
Dominant Role of Irrigation Regime over Biochar in Controlling GHG Emissions from Paddy Fields

 ,
,
Abstract
1. Introduction
2. Materials and Methods
2.1. Trial Design
2.2. Gas and Soil Sampling
2.3. Statistical Analysis
3. Results
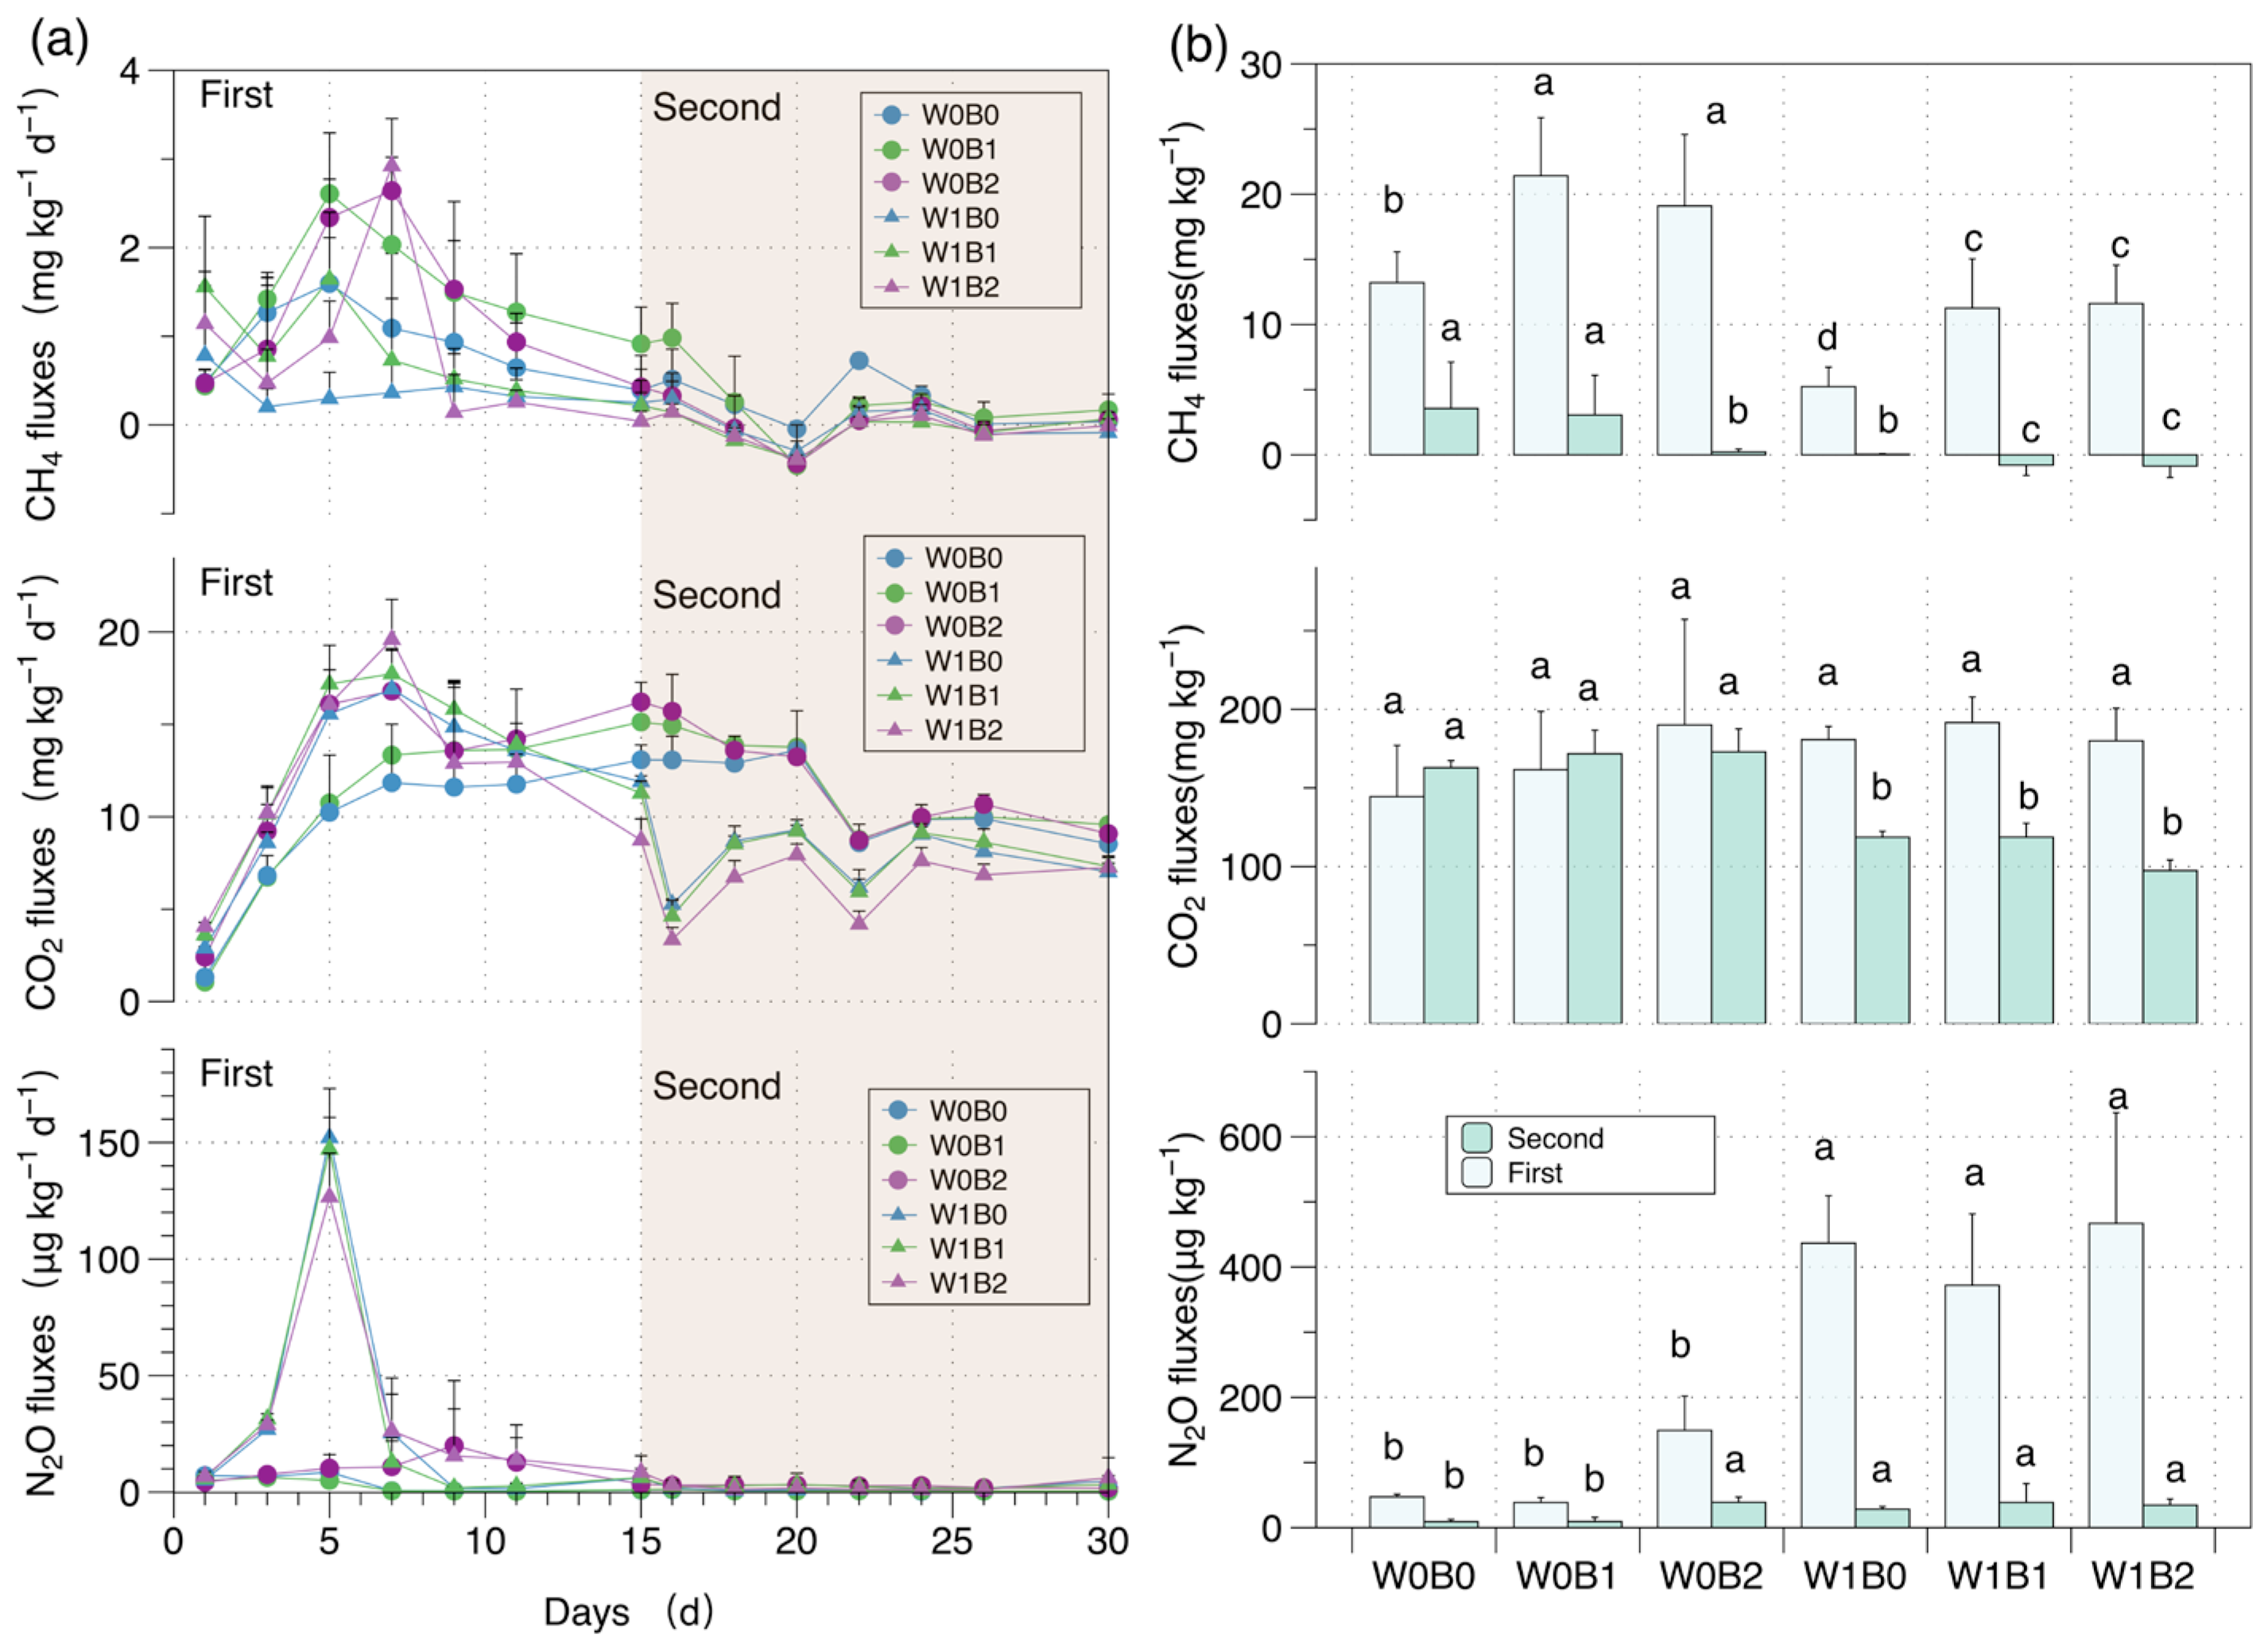
3.1. GHG Emission
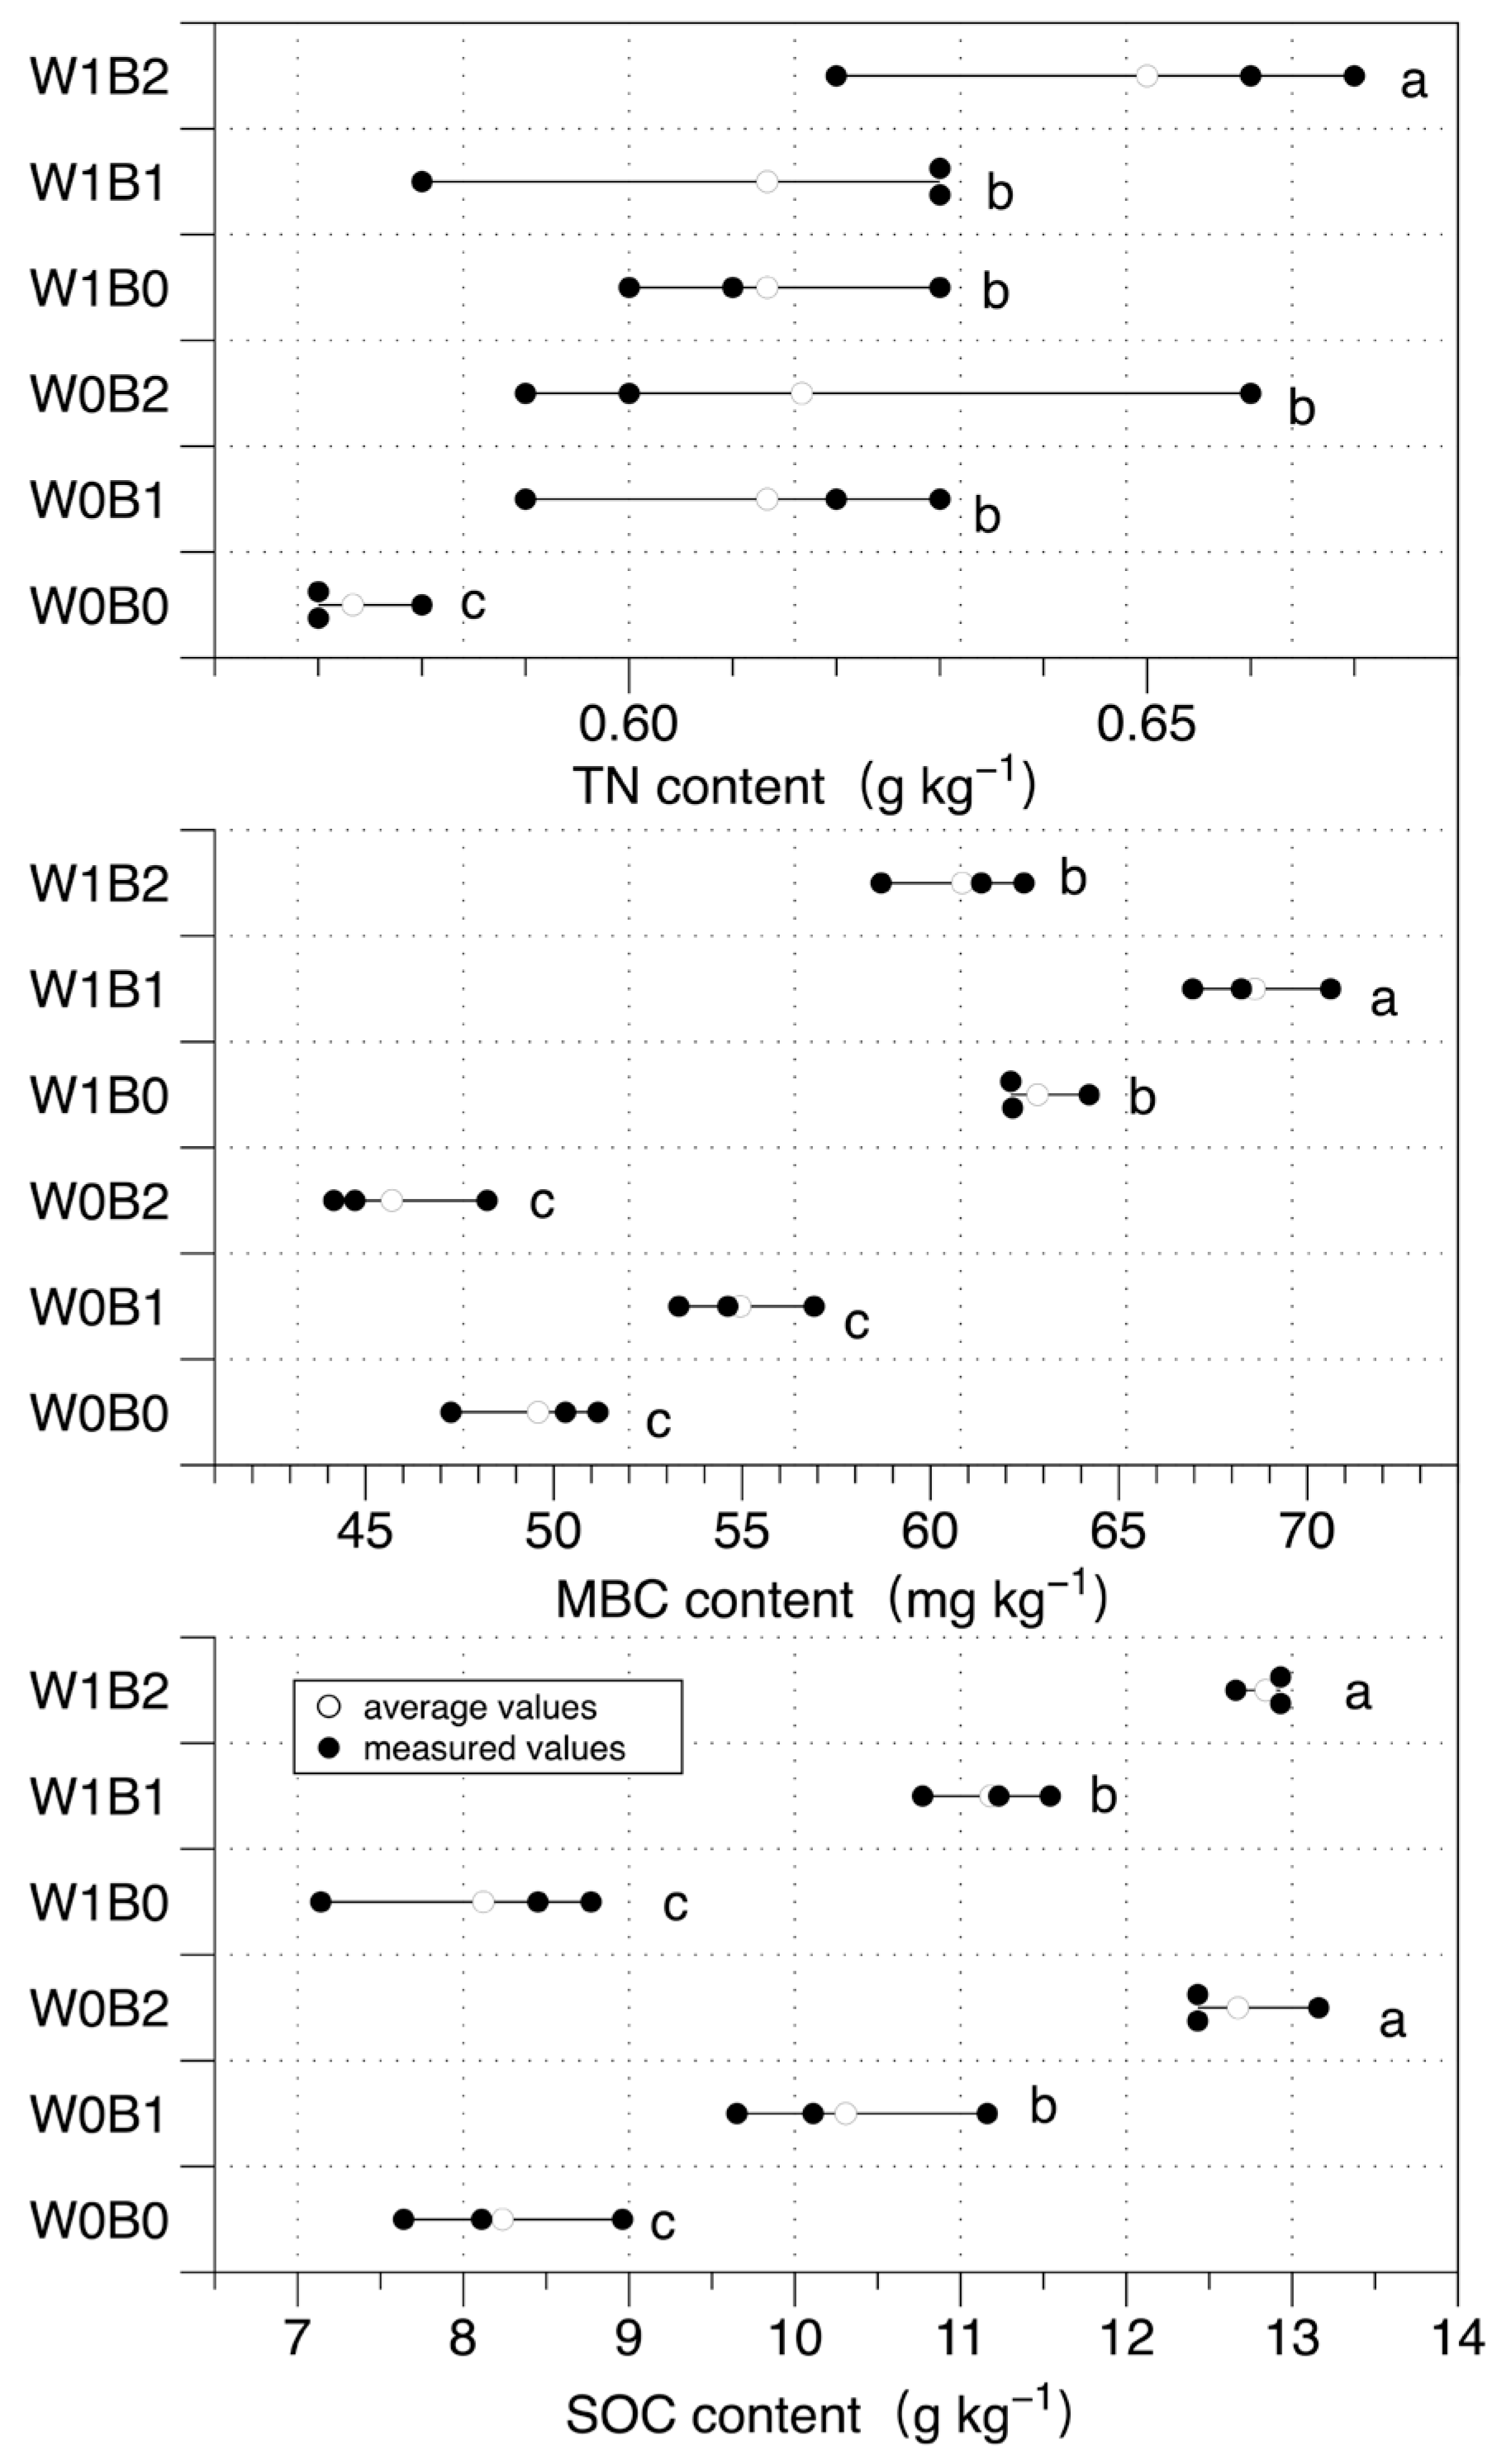
3.2. Soil Carbon and Nitrogen Pools
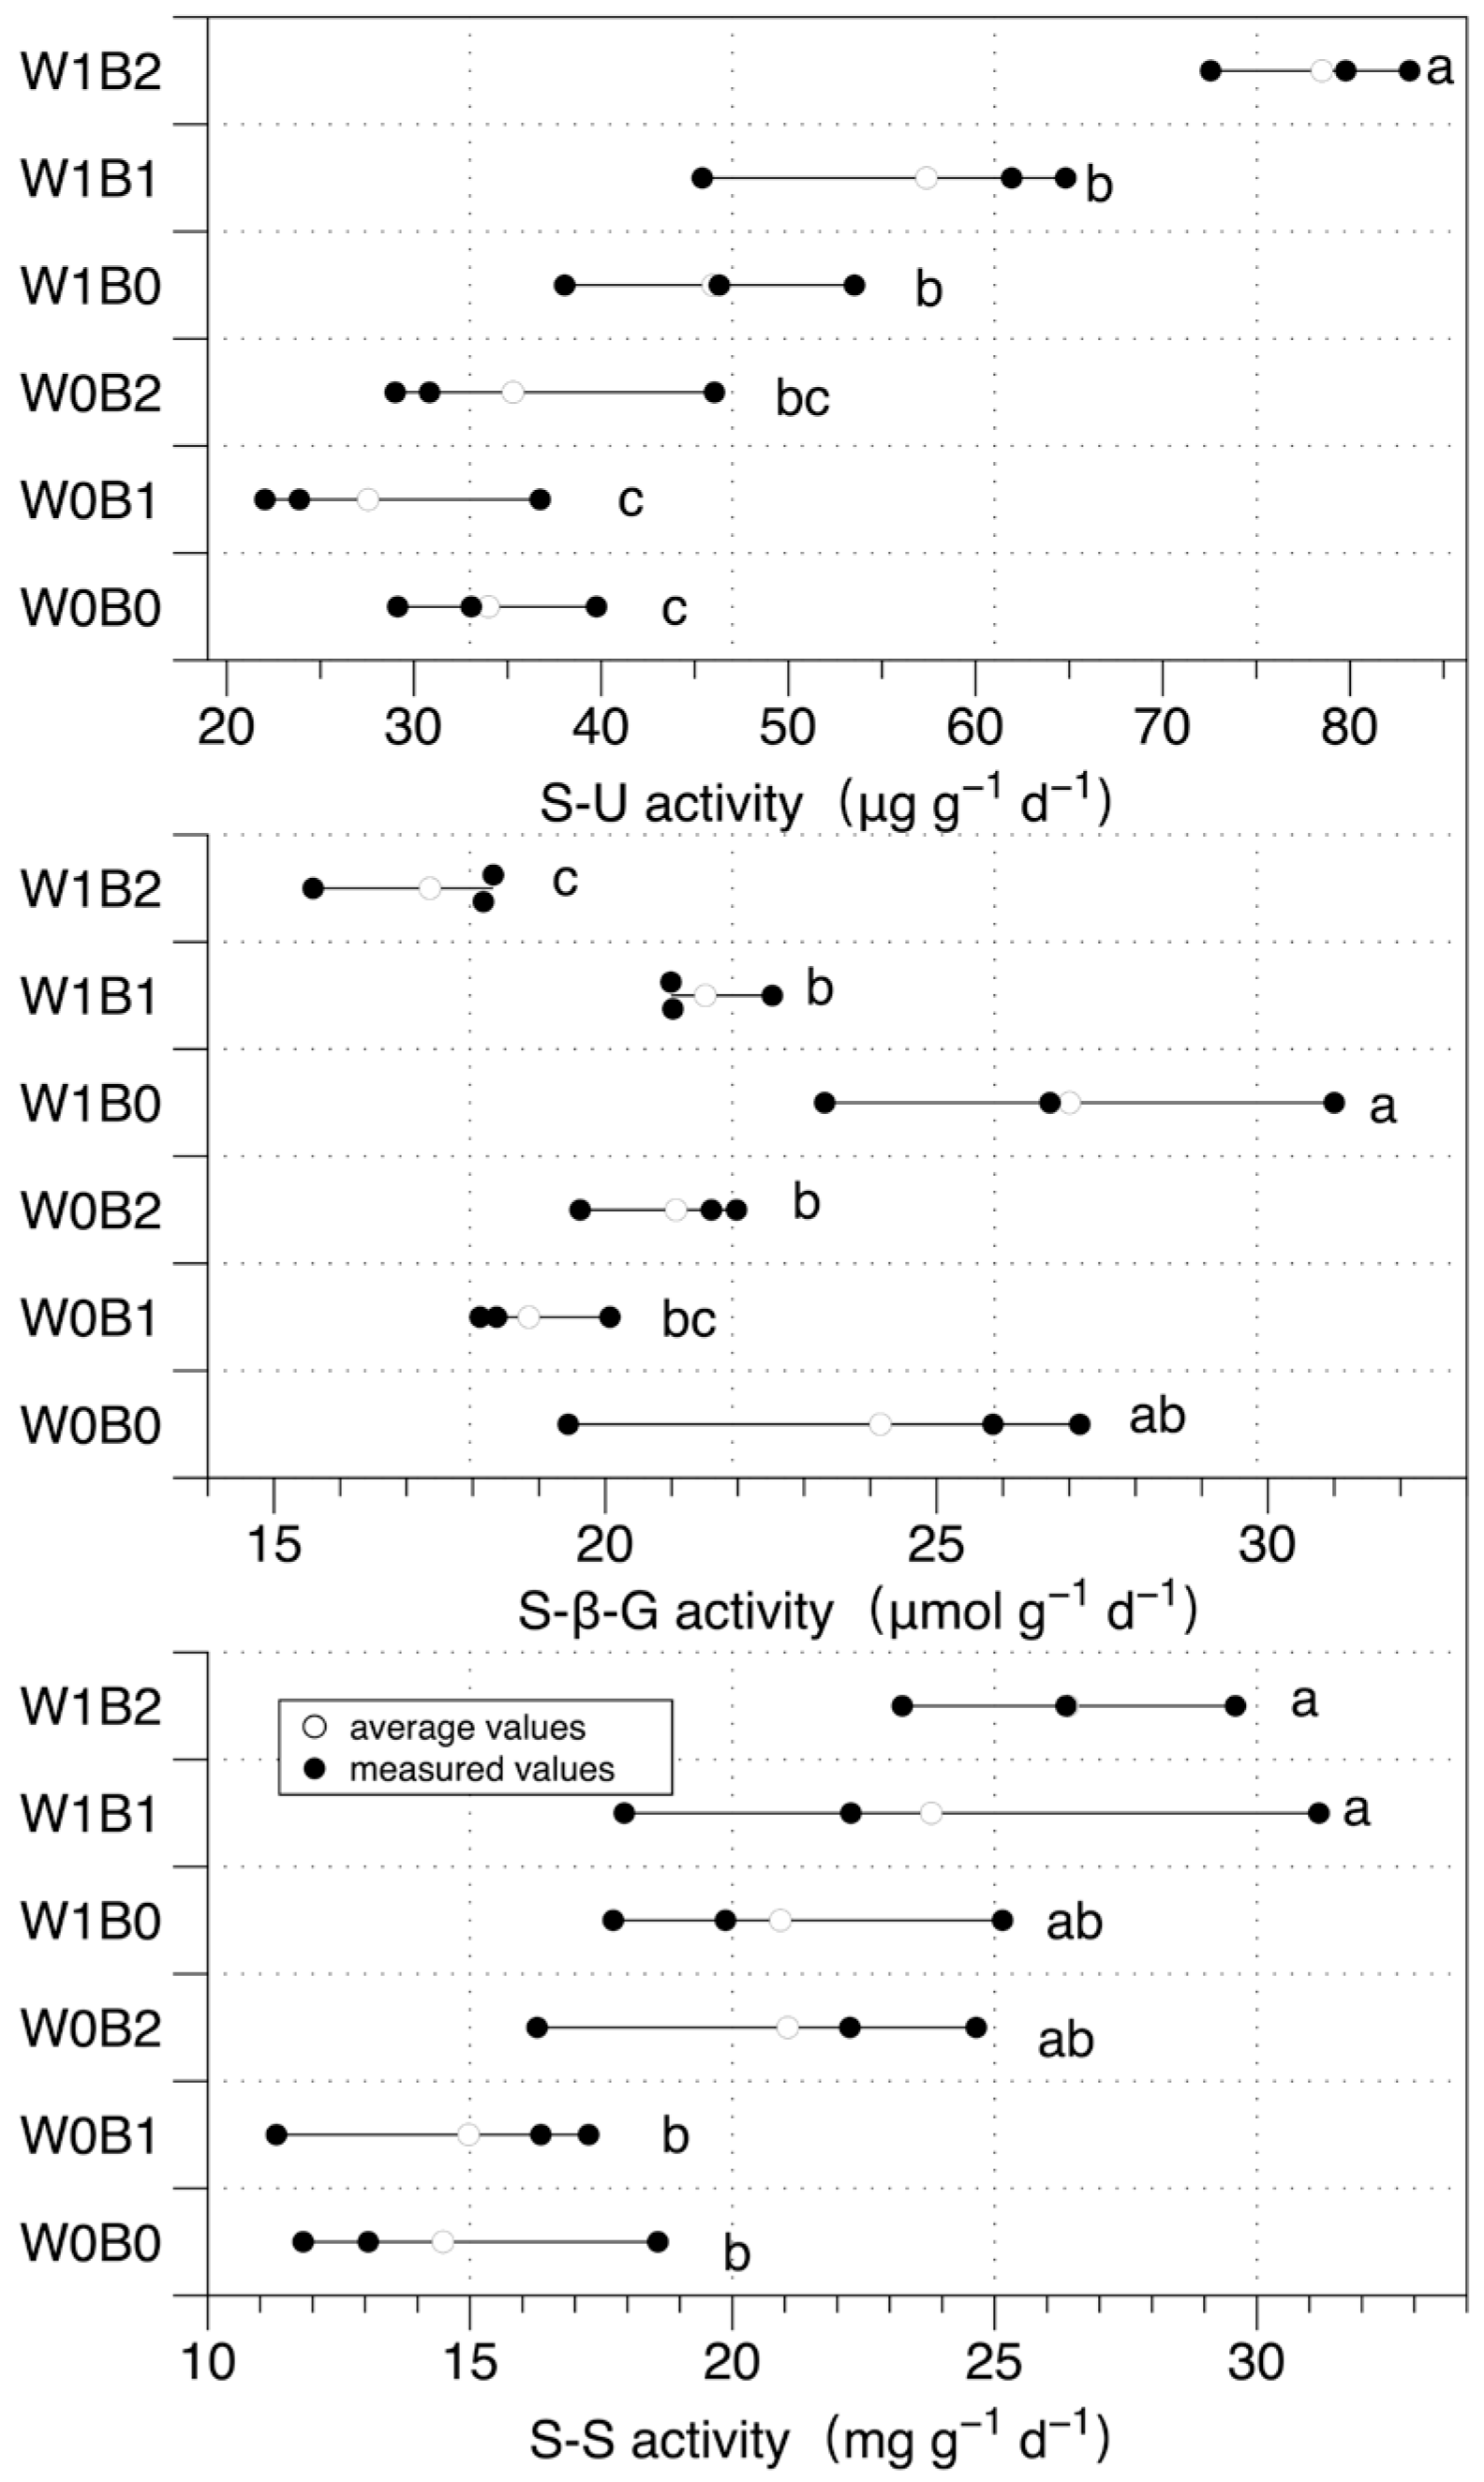
3.3. Soil Enzymes Activity
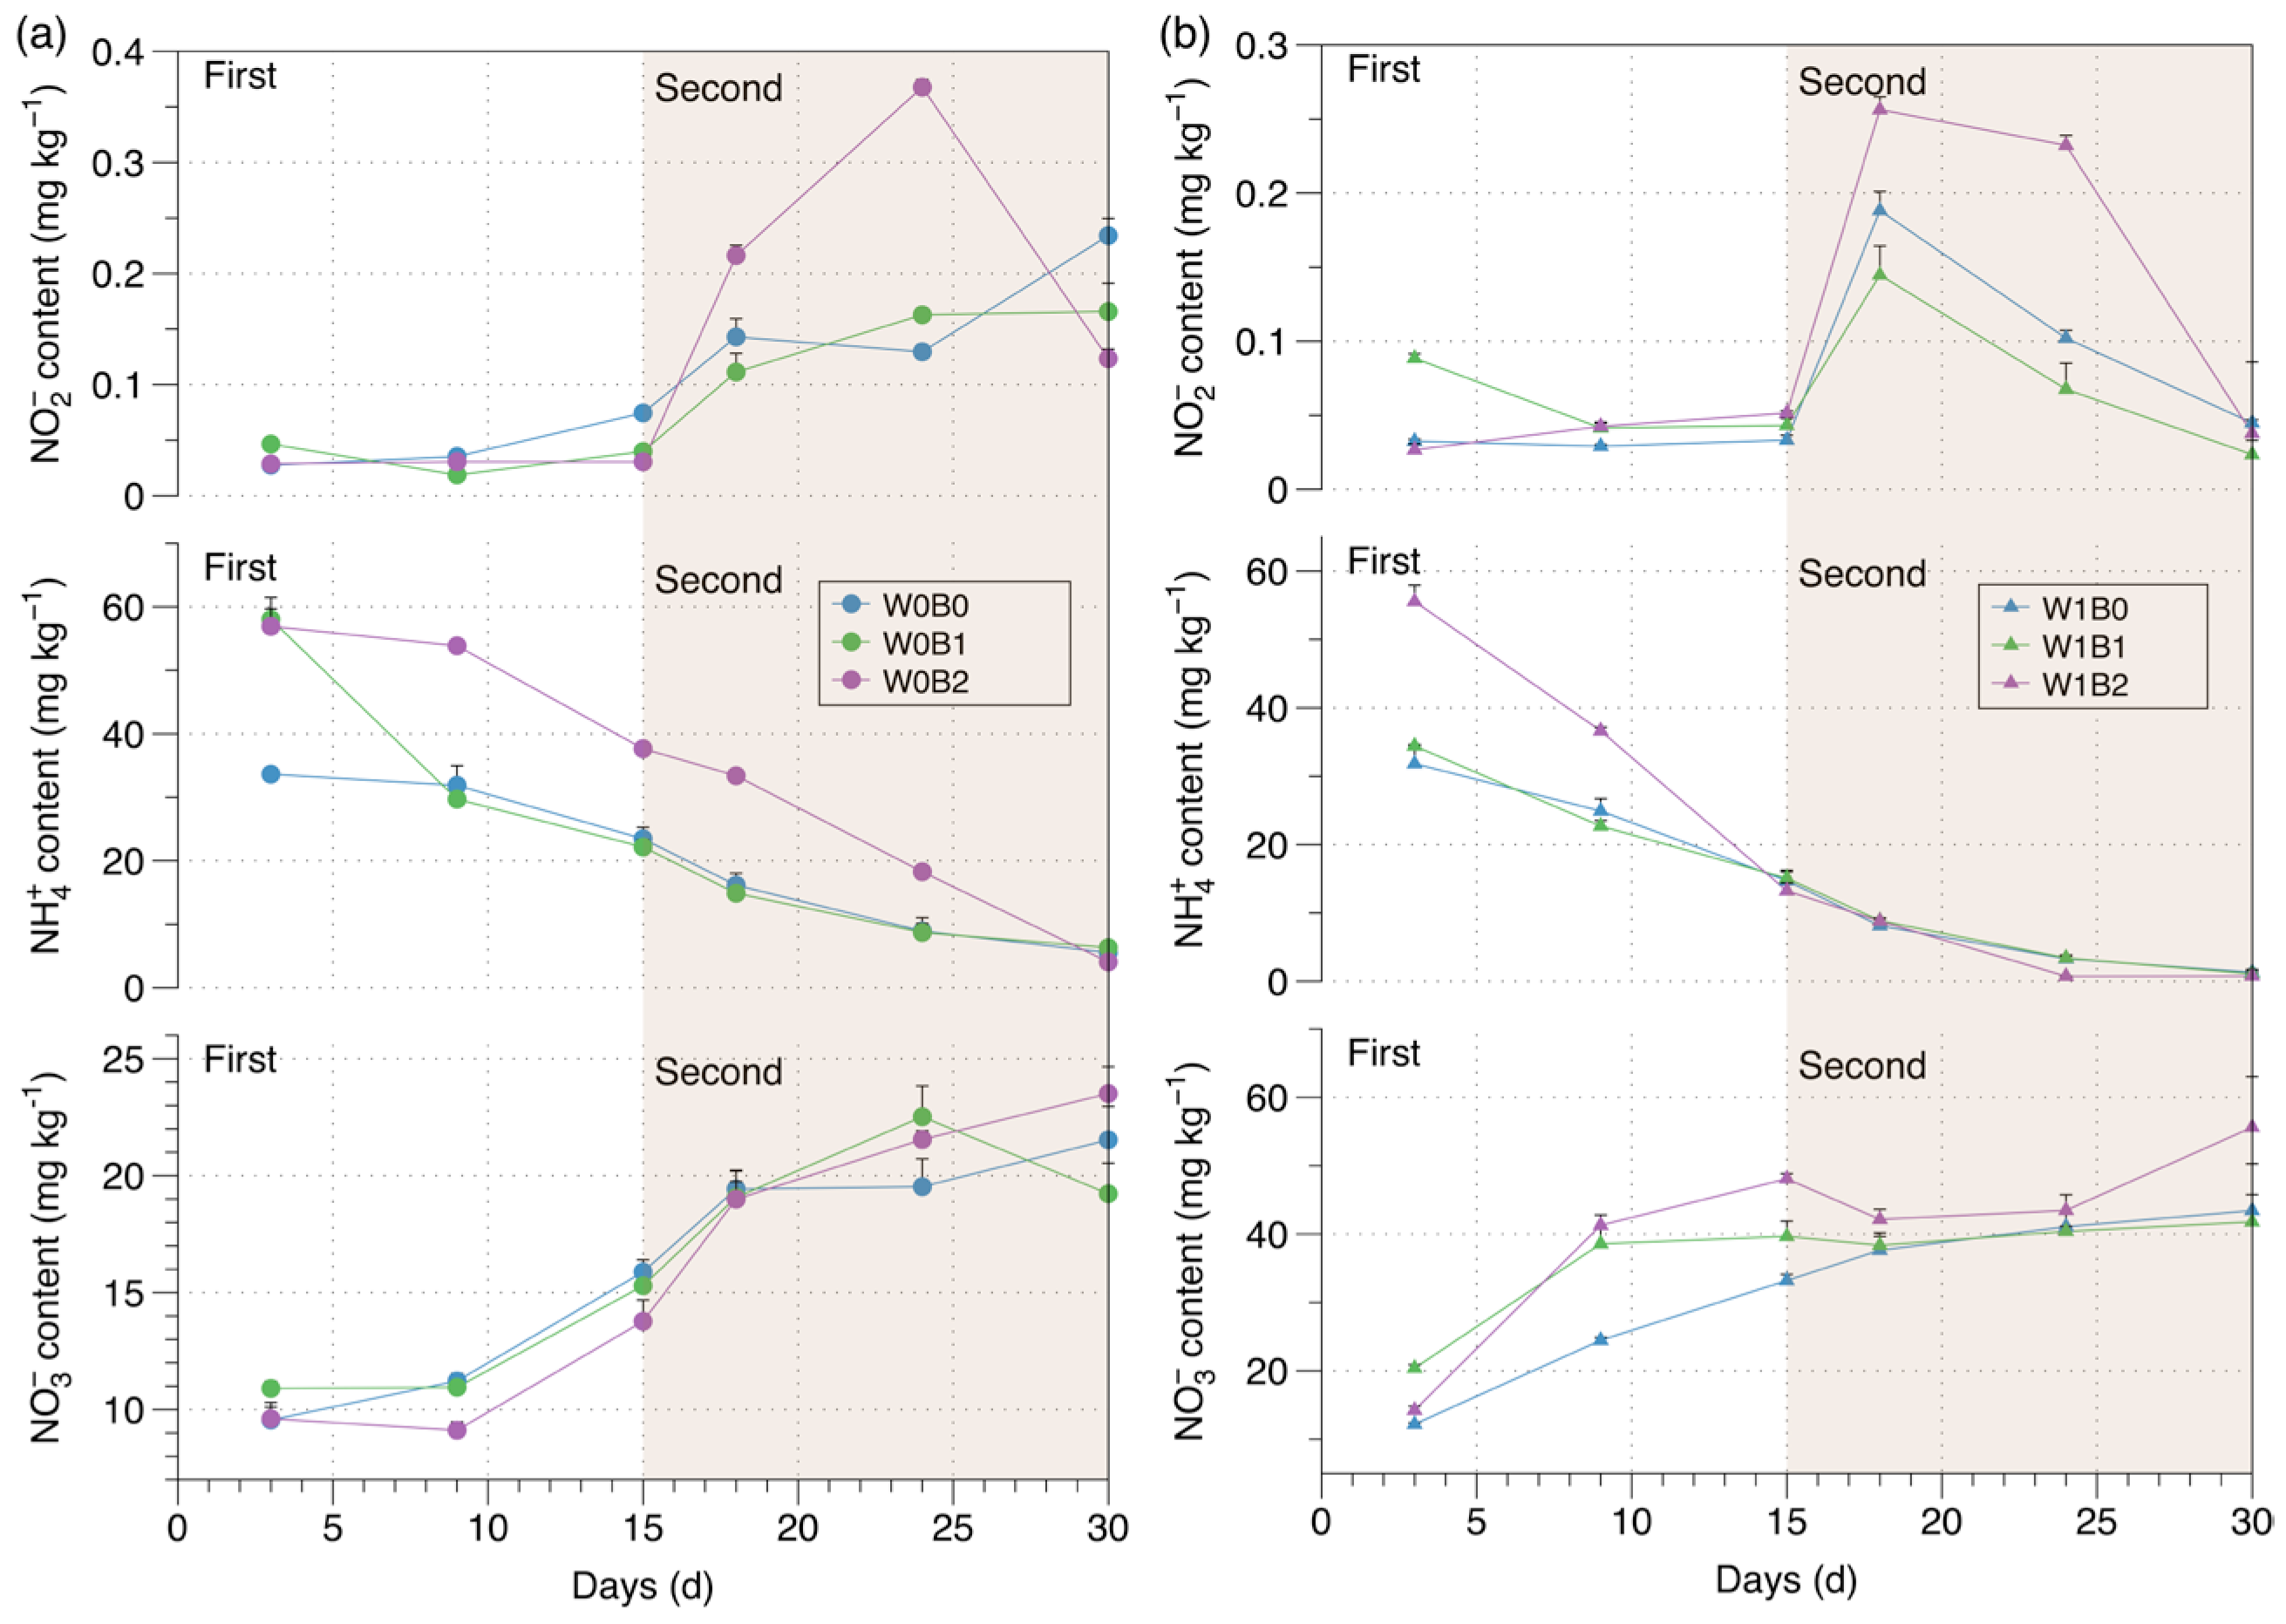
3.4. Soil Inorganic Nitrogen
3.5. Influencing Factors
4. Discussion
4.1. Effect of Biochar on GHG Emissions
4.2. Interactive Effect of Soil Water Regulation and Biochar on GHG Emissions
5. Conclusions
Author Contributions
Funding
Institutional Review Board Statement
Informed Consent Statement
Data Availability Statement
Conflicts of Interest
References
- IPCC. AR5 Climate Change 2013: The Physical Science Basis; Cambridge University Press: Cambridge, UK, 2013. [Google Scholar]
- Smith, P.; Reay, D.; Smith, J. Agricultural Methane Emissions and the Potential Formitigation. Philos. Trans. R. Soc. A 2021, 379, 20200451. [Google Scholar] [CrossRef]
- Tian, Z.; Fan, Y.; Wang, K.; Zhong, H.; Sun, L.; Fan, D.; Tubiello, F.N.; Liu, J. Searching for “Win-Win” Solutions for Food-Water-GHG Emissions Tradeoffs across Irrigation Regimes of Paddy Rice in China. Resour. Conserv. Recycl. 2021, 166, 105360. [Google Scholar] [CrossRef]
- Sander, B.; Schneider, P.; Romasanta, R.; Samoy-Pascual, K.; Sibayan, E.; Asis, C.; Wassmann, R. Potential of Alternate Wetting and Drying Irrigation Practices for the Mitigation of GHG Emissions from Rice Fields: Two Cases in Central Luzon (Philippines). Agriculture 2020, 10, 350. [Google Scholar] [CrossRef]
- He, G.; Wang, Z.; Cui, Z. Managing Irrigation Water for Sustainable Rice Production in China. J. Clean. Prod. 2020, 245, 118928. [Google Scholar] [CrossRef]
- Wu, Z.; Zhang, X.; Dong, Y.; Li, B.; Xiong, Z. Biochar Amendment Reduced Greenhouse Gas Intensities in the Rice-Wheat Rotation System: Six-Year Field Observation and Meta-Analysis. Agric. For. Meteorol. 2019, 278, 107625. [Google Scholar] [CrossRef]
- Qin, X.; Li, Y.; Wang, H.; Liu, C.; Li, J.; Wan, Y.; Gao, Q.; Fan, F.; Liao, Y. Long-Term Effect of Biochar Application on Yield-Scaled Greenhouse Gas Emissions in a Rice Paddy Cropping System: A Four-Year Case Study in South China. Sci. Total Environ. 2016, 569–570, 1390–1401. [Google Scholar] [CrossRef]
- Phungern, S.; Azizan, S.N.F.; Yusof, N.; Noborio, K. Effects of Water Management and Rice Varieties on Greenhouse Gas Emissions in Central Japan. Soil Syst. 2023, 7, 89. [Google Scholar] [CrossRef]
- Zhang, A.; Bian, R.; Pan, G.; Cui, L.; Hussain, Q.; Li, L.; Zheng, J.; Zheng, J.; Zhang, X.; Han, X.; et al. Effects of Biochar Amendment on Soil Quality, Crop Yield and Greenhouse Gas Emission in a Chinese Rice Paddy: A Field Study of 2 Consecutive Rice Growing Cycles. Field Crops Res. 2012, 127, 153–160. [Google Scholar] [CrossRef]
- Liu, Q.; Liu, B.; Zhang, Y.; Lin, Z.; Zhu, T.; Sun, R.; Wang, X.; Ma, J.; Bei, Q.; Liu, G.; et al. Can Biochar Alleviate Soil Compaction Stress on Wheat Growth and Mitigate Soil N2O Emissions? Soil Biol. Biochem. 2017, 104, 8–17. [Google Scholar] [CrossRef]
- Saarnio, S.; Heimonen, K.; Kettunen, R. Biochar Addition Indirectly Affects N2O Emissions via Soil Moisture and Plant N Uptake. Soil Biol. Biochem. 2013, 58, 99–106. [Google Scholar] [CrossRef]
- Xu, X.; He, C.; Yuan, X.; Zhang, Q.; Wang, S.; Wang, B.; Guo, X.; Zhang, L. Rice Straw Biochar Mitigated More N2O Emissions from Fertilized Paddy Soil with Higher Water Content than That Derived from Ex Situ Biowaste. Environ. Pollut. 2020, 263, 114477. [Google Scholar] [CrossRef]
- Wang, K.; Li, F.; Dong, Y. Methane Emission Related to Enzyme Activities and Organic Carbon Fractions in Paddy Soil of South China Under Different Irrigation and Nitrogen Management. J. Soil Sci. Plant Nutr. 2020, 20, 1397–1410. [Google Scholar] [CrossRef]
- Yeasmin, A.S. Influence of Organic Amendments on Soil Carbon Sequestration Potential of Paddy Soils under Two Irrigation Regimes. Sustainability 2022, 14, 12369. [Google Scholar] [CrossRef]
- Arai, H. Increased Rice Yield and Reduced Greenhouse Gas Emissions through Alternate Wetting and Drying in a Triple-Cropped Rice Field in the Mekong Delta. Sci. Total Environ. 2022, 842, 156958. [Google Scholar] [CrossRef]
- Lacroix, E.M.; Rossi, R.J.; Bossio, D.; Fendorf, S. Effects of Moisture and Physical Disturbance on Pore-Scale Oxygen Content and Anaerobic Metabolisms in Upland Soils. Sci. Total Environ. 2021, 780, 146572. [Google Scholar] [CrossRef]
- Lancellotti, B.; Underwood, K.L.; Perdrial, J.; Adair, C.; Schroth, A.; Roy, E. Complex Drivers of Riparian Soil Oxygen Variability Revealed Using Self-Organizing Maps. Water Resour. Res. 2021, 59, e2022WR034022. [Google Scholar] [CrossRef]
- Maris, S.C.; Teira-Esmatges, M.R.; Català, M.M. Influence of Irrigation Frequency on Greenhouse Gases Emission from a Paddy Soil. Paddy Water Env. 2016, 14, 199–210. [Google Scholar] [CrossRef]
- Hu, J.; Cyle, K.T.; Yuan, W.; Shi, W. Soil Dependence of Biochar Composts in Mitigating Greenhouse Gas Emissions: An Overlooked Biophysical Mechanism. Appl. Soil Ecol. 2024, 198, 105374. [Google Scholar] [CrossRef]
- Sun, F.; Lu, S. Biochars Improve Aggregate Stability, Water Retention, and Pore-Space Properties of Clayey Soil. J. Plant Nutr. Soil Sci. 2014, 177, 26–33. [Google Scholar] [CrossRef]
- Zhu, Y.; Wei, C.; Chi, Y.; Yang, P. The Influencing Mechanisms of Reclaimed Water on N2O Production in a Multiyear Maize–Wheat Rotation. Agronomy 2023, 13, 2393. [Google Scholar] [CrossRef]
- Wei, C.; Li, F.; Yang, P.; Ren, S.; Wang, S.; Wang, Y.; Xu, Z.; Xu, Y.; Wei, R.; Zhang, Y. Effects of Irrigation Water Salinity on Soil Properties, N2O Emission and Yield of Spring Maize under Mulched Drip Irrigation. Water 2019, 11, 1548. [Google Scholar] [CrossRef]
- Allen, M.R.; Barros, V.R.; Broome, J.; Cramer, W. IPCC Fifth Assessment Synthesis Report; IPCC: Geneva, Switzerland, 2014. [Google Scholar]
- Slepetiene, A.; Slepetys, J.; Liaudanskiene, I. Standard and Modified Methods for Soil Organic Carbon Determination in Agricultural Soils. Agron. Res. 2008, 6, 543–554. [Google Scholar]
- Wu, J.; Joergensen, R.; Pommerening, B.; Chaussod, R.; Brookes, P. Measurement of Soil Microbial Biomass C by Fumigation-Extraction-an Automated Procedure. Soil Biol. Biochem. 1990, 22, 1167–1169. [Google Scholar] [CrossRef]
- Kohlmann, S.; Greenberg, I.; Joergensen, R.G.; Dippold, M.A.; Ludwig, B. Short-Term Dynamics of Low Molecular Weight Organic Substances and Biochar in Arable Soils. J. Plant Nutr. Soil Sci. 2025, 188, 105–117. [Google Scholar] [CrossRef]
- Fait, G.; Broos, K.; Zrna, S.; Lombi, E.; Hamon, R. Tolerance of Nitrifying Bacteria to Copper and Nickel. Environ. Toxicol. Chem. 2006, 25, 2000–2005. [Google Scholar] [CrossRef]
- Chen, X.; Chen, H.Y.H.; Chen, X.; Wang, J.; Chen, B.; Wang, D.; Guan, Q. Soil Labile Organic Carbon and Carbon-Cycle Enzyme Activities under Different Thinning Intensities in Chinese Fir Plantations. Appl. Soil Ecol. 2016, 107, 162–169. [Google Scholar] [CrossRef]
- Bell, C.W.; Fricks, B.E.; Rocca, J.D.; Steinweg, J.M.; McMahon, S.K.; Wallenstein, M.D. High-Throughput Fluorometric Measurement of Potential Soil Extracellular Enzyme Activities. JoVE J. Vis. Exp. 2013, 15, e50961. [Google Scholar] [CrossRef]
- Jiang, Z.; Yang, S.; Pang, Q.; Xu, Y.; Chen, X.; Sun, X.; Qi, S.; Yu, W. Biochar Improved Soil Health and Mitigated Greenhouse Gas Emission from Controlled Irrigation Paddy Field: Insights into Microbial Diversity. J. Clean. Prod. 2021, 318, 128595. [Google Scholar] [CrossRef]
- Luo, Y.; Durenkamp, M.; De Nobili, M.; Lin, Q.; Brookes, P.C. Short Term Soil Priming Effects and the Mineralisation of Biochar Following Its Incorporation to Soils of Different pH. Soil Biol. Biochem. 2011, 43, 2304–2314. [Google Scholar] [CrossRef]
- He, Y.; Zhou, X.; Jiang, L.; Li, M.; Du, Z.; Zhou, G.; Shao, J.; Wang, X.; Xu, Z.; Hosseini Bai, S.; et al. Effects of Biochar Application on Soil Greenhouse Gas Fluxes: A Meta-analysis. GCB Bioenergy 2017, 9, 743–755. [Google Scholar] [CrossRef]
- Wang, J.; Pan, X.; Liu, Y.; Zhang, X.; Xiong, Z. Effects of Biochar Amendment in Two Soils on Greenhouse Gas Emissions and Crop Production. Plant Soil 2012, 360, 287–298. [Google Scholar] [CrossRef]
- Sriphirom, P.; Towprayoon, S.; Yagi, K.; Rossopa, B.; Chidthaisong, A. Changes in Methane Production and Oxidation in Rice Paddy Soils Induced by Biochar Addition. Appl. Soil Ecol. 2022, 179, 104585. [Google Scholar] [CrossRef]
- Liang, J.; Li, Y.; Si, B.; Wang, Y.; Chen, X.; Wang, X.; Chen, H.; Wang, H.; Zhang, F.; Bai, Y.; et al. Optimizing Biochar Application to Improve Soil Physical and Hydraulic Properties in Saline-Alkali Soils. Sci. Total Environ. 2021, 771, 144802. [Google Scholar] [CrossRef]
- Spokas, K.A. Impact of Biochar Field Aging on Laboratory Greenhouse Gas Production Potentials. GCB Bioenergy 2013, 5, 165–176. [Google Scholar] [CrossRef]
- Faloye, O.T.; Ajayi, E.A.; Rostek, J.; Schroeren, V.; Babalola, T.; Fashina, A.; Horn, R. Hydraulic and Pore Functions of Differently Textured Soils Modified by Biochar from Different Parts of the Mango Plant. Soil Tillage Res. 2024, 236, 105944. [Google Scholar] [CrossRef]
- Clough, T.J.; Condron, L.M.; Kammann, C.; Müller, C. A Review of Biochar and Soil Nitrogen Dynamics. Agronomy 2013, 3, 275–293. [Google Scholar] [CrossRef]
- Li, H.; Meng, J.; Liu, Z.; Lan, Y.; Yang, X.; Huang, Y.; He, T.; Chen, W. Effects of Biochar on N2O Emission in Denitrification Pathway from Paddy Soil: A Drying Incubation Study. Sci. Total Environ. 2021, 787, 147591. [Google Scholar] [CrossRef]
- He, L.; Shan, J.; Zhao, X.; Wang, S.; Yan, X. Variable Responses of Nitrification and Denitrification in a Paddy Soil to Long-Term Biochar Amendment and Short-Term Biochar Addition. Chemosphere 2019, 234, 558–567. [Google Scholar] [CrossRef]
- Zhou, L.; Zhou, X.; Shao, J.; Nie, Y.; He, Y.; Jiang, L.; Wu, Z.; Hosseini Bai, S. Interactive Effects of Global Change Factors on Soil Respiration and Its Components: A Meta-Analysis. Glob. Change Biol. 2016, 22, 3157–3169. [Google Scholar] [CrossRef]
- Chunmei, X.; Liping, C.; Song, C.; Guang, C.; Danying, W.; Xiufu, Z. Rhizosphere Aeration Improves Nitrogen Transformation in Soil, and Nitrogen Absorption and Accumulation in Rice Plants. Rice Sci. 2020, 27, 162–174. [Google Scholar] [CrossRef]
- Tan, X.; Shao, D.; Gu, W.; Liu, H. Field Analysis of Water and Nitrogen Fate in Lowland Paddy Fields under Different Water Managements Using HYDRUS-1D. Agric. Water Manag. 2015, 150, 67–80. [Google Scholar] [CrossRef]
- Han, H.; Gao, R.; Cui, Y.; Gu, S. Transport and Transformation of Water and Nitrogen under Different Irrigation Modes and Urea Application Regimes in Paddy Fields. Agric. Water Manag. 2021, 255, 107024. [Google Scholar] [CrossRef]
- Jiang, X.; Denef, K.; Stewart, C.E.; Cotrufo, M.F. Controls and Dynamics of Biochar Decomposition and Soil Microbial Abundance, Composition, and Carbon Use Efficiency during Long-Term Biochar-Amended Soil Incubations. Biol Fertil Soils 2016, 52, 1–14. [Google Scholar] [CrossRef]
- Xia, H.; Riaz, M.; Zhang, M.; Liu, B.; Li, Y.; El-Desouki, Z.; Jiang, C. Biochar-N Fertilizer Interaction Increases N Utilization Efficiency by Modifying Soil C/N Component under N Fertilizer Deep Placement Modes. Chemosphere 2022, 286, 131594. [Google Scholar] [CrossRef]


| Abbreviation | Biochar Level (t ha−1) | Irrigation | WHC |
|---|---|---|---|
| W0B0 | 0 | flooding | 130% |
| W0B1 | 20 | flooding | 130% |
| W0B2 | 40 | flooding | 130% |
| W1B0 | 0 | intermittent | 100–70% |
| W1B1 | 20 | intermittent | 100–70% |
| W0B2 | 40 | intermittent | 100–70% |
| Factors | First Period | Second Period | Whole Period | ||||||
|---|---|---|---|---|---|---|---|---|---|
| Gas | CH4 | N2O | CO2 | CH4 | N2O | CO2 | CH4 | N2O | CO2 |
| Ir | 24.36 ** | 66.21 ** | 1.11 n.s | 47.85 ** | 5.55 * | 118.93 *** | 29.84 * | 57.16 ** | 3.23 * |
| Bi | 6.62 * | 1.99 n.s | 0.94 n.s | 9.49 * | 3.01 * | 1.53 n.s | 1.11 n.s | 0.47 n.s | 0.59 n.s |
| Ir&Bi | 0.05 n.s | 0.026 n.s | 1.08 n.s | 4.51 * | 2.52 n.s | 3.95 * | 0.19 n.s | 0.09 n.s | 2.00 n.s |
| Label | First Period | Second Period | ||||||
|---|---|---|---|---|---|---|---|---|
| CUE | C/N | NNR | GWP | CUE | C/N | NNR | GWP | |
| W0B0 | 7.32 ± 0.11 c | 11.32 ± 0.14 b | 3.16 ± 0.12 c | 526.83 ± 38.94 b | 5.58 ± 0.46 b | 14.27 ± 0.98 c | 1.05 ± 0.07 c | 199.45 ± 8.68 a |
| W0B1 | 11.22 ± 1.23 a | 14.21 ± 1.21 a | 2.19 ± 0.21 c | 771.54 ± 49.05 a | 4.81 ± 0.17 c | 16.80 ± 0.91 b | 0.13 ± 0.02 d | 206.53 ± 23.15 a |
| W0B2 | 12.11 ± 0.43 a | 16.39 ± 0.27 a | 2.08 ± 0.04 a | 754.31 ± 125.25 a | 4.34 ± 0.22 c | 20.61 ± 1.42 c | 2.27 ± 0.72 b | 135.17 ± 23.07 d |
| W1B0 | 9.02 ± 2.11 b | 10.53 ± 1.21 b | 10.51 ± 1.11 b | 442.85 ± 82.67 c | 7.56 ± 0.87 a | 13.23 ± 1.08 c | 2.91 ± 0.01 b | 171.45 ± 8.62 b |
| W1B1 | 13.44 ± 0.16 a | 15.23 ± 0.92 a | 9.64 ± 0.54 b | 603.88 ± 129.58 b | 5.62 ± 0.10 b | 18.23 ± 0.31 ab | 1.71 ± 0.04 c | 159.83 ± 38.48 bc |
| W1B2 | 12.91 ± 0.18 a | 15.91 ± 0.72 a | 16.2 ± 0.81 a | 640.34 ± 193.72 b | 5.34 ± 0.08 b | 19.77 ± 0.47 a | 6.73 ± 0.74 a | 157.73 ± 16.86 c |
| Ir | * | n.s | *** | ** | * | n.s | *** | * |
| Bi | * | * | *** | * | ** | ** | *** | * |
| Ir&Bi | n.s | n.s | *** | n.s | * | n.s | *** | n.s |
Disclaimer/Publisher’s Note: The statements, opinions and data contained in all publications are solely those of the individual author(s) and contributor(s) and not of MDPI and/or the editor(s). MDPI and/or the editor(s) disclaim responsibility for any injury to people or property resulting from any ideas, methods, instructions or products referred to in the content. |
© 2025 by the authors. Licensee MDPI, Basel, Switzerland. This article is an open access article distributed under the terms and conditions of the Creative Commons Attribution (CC BY) license (https://creativecommons.org/licenses/by/4.0/).
Share and Cite
Chi, Y.; Wang, Y.; Li, Y.; Yan, C.; Shi, M.; Fan, L.; Wei, C. Dominant Role of Irrigation Regime over Biochar in Controlling GHG Emissions from Paddy Fields. Agronomy 2025, 15, 1127. https://doi.org/10.3390/agronomy15051127
Chi Y, Wang Y, Li Y, Yan C, Shi M, Fan L, Wei C. Dominant Role of Irrigation Regime over Biochar in Controlling GHG Emissions from Paddy Fields. Agronomy. 2025; 15(5):1127. https://doi.org/10.3390/agronomy15051127
Chicago/Turabian StyleChi, Yanbing, Yan Wang, Yalong Li, Cheng Yan, Miaomiao Shi, Linlin Fan, and Chenchen Wei. 2025. "Dominant Role of Irrigation Regime over Biochar in Controlling GHG Emissions from Paddy Fields" Agronomy 15, no. 5: 1127. https://doi.org/10.3390/agronomy15051127
APA StyleChi, Y., Wang, Y., Li, Y., Yan, C., Shi, M., Fan, L., & Wei, C. (2025). Dominant Role of Irrigation Regime over Biochar in Controlling GHG Emissions from Paddy Fields. Agronomy, 15(5), 1127. https://doi.org/10.3390/agronomy15051127