Article

YOLO_SSP: An Auto-Algorithm to Detect Mature Soybean Stem Nodes Based on Keypoint Detection

1
College of Grassland Science, Qingdao Agricultural University, Qingdao 266000, China
2
School of Information and Communication Engineering, Hainan University, Haikou 570100, China
3
College of Science and Information, Qingdao Agricultural University, Qingdao 266000, China
*
Author to whom correspondence should be addressed.
Agronomy 2025, 15(5), 1128; https://doi.org/10.3390/agronomy15051128
Submission received: 3 April 2025 / Revised: 28 April 2025 / Accepted: 30 April 2025 / Published: 2 May 2025
(This article belongs to the Section Precision and Digital Agriculture)

Abstract

:
The soybean stem node is a key part of soybean growth and development, and its numbers play a crucial role in soybean yield formation. Traditional manual methods are labor-intensive and error-prone. The keypoint detection method is an ideal choice for stem node detection due to its high accuracy and wide applicability. In this study, a new deep learning method, You Only Look Once _Soybean Stalk Pose (YOLO_SSP) was proposed, which innovatively applied the Small_Effective Low-Level Aggregation Network (S_ELAN) module and fused it with a smaller detection head for detecting stem nodes in mature soybeans. After optimization and iteration, the model achieved 88.1% accuracy on the dataset. Subsequently, by ablating the model, it was found that different improvements were effective in increasing the accuracy of the model. In addition, when comparing the classic YOLO series of keypoint detection models, the results show that YOLO_SSP achieved up to 87.7% of APs, which was higher than YOLOv7-w6-pose, YOLOv7-tiny-pose, YOLOv3s-pose, YOLOv5n-pose, YOLOv5s-pose, YOLOv5m- pose, YOLOv6n-pose, YOLOv8n-pose, and YOLOv10b-pose, which were 2.5%, 12.8%, 5.3%, 3.8%, 3.5%, 3.5%, 5.1%, 5.1%, 5.0%, and 4.5% higher, respectively. Finally, the proposed model was applied to the unique dataset with 85.3% precision and 82.6% accuracy, and the visualization of the model’s detection results proved its applicability and universality. This study provides an effective strategy for soybean stem node detection and significantly improves the accuracy of detection.

1. Introduction

Soybean is rich in protein, fat, and other nutrients [1], and is an important grain and oilseed crop in China [2], with impacts in many areas such as food, feed [3], agroecology [4], environment [5], and energy [6], and research on soybeans is of great significance for ensuring food security [7] and promoting sustainable agricultural development. The in-depth study of soybean phenotypic characteristics not only helps to bring out the multifaceted value of soybean but also promotes the process of agricultural modernization and achieves the increase in yield and efficiency of agricultural production [8], and promotes the protection of the ecological environment and the enhancement of human nutritional health.
The soybean stem node is an important trait in soybean stem-associated phenotypes, and is involved in various aspects of plant growth [9], yield components [10,11], stress tolerance [12,13], and agricultural management in soybean production [14], which are central elements of plant growth and important target traits for breeding. Its number and distribution directly affects plant lighting and ventilation, which is related to plant photosynthesis and material production [15,16], which in turn affects growth rate and yield [17]. The location and number of stem nodes also determine inflorescence and pod formation and are key predictors of yield potential [18,19]. At the same time, the structural characteristics of the stem nodes are crucial for the identification and control of pests and diseases, helping to reduce yield losses [20]. In agricultural practice, the growth characteristics of stem nodes provide an important basis for fertilization and irrigation to ensure healthy plant growth and maximize yield. Therefore, the precise detection of stem nodes is of significant importance for scientifically guiding agricultural production and achieving increased yield and efficiency in soybean cultivation.
A series of efficient soybean plant phenotype acquisition algorithms have been developed through the integration of computer vision and deep learning techniques [21,22,23]. They not only realize real-time monitoring of soybean plant growth status [24] but also greatly improve the accuracy and efficiency of crop management, provide strong support for optimizing pest control strategies [25], and then promote the development of agriculture in the direction of more mechanization and intelligence. They not only strengthen the foundation of increased production and efficiency in agricultural production, but also actively promote the protection of the ecological environment and the enhancement of human nutritional health. In traditional agricultural practices, the acquisition of soybean stem node phenotypes is highly dependent on manual counting, a process that is not only time-consuming and laborious but also prone to errors [26,27,28]. In contrast, the introduction of deep learning algorithms has revolutionized this situation, and their ability to automate the recording of phenotypic traits has significantly accelerated the data collection process, thereby effectively improving breeding efficiency. Ref. [29] used instance segmentation to not only accurately measure the lengths of stem nodes and main stems but to also successfully separate pods and branches from the complex main stem structure. Ref. [30], on the other hand, skillfully reconstructed the plant skeleton model by combining the rotating target detection technique with the region search algorithm, realized the accurate identification of stem nodes and branches, and further enriched the dimensionality of the phenotypic data. Ref. [31] used an automatic phenotypic extraction method not only to identify the traits of pods and stems in detail but also to construct a comprehensive and integrated dataset of bean pods. The application of these techniques is not only limited to the extraction of pod coordinates and segmentation of main stems [32,33,34] but also extends to the computation of pod and leaf counts, which provides a scientific basis for accurate yield prediction [35,36]. Despite significant technological advances, there are still challenges in directly processing plants to obtain complete plant traits without removing pods. Yang [37]’s study demonstrated the potential of pod identification using models trained on external pods, while Ning [38] achieved effective identification of plant pods through target detection techniques. However, when facing dense and overlapping pods on mature plants, their physical occlusion and overlapping phenomena still pose considerable challenges to phenotype extraction, increasing the complexity and difficulty of the task [39].
Unlike the current popular research, this study explored a new soybean stem node detection method to quickly and accurately extract stem node traits from dense, curved, and multi-branched growing mature plants without the need to remove pods. And, in order to solve the overlap problem between pods and stems, we proposed a standard neural network model with smaller and more efficient aggregation modules for keypoint detection for accurate and fast phenotype acquisition, providing strong support for the subsequent accurate acquisition of soybean stem-related phenotypes and the accurate localization of soybean stem nodes. Additionally, replacing standard convolutional layers with RepConv layers enhances feature representation and generalization capabilities [40], aiding the model in capturing fine-grained details and spatial relationships in keypoint detection [41]. And the model detection head is replaced, drawing on the YOLOv7 target detection head for the keypoint detection of plants to make the model more concise, improve training and inference efficiency, and enhance the applicability of the model and the overall performance of the model.
In conclusion, the proposed method incorporates a variety of modules to overcome the limitations of mature soybean stem node detection by combining the use of the Small_Effective Low-Level Aggregation Network (S_ELAN) with RepConv and YOLOv7 target detection headers, which effectively pounces on the global context information and focuses on the local information. This innovative approach not only improves the accuracy of model detection on publicly available datasets but also facilitates soybean breeding efforts, and can be used to estimate soybean yields, improve soybean harvesting efficiency and yield prediction, and make important contributions to better decision making and planning for managers, and to the maintenance and improvement of soybean cropland, which is of great importance.

2. Materials and Methods

2.1. Materials Acquisition

In this study, we carefully selected the study population, with 1200 images from the widely recognized public online dataset and 139 unique images focusing on soybean varieties (referred to as DY data). To obtain DY data, we went into the Agricultural High-Tech Industrial Demonstration Zone (AHTIDZ) of Qingdao Agricultural University in Dongying, Shandong Province, China, where we scientifically planted and collected samples of 37 different varieties of soybeans at maturity in the mildly saline soils unique to the region (average pH 8.62, fluctuating with seasonal rainfall) from May to October 2023, and randomly selected 139 images for testing. During the cultivation process, we strictly adhered to a density of 20,000 plants per square meter, precisely sowing 2 seeds per hole, ensuring a standardized layout with a row spacing of 50 cm and a plant spacing of 13 cm. Each soybean variety was planted in triplicate to enhance the representativeness and reliability of the data. During the data collection phase, we adhered to consistent and rigorous standards, using the same camera to capture 139 clear images of mature soybean stems under constant shooting conditions, with a fixed shooting angle and height. Each picture was guaranteed to be clear, and a 60 cm ruler was included at the bottom of the picture as a reference, aiming to accurately measure and record the length of soybean stems, and laying a solid foundation for the subsequent accurate calculation of plant height and stem length.
In particular, there were differences between the public dataset and the DY dataset. In terms of the shooting environment, the public dataset used laboratory standard lighting and fixed shooting angle, with a uniform and shadow-free pure white background, which ensured high resolution and color consistency of the images, whereas the DY dataset, although also using a white background and fixed shooting angle, suffered from slight shadows cast by the ruler. In terms of plant structural features, the samples in the public dataset were manually processed, showing dry stems and simple branching structures with obvious stem node patterns and fewer branches; in contrast, the plants in the DY dataset were kept in a natural growing state, with curved stems, more branches, and irregularly arranged pods, which more realistically reflected the complexity of the field environment. In terms of image quality, the open dataset showed better detail clarity and color consistency, while the DY dataset showed a slight degradation in image quality due to natural factors.

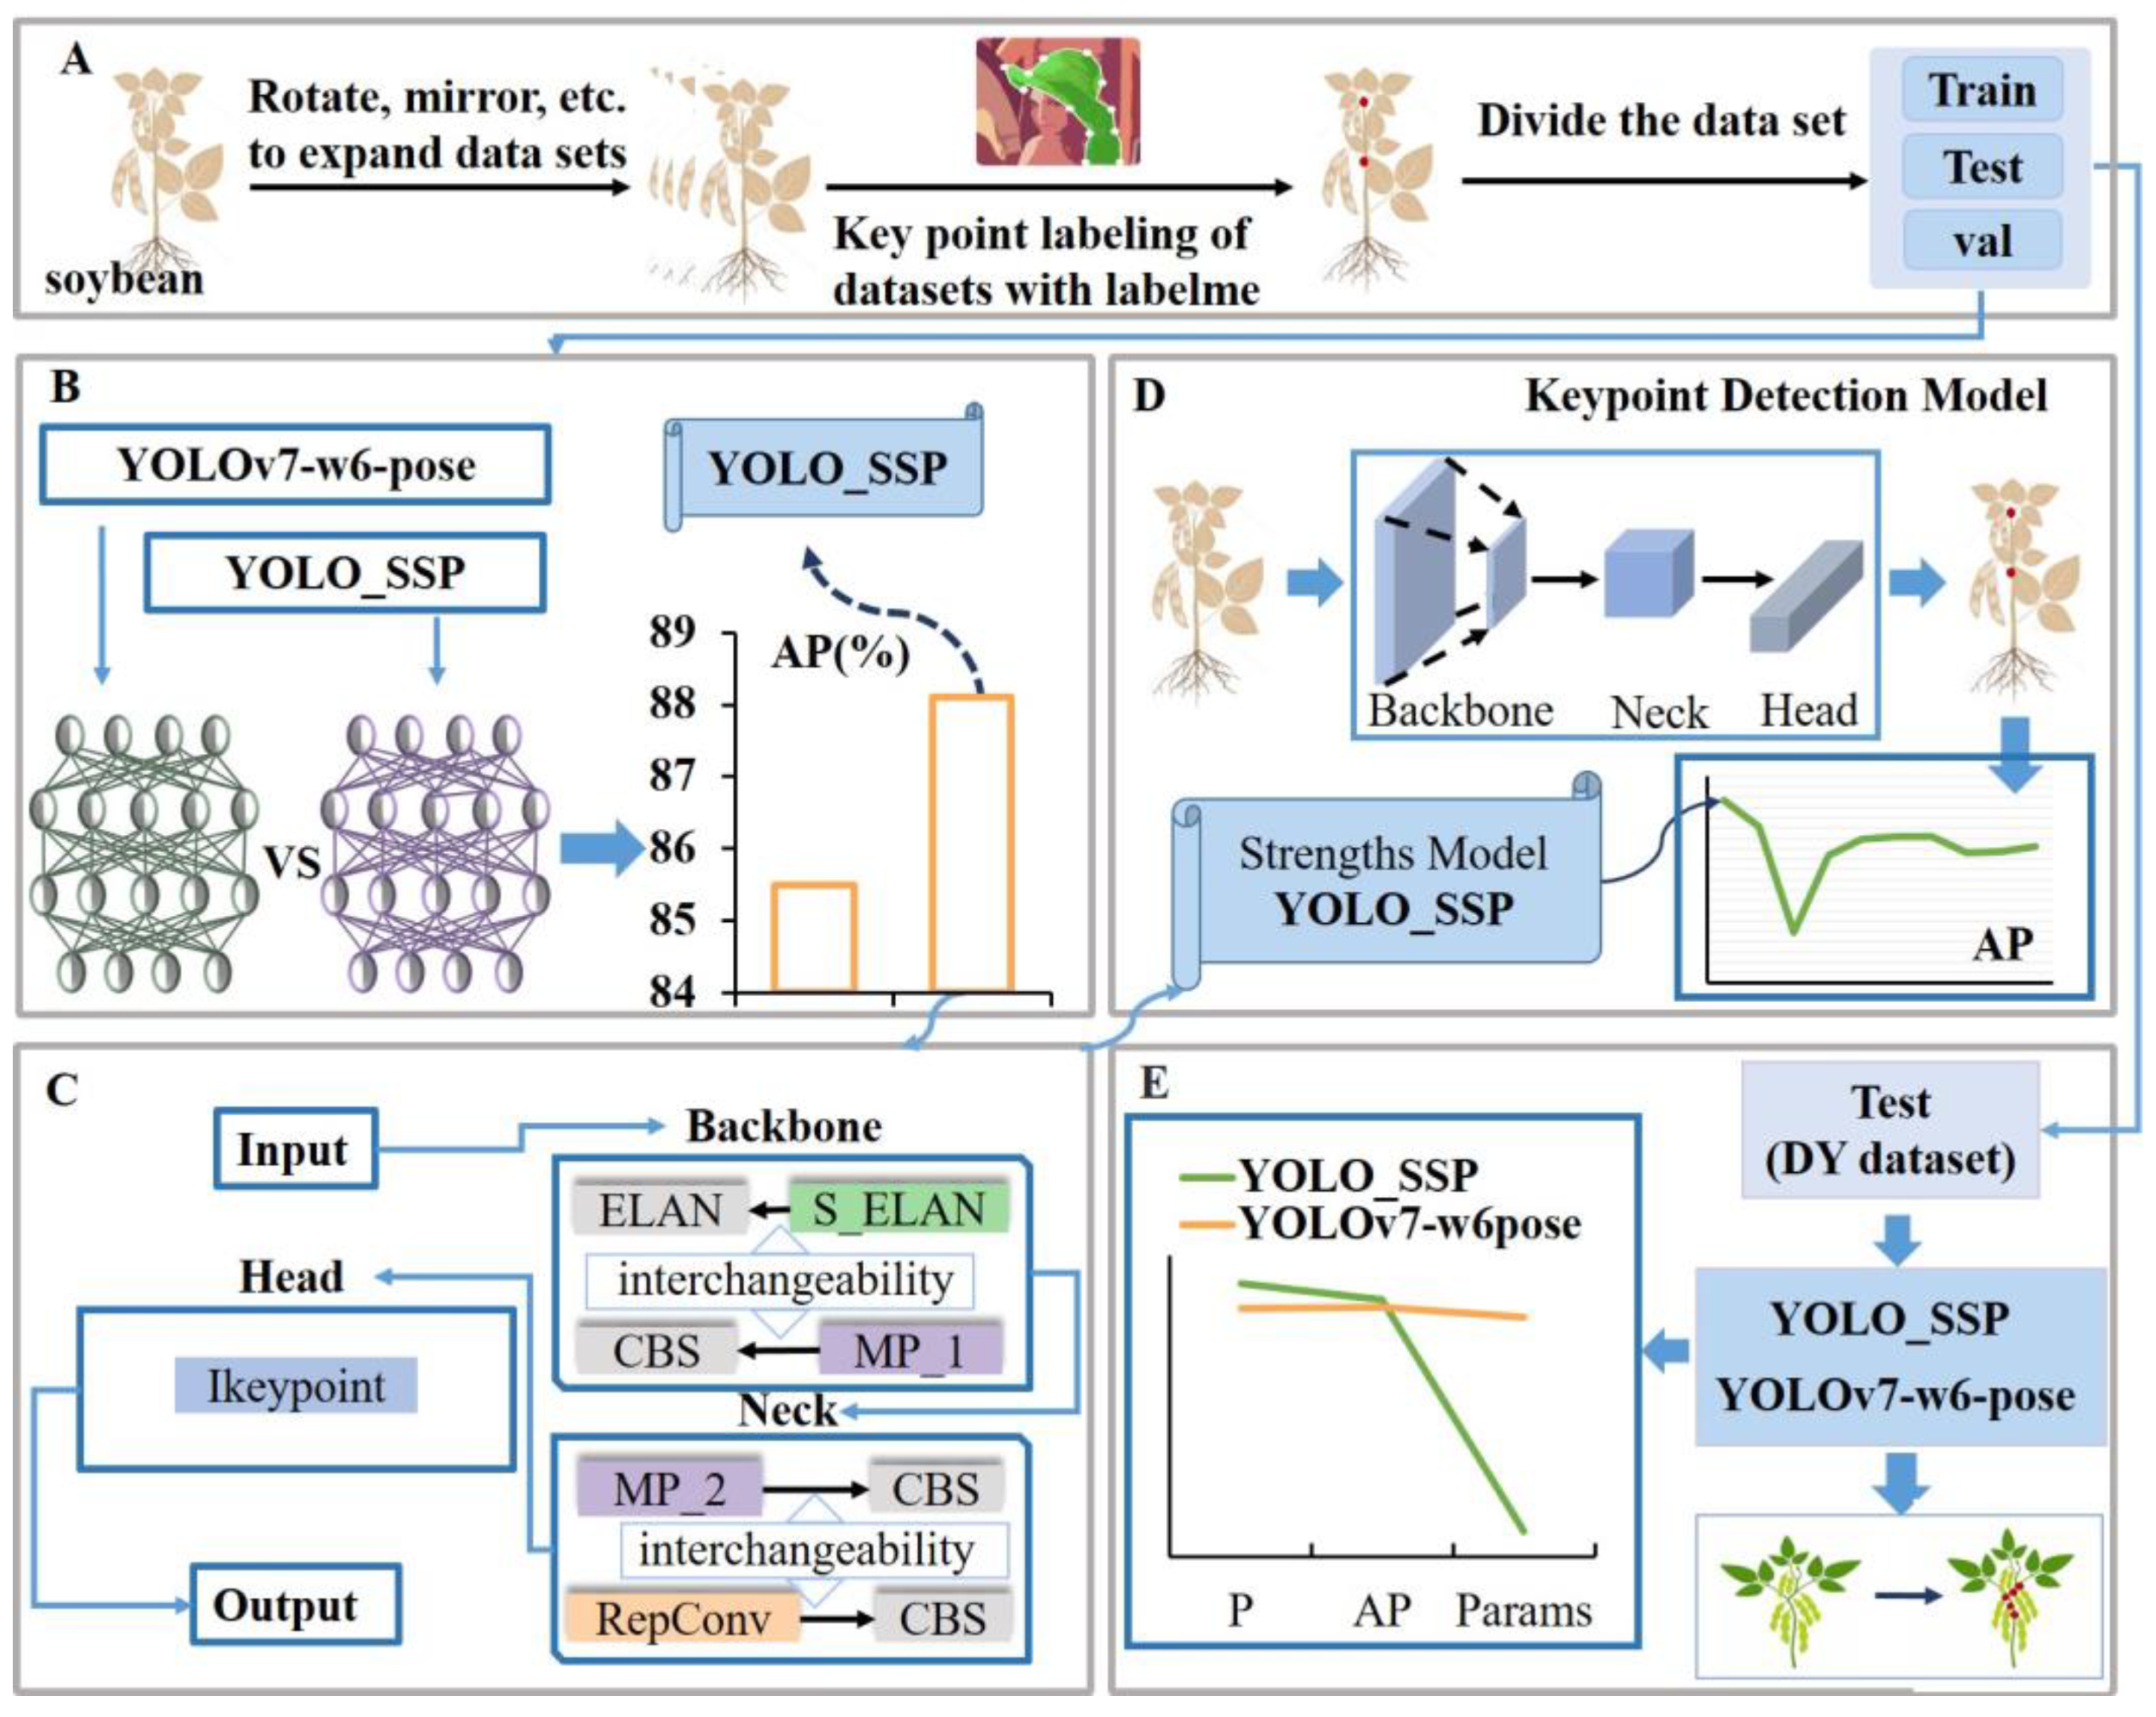
2.2. Experimental Procedure

The experimental process of detecting soybean stem nodes using YOLO_SSP is shown in Figure 1. Step A: the dataset was expanded by methods such as flip mirroring and labeled using Labelme software (5.4.1), and the labeled dataset was divided into a training set validation set and a test set. Step B: the YOLO_SSP network detected and localized mature soybean stem nodes and compared the performance of YOLOv7-w6-pose and YOLO_SSP models. Step C: Validation of YOLO_SSP model modules. Adding or replacing different modules verified changes in model performance. Step D: Validation of YOLO_SSP against other keypoint detection models. The superiority of the YOLO_SSP performance was verified by comparing and visualizing YOLO_SSP with other mainstream keypoint detection networks. Step E: Robustness and generalization validation of YOLOv7_SSP. The processed DY dataset was fed into the YOLOv7_SSP network to test the generalization ability of the network.

2.2.1. Data Preprocessing

In the data processing stage, we uploaded the soybean stem node detection dataset consisting of the public dataset expanded by flipping and mirroring and the DY dataset to the Labelme platform in accordance with a systematic process, and referred to the strategy of the multi-expert collaborative annotation and review mechanism of Wang et al. [42]. Referring to Sykas and Belissent’s study [43,44], stem node labeling was completed by uniformly trained agronomic experts. During the labeling process, we explicitly named the stem nodes as “nodes” and accurately labeled the connection points between soybean stems and pods using the point labeling tool. Notably, to ensure the accuracy and reliability of the labeling results, we did not label stem nodes that could not be clearly identified due to obstruction by the pods or the stems themselves.
In terms of dataset allocation, we comprehensively and systematically explored the performance optimization and practical application potential of deep learning models through a comprehensive experimental strategy. As shown in Table 1, in model improvement, ablation experiments, and comparison experiments, we uniformly adopted industry-recognized public datasets to ensure the universality and authority of the experimental results and to facilitate a fair comparison with existing research results. In the testing and visualization experiments, we introduced the independently acquired DY dataset, which is designed for specific tasks and can more accurately assess the effectiveness and adaptability of the model in practical application scenarios. This allocation method evaluated the model from multiple perspectives and levels, which enhanced the broad applicability of the model and verified the effectiveness of the model in task-specific scenarios, and laid a solid foundation for the promotion and optimization of deep learning models in practical applications.

2.2.2. YOLOv7-W6-Pose

YOLOv7-w6-pose [45,46], an optimized variant of the YOLOv7 series, is based on YOLOv7-w6 (the version with enhanced width factor), with specific optimizations for the backbone network and the detection head, which makes YOLOv7-w6-pose outperform in critical point detection tasks. As an important derivative of the YOLOv7 series, it inherits the solid technical foundation of YOLOv7, which is an important network in the field of critical point detection, and outperforms other networks for soybean stem node detection. In contrast, YOLO_SSP, as a newly proposed model, outperforms YOLOv7-w6-pose in terms of accuracy, which can highlight its motivation for improvement and advantages. The comparison between YOLOv7-w6-pose and YOLO_SSP provides a valuable reference for research and application in related fields.
YOLOv7-w6-pose is specially added to YOLOv7 with a pose estimation module (pose estimation head) in order to realize the accurate detection of target keypoints. The overall structure of the model consists of three core parts as follows: First, the backbone is designed based on the CSP (cross stage partial) architecture, and the YOLOv7-w6 version of the backbone is a “wider version” with more channels and larger model capacity, which can extract richer image features. Secondly, the feature fusion network (neck) utilizes the PANet (path aggregation network) for multi-scale feature fusion, which improves the model’s ability to detect targets of different sizes. Lastly, the output head (head) includes the target detection head and the keypoint detection head, which are responsible for outputting the bounding box and category information of targets, along with the keypoint information of each target and the keypoint coordinates of each target and its confidence level, respectively.
In particular, the “w6” in YOLOv7-w6-pose identifies an extended version of the model. Where “w” stands for wider, it means that, compared with the standard version of YOLOv7, the network architecture of the w6 model is wider, the number of channels is increased, and the feature maps of each layer can contain more information, which enhances the model’s representational capability and detection accuracy. At the same time, the expansion of width makes the model more advantageous in dealing with complex feature tasks. In addition, the “6” stands for resolution enhancement. The YOLOv7-w6 model is usually trained and inferred at a higher input resolution (1280 × 1280) compared with the standard version’s 640 × 640 resolution. The higher resolution allows the model to capture more detailed information, which further improves the detection performance.
It is worth noting that, when using YOLOv7-w6-pose, in order to increase the fitness of the model to soybean plants, this study chose to train from scratch without preloading the weights.

2.2.3. YOLO_Soybean Stalk Pose (YOLO_SSP)

This study introduces a new model, YOLO_Soybean Stalk Pose (YOLO_SSP), for detecting mature soybean stems. Specifically, it is built upon the YOLOv7-w6-pose [47] framework, which focuses on human pose estimation tasks and surpasses many known object detection and pose estimation models in both speed and accuracy. It maintains high-speed inference while providing high-precision detection and pose estimation results. As with other YOLO models, YOLO_SSP is implemented by directly regressing the bounding box locations and categories in the input image, while YOLO_SSP combines several innovative techniques, as shown in Figure 2. The network architecture of YOLO_SSP consists of four modules: the input module, backbone module, neck module, and YOLO head module. First, the Small_Effective Low-Level Aggregation Network (S-ELAN) and max pooling layer_1 are integrated into the backbone network, and the ReOrg module is replaced with two CBS layers of different channel numbers. Next, in the neck network, max pooling layer_2 and RepConv are used to replace the original Conv layers. Finally, the YOLOv7 detection head is used to replace the YOLOv7-w6-pose detection head in the head module. With these innovations, YOLO_SSP achieves higher accuracy and richer feature representation while maintaining efficient detection speed, making it suitable for the complex task of soybean stem node detection.

2.2.4. Advanced Feature Extraction

Feature extraction is a core aspect of image analysis to pinpoint and extract key plant features from raw images [48]. In this process, the CBS (Conv-BatchNorm-ReLU) [49] module (Figure 3a) plays a key role through the organic combination of convolution (Conv), batch normalization (BN), and linear correction unit (ReLU) [50]. In the YOLO_SSP model, the feature extraction is further enhanced by the innovative application of the CBS module, which skillfully divides the input feature map into two processing paths: one path performs deep convolutional computation to mine richer feature information [51]; the other path directly passes the feature map to the next layer in order to retain the original spatial structure information. Eventually, the outputs of these two parts are spliced together to increase the depth and width of the network and reduce computational redundancy through feature reuse, thus improving the detection accuracy while ensuring the operational efficiency of the model.
Meanwhile, we innovatively introduce the Small_Effective Low-Level Aggregation Network (S_ELAN, Figure 3b) as an efficient and lightweight variant of the Effective Low-Level Aggregation Network (ELAN) [52]. The S-ELAN module integrates the ELAN-Attention mechanism and the multipath feature fusion network structure, which weights different channels of the input feature map by ELAN-Attention in order to improve the focus on critical information. It contains multilevel CBS convolutional blocks for feature extraction and nonlinear mapping, and the upper path gradually extracts deep features through multilevel CBS blocks, while the lower path retains shallow features. The feature cascade operation stitches the output feature maps of each path into a wider feature map and further optimizes the important information through the attention mechanism. After outputting the CBS convolutional block, the feature map is channel compressed and mapped. This structure achieves an effective fusion of multi-scale features, balances the combination of deep semantic information and shallow detail information, and optimizes the feature map through the attentional mechanism, which improves the performance and localization accuracy of soybean stem node detection, and is especially suitable for small-target detection tasks, reflecting its uniqueness and advantages under the non-real-time demands of high-throughput phenotyping platforms. As an efficient underlying aggregation network, S_ELAN not only inherits the advantages of ELAN in feature aggregation but also achieves a balance between computational efficiency and performance by reducing the number of parameters. In particular, when S_ELAN is used as a specific component in the YOLO_SSP backbone (labeled as S_ELANT when used in conjunction with “True”, Figure 3c), it can enhance the network’s extraction and aggregation of the underlying features, and improve the model capability and model performance in the critical point detection task.
Finally, we retain the SPPCSPC (Figure 3d) module, which is designed to combine the dual benefits of spatial pyramid pooling (SPP) and contextual spatial pyramid pooling (CSCP), aiming to enhance the model’s ability to cope with object scale variations and to retain rich contextual information [53]. The SPP layer ensures that feature information at different spatial scales is comprehensively captured by performing down sampling of multi-scale features. This is crucial for refining the multi-scale attributes of the target from low-level features [54]. On the other hand, the CSCP layer expands on this by not only focusing on the integration of information in the spatial dimension but also by introducing a context-aware mechanism [55], which enables the model to take into account the features of the target’s surroundings, thus enriching the global understanding of low-level features. This combination strategy enables the SPPCSPC module to extract critical information from low-level features more efficiently, improve the quality of feature aggregation, and ultimately optimize the performance of the target detection task [56].
In conclusion, the combined application of advanced feature extraction modules not only serves to optimize the network structure but also improves the computational efficiency and significantly enhances the model’s ability to extract and understand features in complex scenes, leading to more accurate and robust solutions for plant image analysis and other visual tasks.

2.2.5. Low-Level Feature Extraction

In the process of optimizing the keypoint detection network for mature soybean stalk image analysis to improve its precision and accuracy, the maximum pooling layer (MP) [57], as an indispensable component of convolutional neural networks (CNNs), effectively reduces the spatial dimensionality of the feature maps by selecting the maximum value in each region it covers. This process not only preserves the most prominent features in the image but also greatly reduces the burden of subsequent computation, allowing the model to increase processing speed while maintaining high performance [58]. The application of the MP layer in different parts of the model also reflects its unique role. In the backbone part, MP_1 (Figure 4a) helps the network extract key information such as edges and textures of plants by gradually reducing the size of the feature map and retaining the most important features, which lays a solid foundation for subsequent recognition and localization. In the neck part, MP_2 (Figure 4b) sacrifices some of the spatial information to a certain extent in exchange for a more accurate judgment of the existence and location of plant nodes. This strategy enables the network to pay more attention to the key targets and improve the stability and accuracy of detection.
In summary, in the YOLO_SSP model, the synergistic application of the MP module and the advanced feature extraction module not only focuses on the high-level features and structure of the image but also achieves the double optimization of the model performance and efficiency through the refined feature extraction and dimensionality reduction processing. This strategy can provide strong technical support for plant keypoint detection.

2.2.6. Feature Optimization and Enhancement

The YOLOv7 detection head [59] is a key part of the model architecture, focusing on efficient and accurate detection. Its core architecture covers a multi-scale feature prediction module, localization and classification branches, and a lightweight design. Multi-scale feature prediction improves the detection accuracy of targets of different sizes by fusing different levels of features. The localization and classification branches are responsible for accurately predicting target locations and distinguishing target categories, respectively. The application of lightweight design strategies enables YOLOv7 to achieve fast detection while maintaining high performance [60].
The Effective Low-Level Aggregation Network for High-resolution feature aggregation (ELAN-H) [59] is an improved module introduced in YOLOv7 to enhance feature extraction and aggregation capabilities. Its structure is based on multipath feature stacking and fusion, which enhances the feature expression capability by increasing the deep-level feature interactions. ELAN-H contains multiple parallel paths, each of which performs different operations to increase the diversity of feature expression. Meanwhile, the deep fusion of features at different levels is realized by efficient fusion methods such as residual joining and cross-layer joining. In addition, ELAN-H is designed for high-resolution features to capture more detailed information, which is especially important for tasks requiring fine features such as keypoint detection [61].
In the stem node detection network, the ELAN-H module works closely with the detection head to improve the performance of the detection task. The ELAN-H module provides the detection head with high-quality feature maps through enhanced feature extraction and aggregation capabilities [62]. The head uses these feature maps to achieve accurate and efficient keypoint detection through multi-scale feature fusion strategies, localization and classification branching, and lightweight design. This integration and optimization significantly improves the feature representation and aggregation capabilities in the critical point detection task, which not only improves the accuracy of the detection but also maintains the efficient inference speed, providing a new optimization scheme for the application of deep learning in the field of critical point detection [63].

2.3. Experimental Environment

This study presents the experimental results conducted using the Pytorch deep learning framework and the Python 3.8 programming language. The experiments are run on a computer with a Linux operating system, RTX 3090 GPU, and 12V Intel (R) Xeon (R) Platinum 8255C CPU @ 2.50 GHz. The input image size for the model is 640 × 640 pixels, and is trained using a batch size of 4 on 1400 images. The tuned model is trained using the Adam optimizer throughout, starting with an initial learning rate of 0.01 and ending with a final learning rate of 0.1, over 300 sessions of 50 patience each.

2.4. Evaluation Metrics

This study primarily evaluates deep learning models from two key dimensions: model performance and model complexity. For performance metrics, we use precision (P), recall (R), and average accuracy (AP) from (1) to (3) as evaluation metrics. In particular, the average accuracy at 50% IOU threshold (AP@50%) is chosen for this study and is uniformly referred to as AP. Precision reflects the proportion of target instances that are correctly detected by the model across all instances of predictive volume. Recall, also known as the true positive rate, measures the model’s ability to correctly detect target instances across all actual target instances. Precision reflects the proportion of correctly detected target instances out of all predicted instances by the model. Recall, also known as the true positive rate, measures the model’s ability to correctly detect target instances among all actual target instances. Average precision per class measures the detection performance for a single class. It is the precision of the model’s predictions after sorting by confidence. A high AP indicates that the model not only has good precision at high recall rates but also maintains high precision across the entire recall range. In evaluating model complexity, we use the number of model parameters (Equation (4)) and the number of giga floating-point operations (GFLOPs) per 237 s (Equations (5) and (6)) as measures. These metrics not only reveal the complexity of the model but also reflect the model’s demand for computational resources. By combining these evaluation metrics, we can gain a deeper understanding of the efficiency and accuracy of deep learning models used for soybean stem node detection, providing valuable insights for subsequent research and applications.
P = T P T P + F P
R = T P T P + F N
A P = n = 1 N R n R n 1 P n
P a r a m e t e r s = r × f × f × o + o
F L O P s = 2 × H × W × C i n × K 2 + b i a s × C o u t
G F L O P s = 10 9 F L O P s
Notes: TP represents the count of positive samples correctly classified as positive, FN represents the count of positive samples incorrectly classified as negative, FP represents the count of negative samples incorrectly classified as positive, AP is the area under the precision–recall curve, Pn and Rn are the precision and recall at the nth point, respectively, and N is the total number of points, H × W represents the size of the output feature map, Cin is the number of input channels, K is the kernel size, and Cout is the number of output channels. In this study, the stem nodes labeled as “Node” are classified as positive.

3. Results

3.1. Model Improvement Experiment

By improving the model, the accuracy of stem node detection was enhanced. After training, the YOLOv7-SSP model proposed in this study exhibited significant superiority, with an accuracy of 89.59%, a recall rate of 86.97%, and an AP of 88.1%. As shown in Table 2, compared with YOLOv7-w6-pose, this model demonstrated substantial improvements, with a 2.21% increase in recall rate, a 2.6% increase in AP, and a reduction in the number of parameters by 35.59M. The original and improved models were evaluated using recall–confidence curves, F1–confidence curves, and precision–recall curves. The results are shown in Figure 5, where the red curve represents the relationship between precision, recall, and confidence for the YOLO_SSP model, and the blue curve represents the relationship between precision, recall, and confidence for the YOLOv7-w6-pose model. From Figure 5a, it can be seen that the recall decreases as the confidence level increases, and the recall of YOLO_SSP is slightly higher than that of YOLOv7-w6-pose at all confidence levels, especially in the middle and high confidence ranges, which suggests that YOLO_SSP is able to detect more positively classified samples. Figure 5b shows that precision gradually decreases as recall increases. In the high recall region (close to 1.0), YOLO_SSP’s precision is slightly higher, meaning it reduces false negatives while also having fewer false positives. Figure 5c indicates that, in the medium confidence range (0.4 to 0.6), both models achieve near-maximum F1 scores, suggesting they reach a good balance between precision and recall at this point, with YOLO_SSP performing slightly better than YOLOv7-w6-pose. The YOLO_SSP model outperforms YOLOv7-w6-pose across all metrics, particularly in the high recall and medium confidence range. As shown in Figure 6, in order to comparatively analyze the performance of different models in the same image detection task, this study selected the same image and detected it with different models, respectively, which was used as the basis for an in-depth comparative evaluation to highlight the advantages of the improved models. The results show that the YOLO_SSP model reduces missed detection in the case of plant tops, pod shading, and pod dropping while maintaining high accuracy, and shows better adaptability in the critical point detection task. While YOLOv7-w6-pose does not detect stem nodes well in the above three cases, these findings suggest that the YOLO_SSP model is more suitable for practical applications requiring high detection accuracy and robustness.

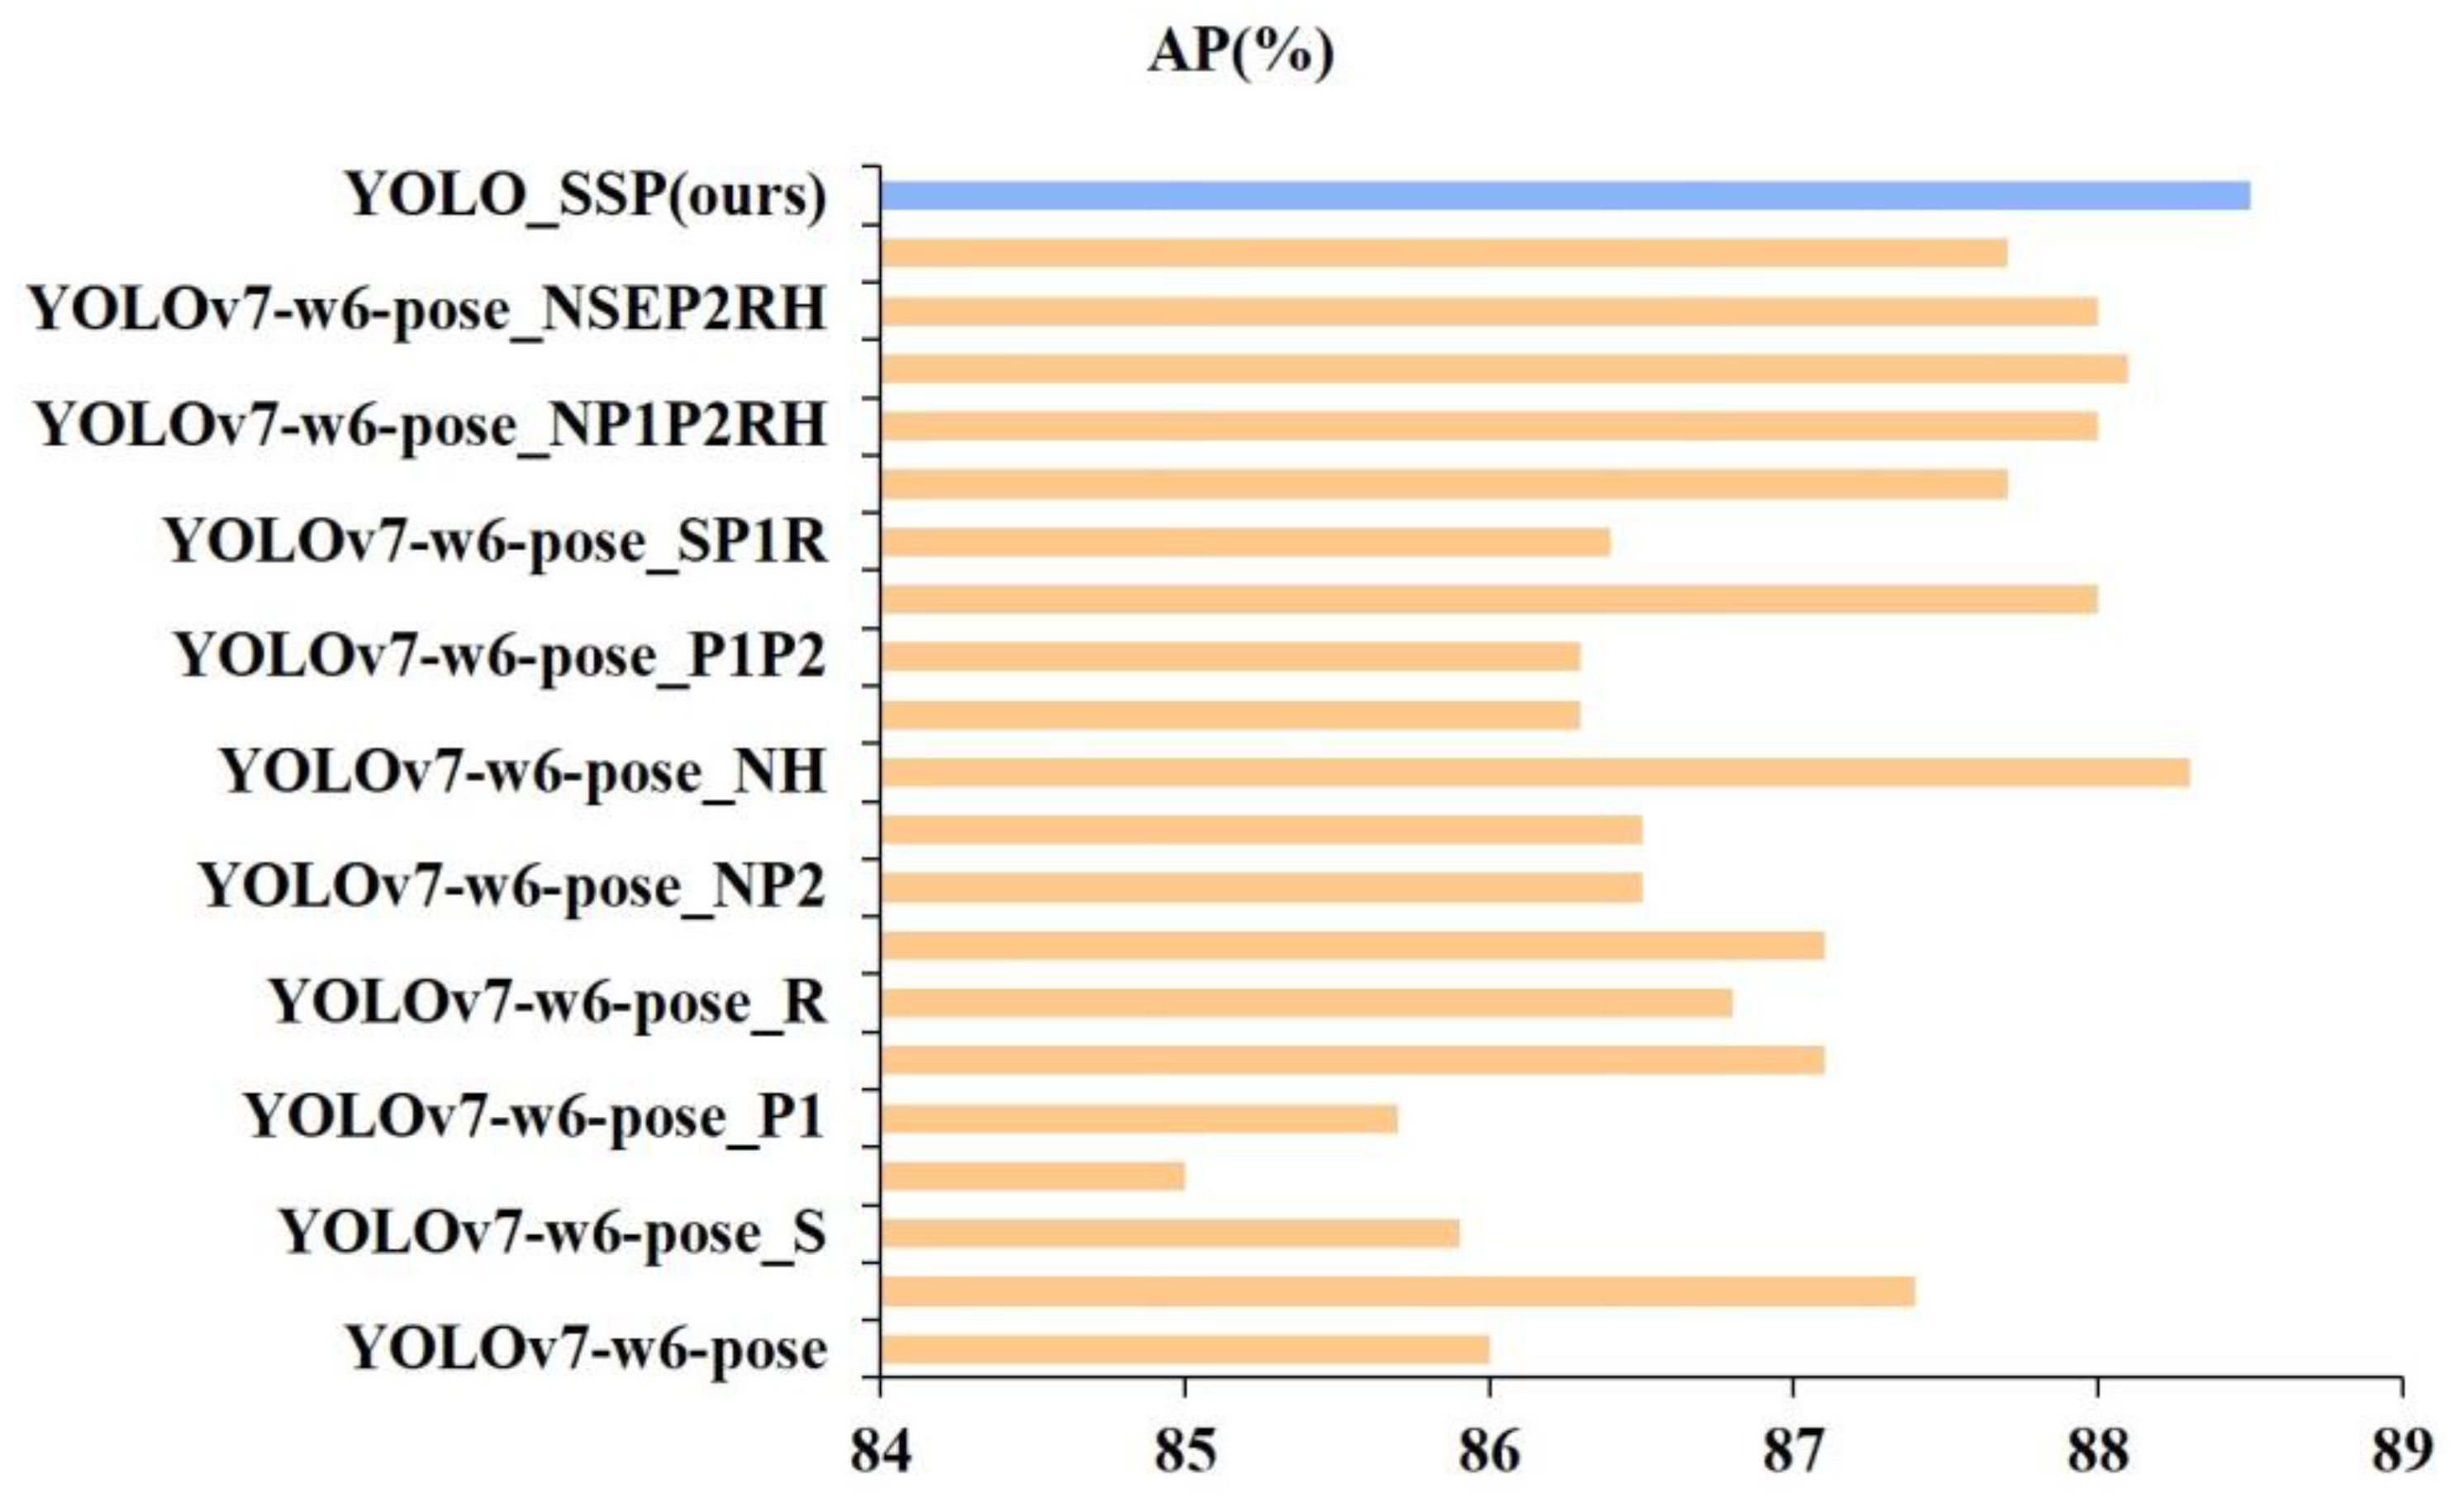
3.2. Ablation Experiment

Ablation experiments are a refined analytical method that systematically replace, remove, or add specific modules within a model to observe how these changes affect the overall performance of the model. To deeply explore the effects of different strategies on improving the performance of the YOLOv7-w6-pose model, this study meticulously designed ablation experiments, selecting 20 modified model variants as the subjects. These model variants employed various strategies aimed at optimizing the original YOLOv7-w6-pose from different angles, including but not limited to architectural adjustments and improvements in feature fusion methods. By comparing each of these models with the original, we can precisely evaluate the specific contribution of each modified module to the model’s performance, thereby identifying the most critical and effective optimization techniques.
The logical rigor of ablation experiments lies in the principle of controlling variables, where only one factor is changed at a time, ensuring that the experimental results directly reflect the effect of that factor. Table 3 lists the results of the ablation experiments, aiming to study the effectiveness of specific modules. The “√” symbol indicates that the corresponding strategy was applied, while “×” indicates that the strategy was not used. The results of the ablation experiments proved the effectiveness of the proposed modules. Specifically, the YOLO_SSP model showed significant improvements, with an accuracy of 90.0%, a recall rate of 86.2%, and an AP of 88.5%. Figure 7 shows the AP of each model; among many models, YOLO_SSP stands out, and YOLO_SSP maintains a high detection accuracy and effectively reduces false positives and false negatives.
In conclusion, the application of the ablation method not only deepened our understanding of the internal mechanisms of the YOLO_SSP model but also provided a solid empirical foundation for further improvements in model performance. YOLO_SSP precisely balances the relationship between performance enhancement and resource consumption, not only meeting high-precision and high-recall detection standards but also maintaining efficient operation under resource-constrained conditions, thereby demonstrating broad applicability and significant advantages in the acquisition of mature soybean stem node phenotypes.

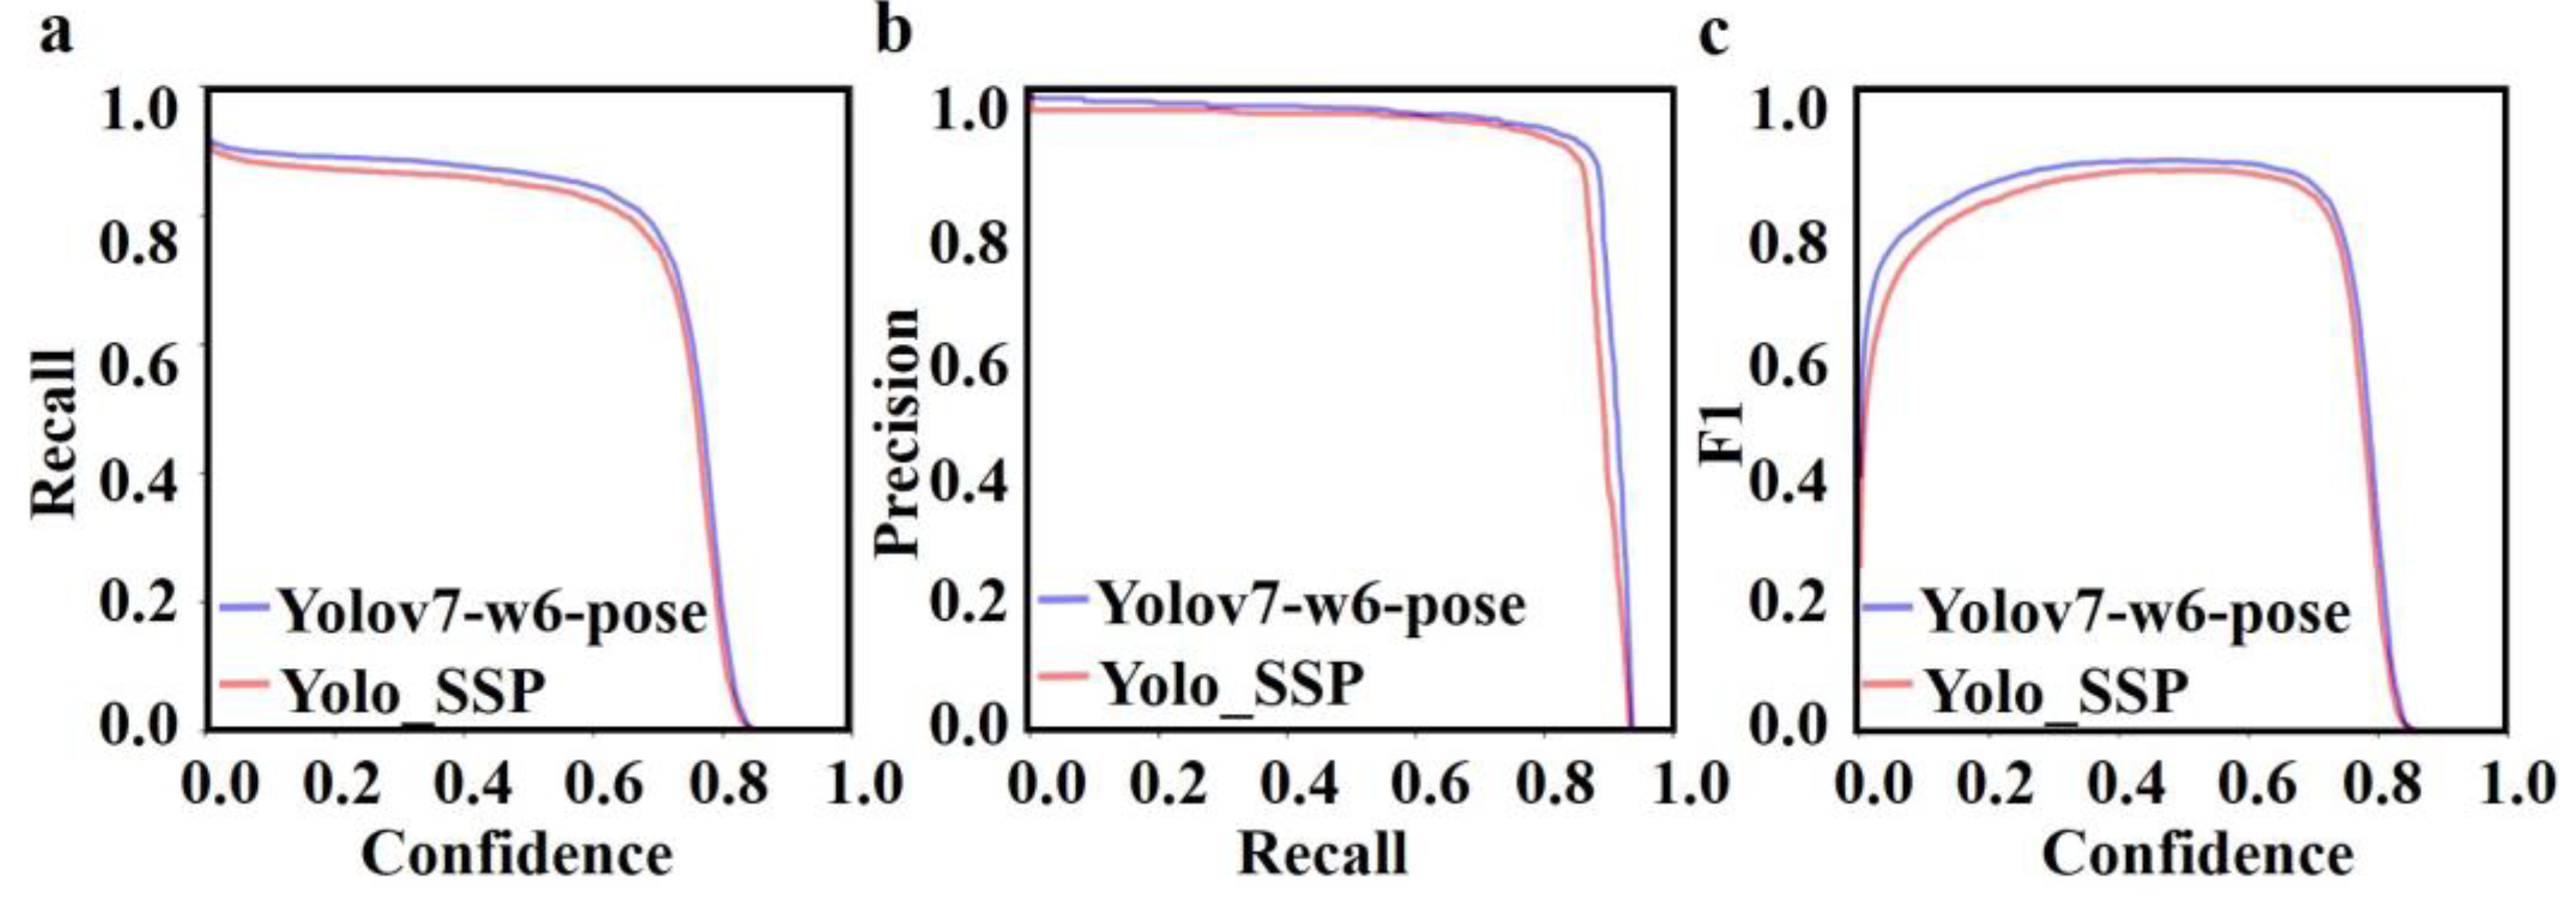
3.3. Comparative Experiment

Comparative experiments involve comparing models or algorithms to evaluate the differences in their performance. We select multiple related methods and test and compare them under identical experimental conditions (batch size = 1) to reveal the strengths and weaknesses of different approaches. To comprehensively and systematically evaluate the effectiveness of our proposed YOLO_SSP model in the task of soybean stem phenotype extraction, this study meticulously designed a series of comparative experiments aimed at directly comparing different detection algorithms to reveal their performance differences and merits. Specifically, we carefully selected several mainstream YOLO series variants, including but not limited to YOLOv7-w6-pose, YOLOv7-tiny-pose, and representative members from their version iterations such as YOLOv3-pose and YOLOv5 series (n, s, m versions) pose versions, along with the latest YOLOv6n-pose, YOLOv8n-pose, and YOLOv10b-pose, ensuring comprehensive and cutting-edge comparisons.
Table 4 shows the specific results of the experiments, indicating that the proposed YOLO_SSP model outperforms the other detection algorithms in terms of both accuracy and complexity. Compared with the YOLO series of keypoint detection algorithms, the proposed method improves the AP by 2.6%, 12.8%, 5.3%, 3.8%, 3.5%, 3.5%, 5.1%, 5.0%, 4.0%, 5.0%, and 4.5%, respectively. Figure 8a shows the variation in the average accuracy of each network as the number of trainings increases. As can be seen from the figure, YOLO_SSP reaches a high average accuracy very quickly during the training process and remains stable during subsequent training. This shows that YOLO_SSP not only adapts quickly to the data but also has good training stability.
Figure 8b shows the change in recall of each network as the number of training sessions increases. YOLO_SSP also achieves high recall at the beginning of training and remains stable throughout the training process. This shows that YOLO_SSP can effectively capture more actual targets and reduce false negatives. Figure 8c shows the training results of the final average accuracy of the model at the end of training. From the figure, it can be seen that the average accuracy of YOLO_SSP model is significantly higher than the average accuracy of other models. Figure 8d shows the results of the final recall of different networks at the end of training, and the recall of YOLO_SSP is significantly higher than that of other models. Figure 8c,d significantly demonstrate the superiority of YOLO_SSP for stem node detection in mature soybean.
In conclusion, this study constructed a rigorous and reasonable comparative experimental framework, and not only selected the optimal performance of yolov7 as the baseline model but also verified the effectiveness of the YOLO_SSP model, which promotes an in-depth understanding of the differences in the performance of different detection algorithms, and provides new perspectives and inspiration for the development of soybean stem phenotyping technology. The multiple performance indexes of the YOLO_SSP were superior to those of other YOLO networks. The high precision and recall of the YOLO network ensure the accuracy and comprehensiveness of target detection, while the moderate precision ensures the stability of multi-class detection performance. Therefore, YOLO_SSP has significant advantages in scenarios requiring efficient, accurate, and stable acquisition of stem node phenotypes, and shows excellent performance in soybean stem node phenotyping technology, which provides strong support for agricultural intelligence.

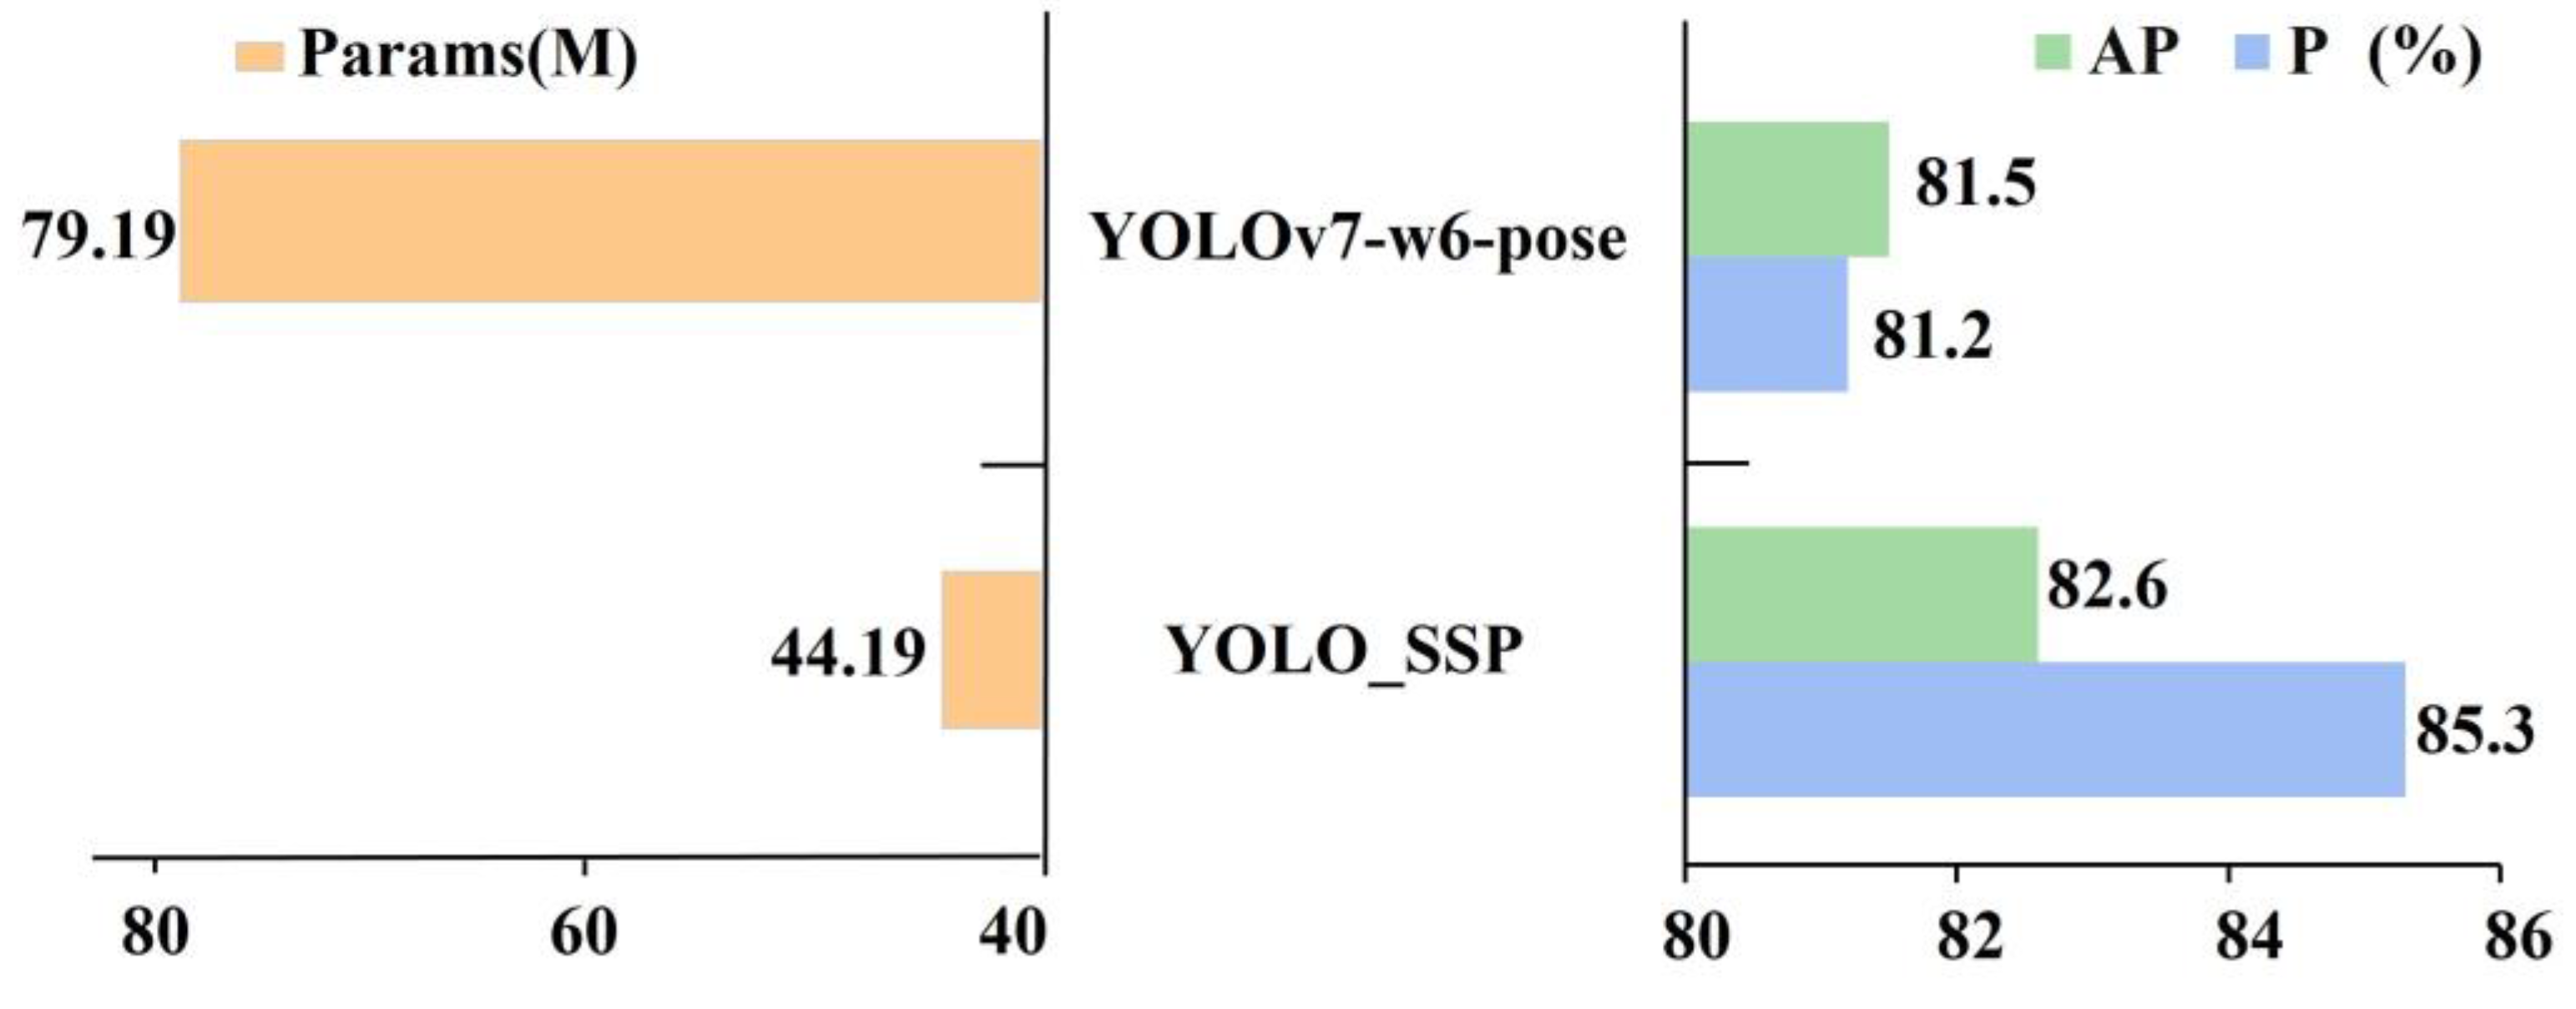
3.4. DY Dataset Testing Experiment

The DY dataset testing experiment comprehensively evaluated the generalization ability and robustness of the YOLO_SSP model in the stem node detection task, particularly its performance in soybean stem detection scenarios. The experiment used a proprietary image dataset under specific conditions, conducting comparative experiments before and after the improvements, and validating with independent test samples to directly reveal the specific contributions of model structure or algorithm optimization to performance enhancement. As shown in Table 5 and Figure 9, by comparing the detection results of the YOLO_SSP model before and after improvements, we found that the model achieved significant enhancements in both precision and AP. Specifically, precision increased by 4.1 percentage points, and AP increased by 1.1 percentage points, indicating that the YOLO_SSP model has higher accuracy and stability in identifying soybean stem nodes. Notably, while precision and AP improved, the model’s number of parameters was halved, reflecting the dual benefits of model optimization in enhancing performance and reducing computational costs.
Further analysis of the data in Figure 9 focused on the detection results for the label “Node” (stem node). It revealed a trend that performance optimization was often accompanied by a corresponding increase in the demand for computational resources. YOLO_SSP is compelling in that it is designed to achieve the dual optimization of performance and efficiency, which not only maintains a high level of detection precision and recall, effectively reducing false positives and omissions, but also tightly controls the total number of parameters and the computational complexity of the model, which significantly reduces the demand for computational resources. This significant difference shows that the YOLO model has a high level of detection accuracy and recall rate. This significant difference indicates that the YOLO_SSP model has higher accuracy and reliability in identifying mature soybean stem phenotypes, which further validates its superiority in this task. In summary, the testing experiment of the YOLO_SSP model on the DY dataset not only demonstrated its excellent performance in the stem node detection task but also provided strong evidence supporting its generalization ability and robustness across different datasets.

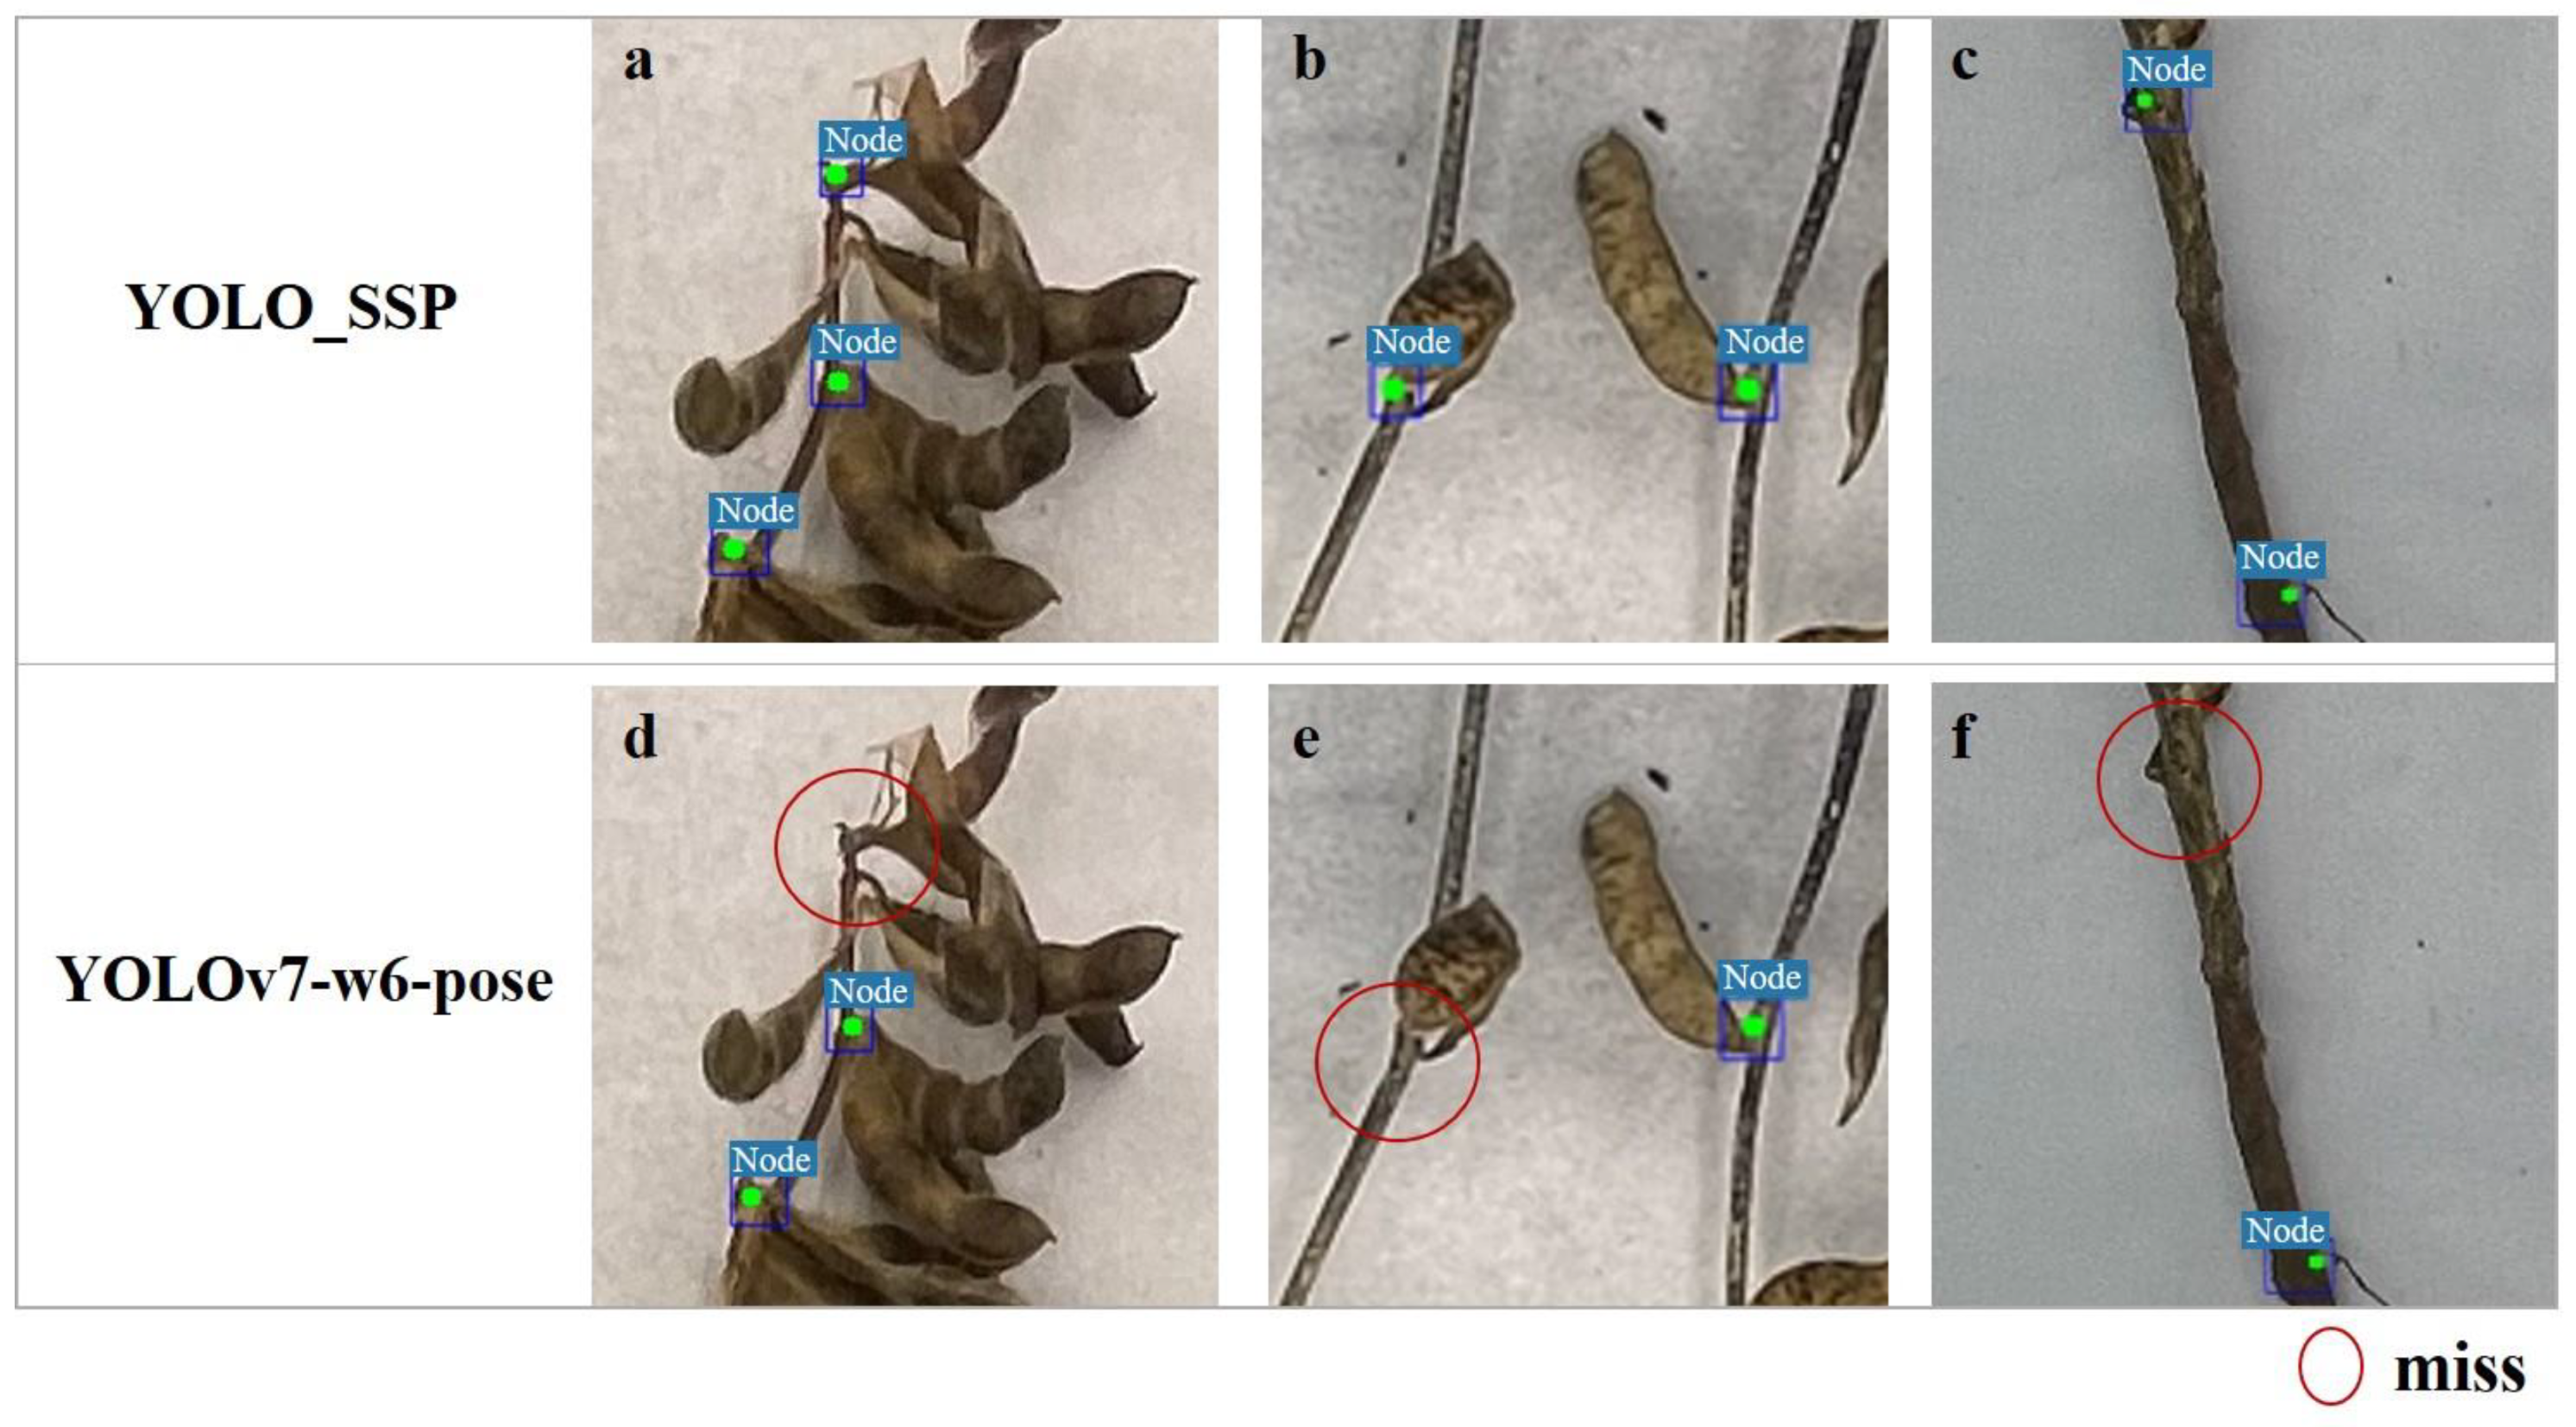
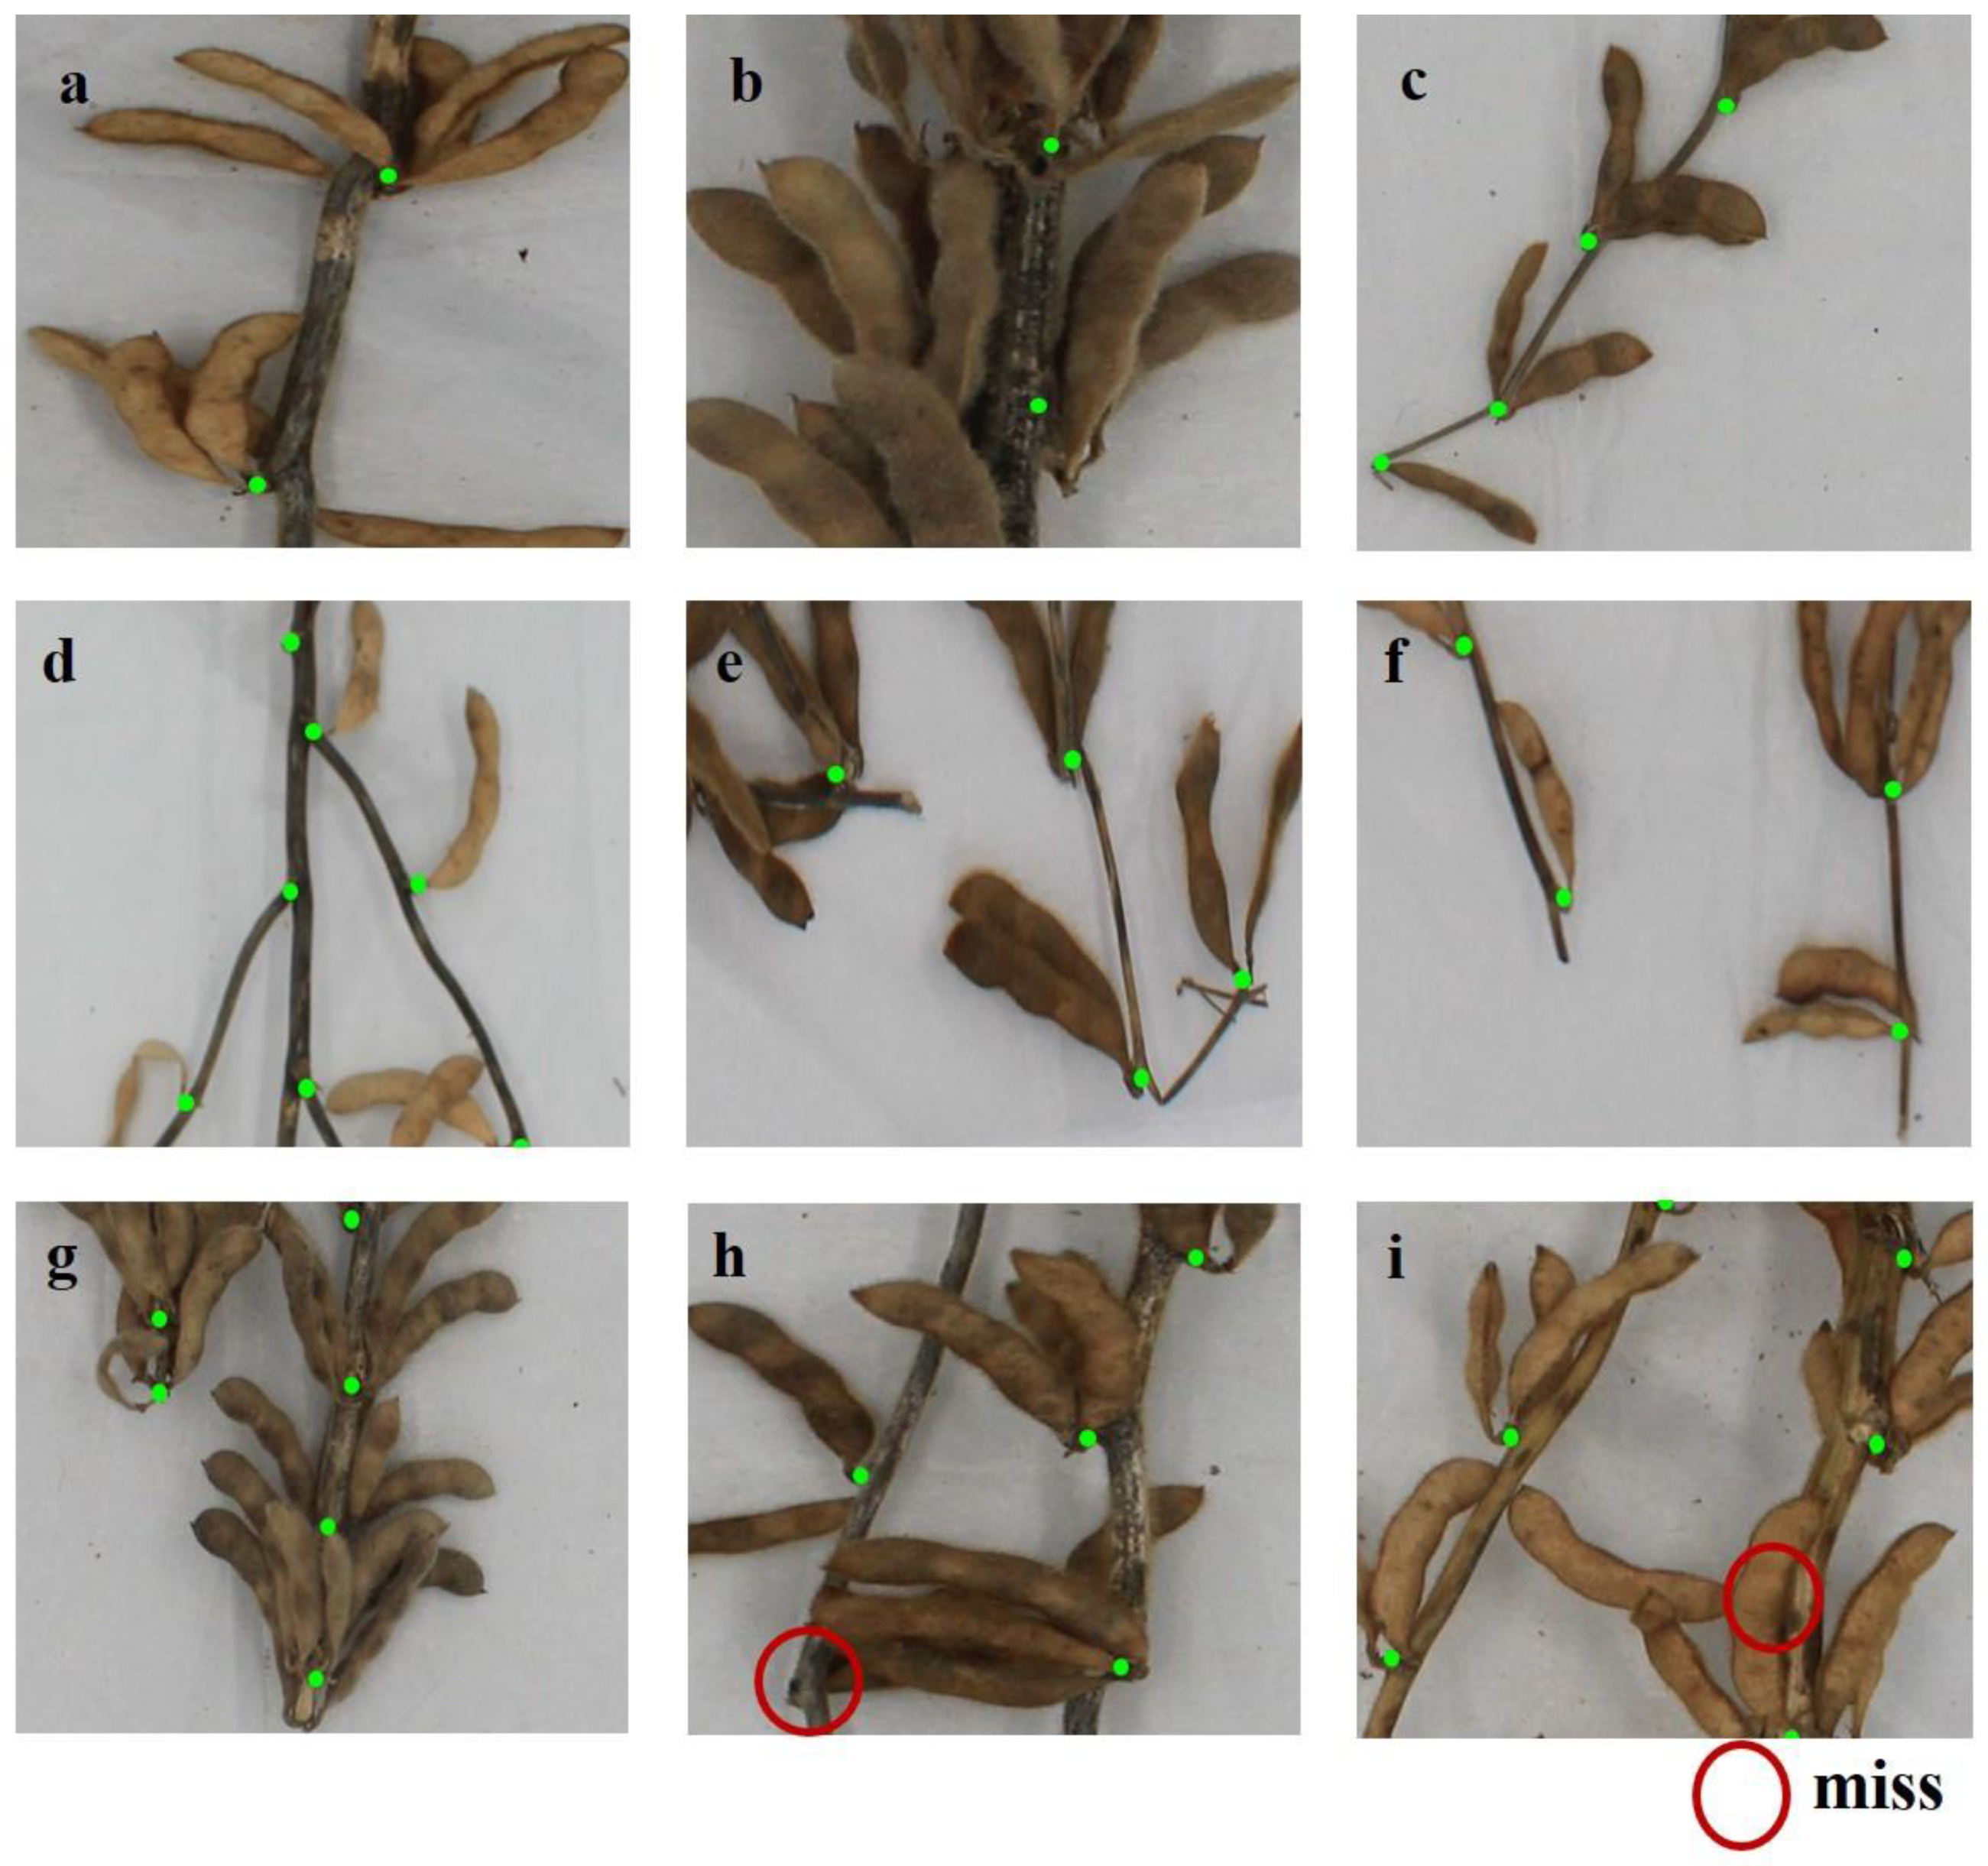
3.5. Visualization Experiment

Data visualization is based on graphical methods to clearly and effectively convey the implicit value information behind the data in a more intuitive form. It is essentially an extension of data analysis, enhancing data readability. Figure 10 shows the detection results of the proposed YOLO_SSP for different branching soybean plants. Figure 10a–c demonstrate the different mature soybean stem single branch detection status, including upright single branch target and dense single branch target with curved single branch target. And Figure 10d–i show different mature soybean stem multi-branch detection conditions, including dense pods, dropped pods, and shaded pods. It is demonstrated that the proposed model is able to detect denser mature soybean stem critical points, and plant apical nodes, normal multi-branches, and dense stem nodes can be accurately detected, except for completely obscured stem nodes. As shown in Figure 10h,i, the vast majority of stem nodes can still be accurately detected, although YOLO_SSP still has limitations, with the risk of misdetection or under detection when the pod–stalk junction is occluded by other pods or when the pods themselves obscure the pod–stalk junction. The experimental results show that the designed network model is robust to detecting multi-target semi-obscured dense stem nodes.

4. Discussion

4.1. Advantages of Using Yolov7 as a Baseline Model

In conducting research on the stem node detection task, the selection of an appropriate baseline model is crucial to accurately assess the performance of the new model YOLO_SSP. In this study, after careful consideration, we finally decided to adopt YOLOv7 as the baseline model instead of the current latest YOLOv10 or other models, and this choice was based on multiple considerations, aiming to ensure that the study was scientific, reasonable, and comprehensive. Comparison experiments show that the YOLOv7-w6-pose model achieves a high level of recall and average precision, 84.6% and 85.2%, respectively (while YOLOv10b-pose has an R of 71.5% and an AP of 83.2%). YOLOv7 shows excellent performance in the stem node detection task, and its performance is significantly better than that of YOLOv10b-pose and other widely recognized models, such as YOLOv3, YOLOv5 series, and YOLOv6. Therefore, selecting the more powerful YOLOv7 as the baseline model can more accurately assess the performance advantage of YOLO_SSP over current state-of-the-art models.
In addition, YOLOv7 has been extensively validated and applied in the community, with a wealth of resources and support [64]. In contrast, YOLOv10, as a newer version, still has relatively limited validation and application in the community [65]. The release of new models is often accompanied by imperfections in model stability and training tuning strategies, which may lead to fluctuating performances on different tasks and a lack of large-scale third-party evaluation validation. Therefore, to ensure the reliability and persuasiveness of this study, it was more appropriate to choose the well-validated YOLOv7 as the baseline model.
In summary, the selection of YOLOv7 as the baseline model was reasonable and scientific. This choice not only gave full consideration to the newest and most representative model but also ensured the recognized methodology of this study and the generality of the conclusions. By adopting YOLOv7 as the baseline model, we were able to more clearly demonstrate the performance advantages of YOLO_SSP and enhance this study’s widespread acceptance and reproducibility. This decision not only reflects our rigorous approach to research but also provides a solid foundation for us to accurately assess the performance of the new model.

4.2. Advantages of YOLO_SSP in Mature Soybean Stem Node Detection

Accurately identifying soybean stem phenotypes directly on the plant without removing pods is a challenging task, especially when pod density is high. Dense pods tend to obscure soybean stem nodes, which not only increases the risk of missed and false detections but also poses additional difficulties in detecting soybean stem nodes. On mature soybean plants, the shading between pods and stems, and between pods and each other, further overwhelms existing detection methods in the face of this particular challenge. In order to overcome this challenge, we borrowed the advanced concepts of human critical point detection techniques and creatively proposed the YOLO_SSP method. Experimental results show that this method exhibits significant advantages over other methods in solving the occlusion problem in soybean stem node detection.
YOLOv5s and YOLOv8n were originally designed for industrial inspection, security monitoring, and mobile real-time scenarios, and their core advantage lies in their ability to quickly recognize small and medium-sized targets. YOLOv5s and YOLOv8n can be effectively used for soybean target detection, mainly due to the high adaptability of their architectural design. The built-in multi-scale detection mechanism of these two models can accurately capture the size difference of soybeans, whether it is the fine identification of close-range bean grains or the overall localization of a group of bean plants at a long distance, and stable detection can be achieved through the synergy of shallow detailed features and deep semantic features. As shown in Table 6, although there have been studies such as Du [66], who successfully utilized the YOLO v5s model to achieve bounding box and keypoint detection for tomato, Du [67] further explored the detection of keypoints at the center of the calyx or at the junction of the calyx and the actual fruit axis for tomato based on this model and Chen [68] attempted the detection of grape picking points based on the YOLOv8n-Pose model for grape-picking point detection, but when we applied these techniques to soybean stem node detection, although we achieved some results, none of the detection effects were as good as YOLO_SSP, and there is still much room for improvement.
The YOLO_SSP method significantly improves the performance of the YOLOv7-w6-pose model by performing a series of replacement and enhancement operations. For backbone layer optimization, we first replaced the ReOrg layer with two CBS modules to enhance feature extraction [72,73], and then introduced the S_ELAN module in combination with other modules to efficiently aggregate low-level features to improve the performance of keypoint detection [74]. Next, the MP_1 module was used to replace the CBS, which both preserved key features and reduced the feature map to facilitate the extraction of edge and texture information [75,76]. For neck improvement, the MP_2 module replaces CBS to reduce the loss of spatial information and allowed the network to focus more on plant nodes [77], followed by the RepConv module to replace CBS to provide greater flexibility for training [78]. The header improvement, on the other hand, replaced the YOLOv7-w6-pose with the YOLOv7 detection header, which significantly enhanced the adaptability and robustness of keypoint detection. In the evaluation in Section 3.2, we provide an in-depth analysis of the impact of different modules on the model performance, revealing how these modules work together to effectively identify and localize soybean stem nodes, and further demonstrating the significant advantages of YOLO_SSP in coping with pod occlusion.

4.3. Specificity of the S_ELAN or ELAN-H Module

The network improvements led to enhanced model performance, but the ablation experiments yielded some unexpected results. First, adding the S_ELAN or ELAN-H module alone decreased the model’s performance, but, when combined with other modules, the overall performance improved. Meanwhile, MP_1 was a max pooling layer structure added to the backbone of the network. Adding the max pooling layer alone (YOLOv7-w6-pose-MP_1) led to a decrease in model accuracy. However, when other modules were modified without adding the pooling layer to the backbone (YOLOv7-w6-pose_NSEP2RH), the model accuracy improved, though it was still lower than that of the YOLO_SSP model. Upon analysis, several potential reasons for these results were identified. First, S_ELAN or ELAN-H alone may have disrupted the model’s structure and feature extraction, leading to a decline in performance. However, when these modules were combined with others, they may have produced a synergistic effect, improving the model’s feature extraction and representation abilities, thereby enhancing overall performance [79]. Secondly, different modules (such as ReOrg, MP_1, MP_2, RepConv, etc.) have varying roles in feature extraction and fusion. When these modules are appropriately combined, they may enhance the diversity and quality of features, thereby improving model performance. However, incorrect combinations may disrupt the feature extraction process, leading to a decline in performance [80]. Finally, different module combinations may require different optimization strategies and hyper parameter settings. Inappropriate settings could have caused the model’s performance to decline [81].

4.4. YOLO Comparative Advantages of the Models in the Pose Series

This study focused on the task of soybean stem node detection, given that there is a gap in the application of keypoint networks in this area, while the YOLO family of detection frame methods has shown initial success as a mainstream detection tool. For example, Oliveira [82] proposed a new grapevine node detection method using the YOLOv7 baseline model, and Shrestha [83] proposed a sugarcane stem node recognition algorithm that improves the YOLOv4-Tiny for accurate and fast recognition and cutting of sugarcane stem nodes. Wen [84]’s study was based on YOLOv7 for sugarcane stem node detection; Xie [85]’s study was based on a novel lightweight network of the YOLOv5 framework for sugarcane stem node detection; Hu [86] proposed an improved YOLOv5 model on three different crops (pepper, eggplant, and tomato) to achieve crop node detection, but it still suffered from imprecise stem node localization, especially the limitation in providing precise locations for obtaining stem node-related phenotypic information (stem node length, plant height, etc.). To overcome these challenges, this study introduces the YOLO_SSP model, which is able to capture the minute features of stem nodes more accurately by integrating the keypoint detection mechanism and effectively deal with the dense distribution of stem nodes, thus standing out in the soybean stem node detection task.
In choosing the comparison models, this study decided to compare only the YOLO series of models based on an in-depth analysis of the current state of existing research. This decision was mainly due to the following considerations: First, although there are many well-known models in the field of pose estimation, these models are mostly designed for human pose estimation tasks, and their characteristics are significantly different from those of the soybean stem node detection task, where human pose estimation networks are designed with the goal of balancing both global and local information [87], whereas stem node detection may need to focus more on local texture and shape information [88]. Directly applying these models to soybean stem node detection tasks may face issues with data suitability [89] and model generalization ability [90]. In contrast, the YOLO family of models performs more robustly in the plant stem node detection task and has an established research base.
Second, this study aimed to evaluate the unique advantages of the YOLO_SSP model in the field of plant detection, and the comparison with the YOLO series model can more accurately reflect its performance enhancement. In addition, considering the comprehensiveness of this study and the competitiveness of the YOLO_SSP model, although a comprehensive comparison with other pose estimation models was not conducted in this study, the excellent performance of the YOLO_SSP model in the soybean stem node detection task has initially proved its potential and application value in the field of plant detection. Future studies could further extend the comparison to fully assess the competitiveness of the YOLO_SSP model in a wider range of fields and explore the possibility of its application in other plant phenotyping tasks.
In summary, this study verified the excellent performance of the YOLO_SSP model in the soybean stem node detection task by comparing it with the YOLO series of models and provided strong support for its application in a wider range of plant detection fields.

4.5. A Non-Critical Exploration of Speed

The multidimensional needs of the experimental design need to be scrutinized when exploring the failure to include inferential speed in the evaluation metrics system. This study aimed to develop a model that will eventually be deployed on a high-throughput phenotyping platform for batch processing and analyzing plant phenotyping data. First, in terms of experimental objectives, the core focus of this study was to improve the accuracy and stability of the model on the stem node detection task. Therefore, when constructing the model evaluation index system, we prioritized the model’s accuracy, recall, and other indicators that can directly reflect the detection performance. These metrics are crucial for assessing model performance in complex phenotyping data, while inference speed was excluded because it was not the focus of this experiment [91,92].
Second, the core task of high-throughput phenotyping platforms was to emphasize the extraction of high-precision phenotypic features and in-depth statistical analysis, and their original design and technical features determined that the speed of inference was not a key factor in this study. Platforms are usually equipped with powerful computational capabilities to effectively cope with the demands of large-scale data processing through advanced techniques such as distributed processing [93,94], task chunking, etc. [95,96]. This means that, even if the inference speed of a model is not optimal, it can be handled properly within the computational power of the platform without substantially affecting the overall course of the experiment [97]. In addition, hardware upgrades, while improving processing speed, do not directly improve model accuracy [98,99,100], which is another important reason why we emphasized model detection performance over inference speed.
In summary, the decision not to use inference speed as an evaluation index in this study was both consistent with the practical needs of the experimental objectives and reflected a deep understanding and rational utilization of the features of high-throughput phenotyping platforms. By focusing on improving the detection performance of the model, we expected to be able to provide more accurate and reliable phenotyping data support for subsequent research activities and breeding practices. This decision not only helped to optimize the experimental design but also further highlighted the unique contribution of this study in the field of high-throughput phenotyping data analysis and soybean breeding.

4.6. Limitations of This Study

In Experiment 3.4, it was found that some soybean stem top nodes were missed or incorrectly detected, suggesting that a larger more diverse dataset may be needed to improve the accuracy of the model. However, obtaining such a dataset is indeed challenging. We need to include more diverse scenarios and challenging cases, such as occlusion and variations in stem node morphology, to more comprehensively evaluate the actual performance of the YOLO_SSP model, including its ability to handle complex scenarios and anomalies, and to continuously improve the model’s detection performance. Currently, some studies [101,102] have applied keypoint information for 3D structure analysis to obtain target information. Similarly, using keypoint information for 3D structure analysis to obtain phenotypic traits in agriculture also holds great potential. By using 3D cameras combined with depth information to directly capture soybean stem images in the field, and utilizing 5G base stations to transmit images of mature soybean stems to the cloud, the limitations of small dataset size, uniform background, and mutual occlusion between pods can be addressed. This study focused on the keypoint detection of mature soybean stems in a consistent environment. In future research, mature soybean plants in complex field backgrounds can be collected for soybean stem phenotype acquisition, expanding the applicability of the network model, further improving detection model accuracy, and facilitating breeding work.

4.7. Future Work

Mature soybean stem node detection is an essential step in soybean production. Detecting and identifying keypoints on soybeans allows for calculating key breeding traits like the number of stem nodes, internode length, plant height, and the distance of the lowest node from the ground. This enables more accurate estimation of soybean yield, plant architecture, and other phenotypic traits. Therefore, when creating the dataset, we used a ruler for calibration, laying the foundation for the subsequent measurement of soybean stem node length and plant height. At the same time, we plan to develop SSP software for the efficient identification of key traits of soybean plant stems, such as calculating the number of stem nodes, internode length, plant height, and the distance of the lowest node from the ground. This will enable one-click identification, reduce manual labor, and accelerate the breeding process, laying the groundwork for acquiring stem traits in breeding work. In the future, with the introduction of more datasets and continuous model optimization, the YOLO_SSP model is expected to further expand its application scope and contribute more significantly to the development of precision agriculture.

5. Conclusions

In this study, we propose and validate the YOLO_SSP model, which is an innovative deep learning tool that effectively mitigates the detection challenges posed by the overlap of pods and stems, and realizes high-precision and non-destructive phenotypic feature extraction. Experimental results show that YOLO_SSP outperforms mainstream keypoint detection algorithms, provides powerful technical support for agricultural research, and is expected to revolutionize field crop monitoring and management and improve agricultural output through integration with IoT devices. In addition, this research provides a scalable solution for the development of plant phenotyping technology, heralding its potential for widespread application in multi-crop and multi-trait detection. Future work will focus on improving model adaptation in complex field backgrounds and integration of multi-source data such as hyperspectral data, and quantifying and deploying the model to large-scale high-throughput phenotyping platforms to optimize the accuracy and robustness of plant trait detection.

Author Contributions

Q.W., conceptualization, data organization, methodology, writing—original draft, visualization, validation; F.L., conceptualization, methodology, writing—review and editing, guidance; H.L., data organization, validation; H.Z., validation, methodology; C.W., validation; H.W. data organization. L.Z., conceptualization, funding acquisition, project management, writing—review and editing, guidance, data organization; Z.H., methodology, guidance, writing—review and editing; All authors have read and agreed to the published version of the manuscript.

Funding

This work is from the Shandong Key Research and Development Program of Good Seed Engineering project topic, the project name is soybean whole-life salt tolerance precision identification technology research (2023LZGC008-001).

Data Availability Statement

The data are available from the corresponding author upon reasonable request.

Acknowledgments

I would like to express my sincere gratitude to my three supervisors for their attentive guidance and generous help, whose professional insights and valuable suggestions have had a profound impact on my work. At the same time, I would like to express my sincere gratitude to the other authors for their contributions to this project, and it is the joint efforts of all of them that have made this work possible.

Conflicts of Interest

The authors declare that they have no known competing financial interests or personal relationships that could have appeared to influence the work reported in this paper.

Abbreviations

The following abbreviations are used in this manuscript:
YOLO_SSPYou Only Look Once _Soybean Stalk Pose
AHTIDZAgricultural High-Tech Industrial Demonstration Zone
S_ELANSmall_Effective Low-Level Aggregation Network
ELANEffective Low-Level Aggregation Network
ELAN-HEffective Low-Level Aggregation Network for High-resolution feature aggregation
CBSConv-BatchNorm-ReLU
BNBatchNorm
SPPSpatial Pyramid Pooling
CSCPContextual Spatial Pyramid Pooling
CSPCross Stage Partial

References

  1. Jarecki, W.; Migut, D. Comparison of Yield and Important Seed Quality Traits of Selected Legume Species. Agronomy 2022, 12, 2667. [Google Scholar] [CrossRef]
  2. Nehbandani, A.; Soltani, A.; Hajjarpoor, A.; Dadrasi, A.; Nourbakhsh, F. Comprehensive yield gap analysis and optimizing agronomy practices of soybean in Iran. J. Agric. Sci. 2020, 158, 739–747. [Google Scholar] [CrossRef]
  3. Świątkiewicz, M.; Witaszek, K.; Sosin, E.; Pilarski, K.; Szymczyk, B.; Durczak, K. The Nutritional Value and Safety of Genetically Unmodified Soybeans and Soybean Feed Products in the Nutrition of Farm Animals. Agronomy 2021, 11, 1105. [Google Scholar] [CrossRef]
  4. Dorman, S.J.; Hopperstad, K.A.; Reich, B.J.; Kennedy, G.; Huseth, A.S. Soybeans as a non-Bt refuge for Helicoverpa zea in maize-cotton agroecosystems. Agric. Ecosyst. Environ. 2021, 322, 107642. [Google Scholar] [CrossRef]
  5. Li, Y.; Yu, H.; Liu, L.; Liu, Y.; Huang, L.; Tan, H. Transcriptomic and physiological analyses unravel the effect and mechanism of halosulfuron-methyl on the symbiosis between rhizobium and soybean. Ecotoxicol. Environ. Saf. 2022, 247, 114248. [Google Scholar] [CrossRef]
  6. Adler, P.R.; Hums, M.E.; McNeal, F.M.; Spatari, S. Evaluation of environmental and cost tradeoffs of producing energy from soybeans for on-farm use. J. Clean. Prod. 2019, 210, 1635–1649. [Google Scholar] [CrossRef]
  7. Kebede, E. Contribution, utilization, and improvement of legumes-driven biological nitrogen fixation in agricultural systems. Front. Sustain. Food Syst. 2021, 5, 767998. [Google Scholar] [CrossRef]
  8. Zhou, J.; Zhou, J.; Ye, H.; Ali, M.L.; Chen, P.; Nguyen, H.T. Yield estimation of soybean breeding lines under drought stress using unmanned aerial vehicle-based imagery and convolutional neural network. Biosyst. Eng. 2021, 204, 90–103. [Google Scholar] [CrossRef]
  9. Yang, Q.; Lin, G.; Lv, H.; Wang, C.; Yang, Y.; Liao, H. Environmental and genetic regulation of plant height in soybean. BMC Plant Biol. 2021, 21, 63. [Google Scholar] [CrossRef]
  10. Vogel, J.T.; Liu, W.; Olhoft, P.; Crafts-Brandner, S.J.; Pennycooke, J.C.; Christiansen, N. Soybean yield formation physiology—A foundation for precision breeding based improvement. Front. Plant Sci. 2021, 12, 719706. [Google Scholar] [CrossRef]
  11. Xu, C.; Li, R.; Song, W.; Wu, T.; Sun, S.; Hu, S.; Han, T.; Wu, C. Responses of branch number and yield component of soybean cultivars tested in different planting densities. Agriculture 2021, 11, 69. [Google Scholar] [CrossRef]
  12. Staniak, M.; Czopek, K.; Stępień-Warda, A.; Kocira, A.; Przybyś, M. Cold stress during flowering alters plant structure, yield and seed quality of different soybean genotypes. Agronomy 2021, 11, 2059. [Google Scholar] [CrossRef]
  13. Staniak, M.; Szpunar-Krok, E.; Kocira, A. Responses of soybean to selected abiotic stresses—Photoperiod, temperature and water. Agriculture 2023, 13, 146. [Google Scholar] [CrossRef]
  14. Li, W.; Wang, P.; Zhao, H.; Sun, X.; Yang, T.; Li, H.; Hou, Y.; Liu, C.; Siyal, M.; Raja Veesar, R. QTL for main stem node number and its response to plant densities in 144 soybean FW-RILs. Front. Plant Sci. 2021, 12, 666796. [Google Scholar] [CrossRef] [PubMed]
  15. Zhang, R.; Shan, F.; Wang, C.; Yan, C.; Dong, S.; Xu, Y.; Gong, Z.; Ma, C. Internode elongation pattern, internode diameter and hormone changes in soybean (Glycine max) under different shading conditions. Crop Pasture Sci. 2020, 71, 679–688. [Google Scholar] [CrossRef]
  16. Xu, Y.; Wang, C.; Zhang, R.; Ma, C.; Dong, S.; Gong, Z. The relationship between internode elongation of soybean stems and spectral distribution of light in the canopy under different plant densities. Plant Prod. Sci. 2021, 24, 326–338. [Google Scholar] [CrossRef]
  17. Fu, M.; Wang, Y.; Ren, H.; Du, W.; Yang, X.; Wang, D.; Cheng, Y.; Zhao, J.; Gai, J. Exploring the QTL–allele constitution of main stem node number and its differentiation among maturity groups in a Northeast China soybean population. Crop Sci. 2020, 60, 1223–1238. [Google Scholar] [CrossRef]
  18. Burroughs, C.H.; Montes, C.M.; Moller, C.A.; Mitchell, N.G.; Michael, A.M.; Peng, B.; Kimm, H.; Pederson, T.L.; Lipka, A.E.; Bernacchi, C.J.; et al. Reductions in leaf area index, pod production, seed size, and harvest index drive yield loss to high temperatures in soybean. J. Exp. Bot. Exp. Bot. 2022, 74, 1629–1641. [Google Scholar] [CrossRef]
  19. Takpah, D.; Asghar, M.A.; Raza, A.; Javed, H.H.; Ullah, A.; Huang, X.; Saleem, K.; Xie, C.; Xiao, X.; Clement, K.S.; et al. Metabolomics Analysis Reveals Soybean Node Position Influence on Metabolic Profile of Soybean Seed at Various Developmental Stages. J. Plant Growth Regul. 2023, 42, 6788–6800. [Google Scholar] [CrossRef]
  20. Lahiri, S.; Reisig, D.D.; Dean, L.L.; Reay-Jones, F.P.F.; Greene, J.K.; Carter, T.E.J.; Mian, R.; Fallen, B.D. Mechanisms of Soybean Host-Plant Resistance Against Megacopta cribraria (Hemiptera: Plataspidae). Environ. Entomol. 2020, 49, 876–885. [Google Scholar] [CrossRef]
  21. Zhou, Y.; Zhou, H.; Chen, Y. An automated phenotyping method for Chinese Cymbidium seedlings based on 3D point cloud. Plant Methods 2024, 20, 151. [Google Scholar] [CrossRef] [PubMed]
  22. Deng, J.; Liu, S.; Chen, H.; Chang, Y.; Yu, Y.; Ma, W.; Wang, Y.; Xie, H. A Precise Method for Identifying 3D Circles in Freeform Surface Point Clouds. IEEE Trans. Instrum. Meas. 2025, 74, 5023713. [Google Scholar] [CrossRef]
  23. Wang, B.; Yang, M.; Cao, P.; Liu, Y. A novel embedded cross framework for high-resolution salient object detection. Appl. Intell. 2025, 55, 277. [Google Scholar] [CrossRef]
  24. Fan, J.; Zhang, Y.; Wen, W.; Gu, S.; Lu, X.; Guo, X. The future of Internet of Things in agriculture: Plant high-throughput phenotypic platform. J. Clean. Prod. 2021, 280, 123651. [Google Scholar] [CrossRef]
  25. Tholkapiyan, M.; Aruna Devi, B.; Bhatt, D.; Saravana Kumar, E.; Kirubakaran, S.; Kumar, R. Performance Analysis of Rice Plant Diseases Identification and Classification Methodology. Wirel. Pers. Commun. 2023, 130, 1317–1341. [Google Scholar] [CrossRef]
  26. Ghanem, M.E.; Marrou, H.; Sinclair, T.R. Physiological phenotyping of plants for crop improvement. Trends Plant Sci. 2015, 20, 139–144. [Google Scholar] [CrossRef]
  27. Guo, Y.; Gao, Z.; Zhang, Z.; Li, Y.; Hu, Z.; Xin, D.; Chen, Q.; Zhu, R. Automatic and accurate acquisition of stem-related phenotypes of mature soybean based on deep learning and directed search algorithms. Front. Plant Sci. 2022, 13, 906751. [Google Scholar] [CrossRef]
  28. Li, Z.; Guo, R.; Li, M.; Chen, Y.; Li, G. A review of computer vision technologies for plant phenotyping. Comput. Electron. Agric. 2020, 176, 105672. [Google Scholar] [CrossRef]
  29. Li, S.; Yan, Z.; Guo, Y.; Su, X.; Cao, Y.; Jiang, B.; Yang, F.; Zhang, Z.; Xin, D.; Chen, Q.; et al. SPM-IS: An auto-algorithm to acquire a mature soybean phenotype based on instance segmentation. Crop J. 2022, 10, 1412–1423. [Google Scholar] [CrossRef]
  30. Guo, X.; Li, J.; Zheng, L.; Zhang, M.; Wang, M. Acquiring soybean phenotypic parameters using Re-YOLOv5 and area search algorithm. Trans. Chin. Soc. Agric. Eng. 2022, 38, 186–194. [Google Scholar]
  31. Zhou, W.; Chen, Y.; Li, W.; Zhang, C.; Xiong, Y.; Zhan, W.; Huang, L.; Wang, J.; Qiu, L. SPP-extractor: Automatic phenotype extraction for densely grown soybean plants. Crop J. 2023, 11, 1569–1578. [Google Scholar] [CrossRef]
  32. Singh, A.; Ganapathysubramanian, B.; Singh, A.K.; Sarkar, S. Machine Learning for High-Throughput Stress Phenotyping in Plants. Trends Plant Sci. 2016, 21, 110–124. [Google Scholar] [CrossRef] [PubMed]
  33. Yang, S.; Zheng, L.; Yang, H.; Zhang, M.; Wu, T.; Sun, S.; Tomasetto, F.; Wang, M. A synthetic datasets based instance segmentation network for High-throughput soybean pods phenotype investigation. Expert Syst. Appl. 2022, 192, 116403. [Google Scholar] [CrossRef]
  34. Zhang, C.; Lu, X.; Ma, H.; Hu, Y.; Zhang, S.; Ning, X.; Hu, J.; Jiao, J. High-Throughput Classification and Counting of Vegetable Soybean Pods Based on Deep Learning. Agronomy 2023, 13, 1154. [Google Scholar] [CrossRef]
  35. Lu, W.; Du, R.; Niu, P.; Xing, G.; Luo, H.; Deng, Y.; Shu, L. Soybean yield preharvest prediction based on bean pods and leaves image recognition using deep learning neural network combined with GRNN. Front. Plant Sci. 2022, 12, 791256. [Google Scholar] [CrossRef]
  36. He, H.; Ma, X.; Guan, H.; Wang, F.; Shen, P. Recognition of soybean pods and yield prediction based on improved deep learning model. Front. Plant Sci. 2023, 13, 1096619. [Google Scholar] [CrossRef]
  37. Yang, S.; Zheng, L.; Chen, X.; Zabawa, L.; Zhang, M.; Wang, M. Transfer learning from synthetic in-vitro soybean pods dataset for in-situ segmentation of on-branch soybean pods. In Proceedings of the IEEE/CVF Conference on Computer Vision and Pattern Recognition, New Orleans, LA, USA, 18–24 June 2022; pp. 1666–1675. [Google Scholar]
  38. Ning, S.; Chen, H.; Zhao, Q.; Wang, Y. Detection of pods and stems in soybean based on IM-SSD+ ACO algorithm. Trans. Chin. Soc. Agric. Mach. 2021, 52, 182–190. [Google Scholar]
  39. Li, M.; Jia, T.; Wang, H.; Ma, B.; Lu, H.; Lin, S.; Cai, D.; Chen, D. Ao-detr: Anti-overlapping detr for x-ray prohibited items detection. IEEE Trans. Neural Netw. Learn. Syst. 2024, 1–15. [Google Scholar] [CrossRef]
  40. Li, Y.; Xu, S.; Zhu, Z.; Wang, P.; Li, K.; He, Q.; Zheng, Q. EFC-YOLO: An efficient surface-defect-detection algorithm for steel strips. Sensors 2023, 23, 7619. [Google Scholar] [CrossRef]
  41. Zhang, J.; Huang, W.; Zhuang, J.; Zhang, R.; Du, X. Detection Technique Tailored for Small Targets on Water Surfaces in Unmanned Vessel Scenarios. J. Mar. Sci. Eng. 2024, 12, 379. [Google Scholar] [CrossRef]
  42. Wang, C.; Jiang, J.; Daneva, M.; Van Sinderen, M. CoolTeD: A web-based collaborative labeling tool for the textual dataset. In Proceedings of the 2022 IEEE International Conference on Software Analysis, Evolution and Reengineering (SANER), Honolulu, HI, USA, 15–18 March 2022; IEEE: New Orleans, LA, USA, 2022; pp. 613–617. [Google Scholar]
  43. Belissent, N.; Peña, J.M.; Mesías-Ruiz, G.A.; Shawe-Taylor, J.; Pérez-Ortiz, M. Transfer and zero-shot learning for scalable weed detection and classification in UAV images. Knowl.-Based Syst. 2024, 292, 111586. [Google Scholar] [CrossRef]
  44. Sykas, D.; Sdraka, M.; Zografakis, D.; Papoutsis, I. A sentinel-2 multiyear, multicountry benchmark dataset for crop classification and segmentation with deep learning. IEEE J. Sel. Top. Appl. Earth Obs. Remote Sens. 2022, 15, 3323–3339. [Google Scholar] [CrossRef]
  45. Chen, Y.; Wu, Q.; Hu, W. Human action capture method based on binocular camera. In Proceedings of the 2024 IEEE International Conference on Smart Internet of Things (SmartIoT), Shenzhen, China, 14–16 November 2024; IEEE: New Orleans, LA, USA, 2024; pp. 234–239. [Google Scholar]
  46. Tîrziu, E.; Vasilevschi, A.; Alexandru, A.; Tudora, E. Enhanced Fall Detection Using YOLOv7-W6-Pose for Real-Time Elderly Monitoring. Future Internet 2024, 16, 472. [Google Scholar] [CrossRef]
  47. Nardi, V. State of the Art Analysis and Optimization of Human Pose Estimation Algorithms. Master’s Thesis, Politecnico di Milano, Milano, Italy, 2022. [Google Scholar]
  48. Humeau-Heurtier, A. Texture feature extraction methods: A survey. IEEE Access 2019, 7, 8975–9000. [Google Scholar] [CrossRef]
  49. He, K.; Zhang, X.; Ren, S.; Sun, J. Deep residual learning for image recognition. In Proceedings of the IEEE Conference on Computer Vision and Pattern Recognition, Las Vegas, NV, USA, 27–30 June 2016; pp. 770–778. [Google Scholar]
  50. Villena-Rodriguez, A.; Martín-Vega, F.J.; Gómez, G.; Aguayo-Torres, M.C.; Kaddoum, G. Aging-Resistant Wideband Precoding in 5G and Beyond Using 3D Convolutional Neural Networks. arXiv 2024, arXiv:2407.07434. [Google Scholar]
  51. Zhang, Y.; Zhang, H.; Huang, Q.; Han, Y.; Zhao, M. DsP-YOLO: An anchor-free network with DsPAN for small object detection of multiscale defects. Expert. Syst. Appl. 2024, 241, 122669. [Google Scholar] [CrossRef]
  52. Wang, C.; Bochkovskiy, A.; Liao, H.M. YOLOv7: Trainable bag-of-freebies sets new state-of-the-art for real-time object detectors. In Proceedings of the IEEE/CVF Conference on Computer Vision and Pattern Recognition, Vancouver, BC, Canada, 17–24 June 2023; pp. 7464–7475. [Google Scholar]
  53. Wang, L.; Li, X.; Chen, X.; Zhou, B. CenterNet-Elite: A Small Object Detection Model for Driving Scenario. Ieee Access 2025. [Google Scholar] [CrossRef]
  54. He, K.; Zhang, X.; Ren, S.; Sun, J. Spatial pyramid pooling in deep convolutional networks for visual recognition. IEEE T Pattern Anal. 2015, 37, 1904–1916. [Google Scholar] [CrossRef]
  55. Karmouch, A.; Galis, A.; Giaffreda, R.; Kanter, T.; Jonsson, A.; Karlsson, A.M.; Glitho, R.; Smirnov, M.; Kleis, M.; Reichert, C. Contextware research challenges in ambient networks. In Proceedings of the Mobility Aware Technologies and Applications: First International Workshop, MATA 2004, Florianópolis, Brazil, 20–22 October 2004; Proceedings 1. Springer: Berlin/Heidelberg, Germany, 2004; pp. 62–77. [Google Scholar]
  56. Zhao, X.Y.; He, Y.X.; Zhang, H.T.; Ding, Z.T.; Zhou, C.A.; Zhang, K.X. A quality grade classification method for fresh tea leaves based on an improved YOLOv8x-SPPCSPC-CBAM model. Sci. Rep. 2024, 14, 4166. [Google Scholar] [CrossRef]
  57. Zafar, A.; Aamir, M.; Mohd Nawi, N.; Arshad, A.; Riaz, S.; Alruban, A.; Dutta, A.K.; Almotairi, S. A comparison of pooling methods for convolutional neural networks. Appl. Sci. 2022, 12, 8643. [Google Scholar] [CrossRef]
  58. Gu, J.; Wang, Z.; Kuen, J.; Ma, L.; Shahroudy, A.; Shuai, B.; Liu, T.; Wang, X.; Wang, G.; Cai, J. Recent advances in convolutional neural networks. Pattern Recogn. 2018, 77, 354–377. [Google Scholar] [CrossRef]
  59. Liu, X.; Zhang, G.; Zhou, B. An efficient feature aggregation network for small object detection in UAV aerial images. J. Supercomput. 2025, 81, 1–26. [Google Scholar] [CrossRef]
  60. Yang, J.; Zhang, T.; Fang, C.; Zheng, H.; Ma, C.; Wu, Z. A detection method for dead caged hens based on improved YOLOv7. Comput. Electron. Agric. 2024, 226, 109388. [Google Scholar] [CrossRef]
  61. Chen, J.; Shen, Y.; Liang, Y.; Wang, Z.; Zhang, Q. YOLO-SAD: An Efficient SAR Aircraft Detection Network. Appl. Sci. 2024, 14, 3025. [Google Scholar] [CrossRef]
  62. Zhou, L.; Liu, Z.; Zhao, H.; Hou, Y.; Liu, Y.; Zuo, X.; Dang, L. A multi-scale object detector based on coordinate and global information aggregation for UAV aerial images. Remote Sens. 2023, 15, 3468. [Google Scholar] [CrossRef]
  63. Liu, K.; Sun, Q.; Sun, D.; Peng, L.; Yang, M.; Wang, N. Underwater target detection based on improved YOLOv7. J. Mar. Sci. Eng. 2023, 11, 677. [Google Scholar] [CrossRef]
  64. Gallo, I.; Rehman, A.U.; Dehkordi, R.H.; Landro, N.; La Grassa, R.; Boschetti, M. Deep object detection of crop weeds: Performance of YOLOv7 on a real case dataset from UAV images. Remote Sens. 2023, 15, 539. [Google Scholar] [CrossRef]
  65. Guarnido-Lopez, P.; Ramirez-Agudelo, J.; Denimal, E.; Benaouda, M. Programming and Setting Up the Object Detection Algorithm YOLO to Determine Feeding Activities of Beef Cattle: A Comparison between YOLOv8m and YOLOv10m. Animals 2024, 14, 2821. [Google Scholar] [CrossRef]
  66. Du, X.; Meng, Z.; Ma, Z.; Lu, W.; Cheng, H. Tomato 3D pose detection algorithm based on keypoint detection and point cloud processing. Comput. Electron. Agric. 2023, 212, 108056. [Google Scholar] [CrossRef]
  67. Du, X.; Meng, Z.; Ma, Z.; Zhao, L.; Lu, W.; Cheng, H.; Wang, Y. Comprehensive visual information acquisition for tomato picking robot based on multitask convolutional neural network. Biosyst. Eng. 2024, 238, 51–61. [Google Scholar] [CrossRef]
  68. Chen, J.; Ma, A.; Huang, L.; Li, H.; Zhang, H.; Huang, Y.; Zhu, T. Efficient and lightweight grape and picking point synchronous detection model based on key point detection. Comput. Electron. Agric. 2024, 217, 108612. [Google Scholar] [CrossRef]
  69. Shuai, L.; Mu, J.; Jiang, X.; Chen, P.; Zhang, B.; Li, H.; Wang, Y.; Li, Z. An improved YOLOv5-based method for multi-species tea shoot detection and picking point location in complex backgrounds. Biosyst. Eng. 2023, 231, 117–132. [Google Scholar] [CrossRef]
  70. Wang, J.; Tan, D.; Sui, L.; Guo, J.; Wang, R. Wolfberry recognition and picking-point localization technology in natural environments based on improved Yolov8n-Pose-LBD. Comput. Electron. Agric. 2024, 227, 109551. [Google Scholar] [CrossRef]
  71. Zheng, J.; Wang, X.; Shi, Y.; Zhang, X.; Wu, Y.; Wang, D.; Huang, X.; Wang, Y.; Wang, J.; Zhang, J. Keypoint detection and diameter estimation of cabbage (Brassica oleracea L.) heads under varying occlusion degrees via YOLOv8n-CK network. Comput. Electron. Agric. 2024, 226, 109428. [Google Scholar] [CrossRef]
  72. Yang, G.; Jing, H. Multiple convolutional neural network for feature extraction. In Advanced Intelligent Computing Theories and Methodologies, Proceedings of the 11th International Conference, ICIC 2015, Fuzhou, China, 20–23 August 2015; Proceedings, Part II 11; Springer: Berlin/Heidelberg, Germany, 2015; pp. 104–114. [Google Scholar]
  73. Zhao, S.; Cai, T.; Peng, B.; Zhang, T.; Zhou, X. GAM-YOLOv8n: Enhanced feature extraction and difficult example learning for site distribution box door status detection. Wirel. Netw. 2023, 30, 6939–6950. [Google Scholar] [CrossRef]
  74. Han, K.; Wang, Y.; Tian, Q.; Guo, J.; Xu, C.; Xu, C. Ghostnet: More features from cheap operations. In Proceedings of the IEEE/CVF Conference on Computer Vision and Pattern Recognition, Seattle, WA, USA, 13–19 June 2020; pp. 1580–1589. [Google Scholar]
  75. Girshick, R.; Donahue, J.; Darrell, T.; Malik, J. Rich feature hierarchies for accurate object detection and semantic segmentation. In Proceedings of the IEEE Conference on Computer Vision and Pattern Recognition, Columbus, OH, USA, 23–28 June 2014; pp. 580–587. [Google Scholar]
  76. Redmon, J.; Farhadi, A. Yolov3: An incremental improvement. arXiv 2018, arXiv:1804.02767. [Google Scholar]
  77. Acikgoz, H. An automatic detection model for cracks in photovoltaic cells based on electroluminescence imaging using improved YOLOv7. Signal Image Video Process. 2024, 18, 625–635. [Google Scholar] [CrossRef]
  78. Wu, T.; Dong, Y. YOLO-SE: Improved YOLOv8 for Remote Sensing Object Detection and Recognition. Appl. Sci. 2023, 13, 12977. [Google Scholar] [CrossRef]
  79. Tan, M.; Le, Q. Efficientnet: Rethinking model scaling for convolutional neural networks. In Proceedings of the International Conference on Machine Learning, PMLR, Long Beach, LA, USA, 9–15 June 2019; pp. 6105–6114. [Google Scholar]
  80. Lin, T.; Dollár, P.; Girshick, R.; He, K.; Hariharan, B.; Belongie, S. Feature pyramid networks for object detection. In Proceedings of the IEEE Conference on Computer Vision and Pattern Recognition, Honolulu, HI, USA, 21–26 July 2017; pp. 2117–2125. [Google Scholar]
  81. Zhang, Z.; He, T.; Zhang, H.; Zhang, Z.; Xie, J.; Li, M. Bag of freebies for training object detection neural networks. arXiv 2019, arXiv:1902.04103. [Google Scholar]
  82. Oliveira, F.; Da Silva, D.Q.; Filipe, V.; Pinho, T.M.; Cunha, M.; Cunha, J.B.; Dos Santos, F.N. Enhancing Grapevine Node Detection to Support Pruning Automation: Leveraging State-of-the-Art YOLO Detection Models for 2D Image Analysis. Sensors 2024, 24, 6774. [Google Scholar] [CrossRef]
  83. Shrestha, B.; Kulkarni, A.; Ahmed, F.; Sadhotra, A.; Maseeh, M.; Baig, S. Designing Efficient Sugarcane Node Cutting Machines: A Novel Approach. Iup J. Mech. Eng. 2024, 17, 41. [Google Scholar]
  84. Wen, C.; Guo, H.; Li, J.; Hou, B.; Huang, Y.; Li, K.; Nong, H.; Long, X.; Lu, Y. Application of improved YOLOv7-based sugarcane stem node recognition algorithm in complex environments. Front. Plant Sci. 2023, 14, 1230517. [Google Scholar] [CrossRef] [PubMed]
  85. Xie, Z.; Li, Y.; Xiao, Y.; Diao, Y.; Liao, H.; Zhang, Y.; Chen, X.; Wu, W.; Wen, C.; Li, S. Sugarcane stem node identification algorithm based on improved YOLOv5. PLoS ONE 2023, 18, e0295565. [Google Scholar] [CrossRef]
  86. Hu, J.; Li, G.; Mo, H.; Lv, Y.; Qian, T.; Chen, M.; Lu, S. Crop Node Detection and Internode Length Estimation Using an Improved YOLOv5 Model. Agriculture 2023, 13, 473. [Google Scholar] [CrossRef]
  87. Zhou, S.; Duan, X.; Zhou, J. Human pose estimation based on frequency domain and attention module. Neurocomputing 2024, 604, 128318. [Google Scholar] [CrossRef]
  88. Bustos, J.P.R. Application of DEEP LEARNING to the Processing of TERRESTRIAL LiDAR Data for the Evaluation of ARCHITECTURAL FEATURES and Functioning of Fruit Trees. Ph.D. Thesis, Université de Montpellier, Montpellier, France, 2024. [Google Scholar]
  89. Cieslak, M.; Govindarajan, U.; Garcia, A.; Chandrashekar, A.; Hadrich, T.; Mendoza-Drosik, A.; Michels, D.L.; Pirk, S.; Fu, C.; Palubicki, W. Generating Diverse Agricultural Data for Vision-Based Farming Applications. In Proceedings of the IEEE/CVF Conference on Computer Vision and Pattern Recognition, Seattle, WA, USA, 16–22 June 2024; pp. 5422–5431. [Google Scholar]
  90. Wäldchen, J.; Rzanny, M.; Seeland, M.; Mäder, P. Automated plant species identification—Trends and future directions. PLoS Comput. Biol. 2018, 14, e1005993. [Google Scholar] [CrossRef]
  91. Ubbens, J.R.; Stavness, I. Deep plant phenomics: A deep learning platform for complex plant phenotyping tasks. Front. Plant Sci. 2017, 8, 1190. [Google Scholar] [CrossRef]
  92. Dosovitskiy, A. An image is worth 16×16 words: Transformers for image recognition at scale. arXiv 2020, arXiv:2010.11929. [Google Scholar]
  93. Wu, Z.; Sun, J.; Zhang, Y.; Wei, Z.; Chanussot, J. Recent developments in parallel and distributed computing for remotely sensed big data processing. Proc. IEEE 2021, 109, 1282–1305. [Google Scholar] [CrossRef]
  94. Issac, A. AI-Enabled Big Data Pipeline for Plant Phenotyping and Application in Cotton Bloom Detection and Counting. Master’s Thesis, University of Georgia, Athens, GA, USA, 2023. [Google Scholar]
  95. Koh, E.; Sunil, R.S.; Lam, H.Y.I.; Mutwil, M. Confronting the data deluge: How artificial intelligence can be used in the study of plant stress. Comput. Struct. Biotec 2024, 23, 3454–3466. [Google Scholar] [CrossRef]
  96. Yang, W.; Feng, H.; Hu, X.; Song, J.; Guo, J.; Lu, B. An Overview of High-Throughput Crop Phenotyping: Platform, Image Analysis, Data Mining, and Data Management. Plant Funct. Genom. Methods Protoc. 2024, 1, 3–38. [Google Scholar]
  97. Yang, W.; Duan, L.; Chen, G.; Xiong, L.; Liu, Q. Plant phenomics and high-throughput phenotyping: Accelerating rice functional genomics using multidisciplinary technologies. Curr. Opin. Plant Biol. 2013, 16, 180–187. [Google Scholar] [CrossRef] [PubMed]
  98. Rasley, J.; Rajbhandari, S.; Ruwase, O.; He, Y. Deepspeed: System Optimizations Enable Training Deep Learning Models with over 100 Billion Parameters. In Proceedings of the 26th ACM SIGKDD International Conference on Knowledge Discovery & Data Mining, CA, Virtual Event, 6–10 July 2020; pp. 3505–3506. [Google Scholar]
  99. Ghimire, D.; Kil, D.; Kim, S. A survey on efficient convolutional neural networks and hardware acceleration. Electronics 2022, 11, 945. [Google Scholar] [CrossRef]
  100. Shuvo, M.M.H.; Islam, S.K.; Cheng, J.; Morshed, B.I. Efficient acceleration of deep learning inference on resource-constrained edge devices: A review. Proc. IEEE 2022, 111, 42–91. [Google Scholar] [CrossRef]
  101. Luo, Z.; Xue, W.; Chae, J.; Fu, G. SKP: Semantic 3D Keypoint Detection for Category-Level Robotic Manipulation. IEEE Robot. Autom. Let. 2022, 7, 5437–5444. [Google Scholar] [CrossRef]
  102. Xu, D.; Zheng, T.; Zhang, Y.; Yang, X.; Fu, W. Multi-person 3D pose estimation from multi-view without extrinsic camera parameters. Expert Syst. Appl. 2025, 266, 126114. [Google Scholar] [CrossRef]
Figure 1. Experimental workflow diagram. (A) Data preprocessing. (B) Model improvements. (C) Model ablation. (D) Model comparison. (E) Model Visualization.
Agronomy 15 01128 g001
Figure 2. YOLO_SSP network architecture diagram.
Agronomy 15 01128 g002
Figure 3. Advanced feature extraction module. (a) CBS (Conv-BatchNorm-ReLU) network structure diagram. (b) Network structure of Small_Effective Low-Level Aggregation Network in backbone. (c) Small_Effective Low-Level Aggregation with “True” in backbone network structure of network. (d) SPPCSPC network structure diagram.
Agronomy 15 01128 g003
Figure 4. Low-level feature extraction module. (a). MP network structure in backbone; (b) MP network structure in neck.
Agronomy 15 01128 g004
Figure 5. Comparison between YOLOv7-w6-pose and YOLO_SSP. (a) Precision–recall curve; (b) recall–confidence curve; (c) F1–confidence curve.
Agronomy 15 01128 g005
Figure 6. Visualization of comparative experiment results. (a) YOLO_SSP model performance of detection results at plant tip; (b) YOLO_SSP model performance of detection results at pod shade; (c) YOLO_SSP model performance of detection results at pod drop; (d) YOLOv7-w6-pose model performance of detection results at plant tip; (e) performance test results of YOLOv7-w6-pose model when pods are obscured; (f) performance test results of YOLOv7-w6-pose model when pods are discarded.
Agronomy 15 01128 g006
Figure 7. Comparison of AP among different models.
Agronomy 15 01128 g007
Figure 8. Performance of comparative experiment training results. (a) Trend and comparison of YOLO series training accuracy; (b) trend and comparison of YOLO series training precision; (c) final average accuracy of different models; (d) final recall of different models.
Agronomy 15 01128 g008
Figure 9. Comparison of YOLO_SSP and YOLOv7-w6-pose model performance.
Agronomy 15 01128 g009
Figure 10. YOLO_SSP detection of soybean stem phenotypes in different single branches. (a) Detection of upright single-stem targets. (b) Detection of dense single-stem targets. (c) Detection of curved single-stem targets. (d) Multi-stem target detection. (e) Multi-stem plant top detection. (f) Multi-stem plant curved and top detection. (g) Multi-stem plant dense detection. (h) Multi-stem plant stem occlusion detection. (i) Multi-stem plant pod occlusion detection.
Agronomy 15 01128 g010
Table 1. Dataset allocation.
ExperimentPublic Online DatasetDY Dataset
Model improvement experiment×
Ablation experiment×
Comparative experiment×
DY dataset testing experiment×
Visualization experiment×
Notes: 1. The public dataset: https://www.kaggle.com/datasets/soberguo/soybeannode (accessed on 19 December 2023). 2. The training results for each experiment were obtained from the dataset corresponding to the table.
Table 2. Performance comparison between YOLOv7-w6-pose and YOLO_SSP.
ModelP (%)R (%)AP (%)Params (M)
YOLOv7-w6-pose89.8584.8585.579.87
YOLO_SSP89.5986.9788.144.28
Table 3. Comparison of ablation experiment results.
ModelNoReOrg
(N)
S_ELAN
(S)
ELAN-H
(E)
MP_1
(P1)
MP_2
(P2)
RepConv
(R)
Head_3
(H)
P
(%)
R
(%)
A
P(%)
Params
(M)
YOLOv7-w6-pose×××××××89.983.986.079.81
YOLOv7-w6-pose_N××××××89.685.887.479.86
YOLOv7-w6-pose_S××××××90.382.585.977.02
YOLOv7-w6-pose_E××××××89.383.585.079.81
YOLOv7-w6-pose_P1××××××88.584.185.773.01
YOLOv7-w6-pose_P2××××××89.385.287.179.81
YOLOv7-w6-pose_R××××××89.084.586.880.80
YOLOv7-w6-pose_H××××××91.084.387.153.54
YOLOv7-w6-pose_NP2×××××89.384.586.579.86
YOLOv7-w6-pose_NR×××××89.883.586.580.85
YOLOv7-w6-pose_NH×××××90.685.988.353.59
YOLOv7-w6-pose_P2R×××××89.982.786.380.80
YOLOv7-w6-pose_P1P2×××××88.883.486.373.01
YOLOv7-w6-pose_NP2H××××90.086.088.053.01
YOLOv7-w6-pose_SP1R××××89.484.386.467.05
YOLOv7-w6-pose_NP2RH×××90.285.987.753.71
YOLOv7-w6-pose_NP1P2RH××89.686.488.047.94
YOLOv7-w6-pose_NSP1P2RH×91.186.588.144.19
YOLOv7-w6-pose_NSEP2RH×90.585.288.052.10
YOLOv7-w6-pose_NSP2RH××90.985.187.752.10
YOLO_SSP90.086.288.544.19
Table 4. Comparison of comparative experiment results.
ModelR (%)AP (%)GFLOPsParams (M)
YOLO_SSP86.687.7118.344.2
YOLOv7-w6-pose84.685.2101.479.9
YOLOv7-tiny-pose72.274.919.99.6
YOLOv3s-pose71.082.47.42.6
YOLOv5n-pose73.283.9259.4
YOLOv5s-pose73.484.266.625.7
YOLOv5m-pose73.984.24515.6
YOLOv6n-pose70.882.611.94.3
YOLOv8n-pose71.282.78.43.1
YOLOv10b-pose71.583.277.518.4
Table 5. Test results of the agricultural university dataset.
ModelP (%)R (%)AP (%)Params (M)
YOLO_SSP85.376.082.644.19
YOLOv7-w6-pose81.279.181.579.81
Table 6. Comparison of point-to-point studies.
0Detection PointAP (%)
YOLOv5s [67]Tomato Calyx–Fruit Rachis Junction Point91.1
Soybean Stem Node Point83.9
YOLOv5s [69]Tea Buds Keypoints71.79
Soybean Stem Node Point84.2
YOLOv8n [68]Grape Picking Point89.7
Soybean Stem Node Point82.7
YOLOv8n [70]Lycium Barbarum Picking Point87.8
Soybean Stem Node Point82.7
YOLOv8n [71]Cabbage Head Keypoints93.5
Soybean Stem Node Point82.7
Disclaimer/Publisher’s Note: The statements, opinions and data contained in all publications are solely those of the individual author(s) and contributor(s) and not of MDPI and/or the editor(s). MDPI and/or the editor(s) disclaim responsibility for any injury to people or property resulting from any ideas, methods, instructions or products referred to in the content.

