Article

Optimizing Protein-Rich Young Vegetative Quinoa (Chenopodium quinoa) Growth: Effects of Inter-Row Spacing and Genotype in Mediterranean Summer Cultivation

1
Northern Agriculture R&D, MIGAL–Galilee Research Institute, Kiryat Shmona 11016, Israel
2
Department of Biotechnology, Faculty of Science and Technology, Tel Hai College, Kiryat Shmona 1220800, Israel
3
Institute of Plant Sciences, Agricultural Research Organization, The Volcani Center, Rishon LeZion 7505101, Israel
*
Author to whom correspondence should be addressed.
Agronomy 2025, 15(5), 1102; https://doi.org/10.3390/agronomy15051102
Submission received: 8 April 2025 / Revised: 25 April 2025 / Accepted: 28 April 2025 / Published: 30 April 2025
(This article belongs to the Section Horticultural and Floricultural Crops)

Abstract

:
Young vegetative quinoa (YVQ) has gained attention as a high-protein leafy crop for human consumption with potential for cultivation in Mediterranean and semiarid regions. We investigated the effects of inter-row spacing and genotype on YVQ fresh and dry matter (DM) yield, protein content (PC), and protein yield during summer cultivation in northern Israel in two separate, independent, randomized field experiments over two consecutive years (2020–2021). We hypothesized that row spacing and genotypic differences would significantly impact yield and PC. Inter-row spacing significantly affected plant density, ranging from 55 to 366 plants m−2. Fresh and DM yields ranged from 4957 to 28,469 kg ha−1 and 661 to 3737 kg DM ha−1, respectively. PC ranged from 20.5 to 26.6% and was not significantly influenced by row spacing. Total protein yield ranged from 147 to 884 kg ha−1. Among the five tested genotypes, no significant differences were observed in fresh (7477–17,776 kg ha−1) or dry (1122–2199 kg DM ha−1) biomass, PC (21.2–26.5%), or protein yield (260–579 kg ha−1), suggesting limited genetic differentiation under the specific environmental and agronomic conditions tested. Amino acid analysis confirmed the presence of all nine essential amino acids, fulfilling over 30% of the recommended daily intake per 100 g DM. These findings highlight YVQ as a promising, sustainable, and protein-rich leafy crop for Mediterranean agriculture. Further research should explore multi-harvest potential, mechanical weeding, and optimized agronomic practices for commercial-scale production.

1. Introduction

In the last few years, there has been a notable increase in the demand for protein products. The worldwide protein ingredient market was estimated to be worth USD 38.5 billion in 2020, with an annual projected rise of about 10.5% between 2021 and 2028 [1]. Over the last century, animals (meat, eggs, fish, and dairy) have been the primary source of protein in Western countries [2]. However, plant proteins may eventually take a share of the animal protein market due to lower production costs, and consumers’ perception of them as healthier, more ethical, and environmentally friendly [3,4]. A well-known but underutilized protein-rich crop is the quinoa plant (Chenopodium quinoa Willd., Amaranthaceae) [5]. Originating in the Andean plateau of South America, this pseudo cereal is widely cultivated for grain production intended for human consumption [6,7]. Quinoa is regarded as a climate-resilient crop and has the remarkable ability to grow in harsh and unfavorable conditions [8,9]. Compared to the major cereal crops grown worldwide, such as barley, wheat, corn, and rice, quinoa grains’ protein content (PC) is high [10,11]. Its high nutritional value is attributed to high levels of protein that contain all of the nine essential amino acids (EAAs) [12,13]. Individuals with celiac disease may find it acceptable because it is gluten-free [14,15]. As a result, quinoa is commonly regarded as a “functional food” or “superfood”, enhancing its commercial attractiveness [16]. Thus, quinoa production has increased dramatically in recent years, and the crop is now cultivated commercially in many countries outside of South America [17,18].
Numerous studies have demonstrated that quinoa can be grown outside its native region in various agroecological settings, including semiarid and desert climates [6,18]. Other studies have investigated the influence of agrotechnical factors—such as plant density, row spacing, irrigation, and fertilization—on quinoa grain production [19,20,21,22]. Numerous recent studies have demonstrated the versatility of quinoa beyond its use for grain production. For instance, it has been suggested that the straw left over from the grain harvest might be fed to cattle because it is highly digestible and has comparatively high protein and mineral contents [23,24,25]. Others have indicated the significant potential of using the biomass of quinoa hay and silage as a high-quality feed for ruminants [23,26,27]. Young vegetative quinoa (YVQ)—an unconventional leafy green vegetable—has been recently investigated [28,29]. Similar to spinach, the soft stalks and green leaves of the quinoa plant have high nutritional value and can be eaten either fresh or cooked [30,31]. YVQ can be cultivated year-round in fields, greenhouses, and high tunnels [32]. Similar to quinoa grains, quinoa leaves also contain all of the EAAs. However, their protein content (as a percentage of dry matter [DM]) is considerably higher, ranging from 25% to 37%, compared to 9.1% to 15.7% in the grains [30,33,34,35]. Quinoa leaves have a higher PC than spinach, chard (mangold), and broccoli [33]. In addition, quinoa leaves have high quantities of Cu, Mn, and K and moderate salt, Ca, P, and Zn levels [34]. In evaluating the nutraceutical potential of YVQ, researchers discovered that quinoa leaf extract includes notable concentrations of several bioactive polyphenols associated with a suppressive effect on the proliferation of prostate cancer cells [36]. Furthermore, YVQ has lower concentrations of saponins—bitter antinutritive metabolites found in quinoa—than the grains [37,38]. YVQ is usually harvested 30–62 days after sowing (DAS) [29,32], whereas detectable quantities of sapogenins—a triterpenoid aglycone that makes up around 50% of the saponin molecule—are first detected 82 DAS [39]. Moreover, quinoa vegetative shoots at 60 DAS were found to have lower saponin concentration compared to those at the reproductive stage (100 DAS) [40].
A study conducted in Poland showed that YVQ should be harvested when it reaches a height of 20–30 cm. In spring and summer sowing, YVQ fresh weight (FW) biomass averaged 317–1389 and 245–777 g m−2, respectively [31]. In Egypt, the fresh yield of YVQ harvested 45 DAS was higher, ranging from 2050 to 4140 g m−2 [41]. In another study conducted in Israel over the course of 2 years, five quinoa accessions were sown on three winter sowing dates (November, December, and January). When the plants reached 10% DM (69-107 DAS, depending on sowing date), they were harvested, and the DM yield ranged from 574 to 1982 kg ha−1 [29]. These results suggest the economic potential for cultivated YVQ, with Mediterranean and semiarid regions benefiting from the use of aerial vegetative sections of young quinoa as a novel, sustainable, and high-protein leafy crop.
Since there is little information available about growing YVQ in Mediterranean countries, our goal was to further research the crop’s yield and PC to assess its potential as a novel, high-protein leafy crop in Israel. Following our recent study on winter cultivation of YVQ [29], the current study focused on summer cultivation to evaluate YVQ’s adaptation to higher temperatures and its potential for an extended growing season. Row spacing and genotypes are essential factors in the success of commercial cultivation of quinoa under field conditions [20,29]. Narrower row spacing increases plant density, which may lead to higher biomass accumulation per unit area, although it may also increase competition [20,42]. In two separate experiments, we investigated the impact of different genotypes and row spacings on biomass yield, PC, and protein production of YVQ during summer cultivation. We hypothesized that narrower row spacing would enhance biomass and protein yield due to increased plant density [20] and that genotypic differences would significantly impact these parameters.

2. Materials and Methods

2.1. Experimental Site

The experiments were conducted in northern Israel (The Gadash research farm, altitude 71 masl, 33°17′95′′ N lat; 35°58′32′′ E long) from 15 June to 27 July 2020 and from 21 June to 3 August 2021. The climate is Mediterranean, and the rainy season generally lasts from October to May, with a mean annual rainfall of 500–550 mm (Israel Meteorological Service, available online: https://ims.gov.il/he/data_gov; accessed on 1 August 2023). There was no rainfall in the experimental plots during the experiment. During the experimental periods, air temperature ranged from 18.2 to 39.8 °C in 2020, and from 17.2 to 40.2 °C in 2021 (Figure 1). The soil at the experimental site is classified by the USDA as clay loam, composed of 37% clay, 40% silt, and 23% sand with a pH of 7.6.

2.2. Plant Material and Experimental Design

Two independent experiments were conducted: one to evaluate the effect of inter-row spacing, and the other to assess the effect of genotype on YVQ parameters. Each experiment followed a randomized complete block design, with four replicates per treatment and was repeated twice, once a year, for two consecutive years. Experiments were conducted at the same experimental farm but implemented in different proximate locations. Seeds of all accessions were obtained from Wild Garden Seed (Philomath, OR, USA), shortly before each sowing date, with an indicated germination rate of approximately 95%. Quinoa seeds were sown in June 2020 and 2021 in all experiments in four 9.8 m2 (5 m long × 1.96 m wide) plots (repeats). All the flowerbeds were prepared after cultivation and rolling. Raised bed width was 1.5 m, and row spacing was implemented by adjusting the number of evenly spaced rows in the middle of the raised bed width. The plots were fertilized with 92 kg N ha−1 as urea (46% N). Sprinkler irrigation was applied daily throughout the growing period at a total rate of 1500 m3 ha−1. All plots were manually weeded once during cultivation.
For the inter-row spacing experiment, seeds of accession Mint Vanilla were sown in two, four, or six rows (80, 26, or 16 cm between rows, respectively) using a manual seeder. The selected spacings were chosen to reflect low, medium, and high planting densities relevant to regional production experience with quinoa as both grain and leafy crops [20,29]. Target intra-row density was maintained across all treatments at 50–60 seeds m−1. The total plot dimensions were ~20 m long × 8 m wide, including spacings between adjacent plots.
For the genotype experiment, five quinoa accessions were used: ‘Red Head’, ‘Mint Vanilla’, ‘Ivory’, ‘Oro de Valle’, and ‘Peppermint’ (Table S1). These accessions were chosen because they had performed well in previous experiments conducted in the experimental region [20,23,29,43]. Seeds were sown in six rows (16 cm between rows) at a target intra-row density of 50–60 seeds m−1 using a manual seeder. The total plot dimensions were ~38 m long × 8 m wide, including spacings between adjacent plots.

2.3. Plant Density at Harvest and Yield Measurements

To determine plant density at harvest (plants m−2), plants were counted in a representative 1 m2 area (0.51 m long × 1.96 m wide) in each plot. The percentage of DM was determined from 30 DAS: five plants per plot with similar external characteristics were collected every 3 days and weighed before and after drying at 60 °C for 48 h, and %DM was calculated. When these plants reached 10–12% DM, the aerial parts of all plants in each experimental plot were manually harvested ~5 cm above the ground and weighed for fresh matter yield in each plot (42 and 43 DAS in 2020 and 2021, respectively). Representative samples of each plot were collected and weighed before and after drying at 60 °C for 48 h to determine plant %DM. Plot DM yield was calculated as fresh matter yield × plant %DM.

2.4. Plant PC, Protein Yield, and Amino Acid Composition

The Kjeldahl method [44] was used to determine each quinoa sample’s N content at the Milouda and Migal laboratories (Kiryat Shmona, Israel), where PC (percent of DM) was also estimated. The conversion factor used to transform N into protein was 6.25. Plot protein yield was calculated as DM yield × PC. The amino acid composition (histidine, isoleucine, leucine, lysine, methionine, phenylalanine, threonine, tryptophan, valine, alanine, arginine, aspartic acid, cystine + cysteine, glutamic acid, glycine, proline, serine, and tyrosine) was determined at the Merieux NutriScience Laboratories (Resana, Italy). Briefly, samples of accession Mint Vanilla from the 2021 growing season were subjected to hot enzymatic hydrolysis of the proteins. The solution obtained from hydrolysis was diluted with deionized water and methanol and analyzed by high-pressure liquid chromatography (HPLC) using methods MP 2326 rev 2 2020 and MP 2455 rev 0 2021 (available online: https://www.accredia.it/en/database, accessed on 25 April 2025).

2.5. Statistical Analysis

In both experiments, treatment (row spacing or genotype) and year were treated as fixed factors, while replicate plots were treated as random effects. Results from each separate experiment were subjected to one-way ANOVA, and the significance between treatments was checked at p < 0.05 using JMP software version 11.0.0 (SAS Institute, Cary, NC, USA). In case of significance, Tukey’s HSD test was performed to compare all pairs and to examine the differences between treatments. Results were also subjected to a two-tailed Pearson correlation matrix using the ‘corrplot’ package in RStudio version 2022.07.1+554 (Boston, MA, USA), in the programming language R.

3. Results

3.1. Effect of Row Spacing on YVQ

3.1.1. Plant Density and DM

Plant density at harvest in 2020 and 2021 for the different row spacings is shown in Table 1. In both years, there were significant differences in plant density at harvest among all inter-row spacings tested. In 2020, DM at harvest ranged between 11.4% and 13.4%, with no significant difference between treatments. In 2021, DM at harvest ranged between 13.3% and 14.4% and was significantly higher in plots sown with 16 cm between rows compared to those sown with 26 and 80 cm between rows.

3.1.2. Fresh and DM Yield

In 2020, the quinoa fresh yield was significantly higher in plots sown with 26 and 16 cm between rows than in those sown with 80 cm between rows. In 2021, the quinoa fresh yield was generally lower than that in 2020, with no significant difference between treatments (Table 1). In 2020, quinoa DM yield was significantly higher in plots sown with 26 and 16 cm between rows than in those sown with 80 cm between rows. In 2021, the DM yield was generally lower, with no significant difference between treatments (Table 1).

3.1.3. PC and Protein Yield

In plots sown in 2020 and 2021, the PC (percent of DM) of YVQ showed no significant difference between treatments (Table 1). In 2020, protein yield was significantly higher in plots sown with 26 and 16 cm between rows compared to plots sown with 80 cm between rows. In 2021, the protein yield of YVQ showed no significant differences between treatments (Table 1).

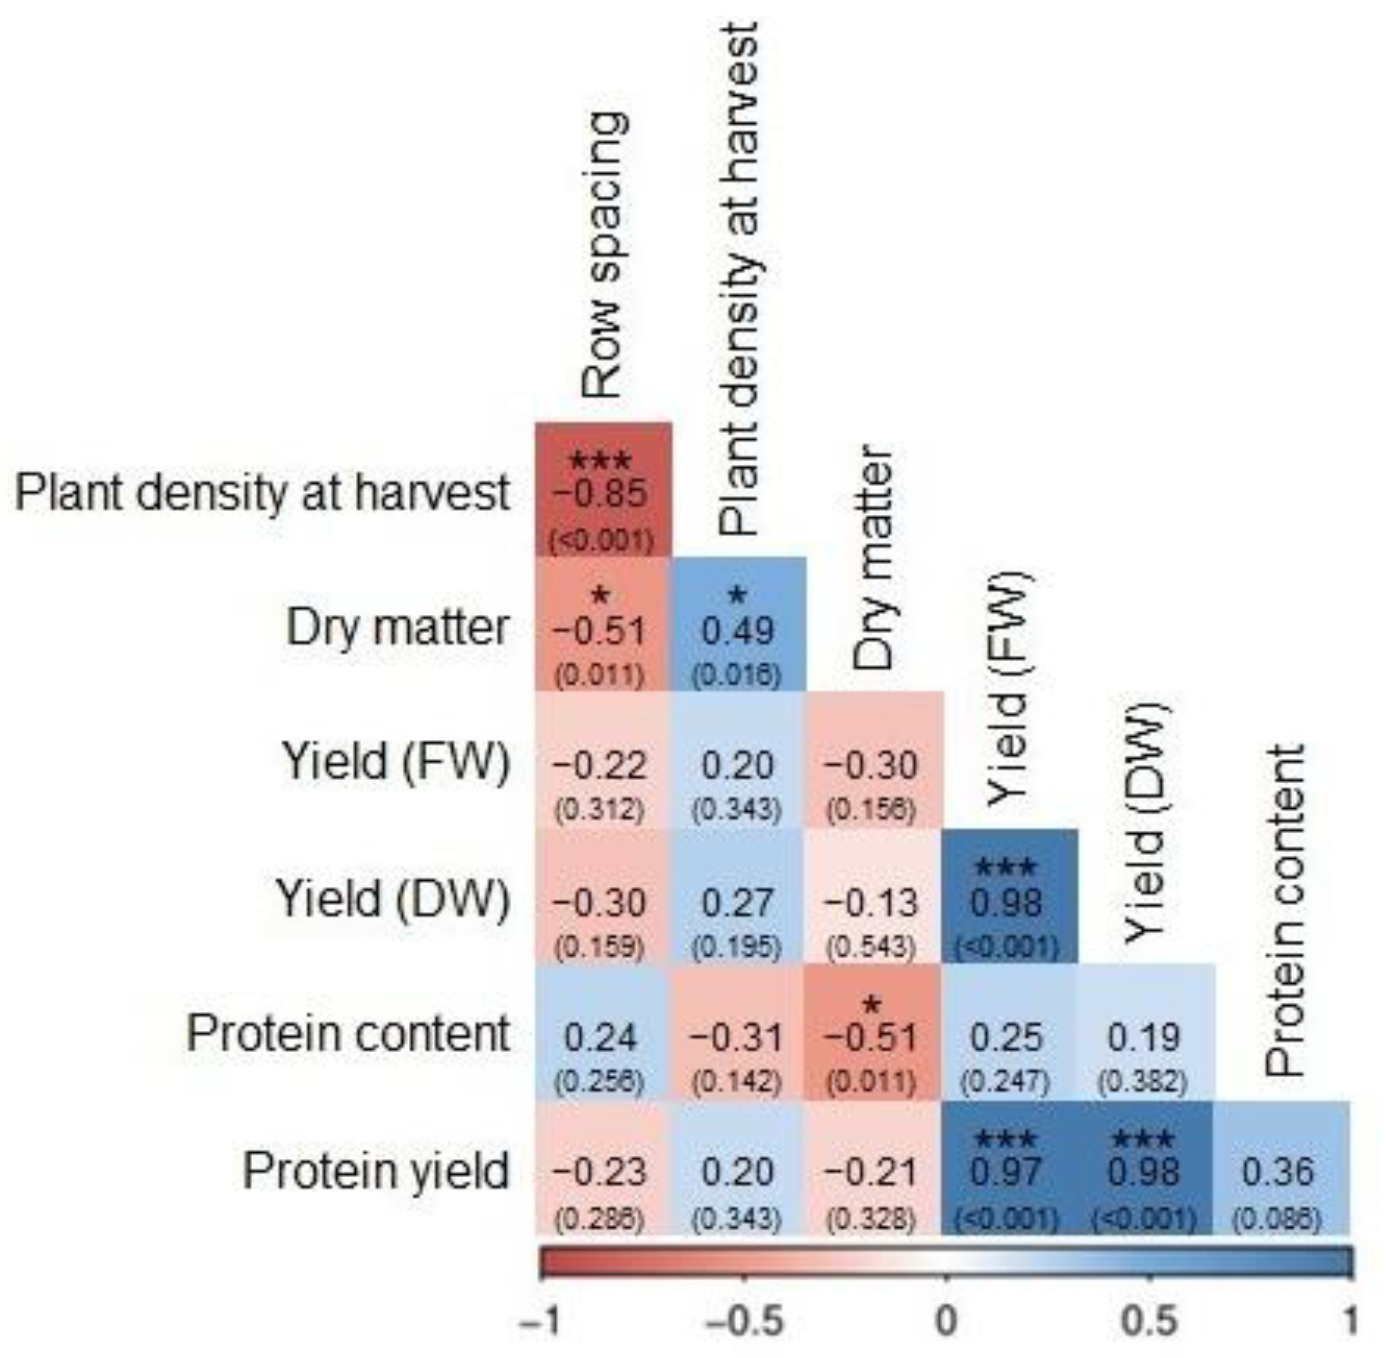
3.1.4. Correlations Between Traits

Of the 21 correlation coefficients evaluated, 7 exhibited significant values (p < 0.05; Figure 2). Row spacing was negatively correlated to plant density and %DM. No significant correlations were found between this parameter and yield or quality parameters. The opposite trend was found for the correlations with plant density at harvest, which was positively correlated to %DM. The latter was negatively correlated to PC. Fresh yield was positively correlated to DM yield, and both were positively correlated with protein yield.

3.2. Effect of Genotypes on YVQ

In the second experiment, we examined the effect of different genotypes (accessions) on yield parameters and PC of YVQ during summer cultivation.

3.2.1. Plant Density and DM

In 2020, plant density at harvest ranged between 111 and 207 plants m−2. Accession Oro de Valle plant density was significantly lower than that of all other accessions (Table 2). In 2021, plant density at harvest ranged between 163 and 279 plants m−2. Accession Red Head plant density was significantly higher than that of all other accessions (Table 2). In the first year, DM at harvest ranged between 12.2% and 13.6% and in the second year, between 14% and 15.1%. There were no significant differences between the different accessions in either year (Table 2).

3.2.2. Fresh and DM Yield

Quinoa fresh yield was generally lower in 2021 than in 2020 (Table 2). There were no significant differences between the different accessions in either year. Similarly, DM yield in 2021 was generally lower than that in 2020, with no significant differences between the different accessions in either year (Table 2).

3.2.3. PC and Protein Yield

In 2020, YVQ PC ranged between 24.4% and 26.5% and in 2021, between 21.2% and 23.4%. There were no significant differences in PC between the accessions in either year (Table 2). YVQ protein yield in 2021 was generally lower than that in 2020, with no significant differences between the different accessions in either year (Table 2).

3.3. Amino Acid Composition of YVQ

Accession Mint Vanilla had relatively high protein yield values and is currently the main quinoa accession cultivated in Israel. It was therefore chosen for amino acid composition analysis. The YVQ contained all of the EAAs (Table 3). For comparison, Table 3 also shows the recommended daily EAA intake for humans (g per 70 kg body weight). Histidine, isoleucine, leucine, lysine, methionine, phenylalanine (with tyrosine), threonine, tryptophan, and valine levels in the YVQ were 33%, 39%, 37%, 24%, 31%, 58%, 60%, 21%, and 35% of the recommended daily intake, respectively.

4. Discussion

Our previous study demonstrated significant potential for cultivating YVQ in Israel and other Mediterranean and semiarid regions during the winter [29]. YVQ yield is generally higher in summer vs. winter cultivation, whereas PC tends to be lower in summer than in winter. Ultimately, protein yield is higher during summer cultivation. For example, in this study, the protein yield of accession Mint Vanilla in June 2020 reached 884 kg ha⁻1 in plots sown with 16 cm row spacing, whereas in December 2020, it was only 359 kg ha⁻1 with the same spacing [29]. However, it is important to note that these two experiments were conducted in different locations, which may have influenced the results. In addition, YVQ yield was generally lower in this experiment’s second year than in the first. Because both experiments in this study were conducted in the same location, environmental conditions, such as air temperature, may have influenced the outcomes. The one-week difference in seeding dates between 2020 and 2021 may have shifted the plants’ critical developmental stages into slightly different temperature windows. This could explain, in part, the observed year-to-year differences in biomass and protein yield. Notably, maximum temperatures were higher in 2021 than in 2020, exceeding 40 °C (Figure 1). Although quinoa is known for its stress tolerance and can adapt to multiple environments, heat stress can adversely impact its growth and development [46]. Heat stress in quinoa has been shown to impair photosynthesis, reduce biomass accumulation, and limit nutrient uptake, ultimately lowering yields [25,47,48,49]. The effects of prolonged heat exposure on YVQ growth and quality therefore warrant further investigation, especially given the increasing frequency of extreme heat events due to global warming [50].

4.1. Effect of Row Spacing on Yield Parameters

Row spacing was significantly negatively correlated with plant density at harvest (Table 1, Figure 2). This was expected, as plots with broader row spacing have fewer seeds sown per unit area than those with narrower row spacing. Similar results were obtained in a previous study that examined the same row spacings in quinoa [20]. Moreover, a similar effect of row spacing on YVQ yield was observed in both years—it was generally, albeit not significantly, negatively correlated with fresh and dry biomass yields (Table 1, Figure 2). However, no significant differences in yield parameters were found between the 16 cm and 26 cm row-spacing treatments in either year. In contrast, in 2020, the yield in the 80 cm row-spacing treatment was significantly lower than in the 16 cm treatment (Table 1). These findings hold practical significance for commercial growers, because reducing the number of seeds per unit area could help lower crop production costs. However, since wider row spacing and lower plant density may lead to thicker quinoa stems [20,51], potentially reducing the plants’ palatability, the 16 cm row spacing may be the most advantageous for producing high-quality quinoa for leafy green use. Future studies should explore this aspect further. In 2021, plots with 16 cm spacing had significantly higher DM content at harvest than wider spacings (Table 1). This may be attributed to higher plant density, which can reduce soil evaporation, modify canopy microclimate, and accelerate maturation [52]. The absence of this trend in 2020 suggests that environmental conditions such as temperature may interact with spacing to influence DM accumulation. However, further investigation is required to confirm this.
Data on the impact of row spacing on YVQ are limited, but a study in India found that quinoa foliage yields generally increase with wider row spacing, peaking at 25 cm compared to 15 or 20 cm spacings [53]. Conversely, studies investigating quinoa grown for grain production have reported higher grain yields with narrower row spacing. For instance, researchers observed the highest quinoa grain yield at a 20 cm inter-row spacing, outperforming 30 and 40 cm spacings [42]. Another study found that a 30 cm row spacing results in greater quinoa grain yield than 40 or 50 cm spacings [54]. Similar trends have been observed in other plant species, where reduced row spacing leads to increased yields. For example, 18 cm spacing improved the vegetative canopy development and ground coverage of amaranth compared to 60 cm spacing [55]. In other studies, vegetative amaranth yield increased with narrower row spacing [56], and the productivity of lettuce grown with 20 cm row spacing was significantly higher than that of 25, 30, 35, and 40 cm [57]. On the other hand, a study in Brazil reported no significant change in quinoa grain yield with increasing plant density [51], and a study conducted in Denmark noted that quinoa plots with 25 or 12.5 cm row spacing yield less than those with a 50 cm spacing [58]. This discrepancy may be attributed to the fact that in the latter study, only the plots with the highest planting density were manually weeded, reducing competition for resources [58]. Because our experimental results were derived from small plots and primarily relied on manual labor, further research is needed to determine optimal row spacing for YVQ production in commercial fields. Although narrow row spacing increased yield in small plots, scaling up to commercial fields may pose challenges, such as reduced compatibility with mechanized seeders or weeders. Thus, wider spacing may be needed to accommodate equipment. Future studies should consider additional agronomic factors, such as mechanical weeding and harvesting methods. In addition, the spacing scheme was not optimized using physiological parameters for YVQ, such as leaf area index, light interception, or nutrient uptake rate. While our approach followed agronomic precedent from quinoa trials [20,29], future work on leafy quinoa should derive row configurations from functional crop growth traits relevant to early vegetative harvest stages.

4.2. Effect of Genotype on Yield Parameters

No significant differences were observed in yield or quality parameters among the different accessions grown under the same row spacing (Table 2). These findings align with our previous study, which showed minimal variation in YVQ yield and quality parameters among the same accessions during winter cultivation [29]. In contrast, another study reported significant differences in YVQ yield among three different quinoa accessions, with accession Ames 13724 consistently producing the highest yield of leafy greens over 3 years [32]. In our study, the absence of a genotype effect could be attributed to the genetic similarity among the selected accessions, which were all bred under similar North American conditions and adapted to temperate climates. Moreover, the short growth period may have limited the expression of genetic differences. Nevertheless, in both years of our experiment, accession Peppermint generally exhibited higher protein yield than most of the other accessions, whereas accession Oro de Valle consistently showed lower yield parameters. Notably, these trends were also observed in winter cultivation, where ‘Peppermint’ tended to yield more and ‘Oro de Valle’ less than other accessions [29]. These results suggest that the accession Peppermint holds strong commercial potential under Mediterranean growing conditions. The relatively better performance of ‘Peppermint’ under summer conditions may reflect specific adaptive traits such as greater heat tolerance or efficient nitrogen use. Although our study did not assess physiological stress responses, previous research has shown that quinoa accessions differ in their ability to maintain productivity under heat stress [47]. However, the poor performance of ‘Oro de Valle’ may not necessarily indicate incompatibility with the local environment; rather, it could be due to its low plant density in both years of the study, likely resulting from a low germination rate. Further research is needed to investigate this factor and use germination-adjusted seeding (pure live seed) to improve validity. Our data suggest that all five genotypes are comparably well adapted to Mediterranean summer conditions, and factors such as sowing density and year-to-year climate variations generally influenced yield more than genetic differences. Thus, quinoa’s broad adaptability might result in agronomic practices being more critical to success than the choice of cultivar—provided the cultivars are all reasonably well adapted to the region.

4.3. Amino Acid Composition of YVQ

‘Mint Vanilla’ is currently the main quinoa accession cultivated in Israel. It also recorded the highest DM and protein yield in the first year of the experiment, leading to its selection for the amino acid composition analysis. In most cases, 100 g of DM from ‘Mint Vanilla’ YVQ provided over 30% of the recommended daily intake of EAAs for a 70 kg adult [45] (Table 3). This highlights the high nutritional quality of YVQ protein, which is primarily determined by its content of EAAs, which humans cannot synthesize [34]. Given that the daily protein requirement for an adult is 0.66 g kg−1 [45], consuming 200 g DM from YVQ could meet the protein and most EAA needs for a 70 kg individual. This has significant economic and social implications, because ensuring adequate intake of high-quality protein remains challenging for certain populations, particularly those who have reduced or eliminated animal proteins in their diets and rely on cereals, grains, and legumes as primary protein sources [10]. For example, in parts of Sub-Saharan Africa and South Asia, where per capita animal protein consumption is below global averages and recurrent malnutrition remains a significant public health issue, YVQ could serve as an affordable, nutrient-dense alternative or supplement to traditional staples [59]. In arid and semi-arid regions, such as the Sahel, Middle East, and North Africa (MENA), or parts of India, where rising temperatures and water scarcity challenge conventional agriculture, quinoa’s heat and drought tolerance make it well suited for year-round production [6,8].
Optimizing quinoa cultivation for young vegetative biomass can therefore benefit Mediterranean agriculture by providing a resilient, water-efficient source of high-quality protein for human and potentially animal consumption. This study focused on a single harvest and did not explore the potential for multiple harvests or regrowth, which could further enhance cumulative yield. Also, interaction effects between genotype and inter-row spacing were not assessed and should be addressed in future studies. Moreover, some agronomic practices (e.g., fertilizer rate, irrigation volume) were held constant, limiting our ability to generalize the results to other management systems. Thus, YVQ could be effectively integrated into sustainable cropping systems by further experimenting and refining agronomic practices and addressing climate change and resource-scarcity challenges.

5. Conclusions

The present study demonstrated that inter-row spacing affects YVQ biomass and protein yield, whereas genotypic differences among the tested accessions were relatively minor. A row spacing of 16 cm appears to be the most favorable for producing high-quality quinoa intended for leafy green use for summer cultivation in Mediterranean climates. YVQ grown in the Mediterranean summer yielded substantial biomass with high PC (up to 3737 kg DM ha−1 and 26.6%, respectively) despite the high temperatures and low irrigation rate of 1500 m3 ha−1 (in comparison, water consumption during the vegetative cycle of spinach grown in Spain was 4060–5590 m3 ha−1 [60]). Our results highlight YVQ’s suitability as a resilient, protein-rich crop for Mediterranean climates characterized by hot and dry summers. These conditions, typical of many Mediterranean regions, underscore YVQ’s potential to contribute to food security under climate change. The consistently high PC and EAA quality observed in the YVQ further emphasize its value as a high-nutrition crop in regions aiming to improve local protein sources. Future studies should explore multi-harvest potential, genotype selection under abiotic stress, and mechanized seeding and harvesting to support commercial-scale adoption. Additionally, investigating the interaction between plant spacing and genotypes, and optimizing agronomic inputs (e.g., fertilization, irrigation) based on YVQ’s short growth cycle could improve efficiency and yield stability in varied environments.

Supplementary Materials

The following supporting information can be downloaded at https://www.mdpi.com/article/10.3390/agronomy15051102/s1. Table S1. Five quinoa accessions evaluated in the field experiments.

Author Contributions

Conceptualization, L.R.; methodology, L.R.; validation, L.R.; formal analysis, L.R.; investigation, L.R. and R.D. writing—original draft preparation, L.R., S.G. and A.A.; writing—review and editing, L.R., S.G. and A.A.; supervision, L.R.; project administration, L.R.; funding acquisition, L.R. All authors have read and agreed to the published version of the manuscript.

Funding

This research was funded by the ICA Foundation in Israel.

Data Availability Statement

The original contributions presented in the study are included in the article, further inquiries can be directed to the corresponding author.

Acknowledgments

The authors thank Itzik Abarbanel and the Gadash research farm team for their efforts in conducting this study. The ICA Foundation in Israel funded several aspects of this study.

Conflicts of Interest

The authors declare no conflicts of interest.

Abbreviations

The following abbreviations are used in this manuscript:
DASdays after sowing
DMdry matter
FWfresh weight
EAAsessential amino acids
PCprotein content
YVQyoung vegetative quinoa

References

  1. Grandview Research Global Protein Ingredients Market Size Report, 2021–2028. Available online: https://www.grandviewresearch.com/industry-analysis/protein-ingredients-market (accessed on 29 January 2023).
  2. De Boer, J.; Aiking, H. On the Merits of Plant-Based Proteins for Global Food Security: Marrying Macro and Micro Perspectives. Ecol. Econ. 2011, 70, 1259–1265. [Google Scholar] [CrossRef]
  3. Aschemann-Witzel, J.; Gantriis, R.F.; Fraga, P.; Perez-Cueto, F.J.A. Plant-Based Food and Protein Trend from a Business Perspective: Markets, Consumers, and the Challenges and Opportunities in the Future. Crit. Rev. Food Sci. Nutr. 2020, 61, 3119–3128. [Google Scholar] [CrossRef]
  4. Pam Ismail, B.; Senaratne-Lenagala, L.; Stube, A.; Brackenridge, A. Protein Demand: Review of Plant and Animal Proteins Used in Alternative Protein Product Development and Production. Anim. Front. 2020, 10, 53–63. [Google Scholar] [CrossRef] [PubMed]
  5. Andreotti, F.; Bazile, D.; Biaggi, C.; Callo-concha, D.; Jacquet, J.; Jemal, O.M.; King, O.I.; Mbosso, C.; Padulosi, S.; Speelman, E.N.; et al. When Neglected Species Gain Global Interest: Lessons Learned from Quinoa’s Boom and Bust for Teff and Minor Millet. Glob. Food Secur. 2022, 32, 100613. [Google Scholar] [CrossRef]
  6. Bazile, D.; Jacobsen, S.-E.; Verniau, A. The Global Expansion of Quinoa: Trends and Limits. Front. Plant Sci. 2016, 7, 622. [Google Scholar] [CrossRef]
  7. Bazile, D.; Pulvento, C.; Verniau, A.; Al-Nusairi, M.S.; Ba, D.; Breidy, J.; Hassan, L.; Mohammed, M.I.; Mambetov, O.; Otambekova, M.; et al. Worldwide Evaluations of Quinoa: Preliminary Results from Post International Year of Quinoa FAO Projects in Nine Countries. Front. Plant Sci. 2016, 7, 850. [Google Scholar] [CrossRef]
  8. Choukr-Allah, R.; Rao, N.K.; Hirich, A.; Shahid, M.; Alshankiti, A.; Toderich, K.; Gill, S.; Butt, K.U.R. Quinoa for Marginal Environments: Toward Future Food and Nutritional Security in MENA and Central Asia Regions. Front. Plant Sci. 2016, 7, 346. [Google Scholar] [CrossRef]
  9. Pulvento, C.; Bazile, D. Worldwide Evaluations of Quinoa—Biodiversity and Food Security under Climate Change Pressures: Advances and Perspectives. Plants 2023, 12, 868. [Google Scholar] [CrossRef]
  10. Scanlin, L.; Lewis, K.A. Quinoa as a Sustainable Protein Source: Production, Nutrition, and Processing. In Sustainable Protein Sources; Elsevier Inc.: Amsterdam, The Netherlands, 2017; pp. 223–238. ISBN 9780128027769. [Google Scholar]
  11. García-Parra, M.; Zurita-Silva, A.; Stechauner-Rohringer, R.; Roa-Acosta, D.; Jacobsen, S.E. Quinoa (Chenopodium quinoa Willd.) and Its Relationship with Agroclimatic Characteristics: A Colombian Perspective. Chil. J. Agric. Res. 2020, 80, 290–302. [Google Scholar] [CrossRef]
  12. Pereira, E.; Encina-Zelada, C.; Barros, L.; Gonzales-Barron, U.; Cadavez, V.; CFR Ferreira, I. Chemical and Nutritional Characterization of Chenopodium quinoa Willd (Quinoa) Grains: A Good Alternative to Nutritious Food. Food Chem. 2019, 280, 110–114. [Google Scholar] [CrossRef]
  13. Angeli, V.; Silva, P.M.; Massuela, D.C.; Khan, M.W.; Hamar, A.; Khajehei, F.; Graeff-Hönninger, S.; Piatti, C. Quinoa (Chenopodium quinoa Willd.): An Overview of the Potentials of the “Golden Grain” and Socio-Economic and Environmental Aspects of Its Cultivation and Marketization. Foods 2020, 9, 216. [Google Scholar] [CrossRef]
  14. Ceyhun Sezgin, A.; Sanlier, N. A New Generation Plant for the Conventional Cuisine: Quinoa (Chenopodium quinoa Willd.). Trends Food Sci. Technol. 2019, 86, 51–58. [Google Scholar] [CrossRef]
  15. Dakhili, S.; Abdolalizadeh, L.; Hosseini, S.M.; Shojaee-Aliabadi, S.; Mirmoghtadaie, L. Quinoa Protein: Composition, Structure and Functional Properties. Food Chem. 2019, 299, 125–161. [Google Scholar] [CrossRef]
  16. Noulas, C.; Tziouvalekas, M.; Vlachostergios, D.; Baxevanos, D.; Karyotis, T.; Iliadis, C. Adaptation, Agronomic Potential, and Current Perspectives of Quinoa Under Mediterranean Conditions: Case Studies from the Lowlands of Central Greece. Commun. Soil. Sci. Plant Anal. 2017, 48, 2612–2629. [Google Scholar]
  17. Jacobsen, S.E. The Scope for Adaptation of Quinoa in Northern Latitudes of Europe. J. Agron. Crop Sci. 2017, 203, 603–613. [Google Scholar] [CrossRef]
  18. Alandia, G.; Rodriguez, J.P.; Jacobsen, S.E.; Bazile, D.; Condori, B. Global Expansion of Quinoa and Challenges for the Andean Region. Glob. Food Secur. 2020, 26, 100429. [Google Scholar] [CrossRef]
  19. Sellami, M.H.; Pulvento, C.; Lavini, A. Agronomic Practices and Performances of Quinoa under Field Conditions: A Systematic Review. Plants 2021, 10, 72. [Google Scholar] [CrossRef]
  20. Asher, A.; Dagan, R.; Galili, S.; Rubinovich, L. Effect of Row Spacing on Quinoa (Chenopodium quinoa) Growth, Yield, and Grain Quality under a Mediterranean Climate. Agriculture 2022, 12, 1298. [Google Scholar] [CrossRef]
  21. Wang, N.; Wang, F.; Shock, C.C.; Meng, C.; Qiao, L. Effects of Management Practices on Quinoa Growth, Seed Yield, and Quality. Agronomy 2020, 10, 445. [Google Scholar] [CrossRef]
  22. Walters, H.; Carpenter-Boggs, L.; Desta, K.; Yan, L.; Matanguihan, J.; Murphy, K. Effect of Irrigation, Intercrop, and Cultivar on Agronomic and Nutritional Characteristics of Quinoa. Agroecol. Sustain. Food Syst. 2016, 40, 783–803. [Google Scholar] [CrossRef]
  23. Asher, A.; Galili, S.; Whitney, T.; Rubinovich, L. The Potential of Quinoa (Chenopodium quinoa) Cultivation in Israel as a Dual-Purpose Crop for Grain Production and Livestock Feed. Sci. Hortic. 2020, 272, 109534. [Google Scholar] [CrossRef]
  24. Filik, G. Biodegradability of Quinoa Stalks: The Potential of Quinoa Stalks as a Forage Source or as Biomass for Energy Production. Fuel 2020, 266, 117064. [Google Scholar] [CrossRef]
  25. Matías, J.; Cruz, V.; Reguera, M. Heat Stress Impact on Yield and Composition of Quinoa Straw under Mediterranean Field Conditions. Plants 2021, 10, 955. [Google Scholar] [CrossRef]
  26. Ramos, N.; Cruz, A.M. Evaluation of Seven Seasonal Crops for Forage Production during the Dry Season in Cuba. Cuba. J. Agric. Sci. 2002, 36, 271–276. [Google Scholar]
  27. Ebeid, H.M.; Kholif, A.E.; El-Bordeny, N.; Chrenkova, M.; Mlynekova, Z.; Hansen, H.H. Nutritive Value of Quinoa (Chenopodium quinoa) as a Feed for Ruminants: In Sacco Degradability and in Vitro Gas Production. Environ. Sci. Pollut. Res. Int. 2022, 29, 35241–35252. [Google Scholar] [CrossRef]
  28. Huang, H.; Wang, Q.; Tan, J.; Zeng, C.; Wang, J.; Huang, J.; Hu, Y.; Wu, Q.; Wu, X.; Liu, C.; et al. Quinoa Greens as a Novel Plant Food: A Review of Its Nutritional Composition, Functional Activities, and Food Applications. Crit. Rev. Food Sci. Nutr. 2024, 1–21. [Google Scholar] [CrossRef]
  29. Rubinovich, L.; Dagan, R.; Lugasi, Y.; Galili, S.; Asher, A. The Potential of Young Vegetative Quinoa (Chenopodium quinoa) as a New Sustainable Protein-Rich Winter Leafy Crop under Mediterranean Climate. PLoS ONE 2023, 18, e0290000. [Google Scholar] [CrossRef] [PubMed]
  30. Pathan, S.; Siddiqui, R.A. Nutritional Composition and Bioactive Components in Quinoa (Chenopodium quinoa Willd.) Greens: A Review. Nutrients 2022, 14, 558. [Google Scholar] [CrossRef]
  31. Adamczewska-Sowińska, K.; Sowiński, J.; Jama-Rodzeńska, A. The Effect of Sowing Date and Harvest Time on Leafy Greens of Quinoa (Chenopodium quinoa Willd.) Yield and Selected Nutritional Parameters. Agriculture 2021, 11, 405. [Google Scholar] [CrossRef]
  32. Pathan, S.; Ndunguru, G.; Islam, M.R.; Jhumur, S.T.; Ayele, A.G. Production of Quinoa Leafy Greens in High Tunnel for Season Extension in Missouri. Horticulturae 2023, 9, 209. [Google Scholar] [CrossRef]
  33. Vazquez-Luna, A.; Cortés, V.P.; Carmona, F.F.; Díaz-Sobac, R. Quinoa Leaf as a Nutritional Alternative. Cienc. Investig. Agrar. 2019, 46, 137–143. [Google Scholar] [CrossRef]
  34. Pathan, S.; Eivazi, F.; Valliyodan, B.; Paul, K.; Ndunguru, G.; Clark, K. Nutritional Composition of the Green Leaves of Quinoa (Chenopodium quinoa Willd.). J. Food Res. 2019, 8, 55. [Google Scholar] [CrossRef]
  35. Gómez, M.J.R.; Magro, P.C.; Blázquez, M.R.; Maestro-Gaitán, I.; Iñiguez, F.M.S.; Sobrado, V.C.; Prieto, J.M. Nutritional Composition of Quinoa Leafy Greens: An Underutilized Plant-Based Food with the Potential of Contributing to Current Dietary Trends. Food Res. Int. 2024, 178, 113862. [Google Scholar] [CrossRef] [PubMed]
  36. Gawlik-Dziki, U.; Świeca, M.; Sułkowski, M.; Dziki, D.; Baraniak, B.; Czyz, J. Antioxidant and Anticancer Activities of Chenopodium quinoa Leaves Extracts—In Vitro Study. Food Chem. Toxicol. 2013, 57, 154–160. [Google Scholar] [CrossRef]
  37. Stoleru, V.; Jacobsen, S.E.; Vitanescu, M.; Jitareanu, G.; Butnariu, M.; Munteanu, N.; Stan, T.; Teliban, G.C.; Cojocaru, A.; Mihalache, G. Nutritional and Antinutritional Compounds in Leaves of Quinoa. Food Biosci. 2022, 45, 101494. [Google Scholar] [CrossRef]
  38. Lim, J.G.; Park, H.M.; Yoon, K.S. Analysis of Saponin Composition and Comparison of the Antioxidant Activity of Various Parts of the Quinoa Plant (Chenopodium quinoa Willd.). Food Sci. Nutr. 2020, 8, 694–702. [Google Scholar] [CrossRef]
  39. Dick Mastebroek, H.; Limburg, H.; Gilles, T.; Marvin, H.J. Occurrence of Sapogenins in Leaves and Seeds of Quinoa (Chenopodium quinoa Willd). J. Sci. Food Agric. 2000, 80, 152–156. [Google Scholar] [CrossRef]
  40. Bernardo Solíz-Guerrero, J.; Jasso De Rodriguez, D.; Rodríguez-García, R.; Luis Angulo-Sánchez, J.; Méndez-Padilla, G. Quinoa Saponins: Concentration and Composition Analysis. In Trends in New Crops and New Uses; Janick, J., Whipkey, A., Eds.; ASHS Press: Alexandria, VA, USA, 2002. [Google Scholar]
  41. Abd El-Samad, E.H.; Hussin, S.A.; El-Naggar, A.M.; El-Bordeny, N.E.; Eisa, S.S. The Potential Use of Quinoa as a New Non-Traditional Leafy Vegetable Crop. Biosci. Res. 2018, 15, 3387–3403. [Google Scholar]
  42. Sief, A.S.; El-Deepah, H.R.A.; Kamel, A.S.M.; Ibrahim, J.F. Effect of Various Inter and Intra Spaces on the Yield and Quality of Quinoa (Chenopodium quinoa Willd.). J. Plant Prod. Mansoura Univ. 2015, 6, 371–383. [Google Scholar] [CrossRef]
  43. Bellalou, A.; Daklo-Keren, M.; Abu Aklin, W.; Sokolskaya, R.; Rubinovich, L.; Asher, A.; Galili, S. Germination of Chenopodium quinoa Cv. ‘Mint Vanilla’ Seeds under Different Abiotic Stress Conditions. Seed Sci. Technol. 2022, 50, 41–45. [Google Scholar] [CrossRef]
  44. AOAC. Official Methods of Analysis, 21st ed.; AOAC International: Rockville, MD, USA, 2019. [Google Scholar]
  45. WHO. Protein and Amino Acid Requirements in Human Nutrition: Report of a Joint WHO/FAO/UNU Expert Consultation; WHO: Geneva, Switzerland, 2007; ISBN 9789241209359. [Google Scholar]
  46. Alvar-Beltrán, J.; Verdi, L.; Marta, A.D.; Dao, A.; Vivoli, R.; Sanou, J.; Orlandini, S. The Effect of Heat Stress on Quinoa (Cv. Titicaca) under Controlled Climatic Conditions. J. Agric. Sci. 2020, 158, 255–261. [Google Scholar] [CrossRef]
  47. Hinojosa, L.; Sanad, M.N.M.E.; Jarvis, D.E.; Steel, P.; Murphy, K.; Smertenko, A. Impact of Heat and Drought Stress on Peroxisome Proliferation in Quinoa. Plant J. 2019, 99, 1144–1158. [Google Scholar] [CrossRef]
  48. Abbas, G.; Areej, F.; Asad, S.A.; Saqib, M.; Anwar-ul-Haq, M.; Afzal, S.; Murtaza, B.; Amjad, M.; Naeem, M.A.; Akram, M.; et al. Differential Effect of Heat Stress on Drought and Salt Tolerance Potential of Quinoa Genotypes: A Physiological and Biochemical Investigation. Plants 2023, 12, 774. [Google Scholar] [CrossRef] [PubMed]
  49. Matías, J.; Rodríguez, M.J.; Cruz, V.; Calvo, P.; Reguera, M. Heat Stress Lowers Yields, Alters Nutrient Uptake and Changes Seed Quality in Quinoa Grown under Mediterranean Field Conditions. J. Agron. Crop Sci. 2021, 207, 481–491. [Google Scholar] [CrossRef]
  50. Alon, E.; Shapira, O.; Azoulay-Shemer, T.; Rubinovich, L. Shading Nets Reduce Canopy Temperature and Improve Photosynthetic Performance in ‘Pinkerton’ Avocado Trees during Extreme Heat Events. Agronomy 2022, 12, 1360. [Google Scholar] [CrossRef]
  51. Spehar, C.R.; da Rocha, J.E.S. Effect of Sowing Density on Plant Growth and Development of Quinoa, Genotype 4.5, in the Brazilian Savannah Highlands. Biosci. J. 2009, 25, 53–58. [Google Scholar]
  52. Risi, J.; Galwey, N.W. Effects of Sowing Date and Sowing Rate on Plant Development and Grain Yield of Quinoa (Chenopodium quinoa) in a Temperate Environment. J. Agric. Sci. 1991, 117, 325–332. [Google Scholar] [CrossRef]
  53. Bhargava, A.; Sudhir, S.; Deepak, O. Effect of Sowing Dates and Row Spacings on Yield and Quality Components of Quinoa (Chenopodium quinoa) Leaves. Indian. J. Agric. Sci. 2007, 77, 748–751. [Google Scholar]
  54. Prommarak, S. Response of Quinoa to Emergence Test and Row Spacing in Chiang Mai-Lumphun Valley Lowland Area. Khon Kaen Agric. J. 2014, 42, 8–14. [Google Scholar]
  55. Casini, P.; Biancofiore, G. Influence of Row Spacing on Canopy and Seed Production in Grain Amaranth (Amaranthus cruentus L.). Agron. Res. 2020, 18, 53–62. [Google Scholar] [CrossRef]
  56. Phillipus Du Plooy, C.; Beletse, Y.; Mulandana, N.; Mamadi, N.; Plooy, C. DU Effect of Spacing and Transplanting Time on Amaranths Yield. In African Crop Science Conference Proceedings; African Crop Science Society: Kampala, Uganda, 2009; Volume 9, pp. 243–246. [Google Scholar]
  57. Nascimento, C.S.; Filho, A.B.C.; Mendoza-Cortez, J.W.; Nascimento, C.S.; Neto, F.B.; Grangeiro, L.C. Effect of Population Density of Lettuce Intercropped with Rocket on Productivity and Land-Use Efficiency. PLoS ONE 2018, 13, e0194756. [Google Scholar] [CrossRef] [PubMed]
  58. Jacobsen, S.E.; Stølen, O.; Jørgensen, I. Cultivation of Quinoa (Chenopodium quinoa) under Temperate Climatic Conditions in Denmark. J. Agric. Sci. 1994, 122, 47–52. [Google Scholar] [CrossRef]
  59. FAO; IFAD; UNICEF; WFP; WHO. The State of Food Security and Nutrition in the World 2022: Repurposing Food and Agricultural Policies to Make Healthy Diets More Affordable; FAO: Rome, Italy, 2022. [Google Scholar]
  60. Delgado-Iniesta, M.J.; Girona-Ruíz, A.; Sánchez-Navarro, A. Agro-Ecological Impact of Irrigation and Nutrient Management on Spinach (Spinacia oleracea L.) Grown in Semi-Arid Conditions. Land 2023, 12, 293. [Google Scholar] [CrossRef]
Figure 1. Daily minimum (Min) and maximum (Max) air temperatures at the Gadash research farm during the experiments of 2020 and 2021 (Source: Israel Meteorological Service).
Agronomy 15 01102 g001
Figure 2. Pearson correlation coefficients among plant density, dry matter, yield (fresh weight [FW] and dry weight [DW]), protein content, and protein yield of YVQ. Colors reflect correlation values between every two variables. Blue and red colors represent positive and negative correlations, respectively. p-values are shown in parentheses, and asterisks indicate significance of Pearson correlation values (* p < 0.05, *** p < 0.001) within each box. Each value represents measurements from plots for all three row spacings during the 2 years of the experiment.
Agronomy 15 01102 g002
Table 1. Effect of row spacing on young vegetative quinoa (YVQ) yield parameters and protein content (PC) in the 2020 and 2021 experiments.
YearRow Spacing (cm)Plant Density at Harvest (Plant m−2)Dry Matter (%)Fresh Yield (kg ha−1)Dry Yield (kg DM
ha−1)
Protein Content (%)Protein Yield (kg ha−1)
16336 ± 6 a13.1 ± 0.628,469 ± 639 a3737 ± 243 a23.9 ± 1.4884 ± 24 a
202026193 ± 27 b13.4 ± 0.727,262 ± 251 a3662 ± 176 a23.5 ± 1.1865 ± 76 a
8055 ± 4 c11.4 ± 0.220,986 ± 555 b2396 ± 54 b26.6 ± 2.2633 ± 39 b
16345 ± 37 a14.4 ± 0.1 a7423 ± 2091072 ± 4120.5 ± 0.4220 ± 13
202126166 ± 157 b13.4 ± 0.1 b6747 ± 1609902 ± 21223.8 ± 1.3209 ± 43
8065 ± 3 c13.3 ± 0.4 b4957 ± 775661 ± 10522.3 ± 2147 ± 28
Note: Results are presented as mean value ± SE of four 9.8 m2 sample plots per treatment. DM, dry matter. Values in a column marked with different letters differ significantly by Tukey HSD test (p < 0.05).
Table 2. Effect of genotype on YVQ yield parameters and PC in the 2020 and 2021 experiments.
YearAccessionPlant Density at Harvest (Plant m−2)Dry Matter (%)Fresh Yield (kg ha−1)Dry Yield (kg DM
ha−1)
Protein Content (%)Protein Yield (kg ha−1)
Red Head176 ± 6 a12.2 ± 0.617,776 ± 7942175 ± 19624.4 ± 0.8533 ± 56
Mint Vanilla183 ± 16 a13.1 ± 0.316,852 ± 3892199 ± 5426.3 ± 1.1579 ± 25
2020Ivory207 ± 14 a13.6 ± 0.615,969 ± 7522182 ± 17324.6 ± 2.1539 ± 69
Oro de Valle111 ± 4 b12.3 ± 0.414,923 ± 10561852 ± 18226.5 ± 1.7486 ± 40
Peppermint186 ± 6 a12.7 ± 0.716,531 ± 16092136 ± 29825.9 ± 1.4556 ± 85
Red Head279 ± 7 a14 ± 0.49342 ± 16201292 ± 20922.7 ± 1290 ± 44
Mint Vanilla168 ± 13 b14.5 ± 0.38337 ± 6861209 ± 9821.9 ± 0.5265 ± 19
2021Ivory181 ± 14 b14.5 ± 0.49821 ± 12411417 ± 17721.5 ± 1300 ± 29
Oro de Valle163 ± 6 b15.1 ± 0.27477 ± 13871122 ± 19823.4 ± 0.7260 ± 42
Peppermint213 ± 20 b15.1 ± 0.59847 ± 7931494 ± 15321.2 ± 1.3315 ± 33
Note: Results are presented as mean value ± SE of four 9.8 m2 sample plots per treatment. Values in a column marked with different letters differ significantly by Tukey HSD test (p < 0.05).
Table 3. Amino acid composition of accession Mint Vanilla from the 2021 growing season.
Amino Acids
(g 100 g DM−1)
Recommended Daily Intake (g per 70 kg Body Weight) a
Essential
Histidine0.23 ± 0.010.7
Isoleucine0.55 ± 0.041.4
Leucine1.01 ± 0.052.73
Lysine0.51 ± 0.042.1
Methionine0.22 ± 0.010.7
Phenylalanine0.65 ± 0.041.75 b
Threonine0.63 ± 0.031.05
Tryptophan0.0588 ± 0.00690.28
Valine0.64 ± 0.051.82
Non-essential
Alanine0.74 ± 0.05
Arginine0.64 ± 0.04
Aspartic acid1.24 ± 0.06
Cystine + Cysteine0.20 ± 0.01
Glutamic acid1.54 ± 0.5
Glycine0.75 ± 0.03
Proline0.63 ± 0.03
Serine0.65 ± 0.03
Tyrosine0.36 ± 0.04
Note: Results are expressed as mean value ± SE of three samples. a Source: [45]. b In total with tyrosine.
Disclaimer/Publisher’s Note: The statements, opinions and data contained in all publications are solely those of the individual author(s) and contributor(s) and not of MDPI and/or the editor(s). MDPI and/or the editor(s) disclaim responsibility for any injury to people or property resulting from any ideas, methods, instructions or products referred to in the content.

