Article

Zinc Treatment Effects on the Expression of Enzyme Genes Related to Lysine Synthesis Pathway in Flammulina filiformis Mycelia

1
Laboratory of the Genetic Breeding of Edible Mushroom, College of Horticulture, Jilin Agricultural University, Changchun 130118, China
2
Engineering Research Centre of Chinese Ministry of Education for Edible and Medicinal Fungi, Jilin Agricultural University, Changchun 130118, China
*
Author to whom correspondence should be addressed.
Agronomy 2025, 15(5), 1107; https://doi.org/10.3390/agronomy15051107
Submission received: 29 March 2025 / Revised: 24 April 2025 / Accepted: 28 April 2025 / Published: 30 April 2025
(This article belongs to the Section Plant-Crop Biology and Biochemistry)

Abstract

:
Zinc and lysine have been identified as beneficial components of Flammulina filiformis. This work investigated the effects of different concentrations of Zn2+ on mycelia growth, zinc content, amino acid composition of F. filiformis. To explore the mechanism of action of zinc on lysine synthesis in F. filiformis mycelia, this work studied at the molecular level. The cultivated strain FV8 and the wild strain FV18 were utilized as the research subjects. Various concentrations of Zn2+ (0, 10, 20, 30 mg/L) were added in the PDA medium for the experiments. The results indicated that the maximum lysine content was reached in the 20 mg/L treatment. A positive correlation was identified between Zn2+ and the lysine content in F. filiformis mycelia, suggesting a regulatory role for Zn2+ in the expression of lysine synthesis pathway genes. Zn2+ has been observed to promote the upregulated expression of HDH and HCD, while concomitantly exerting a negative effect on the expression of AAT in key enzyme genes of the lysine synthesis pathway. The F. filiformis mycelia exhibited a notable enrichment capacity for zinc, with the highest zinc content observed in the 30 mg/L treatment. The zinc-enriched growth performance of wild strain FV18 was found to be superior to that of cultivated strain FV8, which is considered a suitable breeding material. This study provides a foundation for further exploration of the lysine synthesis pathway in F. filiformis mycelia, and selection of functional varieties of F. filiformis.

1. Introduction

Flammulina filiformis [1], one of the widely cultivated and consumed edible mushroom species worldwide, is called “wonder mushroom” on account of their ability to enhance cognitive function due to its high concentrations of lysine and zinc [2]. Lysine is a first-limiting essential amino acid that cannot be synthesized by the human body [3]. Therefore, it must be ingested via food to meet the need for growth and metabolism. Zinc is one of the essential trace elements for the human body [4]. Zinc deficiency is widespread all over the world [5,6]. Inorganic zinc, which has large side effects, is commonly used for supplementation. Consequently, the development of safe “biological zinc supplements” has become the focus [7,8]. Currently, the production of F. filiformis in China has the advantages of short cultivation cycle and high yield. However, the agronomic characteristics of F. filiformis remain the primary focus of research [9,10], while studies on functional varieties are relatively scarce. In the context of the diversified development of the national food concept, consumers are placing increasing emphasis on health and well-being [11]. This has created a substantial demand for the selection and cultivation of new F. filiformis varieties with improved quality traits to satisfy the needs of diverse consumer groups.
In the domain of edible mushroom, the presence of metal elements has been observed to influence the growth of mycelium and the developmental process of fruiting bodies [12]. Additionally, there have been reports on the content, morphology, and structure about Zn [13], Se [14,15], and Fe [16] in edible mushrooms. However, the precise mechanism by which these elements affect the synthesis of components in the body remains to be thoroughly studied. The effects of exogenously added metal elements on plant-related physiological mechanisms and response genes have been extensively explored [17,18,19]. Notably, the mechanism of lysine synthesis by metal elements has been investigated in some bacteria. For instance, Fe, Mn and Co have been found to be involved in the regulation of the lysine biosynthesis system in Kitasatospora kifunense [20]. The presence of both CO2+ and Zn2+ has been demonstrated to enhance lysine accumulation in Bacillus megaterium [21]. In addition, Zn has been identified as a pivotal element in the lysine anabolism process in Escherichia coli [22]. Among the edible mushrooms, lysine synthesis has been studied more in F. filiformis. Lysine biosynthesis in F. filiformis is conducted through the α-aminoadipate (α-AAA) pathway [23]. The 8-step enzyme-catalyzed genes have been identified and analyzed by previous author. First, α-ketoglutarate is catalyzed by homocitrate synthase (HCS) with the participation of acetyl-CoA to form homocitrate, then catalyzed by hypercitrate dehydratase (HCD) to form cis-homoaconitate. Next, cis-homoaconitate is catalyzed by homoaconitate hydratase (HAH) to form homoisocitrate, followed by its catalyzation by homoisocitrate dehydrogenase (HDH) with the participation of NAD forming α-ketoadipate. Then, α-aminoadipate is formed from α-ketoadipate and glutamate by the action of aminoadipate aminotransferase (AAT), which is followed by aminoadipate reductase (AAR), saccharopine reductase (SR) and saccharopine dehydrogenase (SDH) to complete the final step of lysine biosynthesis. Light-responsive element [24] and low-temperature-responsive element [25] have been found. And then it has been found that the environmental factors such as light quality, temperature and exogenous additives can affect lysine production of lysine in F. filiforms [25,26,27]. Nevertheless, there remains a lacuna in the research on the key enzyme genes of the lysine synthesis pathway of F. filiforms by metal elements. The results of the pre-experiment showed that the lysine content of the F. filiformis mycelium increased after the addition of zinc to the PDA plates. The interaction between zinc and lysine in the biosynthesis of F. filiformis has not yet been clarified, so it is necessary to study the effect of zinc on F. filiforms lysine synthesis pathway.
In this work, we introduced different concentrations of Zn2+ during the stage of F. filiformis mycelium to investigate a correlation between the concentrations of Zn2+ and the subsequent expression of lysine-synthesizing genes. This research not only filled a critical gap in understanding the regulatory mechanism of metal elements on lysine synthesis in F. filiformis but also enriched our knowledge of the biological functions of Zn2+ and enhances comprehension of the lysine biosynthesis pathway in F. filiformis. The objective of this study was to determine the optimal concentration of Zn2+ and to reveal the disparities in zinc sensitivity between wild and cultivated strains. The findings of this study will enhance the comprehensive application potential of F. filiformis in supplementing the human body with micronutrients and in promoting intellectual development. Moreover, this study will provide a foundation for parental selection in breeding functional varieties of F. filiformis.

2. Materials and Methods

2.1. Materials

The two F. filiformis strains, including the cultivated strain FV8 and wild strain FV18, which were used in this experiment, were preserved and provided by the College of Horticulture, Jilin Agricultural University. ZnSO4-7H2O, which is analytically pure, was purchased from Shanghai Yuanye Bio-technology Co., Ltd. (Shanghai, China). Reverse transcription kit (AT341) and Quantitative Real-Time PCR kit (AQ601) were purchased from TransGen Biotech (Beijing, China).

2.2. Methods

2.2.1. Experimental Treatment and Strain Culture

According to the findings of the preliminary test, the quantity of Zn2+ to be added to the PDA medium was determined. The Zn2+ concentration was then converted and weighed with an analytical balance to obtain 2 g of ZnSO4-7H2O that had been dissolved and fixed to 100 mL, which is the mother liquid broth. The ZnSO4-7H2O mother liquid broth was added to the PDA medium (peeled potato, 200 g/L; glucose, 20 g/L; agar powder, 10 g/L), which was then configured into four test groups. The Zn2+ concentration and ZnSO4-7H2O mother liquid broth which was added to the PDA medium as shown in Table 1. After the PDA medium has been prepared, the pH value is not adjusted using acid or base. The medium was sterilized at 121 °C for 30 min, after which the medium was then distributed into sterile Petri dishes, with each dish receiving 25 mL. The PDA plates were subsequently made after condensation. Subsequently, cellophane membrane of the same size as the plate dish was sterilized and placed on top of Zn2+ PDA plates with different concentrations.
The two strains of F. filiformis, which had been maintained in the refrigerator at 4 °C, were activated with PDA plates. Then, transferred the identical size and growth pattern of the same block in the center of the PDA plates, which contained varying concentrations of Zn2+. Each strain was inoculated with 3 non-cellophane PDA plates and 27 cellophane PDA plates at each Zn2+ concentration. All of the plates were incubated at 25 °C. After 14 days of incubation, a sufficient quantity of mycelium inoculated on cellophane membrane covered PDA medium was harvested and stored at −80 °C as a reserve sample.

2.2.2. Measurement of Mycelium Growth

  • Mycelium Growth Rate
Colony diameters were measured for 3 days and 5 days after inoculation using the crosshatch method [28]. The mycelium growth rate (mm/d) = mycelial diameter difference (mycelial growth days × 2). This experiment was performed with three replicates for each treatment. Three replicates were utilized for each sample.
  • Mycelium Biomass Content
The mycelium that had been inoculated on cellophane membrane covered PDA medium was collected after 14 days of culture. Then, the mycelium was dried at 60 °C. The weight of the dried mycelium was taken as the mycelial biomass. Three replicates were utilized for each sample.

2.2.3. Determination of Zinc Content

The determination of zinc refers to GB 5009.268-2016 National Standard for Food Safety Determination of multiple elements in food [29]. Based on this determination method, it is improved to a certain extent. Each sample was weighed and transferred into the polytetrafluoroethylene digestion jar, followed by the addition of 5 mL of nitric acid, and the jar was left to stand. Subsequent to the completion of the reaction, the lid must be sealed and the jar was placed into the microwave ablator. Following the completion of the ablation, the temperature must be allowed to cool to below 50 °C. Then, the ablator is to be opened, rinsed with ultrapure water, transferred to a 25 mL volumetric flask, and condensed to the scale. Then, the zinc content was measured by the ICP-MS iCAPRQ (Thermo Fisher Scientific, Waltham, MA, USA). To ensure reliable and reproducible results, three replicates were utilized for each sample.

2.2.4. Determination of Amino Acids

  • Tryptophan Test
Each sample was weighed in 15 mL hydrolysis tubes which NaOH 4.3 M was added to. The tubes were filled with nitrogen, followed by hydrolysis. The samples were removed and cooled. After that, samples were transferred to 50 mL centrifuge tubes. The pH was adjusted to a neutral level using HCl. The volume was fixed at 50 mL, and the samples were shaken. Centrifugation at 6000 rpm for 5 min was then performed. The resultant upper layer was filtered through a 0.22 μm microporous filter membrane, and detection was subsequently conducted using a liquid chromatography mass spectrometer (Agilent Technologies Inc., Santa Clara, CA, USA). Three replicates were utilized for each sample.
  • Free Amino Acids Test
Each mycelium sample was weighed, and 5 mL of a 1:1 hydrochloric acid solution were added to the hydrolysis tube. The tube was mixed well and placed in an electric blast thermostat set at 110 °C ± 1 °C for 22 h. The samples were then removed and allowed to cool to room temperature. The hydrolysis tube was opened, and the hydrolysis solution was filtered into a 10 mL volumetric flask. The hydrolysis tube was rinsed with a small amount of water several times, and the water wash solution was transferred to the same volumetric flask. Finally, the water was fixed to the scale by shaking well. Next, 0.05 mL of filtrate was to be transferred into a 15 mL test tube. The tube could be sealed and placed under a stream of nitrogen gas for a period of 10 min. Following this, 0.02 M hydrochloric acid solution could be added to the tube, bringing the volume to 2 mL. The contents of the tube could then be shaken and mixed thoroughly [30,31]. Finally, the tube was to be placed under a 0.22 μm microporous filter membrane for the automatic amino acid analyzer LA8080 (Hitachi High-Tech, Tokyo, Japan). Three replicates were utilized for each sample.

2.2.5. Determination of Gene Expression in Lysine Synthesis Pathway

  • Extraction of Total RNA and Synthesis of cDNA
The mycelium of each treatment, which was stored at −80 °C as a reserve, was ground into a fine powder using liquid nitrogen. The TRIzol method was then used to extract 0.1000 g mycelia samples. The RNA purity and concentration were measured using a nano-spectrophotometer (Thermo Fisher Scientific, Waltham, MA, USA), and agarose gel electrophoresis was carried out to detect the integrity of RNA. After that, total RNA was reverse-transcribed into cDNA using AT341 and stored at −20 °C as a backup.
  • Quantitative Real-Time PCR
The effects of different concentrations of Zn2+ treatments on the expression of eight genes (HCS, HCD, HAH, SDH, AAR, AAT, HDH, and SR) [24,27] in the lysine synthesis pathway in the mycelium of FV8 and FV18 were determined by fluorescence quantitative PCR. The primers qualified by the pre-test screening were used for quantitative analysis of the genes by SYBR green method, and SPRYp of F. filiformis was selected as the internal reference gene. The primers were synthesized by Comate Bioscience Co., Ltd. (Jilin, China) (Table 2). Total reaction volume was 20 μL: 0.4 μL forward primer (10 μmol/L), 0.4 μL reverse primer (10 μmol/L), 0.4 μL Passive Reference Dye, 10 μL Top Green qpcr supermix, 7.8 μL RNase free water, 1 μL cDNA. Reaction conditions were predenaturation at 95 °C for 2 min, denaturation at 95 °C for 15 s, annealing at 60 °C for 20 s, and extension at 72 °C for 26 s, for a total of 40 cycles. Three replicates were utilized for each sample.
  • Calculation of Gene Relative Expression
Ct values of enzyme genes on lysine synthesis pathway were obtained by qRT-PCR. The relative expression levels of genes on different concentrations of Zn2+ treatments in the mycelium stage were calculated by the formula F = 2−ΔΔC by comparing Ct values. In formula F = 2−ΔΔCt, ΔΔCt = (Ct value of the target gene in the test group − Ct value of the reference gene in the test group) − (Ct value of the target gene in the control group − Ct value of the reference gene in the control group). The control group in this formula is the following: the treatment of common PDA plates without Zn2+ was used as a control to calculate the relative expression levels of each gene between different treatments.

2.2.6. Statistical Analysis

The experimental data from at least three independent repeats were analyzed using SPSS Statistics 26.0 (IBM, New York, NY, USA) which was employed to execute one-way ANOVA, while the Duncan’s multiple range test was utilized to ascertain the disparities among the samples. Additionally, TBtools-II (South China Agricultural University, Guangzhou, China) were utilized to conduct visual heatmap. Origin-Pro 2022 (OriginLab, Northampton, MA, USA) were utilized to bar chart analysis of the data. The correlation between the data was expressed as Pearson correlation coefficients. Significant differences in the graph were represented by different letters between the different treatments. p < 0.05 was considered to be significant.

3. Results

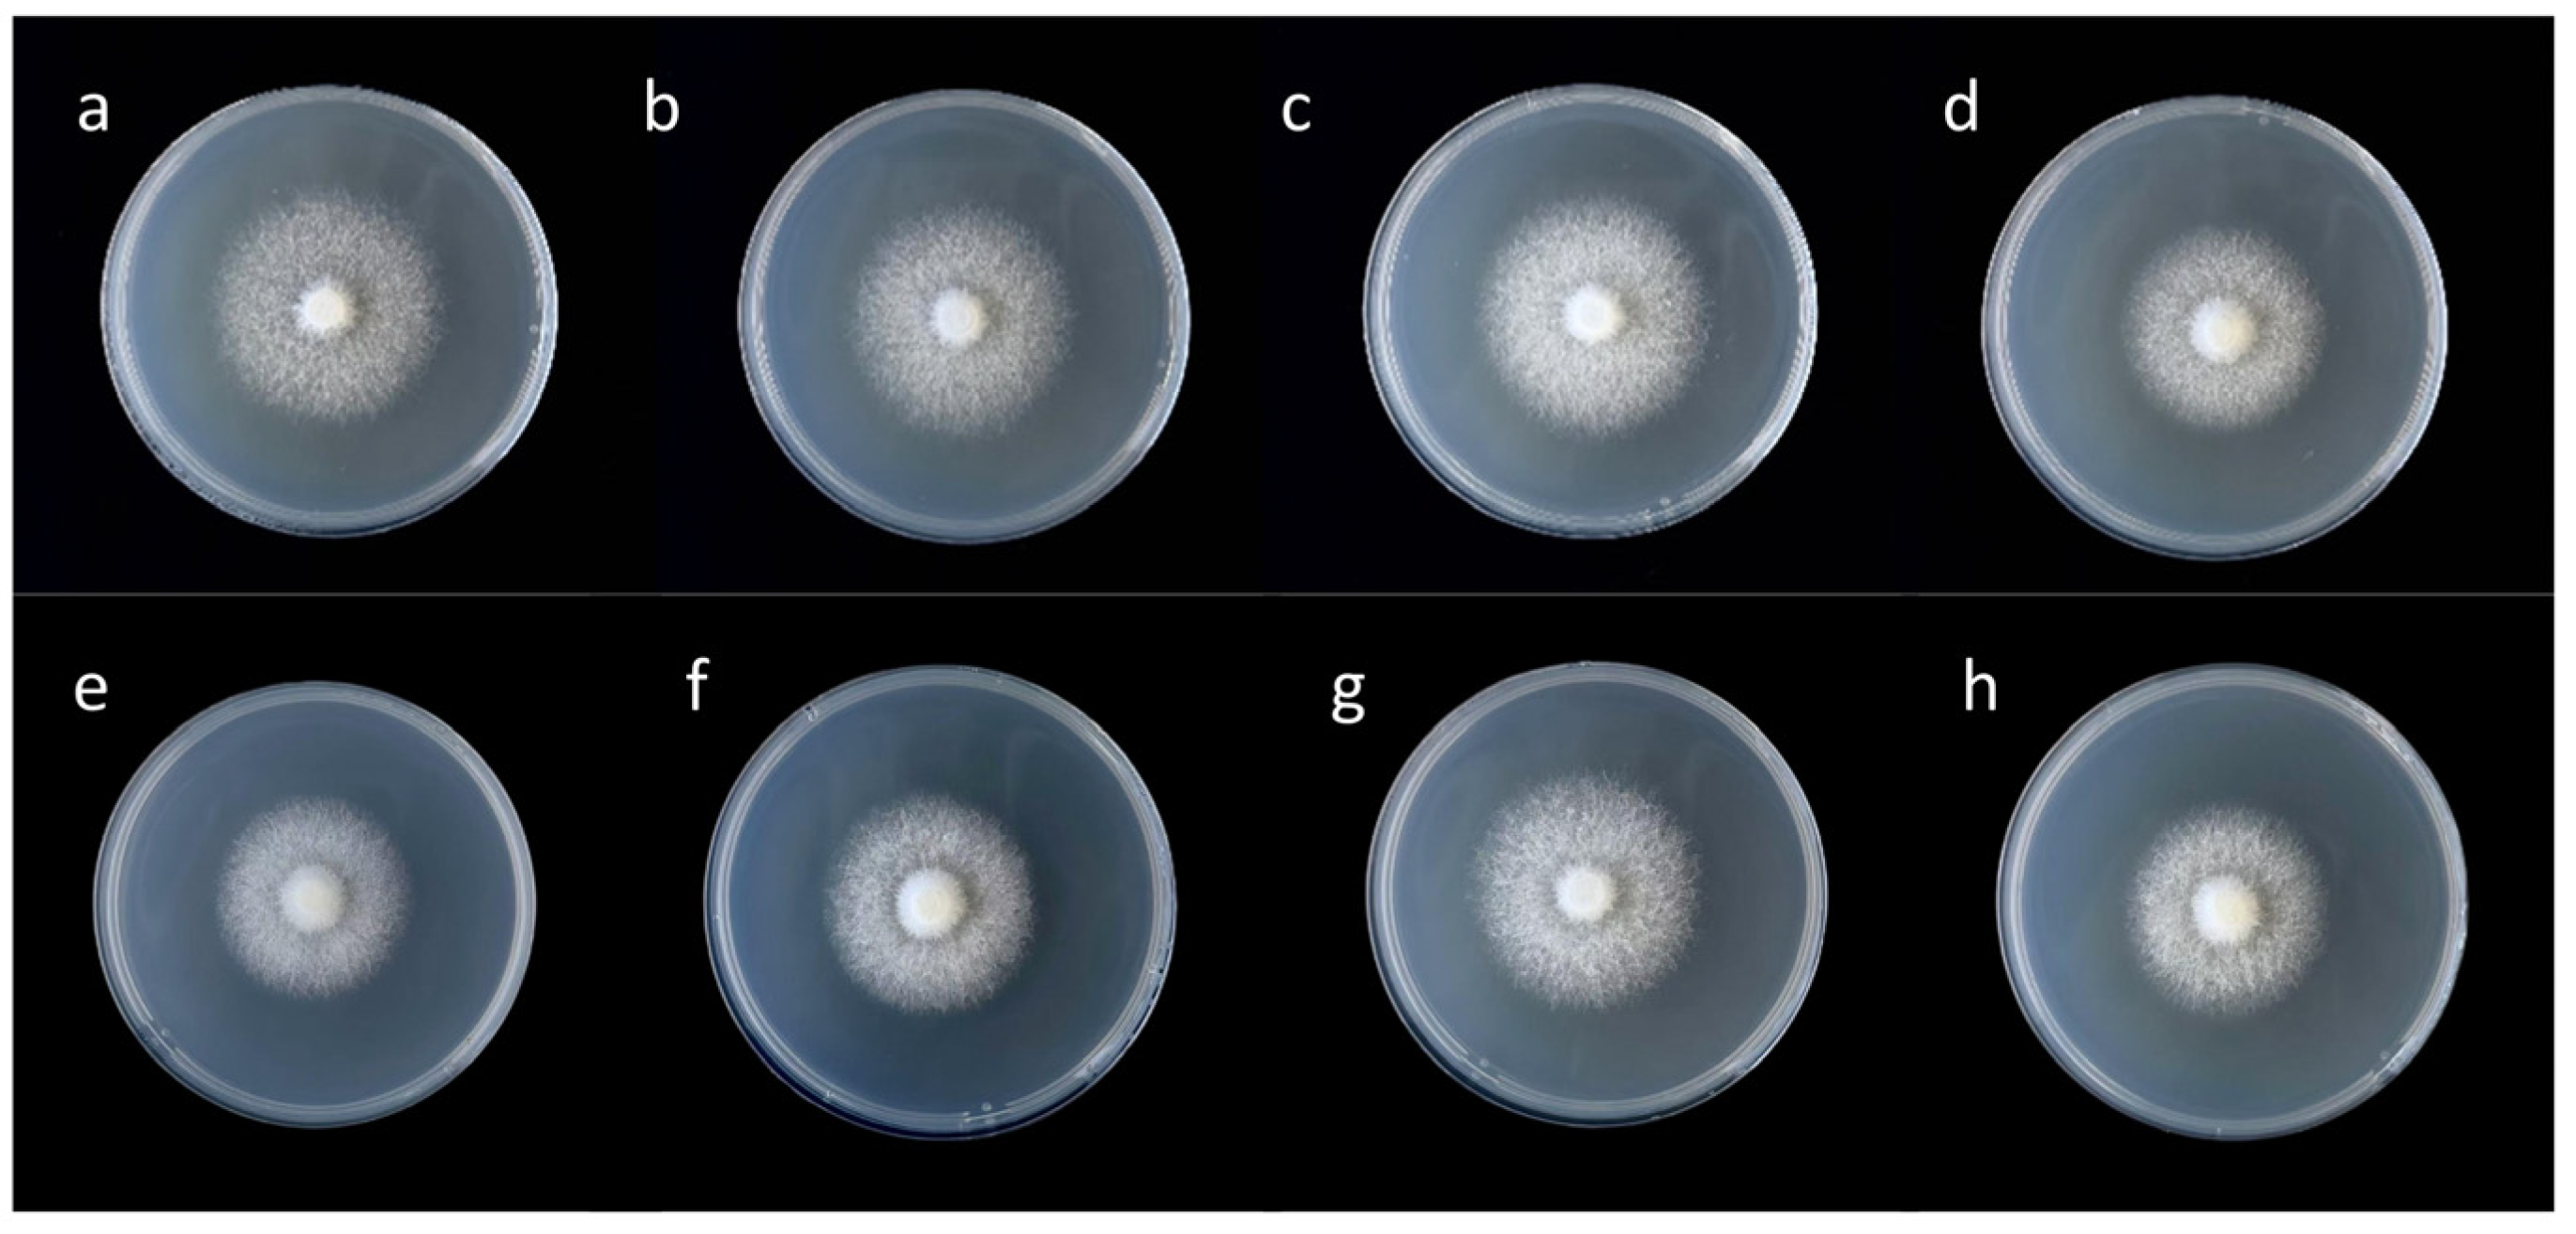
3.1. Effects of Different Concentrations of Zn2+ on Mycelia Growth of F. filiformis

In order to reveal the effect of Zn2+ concentration on the mycelium of F. filiformis, the mycelia growth rate and biomass of F. filiformis were observed and measured (Figure 1 and Table 3). The mycelia growth rate of F. filiformis was promoted by low concentration of Zn2+ and inhibited by high concentration. Under the 20 mg/L treatment, the mycelia growth rates of cultivated strain FV8 and wild strain FV18 were the fastest, which exhibited significant increases of 8.13% and 11.33% in comparison with their respective controls. Under the 30 mg/L treatment, the mycelia growth rates of the two strains were significantly slower than that of the control groups. Comparison of different strains at the same concentration showed that the mycelia growth rate of FV8 in the control group was slightly faster than that of FV18, while the mycelia growth rate of FV18 was faster than that of FV8 under the 20 mg/L treatment. The mycelia biomass of F. filiformis exhibited promotion at low concentrations and inhibition at high concentrations. A statistically significant reduction in mycelia biomass was observed for FV8 and FV18 samples in Zn2+ concentration of 30 mg/L, with a decline of 26% and 19.71% in comparison with their respective controls. In the 20 mg/L treatment, the biomass of FV8 and FV18 increased by 18% and 15.49%, and the mycelia biomass content of FV18 was significantly higher.

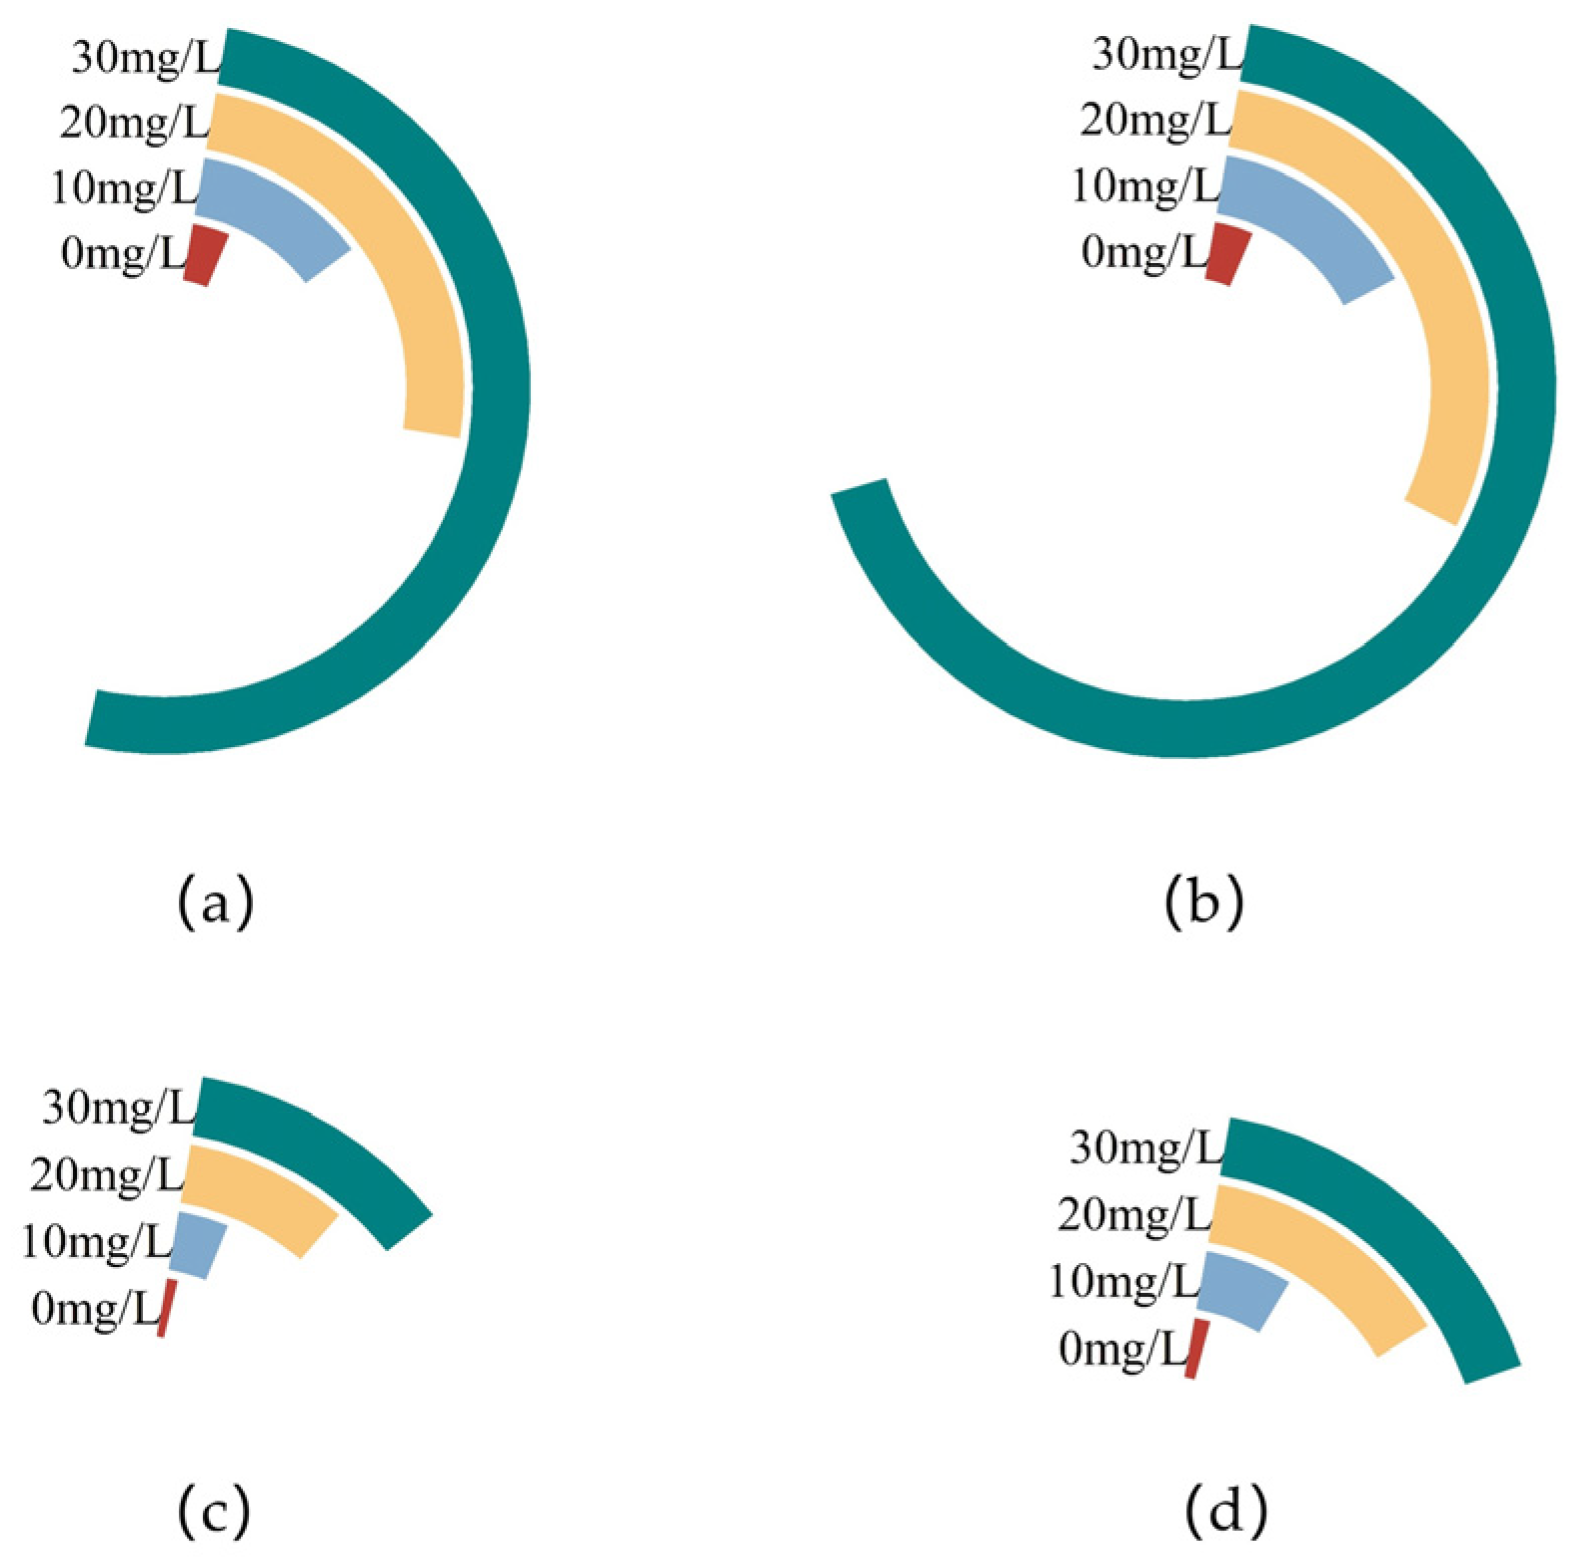
3.2. Zinc Content Analysis Under Different Concentrations of Zn2+ Treatment

The zinc content in the mycelia of F. filiformis in different concentrations of Zn2+ PDA plates was examined. As can be seen from the a and b plots in Figure 2, different concentrations of Zn2+ significantly affected the zinc content in the mycelia of F. filiformis. With the increasing of Zn2+ concentration, the mycelia zinc content of the two strains showed a significant upward trend. In the 30 mg/L treatment showed the highest zinc content in the mycelium of both strains. Comparison of different strains at the same concentration showed that in the control group, both strains had the lowest zinc content, but there was not much difference between the two, with the content of FV8 and FV18 being 3.6 mg/kg and 3.7 mg/kg, respectively. The zinc content of FV8 and FV18 increased approximately 14-fold and 18-fold compared with that of the control groups in the 30 mg/L treatment. The zinc content of total mycelium in different concentrations of Zn2+ PDA plates can be known according to the c and d plots in Figure 2. With the increase of Zn2+ concentration, the mycelia zinc content of the two strains showed a significant upward trend. In the 30 mg/L treatment, the zinc contents of FV8 and FV18 were 11.58 g/kg and 16.91 g/kg, which were approximately 10-fold and 15-fold more than that of the control group, respectively. The zinc content in the mycelia of wild strain FV18 was always higher than cultivated strain FV8 at each set of Zn2+ concentration.

3.3. Zinc Enrichment Under Different Concentrations of Zn2+ Treatment

The bioconcentration factor (BCF) is commonly used to evaluate the degree of metal element accumulation in organisms [32]. According to the BCF to calculate the Zinc enrichment coefficient in the mycelium of F. filiformis, it can be obtained (Table 4): the Zinc enrichment coefficients of the mycelium of FV8 and FV18 were greater than 1 in the PDA plates added with different concentrations of Zn2+, and all showed an increasing trend with rising Zn2+ concentration. In the 30 mg/L treatment, the Zinc enrichment coefficients of FV8 and FV18 were significantly increased by approximately 40.05% and 55.11%, respectively, compared with that of the control groups. While the zinc enrichment rates of total mycelia in different concentrations of Zn2+ PDA medium differed from the above. The maximum Zinc enrichment of total mycelia in FV8 and FV18 was 0.429 and 0.672, respectively, in the 20 mg/L treatment. The results demonstrated an increasing trend followed by a subsequent decreasing trend with increasing Zn2+ concentrations. However, no significant differences were observed between the different concentrations. Consequently, the wild strain FV18 exhibited a more pronounced Zinc enrichment capacity when considered collectively.

3.4. The Contents of Each Amino Acid Under Different Concentrations of Zn2+ Treatment

As shown in Figure 3a, the content of each amino acid was determined in the mycelia of F. filiformis treated with different concentrations of Zn2+. A total of nine essential amino acids including those necessary for infants are necessary for the human body [33]. The mycelia of F. filiformis have been observed to contain eight of these essential amino acids. However, due to the presence of methionine content of less than 0.0075 g/100 g, not all of these amino acids could be detected. Of these, lysine (Lys), valine (Val), and leucine (Leu) were found to be present in notably higher amounts. The most prevalent non-essential amino acids include glutamic acid (Glu), aspartic acid (Asp), alanine (Ala), and arginine (Arg). As the concentration of Zn2+ increased, significant changes in the amino acids Lys, His, and Arg in FV8 were observed. In the 20 mg/L treatment, Lysine content increased compared to the control group, reaching the highest. In contrast, varying concentrations of Zn2+ resulted in decreased content of His and Arg compared to the control group. In different concentrations of Zn2+, the content of amino acids measured in FV18 increased with increasing Zn2+ concentration except for Trp, Cys, Arg, and Pro, their contents did not differ significantly. Therefore, only lysine content was elevated in both strains compared to their corresponding controls under different concentrations of Zn2+ treatment. The analysis revealed a correlation between the specific and total content of amino acids in different concentrations of Zn2+ PDA medium (Figure 3b). It was shown that the content of Val and lysine in the mycelium of FV8 and FV18 were more than other essential amino acids, and the content of Glutamic acid and Arg in the non-essential amino acids were more, both of which were highest at the concentration of 20 m/L Zn2+ PDA medium. At this concentration glutamic acid content was significantly increased in both, and lysine content was 0.052 g/100 g and 0.065 g/100 g, respectively.

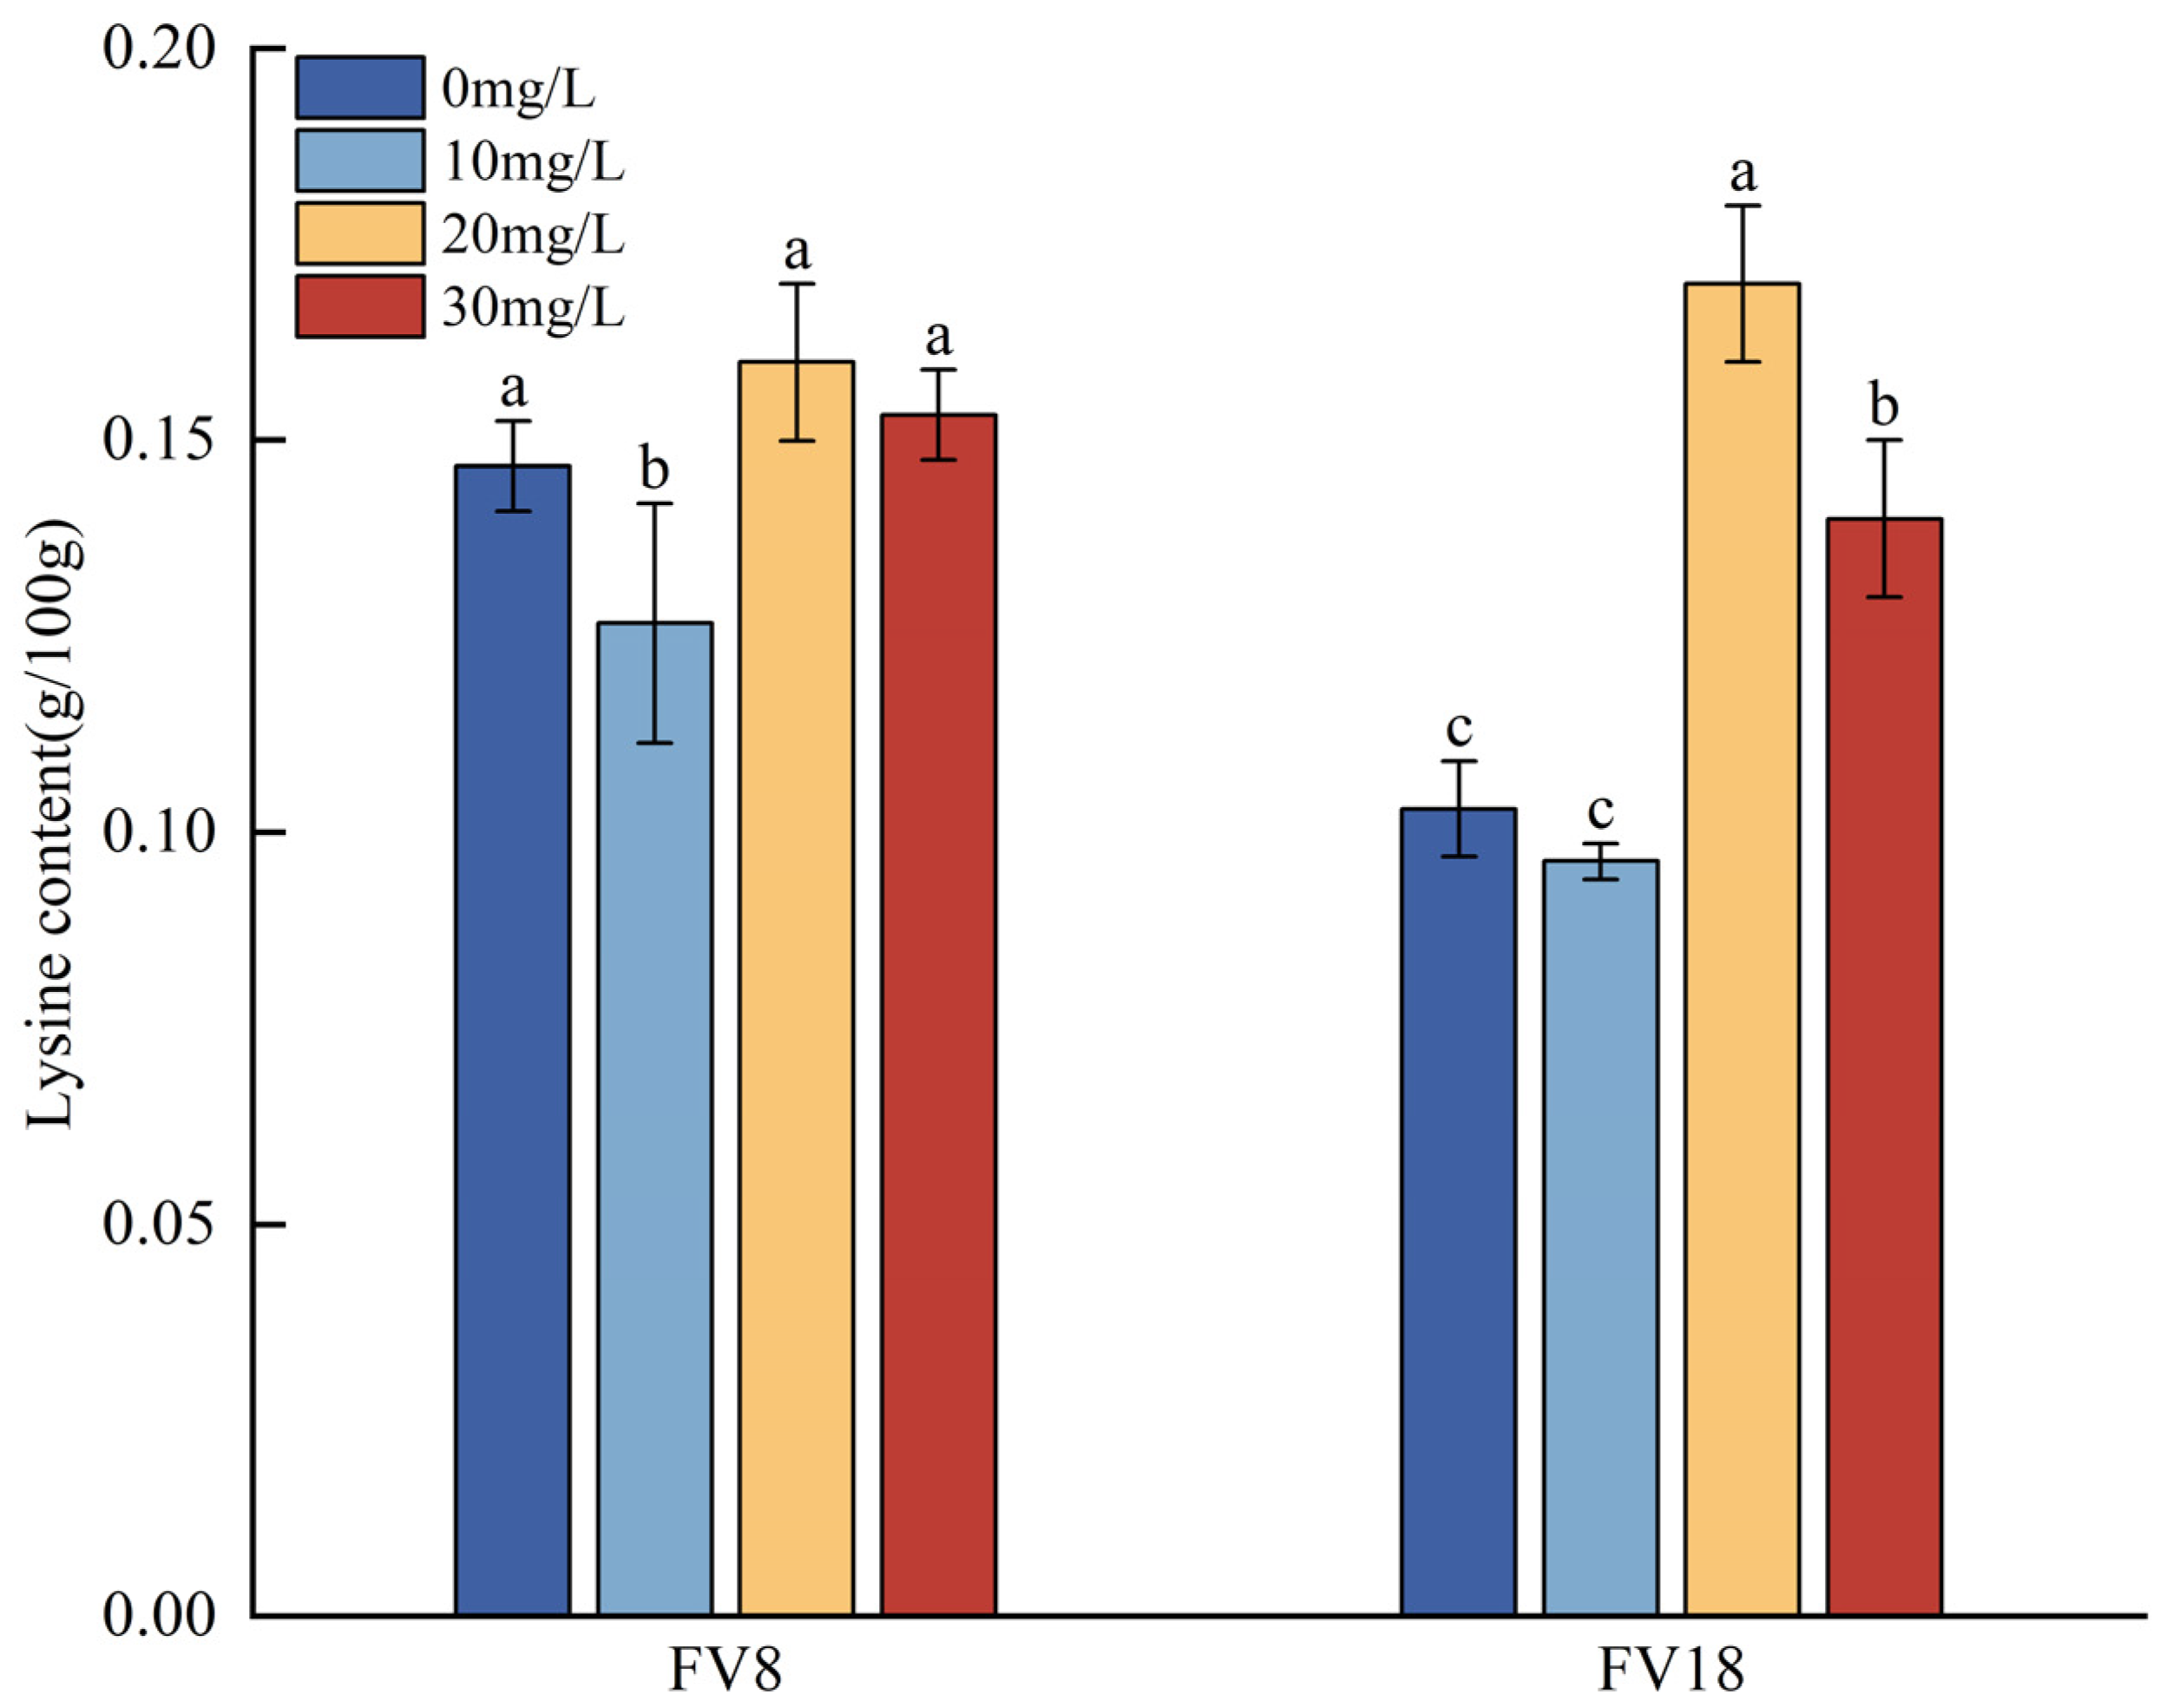
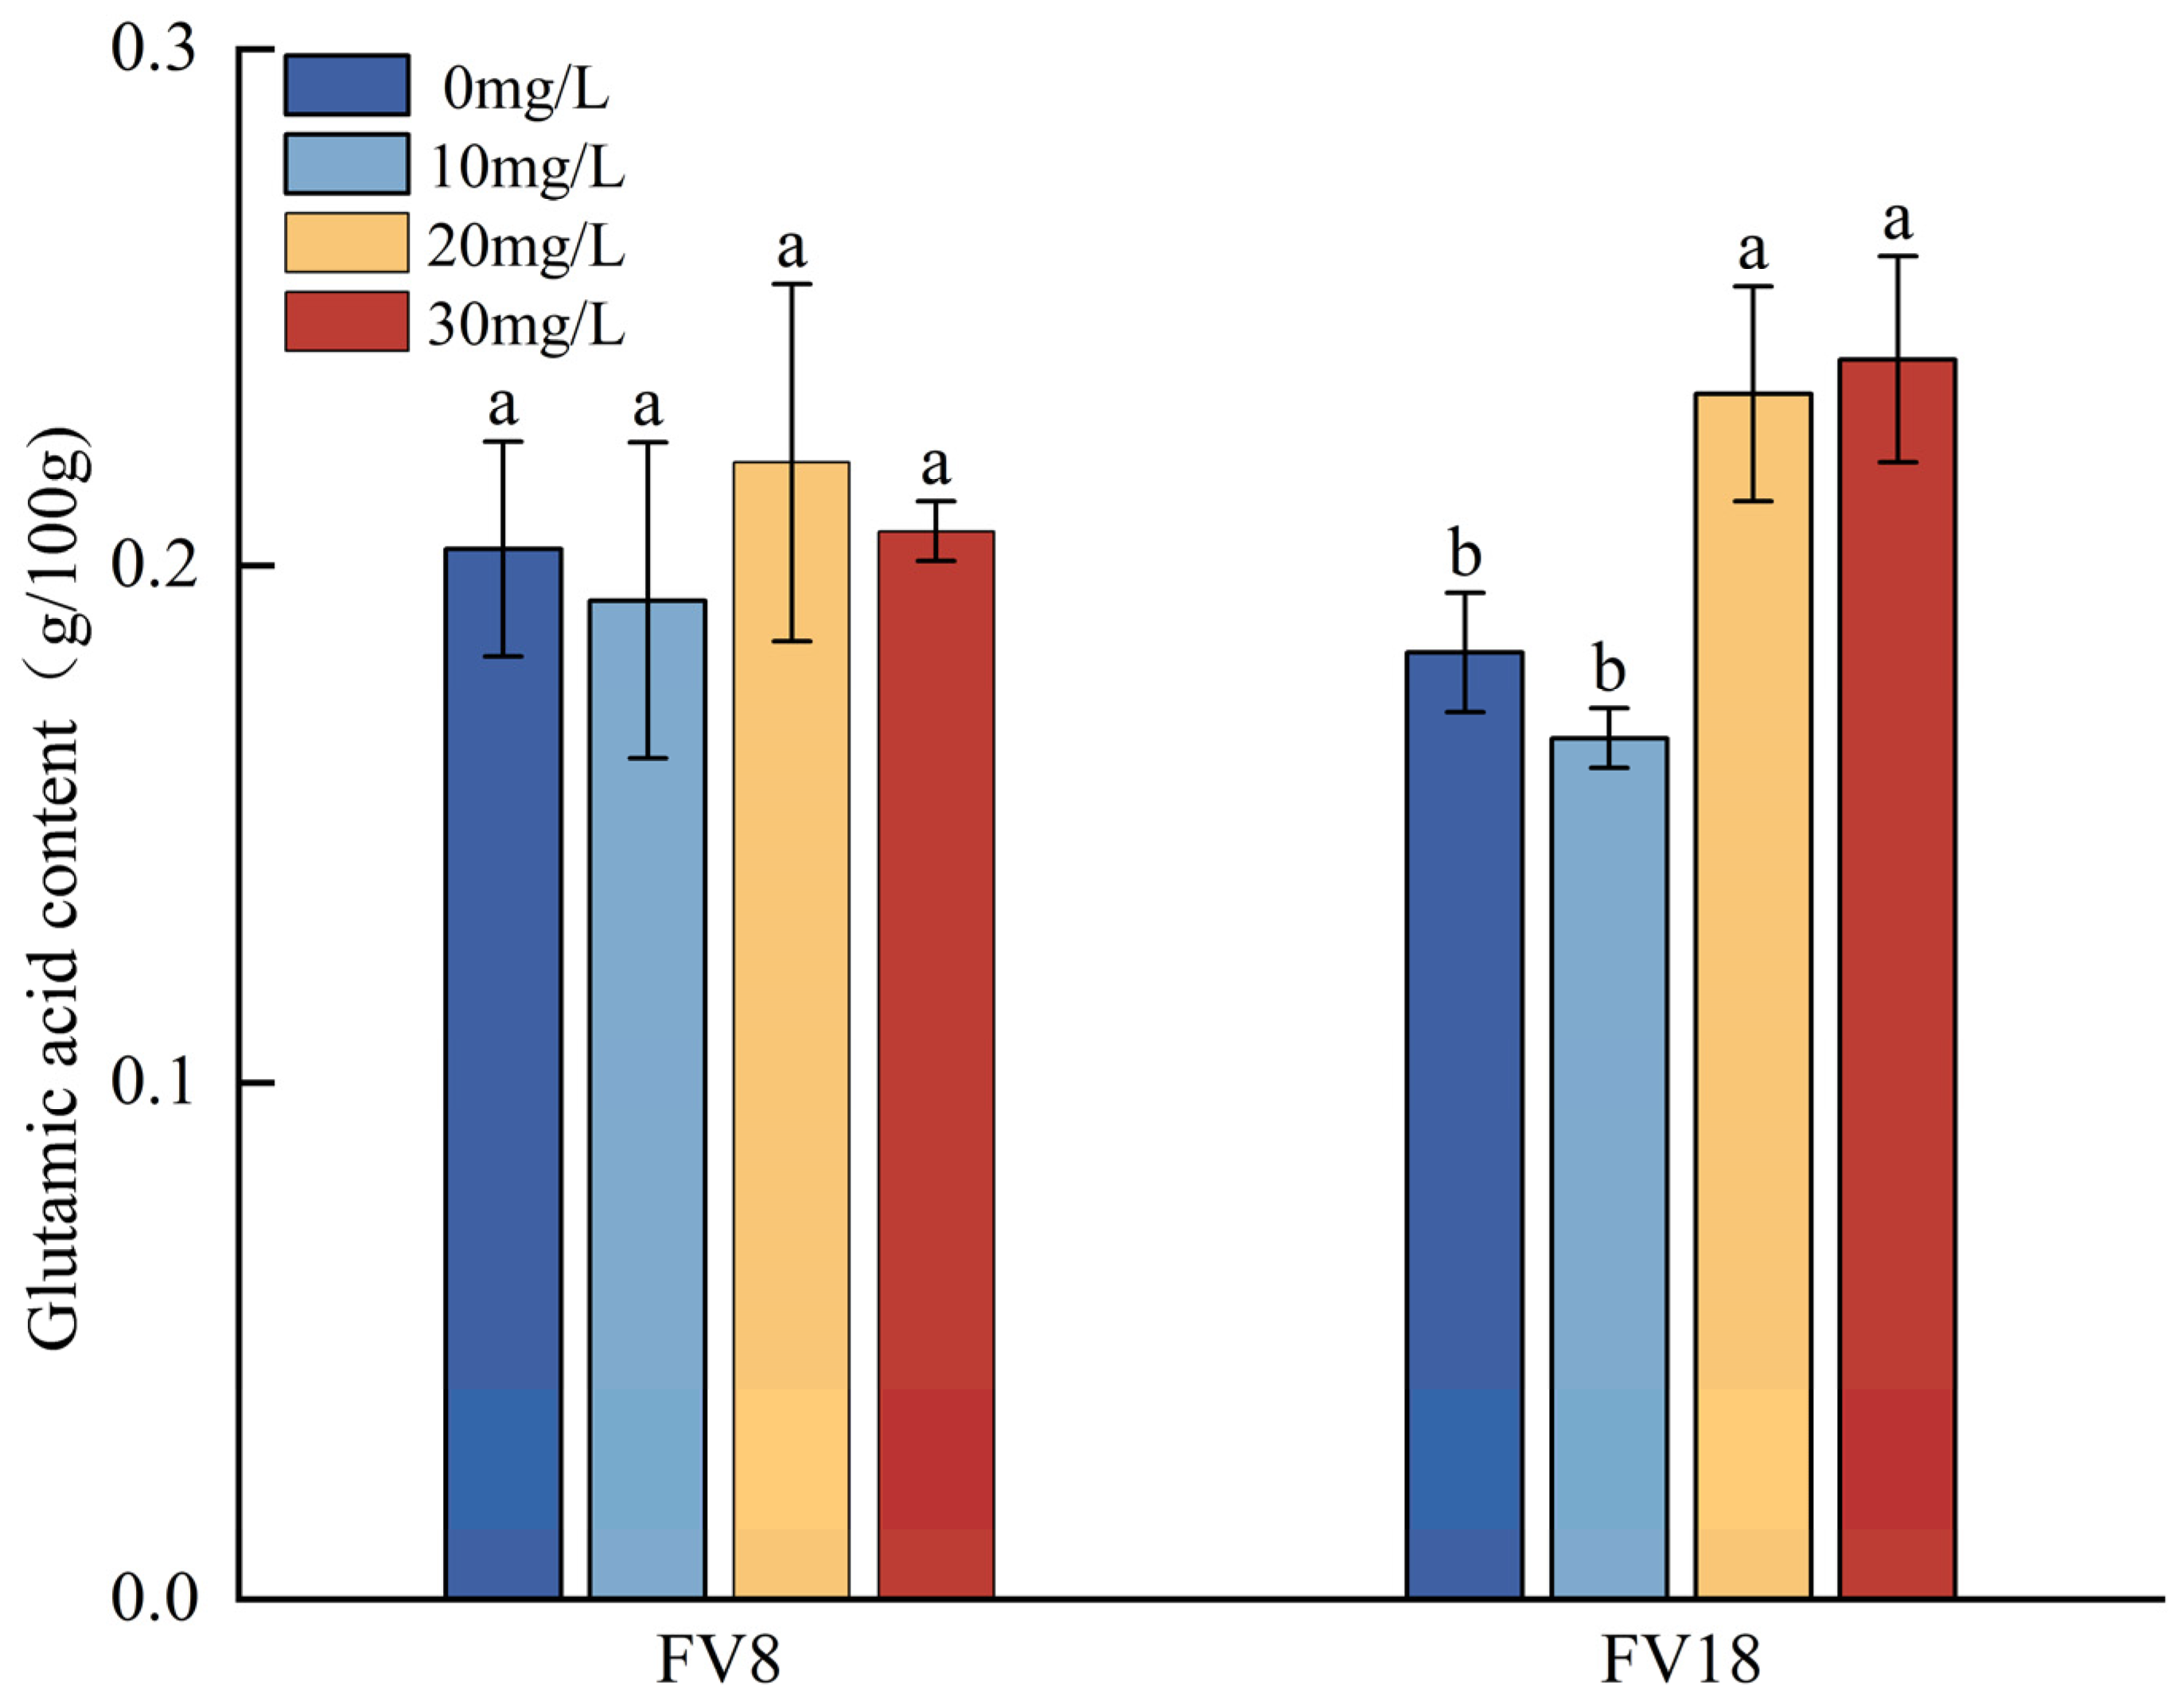
3.5. Changes in the Lysine and Glutamic Acid Contents Under Different Concentrations of Zn2+ Ttreatment

According to the lysine content in F. filiformis after treatment with different concentrations of Zn2+ (Figure 4), the lysine content of FV8 and FV18 increased compared with their corresponding control groups in the 20 mg/L treatment, and both were the highest values. The Lysine content of FV18 which increased by approximately 38.8% was high in comparison with that of FV8 at the same concentration. In the 10 mg/L treatment, the lysine contents of FV8 and FV18 were lower than their corresponding controls, with a decrease of approximately 15.79% and 6.5%, respectively. Comparing the lysine content between different strains at the same concentration showed that wild strain FV18 was lower than cultivated strain FV8 in all cases.
Based on the glutamic acid content detected in the F. filiformis treated with different concentrations of Zn2+ (Figure 5), the highest glutamic acid contents which were found in FV8 and FV18 were, respectively, in the 20 mg/L and 30 mg/L treatment, as compared to the controls. Compared to the corresponding controls of the two strains, the FV18 demonstrated a significant increase in glutamic acid content of approximately 27.28% and 39.13%, respectively, at the Zn2+ concentrations of 20 mg/L and 30 mg/L. In contrast, the glutamic acid content in the FV8 sample exhibited higher levels compared to the control in both cases, though not significantly different. Comparing different strains at the same concentration showed that the glutamic acid content of FV8 and FV18 decreased by approximately 4.92% and 9.1%, respectively, compared with their respective controls at a Zn2+ concentration of 10 mg/L, but neither of them were significantly different. As shown, the glutamic acid content of the wild strain FV18 was less than that of the cultivated strain FV8 in normal PDA medium, but the glutamic acid content of FV18 was approximately 4.5% higher than that of FV8, when the concentration of Zn2+ was 20 mg/L.

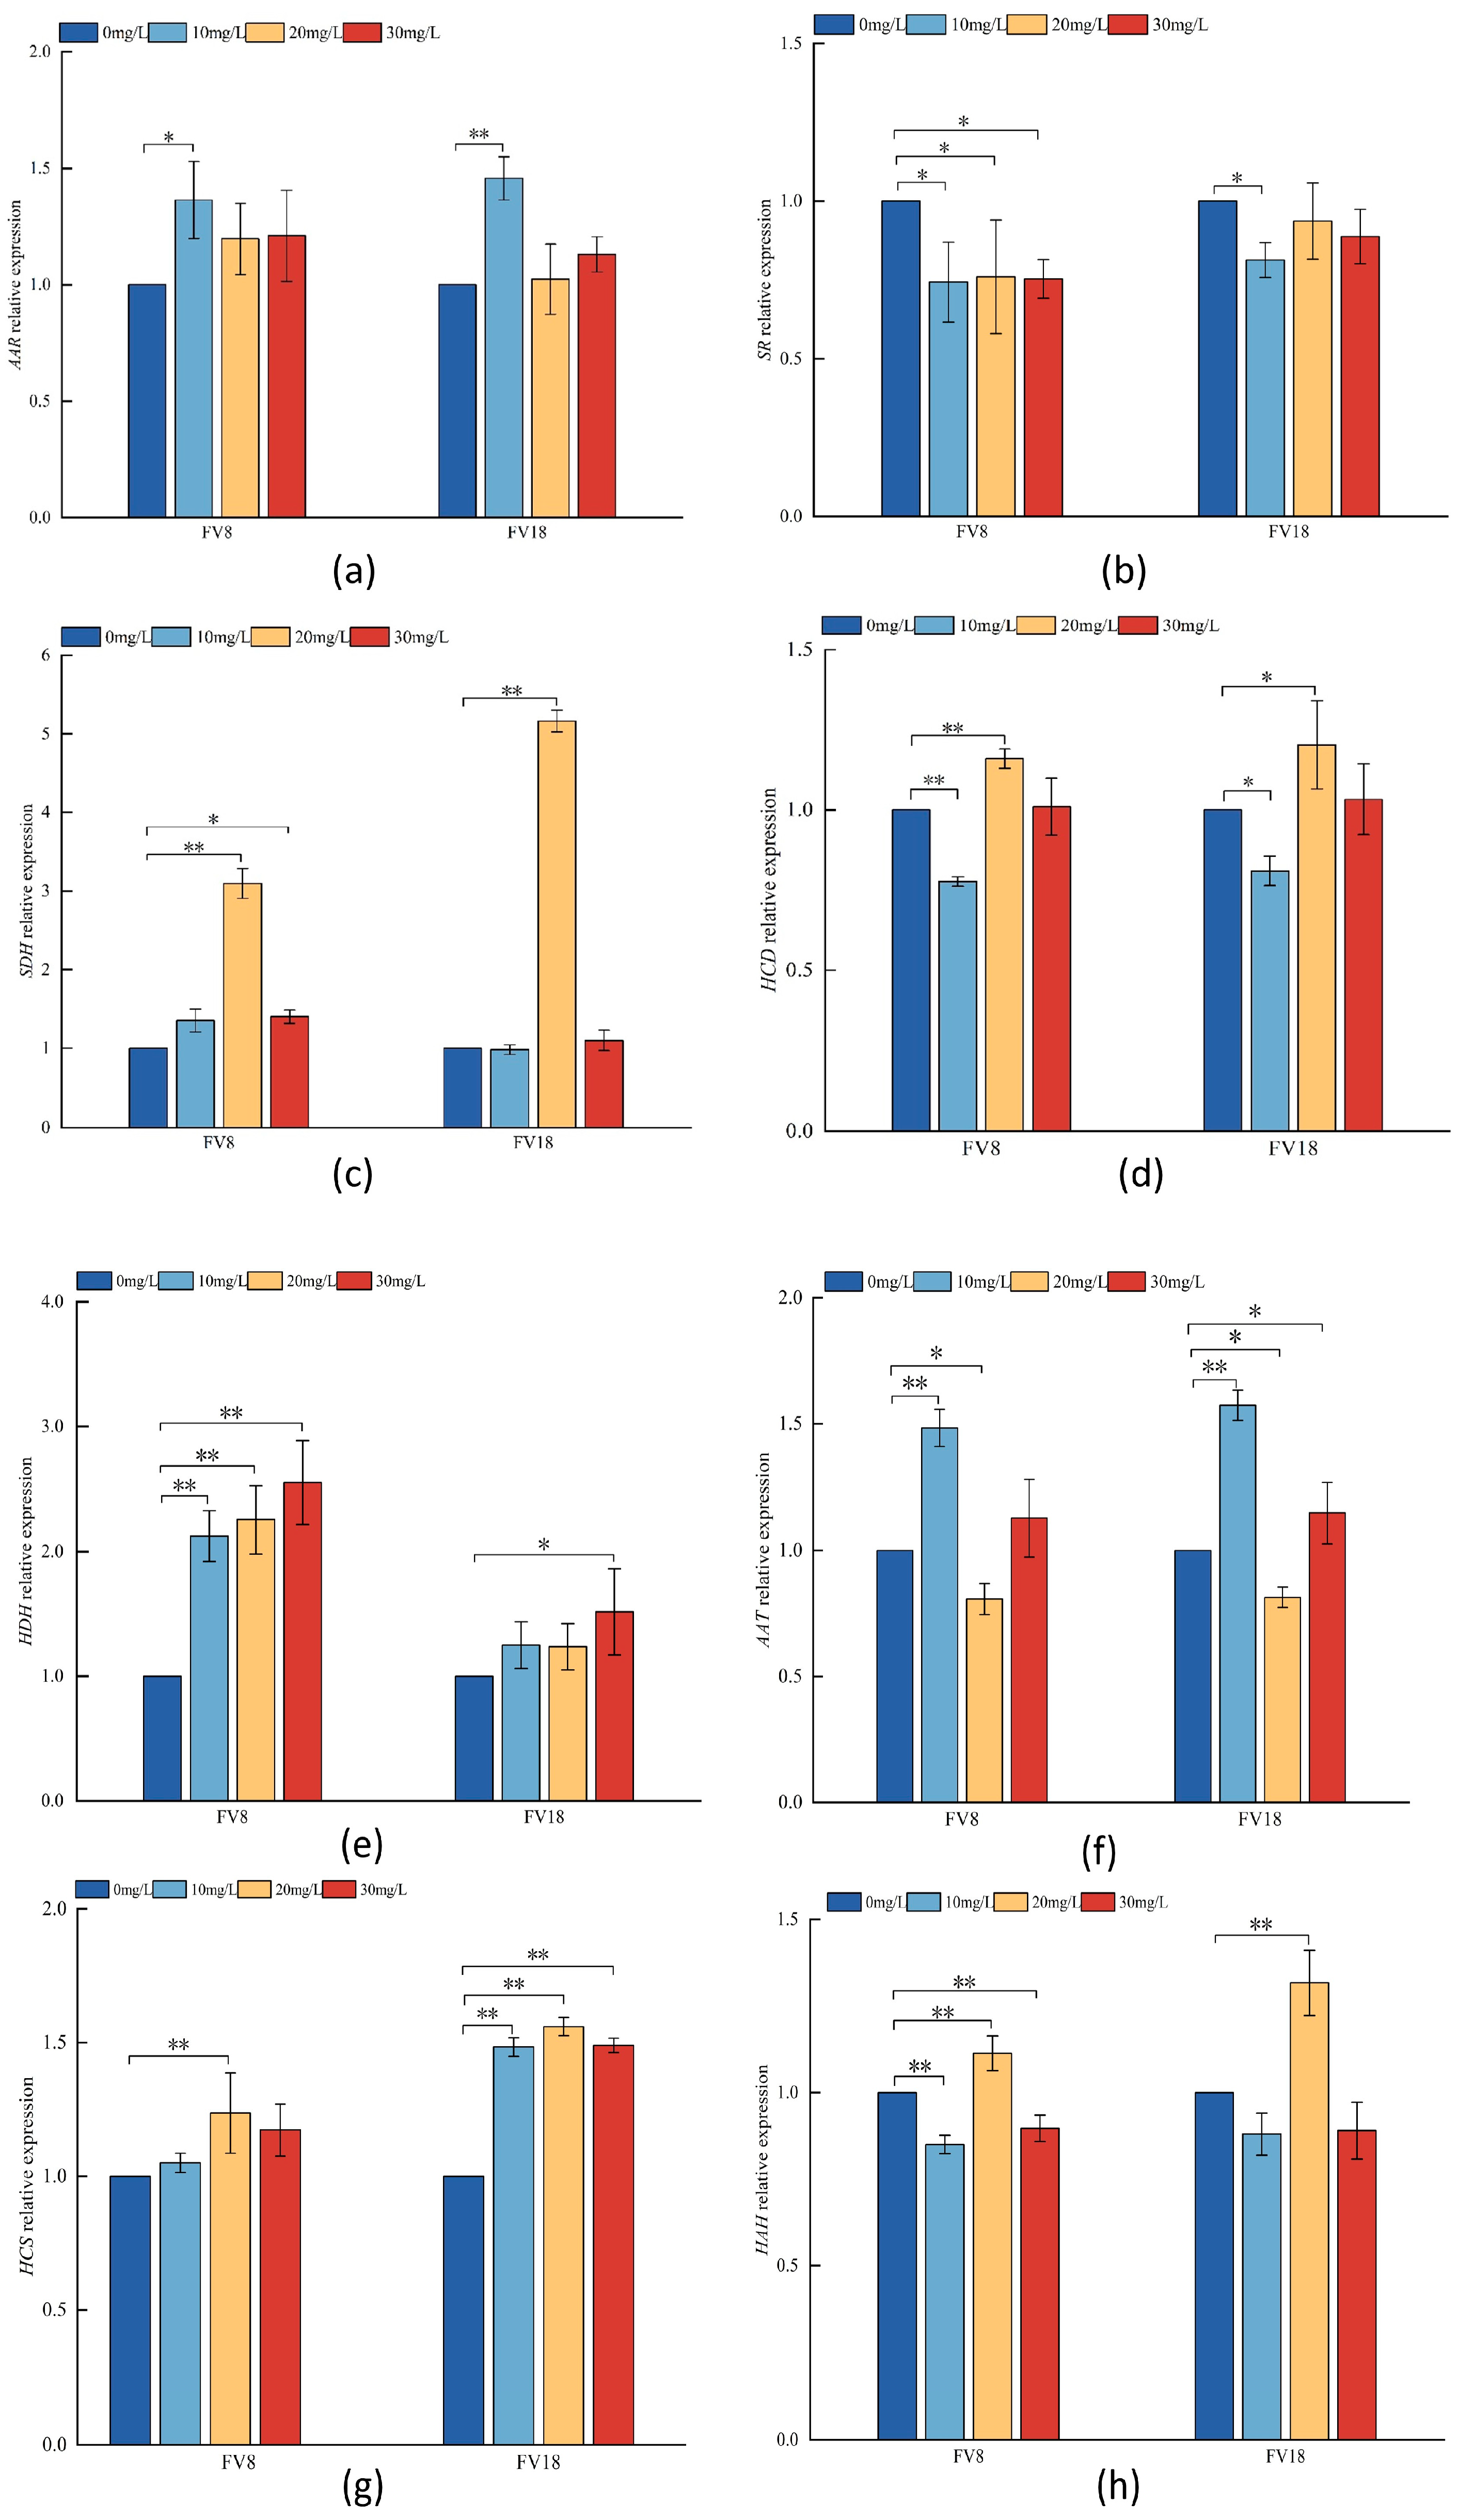
3.6. Analysis of Key Enzyme Genes in Lysine Synthesis Pathway of F. filiformis Under Different Concentrations of Zn2+ Ttreatment

By treating FV8 and FV18 with different concentrations of Zn2+, the key enzyme genes in the lysine synthesis pathway were differentially expressed, indicating that the lysine synthesis pathway was responsive to Zn2+. As shown in Figure 6, in the 20 mg/L treatment, the expressions of HCS, HAH, and SDH were highly significantly upregulated in both strains; AAT was significantly downregulated in both strains. In the 10 mg/L treatment, the expression of AAT was significantly upregulated in both strains, and the expression of AAR was significantly upregulated in FV8 and highly significantly upregulated in FV18. At this time, HCD was significantly down-regulated in FV18 and highly significantly down-regulated in FV8; SR expression was significantly down-regulated in both strains. The relative expression of HDH exhibited was upregulated with increasing Zn2+ concentration in both strains, with the highest relative expression in the 30 mg/L treatment and highly significant increase with increasing Zn2+ concentration in FV8. HCS is the key rate-limiting step in the lysine synthesis pathway in F. filiformis, and the expression of HCS was highly up-regulated at different concentrations of Zn2+ in FV18. In addition to the same regulated genes in two strains above-mentioned, HDH were significantly upregulated and SR downregulated in FV8 in the 20 mg/L treatment, while expressions of these were opposite to those at 20 mg/L. Except for a highly significant upregulation at a Zn2+ concentration of 20 mg/L, the expression of HAH was lower than that of the control group at all concentrations. The SR expression in FV8 was found to be significantly downregulated under various concentrations of Zn2+. While that in FV18 was notably reduced in the 10 mg/L treatment, with the relative expression of SR being the lowest in both strains at this concentration. Notably, the relative expression of both strains was lower than that of the controls at the remaining concentrations, with the exception of the SDH expression, which was higher than that of the controls in the 10 mg/L treatment.

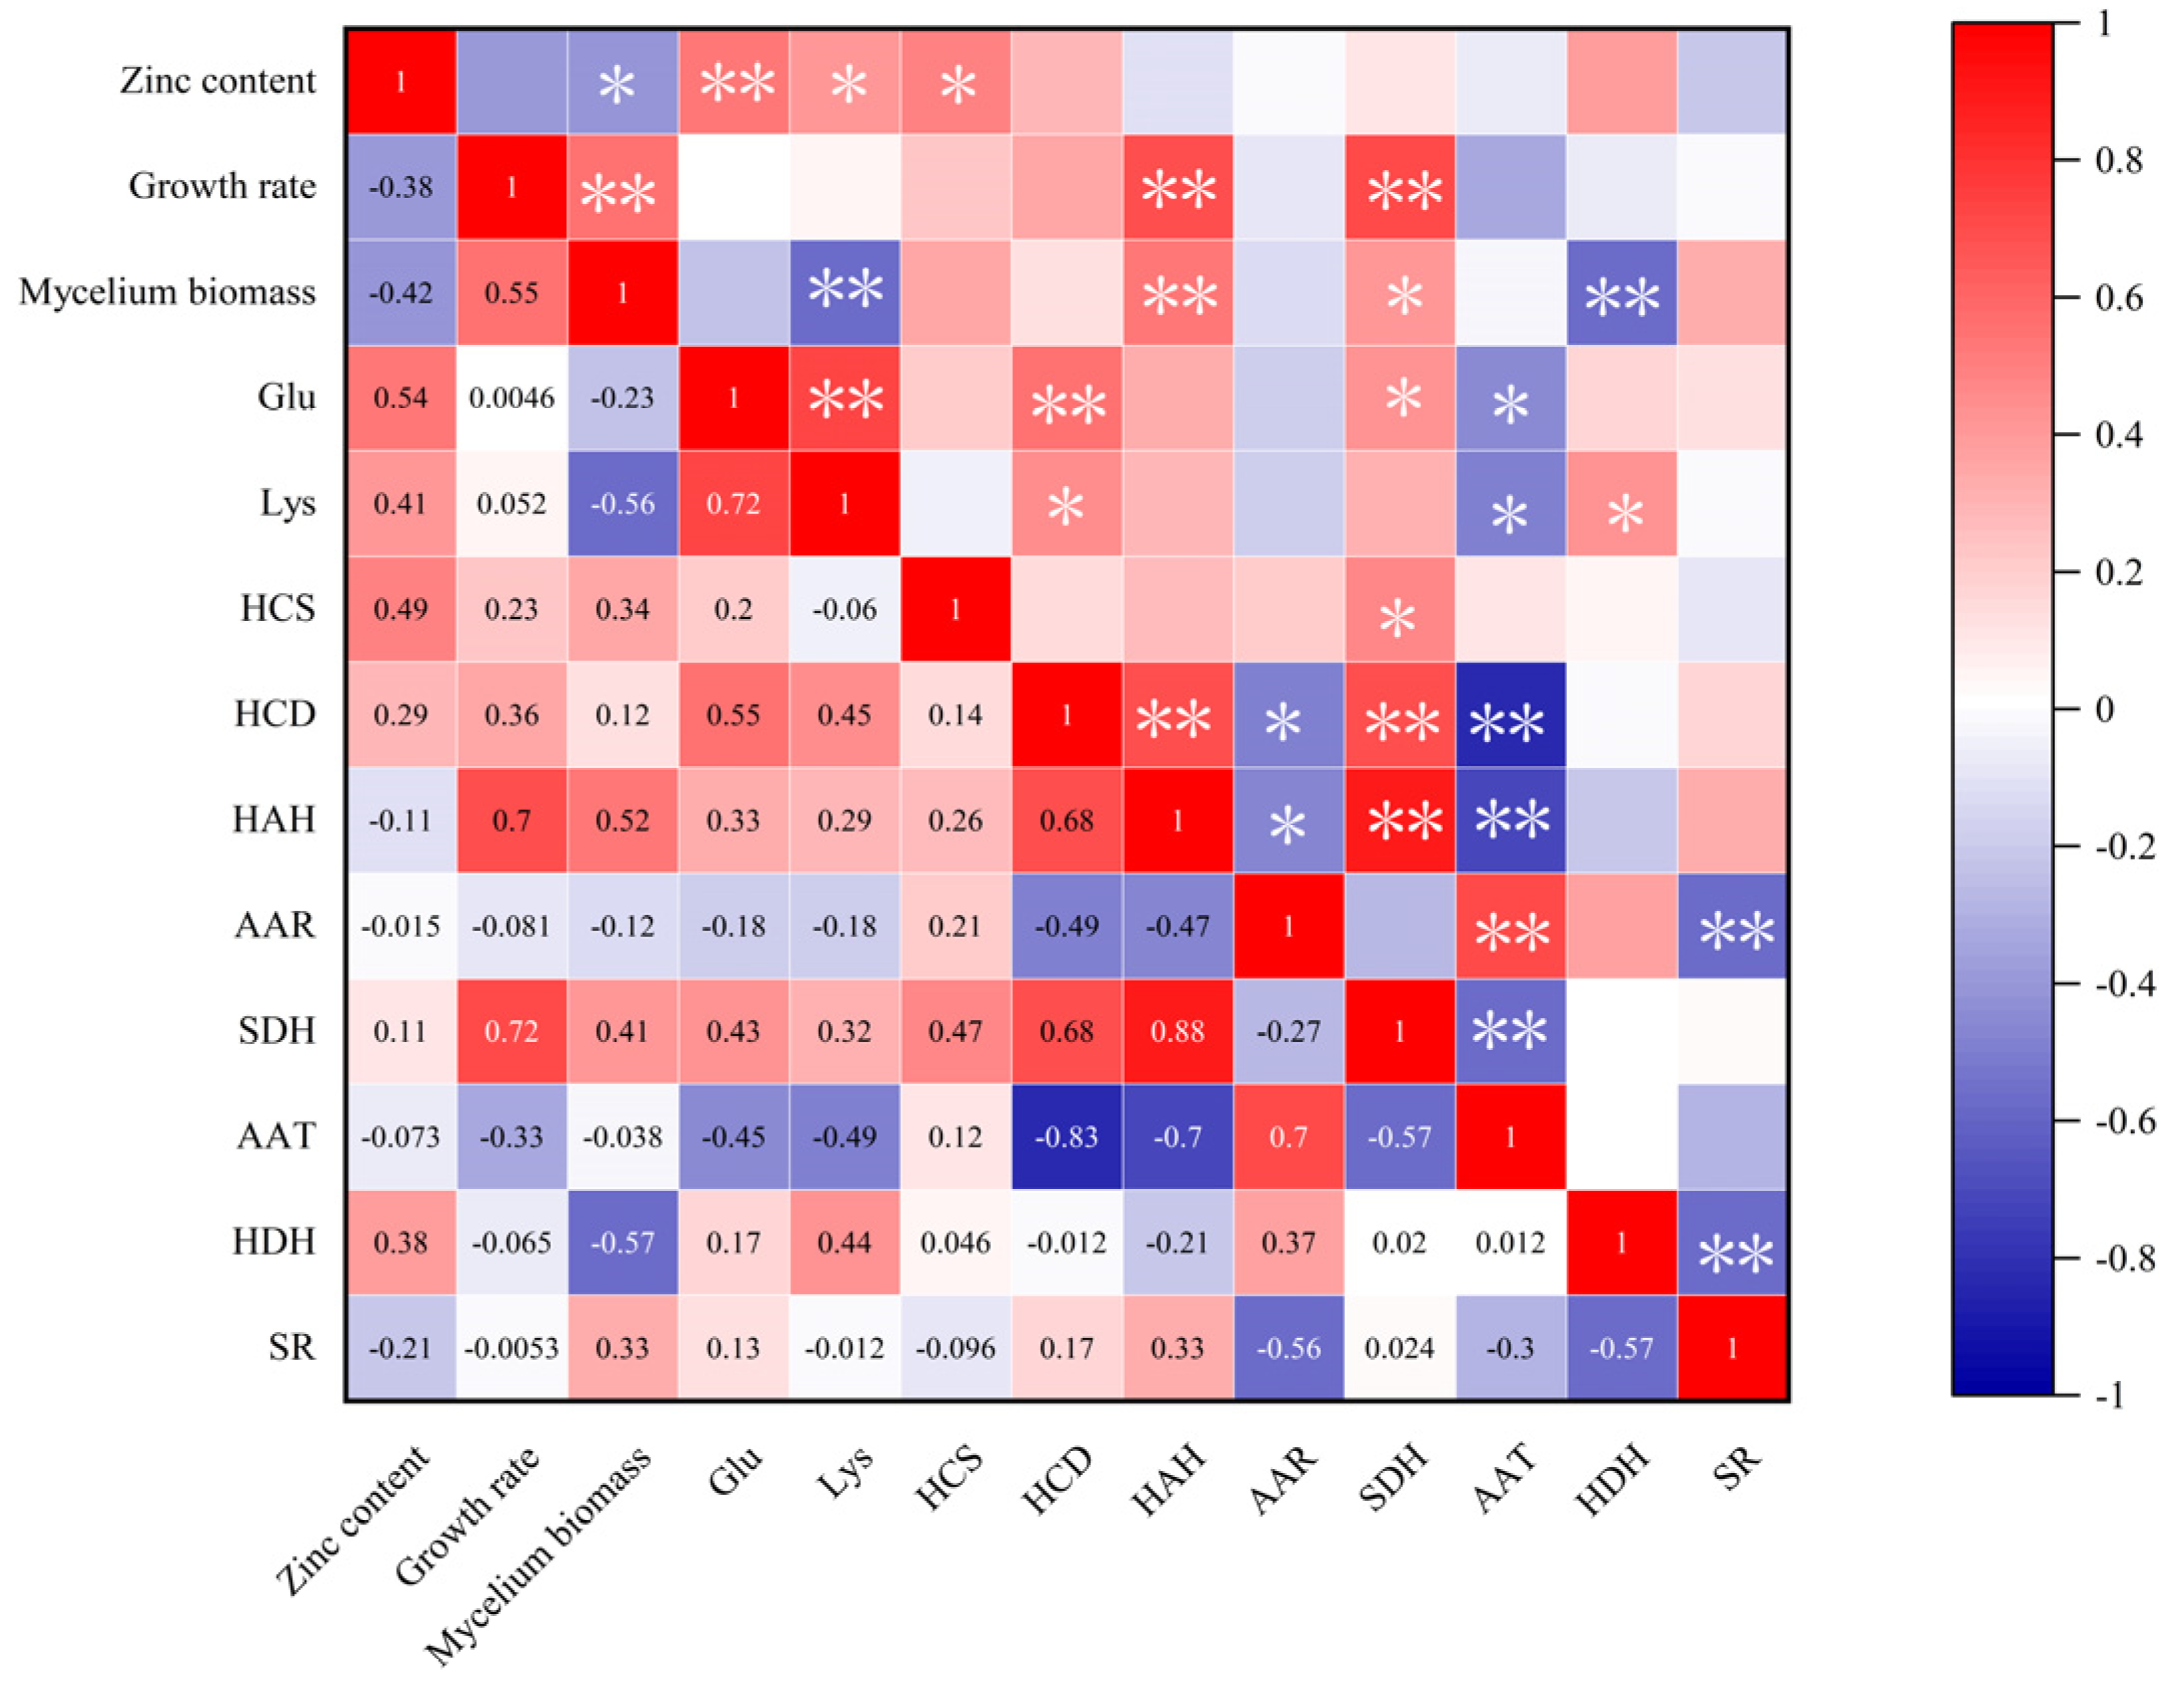
3.7. Correlation Between Lysine Content and Other Measured Indexes Under Different Concentrations of Zn2+ Treatment

There were positive correlations between lysine content and zinc content, growth rate, glutamic acid content and relative expressions of HCD, HAH, SDH and HDH in the key enzyme genes of the lysine synthesis pathway of F. filiformis (Figure 7). Among them, the lysine content of F. filiformis showed a high positive correlation with glutamic acid content with a correlation coefficient of 0.72; the correlation coefficient with zinc content was 0.41 which belonged to a significant positive correlation. And the expressions of HDH and HCD in the key enzyme genes of the lysine synthesis pathway had significant positive correlations with the Lysine content with the correlation coefficients of 0.44 and 0.45. And there was a highly significant negative correlation between Lysine content and mycelia biomass of F. filiformis, with a correlation coefficient of −0.56. A highly significant negative correlation between the relative expression of AAT among its synthesis of key enzyme genes and Lysine content, with a correlation coefficient of −0.49. The correlation between lysine content and mycelial growth rate of F. filiformis was found to be negligible, indicating that lysine content was not associated with mycelia growth rate in this experiment. According to Figure 7, it can be discerned that the glutamic acid content of F. filiformis mycelia exhibited a highly positive correlation with zinc content and HCD and SDH which are the key enzyme genes of the lysine synthesis pathway, with correlation coefficients of 0.55 and 0.43, respectively. Additionally, the glutamic acid content exhibited a significant negative correlation with AAT, with a correlation coefficient of −0.45.

4. Discussion

Currently, studies on exogenous addition of metal ions to edible mushrooms have focused on ion transport [34], element uptake and utilization [35], and metal morphology and structure [36]. There are few studies on the physiological response mechanisms of elements in edible mushrooms, while this aspect is well studied in plants [37,38,39]. Studying the effect of exogenous additions on lysine in F. filiformis has the potential to enhance the quality of F. filiformis. Most of the previous researchers explored from environmental conditions [40], different developmental periods [41,42], etc. However, few studies apply zinc as a direct inducer to modulate biosynthesis. As an important component of microbial metabolic system, zinc not only affects the tricarboxylic acid cycle (TCA) cycle, but also participates in the metabolic activities of F. filiformis. Therefore, the utilization of zinc in the induction of lysine biosynthesis and its regulation mechanism in F. filiformis would be a highly feasible and valuable uptaking. This will provide a basis for the future improvement of the quality of F. filiformis and the subsequent selection and breeding of functional F. filiformis.
The growth of F. filiformis mycelia is promoted by an optimal concentration of Zn2+ [43]. The findings of the study showed that, as the concentration of Zn2+ increased, the mycelia growth rate increased concomitantly, reaching the peak at a concentration of 20 mg/L, after which the growth rate slowed down. An excess of Zn2+ results in an increase in the deposition of chitin in the cell wall [44], inhibiting mycelial elongation. The findings of the study showed that the mycelia of F. filiformis had a significant enrichment capacity for Zinc. The Zinc content of F. filiformis mycelia continued to increase with the rise in Zn2+ concentration, reaching the maximum Zinc content in the 30 mg/L treatment. This may be due to the fact that pH affects zinc solubility and the charge on mycelial cell wall. Acidic environment enhances the ability of mycelium to adsorb Zn2+ but too low pH can inhibit mycelia growth and even lead to cell death [45,46]. Therefore, it can be posited that the rate of Zn2+ enrichment, the sustained enhancement of Zinc content, and the growth inhibition of F. filiformis mycelia may all occur simultaneously. The divergence in the trend of total mycelia and Zinc enrichment rate per unit mass may be due to the prioritization of rapid mycelial growth and biomass synthesis rather than Zinc uptake or storage [47,48], which is a result of the interaction between biomass dynamics and the absorption of elemental mechanisms.
In this experiment, we designed to address the research gaps on the content of various amino acids in F. filiformis mycelia treated with Zn2+, in which we focused on the effects of Zn2+ on the contents of lysine and glutamic acid. The result showed a positive correlation between Zinc content and lysine content. Suitable concentration of Zn2+ can improve the nutritional quality of edible mushrooms [49] which is applicable to F. filiformis. This association is likely attributable to the role of zinc in regulating the TCA cycle within the mitochondrial system. The TCA cycle provides precursors for amino acid synthesis [50], thereby increasing precursors for lysine synthesis indirectly increasing lysine content.
In the 20 mg/L treatment, the mycelia growth and the increase in the content of the measured substances in the wild strain FV18 of F. filiformis were superior to the cultivated strain FV8, compared with the control group, respectively. This may attribute to the genetic diversity of the wild strains and its flexibility of the physiological response to zinc. FV18 can be used as a breeding material for the development of new F. filiformis varieties.
In the combination with the treatment group exhibiting the highest lysine content (that is the Zn2+ concentration of 20 mg/L), it was found that the expression of AAT, a key enzyme gene within the lysine synthesis pathway, was significantly downregulated. This downregulation exhibited a substantial and significant negative correlation with the lysine and glutamic acid content. It was also found that the contents of glutamic acid and lysine showed highly positive correlation. Glutamic acid, an amino donor, has been identified as a predominant catalysis in AAT-mediated reactions [51]. The process of AAT catalysis results in the formation of α-aminoadipic acid, which serves as a substrate for lysine synthesis. while Zn2+ inhibits the expression of AAT, which may have been observed to regulate glutamic acid content through a negative feedback mechanism. This will increase the production of the catalytic intermediate α-aminoadipic acid. However, the precise mechanism underlying this regulatory process remains to be elucidated.
Although previous studies have indicated that HCS, a rate-limiting enzyme gene within the lysine synthesis pathway [52,53], is likely to be a light-responsive element in the promoter region [24], this experiment revealed that HCS was upregulated in response to Zn2+ stimulation. A significant positive correlation has been observed between HCS and zinc content. Zinc has been found directly activated the rate-limiting step for lysine synthesis. we hypothesized that this gene might be affinity for Zn2+ and have related Zn2+ response elements. At a Zn2+ concentration of 20 mg/L, HCD and HAH were stimulated, resulting in upregulated responses. Both HCD and HAH showed a significant positive correlation with the lysine content. It has been demonstrated that HCD and HAH can establish the carbon skeleton foundation for lysine formation [23]. Therefore, zinc has been demonstrated to interact with both of genes to increase the carbon skeleton for lysine synthesis. Among them, the expression of HCD was consistent with the trend of lysine content, so it can be a key gene for carbon skeleton formation in lysine synthesis affected by Zn2+. In contrast to the previously reported involvement of zinc in lysine metabolism in Escherichia coli [22], HDH demonstrated a concentration-dependent response to Zn2+ in F. filiformis. HDH encoding F. filiformis high isocitrate dehydrogenase [23] was found to be specifically activated by zinc. Zn2+ can activate the related mitochondrial dehydrogenase activity [54], and SDH in the lysine synthesis pathway of F. filiformis mycelium is in a large family of proteins that contain both dehydrogenases and oxidoreductases [23]. In this experiment, it was hypothesized that Zn2+ could induce the positive expression of SDH, thereby activating the key enzyme it encodes, but the mechanism of action needs to be further verified by combining biological information analysis and genetic transformation [55].
This study offers preliminary insights into the impacts of zinc on various physiological characteristics of F. filiformis mycelia, including its growth pattern, zinc enrichment, and lysine synthesis regulation. Previous studies showed that zinc in F. filiformis mostly exists in the organic state [13], which can be utilized by human. Thus, F. filiformis have the potential to be a safe natural zinc supplement. The highest lysine content in F. filiformis mycelium was found in the 20 mg/L treatment. That could be used in the development of safe zinc supplement together with high-lysine F. filiformis products. In the next step, we will explore the effect of Zn2+ on the mechanism of lysine synthesis in the fruiting body growth and development stage of F. filiformis. In addition, molecular markers combining zinc enrichment and lysine synthesis will be developed to accelerate the selection and breeding of functional F. filiformis strains, to shorten the development cycle of new varieties.

5. Conclusions

1.
Zn2+ concentration of 30 mg/L resulted in the highest Zinc content in F. filiformis mycelia. At a Zn2+ concentration of 20 mg/L, the growth and the lysine content of the F. filiformis mycelia was the greatest. At this concentration, Zn2+ stimulated the upregulation of HDH and HCD which are key enzyme genes of the lysine synthesis pathway in the F. filiformis mycelia, while the inhibition of AAT made it negatively correlated with the lysine content. Zn2+ synergistically regulated the expression of HDH, HCD, and AAT to affect lysine synthesis in F. filiformis mycelia.
2.
The wild strain FV18 exhibited superior zinc-rich growth characteristics in comparison to the cultivated strain FV8, which could be utilized as a valuable breeding material to develop zinc-rich or high lysine content strains of F. filiformis.

Author Contributions

Conceptualization, Y.Q. and F.Y.; funding acquisition, F.Y.; methodology, Y.Q., X.S. and S.Q.; data curation, Y.Q.; writing—original draft preparation, Y.Q.; writing—review and editing, F.Y. and L.L. All authors have read and agreed to the published version of the manuscript.

Funding

This study was supported by Changbai Mountains Talent Project—Leaders in Science and Technology Innovation.

Data Availability Statement

The original contributions presented in the study are included in the article.

Acknowledgments

The authors thank the reviewers for their valuable suggestions. All individuals included in this section have consented to the acknowledgement.

Conflicts of Interest

The authors declare no conflicts of interest.

References

  1. Dai, Y.C.; Yang, Z.L. Notes on the nomenclature of five important edible fungi in China. Mycosystema 2018, 37, 1572–1577. [Google Scholar] [CrossRef]
  2. Vondruška, J.; Šíma, J.; Kobera, M.; Rokos, L.; Šeda, M.; Svoboda, L. Detrimental and essential elements in fruiting bodies of wild-growing fungi Coprinus comatus, Flammulina velutipes, and Armillaria ostoyae. J. Environ. Sci. Health Part B Pestic. Food Contam. Agric. Wastes 2022, 57, 243–251. [Google Scholar] [CrossRef] [PubMed]
  3. Malinovsky, A.V. Why Threonine Is an Essential Amino Acid in Mammals and Birds: Studies at the Enzyme Level. Biochemistry 2018, 83, 795–799. [Google Scholar] [CrossRef] [PubMed]
  4. Li, B.; Tan, Y.; Sun, W.; Fu, Y.; Miao, L.; Cai, L. The role of zinc in the prevention of diabetic cardiomyopathy and nephropathy. Toxicol. Mech. Methods 2013, 23, 27–33. [Google Scholar] [CrossRef]
  5. Khan, S.T.; Malik, A.; Alwarthan, A.; Shaik, M.R. The enormity of the zinc deficiency problem and available solutions; an overview. Arab. J. Chem. 2022, 15, 103668. [Google Scholar] [CrossRef]
  6. Gupta, S.; Brazier, A.K.M.; Lowe, N.M. Zinc deficiency in low- and middle-income countries: Prevalence and approaches for mitigation. J. Hum. Nutr. Diet. 2020, 33, 624–643. [Google Scholar] [CrossRef]
  7. Lee, M.-H.; Chao, C.-H.; Hsu, Y.-C.; Lu, M.-K. Production, characterization, and functions of sulfated polysaccharides from zinc sulfate enriched cultivation of Antrodia cinnamomea. Int. J. Biol. Macromol. 2020, 159, 1013–1021. [Google Scholar] [CrossRef]
  8. Zhang, M.Y.; Hou, M.J.; Shi, H.J.; Jia, L.; Zhang, J.J. Preparation technology and in vitro antioxidant activities of zinc polysaccharides chewable tablets from red flat mushroom (Pleurotus djamor). J. Food Saf. 2022, 42, 108–116. [Google Scholar]
  9. Li, H.; Shi, L.; Tang, W.; Xia, W.; Zhong, Y.; Xu, X.; Xie, B.; Tao, Y. Comprehensive Genetic Analysis of Monokaryon and Dikaryon Populations Provides Insight Into Cross-Breeding of Flammulina filiformis. Front. Microbiol. 2022, 13, 887259. [Google Scholar] [CrossRef]
  10. Liu, X.R.; Yang, Z.C.; Xiao, S.X.; Cai, P.; Xie, B.G.; Jiang, Y.J. A New High-yielding Flammulina velutipes Cultivar ‘Nongjin 7’. Acta Hortic. Sin. 2018, 45, 1219–1220. [Google Scholar] [CrossRef]
  11. Li, Y. The Role of Edible Fungi in Building the Overall Situation of Food Security—Theme Report on Practicing “Big Food Concept” and Exploring the Development Path of Edible Fungi Industry. J. Fungal Res. 2022, 20, 157–159. [Google Scholar] [CrossRef]
  12. Feng, G.Z.; Shi, H.; Zheng, J.S.; Shi, Y. Research progress of metal ion on the growth and development of edible fungi. Food Res. Dev. 2021, 42, 193–198. [Google Scholar]
  13. Liu, F.; Pei, F.; Mariga, A.M.; Gao, L.; Chen, G.; Zhao, L. Separation and speciation analysis of zinc from Flammulina velutipes. J. Food Drug Anal. 2015, 23, 630–635. [Google Scholar] [CrossRef] [PubMed]
  14. Dong, Z.; Xiao, Y.; Wu, H. Selenium accumulation, speciation, and its effect on nutritive value of Flammulina velutipes (Golden needle mushroom). Food Chem. 2021, 350, 128667. [Google Scholar] [CrossRef]
  15. Hu, T.; Hui, G.; Li, H.; Guo, Y. Selenium biofortification in Hericium erinaceus (Lion’s Mane mushroom) and its in vitro bioaccessibility. Food Chem. 2020, 331, 127287. [Google Scholar] [CrossRef] [PubMed]
  16. Budzyńska, S.; Siwulski, M.; Gąsecka, M.; Magdziak, Z.; Kalač, P.; Niedzielski, P.; Mleczek, M. Biofortification of Three Cultivated Mushroom Species with Three Iron Salts-Potential for a New Iron-Rich Superfood. Molecules 2022, 27, 2328. [Google Scholar] [CrossRef]
  17. Hu, Y.J.; Chen, M.F.; Qiang, Y.; Li, H.Y.; Liu, J.; Chen, F.X. Alleviation mechanisms of Zinc-selenium interaction on the cadmiu toxicity in rice under cadmium stress. Biotechnol. Bull. 2022, 38, 143–152. [Google Scholar] [CrossRef]
  18. Jiang, P.Y.; Shang, X.D.; Song, C.Y.; Wang, R.J.; Yu, H.L.; Li, Q.Z.; Zhang, L.J.; Liu, J.Y.; Tan, Q. Advances in studies on lysine biosynthesis pathway in fungi. Microbiol. China 2020, 47, 915–922. [Google Scholar] [CrossRef]
  19. Popovic, A.V.; Camagajevac, I.S.; Vukovic, R.; Matic, M.; Velki, M.; Gupta, D.K.; Galic, V.; Loncaric, Z. Biochemical and molecular responses of the ascorbate-glutathione cycle in wheat seedlings exposed to different forms of selenium. Plant Physioology Biochem. 2024, 208, 108460. [Google Scholar] [CrossRef]
  20. Kobayashi, K.; Nishikawa, M. Promotion of ε-poly-l-lysine production by iron in Kitasatospora kifunense. World J. Microbiol. Biotechnol. 2007, 23, 1033–1036. [Google Scholar] [CrossRef]
  21. Ekwealor, I.A.; Obeta, J.A.N. Effect of vitamins and bivalent metals on lysine yield in Bacillus megaterium. Afr. J. Biotechnol. 2007, 6, 1348–1351. [Google Scholar]
  22. Rihacek, M.; Kosaristanova, L.; Fialova, T.; Rypar, T.; Sterbova, D.S.; Adam, V.; Zurek, L.; Cihalova, K. Metabolic adaptations of Escherichia coli to extended zinc exposure: Insights into tricarboxylic acid cycle and trehalose synthesis. BMC Microbiol. 2024, 24, 384. [Google Scholar] [CrossRef] [PubMed]
  23. Liu, J.Y.; Wang, R.J.; Zhang, D.; Shang, X.D.; Tan, Q. Analysis of genes related to lysine biosynthesis based on whole genome of Flammulina velutipes. Microbiol. China 2016, 43, 2225–2233. [Google Scholar] [CrossRef]
  24. Tao, Y.X.; Duan, J.Y.; Li, Y.N.; Li, Z.Y.; Song, H.B.; Zhang, Q.S.; Huang, J.H.; Gao, L.L.; Xie, B.G. Identification of genes in Flammulina filiformis L-lysine biosynthesis pathway and their expression in response to light conditions. Acta Edulis Fungi 2018, 25, 1–8. [Google Scholar] [CrossRef]
  25. Jiang, P.Y.; Shang, X.D.; Song, C.Y.; Xu, Z.; Yu, H.L.; Li, Q.Z.; Zhang, L.J.; Tan, Q.; Wang, R.J.; Liu, J.Y. Effect of low temperature on gene expression in the lysine synthesis pathway of Flammulina filiformis. Acta Edulis Fungi 2020, 27, 24–30. [Google Scholar] [CrossRef]
  26. Liu, J.Y.; Jiang, P.Y.; Wang, R.J.; Xu, Z.; Zhang, D.; Song, C.Y.; Yu, H.L.; Zhang, L.J.; Zhang, M.Y.; Tan, Q. Effect of α-ketoglutaric Acid on mycelial growth and lysine synthesis of Flammulina filiformis. Acta Edulis Fungi 2019, 26, 10–16. [Google Scholar] [CrossRef]
  27. Fan, H.; Ge, F.; Wu, T.; Liu, Y.; Tian, L.; Liu, Y.; Xiang, T.; Yu, H.; Shi, L.; He, Q.; et al. The AMP-Activated Protein Kinase (AMPK) Positively Regulates Lysine Biosynthesis Induced by Citric Acid in Flammulina filiformis. J. Fungi 2023, 9, 340. [Google Scholar] [CrossRef]
  28. Xu, Z.; Zhang, L.J.; Shang, X.D.; Liu, J.Y.; Zhang, D.; Yang, H.; Yu, H.L.; Zhang, M.Y.; Wang, R.J. Gradation and evaluation for Flammulina filiformis DUS testing traits. Mycosystema 2019, 38, 658–668. [Google Scholar] [CrossRef]
  29. GB 5009.268-2016, 20; National Standard for Food Safety Determination of Various Elements in Food. China Food and Drug Administration: Beijing, China, 2016.
  30. GB 5009.124-2016, 12; National Standard for Food Safety Determination of Amino Acids in Foods. China Food and Drug Administration: Beijing, China, 2016.
  31. Lin, H.; Yu, X.; Fang, J.; Lu, Y.; Liu, P.; Xing, Y.; Wang, Q.; Che, Z.; He, Q. Flavor Compounds in Pixian Broad-Bean Paste: Non-Volatile Organic Acids and Amino Acids. Molecules 2018, 23, 1299. [Google Scholar] [CrossRef]
  32. Luo, S.Y.; Liang, Y.Q.; Chen, B.S.; Lin, M.T.; Liang, J.X.; Qiu, J.K. Accumulation and Migration of Heavy Metals in Mangrove Sediments and Plants in the Nanshan Town, Xuwen. Trop. Geogr. 2019, 39, 347–356. [Google Scholar] [CrossRef]
  33. Trumbo, P.; Schlicker, S.; Yates, A.A.; Poos, M. Dietary reference intakes for energy, carbohydrate, fiber, fat, fatty acids, cholesterol, protein and amino acids. J. Am. Diet. Assoc. 2002, 102, 1621–1630. [Google Scholar] [CrossRef]
  34. Robinson, J.R.; Isikhuemhen, O.S.; Anike, F.N. Fungal-Metal Interactions: A Review of Toxicity and Homeostasis. J. Fungi 2021, 7, 225. [Google Scholar] [CrossRef] [PubMed]
  35. Oliveira, A.P.d.; Naozuka, J. Preliminary results on the feasibility of producing selenium-enriched pink (Pleurotus djamor) and white (Pleurotus ostreatus) oyster mushrooms: Bioaccumulation, bioaccessibility, and Se-proteins distribution. Microchem. J. 2019, 145, 1143–1150. [Google Scholar] [CrossRef]
  36. de Oliveira, A.P.; Naozuka, J.; Landero-Figueroa, J.A. Effects of Se(IV) or Se(VI) enrichment on proteins and protein-bound Se distribution and Se bioaccessibility in oyster mushrooms. Food Chem. 2022, 383, 132582. [Google Scholar] [CrossRef] [PubMed]
  37. Wang, Y.; Miao, M.; Fang, H.; Zheng, Y.; Liu, L.; Gu, X.; Xu, X.; Liu, X.; Tang, Y.; Lai, Q.; et al. Physiological and metabolomic insights into molecular mechanisms of root sensitivity to zinc toxicity in rice (Oryza sativa L.). J. Hazard. Mater. 2025, 492, 138204. [Google Scholar] [CrossRef]
  38. Zhou, Y.; Nie, K.; Geng, L.; Wang, Y.; Li, L.; Cheng, H. Selenium’s Role in Plant Secondary Metabolism: Regulation and Mechanistic Insights. Agronomy 2025, 15, 54. [Google Scholar] [CrossRef]
  39. Zhang, Z.; Li, L.; Qiu, S.; Sun, Y.; Zhang, R.; Chen, D.; Chen, P.; Song, Y.; Zeng, R.; Lu, L. BAHD acyltransferase OsSLG mediates rice cadmium tolerance by integrating the brassinosteroid and salicylic acid pathway. Plant Sci. 2025, 356, 112503. [Google Scholar] [CrossRef]
  40. Liu, J.Y.; Chang, M.C.; Meng, J.L.; Feng, C.P.; Wang, Y. A Comparative Proteome Approach Reveals Metabolic Changes Associated with Flammulina velutipes Mycelia in Response to Cold and Light Stress. J. Agric. Food Chem. 2018, 66, 3716–3725. [Google Scholar] [CrossRef]
  41. Liu, F.; Wang, W.; Chen, B.Z.; Xie, B.G. Homocitrate synthase expression and lysine content in fruiting body of different developmental stages in Flammulina velutipes. Curr. Microbiol. 2015, 70, 821–828. [Google Scholar] [CrossRef]
  42. Liu, J.; Li, Q.; Jiang, P.; Xu, Z.; Zhang, D.; Zhang, L.; Zhang, M.; Yu, H.; Song, C.; Tan, Q.; et al. Overexpression of the saccharopine dehydrogenase gene improves lysine biosynthesis in Flammulina velutipes. J. Basic Microbiol. 2019, 59, 890–900. [Google Scholar] [CrossRef]
  43. Yang, H.; Zhang, M.Y.; Song, C.Y.; Liu, J.Y.; Xu, Z.; Shang, X.D. Effects of Fe2+, Zn2+ and Ca2+ on mycelium growth and its biological enrichment in mycelia of three edible mushroom. Acta Edulis Fungi 2017, 24, 27–33. [Google Scholar] [CrossRef]
  44. Lanfranco, L.; Balsamo, R.; Martino, E.; Perotto, S.; Bonfante, P. Zinc ions alter morphology and chitin deposition in an ericoid fungus. Eur. J. Histochem. 2002, 46, 341–350. [Google Scholar] [CrossRef] [PubMed]
  45. Kapoor, A.; Viraraghavan, T. Fungal biosorption—An alternative treatment option for heavy metal bearing wastewaters: A review. Bioresour. Technol. 1995, 53, 195–206. [Google Scholar] [CrossRef]
  46. Fomina, M.; Gadd, G.M. Biosorption: Current perspectives on concept, definition and application. Bioresour. Technol. 2014, 160, 3–14. [Google Scholar] [CrossRef]
  47. Gadd, G.M. Metals, minerals and microbes: Geomicrobiology and bioremediation. Microbiology 2010, 156, 609–643. [Google Scholar] [CrossRef] [PubMed]
  48. Zhao, H.; Eide, D. The ZRT2 Gene Encodes the Low Affinity Zinc Transporter in Saccharomyces cerevisiae. J. Biol. Chem. 1996, 271, 23203–23210. [Google Scholar] [CrossRef]
  49. Ramezannejad, R.; Pourianfar, H.R.; Rezaeian, S. Interactive Effects of Selenium, Zinc, and Iron on the Uptake of Selenium in Mycelia of the Culinary-Medicinal Winter Mushroom Flammulina velutipes (Agaricomycetes). Int. J. Med. Mushrooms 2023, 25, 75–87. [Google Scholar] [CrossRef]
  50. Igamberdiev, A.U.; Eprintsev, A.T. Organic Acids: The Pools of Fixed Carbon Involved in Redox Regulation and Energy Balance in Higher Plants. Front. Plant Sci. 2016, 7, 1042. [Google Scholar] [CrossRef]
  51. Wang, J.; Chen, C. Biosorption of heavy metals by Saccharomyces cerevisiae: A review. Biotechnol. Adv. 2006, 24, 427–451. [Google Scholar] [CrossRef]
  52. Ehmann, D.E.; Gehring, A.M.; Walsh, C.T. Lysine biosynthesis in Saccharomyces cerevisiae: Mechanism of alpha-aminoadipate reductase (Lys2) involves posttranslational phosphopantetheinylation by Lys5. Biochemistry 1999, 38, 6171–6177. [Google Scholar] [CrossRef]
  53. Hogg, R.W.; Broquist, H.P. Homocitrate Formation in Neurospora crassa: Relation to lysine biosynthesis. J. Biol. Chem. 1968, 243, 1839–1845. [Google Scholar] [CrossRef] [PubMed]
  54. Brown, A.M.; Kristal, B.S.; Effron, M.S.; Shestopalov, A.I.; Ullucci, P.A.; Sheu, K.F.R.; Blass, J.P.; Cooper, A.J.L. Zn2+ Inhibits α-Ketoglutarate-stimulated Mitochondrial Respiration and the Isolated α-Ketoglutarate Dehydrogenase Complex. J. Biol. Chem. 2000, 275, 13441–13447. [Google Scholar] [CrossRef] [PubMed]
  55. Chen, Y.; Ju, H.; Li, H.; Xu, C.; Jia, H.; Xian, L.; Yuan, C.; Guo, Z.; Zhang, X.; Yu, Y.; et al. Light and phytochrome PHY control the production of edible fungus Flammulina filiformis by regulating the morphogenesis of fruiting bodies and l-lysine accumulation. J. Photochem. Photobiol. B Biol. 2024, 261, 113051. [Google Scholar] [CrossRef] [PubMed]
Figure 1. Mycelia growth of F. filiformis on PDA plates with different concentrations of Zn2+. (ad) is the cultivated strain FV8, (eh) is the wild strain FV18, and the Zn2+ concentration in PDA plates from left to right is 0, 10, 20, and 30 mg/L.
Agronomy 15 01107 g001
Figure 2. Zinc content under different Zn2+ concentrations of F. filiformis mycelia. (a,c) is the cultivated strain FV8, (b,d) is the wild strain FV18, and the two images above are about Zinc content per unit mass of F. filiformis mycelia, the two images below are about the zinc content under total mycelia of F. filiformis.
Agronomy 15 01107 g002
Figure 3. Amino acid content under different Zn2+ concentrations of F. filiformis mycelia. (a) is the amino acid content per unit mass of F. filiformis mycelium, (b) is the amino acid content under total mycelium of F. filiformis.
Agronomy 15 01107 g003
Figure 4. Effects of different Zn2+ concentrations on lysine content of F. filiformis mycelia. Note: Different lowercase letters in the same column indicate that the difference between treatments is statistically significant (p < 0.05).
Agronomy 15 01107 g004
Figure 5. Effects of different Zn2+ concentrations on glutamic content of F. filiformis mycelia. Note: Different lowercase letters in the same column indicate that the difference between treatments is statistically significant (p < 0.05).
Agronomy 15 01107 g005
Figure 6. Relative expression of key enzyme genes in lysine synthesis under different concentrations of Zn2+ treatment. 0 mg/L, 10 mg/L, 20 mg/L, and 30 mg/L were expressed as the added concentrations of Zn2+ in PDA medium, (a) is the AAR relative expression of F. filiformis mycelium, (b) is the SR relative expression of F. filiformis mycelium, (c) is the SDH relative expression of F. filiformis mycelium, (d) is the HCD relative expression of F. filiformis mycelium, (e) is the HDH relative expression of F. filiformis mycelium, (f) is the AAT relative expression of F. filiformis mycelium, (g) is the HCS relative expression of F. filiformis mycelium, (h) is the HAH relative expression of F. filiformis mycelium. * and ** were expressed at 5% and 1% levels compared with the control groups.
Agronomy 15 01107 g006
Figure 7. Heatmap of correlation coefficient between Lysine content and other measured indicators. This heatmap based on Pearson correlation coefficients, * and ** were expressed at 5% and 1% significant levels.
Agronomy 15 01107 g007
Table 1. Different Concentrations of Zn2+.
GroupCKIIIIII
Concentrations of Zn2+ (mg/L)0102030
ZnSO4·7H2O (ml/L)00.511.5
Table 2. Sequence of Gene Primers.
Gene IDForward Primer (5’-3’)Reverse Primer (5’-3’)
HCSTCACACACAAGGCAGGTATTCCATATCGCGTGAGACCAAAGT
HCDTCCAAGGCTGGTGCTATTGCCGGATACAAACATGGGTATGA
HAHCGCCCTCTTTGGTTCAGTTATCGGACATTCCCGTAGAGAT
SDHGGCTTCAGATTCAGGCTATCAGAGTGGAGTCACCAGTCTTTC
AARCAGACGTGATAAGGACGAAGAGTCTTTGATAAGGCGACGATACTT
AATCGAGCAAGAATCCAAACCTCTCGCAACCCACAAGTTCATTTC
HDHAACGGGCGTCAAGAAGAATAGCCTACCGAACGAACAGTTTCTC
SRGAGATCCTGAGTGGCCATTATCGGTATCTTCCGTGGTGGAATAG
SPRYpCACAGTAATATCTCCAGACGCGTCCTACCACTCCTTCGCCTGTTG
Table 3. Effects of different Zn2+ concentrations on the growth of F. filiformis mycelia.
Concentrations of Zn2+ (mg/L)Group
FV8FV18
Mycelia Growth Rate (mm/d)Mycelia Biomass (g)Mycelia Growth Rate (mm/d)Mycelia Biomass (g)
09.255 ± 0.206 bc0.050 ± 0.002 a9.105 ± 0.138 c0.071 ± 0.004 b
109.540 ± 0.083 b0.053 ± 0.003 a9.527 ± 0.090 b0.077 ± 0.006 ab
2010.007 ± 0.163 a0.056 ± 0.006 a10.137 ± 0.180 a0.082 ± 0.006 a
309.038 ± 0.239 c0.037 ± 0.001 b8.910 ± 0.157 c0.057 ± 0.003 c
Note: The data in the table are mean ± standard error. The data are subjected to Duncan test. Different lowercase letters in the same column indicate that the difference between treatments is significant statistically (p < 0.05).
Table 4. Effects of different Zn2+ concentrations on Zinc bio-concentration factor of F. filiformis mycelia.
Concentrations of Zn2+ (mg/L)Zinc Enrichment Rate per Unit Mass of Mycelia (100%)Zinc Enrichment Rate Under Total Mycelia (100%)
FV8FV18FV8FV18
101.207 ± 0.188 b1.453 ± 1.058 a0.338 ± 0.045 a0.589 ± 0.065 a
201.243 ± 0.172 b1.487 ± 0.330 a0.429 ± 0.074 a0.672 ± 0.018 a
301.69 ± 0.197 a2.253 ± 0.451 a0.386 ± 0.066 a0.564 ± 0.061 a
Note: The data in the table are mean ± standard error. The data are subjected to Duncan test. Different lowercase letters in the same column indicate that the difference between treatments is significant statistically (p < 0.05).
Disclaimer/Publisher’s Note: The statements, opinions and data contained in all publications are solely those of the individual author(s) and contributor(s) and not of MDPI and/or the editor(s). MDPI and/or the editor(s) disclaim responsibility for any injury to people or property resulting from any ideas, methods, instructions or products referred to in the content.

