Article

Effects of Wood Ash Fertilizer on Element Dynamics in Soil Solution and Crop Uptake

1
Graduate School of Agriculture, Tohoku University, Sendai 980-8572, Japan
2
Graduate School of Environmental Studies, Tohoku University, Sendai 980-8579, Japan
3
Tohoku Electric Industry Co., Ltd., Sendai 981-0113, Japan
4
Kyushu Synchrotron Light Research Center, Tosu 841-0005, Japan
*
Author to whom correspondence should be addressed.
Agronomy 2025, 15(5), 1097; https://doi.org/10.3390/agronomy15051097
Submission received: 10 March 2025 / Revised: 4 April 2025 / Accepted: 17 April 2025 / Published: 30 April 2025
(This article belongs to the Special Issue Heavy Metal Pollution and Prevention in Agricultural Soils)

Abstract

:
Wood ash, a byproduct of woody biomass power generation, has potential as an alternative K fertilizer due to its high K content and pH-raising properties. However, concerns remain about heavy metal contaminants like Cr and the limited understanding of element dynamics in soil–solution–crop systems after wood ash’s application. This study examined the effects of 1% (w/w) wood ash on element dynamics and komatsuna (Brassica rapa var. perviridis) uptake in low-K soil through a pot experiment. XRD was used to analyze mineral composition, SEM-EDS to observe surface and elemental properties, and XANES to examine Cr speciation in wood ash. Soil solution analysis covered macro- and micronutrients, heavy metals, anions, pH, and DOC, while crop element concentrations and aboveground dry weight were also quantified. The chemical speciation of Cu and Cr in a soil solution was modeled using Visual MINTEQ. Wood ash significantly increased K concentrations (from 17 mg/L to 650 mg/L) in the soil solution, along with Ca, Mg, P, and Mo, while reducing Ni, Mn, Zn, and Cd levels. Komatsuna K uptake surged from 123 mg/kg to 559 mg/kg, leading to a 3.31-fold biomass increase. Notably, the Cd concentration in the crops dropped significantly from 0.709 to 0.057 mg/kg, well below the Codex standard of 0.2 mg/kg. Although Cu and Cr concentrations rose in the soil solution, crop uptake remained low due to >99% complexation with fulvic acid, as confirmed by Visual MINTEQ modeling. This study confirms that wood ash is an effective K fertilizer, but emphasizes the need for risk mitigation strategies to ensure safe and sustainable agricultural application.

1. Introduction

Since the Paris Agreement, over 100 countries have committed to carbon neutrality by 2050, aiming to limit global temperature increases to within 1.5 °C by reducing fossil fuel dependence [1]. Woody biomass is gaining traction as a renewable energy source, particularly in power generation and heating [2]. In Japan, the use of woody biomass has expanded rapidly, with approximately 130 biomass power plants operating across the country as of 2019 [3]. However, the growing reliance on woody biomass has led to a substantial increase in wood ash production [4].
Globally, the primary and secondary wood industries, along with pulp and paper sectors, generate millions of tons of wood ash annually—an estimated 3–5 million tons in the United States [5] and around 200,000 tons in Sweden [6]. The majority of this ash is landfilled, with over 80% of boiler ash from U.S. pulp and paper mills disposed of in landfills or lagoons [5]. Rising disposal costs and the limited availability of landfill sites have driven interest in alternative uses for wood ash.
Japan has one of the highest fertilizer application rates globally, yet relies heavily on imports [7]. Recently, sharp increases in international fertilizer prices have raised concerns about long-term agricultural sustainability [8]. The high-dose application of K fertilizers has led to economic challenges [9]. Therefore, cost-effective, environmentally friendly, and sustainable approaches are needed to enhance the bioavailable K content in the soil while reducing fertilizer use. Various kinds of wood ash have been explored as potential alternative fertilizers because of their high K content [10,11]. Additionally, wood ash has been used as a soil amendment, as its alkalinity raises soil pH by neutralizing acidity through carbonate dissolution [12]. Several studies suggest that wood ash enhances nutrient availability, pH stability, and nitrogen mineralization, leading to improved crop growth [13]. However, in a soil column experiment and a field trial with wood ash application, it was observed that K and Ca leached from the surface soil to the lower soil layers over time [14]. Therefore, the long-term monitoring of nutrient dynamics is necessary for the effective application of wood ash as a fertilizer.
Despite the aforementioned benefits, heavy metal contamination poses a major barrier to widespread wood ash application in agriculture [15]. Wood fly ash (WBFA) from 63 samples in 27 studies has been reported to contain toxic metals, including chromium (Cr), copper (Cu), and cadmium (Cd) [4]. Hexavalent chromium (Cr(VI)), a particularly hazardous form of Cr, has been detected in aqueous extracts of wood ash under nitric acid treatment [16].
However, in addition to the beneficial effects of wood ash application, it is essential to consider its potential adverse impacts on the natural environment and its effects on crop nutrient uptake. The environmental management of ash is often constrained by the presence of toxic trace elements and various inorganic compounds formed through thermochemical reactions during biomass combustion [17]. Wood ash may contain heavy metals [18], such as cadmium (Cd), chromium (Cr) [4], and copper (Cu) [4], raising concerns about their potential accumulation in plants [13]. According to Mayer et al. [18], most wood ash is unsuitable for direct application due to its high Cd and nickel (Ni) content. Additionally, one study on the effects of wood ash fertilization on plant uptake found that at the highest application rate (33.7 t wood ash ha−1), plant Cd concentrations significantly increased, limiting the agricultural use of wood ash as a fertilizer [13]. On the other hand, the alkaline nature of wood ash can improve soil acidity when properly managed, thereby reducing the bioavailability of toxic elements. Studies have shown that the bioavailability of Cd in soil decreases as soil pH increases [19]. When soil pH rises above 6.5, Zinc (Zn) solubility is significantly reduced, with even greater stabilization at higher pH levels [16].
The total concentration of heavy metals in soil or water does not necessarily reflect their bioaccumulation potential. Among heavy metal ions, some are more mobile and can be readily absorbed by plants, such as Cd and Zn, whereas others, like lead (Pb), are relatively immobile [20]. For metal ions to be taken up by plant roots, they must first be solubilized into the soil solution. Plants employ various strategies to enhance the bioavailability of metal ions, including the secretion of phytosiderophores and carboxylates, as well as rhizosphere acidification to promote metal chelation and dissolution [21]. Therefore, investigating the dynamics of various elements in soil following wood ash application and their relationship with crop uptake, element behavior, and speciation in soil solutions is necessary [16,22,23,24]
We conducted a pot experiment using komatsuna (Brassica rapa var. perviridis) in low-K soil to evaluate the potential of wood ash as a safe and effective K fertilizer by investigating element dynamics in soil solutions, nutrient uptake in crops, and the behavior of heavy metals after wood ash application.

2. Materials and Methods

2.1. Soil

A soil sample was collected from a paddy–upland rotation field at the Toyama Prefectural Agricultural, Forestry & Fisheries Research Center (Toyama, Japan) from a depth of 0–15 cm and classified as Gray Lowland Soil according to the Classification of Cultivated Soils in Japan, Third Approximation [25]. After sampling, the soil was sieved to remove particles larger than 2 mm, and the entire volume of each soil sample was homogenized. The physicochemical properties of the soil are summarized in Table 1. The exchangeable K+ was 0.028 cmolc/kg, indicating low K fertility. Soil pH (H2O), electrical conductivity (EC), exchangeable K+, Ca2+, and Mg2+, P2O5, NH4+, NO3, and carbon content are mentioned.

2.2. Wood Ash

Wood ash obtained from Tohoku Electric Industry Co., Ltd. (Sendai, Japan) was sieved using a 250 μm mesh and classified as fly ash. The element content results of wood ash are presented in Table 2. Leaching amounts of inorganic elements extractable with Notification No.46 of the Environment Agency (JLT 46) are shown in Table 3.

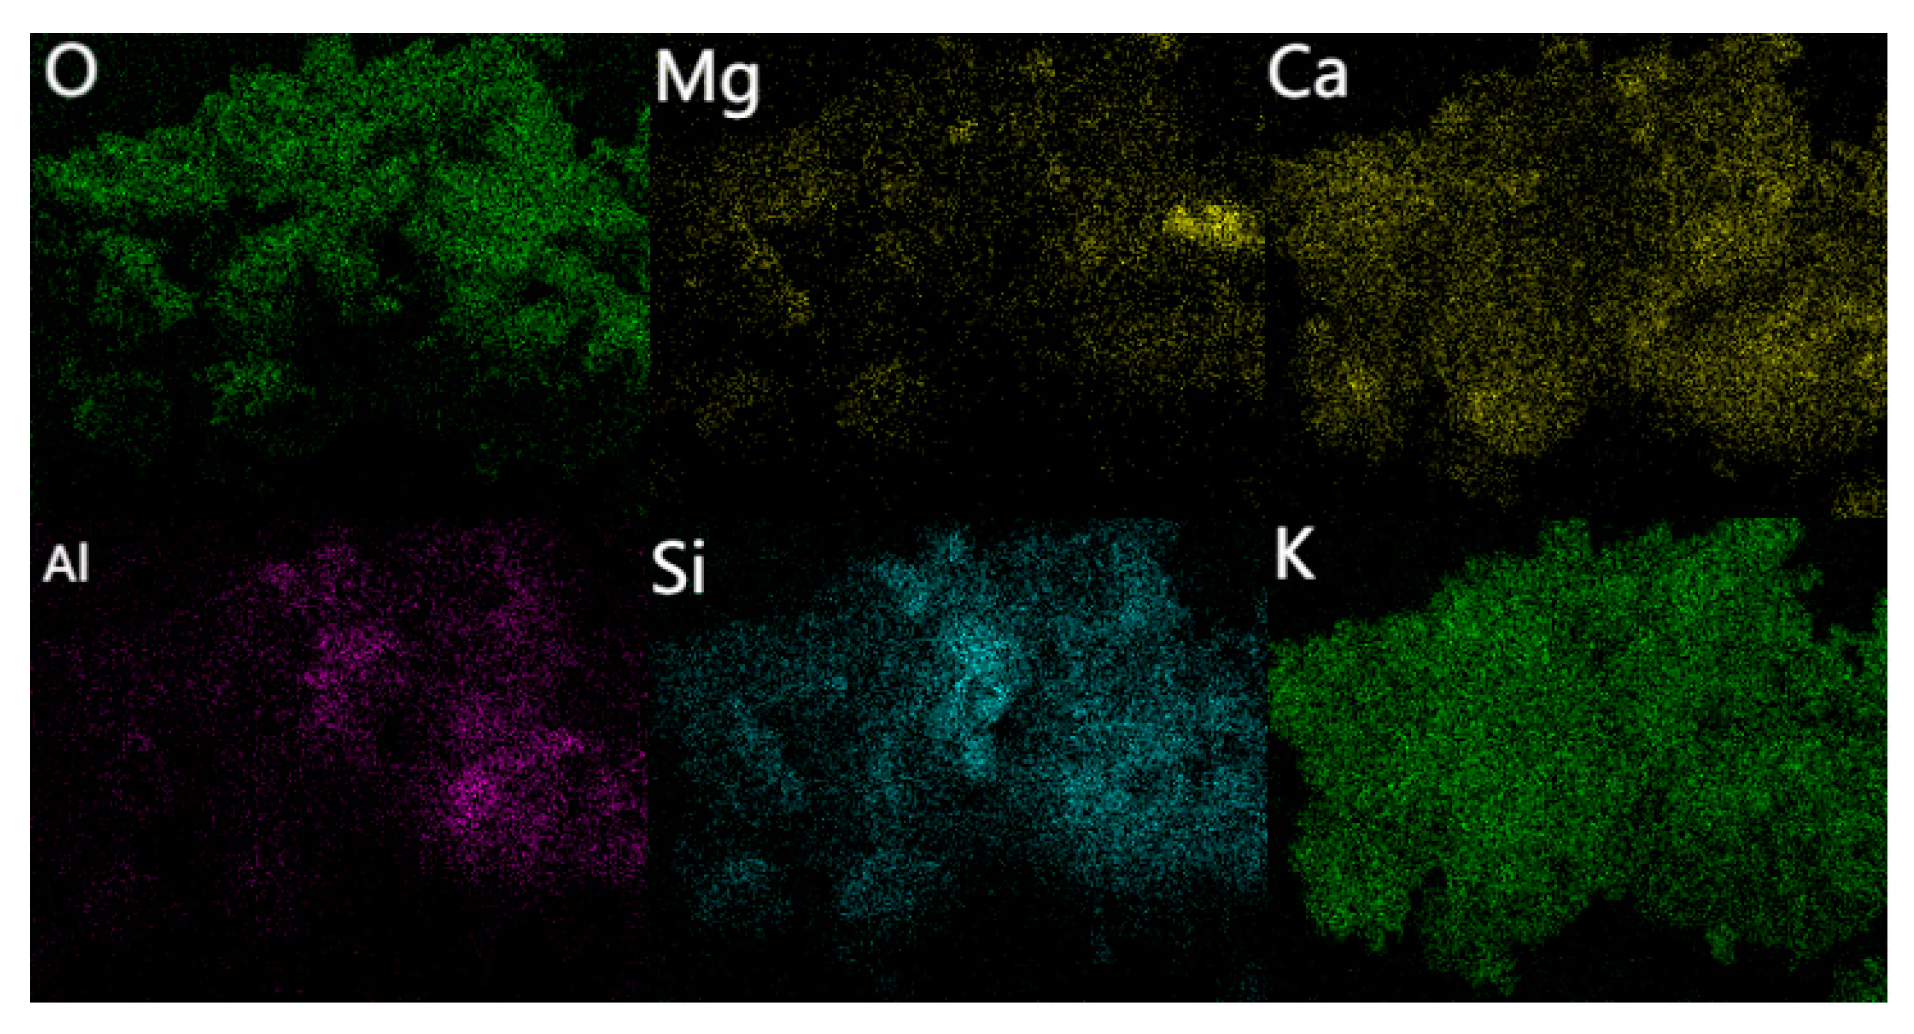
2.3. Physicochemical Properties of Wood Ash

Wood ash suspension was prepared by dissolving 0.5 g of the wood ash in 50 mL of deionized water to determine the buffering capacity of wood ash, a titration experiment was performed using 0.5 M HCl (FUJIFILM Wako Pure Chemical Co., Japan) and an automatic titrator (702 SM Titrino, Metrohm, Switzerland). The microstructure and morphology of the wood ash were analyzed by X-ray diffraction (XRD, Rigaku Rint 2200, Rigaku, Japan) and scanning electron microscopy (SEM, SU8000, 15 Kv, Hitachi, Japan), respectively. The elemental composition of wood ash was determined by energy-dispersive X-ray spectroscopy (EDS, SU8000, Hitachi, Japan). We investigated chemical species Cr in wood ash by the Cr K-edge X-ray absorption near-edge structure (XANES). The XANES spectra of the reference materials (FeCr2O4, CrCl3, and K2CrO4) were obtained in transmission mode at the SAGA Light Source [26] (BL11) and NanoTerasu (BL08W), for which the samples were diluted with boron nitride powder to ensure suitable concentrations. The XANES spectra of the wood ash pellet were obtained in fluorescence yield mode using a seven-element silicon drift detector (XSDD50-07, TechnoAP Co., Ltd., Japan) at the SAGA Light Source and a four-element SDD (XSDD50-04GR, TechnoAP Co., Ltd. Japan) at NanoTerasu. Those XANES spectra were analyzed using the software Athena 0.9.26 software package [27]. The relative proportions of Cr species in the wood ash pellets were estimated by linear combination fitting (LCF) using the spectra of the reference materials.

2.4. Pot Experiment

Two treatments were established using 3 replicates: a control group (No Wood Ash) and a treatment group (1%-Wood Ash). In the control, 0.772 g of urea (FUJIFILM Wako Pure Chemical Co., Japan) was added per pot, providing a nitrogen supply equivalent to 0.36 g N per pot. In the treatment, wood ash was added at 1% of the dry soil weight in addition to the same amount of urea as in the control group. After the mixing of wood ash/urea with 2.6 kg of sieved soil (including 2.5 kg of dry soil), the mixture was placed into 1/5000 a-sized pots. During the cultivation period, distilled water was used for irrigation, maintaining soil moisture at 60% of the maximum water-holding capacity [28].
The pot experiment began on 13 November 2022, with the sowing of komatsuna (Brassica rapa var. perviridis) (SAKATA SEED CORPORATION, Japan), and lasted for 47 days, ending on 20 December 2022, at which point the aboveground crops were harvested.

2.5. Sampling and Analysis

2.5.1. Soil Solution

A soil solution sampler with a porous filter (DIK-301B, Fiber type, Daiki Rika Kogyo Co., Hiroshima, Japan) was installed in the pots, and soil solutions were collected on 22 November and 13 December using the suction method at two different time points during the experiment. The concentrations of heavy metals (Cd, Cu, Cr, manganese (Mn), Mo, nickel (Ni), Zn) and essential crop nutrients (K, Ca, Mg, P) were determined in both the original soil solution and the 1.1% nitric acid diluted solution using inductively coupled plasma–mass spectrometry (ICP-MS) (ELAN, DRC-r, PerkinElmer, Springfield, IL, USA) and inductively coupled plasma–optical emission spectrometry (ICP-OES) (Agilent 5110, Agilent Technologies, Santa Clara, CA, USA). The dissolved organic carbon (DOC) of the soil solution was measured using a Total Organic Carbon Analyzer (897, Shimadzu Corporation, Nishinokyo, Japan), and pH was measured using a compact pH meter (Laqua twin-pH-33, Horiba, Kyoto, Japan). Additionally, the anion concentration in the soil solution was obtained by analysis on the ICS-900 ion chromatographic system (Dionex, Thermo Fisher Scientific, Bend, OR, USA). Finally, the chemical speciation of the elements in the soil solution was determined using Visual MINTEQ 4.0 software [29].

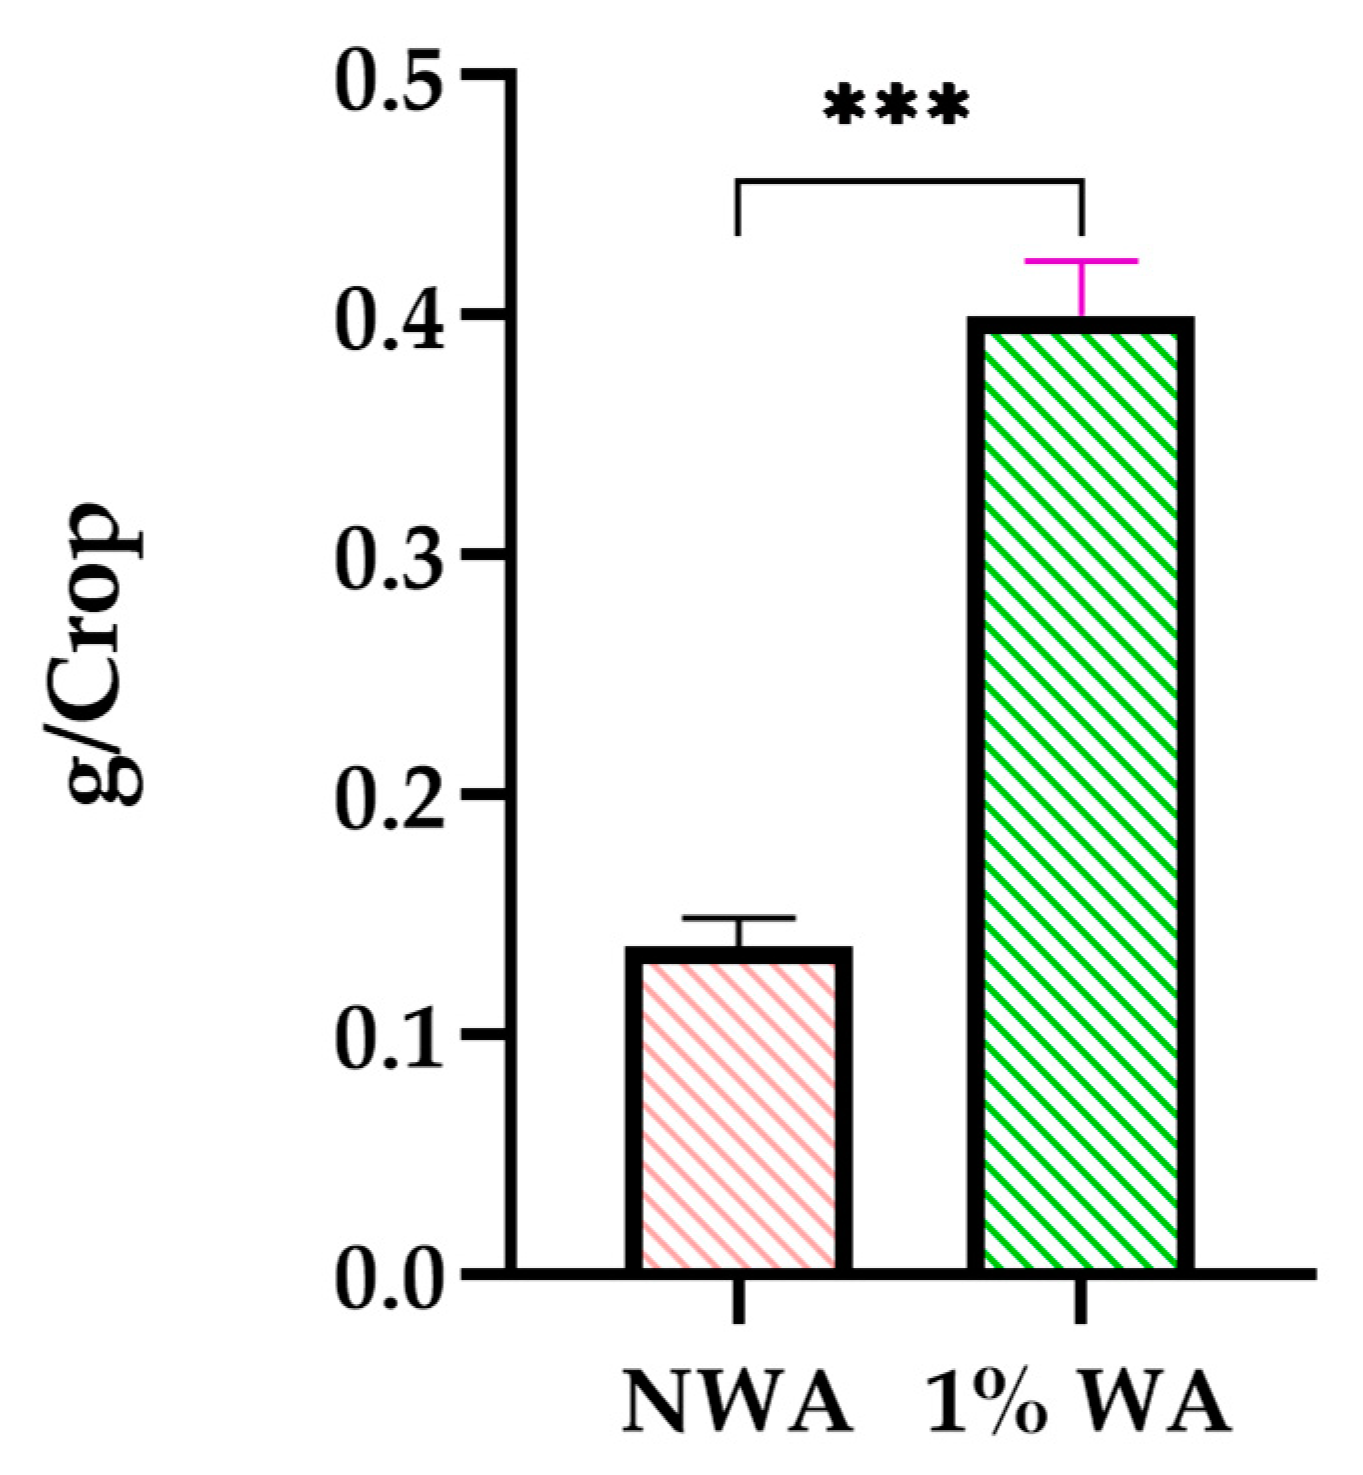
2.5.2. Crop Growth Evaluation

To evaluate the elemental content in crops, the aboveground harvested crops were dried at 75 °C for five days and then weighed. The dried samples were ground into a powder at 2000 rpm using a Multi-Beads Shocker™ (Yasui Kikai, Osaka, Japan). Then, 1 g of power was digested with 5 mL of HNO3 and 1 mL of H2O2 [30] using a heating system (MetaPREP AT2, GL Sciences Inc., Tokyo, Japan). After digestion, the solution was filtered through a 0.2 µm syringe filter (Captiva Econo Filter, Agilent, USA) and the element concentration was measured following the same method as for soil solution analysis.

2.6. Data Analyses

In the figures, column charts are used to represent the elemental data obtained from the soil solution and crops, with t-tests conducted for the measured parameters. To evaluate the effects of wood ash application on nutrient uptake and crop growth, nutrient vector analysis was conducted [13], which compares the relative biomass, relative nutrient concentration, and relative nutrient content of elements (K, Ca, Mg, P, Mo, Zn, Mn, Ni, Cd, Cr, and Cu) between the control and treatment groups. The column charts and t-tests were analyzed using GraphPad Prism 8.0, and the nutrient vector analysis was performed using SigmaPlot 15.0.

3. Results

3.1. Physicochemical Properties of Wood Ash

As shown in Figure 1, we observed that the pH of the wood ash solution decreased slowly from 7 to 6, requiring a larger amount of 0.5 M HCl. This suggests that certain components in the wood ash affected its buffering capacity.
The XRD results of the wood ash reveal characteristic peaks of SiO2, CaCO3, and K2Ca(CO3)2 (Figure 2), which correspond to the positions observed in previous studies for these three substances, and the formation of K2Ca(CO3)2 was attributed to the reaction between potassium carbonate and calcium carbonate under high-temperature conditions [31]. Therefore, we can confirm the presence of carbonates, particularly calcium carbonate and potassium carbonate, in the wood ash, which contribute to the buffering action as mentioned above.
While the presence of carbonates was confirmed by XRD, the microstructure and surface morphology of the wood ash particles were observed using SEM. SEM revealed the presence of layered structures (Figure 3). Further elemental analysis of the layered structures was conducted using EDS. The elemental composition analysis indicated that the layered structures were primarily composed of K and Ca, further confirming the presence of carbonates (Figure 4). Additionally, the wood ash was found to be rich in alkaline elements, particularly K.
Extraction with 2% citric acid [32] was performed to evaluate the available K content in wood ash and assess its potential as a K fertilizer. The results showed that wood ash contains a high K concentration of 168 g/kg, which indicates that the wood ash used in this study has good potential as a K fertilizer.
As shown in Figure 5, compounds containing Cr(VI) exhibit distinct pre-edge features in their spectra, indicating the presence of Cr(VI) in the wood ash. According to the linear combination fitting results of the standards in Table 4, Cr(VI) accounts for 33.1% of the total Cr in the sample. While the characteristics of Cr(VI) were well defined, the correspondence of Cr(III) was weaker, particularly above 6011 eV, where its peak positions did not align well with those of the reference standards. This suggests that additional chemical forms of Cr(III) may exist in the wood ash. However, Cr(III) accounts for 66.9% of the total Cr, making it the dominant oxidation state in the wood ash.

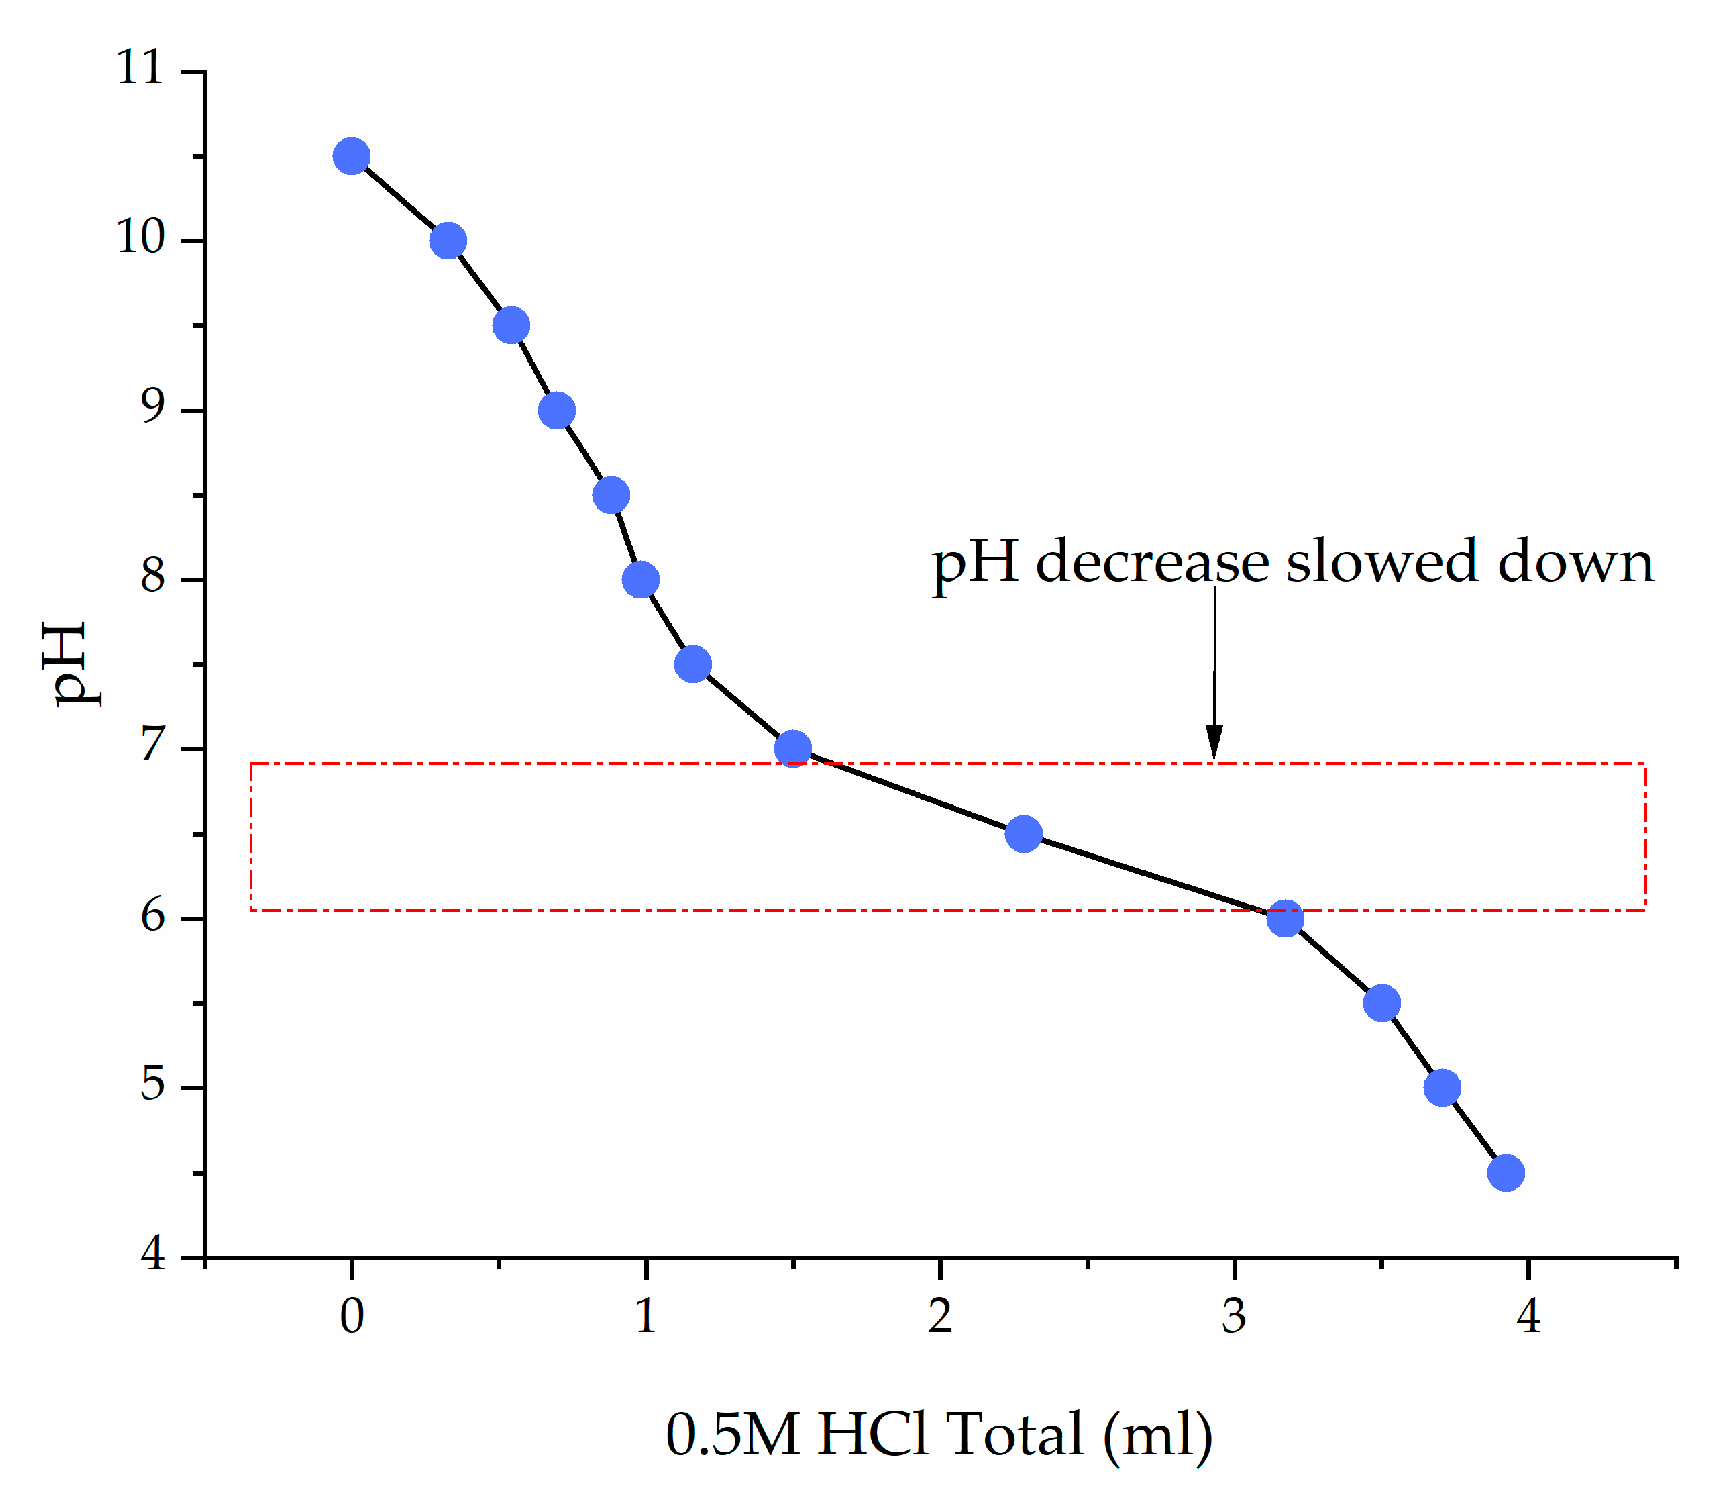
3.2. Soil Solution pH

The pH of the soil solution varied significantly between treatments and sampling times (Figure 6). In the No Wood Ash treatment, pH remained low, approximately 4.5 during the first sampling and 4.7 during the second sampling. In contrast, the 1%-Wood Ash treatment substantially increased the soil solution pH, reaching approximately 7.2 in the first sampling and 7.4 in the second sampling. This result emphasizes the liming effect of wood ash, which efficiently neutralized soil acidity and sustained a consistently higher pH than the control throughout the experiment.

3.3. Elemental Concentration in Soil Solution and Crops

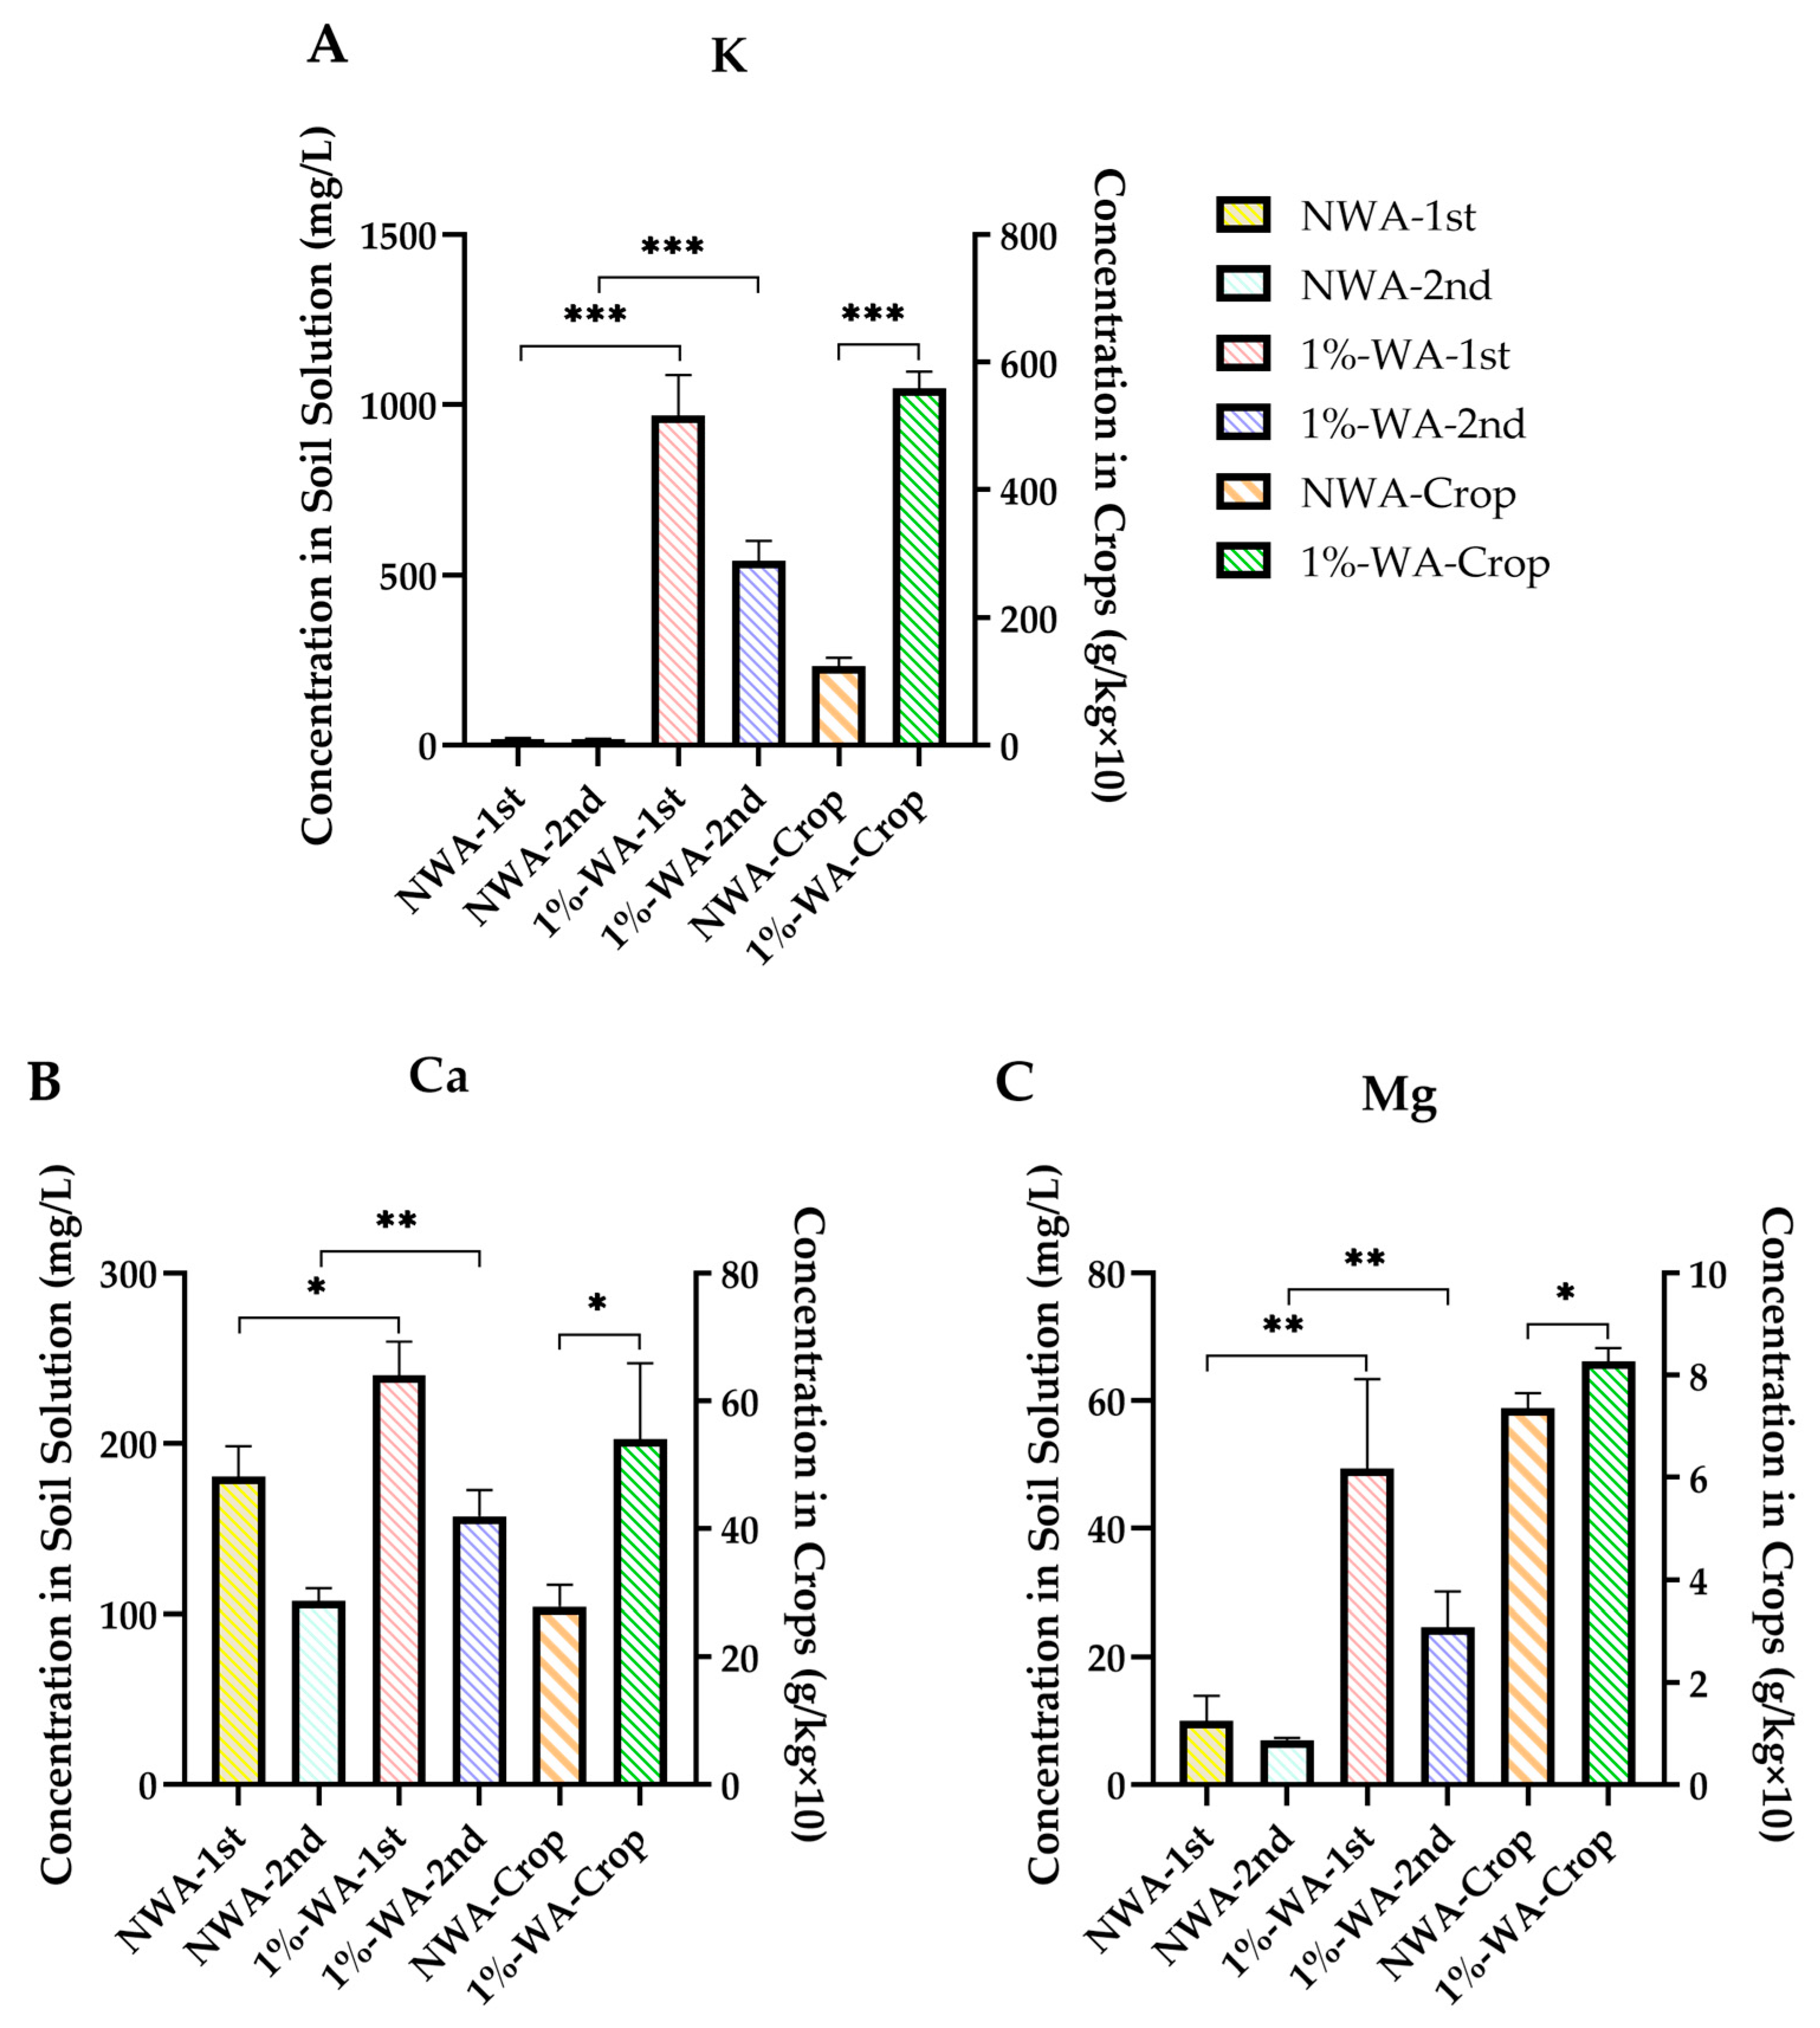
3.3.1. K, Ca, and Mg

The results indicate that the application of wood ash significantly increased the concentration of K, Ca, and Mg in both the soil solution and crops compared to the control (Figure 7). The fertilizer effect on K was particularly remarkable. The K concentration in untreated soil was approximately 17 ppm, while that of the treated soils ranged from 540 to 969 ppm. Correspondingly, the K concentration increased from 123 mg/kg in the control group to 558 mg/kg in treated crops. However, in the second sampling, the concentration of these nutrients in the soil solution decreased relative to the first sampling.

3.3.2. P and Mo

The application of wood ash significantly affected the concentration of P and Mo in both the soil solution and crops. In the soil solution (Figure 8), P concentration was notably low in the control group but increased significantly following wood ash treatment. In crops, the P and Mo concentrations in the wood ash-treated group were significantly higher than those in the control group. The control crops exhibited the lowest concentration of P and Mo, while the highest concentration was observed in crops treated with wood ash.

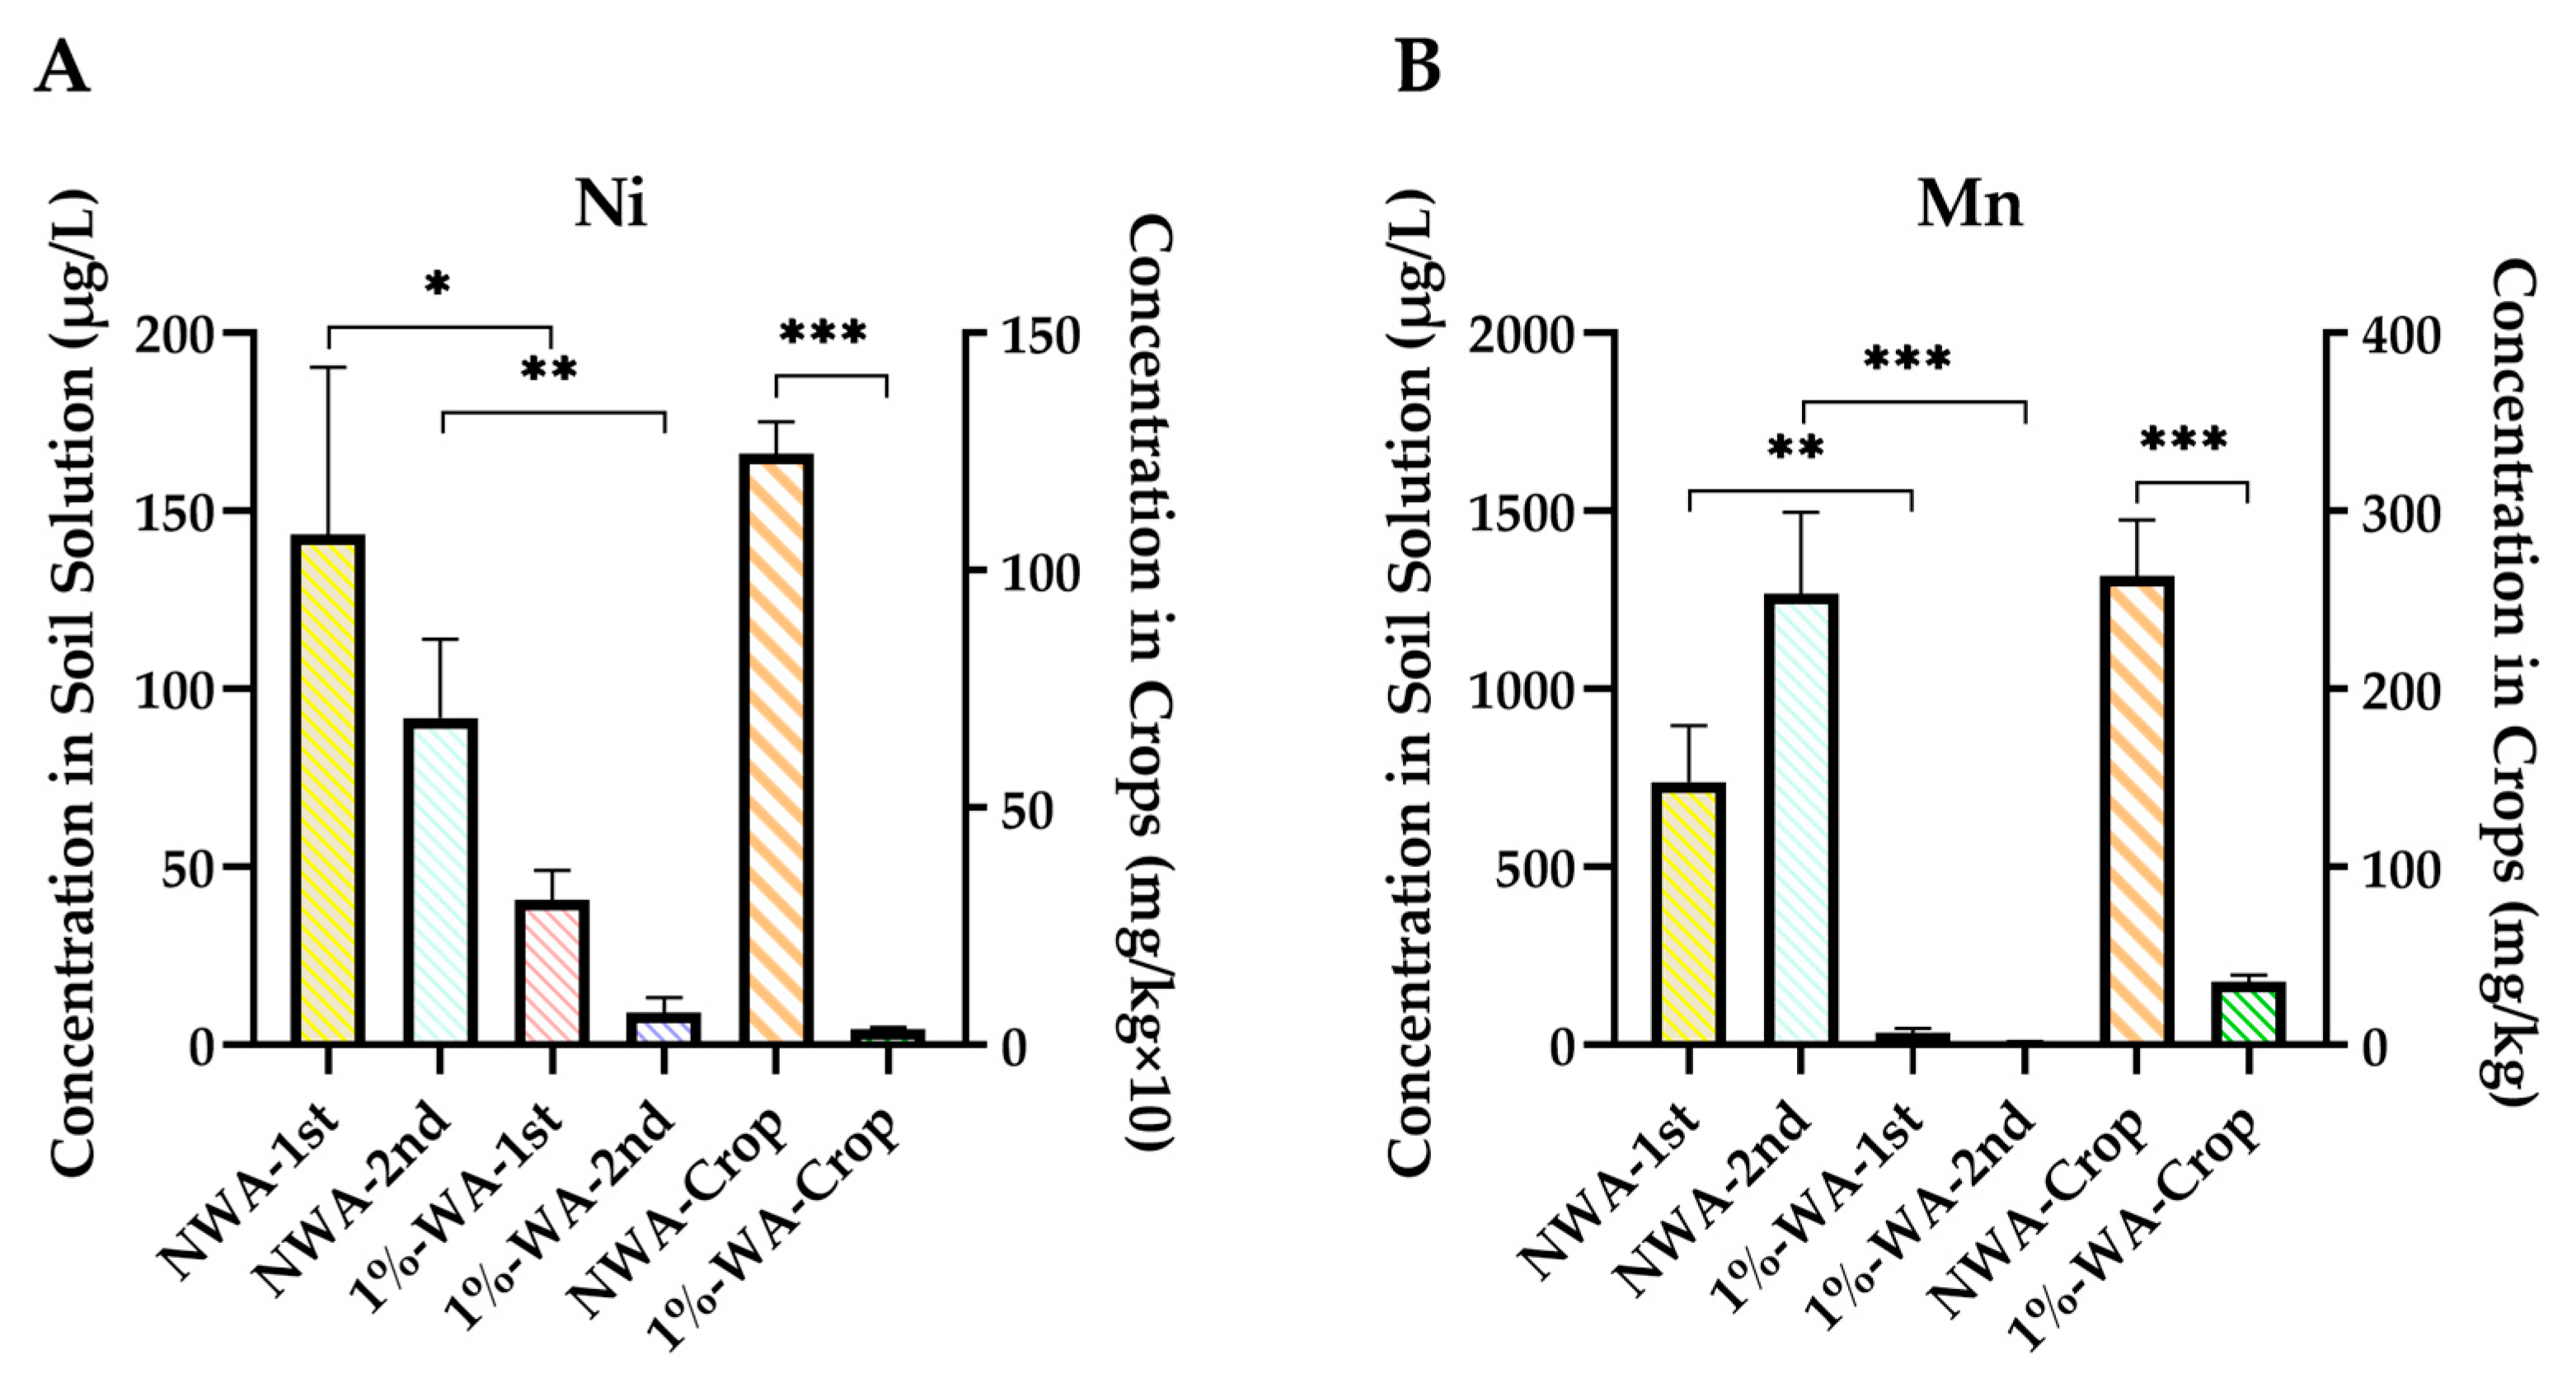
3.3.3. Ni, Mn, Zn, and Cd

With the application of wood ash, the concentrations of Zn, Mn, Cd, and Ni in both the soil solution and crop tissues exhibited a consistent decreasing trend (Figure 9). In the soil solution, the levels of these elements were significantly lower than those in the control group. Similarly, the concentrations of Ni, Mn, Zn, and Cd in the crops also declined, particularly Cd, which decreased from 0.709 mg/kg to 0.057 mg/kg in fresh crops (Table 5).

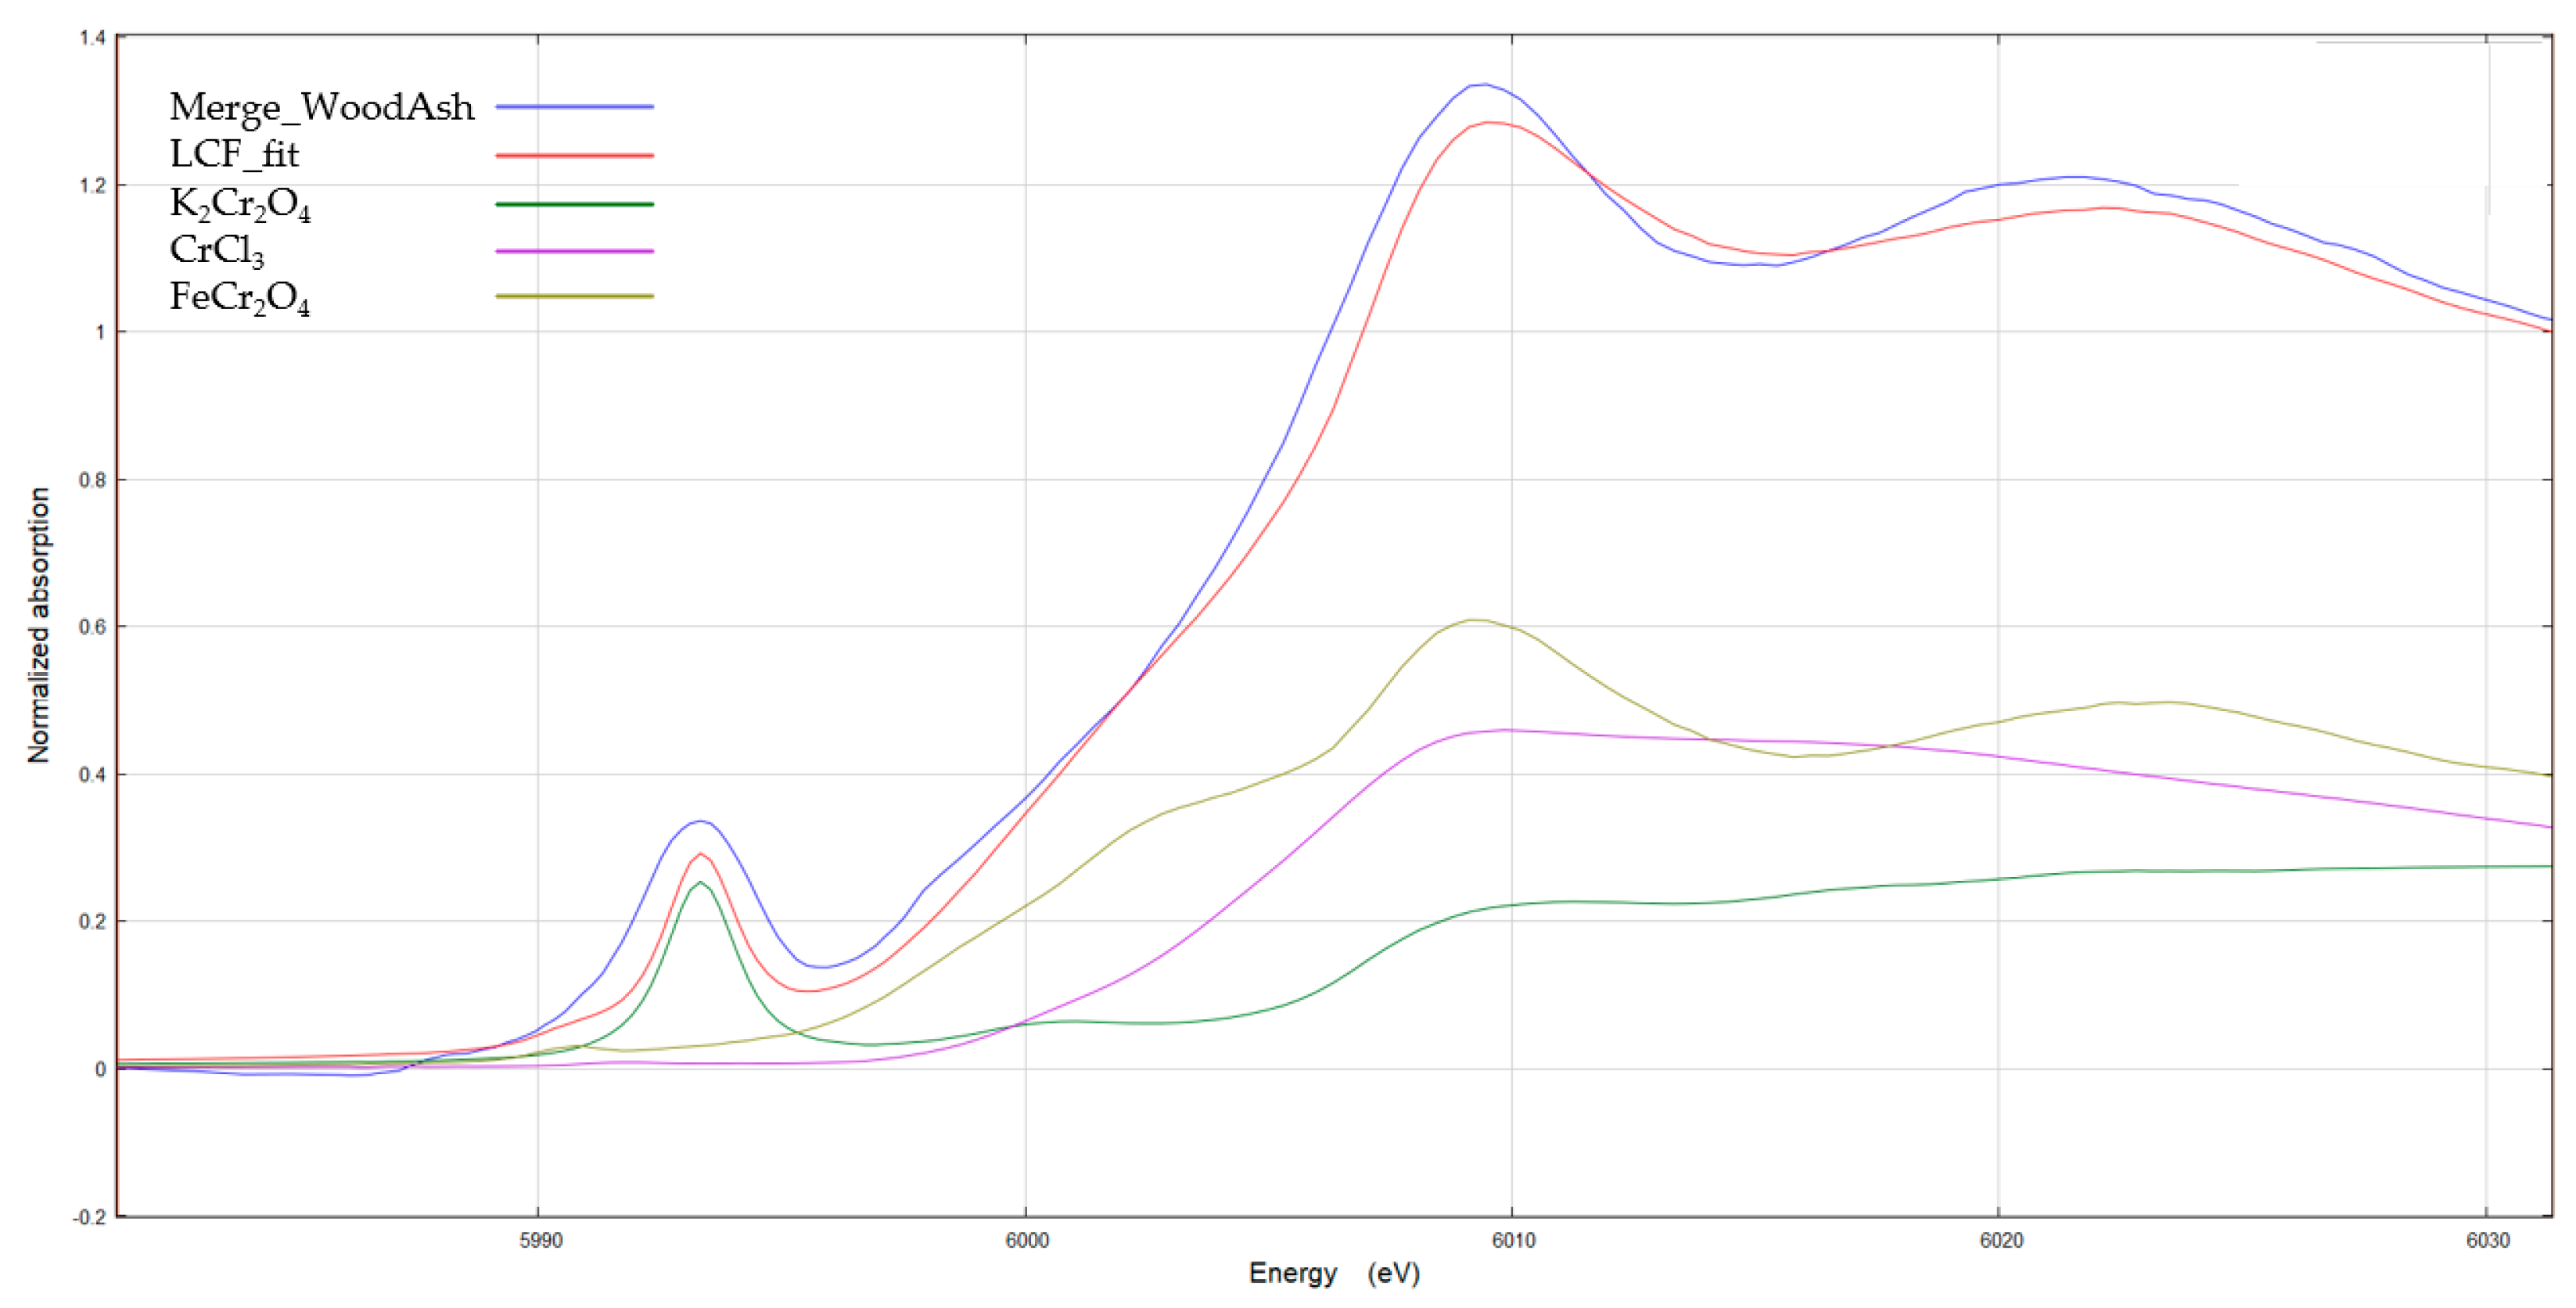
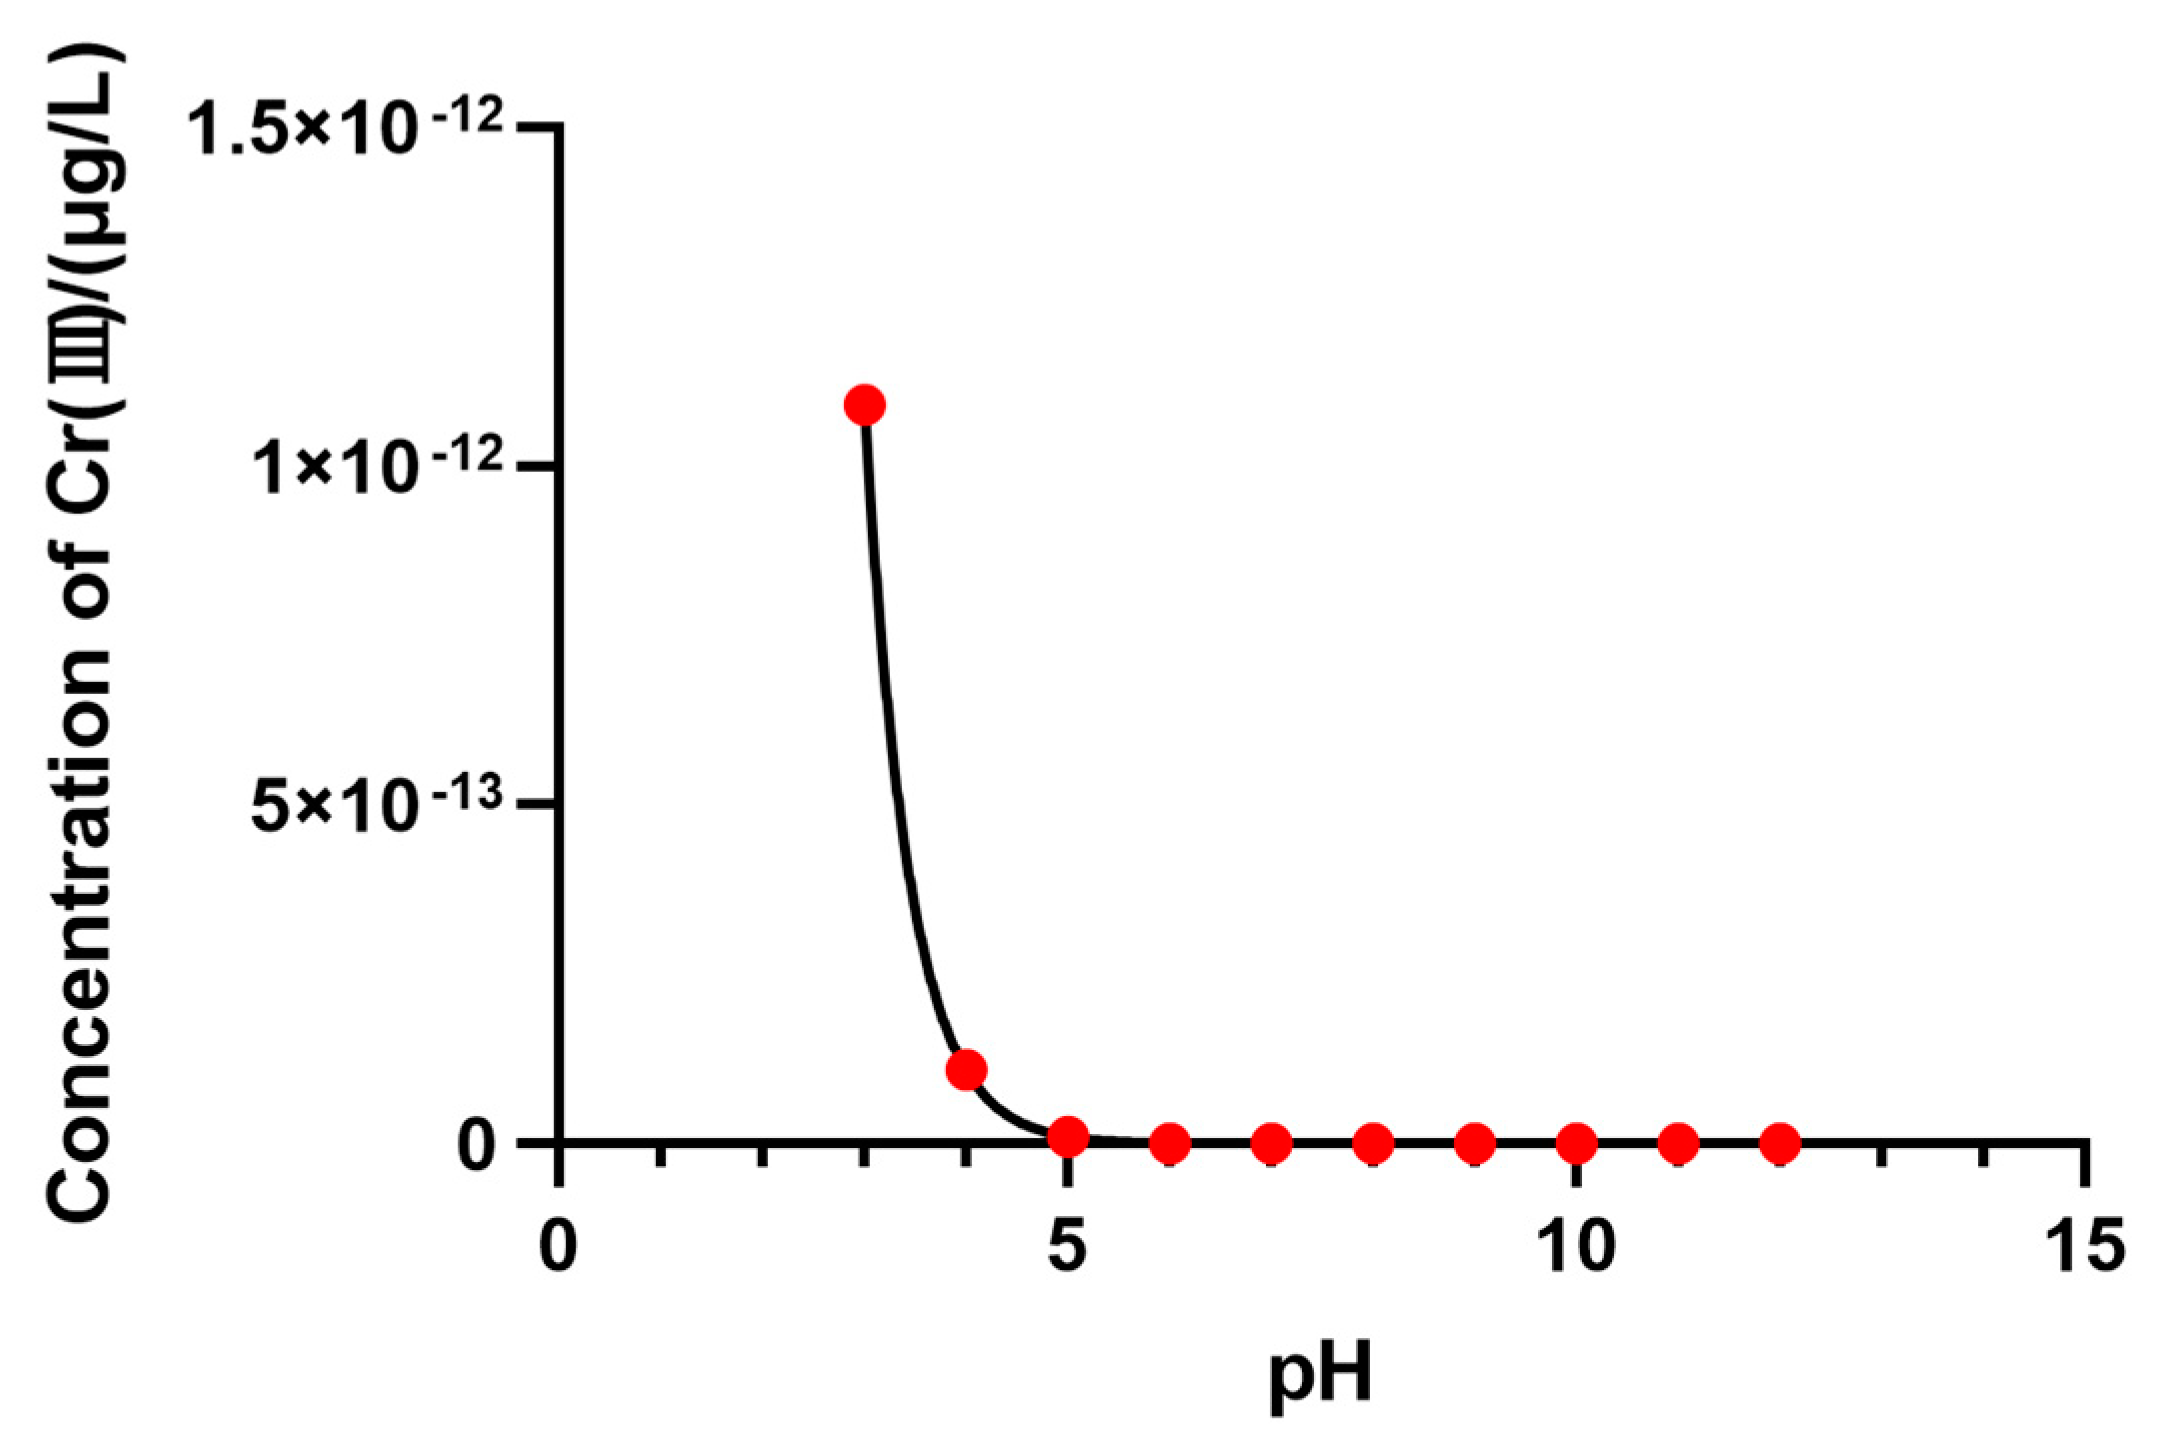
3.3.4. Cu, Cr, and Their Chemical Speciation in Soil Solution

With the addition of wood ash, the concentration of Cu and Cr in both soil solutions and crops exhibited opposite trends, and the application of wood ash promoted the release of organic carbon in the soil (Figure 10), with DOC in the soil solution increasing by 54 times compared to the control treatment (Table 6). In the soil solution, the concentrations of Cu and Cr were significantly higher than those in the control, while the absorption of these elements by crops showed the opposite trend. We hypothesize that Cu and Cr exist in the soil solution in forms that are soluble but difficult for crops to utilize. To explore this further, using the pH, DOC, cation concentration, and anion concentration from the second sampling of the soil solution as input data, we analyzed the chemical speciation of Cu and Cr using Visual MINTEQ 4.0.
According to the calculation results in Table 6, we found that the application of wood ash significantly increased the proportion of organic complexes of these two elements in the soil solution. Over 99% of the Cu and Cr in the soil solution was complexed with fulvic acid, forming organic complexes.

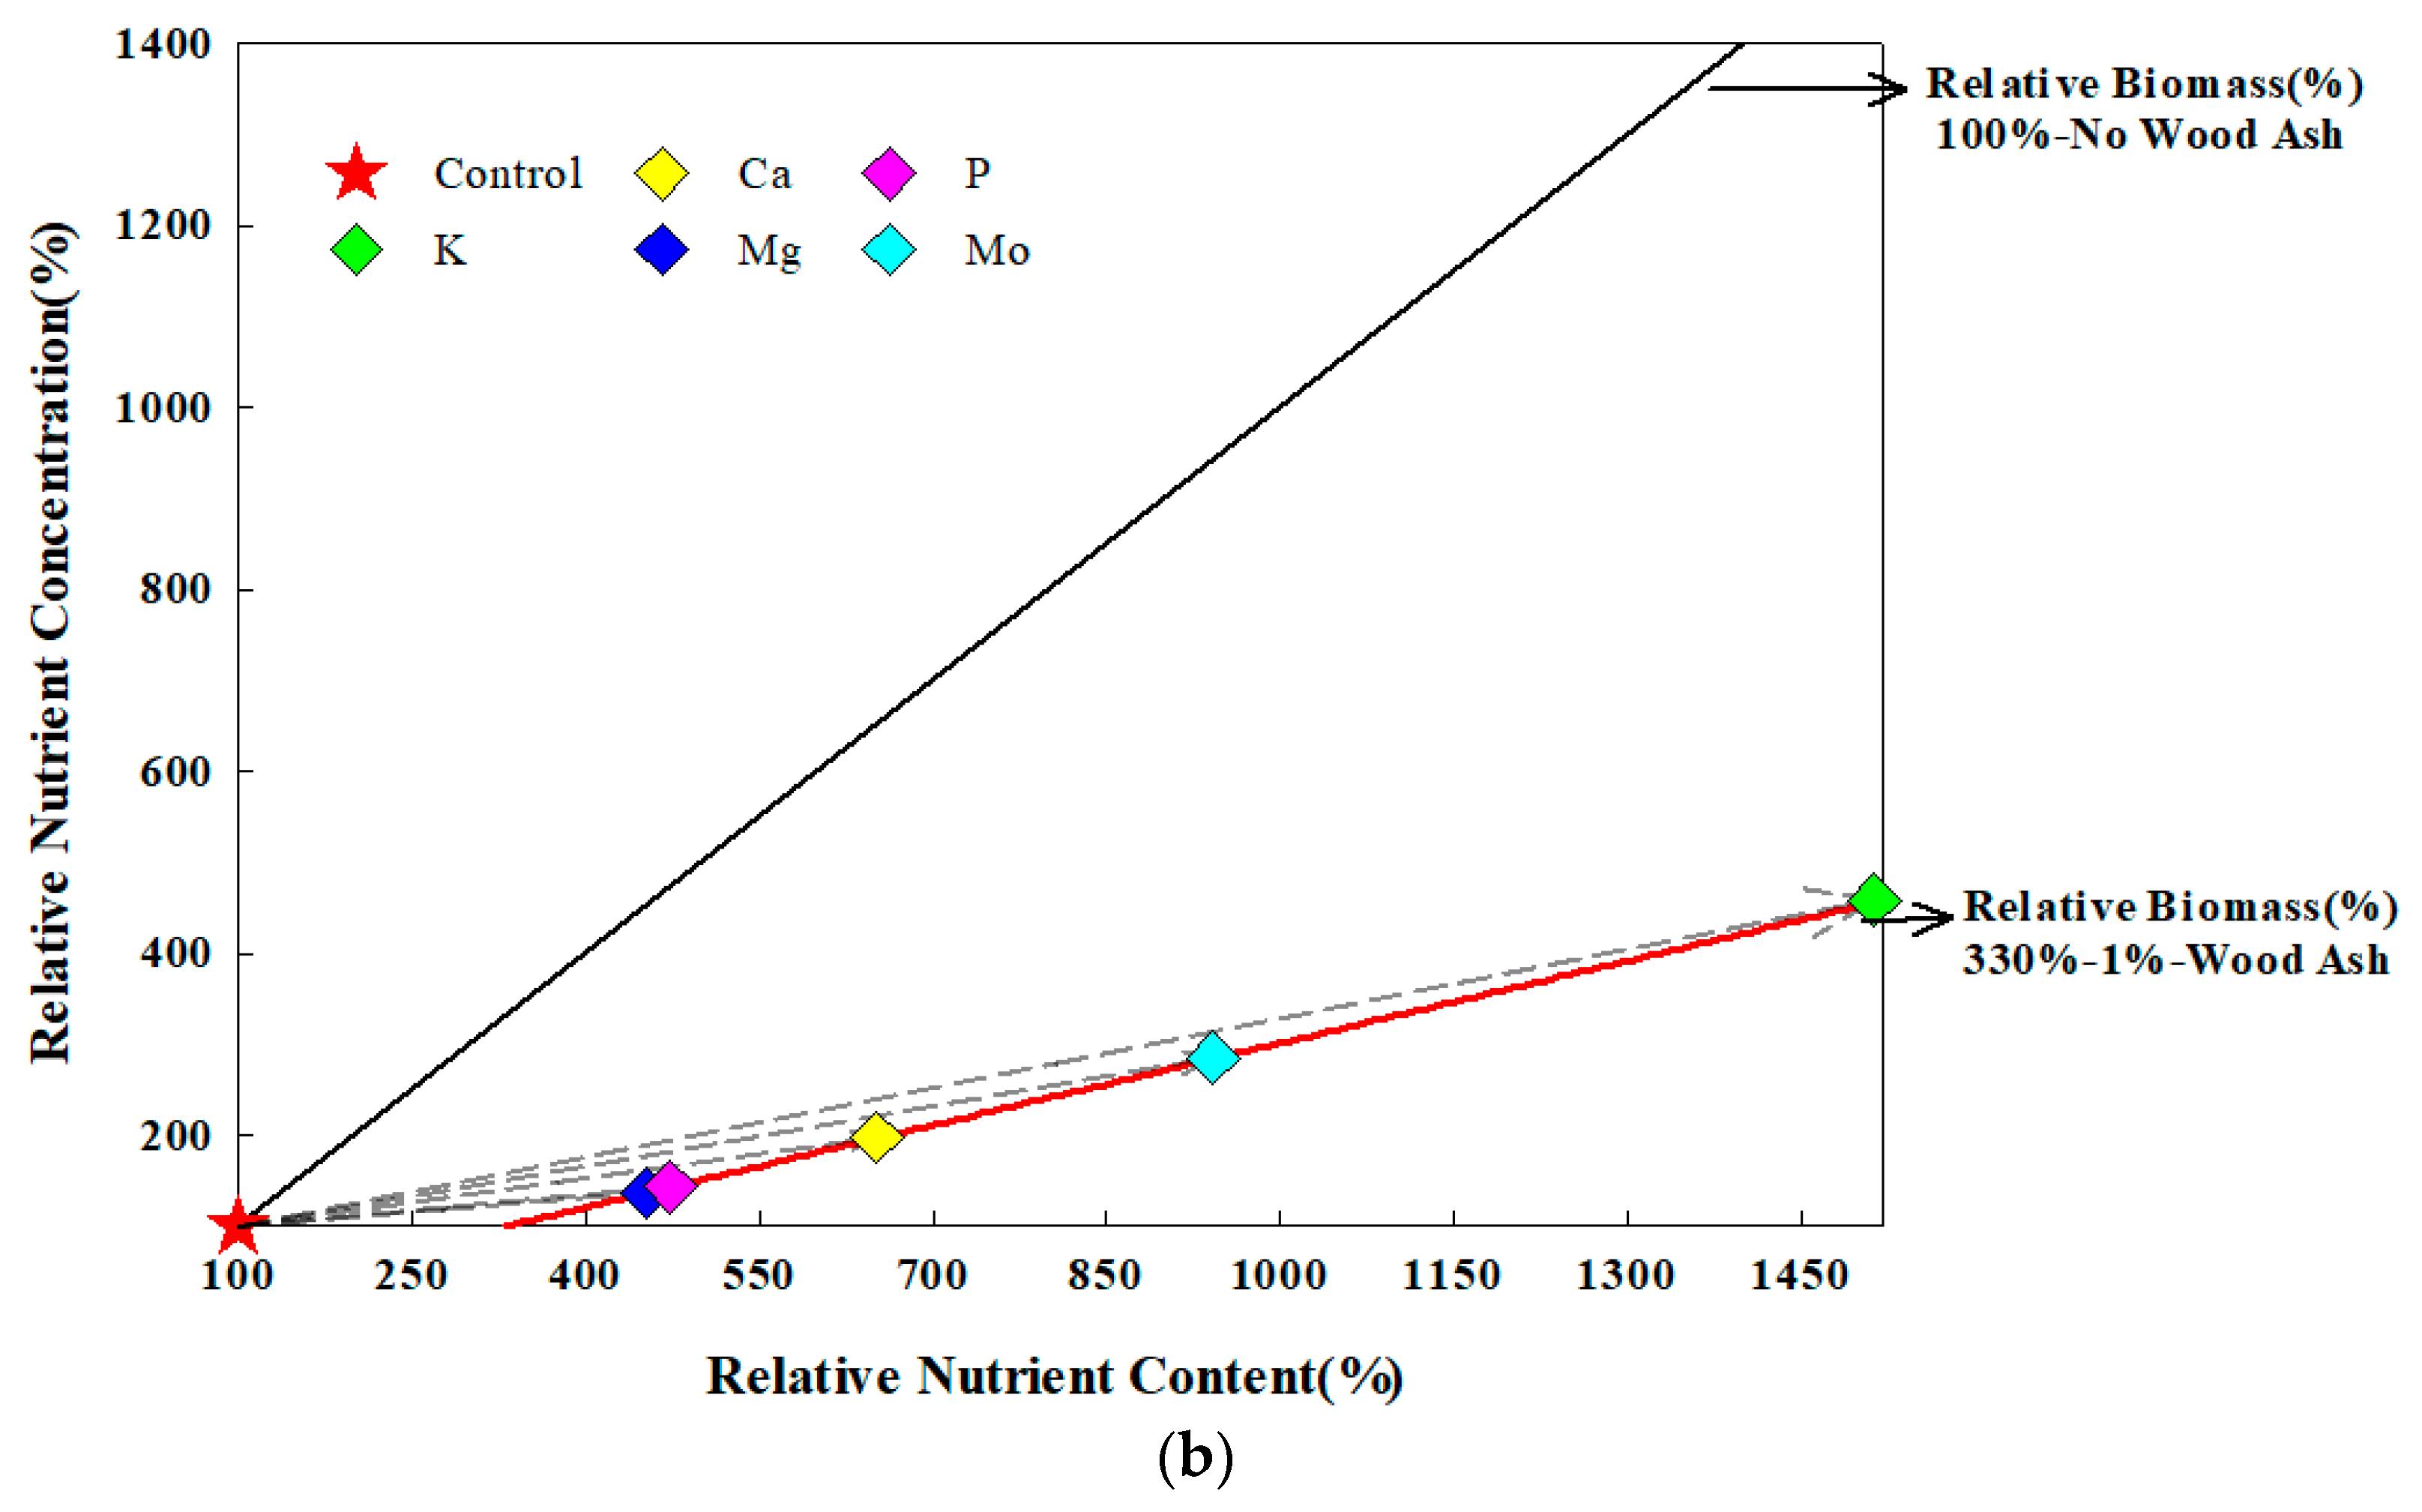
3.4. Crop Growth and Nutrient Vector Analysis

We can observe that the application of wood ash significantly promoted crop growth (Figure 11), with dry weight increasing by 2.86 times compared to the control. Since crop nutrition is a function of nutrient concentration in crops and biomass, crop growth is driven by changes in biomass production and nutrient uptake. The vector diagram displays the nutrient content (x-axis) in the aboveground crop parts, which is calculated by multiplying the nutrient concentration (y-axis) by the dry biomass (straight line). The response of crops to wood ash is expressed relative to the control (standardized to 100). The direction of the vector indicates specific nutrient responses. For example, if relative nutrient content and relative biomass increase, but relative nutrient concentration decreases, it suggests that the application of wood ash leads to nutrient dilution. If a similar response occurs without a change in relative nutrient concentration, the wood ash may be sufficient to provide nutrients, as the concentration remains stable despite increased growth. When all variables increase, an enrichment response occurs, whereas when all variables decrease, an antagonistic response is observed [33]. Based on the results from the nutrient vector diagram in Figure 12, we found that the relative biomass, relative nutrient concentration, and relative nutrient content of K, Ca, Mg, P, and Mo all increased (Figure 12a), while the indicators for Zn, Mn, Ni, Cd, Cr, and Cr decreased (Figure 12b).

4. Discussion

This study demonstrated that wood ash application significantly influenced soil solution composition and nutrient uptake in crops. Soil pH increased from 4.39 (control) to 7.18, highlighting wood ash’s potential to ameliorate soil acidity. Buffer experiments revealed increased HCl consumption, likely due to the neutralizing effect of carbonic acid formation from carbonate reactions [22]. XRD and SEM analyses confirmed the presence of calcium carbonate, supporting its role in pH regulation. The increase in Ca, Mg, and K concentrations in soil solutions suggests their dissolution from wood ash, raising soil pH and enhancing nutrient availability [23,24]. Among these elements, K exhibited the most pronounced increase, reinforcing the potential of wood ash as a K fertilizer.
CO32− + H+→HCO3, pKa = 10.33
HCO3 + H+→H2CO3, pKa = 6.35
Wood ash application also enhanced P and Mo concentrations in both the soil solution and crops. While wood ash contains phosphorus (P) [18], its solubility is generally low. However, the observed increase in P availability suggests pH-induced desorption from soil minerals, weakening the adsorption of phosphate and molybdate anions to iron and aluminum oxides. This aligns with previous studies showing that increased soil pH facilitates the release of anionic nutrients. Nonetheless, long-term studies have reported reduced P uptake in P-deficient soils, emphasizing the need for additional soluble P amendments in such conditions [6].
However, not all elements exhibit similar responses to the application of wood ash. The concentrations of Zn, Mn, Ni, and Cd in the soil solution, as well as their uptake by crops, were significantly reduced. Notably, Cd, which is listed as one of the 126 priority pollutants by the U.S. Environmental Protection Agency (EPA) and classified as a human carcinogen by the International Agency for Research on Cancer (IARC), showed a remarkable decrease in its concentration from 0.709 mg/kg to 0.057 mg/kg in fresh crops (Table 5) with the addition of wood ash, successfully reducing it below the Codex standard (≤0.2 mg/kg), which demonstrates the significant potential of wood ash in mitigating soil heavy metal contamination. In a field experiment investigating potentially toxic elements (PTEs), the application of wood ash as a soil amendment significantly reduced the total and bioavailable PTEs in all farm soils, as well as the PTE concentration in maize tissues [34]. These changes were attributed primarily to the increase in soil pH [34]. These elements typically exist as cations in a soil solution. Under low-pH conditions, these elements tend to be mobile or highly soluble because the increase in proton concentration displaces heavy metal cations from the soil’s exchange sites [35]. As the pH increases, the adsorption and precipitation of Zn, Mn, Ni, and Cd in the soil are enhanced [36]. Additionally, the increase in soil pH reduces the concentration of H+ ions on the soil surface, thereby enhancing the negative surface charge, which improves adsorption capacity for these cations [37]. XRD and SEM analyses of wood ash revealed that its high carbonate content significantly increased soil pH, promoting the formation of hydroxide or carbonate precipitates of these elements [38] and enhancing their adsorption onto the soil surface. This process reduced their solubility and further decreased their uptake by crops. In a pot experiment on rice’s absorption of Cd, the use of Ca and Mg reduced the Cd content in rice, indicating that Ca and Mg, through antagonistic and competitive interactions, jointly mitigated the toxicity of Cd [39]. In our study, the application of wood ash increased the concentration of Ca and Mg in the soil solution and promoted their uptake by crops; therefore, through competitive antagonism, the absorption of Cd by crops may have been reduced. However, a reduction in these elements may lead to micronutrient deficiencies, particularly in soils where these elements are already present in low concentrations. Therefore, further research is necessary to investigate the specific effects of reduced element availability on crop growth and development to better understand the long-term implications of wood ash application in agricultural practices.
With the addition of wood ash, the concentration of Cu and Cr in the soil solution increased, but the uptake of these elements by crops significantly decreased. We preliminarily hypothesize that Cu and Cr formed soluble but less bioavailable substances in the soil solution. Moreover, the DOC content in the soil solution increased by 54 times compared to the control, likely due to the enhanced deprotonation of carboxyl and hydroxyl groups in dissolved organic matter (DOM) as the soil solution pH increased [40]. Calculations of the chemical speciation of these two elements in the soil solution using MINTEQ revealed that over 99% of Cu and Cr existed as organic complexes formed with fulvic acid (FA), with FA2 (phenolic hydroxyl complexes) predominating over FA1 (carboxyl complexes). DOM is a heterogeneous mixture of organic molecules, including humic acids, fulvic acids, proteins, polysaccharides, and hydrophilic organic acids [41]. Active components in DOM, such as carboxyl and phenolic groups, can form complexes with heavy metals, thereby influencing their migration, transformation, bioavailability, and toxicity in soil [42]. Consistent with our experimental results, we found that with the addition of wood ash, Cu and Cr formed organic complexes by binding to the carboxyl and hydroxyl surface sites of DOM, making them soluble in the soil solution but reducing their bioavailability. In a study investigating the influence of molecular weight on the stability and reactivity of humic acids, it was found that higher-molecular-weight fractions were more stable [43]. The addition of wood ash promoted the formation of the more stable FA2 (hydroxyl complexes), thereby reducing the risk of plant uptake of the complexed heavy metals. On the other hand, the difference in the proportion of FA1 and FA2 formation may be related to the increase in pH [44]. In a binding experiment of fulvic acid with aluminum, site titration revealed that under acidic conditions, Al complexation primarily involved carboxyl binding sites, while at pH ≥ 7, both carboxyl and hydroxyl binding sites played a major role in complexation. The authors noted that the extent of proton migration might change due to the protonation/deprotonation of functional groups in humic acids, leading to different binding states of carboxyl and hydroxyl groups at varying pH levels [45]. In our experiment, the increase in FA2 binding proportion for Cu and Cr with rising pH could be further validated by titration methods to examine the binding characteristics of these two functional groups under different pH conditions. Currently, advanced techniques are available to verify the existence of organic complexes. For instance, parallel factor analysis (PARAFAC) was used to analyze the excitation–emission matrix (EEM) spectra of DOM under different heavy metal titration concentrations, qualitatively and quantitatively identifying the types of binding groups in DOM. Additionally, 2D-FTIR-COS was employed to investigate the binding sites and sequences of heavy metals with DOM, correlating peak positions with carboxyl and phenolic hydroxyl groups binding to Cu [46]. While we have only determined the existence of these elements as organic complexes in the soil solution through chemical equilibrium calculations by Visual MINTEQ 4.0, further research using the aforementioned techniques is necessary to elucidate the mechanisms underlying the formation of Cu and Cr organic complexes in the soil solution.
It is widely reported that Cr is primarily present in water and soil as oxidative Cr(III) and Cr(VI) [47]. Cr(III) is typically found as a cation, while Cr(VI) is frequently found as an oxyanion class, in the likes of chromate (CrO42−) and dichromate (Cr2O72−), alongside hydrogen chromate (HCrO4) [48]. Although we measured the total Cr content in this experiment, an analysis of the concentration of Cr(III) from the solubility product of Cr(OH)3 in the soil solution allows us to infer the existing forms of Cr in the solution.
3Cr+ + 3(OH) = Cr(OH), Ksp = 6.30 × 10⁻³¹
At pH ≥ 7, assuming that Cr(III) does not form complexes, the concentration of Cr(III) is negligible, ≥1.09 × 10⁻¹⁶ μg/kg (Figure 13). However, the Cr concentration in the soil solution was much higher, which suggests two possibilities: Cr(III) forms soluble organic complexes; and Cr exists as Cr(VI). In Figure 10, a decrease is shown in the crop uptake of Cr that is different from the dynamics of the oxyanion class, indicating that Cr likely exists in the soil solution in the form of organic complexes.
Synchrotron radiation analysis revealed the presence of both Cr(III) and Cr(VI) in wood ash (Figure 5), and we hypothesize that the Cr present in the soil solution originates from the applied wood ash [49].
The results of the nutrient vector analysis in Figure 12 indicate that the application of wood ash increased the relative nutrient content, relative nutrient concentration, and relative biomass of K, Ca, Mg, P, and Mo, suggesting that these five elements became limiting factors for crop growth [50]. In a study on Scots pine grown in peatlands with a C/N ratio of 17–24, the application of 20 tons per hectare of bark ash over 13 years resulted in a 4–5-fold increase in growth, primarily attributed to the enhanced availability of potassium [51]. In this experiment, the K concentration in the 1% wood ash treatment group increased significantly, reaching a maximum of 969 ppm in the soil solution. The K concentration in the crops also rose substantially. Given the initially low potassium fertility of the experimental soil, we hypothesize that wood ash was a key factor promoting crop growth, demonstrating that wood ash is an excellent source of K with superior fertilizing efficacy. Additionally, the application of wood ash reduced the relative nutrient content of Zn, Mn, Ni, Cd, and Cr, as well as the relative nutrient concentration of these elements and Cu, indicating that the rapid growth of the crops diluted the concentration of these heavy metal cations, and these elements did not become limiting factors for growth in this experiment [50]. Furthermore, the increase in soil pH induced by wood ash application regulated the crop growth environment and increased the organic carbon content in the soil. At the same time, the use of wood ash enhanced microbial activity and promoted nitrogen mineralization [52], thereby providing a nitrogen source, and the rise in available nitrogen content in the soil solution further enhanced crop growth.
The water leaching method specified in Notification No. 46 of the Environmental Agency is widely used to assess the potential impact of waste disposal on the environment and human health. As shown in Figure 3, the concentrations of mercury (Hg), Cd, Pb, Cr(VI), arsenic (As), and selenium (Se) in wood ash were 0.0005, 0.0003, 0.005, 2.70, 0.840, and 0.110 mg/L, respectively, while the regulatory limits specified in Notification No. 46 for these elements are 0.005, 0.03, 0.1, 0.5, 0.1, and 0.1 mg/L, respectively. Comparatively, the concentrations of Cr(VI), As, and Se exceeded the prescribed limits. Although As and Se were not measured in this pot experiment, the absorption of Cr by crops indicated that the addition of wood ash increased Cr concentrations in the soil solution compared to the control. However, Cr was primarily present in the form of organic complexes, which reduced its bioavailability to crops.
Previous studies have shown that in manganese oxide-rich soils, Cr(III) can be oxidized into the more mobile and toxic Cr(VI) [46]. Given the significant proportion of Cr(III) in wood ash, its potential impact cannot be ignored. To optimize the use of wood ash as a fertilizer, it is essential to develop methods for reducing the concentrations of these elements and to improve wood ash at its source.

5. Conclusions

This study investigated the effects of wood ash application on element dynamics in soil solution and crop uptake, focusing on the application of wood ash as a K fertilizer in low-K soil. The results demonstrate that wood ash significantly increased soil pH and enhanced the availability of essential nutrients such as K, Ca, Mg, P, and Mo in both the soil solution and crops. The application of wood ash led to a substantial increase in crop biomass, highlighting its potential as an effective K fertilizer.
However, this study also revealed that wood ash application increased the concentration of heavy metals such as Cu and Cr in the soil solution, although their uptake by crops decreased due to complexation with fulvic acid. This suggests that while wood ash can improve soil fertility and crop growth, careful management is required to mitigate potential risks associated with heavy metal contamination. The reduction in the bioavailability of Zn, Mn, Ni, and Cd in the soil solution further underscores the need for balanced nutrient management to avoid micronutrient deficiencies in crops.
In conclusion, wood ash shows promise as a sustainable alternative to conventional K fertilizers, particularly in acidic and low-K soils. However, further research is needed to optimize its application rates and develop strategies to minimize the environmental risks associated with heavy metals. Long-term field studies are also necessary to evaluate the cumulative effects of wood ash on soil health, crop productivity, and environmental sustainability.

Author Contributions

Conceptualization, T.M. (Tomoyuki Makino); methodology, C.J., C.I., M.-F.C., H.N., T.M. (Takehito Mori), A.S., M.H. and H.S.; writing—original draft preparation, C.J.; writing—review and editing, T.H. and T.M. (Tomoyuki Makino). All authors have read and agreed to the published version of the manuscript.

Funding

This research was supported by the Research and implementation promotion program through open innovation grants (JPJ011937) from the Project of the Bio-oriented Technology Research Advancement Institution (BRAIN). This work was also supported by the Project of Integrated Compost Science (PICS).

Data Availability Statement

The original contributions presented in this study are included in the article. Further inquiries can be directed at the corresponding authors.

Acknowledgments

The XANES spectra were obtained using beamlines BL11 XAFS (Proposal No. 2312093P and No. 2303137P) and BL08W XAFS, at the SAGA Light Source and NanoTerasu, respectively. XRD analysis was carried out at the Fundamental Technology Center with technical support from T. Tanno of the Research Institute of Electrical Communication, Tohoku University. We utilized facilities provided by the Research Equipment Sharing System with technical support from C. Maruo at Tohoku University (897: Total Organic Carbon Analyzer). We sincerely thank S. Yamazaki (Graduate School of Environmental Studies, Tohoku University), K. Kimura (School of Food Industrial Sciences, Miyagi University), and K. Shoji (Graduate School of Agricultural Science, Tohoku University) for their valuable technical support.

Conflicts of Interest

Authors Hiroshi Naganuma, Takehito Mori and Akihiro Sawada were employed by the company Tohoku Electric Industry Co., Ltd. The remaining authors declare that the research was conducted in the absence of any commercial or financial relationships that could be construed as a potential conflict of interest.

References

  1. United Nations Framework Convention on Climate Change (UNFCCC). Adoption of the Paris Agreement-Paris Agreement text English. 2015. Available online: https://unfccc.int/documents/9064 (accessed on 24 March 2025).
  2. Szarka, N.; Scholwin, F.; Trommler, M.; Jacobi, H.F.; Eichhorn, M.; Ortwein, A.; Thrän, D. A novel role for bioenergy: A flexible, demand-oriented power supply. Energy 2013, 61, 18–26. [Google Scholar] [CrossRef]
  3. Zhou, J.; Tabata, T. Research Trends and Future Direction for Utilization of Woody Biomass in Japan. Appl. Sci. 2024, 14, 2205. [Google Scholar] [CrossRef]
  4. Pei, Y.; Ike, M.; Shiota, K.; Takaoka, M. The impacts of furnace and fuel types on the hazardous heavy metal contents and leaching behavior of woody biomass fly ash. Fuel 2024, 372, 132202. [Google Scholar] [CrossRef]
  5. Vance, E.D. Land Application of Wood-Fired and Combination Boiler Ashes: An Overview. J. Environ. Qual. 1996, 25, 937–944. [Google Scholar] [CrossRef]
  6. Clarholm, M. Granulated wood ash and a ‘N-free’ fertilizer to a forest soil effects on P availability. For. Ecol. Manag. 1994, 66, 127–136. [Google Scholar] [CrossRef]
  7. Tian, H.; Bian, Z.; Shi, H.; Qin, X.; Pan, N.; Lu, C.; Pan, S.; Tubiello, F.N.; Chang, J.; Conchedda, G.; et al. History of anthropogenic Nitrogen inputs (HaNi) to the terrestrial biosphere: A 5arcmin resolution annual dataset from 1860 to 2019. Earth Syst. Sci. Data 2022, 14, 4551–4568. [Google Scholar] [CrossRef]
  8. Sasaki, I.; Fujiwara, H.; Sasaki, M. Livestock Manure Processing Methods and the Use of Processing by-Products in Japan. 2024. Available online: https://www.jwnet.or.jp/info/assets/files/R05_chousa_chikusanE.pdf (accessed on 24 March 2025).
  9. Ding, Z.; Ali, E.F.; Almaroai, Y.A.; Eissa, M.A.; Abeed, H.A.A. Effect of Potassium Solubilizing Bacteria and Humic Acid on Faba Bean (Vicia faba L.) Plants Grown on Sandy Loam Soils. J. Soil Sci. Plant Nutr. 2021, 21, 791–800. [Google Scholar] [CrossRef]
  10. Hannam, K.D.; Venier, L.; Allen, D.; Deschamps, C.; Hope, E.; Jull, M.; Kwiaton, M.M.; Mckenney, D.; Rutherford, P.; Hazlett, P. Wood ash as a soil amendment in Canadian forests: What are the barriers to utilization? Can. J. For. Res. 2018, 48, 442–450. [Google Scholar] [CrossRef]
  11. Vassilev, S.V.; Vassileva, C.G.; Song, Y.C.; Li, W.Y.; Feng, J. Ash contents and ash-forming elements of biomass and their significance for solid biofuel combustion. Fuel 2017, 208, 377–409. [Google Scholar] [CrossRef]
  12. Antonangelo, A.; Neto, J.F.; Crusciol, C.A.C.; Alleoni, L.R.F. Lime and calcium-magnesium silicate in the ionic speciation of an oxisol. Sci. Agric. 2017, 74, 317–333. [Google Scholar] [CrossRef]
  13. Johansen, J.L.; Nielsen, M.L.; Vestergård, M.; Mortensen, L.H.; Cruz-Paredes, C.; Rønn, R.; Kjøller, R.; Hovmand, M.; Christensen, S.; Ekelund, F. The complexity of wood ash fertilization disentangled: Effects on soil pH, nutrient status, plant growth and cadmium accumulation. Environ. Exp. Bot. 2021, 185, 104424. [Google Scholar] [CrossRef]
  14. Williams, T.M.; Hollis, C.A.; Smith, B.R. Forest Soil and Water Chemistry following Bark Boiler Bottom Ash Application. J. Environ. Qual. 1996, 25, 955–961. [Google Scholar] [CrossRef]
  15. Steenari, B.; Lindqvist, O. Stabilisation of biofuel ashes for recycling to forest soil. Biomass-Bioenergy 1997, 13, 39–50. [Google Scholar] [CrossRef]
  16. Zhan, G.; Erich, M.S.; Ohno, T. Release of trace elements from wood ash by nitric acid. Water Air Soil Pollut. 1996, 88, 297–311. [Google Scholar] [CrossRef]
  17. James, A.K.; Thring, R.W.; Helle, S.; Ghuman, H.S. Ash management review-applications of biomass bottom ash. Energies 2012, 5, 3856–3873. [Google Scholar] [CrossRef]
  18. Mayer, E.; Eichermüller, J.; Endriss, F.; Baumgarten, B.; Kirchhof, R.; Tejada, J.; Kappler, A.; Thorwarth, H. Utilization and recycling of wood ashes from industrial heat and power plants regarding fertilizer use. Waste Manag. 2022, 141, 92–103. [Google Scholar] [CrossRef] [PubMed]
  19. Kindtler, N.L.; Ekelund, F.; Rønn, R.; Kjøller, R.; Hovmand, M.; Vestergård, M.; Christensen, S.; Johansen, J.L. Wood ash effects on growth and cadmium uptake in Deschampsia flexuosa (Wavy hair-grass). Environ. Pollut. 2019, 249, 886–893. [Google Scholar] [CrossRef] [PubMed]
  20. Lasat, M.M. Phytoextraction of Metals from Contaminated Soil: A Review of Plant/Soil/Metal Interaction and Assessment of Pertinent Agronomic Issues. J. Hazard. Subst. Res. 1999, 2, 5. [Google Scholar] [CrossRef]
  21. Kinnersley, A.M. The role of phytochelates in plant growth and productivity. Plant Growth Regul. 1993, 12, 207–218. [Google Scholar] [CrossRef]
  22. Ochecová, P.; Mercl, F.; Košnář, Z.; Tlustoš, P. Fertilization efficiency of wood ash pellets amended by gypsum and superphosphate in the ryegrass growth. Plant Soil Environ. 2017, 63, 47–54. [Google Scholar] [CrossRef]
  23. Saarsalmi, A.; Kukkola, M.; Moilanen, M.; Arola, M. Long-term effects of ash and N fertilization on stand growth, tree nutrient status and soil chemistry in a Scots pine stand. For. Ecol. Manag. 2006, 235, 116–128. [Google Scholar] [CrossRef]
  24. Augusto, L.; Bakker, M.R.; Meredieu, C. Wood ash applications to temperate forest ecosystems-Potential benefits and drawbacks. Plant Soil 2008, 306, 181–198. [Google Scholar] [CrossRef]
  25. Cultivated Soil Classification Committee. Classification of cultivated soils in Japan, third approximation. In Miscellaneous Publication of the National Institute of Agro-Environmental Sciences; JIRCAS: Ibaraki, Japan, 1995; p. 1.
  26. Okajima, T.; Ohtani, R.; Sumitani, K.; Kawamoto, M. Present Status of SAGA-LS and X-Ray Absorption Spectroscopy on BL11. X-Sen Bunseki No Shinpo 2012, 43, 223–234. [Google Scholar]
  27. Ravel, B.; Newville, M. ATHENA, ARTEMIS, HEPHAESTUS: Data analysis for X-ray absorption spectroscopy using IFEFFIT. J. Synchrotron Radiat. 2005, 12, 537–541. [Google Scholar] [CrossRef]
  28. Asaka, O.; Shoda, M. Biocontrol of Rhizoctonia Solani Damping-Off of Tomato with Bacillus Subtilis RB14. Appl. Environ. Microbiol. 1996, 62. [Google Scholar] [CrossRef]
  29. Makino, T.; Takano, H.; Kamiya, T.; Itou, T.; Sekiya, N.; Inahara, M.; Sakurai, Y. Restoration of cadmium-contaminated paddy soils by washing with ferric chloride: Cd extraction mechanism and bench-scale verification. Chemosphere 2008, 70, 1035–1043. [Google Scholar] [CrossRef] [PubMed]
  30. Jones, J.B., Jr.; Case, V.W. Sampling, Handling, and Analyzing Plant Tissue Samples. Soil Test. Plant Anal. 1990, 3, 389–427. [Google Scholar]
  31. Ji, L. The high-temperature volatilization of sylvite and solid reaction process between sylvite and minerals. In IOP Conference Series: Earth and Environmental Science; Institute of Physics Publishing: Bristol, UK, 2019. [Google Scholar] [CrossRef]
  32. Prasetya, F.A.; Ishizuka, S.; Fukasawa, T.; Ishigami, T.; Sakemi, K.; Fukuda, T.; Fukui, K. Influence of ash species on particle size dependence of water- and citric-acid-soluble potassium concentrations of woody biomass combustion ashes with low potassium content. J. Energy Inst. 2023, 111, 101396. [Google Scholar] [CrossRef]
  33. Isaac, M.E.; Kimaro, A.A. Diagnosis of Nutrient Imbalances with Vector Analysis in Agroforestry Systems. J. Environ. Qual. 2011, 40, 860–866. [Google Scholar] [CrossRef]
  34. Gaothobogwe, K.; Ultra, V.; Rantong, G.; Majoni, S.; Manyiwa, T.; Mokgosi, S.; Dineo, O.; Gajaje, K.; Marenga, W.; Sefatlhi, K. Mitigation of Potentially Toxic Elements in Corn (Zea mays) Grown in Farmlands Near Cu-Ni Mine in Central Botswana. Soil Sediment Contam. 2025, 1–27. [Google Scholar] [CrossRef]
  35. Bourg, A.C.M.; Loch, P.G. Mobilization of Heavy Metals as Affected by pH and Redox Conditions; Springer: Berlin/Heidelberg, Germany, 1995. [Google Scholar]
  36. Kim, Y.N.; Lee, K.A.; Lee, M.; Kim, K.R. Synergetic effect of complex soil amendments to improve soil quality and alleviate toxicity of heavy metal(loid)s in contaminated arable soil: Toward securing crop food safety and productivity. Environ. Sci. Pollut. Res. 2022, 29, 87555–87567. [Google Scholar] [CrossRef]
  37. Bolan, N.; Kunhikrishnan, A.; Thangarajan, R.; Kumpiene, J.; Park, J.; Makino, T.; Kirkham, M.B.; Scheckel, K. Remediation of heavy metal(loid)s contaminated soils-To mobilize or to immobilize? J. Hazard. Mater. 2014, 266, 141–166. [Google Scholar] [CrossRef] [PubMed]
  38. Taupedi, S.B.; Ultra, V.U. Morupule fly ash as amendments in agricultural soil in Central Botswana. Environ. Technol. Innov. 2022, 28, 102695. [Google Scholar] [CrossRef]
  39. Arinzechi, C.; Dong, C.; Huang, P.; Zhao, P.; Liao, Q.; Li, Q.; Yang, Z. Synergistic mitigation of cadmium stress in rice (Oryzasativa L.) through combined selenium, calcium, and magnesium supplementation. Environ. Geochem. Health 2024, 46, 435. [Google Scholar] [CrossRef] [PubMed]
  40. Curtin, D.; Peterson, M.E.; Anderson, C.R. pH-dependence of organic matter solubility: Base type effects on dissolved organic C, N, P, and S in soils with contrasting mineralogy. Geoderma 2016, 271, 161–172. [Google Scholar] [CrossRef]
  41. Xing, J.; Xu, G.; Li, G. Analysis of the complexation behaviors of Cu(II) with DOM from sludge-based biochars and agricultural soil: Effect of pyrolysis temperature. Chemosphere 2020, 250, 126184. [Google Scholar] [CrossRef]
  42. Zhou, X.; Cao, H. Effect of Common Ions in Agricultural Additives on the Retention of Cd, Cu, and Cr in Farmland Soils. Sustainability 2024, 16, 4870. [Google Scholar] [CrossRef]
  43. Sutton, R.; Sposito, G. Molecular structure in soil humic substances: The new view. Environ. Sci. Technol. 2005, 39, 9009–9015. [Google Scholar] [CrossRef]
  44. Sudiono, S.; Yuniarti, M.; Siswanta, D.; Kunarti, E.S.; Triyono, T.; Santosa, S.J. The role of carboxyl and hydroxyl groups of humic acid in removing AuCl4– from aqueous solution. Indones. J. Chem. 2017, 17, 95–104. [Google Scholar] [CrossRef]
  45. Song, J.; Jin, X.; Wang, X.C.; Jin, P. Preferential binding properties of carboxyl and hydroxyl groups with aluminium salts for humic acid removal. Chemosphere 2019, 234, 478–487. [Google Scholar] [CrossRef]
  46. Zhu, Y.; Jin, Y.; Liu, X.; Miao, T.; Guan, Q.; Yang, R.; Qu, J. Insight into interactions of heavy metals with livestock manure compost-derived dissolved organic matter using EEM-PARAFAC and 2D-FTIR-COS analyses. J. Hazard. Mater. 2021, 420, 126532. [Google Scholar] [CrossRef] [PubMed]
  47. Kotasâ, J.; Stasicka, Z. Chromium occurrence in the environment and methods of its speciation. Environ. Pollut. 2000, 107, 263–283. [Google Scholar] [CrossRef] [PubMed]
  48. Tandon, R.K.; Crisp, P.T.; Ellis, J.; Baker, R.S. Effect of ph on chromium(VI) species in solution. Talanta 1984, 31, 227–228. [Google Scholar] [CrossRef]
  49. Makino, T.; Kamewada, K.; Hatta, T.; Takahashi, Y.; Sakura, Y. Determination of optimal chromium oxidation conditions and evaluation of soil oxidative activity in soils. J. Geochem. Explor. 1998, 64, 435–441. [Google Scholar] [CrossRef]
  50. Gale, N.; Halim, A.; Horsburgh, M.; Thomas, S.C. Comparative responses of early-successional plants to charcoal soil amendments. Ecosphere 2017, 8, e01933. [Google Scholar] [CrossRef]
  51. Ferm, A.; Hokkanen, T.; Moilanen, M.; Issakainen, J. Effects of wood bark ash on the growth and nutrition of a Scots pine afforestation in central Finland. Plant Soil 1992, 147, 305–316. [Google Scholar] [CrossRef]
  52. Vestergård, M.; Bang-Andreasen, T.; Buss, S.M.; Cruz-Paredes, C.; Bentzon-Tilia, S.; Ekelund, F.; Kjøller, R.; Mortensen, L.H.; Rønn, R. The relative importance of the bacterial pathway and soil inorganic nitrogen increase across an extreme wood-ash application gradient. GCB Bioenergy 2018, 10, 320–334. [Google Scholar] [CrossRef]
Figure 1. Total consumption of 0.5 M HCl for titration.
Agronomy 15 01097 g001
Figure 2. XRD pattern of wood ash; Cu Kα, λ: 1.54187 Å; Bragg–Brentano scheme; scintillation counter detector; scattering slit: 1/4 degrees; receiving slit: 0.3 mm; monochromator receiving slit: 0.8 mm.
Agronomy 15 01097 g002
Figure 3. SEM micrographs at different magnifications. EDS analysis was performed on the area indicated by the dashed box, and the solid box shows a magnified view of this region.
Agronomy 15 01097 g003
Figure 4. SEM-EDS analysis of wood ash.
Agronomy 15 01097 g004
Figure 5. XANES analysis of Cr in wood ash.
Agronomy 15 01097 g005
Figure 6. Soil solution pH at different sampling times. Values are means, with error bars representing standard errors (n = 3). Asterisk indicates significant differences between groups, with the number of asterisks indicating the level of significance (*** p < 0.001). NWA and 1% WA represent No Wood Ash and 1%-Wood Ash, respectively; 1st and 2nd refer to the first and second soil solution samples taken, respectively.
Agronomy 15 01097 g006
Figure 7. Concentration of (A) K, (B) Ca, and (C) Mg in soil solution and crops. Values are means, with error bars representing standard errors (n = 3). Asterisk indicates significant differences between groups, with the number of asterisks indicating the level of significance (* p < 0.05; ** p < 0.01; *** p < 0.001). NWA and 1%-WA represent No Wood Ash and 1%-Wood Ash, respectively; 1st and 2nd refer to the first and second soil solution samples taken, respectively; crop refers to crop analysis. The values on the left y-axis represent the elemental concentration in the soil solution, while the right y-axis represents the concentration of elements in the crops. The legend applies to the figures representing elemental concentration in both the soil solution and crops.
Agronomy 15 01097 g007
Figure 8. Concentration of (A) P and (B) Mo in soil solution and crops. Asterisk indicates significant differences between groups, with the number of asterisks indicating the level of significance (** p < 0.01; *** p < 0.001).
Agronomy 15 01097 g008
Figure 9. Concentration of (A) Ni, (B) Mn, (C) Zn, and (D) Cd in soil solution and crops. Asterisk indicates significant differences between groups, with the number of asterisks indicating the level of significance (* p < 0.05; ** p < 0.01; *** p < 0.001).
Agronomy 15 01097 g009aAgronomy 15 01097 g009b
Figure 10. Concentration of (A) Cu and (B) Cr in soil solution and crops. Asterisk indicates significant differences between groups, with the number of asterisks indicating the level of significance (* p < 0.05; ** p < 0.01; *** p < 0.001).
Agronomy 15 01097 g010
Figure 11. Dry weight of the aboveground crops. Asterisk indicates significant differences between groups, with the number of asterisks indicating the level of significance (*** p < 0.001).
Agronomy 15 01097 g011
Figure 12. Nutrient vector diagrams of the measured elements in the two treatments, No Wood Ash and 1%-Wood Ash: (a) increase in relative nutrient content; (b) decrease in relative nutrient content. The diagram illustrates the relative nutrient concentration and relative nutrient content of each treatment compared to the control. The black solid line represents 100% relative biomass, while the red solid line indicates the relative biomass in the wood ash treatment. The dashed lines represent vectors originating from the control reference point.
Agronomy 15 01097 g012aAgronomy 15 01097 g012b
Figure 13. Diagram of pH and Cr(III) activity to precipitate Cr hydroxides.
Agronomy 15 01097 g013
Table 1. Physicochemical properties of soil.
SoilGray Lowland Soil
pH (H2O)4.50 ± 0.071
EC0.350 ± 0.035 mS/cm
CEC8.60 ± 0.212 cmolc/kg
K+0.028 ± 0 cmolc/kg
Ca2+2.13 ± 0 cmolc/kg
Mg2+0.370 ± 0 cmolc/kg
P2O515.5 mg ± 0.141/100 g
NH4+0.700 mg ± 0.071/100 g
NO319.0 mg ± 0.148/100 g
Carbon Content3.10 ± 0%
Cr0.017 ± 0 mg/kg
Cd0.030 ± 0 mg/kg
Cr and Cd are measured using water extraction at a 1:10 ratio.
Table 2. Element contents in wood ash.
ElementUnitContent
Micro elementsCdmg/kg2.40
Crmg/kg160
Asmg/kg22.0
Cumg/kg200
Znmg/kg160
Nimg/kg90.0
Macro elementsMgg/kg29.0
Pg/kg6.70
Kg/kg190
Cag/kg130
Sig/kg98.0
Alg/kg16.0
Table 3. Leaching amounts of inorganic elements.
ElementUnitContent
Micro elementsHgmg/L0.0005
Cdmg/L0.0003
Pbmg/L0.005
Cr (VI)mg/L2.70
Asmg/L0.840
Semg/L0.110
Table 4. Results from fitting of standards.
StandardsWeight (%)
FeCr2O458.7
CrCl38.20
K2CrO433.1
Table 5. Cd concentration in fresh crops.
NWA1%-WA
Fresh Weight1.60 g5.60 g
Dry Weight0.140 g0.400 g
DryConc.8.10 mg/kg0.793 mg/kg
FreshConc.0.709 mg/kg0.057 mg/kg
DryConc.: concentration in dry crop; FreshConc.: concentration in fresh crop. NWA: No Wood Ash; 1%-WA: 1%-Wood Ash.
Table 6. Results of Cu and Cr chemical speciation and DOC.
NWA1%-WA
FA1-Cu71.4 ± 1.02%7.70 ± 3.70%
FA2-Cu6.15 ± 1.74%92.3 ± 3.70%
FA1-Cr(III)14.2 ± 5.15%0.10 ± 0.05%
FA2-Cr(III)85.8 ± 5.15%99.9 ± 0.05%
DOC5.23 ± 2.15 mg/L283 ± 85.8 mg/L
NWA: No Wood Ash; 1%-WA: 1%-Wood Ash; FA1: carboxyl complex; FA2: hydroxyl complex; DOC: dissolved organic carbon.
Disclaimer/Publisher’s Note: The statements, opinions and data contained in all publications are solely those of the individual author(s) and contributor(s) and not of MDPI and/or the editor(s). MDPI and/or the editor(s) disclaim responsibility for any injury to people or property resulting from any ideas, methods, instructions or products referred to in the content.

