Article

Heavy Metals Distribution and Source Identification in Contaminated Agricultural Soils: Isotopic and Multi-Model Analysis

1
Nanjing Institute of Environmental Sciences, Ministry of Ecology and Environment of China, Nanjing 210042, China
2
School of Sustainability, Civil and Environmental Engineering, University of Surrey, Guildford GU2 7XH, UK
*
Author to whom correspondence should be addressed.
Agronomy 2025, 15(4), 812; https://doi.org/10.3390/agronomy15040812
Submission received: 3 March 2025 / Revised: 22 March 2025 / Accepted: 23 March 2025 / Published: 26 March 2025
(This article belongs to the Special Issue Heavy Metal Pollution and Prevention in Agricultural Soils)

Abstract

:
Heavy metal pollution in agricultural soil has been tightly associated with anthropogenic emissions. Although there are many studies that focus on a regional scale, the source identification of heavy metal contamination on a field scale around industrial areas remains unclear. The average concentrations in topsoils of Hg, Cd, As, Pb, Cr, Ni, Zn, and Cu were 2.07, 0.13, 8.56, 42.3, 81.1, 37.3, 105, and 43.8 mg kg−1, respectively. The enrichment of Hg was particularly presented on topsoils, with the highest single pollution index (Pi) (9.00) and ecological risk index (Eri) (922) values. An integrated methodology was employed in source identification of heavy metals contamination, especially for Hg, including Pearson’s and PCA analysis, soil profile morphology, mathematical modeling, and Hg isotope analysis. Results revealed that the concentrations of Hg decreased as a function of depth, suggesting Hg contamination was an anthropogenic source and can be supported by Hg isotope analysis. The negative Δ199Hg values of the residual Hg (F4-Hg) and soil profile in 80–100 cm deviate from those of the soil profiles in 0–80 cm, indicating exogenous input of Hg occurred in the study area. According to the UNMIX model, the contribution of coal combustion, agricultural activities, parent material, and industrial/traffic emissions to Hg accumulation in soils were 66.2%, 16.9%, 9.81%, and 7.0%, respectively. However, the contribution rates calculated with the PMF model of mixed industrial source, traffic emissions, and parent material were 71.4%, 27.8%, and 0.8%, respectively. This study can accurately quantify and identify the factors contributing to heavy metal contamination in agricultural soil on a field scale.

1. Introduction

Heavy metals contamination in agricultural soils has attracted increasing concern due to its damage to crop safety and quality, the sustainability of agriculture, and the security of the human environmental ecosystem [1,2,3,4]. Heavy metals, such as mercury (Hg), cadmium (Cd), chromium (Cr), and lead (Pb), are a pressing problem given their high toxicity, non-biodegradability, persistent behavior, and bioaccumulation in the food chain [5,6,7]. Particularly, Hg has induced critical public health and environmental damage, which attracts the most concern from researchers around the world [8]. Human activities lead to heavy metals entering the agricultural soils. Besides, identifying soil heavy metal sources can provide a key basis for ascertaining pollution levels while formulating environmental protection policies [9,10]. Thus, identifying the source and quantifying heavy metal distribution in agricultural soils is essential to prevent increasing contamination [11,12,13].
Heavy metals pollution sources can be traced back to natural phenomena like parent material, volcanic activities, weathering of rocks, and other geological processes [11,13,14,15]. Human activities, including industrial operations, farming practices, and transportation, contribute to heavy metal accumulation in soils. Agricultural practices such as using irrigation water, sedimentary fertilizers, pesticides, chemical fertilizers, and livestock manure, along with wastewater, solid waste, and industrial emissions, can increase the heavy metal concentration in soils [9,14,15,16]. Thus, it is important to identify and qualify the pollutant sources to establish soil contamination control policies and management strategies [11,16].
Quantitatively apportioning sources with multi-model analyses were promising approaches to trace soil heavy metal sources, like correlation analysis (CA), principal component analysis (PCA), and positive matrix factorization (PMF) [1,11,12,17,18,19]. These complementary analyses can offer a robust foundation to make decisions regarding pollution control and remediation strategies. The combined model results yield a thorough comprehension of the pollution sources, facilitating the development of targeted and effective mitigation measures [17,20]. Pearson correlation is suitable for determining the linear dependency of two variables, while PCA serves as a data dimensionality reduction technique, aiming to explain most data variance with fewer variables, which were principal components [18]. The PMF is a mathematical matrix operation method that breaks down complex mixture data into multiple factors, determining each factor’s contribution to the observed data [19]. Zhou et al. (2016) collected 155 topsoil samples for assessing heavy metal pollution levels; as a result, Zn and Cd were mainly influenced by anthropogenic activities, while Cu and Hg were impacted by anthropogenic and natural sources [21]. Additionally, the PMF model was employed to evaluate soil heavy metal sources in the representative coastal economic development area of Southeastern China, and results indicated that the contamination was mostly derived from industrial atmospheric deposition, agricultural sources, and then natural sources [1]. Lv (2019) analyzed 10 heavy metal elements in 300 topsoils using PMF, revealing that As, Co, Cr, Cu, Mn, Ni, and Zn were primarily from natural sources [22]. Similarly, a strong correlation between predicted and observed data in agricultural fields was found with the PMF model [1,23]. In addition, the UNMIX model performs source apportionment by processing the input element concentration data, making it more convenient to use [1,24,25]. GIS-based geo-statistical plus local conditions for apportioning heavy metal sources was applied in [26]. However, although GIS-based geostatistical methods can be applied to source identification, it is only appropriated for a large scale but not a field. Analyzing soil profile morphology is also a valuable method to identify soil pollution sources. This process involves assessing the soil heavy metal vertical distribution and their speciation by examining heavy metal speciation and content within soil profiles at diverse depths [27,28]. By comparing the heavy metal speciation across different soil layers, an initial evaluation of anthropogenic pollution in soils can be identified [29,30,31]. Using isotopes for source identification has become popular recently [31,32,33]. As Hg isotope analysis has developed, it has become a promising approach to identify environmental Hg sources. Distinct isotopic signatures are often exhibited by different pollution sources, allowing for the identification and quantification of contributions from various emission sources. By analyzing the isotopic composition of pollutants in environmental samples, researchers can trace their origin and identify the pollution sources [34,35].
Soil pollution is multi-source and requires complementary approaches to enhance reliability and accuracy while tracing pollutant sources. This study focused on (1) investigating heavy metal distribution patterns, contamination status, and potential health risks in agricultural soil and (2) integrating multi-variable statistical receptor models and Hg isotope composition to identify the possible pollutant sources in the study area. This investigation could offer a broader understanding of soil contamination sources and their respective contributions, which can be beneficial for the management of specific strategies for soil remediation and sustainable land management in agricultural settings.

2. Materials and Methods

2.1. Study Area

Our study site is located in Zhejiang Province, a southeastern region of China, geographically defined by the coordinates E120.685833°–E120.686944° and N30.810000°–N30.810278°. The area exhibited a unique layout where densely populated residential zones are encircled by agricultural fields. Several industrial facilities, both current and historical, are dispersed throughout the area, including a thermal power plant, cloth printing and dyeing facilities, as well as spinning mills. Additionally, a major roadway intersects the village. The agricultural practices in the region follow a crop rotation system, cultivating rice in the summer and wheat in the winter.

2.2. Sample Collection and Preparation

Between November 2020 and February 2021, a total of 38 soil samples were obtained from the 0 to 20 cm depth at the site, as illustrated in Figure S1. The soil sampling procedure followed a regular and systematic approach. A sampling grid, approximately 40 m × 40 m in size, was set up to ensure representative coverage. Approximately 1.5 kg of each composite sample was obtained through pooling soil samples collected at five distinct points, with one central point and four other points located within a 2 m radius, specifically toward the north, east, south, and west directions. Moreover, we obtained seven soil profile samples representing different depths in the soil profile: 0–20, 20–40, 40–60, 60–80, and 80–100 cm. Additionally, two sediment samples from the irrigation channel were collected at the entrance and exit of the study area. After air-drying, soil and sediment samples were sieved through a 2-mm mesh before analysis.

2.3. Chemical Analysis

Solid samples were digested in a poly-tetrafluoroethylene container with a mixture of HNO3 (Guangtuo, guarantee reagent, 65.0–67.0%, Nanjing, China) (5 mL)-HF (Guangtuo, guarantee reagent, 99.8%, Nanjing, China) (1 mL)-HClO4 (Guangtuo, guarantee reagent, 70–72%, Nanjing, China) (1 mL). This mixture was heated at 180 °C for 10 h, cooled to ambient temperature, and diluted with deionized water till 30 mL. Subsequently, 6 N HCl (Guangtuo, guarantee reagent, 36–38%, China) distilled with sub-boiling quartz (4 mL) was added to acidify this resultant aqueous samples to pH 1.5. An inductively-coupled plasma-mass spectrometer (ICP-MS, Agilent 7500a, Santa Clara, CA, USA) and atomic fluorescence spectrophotometer (AFS-8220) (Hg and As) were used to determine heavy metal concentrations (Cu, Zn, Cr, Cd and Ni). Sample replicates, standard reference materials, and reagent blanks (GBW07429, the National Research Center for Certified Reference Materials of China, Shanghai, China) were incorporated into all analyses to ensure quality. The recovery of Cu, Cr, Ni, Zn, As, Hg, Pb, and Cd were 96.2%, 106.7%, 91.9%, 109.3%, 99.5%, 98.6%, 104.4%, and 101.6%, respectively.
The soil sample processing was completed with the double-stage offline combustion-trapping technology, as reported in detail [31]. Briefly, Hg was extracted from soil samples with the catalyst tube (LECO, USA, St. Joseph, MI, USA) after three stages of heating treatments with high purity oxygen being introduced, and 10 mL mixed acid (HNO3/HCl = 2:1(v:v)) rapping solution was added for capturing the thermally-decomposed Hg. Additionally, prior to the isotope analysis, we utilized the Nu-Plasma II multi-collector inductively coupled plasma-mass spectrometer (Nu Instruments, Oxford, UK) to dilute Hg solutions till 1 ng⋅mL−1, which was used in [32]. Besides, NIST SRM 3133 was detected similarly to soil solution samples, while the Hg isotope analysis process was conducted similarly to an analyzing standard solution. We identified MDF for Hg isotope in δXXXHg in line with NIST-3133, which was examined before and following every sample, and it is expressed as:
δ XXX Hg = [ ( Hg XXX / Hg 198 ) sample ( Hg XXX / Hg 198 ) nist 3133 1 ] × 1000
in which XXX represents the mass number for every Hg isotope, which can be 199, 200, and 201. The MIF can be described as Δ-values (ΔXXXHg), which were calculated as [36]:
Δ199Hg (‰) = δ199Hg − (0.2520 × δ202Hg)
Δ200Hg (‰) = δ200Hg − (0.5024 × δ202Hg)
Δ201Hg (‰) = δ201Hg − (0.7520 × δ202Hg)
Standard analytical approaches were used to measure soil physicochemical characteristics according to the description by [37]. A soil:water ratio of 1:2.5 was used to analyze soil pH with a glass electrode. Besides, the potassium dichromate wet combustion process was adopted for measuring soil organic matter (SOM) levels. Meanwhile, we analyzed soil cation exchange capacity (CEC) through ammonium acetate exchange (1.0 mol L−1, pH 7.0) as well as HCl titration. BCR sequential extraction of soil Hg was divided into F1 (acid extractable), F2 (reducible), F3 (oxidizable) or F4 (residual). Duplicates were measured, and the relative standard deviation was <10%.

2.4. Statistical Analysis

The equation below was utilized to determine the single pollution index (PI) for soil and rice pollutants:
PI = CMeasured/CStandard
where CMeasured stands for the determined total content, whereas CStandard stands for maximal soil heavy metal contents in line with Soil Environmental Quality (GB 15618-2018).
Ecological risk index (Eri) represents an indicator for assessing soil heavy metal contamination levels and ecological risk [2,38] and was calculated as:
Eri = Tri × (Ci/Cni)
RI = i m   E r i
in which Ci stands for the detected total metal content, Cni represents heavy metal’s background value, and Tri accounts for heavy metal’s toxicity coefficient. The Tri of Hg, Cd, As, Pb, Cr, Ni, Zn, and Cu are 40, 30, 10, 5, 2 5, 1, and 5, respectively [1,23,39,40]. The Risk Index (RI) is the total Eri and exhibits the possible Eri of overall contamination for soil heavy metals [2,38]. Eri for a single heavy metal element can be determined by low (Ei ≤ 40; RI ≤ 90), moderate (40 < Ei ≤ 80; 90 < RI ≤ 180), considerable (80 < Ei ≤ 160; 180 < RI ≤ 360), very high (160 < Ei ≤ 320; 360 < RI ≤ 720) and extremely high (Ei > 320; RI > 720) potential ecological risk.
SPSS 25.0 (IBM SPSS Statistics for Windows, Armonk, NY, USA) and Microsoft Excel were employed for data analysis. The spatial distribution of the Pb concentrations was generated by the kriging method in ArcGIS 10.5 (ESRI, ArcGIS 10.5, Redlands, CA, USA). We also computed the Pearson correlation coefficients to determine the relations of two variables. The UNMIX 6.0 and EPA PMF 5.0 were adopted for assessing heavy metal source apportionment.

3. Results and Discussion

3.1. Soil Properties, Concentrations, Distributions, and Risk Assessments of Heavy Metals in the Study Area

Table 1 presents soil properties and heavy metal concentrations. As observed, coefficients of variation (CV) of soil physicochemical properties were low. The average pH, SOM, and CEC were 6.51, 40.9 g kg−1, and 30.7 cmol (+) kg−1, respectively. Soil pH ranged between acidic and weakly calcareous, with an average of 6.51. However, the mean concentrations of Hg, Cd, As, Pb, Cr, Ni, Zn, and Cu in soil samples were 2.07, 0.13, 8.56, 42.3, 81.1, 37.3, 105, and 43.8 mg kg−1, respectively. Elevated concentrations of Hg, Cd, Pb, Cr, Ni, Zn, and Cu (with the exception of As) were observed relative to respective background values (Bi) (A horizon) of Zhejiang province, indicating a severe enrichment of heavy metals in the study area (China National Environmental Monitoring Centre, 1990) [41]. The Hg concentration was significantly higher, about 20.8 times greater than the background values, indicating a severe enrichment of Hg in the study area. According to the risk screening values for soil contamination of agricultural land in the Chinese Soil Environmental Quality scheme (GB 15618-2018), soil Hg concentrations exceeded the screening value in all sampling points by about 9 times at the maximum, which was higher than the average in Zhejiang province of 0.25 mg/kg [23]. The results revealed there was a higher pollution risk for soil Hg in the study area, which could potentially impact crop quality and, subsequently, human health. Elevated CV of soil heavy metals were not exhibited, indicating the impact of local anthropogenic activities as the single source [1]. Three soil samples (7.89% overall) exceeded limits for Cu based on risk screening values (GB 15618-2018). Soil samples utilized in this work did not exceed the maximum permissible concentrations of Pb, Ni, Cr, Cd, As, and Zn.
Figure 1 displays heavy metal spatial distributions and soil pH. Overall, the spatial distribution of soil heavy metal exhibited a significant heterogeneity between the interior and exterior of our study area. Hotspots of high Hg, Cu, Pb, Zn, Cd, and As were distributed within the northwestern area, with a low-value area at the center, but exhibited more dispersed distribution patterns for Ni and Cd. Compared to Cd, its distribution was evenly distinct within the high Ni area. As a result, Hg, Cu, Pb, Zn, Cd, and As showed spatial coherence. Heavy metals, which mainly originate from anthropogenic activities such as industrial and traffic emissions and irrigation, can affect spatial distribution [1,42]. Notably, one particular area demonstrated a significantly elevated total Hg concentration, indicating the presence of a localized source point that resulted in soil Hg pollution. Therefore, the highest Hg, Cu, Pb, Zn, Cd, and As concentrations in soils were located at irrigation canal inlets, and this area was closest to the roads, which was consistent with prior results [1,43].
The Pi and Eri of soil heavy metals were applied in evaluating the ecological risk of the study area and were listed in Tables S1 and S2 [39]. The Pi values of 8 heavy metal elements in soil surfaces displayed a descending order Hg (9.00) > Cu (0.68) > Zn (0.49) > Cr (0.48) > Ni (0.46) > Cd (0.44) > Pb (0.43) > As (0.32). Only Hg revealed a Pi value exceeding 1, indicating the contaminations of other heavy metals were not severe. However, attention should be paid to Hg concentrations with a maximum Pi of 9.00. The Eri values of heavy metals in topsoils were as follows: Hg (922) > Cd (56.5) > Cu (12.8) > As (9.57) > Pb (9.18) > Ni (6.93) > Cr (3.15) > Zn (1.53). Except for Hg and Cd, all values of Eri for heavy metals were below 40. The Eri of Cd in soils ranged from 11.2 to 75.9 with an average value of 56.5, indicating a moderate potential ecological risk of Cd within our study area. Furthermore, the average value of Eri for soil Hg was up to 922, and 100% of sampling points were classified as having extremely high ecological risk, suggesting that measures to restrain Hg contamination should be taken. The value of RI is influenced by soil heavy metal contents, pollutant type, toxicity level, and heavy metal pollution sensitivity in the media [39,40,44]. The RI value for the heavy metals within the agricultural soils of our study area was 1022, suggesting an extremely high potential ecological risk level within our selected area and facilitating high soil Hg concentrations.

3.2. Properties, Heavy Metal Concentration in Soil Profile

Heavy metal concentrations and SOM, CEC, and pH in the soil profile are shown in Figure S2. The lowest soil pH was observed within topsoils, which presented an increasing trend from 0 to 100 cm of soil layers. The pH values in the soil of 80–100 cm were above 7.5, suggesting the presence of an alkaline soil parent material. However, the distribution of SOM showed the opposite pattern, and this finding was consistent with studies in the Yangtze River Delta region [1,24,45]. The SOM content at 0–20 cm depth increased by 2.08 times relative to the deep depth (80–100 cm). The neutral-to-mildly alkaline pH and high SOM in surface soils, which increased initially and decreased with increasing depth, were possibly caused by organic and chemical fertilizer application [2,24,46]. The mid-layer soil (40–80 cm) had a relatively high CEC, while the surface (0–40 cm) and deep (80–100 cm) soils had lower CEC. The high cation exchange capacity of soil can result in a strong affinity for particle surfaces, and this may influence soil heavy metal behaviors, including migration, mobility, and speciation. This indicated that the surface soil lacks the fertility retention capability present in the mid-layer [47].
Soil concentrations of Hg, Pb, Cd, Zn, and Cu revealed an overall declined trend as a function of depth. Pb, Cd, and Cu concentrations in surface soil (0–20 cm) increased by 2.07, 2.49, and 1.99 folds relative to deepest soil (80–100 cm), indicating enrichment effects of these metals. The most significant variation was observed in the Hg concentration in soil surfaces, ranging from 1.09 to 5.40 mg kg−1. Total soil Hg concentration declined from the surface to the bottom, with concentrations 3.33 times higher on the surface (0–20 cm) compared to the deep layer (80–100 cm). This indicated that soil Hg contents were affected by substantial anthropogenic activities or other pollution sources [1,20,24,48,49], which is consistent with soil contamination induced by historical zinc smelting in Jaworzno
The total concentration of Hg at the 80–100 cm depth still exceeded the background value. Compared to the soil limits of Hg contamination in the agricultural land, exceedance rates were at 100%, 85.7%, 42.8%, 28.6%, and 0%, respectively, in the soil depth at 0–20, 20–40, 40–60, 60–80, and 80–100 cm. Noticed that parent materials can contribute to Hg accumulation in the study area. The Hg species distribution in different soil layers is shown in Figure S3. At the 0–60 cm soil depth, Hg mainly existed in the F3-Hg form, while in 60–100 cm soil layers, it mainly existed as F4-Hg. Hg distribution within deep soil (60–100 cm) differed significantly from that in-depth at 0–60 cm. The F4-Hg proportion at 60–100 cm depth was roughly double that at 0–60 cm, while total Hg concentration within deep soil (80–100 cm) still exceeded the background value. This indicated that Hg in the topsoil was under the influence of natural factors (parent material) and external pollution.
The greatest As concentration was detected within the mid-layer soil, decreasing toward the surface and deep layers. The moderate variability of Pb and Cu concentrations suggested the potential presence of anthropogenic pollution [50]. As, Cr, Ni, Cd, and Zn concentrations presented relatively low variability and consistent distributions, indicating predominantly natural sources. This observation aligned with Luo et al. (2015), who investigated heavy metal distribution patterns and sources within 13 soil samples by diverse depths (0–5, 5–10, 10–20 cm) and found a downward trend in soil heavy metals concentrations from surface to the deeper layers, supporting the conclusion that anthropogenic inputs primarily affect surface soils in this region [31]. Hg was identified as the primary contaminant in this area, necessitating special attention.

3.3. Source Identification of Heavy Metal in Soil

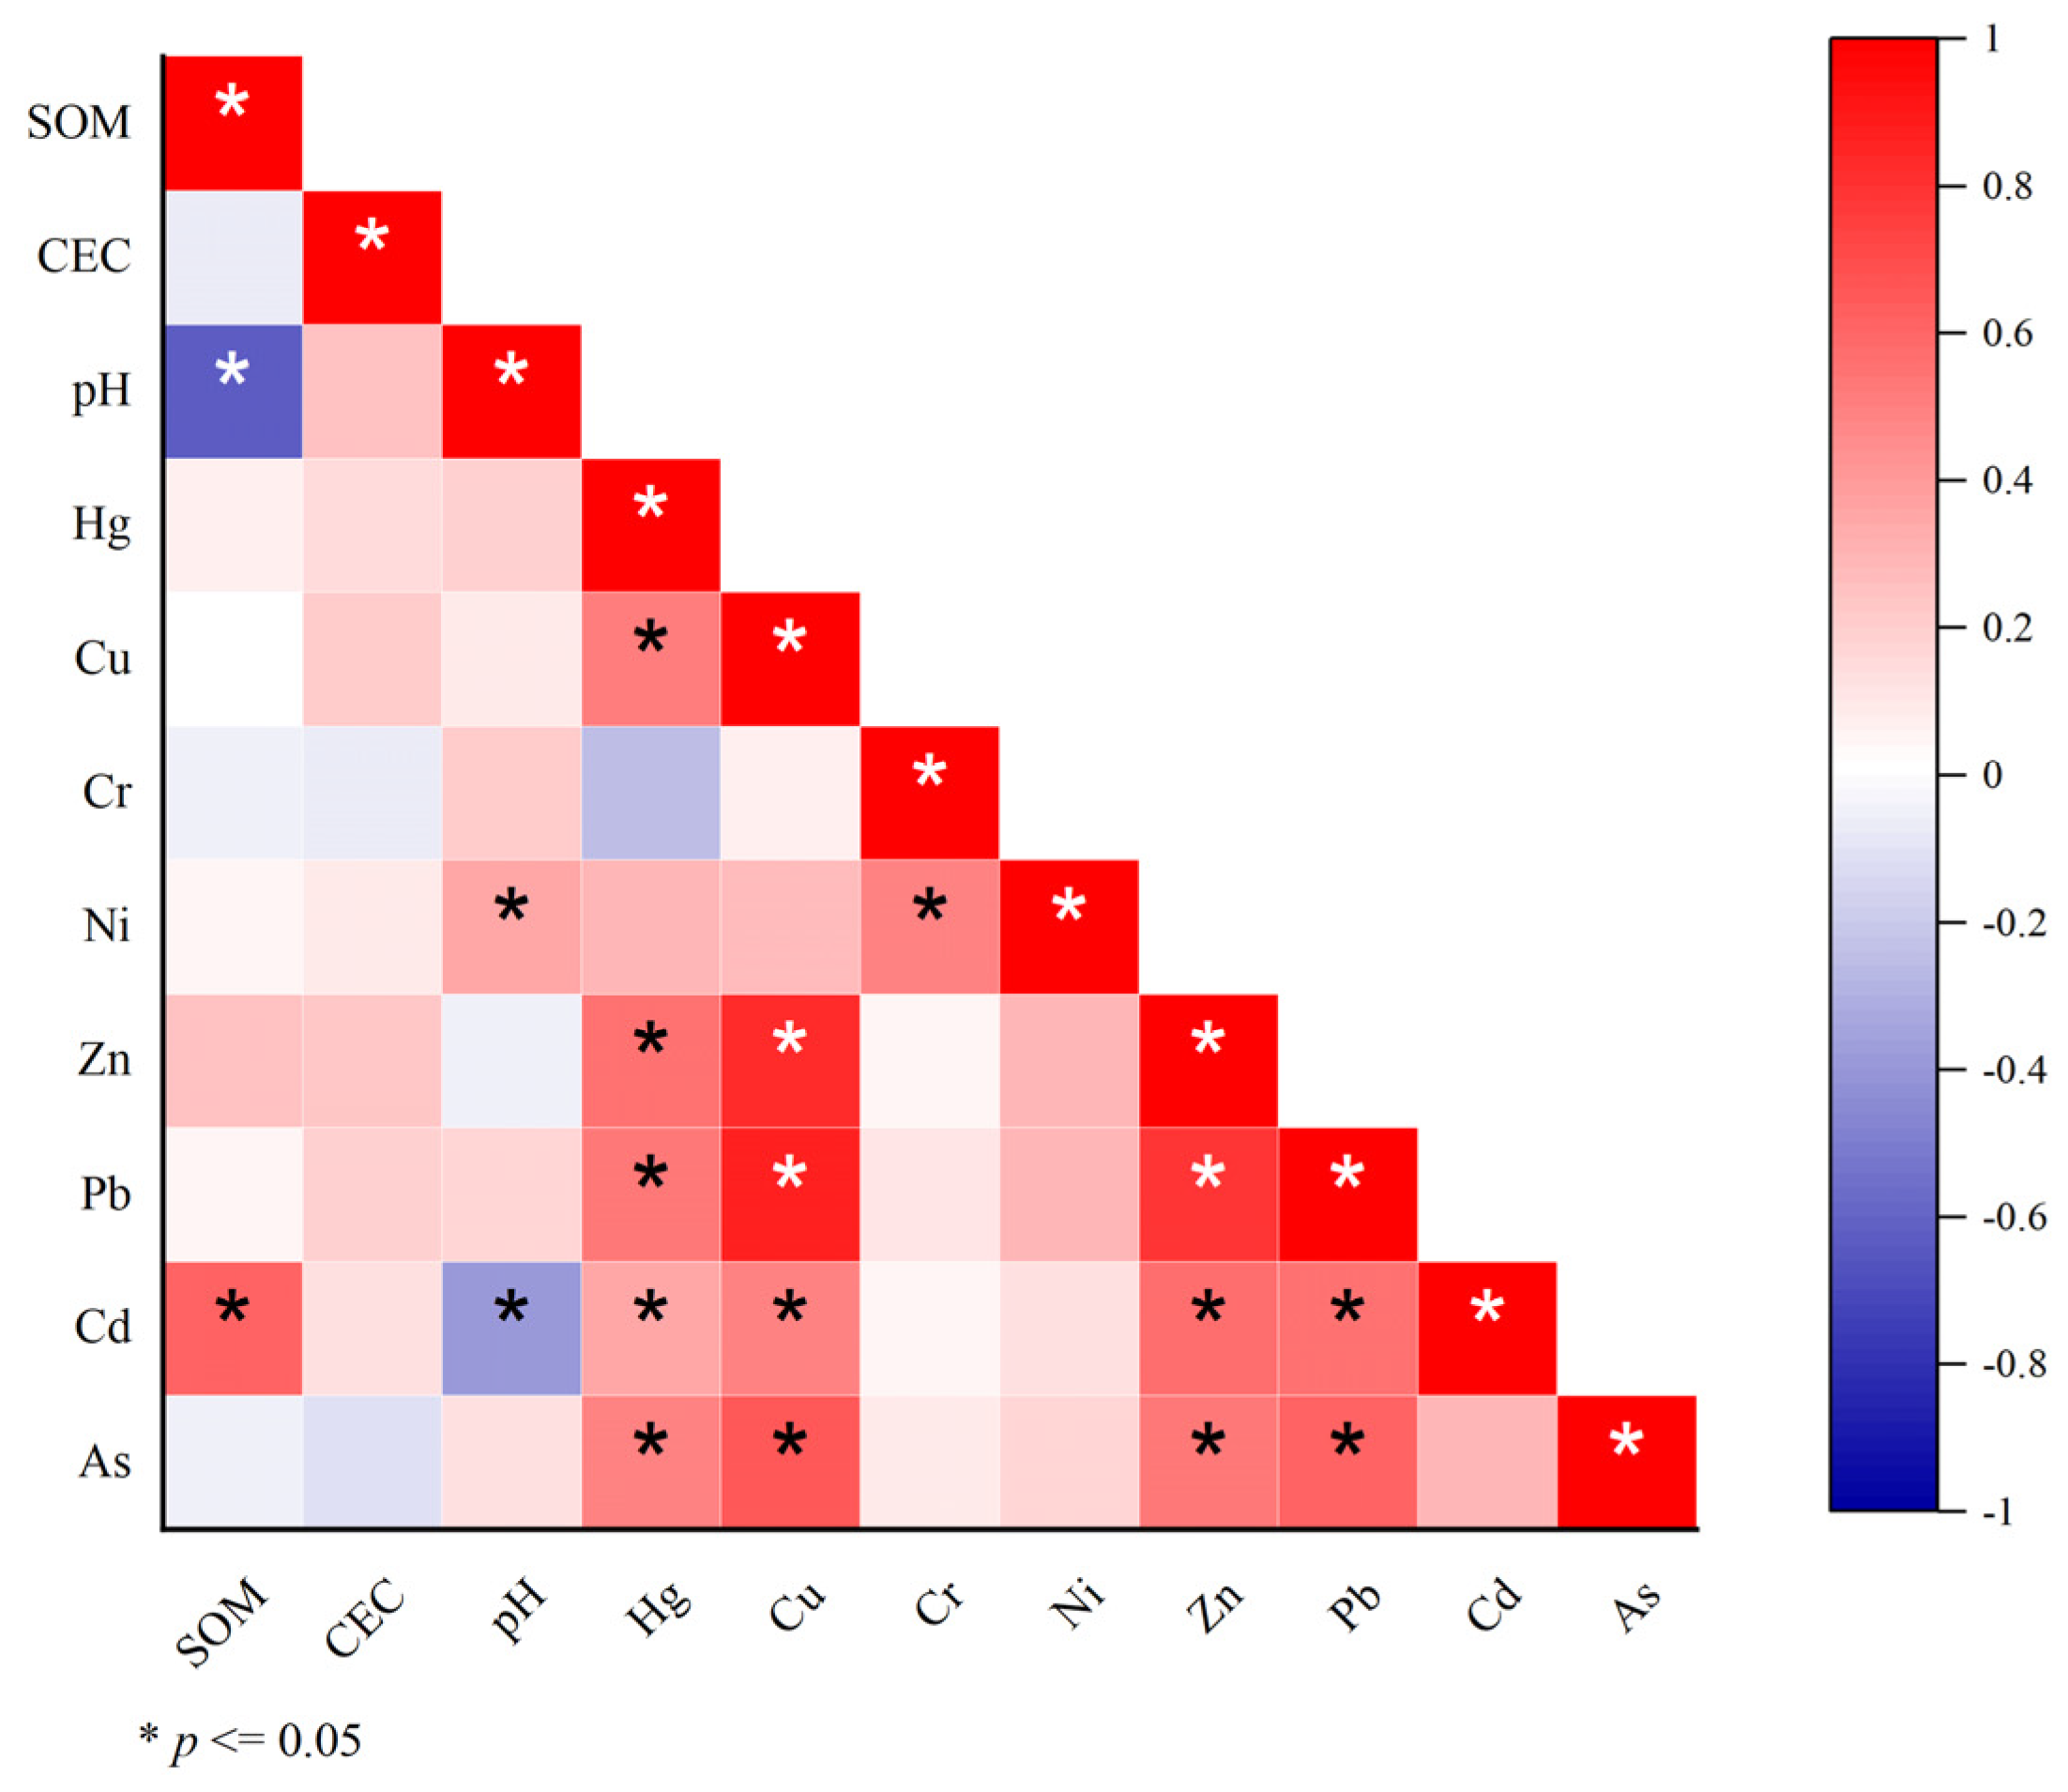
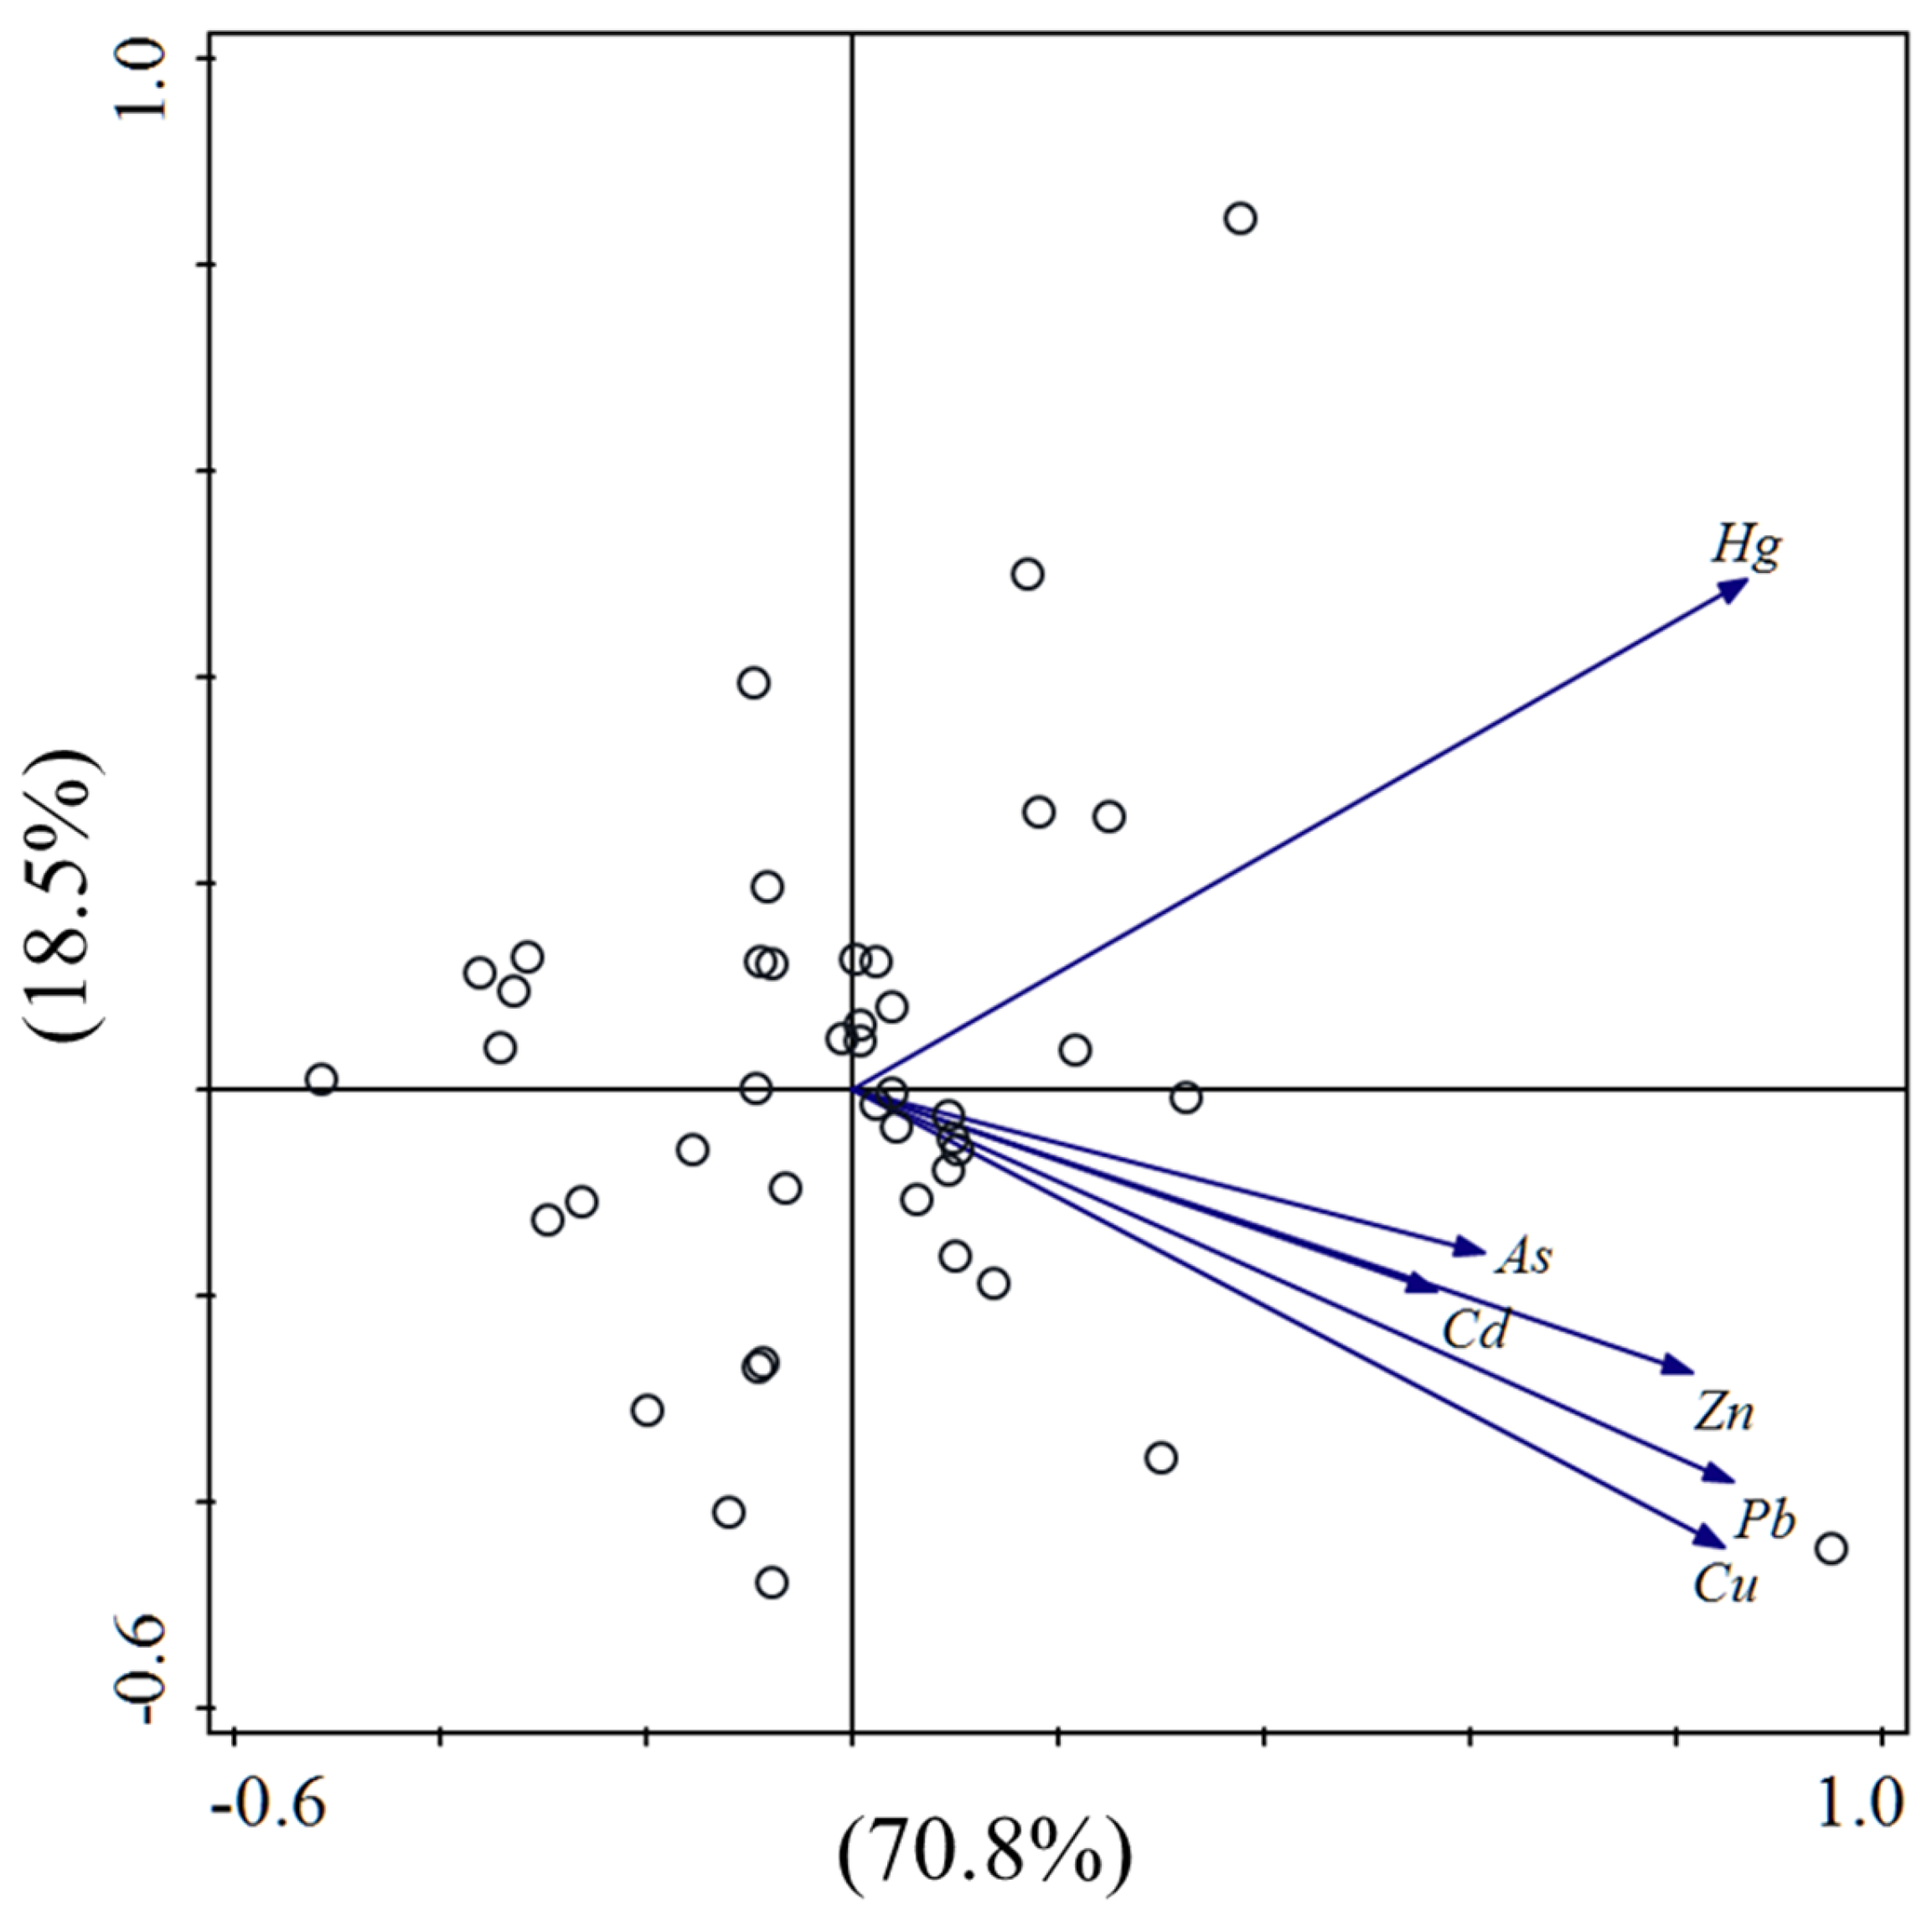
3.3.1. Source Identification by CA and PCA

Correlation analysis provided valuable insights into comprehending the behavior and interactions of heavy metals within soil systems. In Figure 2, Hg revealed the strongest positive correlations with all other elements (Cu, Zn, As, Cd, and Pb), and other elements correlated significantly with each other. Ni and Cr exhibited weak or no correlations with other elements, consistent with previous findings [6]. This pattern suggests different sources: Ni and Cr likely originate from natural processes, whereas the strongly correlated metals reflect anthropogenic inputs [20,22].
Due to strong correlations between Hg, Cu, Zn, As, Cd, and Pb, PCA analysis was applicable to those metals, providing comprehensive insights into their relationships, sources, and potential impacts on the environment (Figure 3). The first and second factors accounted for 70.8 and 18.5% of the total variation (p < 0.005), respectively. Cu, Zn, As, Cd, and Pb exhibited homogeneity, indicating a shared origin, while Hg appeared separately, suggesting different contamination sources. This observation could be attributed to the following: first of all, Cu, Zn, As, Cd, and Pb of natural origins, such as geological formations, weathering of rocks, and soil mineralization, resulting in similar geochemical behaviors and distributions [7]. It was also obtained three components, including industrial sources (Cd, Zn and Pb), nature sources (Cr and Ni) as well as agricultural sources (As and Cu) by using PCA analysis methods [51]. Secondly, human activities like mining, emissions from fossil fuel combustion, industrial processes, and agricultural practices can introduce these metals to the environmental systems through similar pathways, like air deposition, water runoff, and soil contamination [25,29,34]. Additionally, Hg exhibited a different contamination source due to its distinct behavior and sources of release. Hg can be emitted into the environment through multiple sources, such as industrial processes, coal combustion, waste incineration, and natural sources like volcanic activities. Its transportation and environmental behavior differentiate it from other metals, leading to its separate origin in the PCA analysis [51].

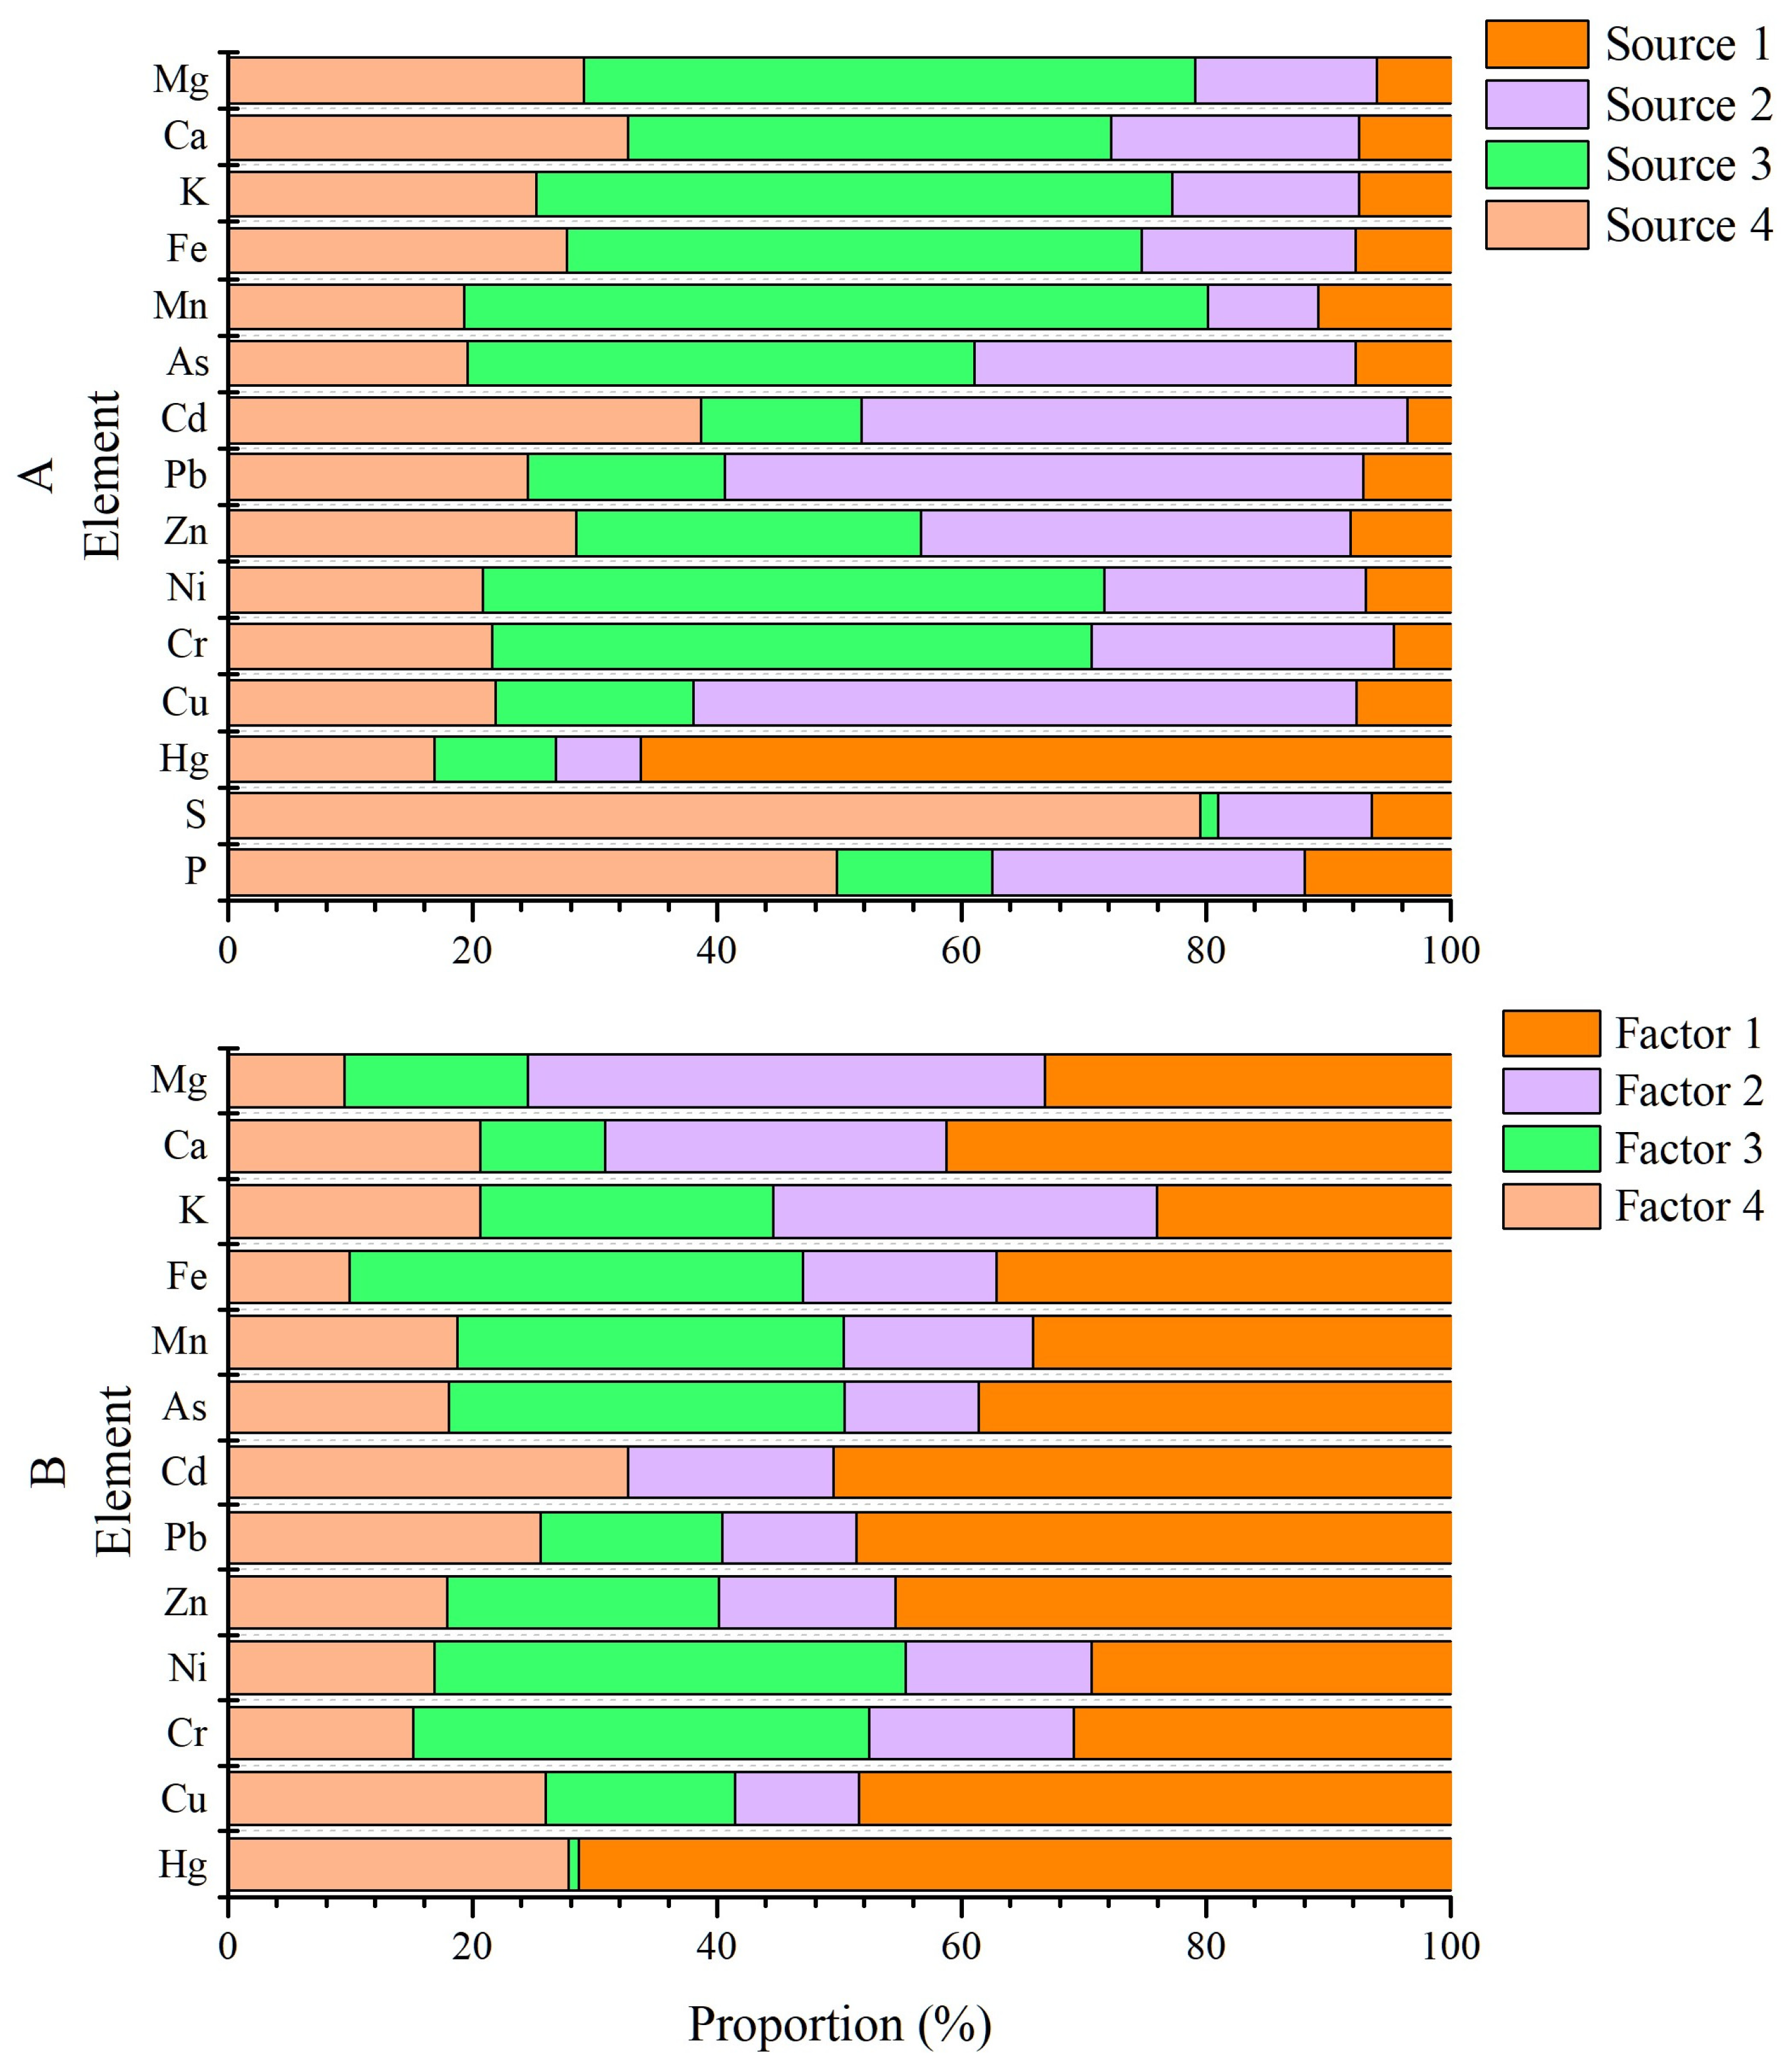
3.3.2. Source Identification by UNMIX

To better understand heavy metals source contribution, we examined 70 samples with UNMIX 6.0 software. As shown in Figure 4A, the contributions of different elements in soils originated from four sources (Min Rsq = 0.96, Min Rsq > 0.8, Min Sig/Noise = 2.08). Source 1 was characterized as predominantly Hg concentrations (66.2%), significantly higher than its presence in Source 2 (7.0%), Source 3 (9.81%), and Source 4 (16.9%). Environmental investigations showed chemical plants, waste incineration power plants, and textile printing and dyeing factories in the surrounding area, all with substantial coal consumption. During the coal combustion, Hg was released into the atmosphere initially and deposited into the soil through atmospheric deposition [13]. Coal combustion occupies over 20% of predicted global Hg emissions [34,52]. Given the Hg contribution with prominent coal consumption activities in the surrounding area, Source 1 is associated with emissions from coal combustion.
Source 2 revealed a primary contribution to Cd (44.7%), Pb (52.2%), Cu (54.3%), and Zn (35.1%) compared to their contributions in other sources, indicating that Source 2 played a dominant role in these elements. Although Zn had the highest contribution rate in Source 2, its contribution rates in Source 3 (28.2%) and Source 4 (28.4%) were also relatively high. Source 2 had a higher contribution to Cu and Pb, followed by Cr and Cd. Mechanical industries near the agricultural field might emit waste gases containing elements like Cu during processes such as electroplating [53]. Pb may originate from automobile exhaust emissions, entering the soil via deposition in the atmosphere [29]. Our study area was surrounded by highway intersections frequently with heavy truck transportation. Previous research reported that the braking process during transportation generated Cu, Cd, and Zn [54]; fuel consumption in vehicles released heavy metals like Cd, Cr, Cu, and Pb [34,55]. Therefore, Source 2 could represent industrial and transportation emissions.
Applying a similar analysis approach, Source 3 was identified as the major source for Ni (50.9%) and Cr (49.1%), as well as for Mn, Fe, K, and Mg, which are not elements of concern in the study area. Mn showed relatively less susceptibility to external disturbances, serving as an indicator for natural soil sources [56]. Additionally, a low coefficient of variation for Ni (7.7%) and Cr (9.2%) indicated minimal anthropogenic influence, confirming source 3 as soil parent material. While Source 4 is not the primary contributor for any single metal in the selected regions, it was associated with agricultural activities based on the elevated concentrations of P and S in soils. Phosphate-based fertilizers were extensively applied, leading to P accumulating in agricultural soils and limited P absorption into plants [47,56].

3.3.3. Source Identification by PMF

The contributions of different elemental sources analyzed using the PMF model are presented in Figure 4B. The calculated results remained relatively stable, indicating satisfactory PMF model performance, and our selected number of factors aligned well with the requirements of source apportionment analysis [19]. Factor 1 contributed significantly to Hg (71.4%), Cd (50.5%), and several other elements (>30% for Pb, As, Mn, Cu, and Zn), representing mixed industrial sources from nearby incineration power plants using coal as fuel. Factor 1 represented the mixed industrial source because our study area is near an incineration power plant, which primarily uses substantial quantities of coal as fuel. This combustion of coal is a significant contributor to soil heavy metal pollution, including Hg [57]. Based on similar findings, industrial activities contributed 24.9% to Zn, Cd, and Pb enrichment [26]. Additionally, there are potential pollution sources such as chemical plants, metal product factories, and textile printing and dyeing plants in the vicinity.
Factor 2 exhibited contributions of 31.3% for K, 27.9% for Ca, and 42.2% for Mg. Due to the low utilization efficiency of fertilizers, a significant portion of K remained in soils from compound fertilizers. Furthermore, the accumulation of Mg and Ca primarily originates from fertilizers and agrochemicals [37,57]. Thus, Factor 2 represented a source associated with agricultural activity.
For Factor 3, Fe, Cr, Mn, and Ni exhibited relatively notable contributions, with Ni, Cr, and Fe reaching 38.5%, 37.3%, and 37.1%, respectively. Previous studies have indicated that Fe, Mn, and Cr are characteristic elements of soil parent materials, and they are less influenced by external disturbances, primarily influenced by the formation of parent materials [30]. Considering the soil background values and CV, Ni and Cr were mainly influenced by the parent materials. Consequently, Factor 3 was the natural source.
Factor 4 accounted for the largest contribution to Cd, Pb, and Cu sources. The strong Cu-Pb correlation coefficient (>0.8) demonstrated similar origins. Cd and Pb in soils are influenced by traffic emissions, with Pb possibly originating from vehicle exhaust emissions [34,54]. Previous studies have also found that Cu and Pb were derived from traffic and industrial emissions, which contributed 25.9% to soil contamination [26]. Given the study area’s proximity to two major highways with heavy traffic confirmed Factor 4 as representing traffic emissions.

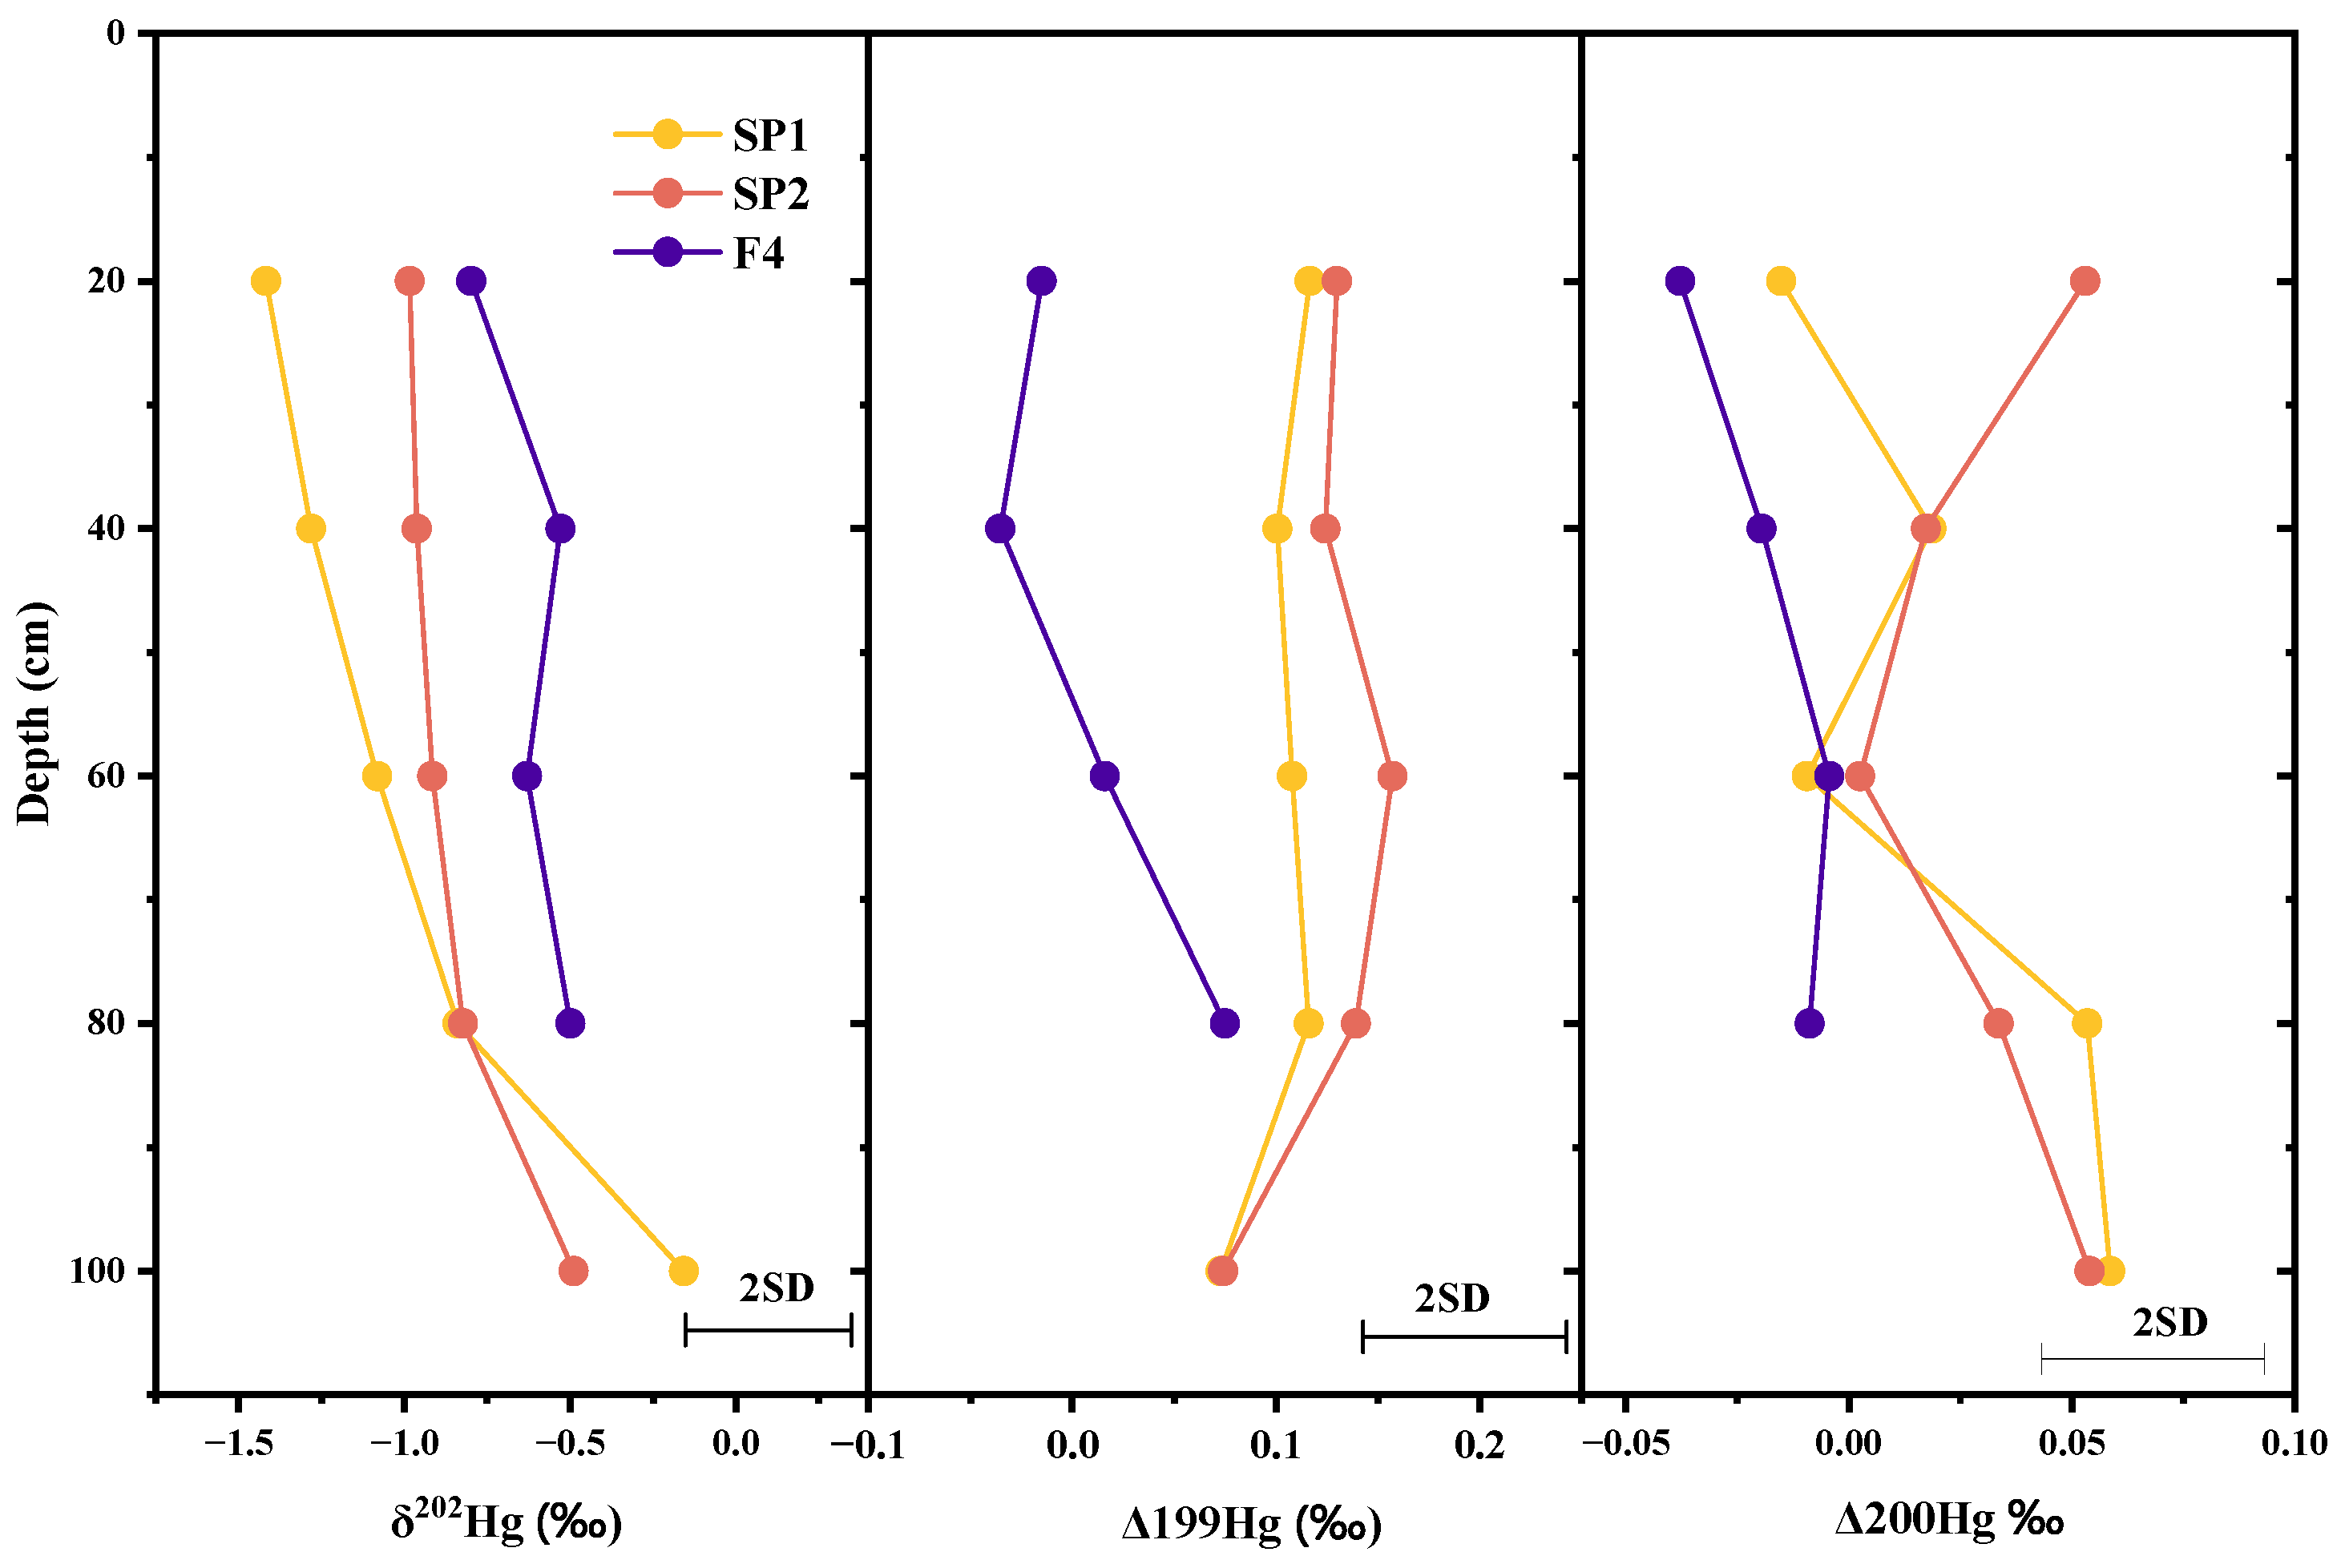
3.3.4. Source Identification by Hg Isotope Analysis

Hg isotope analysis provided critical insights into soil Hg pollution sources and pathways [33]. Various chemical and physical processes, including oxidation, reduction, and microbial transformations, can alter the environmental Hg isotopic composition [33,58]. Both mass-independent isotope fractionation (MIF, such as Δ199Hg or Δ200Hg) and mass-dependent fractionation (MDF, such as δ202Hg) can significantly change natural Hg isotope characteristics [59,60,61]. Therefore, Hg isotope analysis can provide a practical pathway to verify source identification in soil pollution [62,63,64].
As shown in Figure 5, the Hg isotopic (δ202Hg, Δ199Hg, and Δ200Hg) composition in soil profiles revealed a distinctive pattern across different depths. The δ202Hg in surface soil ranged between −1.46‰ and −0.98‰ (−1.26 ± 0.17‰, 2SD, n = 10), whereas Δ199Hg ranged between 0.08‰ and 0.15‰ (0.12 ± 0.02‰, 2SD, n = 10). Two soil profile samples were collected in the study area (SP1 and SP2) with δ202Hg values of −1.28‰ in 20–40 cm, −1.08‰ in 40–60 cm, −0.84‰ in 60–80 cm, −0.16‰ in 80–100 cm of SP1 and −0.96‰ in 20–40 cm, −0.92‰ in 40–60 cm, −0.82‰ in 60–80 cm, −0.48‰ in 80–100 cm of SP2, respectively. Both δ202Hg and Δ199Hg exhibited identical trends approaching 0 from 0 to 100 cm depth in two soil profiles, indicating the impacts of external factors in Hg accumulation decreased with increasing depth. In addition, the negative Δ199Hg values of the residual Hg (F4-Hg) and soil profile in 80–100 cm deviated from those of the soil profiles in 0 to 80 cm, suggesting the occurrence of Hg exogenous input in the study area. Such significantly negative Δ199Hg values in background soils were observed in previous studies [32,61,65].
Surface soil with the greatest positive Δ199Hg in the soil profile probably indicates the Hg isotopic signature of an external source of pollution [32,33,61]. Negative δ202Hg values were all detected in SP1, SP2, and F4-Hg, consistent with δ202Hg in atmospheric samples, which are heavily affected by anthropogenic point sources [63,66,67]. The variation of δ202Hg, Δ199Hg, and Δ200Hg of F4-Hg was not significant, indicating that residual Hg in soil was uniform. However, the composition of Hg in soil of 0–80 cm and irrigation channel sediments was similar, and they were clustered together, suggesting that irrigation water was one of the sources of Hg in the study area. These findings indicated there were possibly the same sources of Hg entering irrigation water and soils (Figure 6). Therefore, soil Hg concentrations were influenced by atmospheric deposition and irrigation sediment that may be related to anthropogenic sources. Soils affected by human activities generally have a negative δ202Hg [63]. Moreover, compared with the soil profile of 80–100 cm and the residual Hg, δ202Hg in the soil of 0–60 cm and irrigation canal sediments presented more negative values.

4. Conclusions

The average concentration in the topsoil of Hg, Cd, As, Pb, Cr, Ni, Zn, and Cu in soil were 2.07, 0.13, 8.56, 42.3, 81.1, 37.3, 105, and 43.8 mg kg−1, respectively. The enrichment Hg was particularly severe on topsoils, with the highest single pollution index (Pi) (9.00) and ecological risk index (Eri) (922) values. The results revealed that the concentrations of Hg decreased with increasing soil depth, suggesting anthropogenic sources of contamination, which can be supported by the Hg isotope analysis at the same time. Given the results from isotopic analysis, this study accurately quantified and identified the factors contributing to heavy metal contamination in agricultural soil at a comprehensive level.
According to the UNMIX and PMF model, the contribution of mixed industrial sources and traffic emissions were consistent but not parent material. This study can accurately quantify and identify the factors contributing to heavy metal contamination in agricultural soil on a field scale. Safe utilization strategies and eco-friendly stabilization methods should be implemented in agricultural soils to ensure the security of agricultural food.

Supplementary Materials

The following supporting information can be downloaded at https://www.mdpi.com/article/10.3390/agronomy15040812/s1, Figure S1. The sampling sites of the study area; Figure S2. Content of heavy metals and soil pH, SOM, and CEC in soil profiles. Figure S3. The Hg species distribution in soil profiles. Table S1. Potential ecological risk index of heavy metals in the soil of the study area. Table S2. Single factor index of heavy metals.

Author Contributions

Conceptualization, T.M. and J.X.; Methodology, T.M., X.G. and L.C.; Software, B.C., X.G., L.C. and Y.L.; Formal analysis, B.C., L.C., X.W. and Y.L.; Investigation, T.M., B.C., X.G., L.C., X.W., M.L. and J.X.; Writing—original draft, T.M., M.Y., X.G., L.C., M.L., Y.L. and J.X.; Writing—review & editing, T.M., X.G., L.C. and J.X.; Project administration, J.X. All authors have read and agreed to the published version of the manuscript.

Funding

This work was supported by the National Key Research and Development Program of China under Grant (No. 2023YFC3707902) and a Fellowship awarded by the University of Surrey’s Institute of Advanced Studies.

Data Availability Statement

The data presented in this study are available upon request from the corresponding author.

Acknowledgments

We greatly appreciate Hua Zhang and Guangyi Sun for providing assistance in Hg isotope analysis at the Institute of Geochemistry Chinese Academy of Sciences. Our thanks should also go to Xin Yin, who proofread and polished our manuscript as a professional English expert.

Conflicts of Interest

The authors declare no conflict of interest.

References

  1. Wu, Q.M.; Hu, W.Y.; Wang, H.F.; Liu, P.; Wang, X.K.; Huang, B. Spatial distribution, ecological risk and sources of heavy metals in soils from a typical economic development area, Southeastern China. Sci. Total Environ. 2021, 780, 146557. [Google Scholar] [CrossRef] [PubMed]
  2. Zhao, K.L.; Zhang, L.Y.; Dong, J.Q.; Wu, J.S.; Ye, Z.Q.; Zhao, W.M.; Ding, L.Z.; Fu, W.J. Risk assessment, spatial patterns and source apportionment of soil heavy metals in a typical Chinese hickory plantation region of southeastern China. Geoderma 2020, 360, 114011. [Google Scholar] [CrossRef]
  3. Safari, Y.; Delavar, M.A. The influence of soil pollution by heavy metals on the land suitability for irrigated wheat farming in Zanjan region, northwest Iran. Arab. J. Geosci. 2019, 12, 21. [Google Scholar] [CrossRef]
  4. Yadav, I.C.; Devi, N.L.; Singh, V.K.; Li, J.; Zhang, G. Spatial distribution, source analysis, and health risk assessment of heavy metals contamination in house dust and surface soil from four major cities of Nepal. Chemosphere 2019, 218, 1100–1113. [Google Scholar] [CrossRef]
  5. Pandey, S.; Parvez, S.; Sayeed, I.; Haque, R.; Bin-Hafeez, B.; Raisuddin, S. Biomarkers of oxidative stress: A comparative study of river Yamuna fish Wallago attu (Bl. & Schn.). Sci. Total Environ. 2003, 309, 105–115. [Google Scholar]
  6. Li, Y.H.; Kuang, H.F.; Hu, C.H.; Ge, G. Source apportionment of heavy metal pollution in agricultural soils around the Poyang Lake Region using Unmix model. Sustainability 2021, 13, 5272. [Google Scholar] [CrossRef]
  7. Vareda, J.P.; Valente, A.J.; Duraes, L. Assessment of Heavy Metal Pollution from Anthropogenic Activities and Remediation Strategies: A Review. J. Environ. Manag. 2019, 246, 101–118. [Google Scholar] [CrossRef]
  8. Azad, A.M.; Frantzen, S.; Bank, M.S.; Madsen, L.; Maage, A. Mercury bioaccumulation pathways in tusk (Brosme brosme) from Sognefjord, Norway: Insights from C and N isotopes. Environ. Pollut. 2021, 269, 115997. [Google Scholar] [CrossRef]
  9. Hu, W.; Zhang, Y.; Huang, B.; Teng, Y. Soil environmental quality in greenhouse vegetable production systems in eastern China: Current status and management strategies. Chemosphere 2017, 170, 183–195. [Google Scholar] [CrossRef]
  10. Liu, P.; Hu, W.; Tian, K.; Huang, B.; Zhao, Y.; Wang, X.; Zhou, Y.; Shi, B.; Kwon, B.; Ryu, J.; et al. Accumulation and ecological risk of heavy metals in soils along the coastal areas of the Bohai Sea and the Yellow Sea: A comparative study of China and South Korea. Environ. Int. 2020, 137, 105519. [Google Scholar] [CrossRef]
  11. Yang, X.; Yang, Y.; Wan, Y.Y.; Wu, R.J.; Feng, D.K.; Li, K. Source identification and comprehensive apportionment of the accumulation of soil heavy metals by integrating pollution landscapes, pathways, and receptors. Sci. Total Environ. 2021, 786, 147436. [Google Scholar] [PubMed]
  12. Long, Z.J.; Zhu, H.; Bing, H.J.; Tian, X.; Wang, Z.G.; Wang, X.F.; Wu, Y.H. Contamination, sources and health risk of heavy metals in soil and dust from different functional areas in an industrial city of Panzhihua City, Southwest China. J. Hazard. Mater. 2021, 420, 126638. [Google Scholar] [PubMed]
  13. Alina, D.S.; Delia, M.T.; Carmen, E.M.; Ciprian, I.; Lavinia, P.; Manuel, G.; Simona, B. Enzymological and Physicochemical Evaluation of the Effects of Soil Management Practices. Rev. Chim. 2017, 68, 2243–2247. [Google Scholar]
  14. Pan, L.B.; Ma, J.; Wang, X.L.; Hou, H. Heavy metals in soils from a typical county in Shanxi Province, China: Levels, sources and spatial distribution. Chemosphere 2016, 148, 248–254. [Google Scholar] [PubMed]
  15. Sun, L.; Guo, D.; Liu, K.; Meng, H.; Zheng, Y.; Yuan, F.; Zhu, G. Levels, sources, and spatial distribution of heavy metals in soils from a typical coal industrial city of Tangshan, China. Catena 2019, 175, 101–109. [Google Scholar] [CrossRef]
  16. Simona, B.; Tapan, B.; Lotfi, A.; Pascale, B.; Badr, A.S.; Anamaria, L.P.; Areha, A.; Alina, D.S. Expatiating the impact of anthropogenic aspects and climatic factors on long-term soil monitoring and management. Environ. Sci. Pollut. Res. 2021, 28, 30528–30550. [Google Scholar]
  17. Li, B.; Xiao, R.; Wang, C.Q.; Cao, L.H.; Zhang, Y.; Zheng, S.Q.; Yang, L.; Guo, Y. Spatial distribution of soil cadmium and its influencing factors in peri-urban farmland: A case study in the Jingyang District, Sichuan, China. Environ. Monit. Assess. 2017, 189, 21. [Google Scholar]
  18. Borvka, L.; Vacek, O.; Jehlika, J. Principal component analysis as a tool to indicate the origin of potentially toxic elements in soils. Geoderma 2005, 128, 289–300. [Google Scholar]
  19. Paatero, P.; Tapper, U. Positive Matrix Factorization: A nonnegative factor model with optimal utilization of error estimates of data values. Environmetrics 1994, 5, 111–126. [Google Scholar] [CrossRef]
  20. Stefania, G.A.; Rotiroti, M.; Buerge, I.J.; Zanotti, C.; Nava, V.; Leoni, B.; Fumagalli, L.; Bonomi, T. Identification of groundwater pollution sources in a landfill site using artificial sweeteners, multivariate analysis and transport modeling. Waste Manag. 2019, 95, 116–128. [Google Scholar] [CrossRef]
  21. Zhou, J.; Feng, K.; Pei, Z.P.; Meng, F.; Sun, J. Multivariate analysis combined with GIS to source identification of heavy metals in soils around an abandoned industrial area, Eastern China. Ecotoxicology 2016, 25, 380–388. [Google Scholar] [PubMed]
  22. Lv, J. Multivariate Receptor models and robust geostatistics to estimate source apportionment of heavy metals in soils. Environ. Pollut. 2019, 244, 72–84. [Google Scholar] [PubMed]
  23. Deng, M.H.; Zhu, Y.W.; Shao, K.; Zhang, Q.; Ye, G.H.; Shen, J. Metals source apportionment in farmland soil and the prediction of metal transfer in the soil-rice-human chain. J. Environ. Manag. 2020, 260, 110092. [Google Scholar]
  24. Wang, Y.T.; Guo, G.H.; Zhang, D.G.; Lei, M. An integrated method for source apportionment of heavy metal(loid)s in agricultural soils and model uncertainty analysis. Environ. Pollut. 2021, 276, 116666. [Google Scholar]
  25. Iakovidesa, M.; Stephanoua, E.G.; Apostolaki, M.; Hadjicharalambousc, M.; Evansd, J.; Koutrakisd, P.; Achilleosd, S. Study of the occurrence of airborne Polycyclic Aromatic Hydrocarbons associated with respirable particles in two coastal cities at Eastern Mediterranean: Levels, source apportionment, and potential risk for human health. Atmos. Environ. 2019, 213, 170–184. [Google Scholar]
  26. Zhang, X.; Yang, H.H.; Cui, Z.J. Evaluation and analysis of soil migration and distribution characteristics of heavy metals in iron tailings. J. Clean. Prod. 2018, 172, 475–480. [Google Scholar]
  27. dos Santos, G.C.G.; Valladares, G.S.; Abreu, C.A.; de Camargo, O.A.; Grego, C.R. Assessment of copper and zinc in soils of a vineyard region in the state of São Paulo, Brazil. Appl. Environ. Soil Sci. 2013, 10, 790795. [Google Scholar]
  28. Bashir, M.A.; Rehim, A.; Liu, J.; Imran, M.; Liu, H.B.; Suleman, M.; Naveed, S. Soil survey techniques determine nutrient status in soil profile and metal retention by calcium carbonate. Catena 2019, 173, 141–149. [Google Scholar]
  29. Facchinelli, A.; Sacchi, E.; Mallen, L. Multivariate statistical and gis-based approach to identify heavy metal sources in soils. Environ. Pollut. 2001, 114, 313–324. [Google Scholar]
  30. Giri, S.; Singh, A.K.; Mahato, M.K. Metal contamination of agricultural soils in the copper mining areas of Singhbhum shear zone in India. J. Earth Syst. Sci. 2017, 126, 49. [Google Scholar]
  31. Luo, X.; Xue, Y.; Wang, Y.; Cang, L.; Xu, B.; Ding, J. Source identification and apportionment of heavy metals in urban soil profiles. Chemosphere 2015, 127, 152–157. [Google Scholar] [CrossRef] [PubMed]
  32. Yin, R.S.; Feng, X.B.; Hurley, J.P.; Krabbenhoft, D.P.; Lepak, R.F.; Hu, R.Z.; Zhang, Q.; Li, Z.G.; Bi, X.W. Mercury isotopes as proxies to identify sources and environmental impacts of mercury in sphalerites. Sci. Rep. 2016, 6, 18686. [Google Scholar] [CrossRef] [PubMed]
  33. Zhang, K.; Liao, L.F.; Li, G.G.; Lin, Y.; Meng, B.; Feng, X.B. Mercury isotopes trace historical mercury pollution from Pb-Zn smelter in China. Chem. Geol. 2023, 635, 121622. [Google Scholar] [CrossRef]
  34. Gmochowska, W.; Pietranik, A.; Tyszka, R.; Ettler, V.; Mihaljevic, M.; Dlugosz, M.; Walenczak, K. Sources of pollution and distribution of Pb, Cd and Hg in Wroclaw soils: Insight from chemical and Pb isotope composition. Geochemistry 2019, 79, 434–445. [Google Scholar] [CrossRef]
  35. Yu, E.J.; Liu, H.Y.; Dinis, F.; Zhang, Q.Y.; Jing, P.; Liu, F.; Ju, X.H. Contamination Evaluation and Source Analysis of Heavy Metals in Karst Soil Using UNMIX Model and Pb-Cd Isotopes. Int. J. Environ. Res. Public Health 2022, 19, 12478. [Google Scholar] [CrossRef]
  36. Blum, J.D.; Bergquist, B.A. Reporting of variations in the natural isotopic composition of mercury. Anal. Bioanal Chem. 2007, 388, 353–359. [Google Scholar] [CrossRef]
  37. Lu, R.K. Analytical Methods for Soil and Agricultural Chemistry; China Agricultural Science and Technology Press: Beijing, China, 2000. (In Chinese) [Google Scholar]
  38. Simpson, S.; Angel, B.; Jolley, D. Metal equilibration in laboratory contaminated (spiked) sediments used for the development of whole sediment toxicity tests. Chemosphere 2004, 54, 597–609. [Google Scholar] [CrossRef]
  39. Hakanson, L. An ecological risk index for aquatic pollution control. A sedimentological approach. Water Res. 1980, 14, 975–1001. [Google Scholar] [CrossRef]
  40. Liu, S.; Pan, G.; Zhang, Y.; Xu, J.; Ma, R.; Shen, Z.; Dong, S. Risk assessment of soil heavy metals associated with land use variations in the riparian zones of a typical urban river gradient. Ecotoxicol. Environ. Saf. 2019, 181, 435–444. [Google Scholar] [CrossRef]
  41. Environmental Monitoring Administration of China. The Background Values of Heavy Metals for Agricultural Soil in Zhejiang Province; Environmental Monitoring Administration of China: Beijing, China, 1990.
  42. Yuan, G.L.; Sun, T.H.; Han, P.; Li, J.; Lang, X.X. Source identification and ecological risk assessment of heavy metals in topsoil using environmental geochemical mapping: Typical urban renewal area in Beijing, China. J. Geochem. Explor. 2014, 136, 40–47. [Google Scholar] [CrossRef]
  43. Zhu, K.; Chen, Y.; Zhang, S.; Yang, Z.; Huang, L.; Lei, B.; Li, L.; Zhou, Z.; Xiong, H.; Li, X. Identification and prevention of agricultural non-point source pollution risk based on the minimum cumulative resistance model. Glob. Ecol. Conserv. 2020, 23, e01149. [Google Scholar] [CrossRef]
  44. Dana, C.F.; Simona, G.B.; Laura, E.; Paul, A.N.; Alexa, F.B.; Bianca, P.; Andrei-Flavius, R.; Alexandra, G.T.; Mihaela, A.B.; Tapan, B.; et al. Characterization of the Toxicological Impact of Heavy Metals on Human Health in Conjunction with Modern Analytical Methods. Toxics 2022, 10, 716. [Google Scholar] [CrossRef] [PubMed]
  45. Shao, D.W.; Zhan, Y.; Zhou, W.J.; Zhu, L.Z. Current status and temporal trend of heavy metals in farmland soil of the Yangtze River Delta Region: Field survey and meta-analysis. Environ. Pollut. 2016, 219, 329–336. [Google Scholar] [PubMed]
  46. Wang, F.; Guan, Q.; Tian, J.; Lin, J.; Yang, Y.; Yang, L.; Pan, N. Contamination characteristics, source apportionment, and health risk assessment of heavy metals in agricultural soil in the Hexi corridor. Catena 2020, 191, 104573. [Google Scholar]
  47. Moreira, A.; Sfredo, G.J.; Moraes, L.A.C.; Fageria, N.K. Lime and cattle manure in soil fertility and soybean grain yield cultivated in tropical soil. Commun. Soil Sci. Plant Anal. 2015, 46, 1157–1169. [Google Scholar] [CrossRef]
  48. Sutkowska, K.; Teper, L.; Czech, T.; Hulok, T.; Olszak, M.; Zogala, J. Quality of Peri-Urban Soil Developed from Ore-Bearing Carbonates: Heavy Metal Levels and Source Apportionment Assessed Using Pollution Indices. Minerals 2020, 10, 1140. [Google Scholar] [CrossRef]
  49. Sutkowska, K.; Teper, L.; Krzykawski, T.; Czech, T. Heavy Metals Soil Contamination Induced by Historical Zinc Smelting in Jaworzno. Ecol. Chem. Eng. A 2013, 20, 1441–1450. [Google Scholar] [CrossRef]
  50. Vareda Sonke, J.E.; Blum, J.D. Advances in mercury stable isotope biogeochemistry. Chem. Geol. 2013, 336, 1–4. [Google Scholar]
  51. Huang, Y.; Li, T.Q.; Wu, C.X.; Japenga, J.; Deng, M.H.; Yang, X.E. An integrated approach to assess heavy metal source apportionment in peri-urban agricultural soils. J. Hazard. Mater. 2015, 299, 540–549. [Google Scholar]
  52. UNEP. Global Mercury Assessment 2018; UN Environment Programme, Chemicals and Health Branch: Geneva, Switzerland, 2019. [Google Scholar]
  53. Hou, D.Y.; O’Connor, D.; Nathanail, P.; Tian, L.; Ma, Y. Integrated gis and multivariate statistical analysis for regional scale assessment of heavy metal soil contamination: A critical review. Environ. Pollut. 2017, 231, 1188–1200. [Google Scholar]
  54. Adamiec, E. Chemical fractionation and mobility of traffic-related elements in road environments. Environ. Geochem. Health 2017, 39, 1457–1468. [Google Scholar] [CrossRef] [PubMed]
  55. Cai, L.M.; Jiang, H.H.; Luo, J. Metals in soils from a typical rapidly developing county, southern China: Levels, distribution, and source apportionment. Environ. Sci. Pollut. Res. Int. 2019, 26, 19282–19293. [Google Scholar] [CrossRef] [PubMed]
  56. Mohamed, K.H.; Aydi, S.S.; Aydi, S.; Rahmani, R.; Haddad, M.; Lante, A.; Tinello, F.; BIenvenuti, S.; Bousnina, H. Soil fertilization practices affect growth, yield and quality of essential oil of Matricaria recutita grown in Tunisian oases. Commun. Soil Sci. Plant Anal. 2023, 10, 1080. [Google Scholar] [CrossRef]
  57. Quantin, C.; Ettler, V.; Garnier, J.; Sebek, O. Sources and extractability of chromium and nickel in soil profiles developed on Czech serpentinites. Geoscience 2008, 340, 872–882. [Google Scholar] [CrossRef]
  58. Qin, C.Y.; Du, B.Y.; Yin, R.S.; Meng, B.; Fu, X.W.; Li, P.; Zhang, L.M.; Feng, X.B. Isotopic fractionation and source appointment of methylmercury and inorganic mercury in a Paddy ecosystem. Environ. Sci. Technol. 2020, 54, 14334–14342. [Google Scholar] [CrossRef]
  59. Kritee, K.; Blum, J.D.; Johnson, M.W.; Bergquist, B.A.; Barkay, T. Mercury stable isotope fractionation during reduction of Hg (II) to Hg (0) by mercury resistant microorganisms. Environ. Sci. Technol. 2007, 41, 1889–1895. [Google Scholar] [CrossRef]
  60. Kritee, K.; Blum, J.D.; Barkay, T. Mercury stable isotope fractionation during reduction of Hg (II) by different microbial pathways. Environ. Sci. Technol. 2008, 42, 9171–9177. [Google Scholar] [CrossRef]
  61. Zheng, W.; Obrist, D.; Weis, D.; Bergquist, B.A. Mercury isotope compositions across north American forests. Glob. Biogeochem. Cycles 2016, 30, 1475–1492. [Google Scholar] [CrossRef]
  62. Yin, R.; Feng, X.; Wang, J.; Li, P.; Liu, J.; Zhang, Y.; Chen, J.; Zheng, L.; Hu, T. Mercury speciation, mercury isotope fractionation during ore roasting process and their implication to source identification of downstream sediment in Wanshan mercury mining area, SW China. Chem. Geol. 2012, 04, 030. [Google Scholar] [CrossRef]
  63. Blum, J.D. Mercury isotopes in earth and environmental sciences. Annu. Rev. Earth Planet Sci. 2014, 42, 249–272. [Google Scholar] [CrossRef]
  64. Foucher, D.; Ogrinc, N.; Hintelmann, H. Tracing mercury contamination from the Idrija mining region (Slovenia) to the Gulf of Trieste using Hg isotope ratio measurements. Environ. Sci. Technol. 2009, 43, 33–39. [Google Scholar] [CrossRef] [PubMed]
  65. Demers, J.D.; Blum, J.D.; Zak, D.R. Mercury isotopes in a forested ecosystem: Implications for air-surface exchange dynamics and the global mercury cycle. Glob. Biogeochem. Cycles 2013, 27, 222–238. [Google Scholar] [CrossRef]
  66. Rolison, J.M.; Landing, W.M.; Luke, W.; Cohen, M.; Salters, V.J.M. Isotopic composition of species-specific atmospheric Hg in a coastal environment. Chem. Geol. 2012, 10, 007. [Google Scholar] [CrossRef]
  67. Sherman, L.S.; Blum, J.D.; Johnson, K.P.; Keeler, G.J.; Barres, J.A.; Douglas, T.A. Mass-independent fractionation of mercury isotopes in Arctic snow driven by sunlight. Nat. Geosci. 2010, 3, 173–177. [Google Scholar] [CrossRef]
Figure 1. The spatial distribution of heavy metals in the study area.
Agronomy 15 00812 g001
Figure 2. Pearson’s correlation analysis among soil properties in the selected regions.
Agronomy 15 00812 g002
Figure 3. PCA analysis of metals in the selected regions. Black circles were sampling sites; blue arrows were different metals.
Agronomy 15 00812 g003
Figure 4. The relative contribution of different sources and factors by UNMIX model (A) and PMF model (B).
Agronomy 15 00812 g004
Figure 5. The Hg isotope distribution in soil profiles.
Agronomy 15 00812 g005
Figure 6. Scatter plot of Hg isotope ratios in soil profile and irrigation canal sediments.
Agronomy 15 00812 g006
Table 1. Soil properties and heavy metal concentrations in the study area (n = 38).
VariableSOM
(g kg−1)
pHCEC
(cmol kg−1)
Hg
(mg kg−1)
Cd
(mg kg−1)
As
(mg kg−1)
Pb
(mg kg−1)
Cr
(mg kg−1)
Ni
(mg kg−1)
Zn
(mg kg−1)
Cu
(mg kg−1)
Max59.37.5940.25.400.1812.782.410750.0162103
Min15.35.0924.71.090.077.0333.375.032.083.031.0
Mean42.16.4231.52.870.138.7643.583.338.210845.1
SD11.90.744.741.350.031.078.796.483.5311.911.5
CV (%)28.311.514.964.920.312.220.37.689.1811.325.6
Reference Bi a///0.090.079.2023.752.927.670.617.6
a means the reference heavy metal concentrations for Zhejiang province.
Disclaimer/Publisher’s Note: The statements, opinions and data contained in all publications are solely those of the individual author(s) and contributor(s) and not of MDPI and/or the editor(s). MDPI and/or the editor(s) disclaim responsibility for any injury to people or property resulting from any ideas, methods, instructions or products referred to in the content.

