Article

Assessing the Influences of Grassland Degradation on Soil Quality Through Different Minimum Data Sets in Southwest China

1
College of Ecological Engineering, Guizhou University of Engineering Science, Bijie 551700, China
2
Key Laboratory of Ecological Microbial Remediation Technology of Yunnan Higher Education Institutes, Dali University, Dali 671003, China
*
Author to whom correspondence should be addressed.
Agronomy 2025, 15(5), 1091; https://doi.org/10.3390/agronomy15051091
Submission received: 3 April 2025 / Revised: 25 April 2025 / Accepted: 28 April 2025 / Published: 29 April 2025
(This article belongs to the Section Grassland and Pasture Science)

Abstract

:
Establishing a suitable and useful soil quality (SQ) assessment tool is imperative for the accurate evaluation of the effect of environmental changes on SQ. This study constructed four soil quality indexes (SQIs) based on different minimum data sets and weighted additive models to evaluate the influence of grassland degradation on SQ in northwest Guizhou, China. A total of 19 soil properties, including six physical properties, six chemical properties, and seven microbial properties, were measured at soil depths 0–20 cm to construct the SQIs. Results showed that 18 soil indicators were selected as the potential SQ indicators in the total data set. Based on the principal component analysis, four indicators, soil organic carbon (SOC), mean weight diameter, α-glucosidase, and β-acetylglucosaminidase, were selected in the minimum data set (MDS). However, six indicators, SOC, pH, β-1,4-xylosidase, β-acetylglucosaminidase, Clay, and Bulk Density, were selected for the selective MDS. Despite the notable inter-correlation among the four established SQIs, the SQI derived from the selective MDS and weighted additive model demonstrated heightened sensitivity and capacity for differentiation with respect to grassland degradation because of the high values of F and CV. Grassland degradation significantly reduced the SQ, and the value of SQ under severely degraded grassland was reduced by 51% compared with that under non-degraded grassland. Under the lightly degraded grassland, the reduction in soil physical quality was the primary reason for the total SQ decline, while the reduction in soil microbial and chemical reduction resulted in a significant decline in total SQ under the severely degraded grassland. In conclusion, greater attention should be paid to the SQ reduction resulting from grassland degradation in the study area, and the SQI established by selective MDS and weighted additive model should be used as a suitable and useful SQ assessment tool to evaluate the influence of environmental changes on SQ in Southwest China and other similar areas.

1. Introduction

Soil is an important non-renewable resource and plays a pivotal role in sustaining life by supporting global food production and maintaining ecosystem functions such as vegetation productivity and climate regulation [1,2]. Healthy and high-quality soil has a degree of elasticity and resilience, which enables it to maintain its ecosystem services and functions [3,4]. However, the integrity of soil properties and their functions is being threatened by the process of degradation resulting from human activity [1,3]. Therefore, a thorough and accurate evaluation of soil degradation status and trends, coupled with the identification of suitable remedial measures, is of critical importance for maintaining the soil ecosystem functions [5].
Soil quality assessment is an effective method to evaluate the status of soil resources, and it is a reliable indicator for monitoring soil degradation status and trends [5,6]. Therefore, changes in soil quality are usually evaluated through a combination of changes in the physical, chemical, and microbial properties of the soil. Numerous models and conceptual frameworks for evaluating soil quality have been successfully proposed and applied at plot, regional and national scales. It is regrettable that a universally applicable tool for all environments and management practices is not yet available [7,8,9]. In these proposed models, the soil quality index (SQI) is a widely used method to assess soil quality changes under various environmental conditions or different management practices due to its flexibility and ease of use [2,10,11].
Despite the extensive utilization of SQI models to evaluate soil quality in previous studies, the process of constructing SQI remains laden with various challenges [8,12]. It is important to note that some important soil indicators containing significant information are frequently misplaced during the process of selecting appropriate soil indicators in the minimum data set (MDS). For example, Li et al. [13] reported that only five chemical indicators and one physical indicator were retained in MDS. The absence of soil microbial indicators in MDS will, to some extent, reduce the accuracy and credibility of the soil quality evaluation results [10,14]. In a karst region of southwest China, Yu et al. [9] found that SQI calculated by the MDS, including the physical, chemical and microbial indicators, performed better than the SQIs calculated by the MDS only, including chemical indicators. In addition, different weight values were assigned to the key soil indicators in MDS when combining these unitless scores of soil indicators into a comprehensive SQI. For example, some studies assigned the same weight value to the soil indicators in MDS [15,16], while other studies assigned different weight values to the soil indicators according to their importance and contributions [13,17]. In consideration of the fact that the function of different soil indicators varies in soil, it is essential that the relative significance of these indicators is appropriately weighted in soil quality evaluation [6,10]. However, the impact of SQIs, constructed with varying weight values, on soil quality evaluation remains to be elucidated [9,14,16]. Therefore, a detailed comparison and evaluation of the applicability and accuracy of these SQIs, constructed using different MDS and weighted additive models, is required [9,17].
China is distinguished by its extensive grassland areas, which collectively span an expanse of about 400 million ha [18,19]. It is well known that grassland degradation has a significant effect on the soil’s physical, chemical and microbial properties [20,21]. However, these studies focus on only one aspect of the soil’s physical–chemical–biological properties and lack consideration of the influence of grassland degradation on total soil quality [22]. In addition, given that the grassland area in Southwest China is diminutive, constituting a mere 11% of the total grassland area [23,24], most previous studies have disregarded the repercussions of grassland degradation on soil properties and soil quality in southwest China. Furthermore, the profound impact of human activities and climate change has precipitated the degradation of grassland in southwest China, which threatens the sustainable development of regional society [25]. Therefore, further study is necessary to elucidate the influence of grassland degradation on soil properties and soil quality in southwest China.
In this study, we established four different SQIs by two different indicator-selecting approaches (MDS and selective MDS) and two different weighted additive models (variance-weighted and equal-weighted) to evaluate the influence of grassland degradation on soil quality in northwest Guizhou. We hypothesized that the SQI constructed by the selective MDS and variance-weighted model performed better than other SQIs, and grassland degradation significantly reduced the soil quality in the study area. To test these hypotheses, the objectives of this study were to (1) compare the performance of these four constructed SQIs in assessing soil quality and (2) assess the influence of four grassland degradation stages on soil quality in a meadow–grassland in southwest China.

2. Materials and Methods

2.1. Study Area

The research area is located in the transition zone from the Yunnan Plateau to the hilly areas of northwest Guizhou (104°05′54′′~104°47′21′′ E, 26°45′06′′~27°09′21′′ N). It has an average altitude of approximately 1500 m. The area experiences a subtropical humid monsoon climate with an average annual temperature of 12.8 °C and a mean annual rainfall of 950 mm. The sunshine duration is about 1377 h. The northwest region of Guizhou is the main distribution area of natural grassland resources in Guizhou Province. It is also the region with the lowest latitude where meadow grasslands are distributed in China. The dominant plants in the grasslands here mainly include Festuca ovina, Leucas mollissima, Trifolium repens, Mazus longipes, etc. In recent years, increasingly intense human disturbances have caused severe damage to the meadow grassland resources in the northwest region of Guizhou, resulting in a sharp decline in grassland productivity and biodiversity as well as a weakened capacity for water conservation and soil fixation.

2.2. Sampling Design and Soil Analysis

According to the national standard of the People’s Republic of China (GB 19377-2003) [26] and study experiences in the study area, four degrees of degraded subalpine grasslands were defined, namely non-degraded grassland (NDG), lightly degraded grassland (LDG), moderately degraded grassland (MDG), and severely degraded grassland (SDG), respectively. In each degradation degree grassland, six replicated plots (10 m × 10 m) with similar vegetation characteristics were established, and a total of 24 study plots were chosen. In July 2022, five 1 m × 1 m quadrats in each sampling plot were randomly established to collect the soil samples. Undisturbed soil samples were collected at 0–20 cm depth, and the five soil cores in each replicated plot were combined to represent this plot.
The collected samples were immediately transported to the laboratory for pretreatment. Each soil sample was divided into two parts: one subsample was air-dried for the physical and chemical properties determination, and another subsample was stored field-moist in a fridge for soil enzyme activities and soil water content. A total of 19 soil properties including six physical properties (MWD, mean weight diameter; GMD, geometric mean diameter; BD, bulk density; SWC, soil water content), six chemical properties (SOC, soil organic carbon; TN, total nitrogen; TP, total phosphorus; AN, available nitrogen; AP, available phosphorus), and seven microbial properties (LAP, leucine amino peptidase; NAG, β-acetylglucosaminidase; AG, α-glucosidase; BG, β-glucosidase; BX, β-1, 4-xylosidase; CBH, fiber biohydrolase; ACP, acid phosphatase) were determined using the standard laboratory analytical methods described in Table 1.

2.3. Constructing Soil Quality Index

The one-way analysis of variance was used to identify the soil properties that did not vary significantly among the four degrees of degraded subalpine grasslands. Only those soil properties that exhibited significant differences were retained as constituent elements of the total data set to construct the SQI [9,14].
The principal component analysis (PCA) and Pearson’s product–moment correlation matrix were used to select the most representative soil indicators in the minimum data set (MDS) or in the selective minimum data set (SMDS) following the method reported by Yu et al. [9] and Zahedifar [28]. In the selection approach of MDS, the PCA was used in the total data set. However, the total data set was divided into three distinct data sets, and each of these three data sets was then subjected to PCA to be selective soil indicators in SMDS.
The nonlinear scoring algorithm was used to normalize the selected soil indicators in MDS or SMDS into scores ranging from 0 to 1. The equation for the scoring functions was used as follows:
S N L = 1 1 + ( y / y 0 ) b
where SNL is the score for each soil indicator; y and y0 are the actual value and mean value of the soil indicator; b is the slope of the equation, and the value of b is set as −2.5 and 2.5 for a “more is better” and “less is better” scoring function, respectively [9,27].
The variance of each respective PC was used to calculate the weight of the soil indicator in MDS [9]. In the SMDS, the physical, chemical and biological data set was assigned an equal weight of 0.33, and then a sub-weight was given to the soil indicator based on the variance of the respective PC. The weighted additive model was used to calculate the SQI as follows:
S Q I - W = i = 1 n ( S i × W i )
where SQI-W is the weighted soil quality index; n is the number of soil indicators; Si is the nonlinear score of soil indicator i; Wi is the weight of soil indicator i.
In addition, an equal additive model was also used to calculate the SQI as follows:
S Q I - E = i = 1 n S i n
where SQI-E is the equal-weighted soil quality index; n is the number of soil indicators; Si is the nonlinear score of soil indicator i.
Based on the above procedures, four soil quality indexes were calculated, and the four SQIs were MDS and variance weighted (SQI-M), MDS and equal-weighted (SQI-ME), SMDS and variance weighted (SQI-RM), and SMDS and equal-weighted (SQI-RME).

2.4. Statistical Analyses

A one-way ANOVA was used to test the effects of grassland degradation on the 19 soil indicators, and the least significant difference test (LSD) was conducted to compare the differences (p-value < 0.05) for the 19 soil indicators among the four grassland degradation levels. Similarly, the significant differences among the different SQIs were tested using the one-way ANOVA and LSD. The redundant soil indicators in the total data set were removed based on the PCA and correlation matrices using the SPSS 16.0 software.

3. Results

3.1. Changes in Soil Indicators

Among the 19 measured soil indicators, 18 soil indicators were significantly affected by the grassland degradation types (Table 2). The values of soil pH, BD and Clay were all lowest under NDG, and the highest value was found under MDG, SDG and MDG for soil pH, BD and Clay, respectively. Compared with SDG, the TP content under NDG and LDG increased by 20.3% and 35.6%, respectively. The highest values of SOC, TN, AN, LAP, AG, BX, and CBH were all found under NDG, while the lowest values were all found under SDG. The contents of AP, BG and NAG under LDG and NDG were significantly higher than those under SDG and MDG. The lowest values of MWD and GMD were all found under LDG, which were reduced by 23.0% and 39.8%, respectively, compared with those under NDG. The SWC contents under LDG, MDG, and SDG were reduced by 44.3%, 46.6%, and 45.0%, respectively, in comparison with those under NDG. However, the difference in SWC contents among the LDG, MDG and SDG was not significant.

3.2. Establishing the MDS and SMDS

Our results showed that the eigenvalues of four PCs were greater than 1. It is, therefore, evident that these four PCs were selected for the MDS in this study (Table 3). The PC1 explained 56.5% of the total variability with an eigenvalue of 10.18. In PC1, eight soil indicators were chosen because of their high loading values (>0.84). The correlation analysis results showed that these eight soil indicators were all significantly correlated (Table 4). Therefore, only the soil indicator SOC with the highest loading value was selected as the important indicator to represent PC1 in the MDS. For PC2, three soil indicators with high loading values were selected, and these three soil indicators were all correlated significantly with each other. Therefore, only the soil indicators MWD were chosen for the MDS. The PC3 and PC4 were responsible for 7.62% and 5.66%, respectively, of the total variability. In these two PCs, it was found that merely a single soil indicator in each PC satisfied the criteria for being designated as a highly loaded soil indicator. Therefore, the soil indicators AG in PC3 and NAG in PC4 were chosen as the important indicators to represent PC3 and PC4 in the MDS. Finally, the MDS was established by the four important indicators, SOC, MWD, AG and NAG, in the present study.
In order to select the appropriate indicators in SMDS, three similar PCA analyses were performed for physical, chemical, and microbial properties. For physical properties, two PCs were chosen, and they explained 85.3% of the total variability. In PC1, four highly loaded soil indicators were identified, and these four soil indicators were all significantly corrected. Therefore, only the soil indicator Clay, with the highest loading value, was chosen as the important soil indicator in the SMDS. In PC2, only the indicator BD was identified and thus chosen as the important soil indicator in the SMDS. For chemical properties, the soil indicator SOC in PC1 and pH in PC2 were chosen to represent the chemical properties of the SMDS. For microbial properties, the soil indicator BX in PC1 and NAG in PC2 were chosen to represent the chemical properties of the SMDS. Finally, the SMDS was established by two important physical indicators (Clay and BD), two important chemical indicators (SOC and pH), and two important microbial indicators (BX and NAG) in the present study.

3.3. Constructing the Soil Quality Indexes

The parameters used in the nonlinear equations to construct the SQI are listed in Table 5. In MDS, the “more is better” scoring curve was applied to the four soil indicators. The weight values for these four soil indicators calculated by the variance were 0.64, 0.22, 0.08 and 0.06 for SOC, MWD, AG, and NAG, respectively. However, the weight value for these four soil indicators in an equal additive model was all 0.25.
In SMDS, the “more is better” scoring curve was applied to the soil indicators SOC, NAG, and BX, while the soil indicators pH, Clay and BD were applied to the “less is better” scoring curve. The weight values calculated by the variance for the SOC, pH, NAG, BX, Clay and BD were 0.30, 0.04, 0.05, 0.28, 0.27, and 0.06, respectively. However, the weight value for these six soil indicators in an equal additive model was all 0.17. According to the above parameters, four SQIs were constructed based on the MDS and SMDS as follows:
SQI-M = (0.64 × SOC) + (0.22 × MWD) + (0.08 × AG) + (0.06 × NAG)
SQI-ME = (0.25 × SOC) + (0.25 × MWD) + (0.25 × AG) + (0.25 × NAG)
SQI-RM = (0.30 × SOC) + (0.04 × pH) + (0.28 × BX) + (0.05 × NAG) + (0.27 × Clay) + (0.06 × BD)
SQI-RME = (0.17 × SOC) + (0.17 × pH) + (0.17 × BX) + (0.17 × NAG) + (0.17 × Clay) + (0.17 × BD)

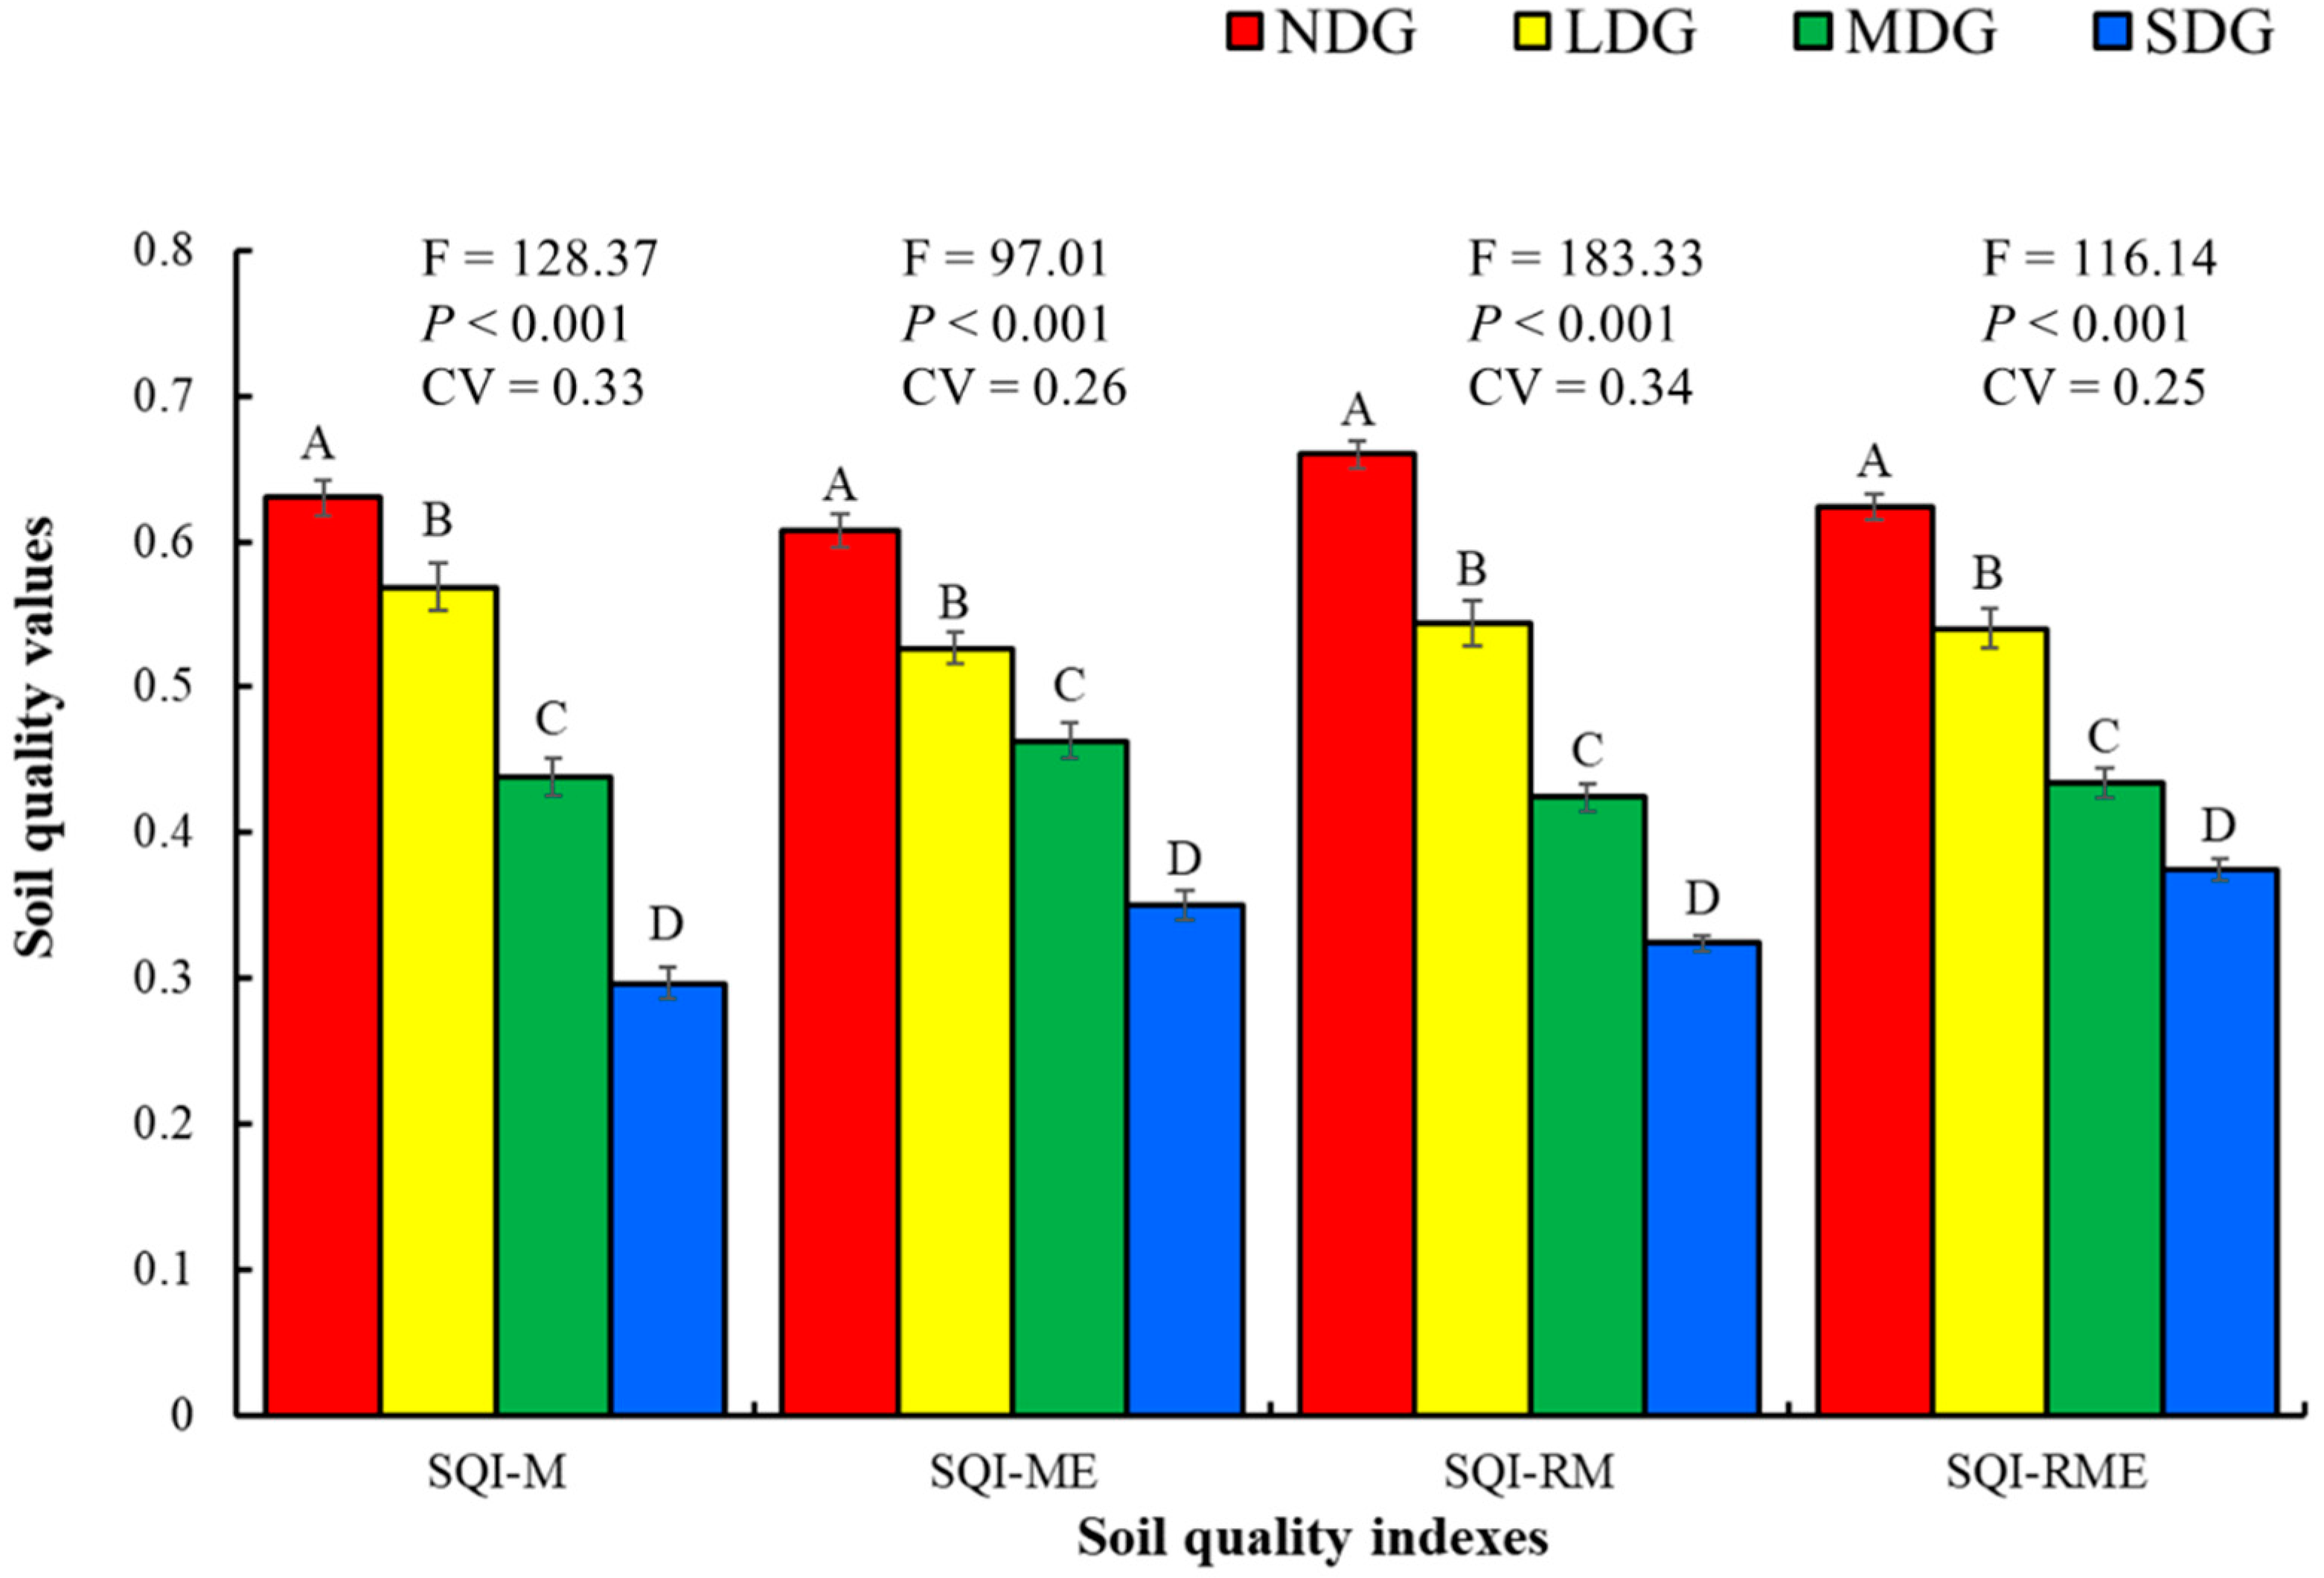
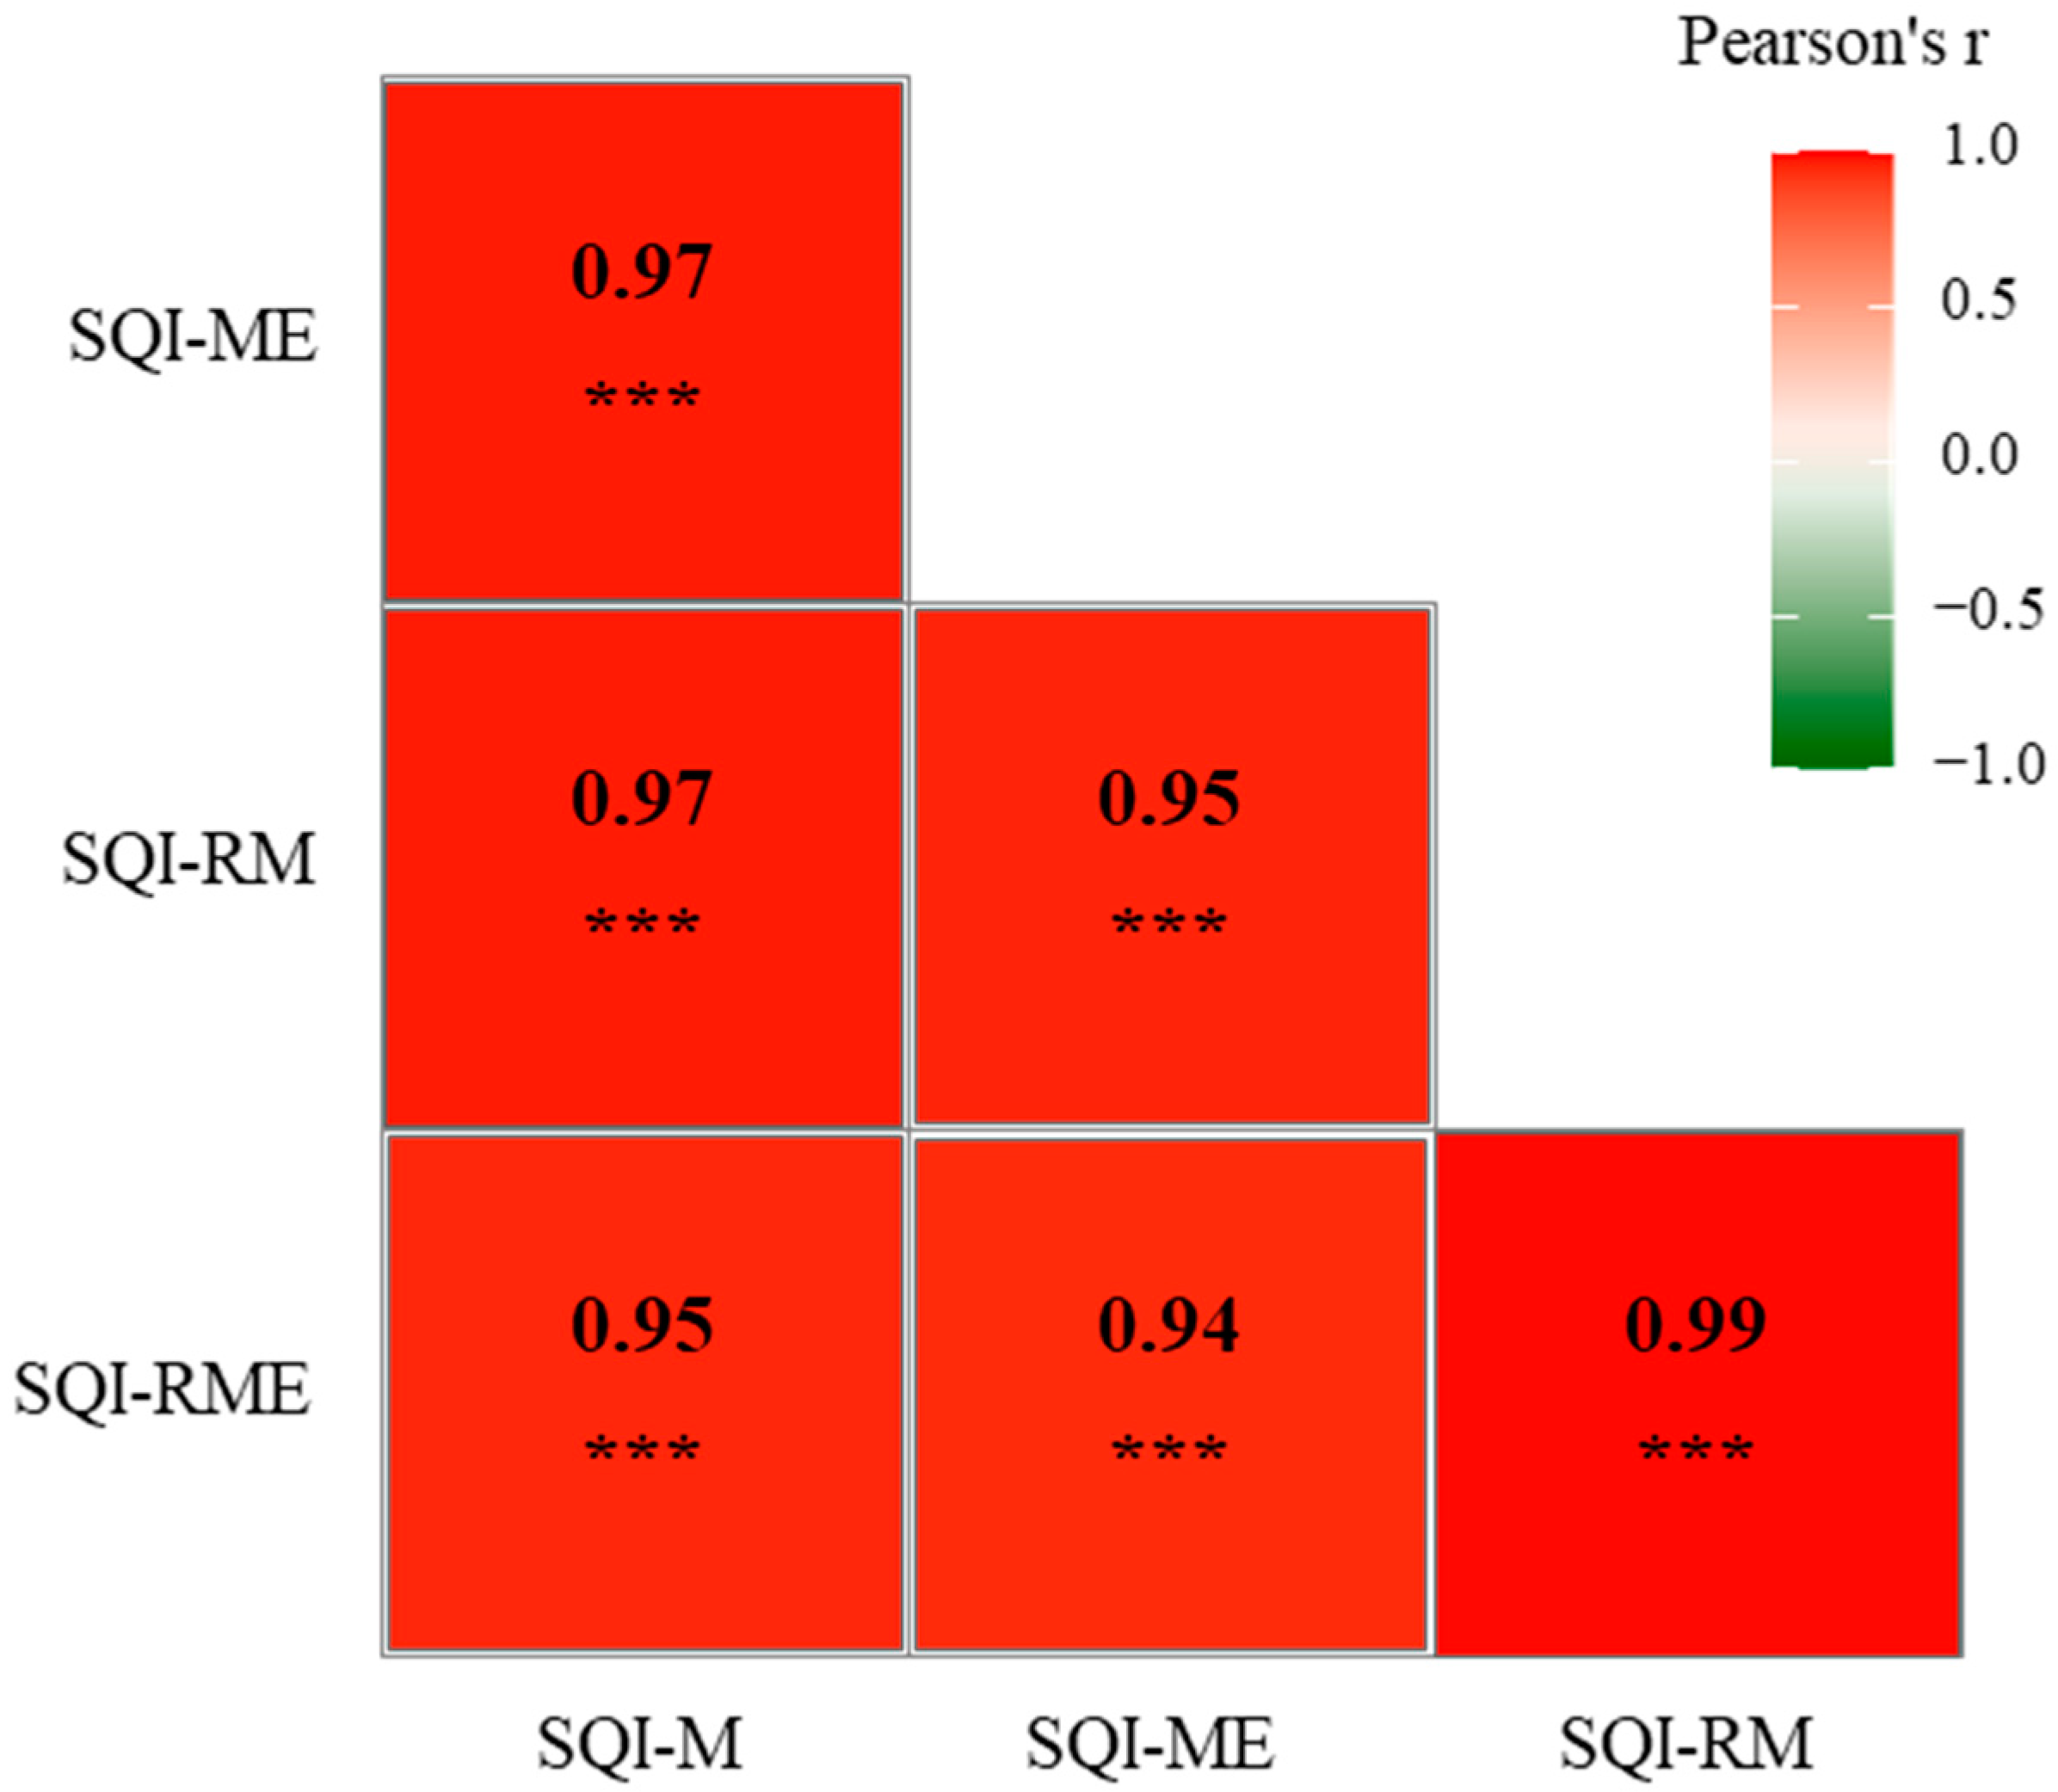
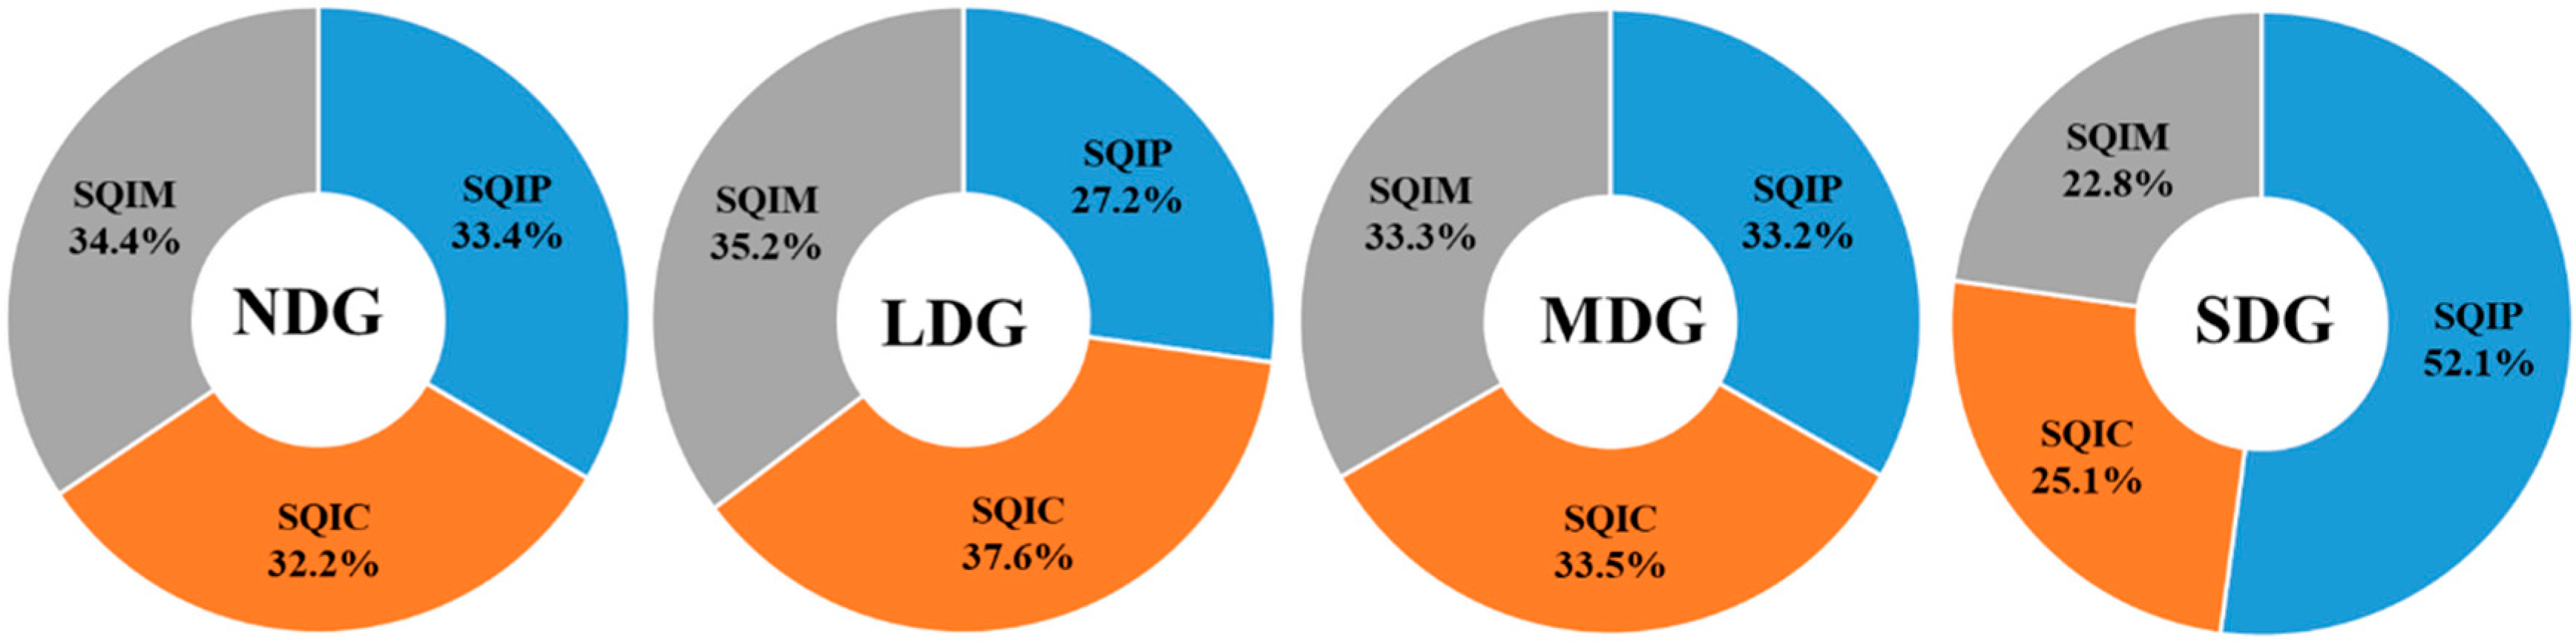
3.4. Assessing the Soil Quality Under Different Grasslands

The four constructed SQIs exhibited analogous alteration trends among the four degraded grasslands, with the highest values under NDG and lowest values under SDG (Table 1). The values of F and CV for SQI-M and SQI-RM were found to be higher than those of SQI-ME and SQI-RME (Figure 1). The results of the correlation analysis showed that all four of the constructed SQIs exhibited a significant correlation (Figure 2). The values of F and CV for SQI-RM and SQI-RME were higher than those of SQI-M and SQI-ME, respectively.
The average SQI values under the four degraded grasslands were 0.483, 0.487, 0.488 and 0.493 for SQI-M, SQI-ME, SQI-RM, and SQI-RME, respectively. The maximum SQI values for the four constructed SQIs were all observed under NDG with an average value of 0.630, which was significantly higher than that under LDG > MDG > SDG. Based on the SMDS, the contributions of soil physical, chemical and microbial quality to total soil quality under the four grasslands were calculated (Figure 3). Under NDG, the contribution of soil microbial quality was highest, while the contribution of soil chemical quality was lowest. Under LDG and MDG, the highest contributions to total soil quality were all attributable to soil chemical quality, and the lowest contributions were all attributable to soil physical quality. Under SDG, the highest contribution to soil quality was attributable to soil physical quality, and the lowest contribution was attributable to soil microbial quality.

4. Discussion

4.1. Effect of Grassland Degradation on Soil Properties

It is evident that grassland degradation has the capacity to exert an influence on multiple soil properties [20]. The BD is a commonly used indicator for the compactness and porosity of the topsoil, and it is useful for understanding the changes in the soil’s physical, chemical and biological properties [29]. Our result indicated that grassland degradation significantly increased the BD (Table 1) in the present study. This result was consistent with the findings of Mi et al. [30] in a meta-analysis of degraded grassland in China. The main reason for this phenomenon was the changes in vegetation types and biomass after grassland degradation. Grassland degradation tends to reduce the vegetation biomass and vegetation cover, thereby reducing the amount of cementing agent for the formation of soil aggregates and the stability of soil aggregate (Table 1). Therefore, the macroaggregates were broken, thus decreasing the soil porosity and increasing the contents of small-size soil fractions. Soil water content is an important indicator in natural ecosystems because it connects vegetation, soil and atmosphere [31]. Our result showed that grassland degradation significantly reduced the SWC in the study area. The reduction in SWC was also due to the decrease in vegetation biomass and vegetation cover after grassland degradation. This is because lower vegetation cover increases soil evaporation, thus decreasing the soil water contents.
SOC content is an important soil indicator and is usually used in soil quality assessment. The present study highlighted the negative effect of grassland degradation on the SOC contents in the study area (Table 1). This finding agreed well with the observed results of Yu et al. [20] in Songnen grassland and Zhang et al. [21] in grasslands of northern China. Previous studies have demonstrated that plant biomass and microbial necromass are two important carbon sources of SOC [32]. After grassland degradation, the reduction in vegetation biomass reduced the inputs of vegetation biomass into the soil, thus reducing the plant sources of SOC and decreasing the SOC content. In addition, the decline in vegetation biomass and coverage has been demonstrated to result in an escalation in wind- and rain-induced soil erosion, thereby facilitating the dispersion of SOC within the fine soil particles [20,33]. On the other hand, we found that the soil nutrient contents, including the TN, TP, AN, and AP, significantly declined after grassland degradation. The decline in soil nutrients, SOC content, and vegetation biomass created unfavorable environmental conditions for the soil microbial community’s survival and reproduction, thereby reducing the soil microbial biomass and the microbial necromass of the SOC.
The activities of enzymes in soil can serve as an indicator of soil quality, owing to the role of enzymes as catalysts in various biochemical processes within soil [34]. Previous studies had reported that soil enzyme activities were closely related to microbial activities because soil enzymes were mainly derived from microbial communities [34,35]. Therefore, the decline in all measured soil enzyme activities in the present study also demonstrated the reduction in biomass and activities of the microbial community in soils after grassland degradation in the study area. The soil pH is often used as an indicator of the chemical fertility of the soil [36]. Therefore, soil pH was also commonly used for soil quality assessment under different environmental conditions [9,27]. Our results confirmed the finding of Mi et al. [30] that the decomposition of acidic substances in soil and the accumulation of salt ions in the surface soil resulted from grassland degradation, triggering a significant increase in soil pH [37].

4.2. Assess the Influences of Grassland Degradation on Soil Quality

Using the SQI to assess the changes in soil quality under different environmental conditions is still a developing and hot field of soil science because no universally recognized and accepted SQI exists [10,12]. Our results indicated that the SQIs established by the selective minimum data set (SMDS) had greater discriminability and sensitivity to grassland degradation than the SQIs established by the MDS (Figure 1). This result agrees well with the findings of Marion et al. [10] in Southern Brazil and Yu et al. [9] in the karst regions of southwest China. It is widely acknowledged that soil quality is the result of a combination of chemical, physical, and biological properties inherent in soils [38,39]. Therefore, the absence of one of these three types of properties has been demonstrated to affect the accuracy and sensitivity of the results of soil quality assessment. Yu et al. [9] reported that only four chemical indicators were selected in MDS, and the absence of physical and microbial indicators led to the lower accuracy and sensitivity of SQIs established by the MDS. In this study, one chemical indicator, one physical indicator, and two microbial indicators were selected for the MDS. However, two chemical indicators, two physical indicators, and two microbial indicators were selected in SMDS. The incorporation of one chemical and physical indicator engendered a more comprehensive evaluation of soil quality, thereby yielding enhanced outcomes in the soil quality assessment.
In diverse soil ecosystems, distinct soil indicators fulfil varied roles, contingent on substantial variations in function and environmental factors [40,41]. Therefore, assigning different weighted values to the soil indicators within MDS or SMDS is preferable to the equal-weighted values during the soil quality assessment using SQIs. The results of this study supported the assumption that the SQIs established by the variance-weighted method performed better than the SQIs established by the equal-weighted method (Figure 1). This is primarily attributable to the fact that the equal-weighted method undermines the significance of some key indicators in the MDS or SMDS. For example, soil organic matter is an important factor limiting vegetation growth, and a low content of SOC usually implies low soil fertility. In our study, the variance-weighted method emphasized the importance of SOC content in soil quality assessment in the study area, given its high weight value of 0.64. However, the equal-weighted method only assigned a weight value of 0.25. This phenomenon is also observed in the SMDS. In general, the SQI established by the variance-weighted method and SMDS (SQI-RM) in the four established SQIs demonstrated the most effective performance in the evaluation of the impact of grassland degradation on soil quality. Consequently, it is recommended that SQI-RM should be used for the soil quality assessment in the study area or a similar area.
Results of the SQIs in the present study indicated that grassland degradation significantly (p < 0.001) reduced the soil quality, which confirmed the findings of Wang et al. [42] in a semiarid grassland of North China and Liu et al. [22] in the eastern Qinghai-Tibet Plateau, China. However, the impact of grassland degradation on soil quality varied at different stages of the degradation process. Compared to the NDG, the reduction in soil quality under LDG was mainly due to the reduction in soil physical quality (Figure 3). This is also evidenced by the significant variations in soil physical indicators observed in the SMDS. Under the MDG, the contributions of SQIP, SQIC, and SQIM underwent minor alterations in comparison with the NDG. This result implied that a similar decline occurred in all three sections of SQI. However, the significant reduction in contributions of SQIM and SQIC under SDG led to a significant decline in soil quality compared to the NDG. These changes suggested that alterations in soil indicators during the process of grassland degradation were not always consistent. Ignoring changes in any of the soil’s physical, chemical and microbial properties in the evaluation of soil quality under different environmental conditions could result in biased or erroneous conclusions. Therefore, the SMDS approach proposed in this study should be used more extensively in future soil quality assessment studies to screen for key soil indicators that influence changes in soil quality under different soil management practices.

5. Conclusions

The findings of the present study clearly revealed the effect of grassland degradation on the soil’s physical, chemical, and microbial properties, as well as SQIs in the hilly areas of northwest Guizhou. Grassland degradation significantly increased the soil properties of pH, Clay fraction, and BD, but decreased the SOC, TN, TP, AN, AP, MWD, GMD, sand fraction, SWC, LAP, NAG, AG, BG, BX, and CBH. According to the results of the PCA analysis, the four indicators, SOC, MWD, AG, and NAG, were selected in the MDS. However, six indicators, SOC, pH, BX, NAG, Clay and BD, were selected in the SMDS. Although there were significant correlations between all the established four SQIs, the SQI-RM had been demonstrated to exhibit higher sensitivity and differentiation with regard to grassland degradation. Therefore, the SQI-RM was the best SQI method for soil quality assessment under the four grassland degradation sequences. Grassland degradation significantly decreased the soil quality in this study. However, the reduction in soil physical, chemical, and microbial quality was significantly different under different degradation stages. To summarize, given the considerable repercussions of grassland degradation on soil quality, it is imperative to implement effective restoration measures to enhance soil quality, thereby ensuring the sustainable utilization of grassland. In addition, the SQI-RM was recommended as a useful tool to evaluate the influence of environmental changes on soil quality in Southwest China and other similar regions in the world based on its best performance in the four established SQIs.

Author Contributions

Conceptualization, W.L. and T.F.; methodology, X.B. and D.L.; investigation, W.L., X.B., S.Z. and B.H.; data curation, D.L.; writing—original draft preparation, W.L.; writing—review and editing, W.L. and T.F.; funding acquisition, W.L. All authors have read and agreed to the published version of the manuscript.

Funding

This research was funded by the Bijie Science and Technology Foundation (Bikelianhe [2023] 10), the Guizhou Provincial Science and Technology Project (qiankehejichu-ZK-[2024] Key077), the Bijie Scientist Workstation Project “Bijie City Scientist Workstation for Mountain Resources, Environment, and Disaster Research” (BKHPT[2025]02), and the Bijie Talent Team of Karst Plateau Resources and Environmental Remote Sensing Talent Team (202314).

Data Availability Statement

The original contributions presented in this study are included in the article. Further inquiries can be directed to the corresponding author.

Acknowledgments

We are grateful to the Hezhang County Forestry Bureau and Weining County Forestry Bureau for their assistance during sampling and data collection.

Conflicts of Interest

The authors declare no conflicts of interest.

References

  1. Ferreira, C.S.S.; Seifollahi-Aghmiuni, S.; Destouni, G.; Ghajarnia, N.; Kalantari, Z. Soil degradation in the European Mediterranean region: Processes, status and consequences. Sci. Total. Environ. 2022, 805, 150106. [Google Scholar] [CrossRef] [PubMed]
  2. Liu, B.H.; Zhang, Y.L.; Yi, X.Y.; Zheng, H.T.; Ni, K.; Ma, Q.X.; Cai, Y.J.; Ma, L.F.; Shi, Y.Z.; Yang, X.D.; et al. Partially replacing chemical fertilizer with manure improves soil quality and ecosystem multifunctionality in a tea plantation. Agric. Ecosyst. Environ. 2025, 378, 109284. [Google Scholar] [CrossRef]
  3. Kraamwinkel, C.T.; Beaulieu, A.; Dias, T.; Howison, R.A. Planetary limits to soil degradation. Commun. Earth Environ. 2021, 2, 249. [Google Scholar] [CrossRef]
  4. Laik, R.; Singh, S.K.; Pramanick, B.; Kumari, V.; Nath, D.; Dessoky, E.S.; Attia, A.O.; Hassan, M.M.; Hossain, A. Improved method of boron fertilization in rice (Oryza sativa L.)-m (Brassica juncea L.) cropping system in upland calcareous soils. Sustainability 2021, 13, 5037. [Google Scholar] [CrossRef]
  5. Lal, R. Restoring soil quality to mitigate soil degradation. Sustainability 2015, 7, 5875–5895. [Google Scholar] [CrossRef]
  6. Li, K.L.; Wang, C. Multiple soil quality assessment methods for evaluating effects of organic fertilization in wheat-maize rotation system. Eur. J. Agron. 2023, 150, 1269299. [Google Scholar] [CrossRef]
  7. Obade, V.P.; Lal, R. A standardized soil quality index for diverse field conditions. Sci. Total. Environ. 2016, 541, 424–434. [Google Scholar] [CrossRef]
  8. Raiesi, F.; Beheshti, A. Evaluating forest soil quality after deforestation and loss of ecosystem services using network analysis and factor analysis techniques. CATENA 2022, 208, 105778. [Google Scholar] [CrossRef]
  9. Yu, P.J.; Liu, J.L.; Tang, H.Y.; Sun, X.Z.; Liu, S.W.; Tang, X.G.; Ding, Z.; Ma, M.G.; Ci, E. Establishing a soil quality index to evaluate soil quality after afforestation in a karst region of Southwest China. CATENA 2023, 230, 107237. [Google Scholar] [CrossRef]
  10. Marion, L.F.; Schneider, R.; Cherubin, M.R.; Colares, G.S.; Wiesel, P.G.; Costa, A.B.; Lobo, E.A. Development of a soil quality index to evaluate agricultural cropping systems in southern Brazil. Soil. Tillage. Res. 2022, 218, 105293. [Google Scholar] [CrossRef]
  11. Shuite, Z.; Demessie, A.; Abebe, T. Land use effect on soil quality and its implication to soil carbon storage in Aleta Chuko, Ethiopia. Geoderma Reg. 2025, 40, e00917. [Google Scholar] [CrossRef]
  12. Yu, P.J.; Liu, S.W.; Zhang, L.; Li, Q.; Zhou, D.W. Selecting the minimum data set and quantitative soil quality indexing of alkaline soils under different land uses in northeast China. Sci. Total. Environ. 2018, 616, 564–571. [Google Scholar] [CrossRef] [PubMed]
  13. Li, F.F.; Zhang, X.S.; Zhao, Y.; Song, M.J.; Liang, J. Soil quality assessment of reclaimed land in the urban-rural fringe. CATENA 2023, 220, 106692. [Google Scholar] [CrossRef]
  14. Liu, C.Z.; Si, B.C.; Zhao, Y.; Wu, Z.M.; Lu, Z.C.; Chen, X.; Han, X.Z.; Zhu, Y.C.; Zou, W.X. Divers of soil quality and maize yield under long-term tillage and straw incorporation in Mollisols. Soil Tillage Res. 2025, 246, 106360. [Google Scholar] [CrossRef]
  15. Nasir, M.J.; Haider, M.F.; Ali, Z.; Akhtar, W.; Alam, S. Evaluation of soil quality through simple additive soil quality index (SQI) of Tehsil Charsadda, Khyber Pakhtunkhwa, Pakistan. J. Saudi Soc. Agric. Sci. 2024, 23, 42–54. [Google Scholar] [CrossRef]
  16. Ma, L.; Si, H.T.; Li, M.Y.; Li, C.; Zhu, D.X.; Mao, Z.; Yan, Y.L.; Jiang, K.; Yu, P.J. Influence of land use types on soil properties and soil quality in karst regions of Southwest China. Agronomy 2024, 14, 882. [Google Scholar] [CrossRef]
  17. Temjen, W.; Singh, M.R.; Ajungla, T. Effect of shifting cultivation and fallow on soil quality index in Mokokchung district, Nagaland. India. Ecol. 2022, 11, 42. [Google Scholar] [CrossRef]
  18. Dong, S.K.; Wen, L.; Li, Y.Y.; Wang, X.X.; Zhu, L.; Li, X.Y. Soil quality effects of grassland degradation and restoration on the Qinghai-Tibetan Plateau. Soil Sci. Soc. Am. J. 2012, 76, 2256–2264. [Google Scholar] [CrossRef]
  19. Zhang, L.; Zhou, G.S.; Ji, Y.H.; Bai, Y.F. Spatiotemporal dynamic simulation of grassland carbon storage in China. Sci. China Earth Sci. 2016, 59, 1946–1958. [Google Scholar] [CrossRef]
  20. Yu, P.J.; Wang, H.Q.; Hu, J.; Shi, W.Y.; Xia, X.Y.; Sun, X.Z.; Tang, H.Y.; Huang, Y.X. Vegetation degradation reduces aggregate associated carbon by reducing both labile and stable carbon fraction in Northeast China. Sci. Total. Environ. 2024, 954, 176789. [Google Scholar] [CrossRef]
  21. Zhang, X.D.; Song, Z.L.; Zhang, D.B.; Wu, Y.T.; Zwieten, L.V.; Sun, S.B.; Wang, W.Y.; Liu, H.Y.; Wang, Y.D.; Wang, H.L. Soil properties and anthropogenic influences control the distribution of soil organic carbon in grasslands of northern China. Land Degrad. Dev. 2024, 35, 33–45. [Google Scholar] [CrossRef]
  22. Liu, L.K.; Zhao, G.J.; An, Z.F.; Mu, X.M.; Jiao, J.Y.; An, S.S.; Tian, P. Effect of grazing intensity on alpine meadow soil quality in the eastern Qinghai-Tibet Plateau, China. Ecol. Indic. 2022, 141, 109111. [Google Scholar] [CrossRef]
  23. Huangfu, J.Y.; Mao, F.X.; Lu, X.S. Analysis of grassland resources in southwest China. Acta Pratacult. Sin. 2012, 21, 75–82. [Google Scholar]
  24. Fang, J.Y.; Geng, X.Q.; Zhao, X.; Shen, H.H.; Hu, H.F. How many areas of grasslands are there in China? Chin. Sci. Bull. 2018, 63, 1731–1739. [Google Scholar] [CrossRef]
  25. Wuyunga; Wulantuya; Zhang, W.Q.; Siqinchaoketu; Gaosuriguga; Bao, M.S. Analysis of the evolution of the grassland degradation evaluation index system in China based on CiteSpace. Chin. J. Grassl. 2023, 45, 125–136. [Google Scholar]
  26. GB 19377-2003; Parameters for Degradation, Sandification and Salification of Rangelands. General Administration of Quality Supervision, Inspection and Quarantine of the People’s Republic of China: Beijing, China, 2003.
  27. Cao, Y.; Xiong, K.N. Soil quality assessment under different vegetation restoration strategies in the karst rocky deserted area of Southwestern China. J. Soil Sci. Plant Nutr. 2024, 24, 3249–3264. [Google Scholar] [CrossRef]
  28. Zahedifar, M. Assessing alteration of soil quality, degradation, and resistance indices under different land sues through network and factor analysis. CATENA 2023, 222, 106807. [Google Scholar] [CrossRef]
  29. Panagos, P.; Rosa, D.D.; Liakos, L.; Labouyrie, M.; Borrelli, P.; Callabio, B. Soil bulk sensity assessment in Europe. Agric. Ecosyst. Environ. 2024, 364, 108907. [Google Scholar] [CrossRef]
  30. Mi, W.T.; Zheng, H.; Chi, Y.; Ren, W.B.; Zhang, H.X.; Zhang, W.Y.; Yuan, F.; Liu, Y.L. Reseeding restoration significantly improves the physical and chemical properties of degraded grassland soil in China—A meta analysis. CATENA 2025, 252, 108849. [Google Scholar] [CrossRef]
  31. Guo, X.W.; Dai, L.C.; Li, Q.; Qian, D.W.; Cao, G.M.; Zhou, H.K.; Du, Y.G. Light grazing significantly reduces soil water storage in Alpine grasslands on the Qinghai-Tibet Plateau. Sustainability 2020, 12, 2523. [Google Scholar] [CrossRef]
  32. Luo, R.Y.; Kuzyakov, Y.; Zhu, B.; Qiang, W.; Zhang, Y.; Pang, X.Y. Phosphourus addition decreases plant lignin but increases microbial necromass contribution to soil organic carbon in a subalpine forest. Glob. Change Biol. 2022, 28, 4194–4210. [Google Scholar] [CrossRef] [PubMed]
  33. Li, Q.; Yu, P.J.; Li, G.D.; Zhou, D.W.; Chen, X.Y. Overlooking soil erosion induces underestimation of the soil C loss in degraded land. Quat. Int. 2014, 349, 287–290. [Google Scholar] [CrossRef]
  34. Chen, Y.X.; Wei, T.X.; Sha, G.L.; Zhu, Q.K.; Liu, Z.; Ren, K.; Yang, C. Soil enzyme activities of typical plant communities after vegetation restoration on the Loess Plateau, China. Appl. Soil Ecol. 2022, 170, 104292. [Google Scholar] [CrossRef]
  35. Pausch, J.; Kuzyakov, Y. Carbon input by roots into the soil: Quantification of rhizodeposition from root to ecosystem scale. Glob. Change Biol. 2018, 24, 1–12. [Google Scholar] [CrossRef]
  36. Hartemink, A.E.; Barrow, N.J. Soil pH—Nutrient relationships: The diagram. Plant Soil 2023, 486, 209–215. [Google Scholar] [CrossRef]
  37. Li, Y.M.; Wang, S.P.; Jiang, L.L.; Zhang, L.R.; Cui, S.J.; Meng, F.D.; Wang, Q.; Li, X.; Zhou, Y. Changes of soil microbial community under different degraded gradients of alpine meadow. Agric. Ecosyst. Environ. 2016, 222, 213–222. [Google Scholar] [CrossRef]
  38. Bunemann, E.K.; Bongiorno, G.; Bai, Z.G.; Creamer, R.E.; Deyn, G.D.; Goede, R.; Fleskens, L.; Geissen, V.; Kuyper, T.W.; Mader, P.; et al. Soil quality—A critical review. Soil Biol. Biochem. 2018, 120, 105–125. [Google Scholar] [CrossRef]
  39. Sepehya, S.; Mehta, D.; Kumar, A.; Sharma, R.; Sharma, D.; Sharma, A. Concept and assessment methodology of soil quality: A review. Int. J. Plant. Soil. Sci. 2024, 36, 164–172. [Google Scholar] [CrossRef]
  40. Yu, P.J.; Han, D.L.; Liu, S.W.; Wen, X.; Huang, Y.X.; Jia, H.T. Soil quality assessment under different land uses in an alpine grassland. CATENA 2018, 171, 280–287. [Google Scholar] [CrossRef]
  41. Drobink, T.; Greiner, L.; Keller, A.; Gret-Regamey, A. Soil quality indicators—From soil functions to ecosystems services. Ecol. Indic. 2018, 94, 151–169. [Google Scholar] [CrossRef]
  42. Wang, D.; Huang, X.D.; Qiao, N.; Geng, Q.L.; Liu, Y.Z.; Song, H.Q.; Yang, Z.L.; Liu, C.; Wang, G. Effects of mowing and fertilization on soil quality in a semiarid grassland of North China. Land Degrad. Dev. 2020, 32, 1656–1666. [Google Scholar] [CrossRef]
Figure 1. Values of soil quality under different grasslands. The bar represents the standard error. Different uppercase letters indicate significant differences (p < 0.05) among different grasslands.
Agronomy 15 01091 g001
Figure 2. Correlation relationships among the soil quality indexes. ***, p < 0.001.
Agronomy 15 01091 g002
Figure 3. The contribution of soil physical (SQIP), chemical (SQIC), and microbial quality (SQIM) to total soil quality under different grasslands.
Agronomy 15 01091 g003
Table 1. The methods used to determine soil properties in this study.
Soil Properties TypeSoil PropertiesStandard Analytical MethodsReference
Chemical propertiespH1:5 soil-to-water ratioLiu et al., 2025 [2]
SOC (g kg−1)Dry combustion C and N analyzerLiu et al., 2025 [2]
TN (g kg−1)Dry combustion C and N analyzerLiu et al., 2025 [2]
TP (g kg−1)Digestion, spectrophotometer detectionLiu et al., 2025 [2]
AN (mg kg−1)Alkaline hydrolysis diffusion methodLiu et al., 2025 [2]
AP (mg kg−1)Sodium bicarbonate extraction, colorimetric detectionLiu et al., 2025 [2]
Microbial propertiesLAP (nmol h−1 g−1)Microplate fluorescence methodCao et al., 2024 [27]
NAG (nmol h−1 g−1)Microplate fluorescence methodCao et al., 2024 [27]
AG (nmol h−1 g−1)Microplate fluorescence methodCao et al., 2024 [27]
BG (nmol h−1 g−1)Microplate fluorescence methodCao et al., 2024 [27]
BX (nmol h−1 g−1)Microplate fluorescence methodCao et al., 2024 [27]
CBH (nmol h−1 g−1)Microplate fluorescence methodCao et al., 2024 [27]
ACP (nmol h−1 g−1)Microplate fluorescence methodCao et al., 2024 [27]
Physical propertiesMWD (mm)Wet sieving and calculationYu et al., 2023 [9]
GMD (mm)Wet sieving and calculationYu et al., 2023 [9]
Clay (%)Using mastersizer 2000Yu et al., 2023 [9]
Sand (%)Using mastersizer 2000Yu et al., 2023 [9]
BD (g cm−3)Cutting ring methodLiu et al., 2025 [2]
SWC (%)Oven-drying methodYu et al., 2023 [9]
MWD, mean weight diameter; GMD, geometric mean diameter; BD, bulk density; SWC, soil water content; SOC, soil organic carbon; TN, total nitrogen; TP, total phosphorus; AN, available nitrogen; AP, available phosphorus; LAP, leucine aminopeptidase; NAG, β-acetylglucosaminidase; AG, α-glucosidase; BG, β-glucosidase; BX, β-1,4-xylosidase; CBH, fiber biohydrolase; ACP, acid phosphatase.
Table 2. Changes in different soil indicators under the four grasslands.
NDGLDGMDGSDGp
pH6.77 (±0.06) c7.07 (±0.12) b6.97 (±0.10) bc7.69 (±0.04) a<0.001
SOC (mg g−1)54.81 (±1.43) a52.86 (±2.17) a37.22 (±1.02) b25.41 (±1.15) c<0.001
TN (mg g−1)2.99 (±0.12) a2.74 (±0.08) a1.96 (±0.12) b1.88 (±0.14) b<0.001
TP (mg g−1)0.71 (±0.02) b0.80 (±0.02) a0.61 (±0.03) c0.59 (±0.03) c<0.001
AN (mg kg−1)137.4 (±5.29) a122.71 (±4.64) b99.12 (±5.21) c86.11 (±3.71) c<0.001
AP (mg kg−1)4.77 (±0.10) a4.85 (±0.11) a3.71 (±0.15) b3.2 (±0.06) c<0.001
LAP (nmol h−1 g−1)37.25 (±0.90) a35.5 (±1.18) a26.85 (±1.77) b21.26 (±0.77) c<0.001
NAG (nmol h−1 g−1)27.45 (±1.38) a25.78 (±1.28) a20.66 (±1.72) b21.45 (±1.60) b0.011
AG (nmol h−1 g−1)4.26 (±0.13) a3.63 (±0.15) b4.02 (±0.20) ab2.24 (±0.09) c<0.001
BG (nmol h−1 g−1)49.03 (±2.62) a52.47 (±2.51) a36.17 (±1.22) b26.24 (±1.18) c<0.001
BX (nmol h−1 g−1)4.69 (±0.17) a3.81 (±0.17) b2.96 (±0.06) c1.82 (±0.10) d<0.001
CBH (nmol h−1 g−1)6.10 (±0.22) a4.69 (±0.29) b4.78 (±0.13) b2.63 (±0.14) c<0.001
ACP (nmol h−1 g−1)61.49 (±2.74) ab66.43 (±3.30) a60.53 (±2.25) ab56.1 (±2.68) b0.104
MWD (mm)3.30 (±0.08) a2.54 (±0.17) c2.69 (±0.14) bc2.93 (±0.07) ab0.002
GMD (mm)2.16 (±0.12) a1.3 (±0.18) b1.31 (±0.13) b1.61 (±0.09) b<0.001
Clay (%)4.44 (±0.21) c6.85 (±0.17) a6.78 (±0.32) a5.76 (±0.24) b<0.001
Sand (%)23.72 (±3.29) a4.06 (±0.54) c13.32 (±1.81) b10.79 (±1.30) b<0.001
BD (g cm−3)1.08 (±0.04) b1.14 (±0.05) b1.45 (±0.07) a1.40 (±0.05) a<0.001
SWC (%)69.67 (±2.60) a38.79 (±1.87) b37.21 (±2.03) b38.34 (±1.20) b<0.001
Results are shown as the mean (±SD). Values with the same letter within rows are not significantly different at p < 0.05. See Table 1 for abbreviations.
Table 3. Results of PCA analysis.
Soil IndicatorsMinimum Data SetSeparate Minimum Data Set
PC1PC2PC3PC4ChemicalMicrobialPhysical
PC1PC2PC1PC2PC1PC2
pH−0.750.17−0.510.07−0.750.58
SOC0.94−0.25−0.040.010.970.01
TN0.870.02−0.260.200.890.18
TP0.67−0.44−0.270.100.790.44
AN0.88−0.02−0.010.210.87−0.18
AP0.88−0.29−0.18−0.060.930.08
LAP0.93−0.22−0.01−0.03 0.940.08
NAG0.59−0.12−0.26−0.64 0.600.76
AG0.70−0.110.590.20 0.80−0.48
BG0.85−0.35−0.090.24 0.88−0.02
BX0.94−0.100.120.08 0.95−0.07
CBH0.89−0.030.36−0.15 0.93−0.08
MWD0.310.86−0.080.32 0.870.37
GMD0.450.80−0.150.29 0.910.22
Clay−0.45−0.810.160.13 −0.930.01
Sand0.430.710.31−0.38 0.810.09
BD−0.770.040.480.12 −0.470.86
SWC0.770.570.02−0.15 0.92−0.19
Eigenvalues10.183.441.371.024.540.604.420.824.150.96
Variance (%)56.5419.097.625.6675.6110.0373.6513.7169.2016.05
Cumulative56.5475.6383.2588.9175.6185.6473.6587.3769.2085.25
PC, principal component. Boldface factor loading values are in the top 10%, and the boldface and italic factor loading values correspond to the selected soil indicators. See Table 1 for abbreviations.
Table 4. Correlation analysis results among the selected 18 soil indicators.
IndicatorpHSOCTNTPANAPLAPANGAGBGBXCBHMWDGMDClaySandBDSWC
pH1
SOC***1
TN*****1
TP*******1
AN***********1
AP**************1
LAP******************1
NAG0.05***********1
AG*****************0.171
BG************************1
BX****************************1
CBH*******************************1
MWD0.430.350.070.350.100.450.320.430.260.380.150.201
GMD0.330.13*0.44*0.240.150.320.170.16*0.09***1
Clay0.260.16*0.50*0.170.090.140.320.390.070.06******1
Sand*0.150.110.260.100.260.130.090.060.480.07*********1
BD********************0.14********0.240.07**0.161
SWC*******0.09*****************************1
See Table 1 for abbreviations. *, p < 0.05, **, p < 0.01, ***, p < 0.001
Table 5. The parameters used in the nonlinear equations to establish the soil quality indexes.
IndicatorsScoring CurveParametersWeight for MDSWeight for SMDS
MeanSlopeVarianceEqualVarianceEqual
SOCMore is better42.57−2.50.640.250.300.17
MWDMore is better2.86−2.50.220.25
AGMore is better3.54−2.50.080.25
NAGMore is better23.84−2.50.060.250.050.17
ClayLess is better5.962.5 0.270.17
BDLess is better1.272.5 0.060.17
pHLess is better7.122.5 0.040.17
BXMore is better3.32−2.5 0.280.17
See Table 1 for abbreviations. MDS, minimum data set, SMDS, separate minimum data set.
Disclaimer/Publisher’s Note: The statements, opinions and data contained in all publications are solely those of the individual author(s) and contributor(s) and not of MDPI and/or the editor(s). MDPI and/or the editor(s) disclaim responsibility for any injury to people or property resulting from any ideas, methods, instructions or products referred to in the content.

