Abstract
Drip irrigation technology, known for its advantages in high water use efficiency and yield increase, has been a focal point of research regarding its combined effects with the plastic film-mulching technique on field water consumption and crop growth. To accurately quantify the water-saving effect of plastic film-mulching techniques and investigate the mechanisms of mulching on evaporation (E) and transpiration (T), this study was conducted on soybean using the Bowen ratio–energy balance system and micro-lysimeters as the observation means and the MSW model as the data partitioning tool, during 2019–2021 in arid northwest China. We compared evapotranspiration (ET) under the film-mulched drip irrigation (FM) and non-mulched drip irrigation (NM) treatments. The results show that ET, E, and T under FM were reduced by 32.6 mm, 76.1 mm, and −43.5 mm, respectively. Moreover, mulching increased the leaf area index (LAI) by 20.7%, soybean yield from 2727.0 kg ha−1 to 3250.5 kg ha−1, and WUE from 0.64 kg m−3 to 0.83 kg m−3 on average, which means mulching reduced water consumption in the field by decreasing soil evaporation and improved water use efficiency by promoting crop growth. Further analysis indicated that mulching has strengthened the connection between soil temperature and humidity and weakened the effect of soil temperature on soybean leaf growth. Soil water content (SWC) and LAI had a direct negative effect on E, with LAI causing a stronger effect on E under the FM treatment. Mulching has weakened the direct effect of SWC on T, so that only LAI and soil temperature had a significant direct positive effect on T. Following the rapid growth of soybean LAI, the isolating effect of the mulch was gradually replaced by the dense leaf canopy. The results provide a reference for further exploring the water-saving and yield-increasing benefits of plastic film-mulching techniques, and to facilitate wider promotion of the plastic film-mulching techniques and the water–fertilizer integration technology in arid regions.
1. Introduction
Increases in the concentrations of greenhouse gases have caused climate change globally and will maintain or even intensify the rise in mean annual temperature and regional precipitation [1]. As a result, the spatial and temporal distribution of rainfall, water availability, and other agricultural production factors will be affected and the water supply and demand altered, thus posing a serious threat to global food security [2]. In particular, for arid and semi-arid regions, water shortage has greatly restricted agricultural and economic development locally [3]. Currently, agriculture accounts for 60% of the world’s total sweet water consumption [4].
The mulched drip irrigation technology further carries forward the advantages of the drip irrigation technology and has been widely popularized in arid and semi-arid areas [2,5,6,7,8]. As of today, many studies have been conducted to compare mulched drip irrigation and non-mulched drip irrigation, concluding that mulching reduced field evapotranspiration by 2.8–5.2% [7,9], increased LAI by 36.79% [10,11,12], and raised crop yield by 5.9–8.8% [9,13,14]. Yet, most of these studies were plot experiments, from which the water consumption data were not as accurate as those from field observation experiments. In addition, few studies have been carried out on partitioning and comparing soil evaporation and plant transpiration data.
Irrigation directly changes soil temperature and humidity, which in turn affect crop growth and field evapotranspiration [15,16]. Sui et al. [3] found that mulched drip irrigation increased field water capacity by 8 mm compared with non-mulched drip irrigation. Al-Othman et al. [17] pointed out that mulching increased soil temperature by 1.1 °C to 3.6 °C, which accelerated the growth of maize. Some studies indicated that the temperature-increasing effect of mulching occurred mainly in the early stages of the growth period [18,19]. Evapotranspiration climbed significantly with the increase in soil moisture caused by irrigation, and mulching raised soil temperature, quickened crop growth, and reduced total water consumption while increasing plant transpiration [16,20,21]. However, few studies have accurately evaluated and discussed soil evaporation and plant transpiration based on daily field trial data combined with mathematical models [22], and few have quantified the respective effects of soil temperature and humidity on soil evaporation and plant transpiration.
Moreover, the water demand of soybeans is significantly higher than that of cereal crops, and the sensitivity of soybeans to water is different at different growth stages, which is further amplified under a drought environment. Few soybeans are cultivated in northwest China, and research on soybeans pays more attention to variety breeding, fertilization and yield increases, etc. Few studies have conducted long-term observations on field water consumption of soybeans under film-mulched drip irrigation, and there are few relevant data to explain whether such field management mode can save water and increase soybean yield in the arid northwest region. Analyzing the effects of film-mulched drip irrigation on soil evaporation and plant transpiration in soybean fields, respectively, which could further clarify its water-saving and yield-increasing mechanisms, providing guidance and data support for soybean cultivation in arid and semi-arid regions. To achieve the above research objectives, we conducted a 3-year field experiment on soybeans in arid northwest China. We employed the Bowen ratio–energy balance (abbreviated as BREB, the same below) system, micro-lysimeters, and the MSW model to compare soil evaporation, plant transpiration, and field evapotranspiration under mulched and non-mulched drip irrigation. Meanwhile, we observed the soil water content (abbreviated as SWC, the same below) and soil temperature (abbreviated as Ts, the same below), and discussed how mulching changed the soil temperature and humidity, thereby affecting soil evaporation and plant transpiration BY considering leaf growth indicators.
2. Materials and Methods
2.1. Experimental Site Description
To conduct a precise study of the effects of the film-mulching technique on water-saving agricultural production in arid and semi-arid regions, a national experimental station located in the arid area of northwest China was selected to carry out the experiment. This experiment was conducted at the National Field Scientific Observation and Research Station on Efficient Water Use of Oasis Agriculture (37°49′ N, 102°52′ E, altitude 1586 m) during 2019–2021 in Wuwei City, Gansu Province, northwest China. The experimental site is in a typical continental temperate climate zone, where the annual precipitation is 164 mm, mean annual temperature is 8 °C, annual accumulated temperature (>0 °C) is 3550 °C, annual evaporation is 2000 mm, and the average annual duration of sunshine is 3000 h. The groundwater table was 40–50 m below the ground surface [23]. Its soil texture is sandy loam, with a mean dry bulk density of 1.54 g cm−3 at 0–1 m depth and a mean field capacity of 0.30 cm3 cm−3.
2.2. Experimental Design
In this experiment, spring soybean (Longhuang 3) was selected and sown manually with a hole planter at a density of 118,000 plants per hectare, with the plant spacing at 15 cm and the row spacing at 50 cm. The irrigation method adopted was drip irrigation, with the drip tape spacing at 0.5 m and the drip emitter spacing at 0.2 m. To compare the effects of film-mulching on crop growth, two treatments, film-mulching (FM) and non-mulching (NM), were set up, and the area of a single test field was 50 m × 50 m. The specific layouts of soybean fields under different irrigation methods are shown in Figure 1. FM and NM fields were separated by ridging after pre-sowing irrigation. The white transparent plastic film with a thickness of 0.01 mm was selected. The soil was compacted on both sides of the plastic film to reduce damage caused by wind. With the expansion of the soybean canopy, the influence of wind on the plastic film would gradually decrease. The soybean planting and harvesting dates under different treatments from 2019 to 2021 are shown in Table 1. The spring soybean irrigation schedule was developed according to local irrigation practices and applied the same to both the FM and NM conditions, as shown in Table 2. The year 2019 was characterized by full irrigation, whereas the years 2020 and 2021 were subjected to deficit irrigation.
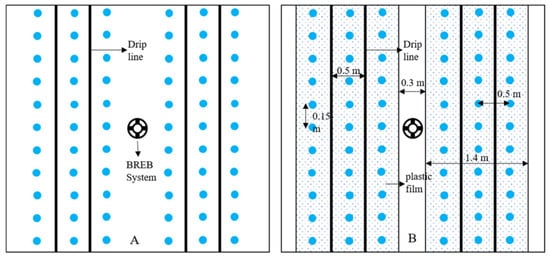
Figure 1.
The specific layouts of soybean fields under film-mulched drip irrigation (FM) and non-mulched drip irrigation (NM) ((A) for NM, and (B) for FM).

Table 1.
Planting and harvesting dates of soybeans under film-mulched drip irrigation (FM) and non-mulched drip irrigation (NM) during 2019–2021.
Table 2.
Soybean irrigation scheduling from 2019 to 2021 (the numbers in parentheses indicate the irrigation amount on the underlined date).
2.3. Observations and Data Collection
2.3.1. Meteorological Data
The conventional meteorological data were obtained from the automatic weather stations at the experimental station through continuous monitoring with an observation frequency of 15 min, such data including rainfall, wind speed, solar radiation, air temperature, and relative air humidity. The missing data were interpolated according to Bowen ratio–energy balance system observations to meet the accuracy standard of the experiment. The variations of rainfall, wind speed, solar radiation and air temperature over the whole growth period of soybean during 2019–2021 are shown in Figure 2, and the corresponding annual mean values are shown in Table 3.
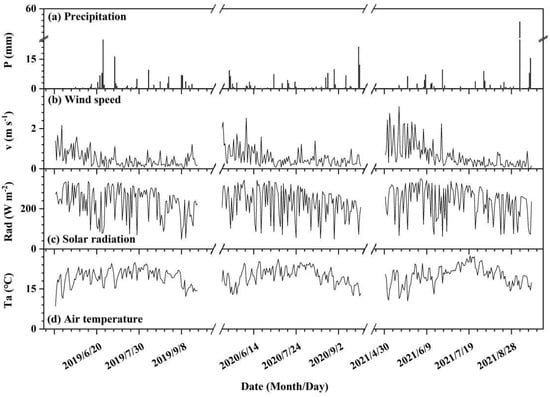
Figure 2.
Diurnal variation of conventional meteorological indicators over the whole growth period of soybean during 2019–2021.
Table 3.
The annual mean values of conventional meteorological indicators over the whole growth period of soybean during 2019–2021.
2.3.2. Water and Heat Fluxes
A Bowen ratio–energy balance (BREB) system (Figure 1) was installed at the center of the test field under FM and NM treatments, respectively, for long-term continuous observation of water and heat fluxes throughout the soybean growth period. The observation indices, corresponding probe models, and locations of the BREB system devices are shown in Table 4. Perform regular maintenance of the BREB system with LoggerNet software 4.0. In addition, to calibrate the observed soil water content data, six sampling points were set up in the FM and NM fields, respectively. Soil samples were taken before and after each irrigation to measure the soil moisture content with an electronic balance and a drying oven. The accuracy of the electronic balance was 0.01 g.
Table 4.
Installation information of Bowen ratio–energy balance (BREB) system.
The Bowen ratio–energy balance method was proposed by Bowen based on the energy balance equation and the near-surface gradient diffusion theory to estimate the near-surface latent heat (λET) and sensible heat flux (Hs) [24].
According to the near-surface gradient diffusion theory, the latent heat flux (λET) and sensible heat flux (Hs) due to turbulent exchange per unit time are correlated with the temperature and water vapor pressure in the vertical direction as follows:
where λ is the latent heat of vaporization of water (J kg−1), ρa is the air density (kg m−3), Cp is the specific heat of air at constant pressure (J kg−1 K−1), Kw and Kh are the latent heat and sensible turbulent exchange coefficient (m2 s−1), respectively, and ∂q/∂z and ∂θ/∂z are the specific humidity gradient (1 m−1) and the potential temperature gradient (°C m−1) of the near-surface air, respectively. Assuming that the underlying surface latent heat and sensible turbulent exchange are similar, according to the Reynolds similarity principle, Kw ≈ Kh, the Bowen ratio can be expressed as follows:
where ΔT and Δe are the temperature difference (°C) and vapor pressure difference (kPa) at different heights.
Using the formula above, we could obtain the following:
The BREB system was used to observe the temperature and vapor pressure at two vertical locations, which were used together with the observed net radiation flux and soil heat flux, to be inserted into the equation above to obtain λET and Hs. The precision of the calculated values for λET and Hs is contingent upon the precision of the Bowen ratio. According to the set of criteria for selecting between reliable and unreliable values promoted by Perez et al. [25], H and ET data were screened and interpolated [26]. The water consumption (ET) is transformed by λET.
2.3.3. Soil Evaporation
Soil evaporation was measured by micro-Lysimeters, which were constructed using PVC tubes, with inner and outer diameters of 10 cm and 11 cm, respectively, and a height of 20 cm for both. Undisturbed soil was placed inside the inner tube, which was first covered with filter paper at the bottom and then sealed with gauze. The outer tube was used to secure and protect the surrounding soil. Six replicates were set up for the FM and NM treatments, with three located in bare soil and three under the mulching film (beneath the nozzles of drip irrigation tapes). The location where the plant height and canopy of soybean were at the average level of the field was selected when setting up micro-lysimeters, and the soil inside was periodically replaced. Weighing was performed daily at 19:30 using an electronic balance with an accuracy of 0.1 g. The data obtained by the micro-lysimeter that deviated from the mean by more than three times the standard deviation were excluded.
2.3.4. Physiological Indicators
The test fields for each treatment in the experiment were divided into 5 m × 5 m plots to select plant samples, and the growth indices of spring soybean measured in this study mainly included canopy height, number of stem nodes, number of leaves, leaf length, leaf width, number of root nodules, and chlorophyll content, with sampling intervals of about 10 days and 30 replicates in the test field for each treatment. The ratio of sampled plants between the middle row and the side rows was controlled at 1:2.
The leaf area index (LAI) data were also interpolated to obtain the daily scale data for the whole growth period, which were calculated as follows:
where LAI is the leaf area index (cm2 cm−2), Li and Wi are the leaf length and leaf width, (cm), respectively, and D and S are the row spacing and plant spacing (cm), respectively.
At harvest time, nine one-square-meter quadrats were taken for each treatment, with the soybeans in the quadrats threshed and dried separately. Then, the soybean seeds were weighed using an electronic balance with an accuracy of 0.01 g to obtain soybean yield data for each treatment.
2.4. MSW Model Description
The MSW model, improved from the Shuttleworth–Wallace model [27] by Li et al. [23], has been demonstrated to accurately segment field evapotranspiration data under plastic film-mulching conditions, with the full expression shown below:
where represents the soil evaporation under film-mulching. Ideally, it could be deemed that the mulch has completely blocked the evaporation of soil water, i.e., . Therefore, the MSW model can be further simplified as follows:
where ET represents evapotranspiration, the non-mulched soil evaporation, T the canopy transpiration, λ the latent heat of vaporization (J kg−1), and the ratio of mulched soil area to total area. and mean the soil surface resistance and canopy resistance coefficients, and and are similar to the soil evaporation and plant transpiration as expressed in the Penman–Monteith model. These coefficients are expressed with the following formula:
where is the saturation water vapor pressure curve (kPa K−1), the air density (kg m−3), the specific heat of dry air at constant pressure (J kg−1 K−1), the saturation vapor pressure deficit (kPa), the humidity constant (kPa K−1), and the aerodynamic resistance (s m−1) between the soil and the canopy and between the canopy and the reference height, respectively, and the canopy boundary layer and stomatal volume resistance (s m−1), and the soil surface resistance (s m−1). and are the total available energy and the available energy to the substrate (W m−2), respectively, defined as follows:
where is the net radiation (W m−2), G the soil heat flux (W m−2), the radiation to the soil surface (W m−2), c the extinction coefficient, and LAI the leaf area index (cm2 cm−2).
The aerodynamic resistance and can be expressed as follows:
where k is the von Karman constant, the friction velocity, z the reference height, hc the canopy height, n the extinction coefficient of the eddy diffusion, and Kh, d, and z0 represent the canopy top eddy diffusion coefficient, zero plane displacement, and roughness length, which are calculated as follows:
and are calculated as follows:
where rb represents the mean boundary layer resistance (s m−1), the mean value of soil water content at 0–100 cm soil depth (cm3 cm−3), and the mean value of field capacity at 0–100 cm soil depth (cm3 cm−3).
The canopy resistance () is related to the following environmental factors:
where is the minimum stomatal resistance observed under the best conditions, Rs the incoming solar radiation (W m−2), the air temperature (°C), VPD the saturation vapor pressure deficit (KPa), the wilting point at 0–100 cm depth, and the normalized soil moisture factor.
2.5. Model Evaluation Indicators
The performance of the software model was evaluated based on the linear regression between the estimated value (Ei) and the observed value (Oi). In the process, the coefficient of determination (R2), mean absolute error (MAE), and root mean square error (RMSE) were used as performance indicators, which were calculated as follows:
where M, S, , , and n represent the measured value, simulated value, the mean of measured values, the mean of the simulated values, and the number of data, respectively. The value of R2 represents the proportion of data variance that the model can explain, and the value range is [0, 1]. MAE reflects the actual difference between the predicted value and the observed value. RMSE is used to measure the deviation between the measured value and the simulated value. The smaller MAE and RMSE, and the larger R2, mean better simulation effects. SPSS 25.0 and OriginPro 2018C software were used for data processing and analysis in the study.
3. Results
3.1. Simulation Effect of the MSW Model
In order to partition the field evapotranspiration data (ETmeasured) calculated with the Bowen ratio, the MSW model was used to simulate ET (ETMSW), E (EMSW), and T (TMSW) under FM and NM conditions, respectively, and the simulation results were validated based on ETmeasured and E data (Emeasured) obtained from the micro-lysimeters, thereby obtaining the ratio of the soil evaporation at the daily scale to field evapotranspiration (EMSW/ETMSW) and the ratio of plant transpiration to field evapotranspiration (TMSW/ETMSW). Finally, Finally, EMSW/ETMSW and TMSW/ETMSW were multiplied by ETmeasured, respectively, to obtain the E and T data at the daily scale after partitioning.
The daily variations of ETMSW and ETmeasured under different irrigation conditions during 2019–2021 are shown in Figure 3. Combined with Table 5, the fitting effect between ETMSW and ETmeasured was good. However, the MSW model underestimated field evapotranspiration by 10% and 11% for the FM and NM conditions, respectively, during the 3-year observation period. Figure 4 illustrates the daily variation in EMSW and Emeasured under different irrigation conditions during 2019–2021. Combined with Table 6, the fitting effect between EMSW and Emeasured was good. But the MSW model underestimated soil evaporation by 4% and 1% for the FM and NM conditions, respectively. Because of the large number of branches and leaves of soybean plants, leaf area index, and canopy height involved in the MSW model could not accurately represent crop growth, resulting in an underestimation of ET. Moreover, the MSW model assumed that the film-mulching was airtight, while the film-mulching in agricultural production was damaged, and there was heat conduction between the inside and outside of the plastic film, resulting in E being further underestimated under FM conditions.
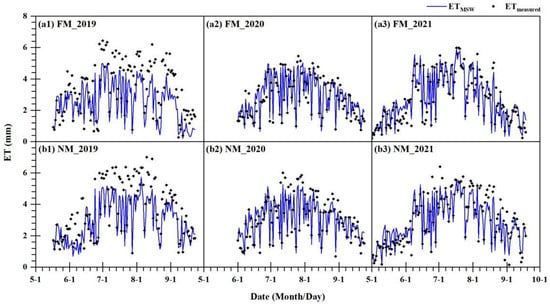
Figure 3.
Daily variations of evapotranspiration simulated by MSW model (ETMSW) and evapotranspiration measured by Bowen ratio–energy balance system (ETmeasured) under film-mulched drip irrigation (FM) and non-mulched drip irrigation (NM) during 2019–2021 (Subfigures (a1–a3) and (b1–b3) show the simulation effect of ET under FM and NM conditions from 2019 to 2021, respectively).
Table 5.
Evaluation of fitting effect of MSW model on field evapotranspiration (ET) under film-mulched drip irrigation (FM) and non-mulched drip irrigation (NM) from 2019 to 2021.
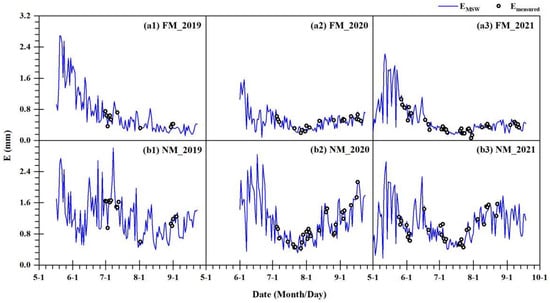
Figure 4.
Daily variations of soil evaporation simulated by the MSW model (EMSW) and evaporation measured by the micro-lysimeter (Emeasured) under film-mulched drip irrigation (FM) and non-mulched drip irrigation (NM) during 2019–2021 (Subfigures (a1–a3) and (b1–b3) show the simulation effect of E under FM and NM conditions from 2019 to 2021, respectively).
Table 6.
Evaluation of fitting effect of the MSW model on soil evaporation (E) under film-mulched drip irrigation (FM) and non-mulched drip irrigation (NM) from 2019 to 2021.
In summary, the MSW model has a better fitting effect on field ET and E of the soybean field, so that it will be feasible to partition ET with the MSW model. This result will promote the application of the MSW model in the study of field evapotranspiration under the condition of film-mulched drip irrigation and provide data support and reference for the popularization of water-saving irrigation technology in arid and semi-arid areas.
3.2. Comparison of ET, E, and T Under Different Irrigation Conditions
The comparison of field evapotranspiration under FM and NM conditions obtained with the BREB system was conducted, with results shown in Figure 5. ET under both treatments first increased and then decreased along with soybean growth during the growth seasons of 2019–2021. As shown in Table 7, during the observation period of 2019–2021, ET of FM was 26.3 mm, 30.4 mm, and 41.2 mm lower than that under NM during 2019–2021, respectively, with a 3-year average of 32.6 mm lower.
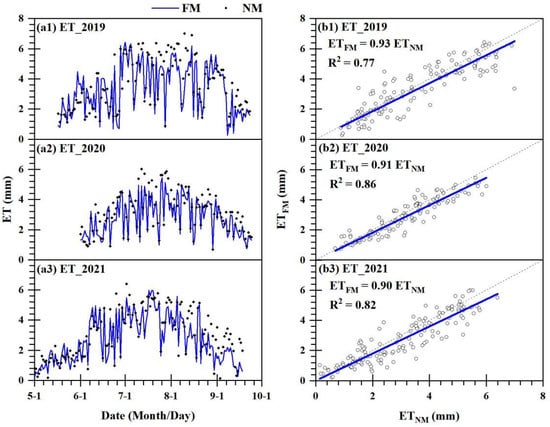
Figure 5.
Comparison of field evapotranspiration under film-mulched drip irrigation (ETFM) and non-mulched drip irrigation (ETNM) during 2019–2021 (Subfigures (a1–a3) successively represent daily variations of ETFM and ETNM from 2019 to 2021, and subfigures (b1–b3) successively represent the comparison of ETFM and ETNM from 2019 to 2021 in scatter form).
Table 7.
Field evapotranspiration (ET), soil evaporation (E), and plant transpiration (T) under film-mulched drip irrigation (FM) and non-mulched drip irrigation (NM) during 2019–2021.
E and T obtained under FM and NM conditions were compared after partitioning the observed ET with the MSW model. Figure 6 illustrates the comparison results of E under FM and NM conditions. From Figure 6(a1–a3), E peaked before June under both treatments during the soybean growth seasons of 2019–2021, then gradually decreased and started to slightly rebound in late August. Figure 6(b1–b3) shows that E was consistently lower under FM than under NM. As shown in Table 7, during the observation period of 2019–2021, E under FM was 76.9 mm, 72.3 mm, and 79.3 mm lower than that under NM, with a 3-year average of 76.1 mm lower.
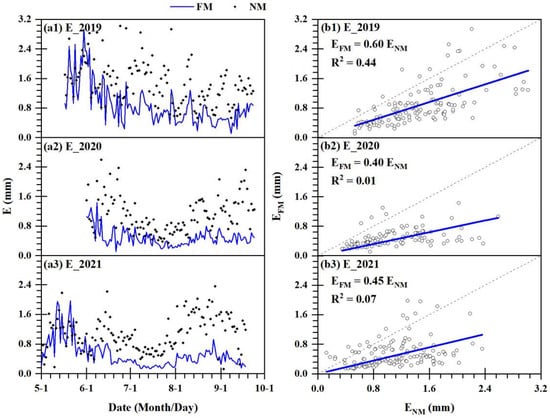
Figure 6.
Comparison of soil evaporation under film-mulched drip irrigation (EFM) and non-mulched drip irrigation (ENM) during 2019–2021 (Subfigures (a1–a3) successively represent daily variations of EFM and ENM from 2019 to 2021, and subfigures (b1–b3) successively represent the comparison of EFM and ENM from 2019 to 2021 in scatter form).
The comparison of T between FM and NM is shown in Figure 7. During soybean growth seasons of 2019–2021, T first increased and then decreased under different irrigation conditions, and on the whole, T of FM was higher than that of NM. As shown in Table 7, during 2019–2021, T under FM was 50.6 mm, 41.9 mm, and 38.1 mm higher than that under NM, with the 3-year average of 43.5 mm higher.
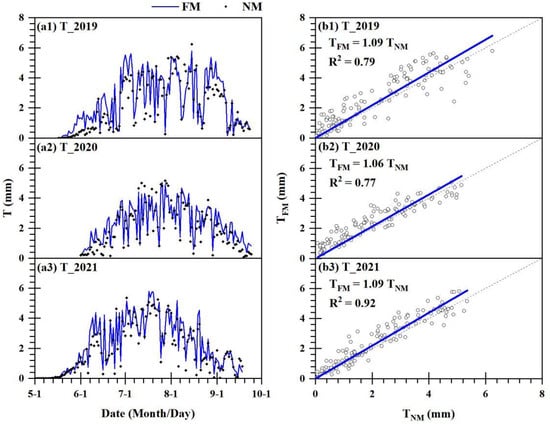
Figure 7.
Comparison of plant transpiration under film-mulched drip irrigation (TFM) and non-mulched drip irrigation (TNM) during 2019–2021 (Subfigures (a1–a3) successively represent daily variations of TFM and TNM from 2019 to 2021, and subfigures (b1–b3) successively represent the comparison of TFM and TNM from 2019 to 2021 in scatter form).
To sum up, during 2019–2020, ET, E, and T under FM were 7.9% lower, 49.6% lower and 16.8% higher than those under NM on average.
3.3. Comparison of Yield and WUE Under Different Irrigation Conditions
From 2019 to 2020, the yields of soybean under FM were 3341.4 kg ha−3, 3393.2 kg ha−3, and 3016.8 kg ha−3, respectively, with a three-year average of 3250.5 kg ha−3. For NM, the yields were 2781.1 kg ha−3, 2844.8 kg ha−3, and 2555.1 kg ha−3, with an average of 2727.0 kg ha−3 over the same period. Correspondingly, the WUE values for these three years under FM were 0.76 kg m−3, 0.93 kg m−3, and 0.80 kg m−3, respectively, with an average of 0.83 kg m−3. Under NM, the WUE values were 0.59 kg m−3, 0.74 kg m−3, and 0.61 kg m−3, respectively, with an average of 0.64 kg m−3.
Soybean yield and WUE under FM were 19.2% and 28.3% higher than those under NM during 2019–2020.
3.4. Effect from Soil Temperature/Humidity and Crop Growth on Field Evapotranspiration
Mulching directly affects soil temperature and humidity, which in turn change crop growth and ultimately soil evaporation and plant transpiration. Considering the shallow activity depth of the soybean root [28], we selected the soil layer at a depth of 60 cm for analysis and performed correlation analysis on soil temperature and humidity, LAI and ET under different irrigation conditions, with the results shown in Figure 8. Significant positive correlations were found between Ts and T, Ts and ET, LAI and T, LAI and ET, and T and ET under both irrigation conditions, while significant negative correlations were found between SWC and LAI, LAI and E, and E and T. Yet, the mean SWC at 60 cm depth and Ts presented significant positive correlations under FM, but not under NM. By contrast, SWC and T, Ts and LAI, and E and ET showed significant positive correlations under NM, but not under FM.
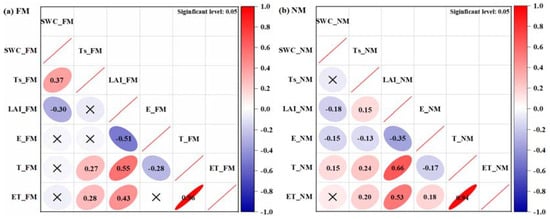
Figure 8.
Correlation analysis of soil environment, canopy development, and field evapotranspiration under different irrigation conditions during 2019–2021 (“×” indicated that there was no significant correlation between the corresponding two indicators at the 0.05 level).
Structural equation modeling (SEM) is a statistical technique used to test hypotheses about the effects of specific variables and how those variables relate to each other. According to the fitting results of the SEM, the effect intensity and direction between variables can be understood. The observed indicators under different irrigation conditions were analyzed using the SEM, with results shown in Figure 9. For SWC, Ts, and LAI, SWC had a negative effect on LAI under both irrigation conditions. However, SWC caused a direct positive effect on Ts under FM, but not under NM, while Ts had a direct positive effect on LAI under NM, but not under FM.
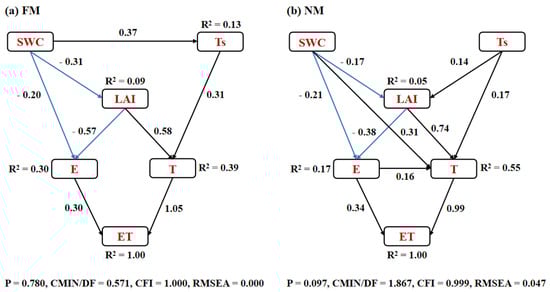
Figure 9.
Path analysis of soil environment and canopy development on field evapotranspiration under film-mulched drip irrigation (FM) and non-mulched drip irrigation (NM) from 2019 to 2021 (The fitting indexes of structural equation model under FM and NM conditions met the conditions that p > 0.05, CFI > 0.95, and RMSEA < 0.06, indicating a good fitting effect. all arrow connections were significant at the 0.05 level, with blue arrows representing negative effects and black arrows representing positive effects).
Regarding the direct effects of the above three indicators on E, only SWC and LAI had direct effects, both being negative, on E under the two irrigation conditions and were ordered by their degree of direct effect as follows: LAI (−0.57) > SWC (−0.20) under FM, and LAI (−0.38) > SWC (−0.21) under NM. The direct effect of LAI on E under FM was significantly higher than that under NM (FM (−0.57) > NM (−0.38)). Regarding the direct effects of the above three indicators on T, only LAI and Ts had direct effects, both being positive, on T under FM and were ordered by their degree of direct effect as follows: LAI (0.58) > Ts (0.31). While under NM, SWC, Ts, and LAI had direct effects, all being positive, on T, and were ordered by their degree of direct effect as follows: LAI (0.74) > SWC (0.31) > Ts (0.17). The direct effect of Ts on T under FM was significantly higher than that under NM (FM (0.31) > NM (0.17)), while the direct effect of LAI on T was evidently lower (FM (0.58) < NM (0.74)).
Regarding the respective direct effects of E and T on ET, the direct effect of T on ET was greater than that of E on ET for both irrigation conditions. However, the direct effect of E on ET was lower (FM (0.30) < NM (0.34)), while the direct effect of T on ET was higher (FM (1.05) > NM (0.99)) under FM than under NM.
In short, it was feasible to partition ET with the MSW model due to the good fitting effect of field-measured data and model simulation data. The results showed that ET, E, and T under FM were reduced by 32.6 mm, 76.1 mm, and −43.5 mm, respectively. It should be noted that SWC and Ts presented significant positive correlations under FM. Compared to NM, the direct effect from Ts on T under FM was significantly higher, while the direct effect of LAI on T was evidently lower.
4. Discussion
During the observation period of 2019–2021, ET under FM was 32.6 mm per year (7.8%) lower than that under NM on average. Specifically, E under FM was on average 76.1 mm per year (48.5%) lower than that under NM, while T was on average 43.5 mm per year (16.7%) higher, indicating that FM reduces water consumption mainly by decreasing evaporation from the field. This finding is consistent with that of Zhao et al., who found that film-mulching reduced E by 60.7%, increased T by 20.2%, and ultimately lowered ET by 10.1% [29]. The greater E, T, and ET changes reported by Zhao et al. [29] resulted from their higher irrigation frequency and higher single irrigation amount, which maximized film-mulching’s water conservation potential. Under FM, the SWCs during 2020–2021 were higher, mainly due to the film coverage rate of 82.35% in soybean fields, which avoided ineffective soil evaporation. Similarly, the study of Al-Othman et al. showed that compared with NM, the water retention capacity of soil was improved by film-mulching [17]. Few studies have conducted continuous in situ observations of field temperature in soybeans under both film-mulched and non-mulched conditions. Prior studies generally believed that the impact of plastic film on soil temperature diminished as the canopy developed [30], and mulching could increase soil temperature, which was partly different from our conclusion [31]. In the early soybean reproductive period (before July), values of Ts were always higher under FM due to the insulating effect of the mulch, and proper warming was beneficial to crop growth [32]. After July, with the rapid increase in LAI, soybean leaves gradually separated the field soil and upper air, weakening the warming effect of the mulch, so that the higher LAI and T under FM resulted in a gradually lower soil temperature than that under NM.
Film-mulching could promote root development, improve root water absorption and nitrogen uptake efficiency, increase leaf water potential [33,34], which led to denser canopy and higher plant transpiration. Besides, water stress reduced crop yields by limiting photosynthesis, and soil water stress increased stomatal limitation and might cause non-stomatal limitation [6]. Plant chlorophyll fluorescence parameters and stomatal regulation were significantly improved under film-mulching condition [6], causing an increase in net photosynthetic rate, which was conducive to the improvement of crop yield. Studies in the past 10 years showed that mulching had a positive effect on promoting crop growth and yield [31]. In our study, FM increased yield by an average of 19.2% and raised WUE by 28.3% on average in our study.
SWC had a negative effect on LAI under FM and NM conditions. An oversupply of soil water at specific growth stages might decrease water use efficiency. Similarly, Nendel et al. suggested that excessively wet conditions during the harvest season could negatively impact soybean production [35]. The soybean was more drought-tolerant under film-mulching condition. The research, conducted in arid regions, showed that plastic mulching increased catalase and superoxide dismutase activities while decreasing malondialdehyde content in plants [36]. In other words, film-mulching enhanced the crop’s stress resistance and antioxidant capacity, promoting crop growth and development. It should be noted that soybeans were highly sensitive to water at reproductive growth stage, especially during the flowering period. Ensuring water supply during this stage in agricultural production was crucial for yield formation [37].
The isolation and insulation effects of the mulch strengthened the direct effect of SWC on Ts but weakened the direct effect of SWC on T and Ts on LAI. Conventional plastic film was selected in our study, and the use of black plastic film may further strengthen the connection between SWC and T. As far as E is concerned, the denser leaves under FM largely reduced the external influence on soil and thus avoided more ineffective evaporation. As for T, the factors that directly affected plant transpiration under FM were Ts and LAI, while SWC and E also caused effects on T under NM. Knipper et al. used the associated flux disaggregation technique to segment ET data and found that 5 °C higher Ts and 5 °C lower canopy temperature would directly lead to a 2.6 mm/day lower E and a 2.6 mm/day higher T [22], which proved the direct influence of Ts on ET. The structural equation model could only explain some of the variations in T (FM: 0.39; NM: 0.55). To explain why LAI had more direct effects on T under NM, a more comprehensive analysis of relevant indicators was required to identify the underlying causes. Variations in E and T, both serving as components of ET, could explain changes in ET completely. During 2019–2021, E accounted for 20.6% and 37.5% of ET, and T accounted for 79.4% and 62.5% of ET under FM and NM, respectively. E/ET of FM was 16.9% lower than that of NM, signaling a lower direct effect of E on ET.
5. Conclusions
We conducted research on soybean fields in arid northwest China during 2019–2021, using the BREB system as the main observation method and the MSW model as the data partitioning tool. We compared E, T, and ET under FM and NM, respectively, concluding that mulching reduced E by 76.1 mm per year and increased T by 43.5 mm per year, ultimately reducing ET by 32.6 mm per year. Mulching could retain heat and moisture, but its effect gradually weakened with the rapid growth of soybeans. It effectively promoted crop growth and increased LAI by 20.7%, yield by 19.2%, and WUE by 28.3%, on average. It also strengthened the link between SWC and Ts and weakened the direct effect of soil temperature and moisture on soybean aboveground. In addition, the denser leaves under FM effectively isolated the external influence on the soil, thus reducing ineffective evaporation from the field. Compared with NM, FM reduced the direct effect of E on ET, while increasing the direct effect of T on ET.
In this study, we quantified the water-saving effect of mulching based on field experiments, with the aid of micro-meteorological observation tools and modeling tools, which provided a reference for the comprehensive planning and rational allocation of agricultural water resources in arid areas. The study expounded the main mechanism of mulching on ET by analyzing the relationship between soil temperature and humidity, crop growth and field evapotranspiration, providing a new perspective for further exploration of the water-saving and yield-increasing mechanisms of plastic film-mulching techniques in the future. Meanwhile, the study provided data support for planting and popularization of soybeans in arid northwest China. The soybean cultivation mode of “one film-mulching, two irrigation belts and three plant rows” could be considered in agricultural production. Particularly in the context of smart agriculture becoming a research hotspot, large-scale agricultural production can benefit from mechanized film-mulching, coupled with real-time monitoring of field hydrothermal dynamics through IoT technologies, enabling automated irrigation systems. Attention should be paid to field heat preservation in the early growth stage of soybean, and a small amount of high-frequency irrigation mode should be adopted to reduce the peak of soil water content and increase soil temperature.
The MSW model could be improved in further research to address the 10–11% underestimation of ET. Consider studying the performance of film-mulched crops under different scenarios (such as elevated CO2 or increased temperature), focusing on the interactions between soil, atmosphere, and plant. Furthermore, plastic film is resistant to degradation, causing residual pollution, which poses a significant challenge to sustainable agricultural development. Future research should focus more on environmentally friendly materials, such as biodegradable mulch films.
Author Contributions
Methodology, S.L.; data curation, D.Y., C.W. and Z.G.; writing—original draft, D.Y., C.W. and Z.G.; writing—review and editing, D.Y., C.W., Y.S., X.H. and Z.W.; funding acquisition, S.L., Y.S. and X.H. All authors have read and agreed to the published version of the manuscript.
Funding
This research was funded by National Key R&D Program of China (2022YFD1900801, 2022YFC3002802, and 2023YFD1900305), the National Natural Science Foundation of China (52379052), and the Shaanxi Province key research and development plan key industrial innovation chain project (2023-ZDLNY-48).
Data Availability Statement
The original contributions presented in the study are included in the article; further inquiries can be directed to the corresponding author.
Conflicts of Interest
Authors Danni Yang, Yingying Sun, Xiandong Hou were employed by Institute of Land Engineering and Technology, Shaanxi Provincial Land Engineering Construction Group Co., Ltd. and Shaanxi Agricultural Development Group Co., Ltd.; Author Zhenyu Guo was employed by the Power China Northwest Engineering Corporation Limited; The remaining authors declare that the research was conducted in the absence of any commercial or financial relationships that could be construed as a potential conflict of interest.
References
- Sun, Y.; Zhang, X.; Ding, Y.; Chen, D.; Qin, D.; Zhai, P. Understanding human influence on climate change in China. Natl. Sci. Rev. 2022, 9, 113. [Google Scholar] [CrossRef] [PubMed]
- Kang, S.Z.; Hao, X.M.; Du, T.S.; Tong, L.; Su, X.L.; Lu, H.N.; Li, X.L.; Huo, Z.L.; Li, S.E.; Ding, R.S. Improving agricultural water productivity to ensure food security in China under changing environment: From research to practice. Agric. Water Manag. 2017, 179, 5–17. [Google Scholar] [CrossRef]
- Sui, J.; Wang, J.D.; Gong, S.H.; Xu, D.; Zhang, Y.Q.; Qin, Q.M. Assessment of maize yield-increasing potential and optimum N level under mulched drip irrigation in the Northeast of China. Field Crops Res. 2018, 215, 132–139. [Google Scholar] [CrossRef]
- Zhang, C.Y.; Oki, T. Water pricing reform for sustainable water resources management in China's agricultural sector. Agric. Water Manag. 2023, 275, 108045. [Google Scholar] [CrossRef]
- Wang, J.T.; Du, G.F.; Tian, J.S.; Jiang, C.D.; Zhang, Y.L.; Zhang, W.F. Mulched drip ir-rigation increases cotton yield and water use efficiency via improving fine root plasticity. Agric. Water Manag. 2021, 255, 106992. [Google Scholar] [CrossRef]
- Li, C.; Wang, J.; Zhang, Y.; Feng, H.; Zhang, W.; Siddique, K.H.M. Response of plastic film mulched maize to soil and atmospheric water stresses in an arid irrigation area. Eur. J. Agron. 2024, 154, 127080. [Google Scholar] [CrossRef]
- Jia, Q.; Shi, H.B.; Li, R.P.; Miao, Q.F.; Feng, Y.Y.; Wang, N.; Li, J.W. Evaporation of maize crop under mulch film and soil covered drip irrigation: Field assessment and modelling on West Liaohe Plain, China. Agric. Water Manag. 2021, 253, 106894. [Google Scholar] [CrossRef]
- Xiao, C.; Ji, Q.Y.; Zhang, F.C.; Li, Y.; Fan, J.L.; Hou, X.H.; Yan, F.L.; Liu, X.Q.; Gong, K.Y. Effects of various soil water potential thresholds for drip irrigation on soil salinity, seed cotton yield and water productivity of cotton in northwest China. Agric. Water Manag. 2023, 279, 108172. [Google Scholar] [CrossRef]
- Zhang, Y.Q.; Wang, J.D.; Gong, S.H.; Xe, D.; Sui, J.; Wu, Z.D.; Mo, Y. Effects of film mulching on evapotranspiration, yield and water use efficiency of a maize field with drip irrigation in Northeastern China. Agric. Water Manag. 2018, 205, 90–99. [Google Scholar] [CrossRef]
- Lin, W.; Liu, W.; Zhou, S.; Liu, C. Influence of plastic film mulch on maize water use efficiency in the Loess Plateau of China. Agric. Water Manag. 2019, 224, 105710. [Google Scholar] [CrossRef]
- Lu, H.D.; Xia, Z.Q.; Fu, Y.F.; Wang, Q.; Xue, J.Q.; Chu, J. Response of soil temperature, moisture, and spring maize (Zea mays L.) root/shoot growth to different mulching materials in semi-arid areas of northwest China. Agronomy 2020, 10, 453. [Google Scholar] [CrossRef]
- Zong, R.; Wang, Z.H.; Zhang, J.Z.; Li, W.H. The response of photosynthetic capacity and yield of cotton to various mulching practices under drip irrigation in Northwest China. Agric. Water Manag. 2021, 249, 106814. [Google Scholar] [CrossRef]
- Farah, A.H.; Al-Ghobari, H.M.; Zin El-Abedin, T.K.; Alrasasimah, M.S.; El-Shafei, A.A. Impact of partial root drying and soil mulching on squash yield and water use efficiency in arid. Agronomy 2021, 11, 706. [Google Scholar] [CrossRef]
- Wei, H.H.; Zhang, F.; Zhang, K.P.; Qin, R.Z.; Zhang, W.J.; Sun, G.J.; Huang, J. Effects of soil mulching on staple crop yield and greenhouse gas emissions in China: A meta-analysis. Field Crops Res. 2022, 284, 108566. [Google Scholar] [CrossRef]
- Durgam, M.; Mailapalli, D.R.; Singh, R. Prediction of soil temperature in wheat field using machine learning models. Commun. Soil Sci. Plant Anal. 2024, 22, 3510–3534. [Google Scholar] [CrossRef]
- Liu, G.; Wang, W. Irrigation-induced crop growth enhances irrigation cooling effect over the North China Plain by increasing transpiration. Water Resour. Res. 2023, 59, e2022WR034142. [Google Scholar] [CrossRef]
- Al-Othman, A.A.; Mattar, M.A.; Alsamhan, M.A. Effect of mulching and subsurface drip irrigation on soil water status under arid environment. Span. J. Agric. Res. 2020, 18, e1201. [Google Scholar] [CrossRef]
- Wang, D.; Li, G.Y.; Mo, Y.; Zhang, D.; Xu, X.H.; Wilkerson, C.J.; Hoogenboom, G. Evaluation of subsurface, mulched and non-mulched surface drip irrigation for maize production and economic benefits in northeast China. Irrig. Sci. 2020, 39, 159–171. [Google Scholar] [CrossRef]
- Zhang, X.D.; Yang, L.C.; Xue, X.K.; Kamran, M.; Ahmad, I.; Dong, Z.Y.; Liu, T.N.; Jia, Z.K.; Zhang, P.; Han, Q.F. Plastic film mulching stimulates soil wet-dry alternation and stomatal behavior to improve maize yield and resource use efficiency in a semi-arid region. Field Crops Res. 2019, 233, 101–113. [Google Scholar] [CrossRef]
- Gao, L.; Zhao, P.; Kang, S.Z.; Li, S.; Tong, L.; Ding, R.S.; Lu, H.N. Surface soil water content dominates the difference between ecosystem and canopy water use efficiency in a sparse vineyard. Agric. Water Manag. 2019, 226, 105817. [Google Scholar] [CrossRef]
- Coelho, E.F.; Santos, D.L.; de Lima, L.W.F.; Castricini, A.; Barros, D.L.; Filgueiras, R.; Da Cunha, F.F. Water regimes on soil covered with plastic film mulch and relationships with soil water availability, yield, and water use efficiency of papaya trees. Agric. Water Manag. 2022, 269, 107709. [Google Scholar] [CrossRef]
- Knipper, K.; Anderson, M.; Bambach, N.; Kustas, W.; Gao, F.; Zahn, E.; Hain, C.; Mcelrone, A.; Belfiore, O.R.; Castro, S.; et al. Evaluation of partitioned evaporation and transpiration estimates within the DisALEXI modeling framework over irrigated crops in California. Remote Sens. 2023, 15, 68. [Google Scholar] [CrossRef]
- Li, S.E.; Kang, S.Z.; Zhang, L.; Ortega-Farias, S.; Li, F.S.; Du, T.S.; Tong, L.; Wang, S.F.; Ingman, M.; Guo, W.H. Measuring and modeling maize evapotranspiration under plastic film-mulching condition. J. Hydrol. 2013, 503, 153–168. [Google Scholar] [CrossRef]
- Bowen, I.S. The ratio of heat losses by conduction and by evaporation from any water surface. Phys. Rev. 1926, 27, 779–787. [Google Scholar] [CrossRef]
- Perez, P.J.; Castellvi, F.; Ibañez, M.; Rosell, J.I. Assessment of reliability of Bowen ratio method for partitioning fluxes. Agric. For. Meteorol. 1999, 97, 141–150. [Google Scholar] [CrossRef]
- Zhang, B.; Kang, S.; Li, F.; Zhang, L. Comparison of three evapotranspiration models to Bowen ratio-energy balance method for a vineyard in an arid desert region of northwest China. Agric. For. Meteorol. 2008, 10, 1629–1640. [Google Scholar] [CrossRef]
- Shuttleworth, W.J.; Wallace, J.S. Evaporation from sparse crops: An energy combination theory. Q. J. R. Meteorol. Soc. 1985, 111, 839–855. [Google Scholar] [CrossRef]
- Buakum, B.; Limpinuntana, V.; Vorasoot, N.; Pannangpetch, K.; Bell, R.W. Rooting patterns of four crop legumes in response to seed-placement depths in the dry season. Acta Agric. Scand. Sect. B-Soil Plant Sci. 2012, 62, 35–48. [Google Scholar] [CrossRef]
- Zhao, Y.; Mao, X.M.; Shukla, M.K. A modified SWAP model for soil water and heat dynamics and seed-maize growth under film mulching. Agric. For. Meteorol. 2020, 292, 108127. [Google Scholar] [CrossRef]
- Hou, X.; Wang, F.; Han, J.; Kang, S.; Feng, S. Duration of plastic mulch for potato growth under drip irrigation in an arid region of Northwest China. Agric. For. Meteorol. 2010, 150, 115–121. [Google Scholar] [CrossRef]
- Zhao, Y.; Mao, X.; Li, S.; Huang, X.; Che, J.; Ma, C. A review of plastic film mulching on water, heat, nitrogen balance, and crop growth in farmland in china. Agronomy 2023, 13, 2515. [Google Scholar] [CrossRef]
- Arredondo, T.; Delgado-Balbuena, J.; Kimball, B.; Luna-Luna, M.; Yepez-Gonzalez, E.; Hu-ber-Sannwald, E.; Garcia-Moya, E.; Garatuza-Payan, J. Late sowing date as an adaptive strategy for rainfed bean production under warming and reduced precipitation in the Mexican Altiplano? Field Crops Res. 2020, 255, 107903. [Google Scholar] [CrossRef]
- Mondal, M.; Skalicky, M.; Garai, S.; Hossain, A.; Sarkar, S.; Banerjee, H.; Kundu, R.; Brestic, M.; Barutcular, C.; Erman, M.; et al. Supplementing nitrogen in combina-tion with rhizobium inoculation and soil mulch in peanut (Arachis hypogaea L.) production system: Part II. Effect on phenology, growth, yield attributes, pod quality, profitability and nitrogen use efficiency. Agronomy 2020, 10, 1513. [Google Scholar] [CrossRef]
- de Souza, A.J.B.; Cristofani-Yaly, M.; Da Conceicao, P.M.; Devite, F.T.; Bastianel, M.; Romero, P.V.S.; Padilha, P.H.B.; de Azevedo, F.A. Physiological and productivity responses of Tahiti acid lime grafted onto dwarfing rootstocks under different planting and mulching practices. Front. Sustain. Food Syst. 2025, 9, 1489291. [Google Scholar] [CrossRef]
- Nendel, C.; Reckling, M.; Debaeke, P.; Schulz, S.; Berg-Mohnicke, M.; Constantin, J.; Fronzek, S.; Hoffmann, M.; Jaksic, S.; Kersebaum, K.; et al. Future area expansion outweighs increasing drought risk for soybean in Europe. Glob. Chang. Biol. 2023, 29, 1340–1358. [Google Scholar] [CrossRef]
- Zhao, L.; Zhang, C.; Liang, M.; Chen, P.; Anwar, S.; Fan, M.Y.; Xie, G.M.; Wang, C.Y. Exploring the influence of planting densities and mulching types on photosynthetic activity, antioxidant enzymes, and chlorophyll content and their relationship to yield of maize. Plants 2024, 13, 3423. [Google Scholar] [CrossRef]
- Kim, J.; Lee, C.; Park, J.; Mansoor, S.; Chung, Y.S.; Kim, K. Drought Stress Restoration Frequencies of Phenotypic Indicators in Early Vegetative Stages of Soybean (Glycine max L.). Sustainability 2023, 15, 4852. [Google Scholar] [CrossRef]
Disclaimer/Publisher’s Note: The statements, opinions and data contained in all publications are solely those of the individual author(s) and contributor(s) and not of MDPI and/or the editor(s). MDPI and/or the editor(s) disclaim responsibility for any injury to people or property resulting from any ideas, methods, instructions or products referred to in the content. |
© 2025 by the authors. Licensee MDPI, Basel, Switzerland. This article is an open access article distributed under the terms and conditions of the Creative Commons Attribution (CC BY) license (https://creativecommons.org/licenses/by/4.0/).