Article

ASE-YOLOv8n: A Method for Cherry Tomato Ripening Detection

by
Xuemei Liang
1,
Haojie Jia
1,
Hao Wang
2,
Lijuan Zhang
1,3,
Dongming Li
1,3,
Zhanchen Wei
1,
Haohai You
1,
Xiaoru Wan
1,
Ruixin Li
1,
Wei Li
1 and
Minglai Yang
1,*
1
College of Information Technology, Jilin Agricultural University, Changchun 130118, China
2
Faculty of Electronic and Information Engineering, Xi’an Jiaotong University, Xi’an 710049, China
3
College of Internet of Things Engineering, Wuxi University, Wuxi 214105, China
*
Author to whom correspondence should be addressed.
Agronomy 2025, 15(5), 1088; https://doi.org/10.3390/agronomy15051088
Submission received: 29 March 2025 / Revised: 25 April 2025 / Accepted: 28 April 2025 / Published: 29 April 2025

Abstract

:
To enhance the efficiency of automatic cherry tomato harvesting in precision agriculture, an improved YOLOv8n algorithm was proposed for fast and accurate recognition in natural environments. The improvements are as follows: first, the ADown down-sampling module replaces part of the original network backbone’s standard convolution, enabling the model to capture higher-level image features for more accurate target detection, while also reducing model complexity by cutting the number of parameters. Secondly, the model’s neck adopts a Slim-Neck (GSConv+VoV-GSCSP) instead of traditional convolution with C2f. It replaces this combination with the more efficient CSConv and swaps the C2f module for VoV-GSCSP. Finally, the model also introduces the EMA attention mechanism, implemented at the P5 layer, which enhances the feature representation capability, enabling the network to extract detailed target features more accurately. This study trained the object-detection algorithm on a self-built cherry tomato dataset before and after improvement and compared it with early deep learning models and YOLO series algorithms. The experimental results show that the improved model increases accuracy by 3.18%, recall by 1.43%, the F1 score by 2.30%, mAP50 by 1.57%, and mAP50-95 by 1.37%. Additionally, the number of parameters is reduced to 2.52 M, and the model size is reduced to 5.08 MB, which outperforms other related models compared to the previous version. The experiment demonstrates the technology’s broad potential for embedded systems and mobile devices. The improved model offers efficient, accurate support for automated cherry tomato harvesting.

1. Introduction

Cherry tomatoes (Solanum lycopersicum var. cerasiforme) are rich in lycopene, organic acids, and various vitamins, which are favored by consumers and play an important role in the daily diet [1]. However, in the key link of fruit production, the picking stage is still dominated by manual operation. Although manual picking can ensure a certain degree of fineness, it is labor-intensive and costly. Orchards, through the introduction of mechanized picking, not only can significantly reduce labor costs and improve the efficiency of picking but also improve the income of fruit farmers and market competitiveness [2]. With the continuous development of agricultural science and technology, the performance of mechanical picking equipment has been gradually optimized to adapt to the needs of different varieties and growing conditions. This provides more possibilities for large-scale planting and at the same time reduces the damage to the fruit in the picking process and improves the quality of the product. In the future, the popularization and promotion of mechanical picking is expected to further promote the development of modern agriculture in the direction of intelligence and intensification, for fruit farmers and consumers to bring considerable profit growth [3,4]. However, cherry tomatoes have intricate growth characteristics. Fruits vary in size, ripeness, and location, often overlapping. Dense foliage and complex lighting make rapid planting and accurate cherry tomato identification challenging during harvest [5]. Additionally, cherry tomatoes spoil easily, facing storage and transport difficulties. Selecting cherry tomatoes based on ripeness is essential for specific transportation and storage needs [6]. Efficient labor organization, timely harvesting, and the precise positioning of tomatoes at different maturity levels are key to mechanized harvesting and advancing precision agriculture [7,8].
In recent years, computer vision technology in agriculture has gained widespread global attention. Research on fruit recognition and maturity classification has made continuous breakthroughs, covering traditional recognition methods based on feature extraction and advanced technologies, such as convolutional neural networks in deep learning. The progress of these studies has provided strong technical support for the development of smart agriculture and promoted the optimization of automated fruit detection and classification systems [9].
The traditional recognition method based on digital image processing is to match the target fruit by extracting the color, view, geometry, texture, and other features of the image. For example, Guzmán et al. [10] used a color-based segmentation algorithm and operators to detect edges, and the maturity index of different olive samples was objectively assessed through an analysis of images obtained via machine vision. Li et al. [11] developed and validated a step-by-step algorithm called the Color Component Analysis-based Detection Method to identify blueberry fruits using outdoor color images. Zhou et al. [12] developed an apple-recognition algorithm using color features to estimate fruit counts and predict yields early. Song et al. [13] used multiple views of the same fruit to demonstrate a new statistical method that combines information from multiple views to automatically identify and count fruits from multiple images. Bulanon et al. [14] developed an image fusion method combining thermal and visible light images to detect oranges in tree crowns. Maldonado Jr et al. [15] constructed and tested an algorithm based on a texture analysis and support vector machine (SVM) for the automatic calculation of green fruits in digital images of orange trees. Lin et al. [16] proposed a novel detection algorithm based on color, depth, and shape information for detecting spherical or cylindrical fruits on plants in natural environments, successfully identifying chili peppers, eggplants, and guavas. Lin et al. [17] developed a new probabilistic Hough transform based on contour information, which trains the recognition of fruits, such as citrus and tomato, based on color and texture features. The proposed method effectively detects various fruits (green, orange, circular, and non-circular) in natural environments. While traditional digital image processing has advanced in feature design, it still has many limitations in fruit recognition. For example, during color grading, these methods usually rely on a predetermined reference color for matching. However, since the quality of produce is highly correlated with the color, this approach shows insufficient adaptability in the face of changing lighting conditions or color shifts, leading to a decrease in the recognition accuracy. Meanwhile, under complex background conditions, the dependence of traditional methods on geometric features, such as edge detection and contour extraction, makes them less robust and difficult to accurately separate target fruits. In addition, texture feature extraction often relies on manually designed filters and feature descriptors, which not only leads to low computational efficiency, but also makes it inadequate when processing large-scale texture samples.
Advances in machine learning have greatly improved agricultural tasks [18]. Deep learning, especially CNN, excels in fruit detection and automated harvesting by extracting high-dimensional features, achieving human-level accuracy and speed in some areas. More importantly, these traditional methods require much manual intervention for feature design and debugging and are vulnerable to subjective factors, which not only have low detection efficiency and long processing times but also limit their accuracy and practicability in complex scenes. To address these issues, deep-learning-based CNN technology has become a research focus in fruit recognition in recent years [19]. Unlike traditional methods, deep learning can organically combine feature extraction, feature selection, and classification tasks through an end-to-end training process. Owing to its deeper network structure and stronger learning ability, CNN has shown significant advantages, not only improving the recognition efficiency and accuracy, but also speeding up the processing speed, making the fruit recognition system more intelligent and automated [20]. In addition, the deep learning method can also train the model through large-scale data and has strong generalization ability. In the face of light changes, complex backgrounds, and diverse fruit samples, it shows higher robustness and adaptability. For example, by introducing data-enhancement technology and transfer learning strategies, the deep learning model can further improve the recognition ability of rare samples and new samples and significantly expand its application scenarios. These technological breakthroughs not only solve the many bottleneck problems of traditional methods but also inject new impetus into the development of agricultural automation and intelligent agriculture [21]. In a related study, Kuznetsova et al. [22] developed a machine vision system for detecting apples in orchards. It is based on the YOLOv3 algorithm with special pre-processing and post-processing. The proposed pre- and post-processing techniques enable YOLOv3 for machine vision in apple and orange harvesting robots. Gai et al. [23] introduced an improved YOLOv4 with DenseNet to detect three cherry ripening stages, excelling in handling overlapping and occluded fruits. Zhang et al. [24] used the improved YOLOv4-tiny model for the multi-class detection of cherry tomatoes. This method can detect fruits as picking objects in the complex environment of no occlusion, branch occlusion, fruit occlusion, and leaf occlusion in the daytime. Wang et al. [25] proposed an improved target detection algorithm based on YOLOv5n. The improved model achieved an improvement of 1.4% in accuracy and recall. Its average accuracy reached 95.2%, with a detection time of 5.3 ms and a weight file size of just 4.4 MB, meeting real-time detection and lightweight application requirements. The improved model enabled real-time recognition and maturity detection of cherry tomatoes. Zhang et al. [26] developed a YOLOv5s-based deep learning algorithm for fast, accurate grape bunch detection. Tests showed 99.40% precision, recall, mAP, and F1 scores. Liu et al. [27] proposed an improved YOLOv7-based method for oil tea trunk detection, integrating the CBAM attention mechanism into the backbone and head layers. This enhanced the trunk feature extraction and target focus. Experimental results showed 89.2% mAP, 94% recall, 87% F1 score, and an average detection speed of 0.018 s per image, demonstrating high accuracy. Gu et al. [28] introduced a citrus-detection model for complex environments using YOLOv7-tiny. The model, 4.5 MB in size with 2.1 M parameters, achieved a 96.98% mAP and a detection time of 5.9 ms per image, performing well under occlusion, lighting changes, and motion variations. These studies highlight the strong potential of deep-learning-based detection algorithms in fruit recognition, significantly enhancing the accuracy, stability, and intelligence of ripeness detection.
At present, domestic and international research on tomato ripening detection mainly focuses on the fields of color characteristics, odor characteristics, spectral characteristics, and machine vision. For example, Zhao et al. [29] used the AdaBoost classifier and color analysis to detect tomatoes in a greenhouse, achieving over 96% accuracy in identifying ripe tomatoes in real conditions. However, the false-negative rate was about 10%, 3.5% of tomatoes were not detected, and the color features were susceptible to interference from environmental factors, thus limiting the accuracy of ripeness detection. Jun Wang et al. [30] used the information about aroma behavior to evaluate the maturity and shelf life of fruits and used e-nose to evaluate the maturity and monitor the shelf life of tomatoes. Research showed that the e-nose had sufficient sensitivity to assess the tomato maturity and predict hardness, effectively evaluating the shelf life of light red and red-stage fruits. However, tomato odors vary with environmental conditions and storage methods, affecting the detection accuracy. Dai et al. [31] used hyperspectral imaging to monitor tomato ripeness and predict the lycopene content. A support vector classifier (SVC) based on full and eigen wavelengths achieved 95.83% accuracy using eigen wavelengths. However, spectral feature recognition relies on complex algorithms and costly equipment, limiting large-scale applications. Mubashiru Olarewaju Lawal et al. [32] developed the YOLO-Tomato model, an improved YOLOv3 framework for detecting tomatoes under complex conditions, like shading, lighting variations, and clustering. Using techniques like tag-what-you-see, dense architecture integration, spatial pyramid pooling, and Mish activation, YOLO-Tomato-A, B, and C achieved AP scores of 98.3%, 99.3%, and 99.5%, with detection times of 48 ms, 44 ms, and 52 ms, respectively, outperforming many advanced methods. Li et al. [33] introduced YOLOv5s-Tomato, an improved YOLOv5 model for recognizing four ripening stages—mature green, breaker, pink, and red. It achieved 95.58% accuracy, a 97.42% mAP, and a 9.2 ms detection speed per image with a 23.9 MB model size. YOLOv5s-Tomato effectively improves the recognition accuracy for occluded and small tomatoes while meeting greenhouse detection requirements.
In summary, CNN-based deep learning methods excel in fruit-ripeness recognition. Image processing and deep learning help to identify factors limiting accuracy and enhance crop detection in complex environments [34]. Integrating trained models into cherry tomato harvesters enables precise, real-time, and automated ripeness detection, optimizing the picking process [35].
This study focuses on the identification and ripeness detection needs and challenges of cherry tomatoes in natural environments and makes a series of improvements to the YOLOv8n model. Our goal is to minimize the number of parameters and computational resources of the model to meet the requirements of the detection task while maintaining the accuracy of the model detection. Through experiments and tests, the recognition effectiveness of cherry tomatoes and the detection performance of mature cherry tomatoes in the natural environment were evaluated, which provided a valuable reference for the rational allocation of labor and accurate targeting in the process of mechanized fruit harvesting.

2. Materials and Methods

2.1. Materials

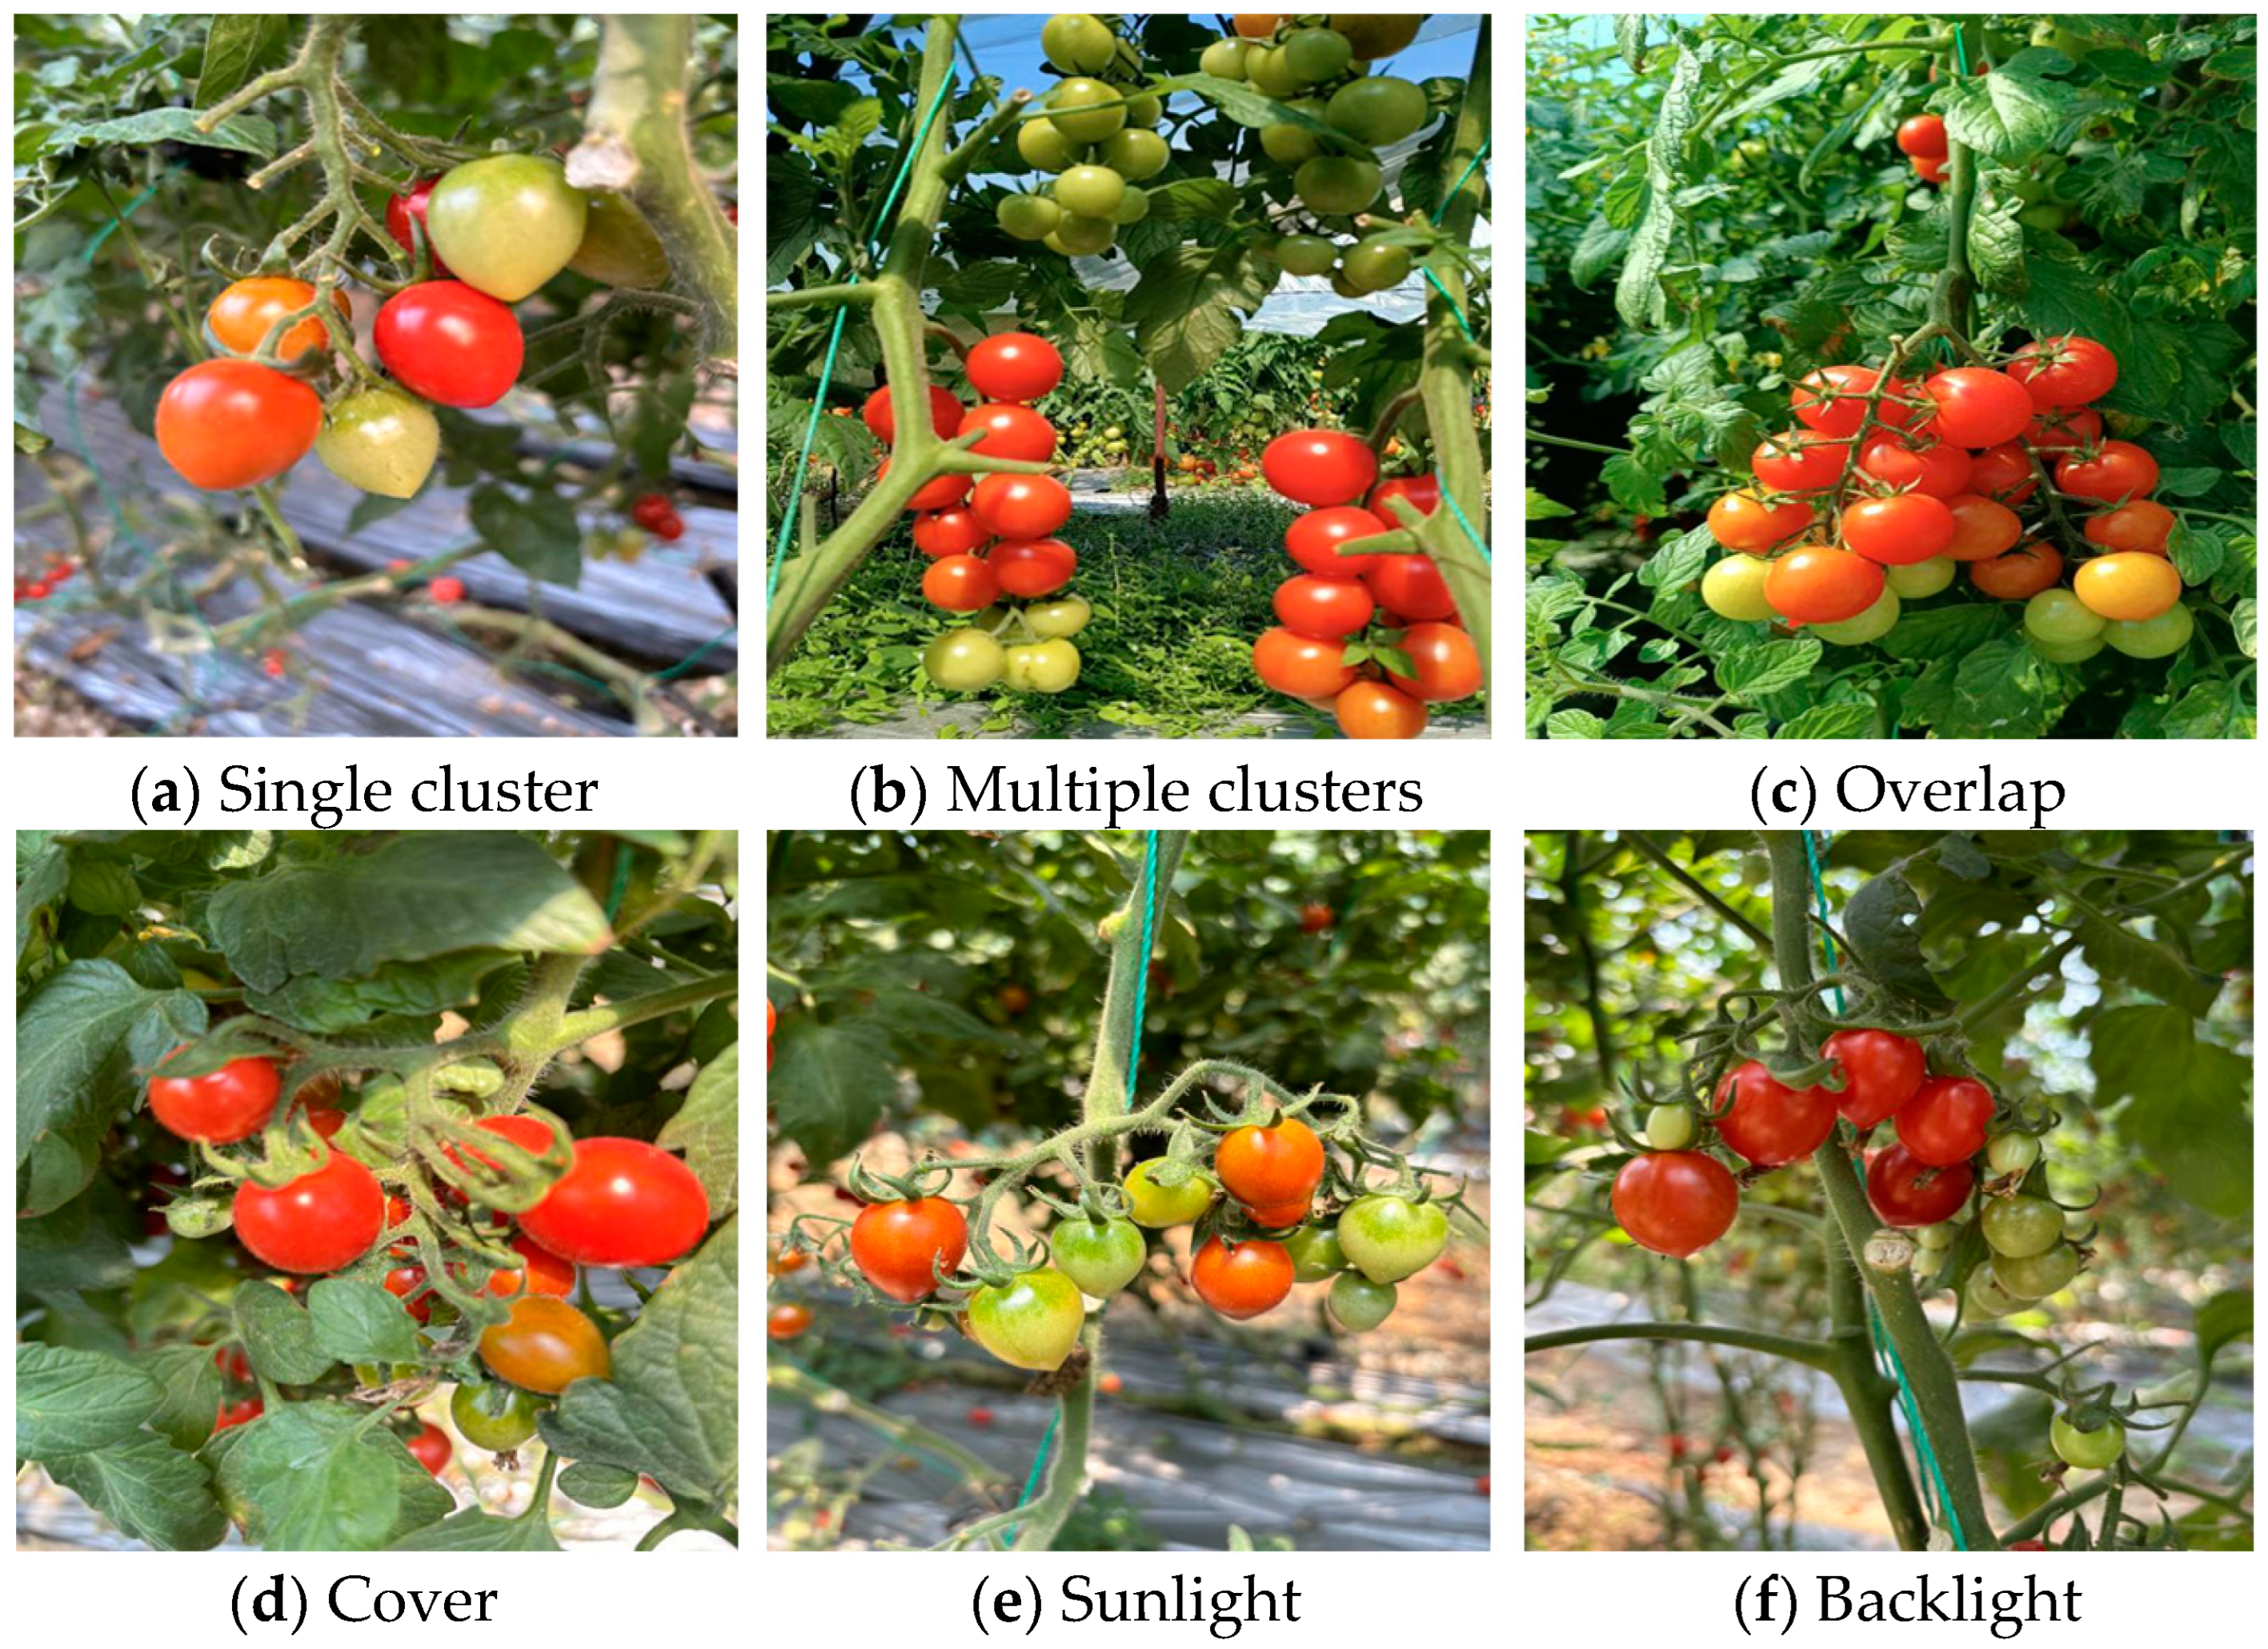
2.1.1. Image Collection

A self-constructed cherry tomato dataset was used within this research, and the image data were collected from cherry tomato plantations in Mingcun Town, Pingdu City, Shandong Province. The cherry tomato variety is Busan 88. The image was taken on 23 May 2024 in natural sunlight using a mobile camera. The image acquisition device is an iPhone 15 (PEGATRON Electronics Corporation, Shanghai, China), and the shooting distance is about 10 to 60 cm. In order to mitigate the risk of overfitting the network model due to the limited diversity of training samples, the photographs contained cherry tomato fruits of different ripeness levels, shooting in 5 directions: left, right, top, back, and front. Two lighting conditions were considered, representing different lighting conditions. A number of datasets of cherry tomatoes in light and backlight were collected in the presence of light throughout the day, depending on the angle of sunlight. These images also include various growth forms of cherry tomatoes in real life, such as overlapping, shading, and clinging fruit images. A total of 870 valid pictures of the original cherry tomatoes were obtained and saved in JPEG format. Figure 1 shows samples of the cherry tomato dataset captured in different scenarios.

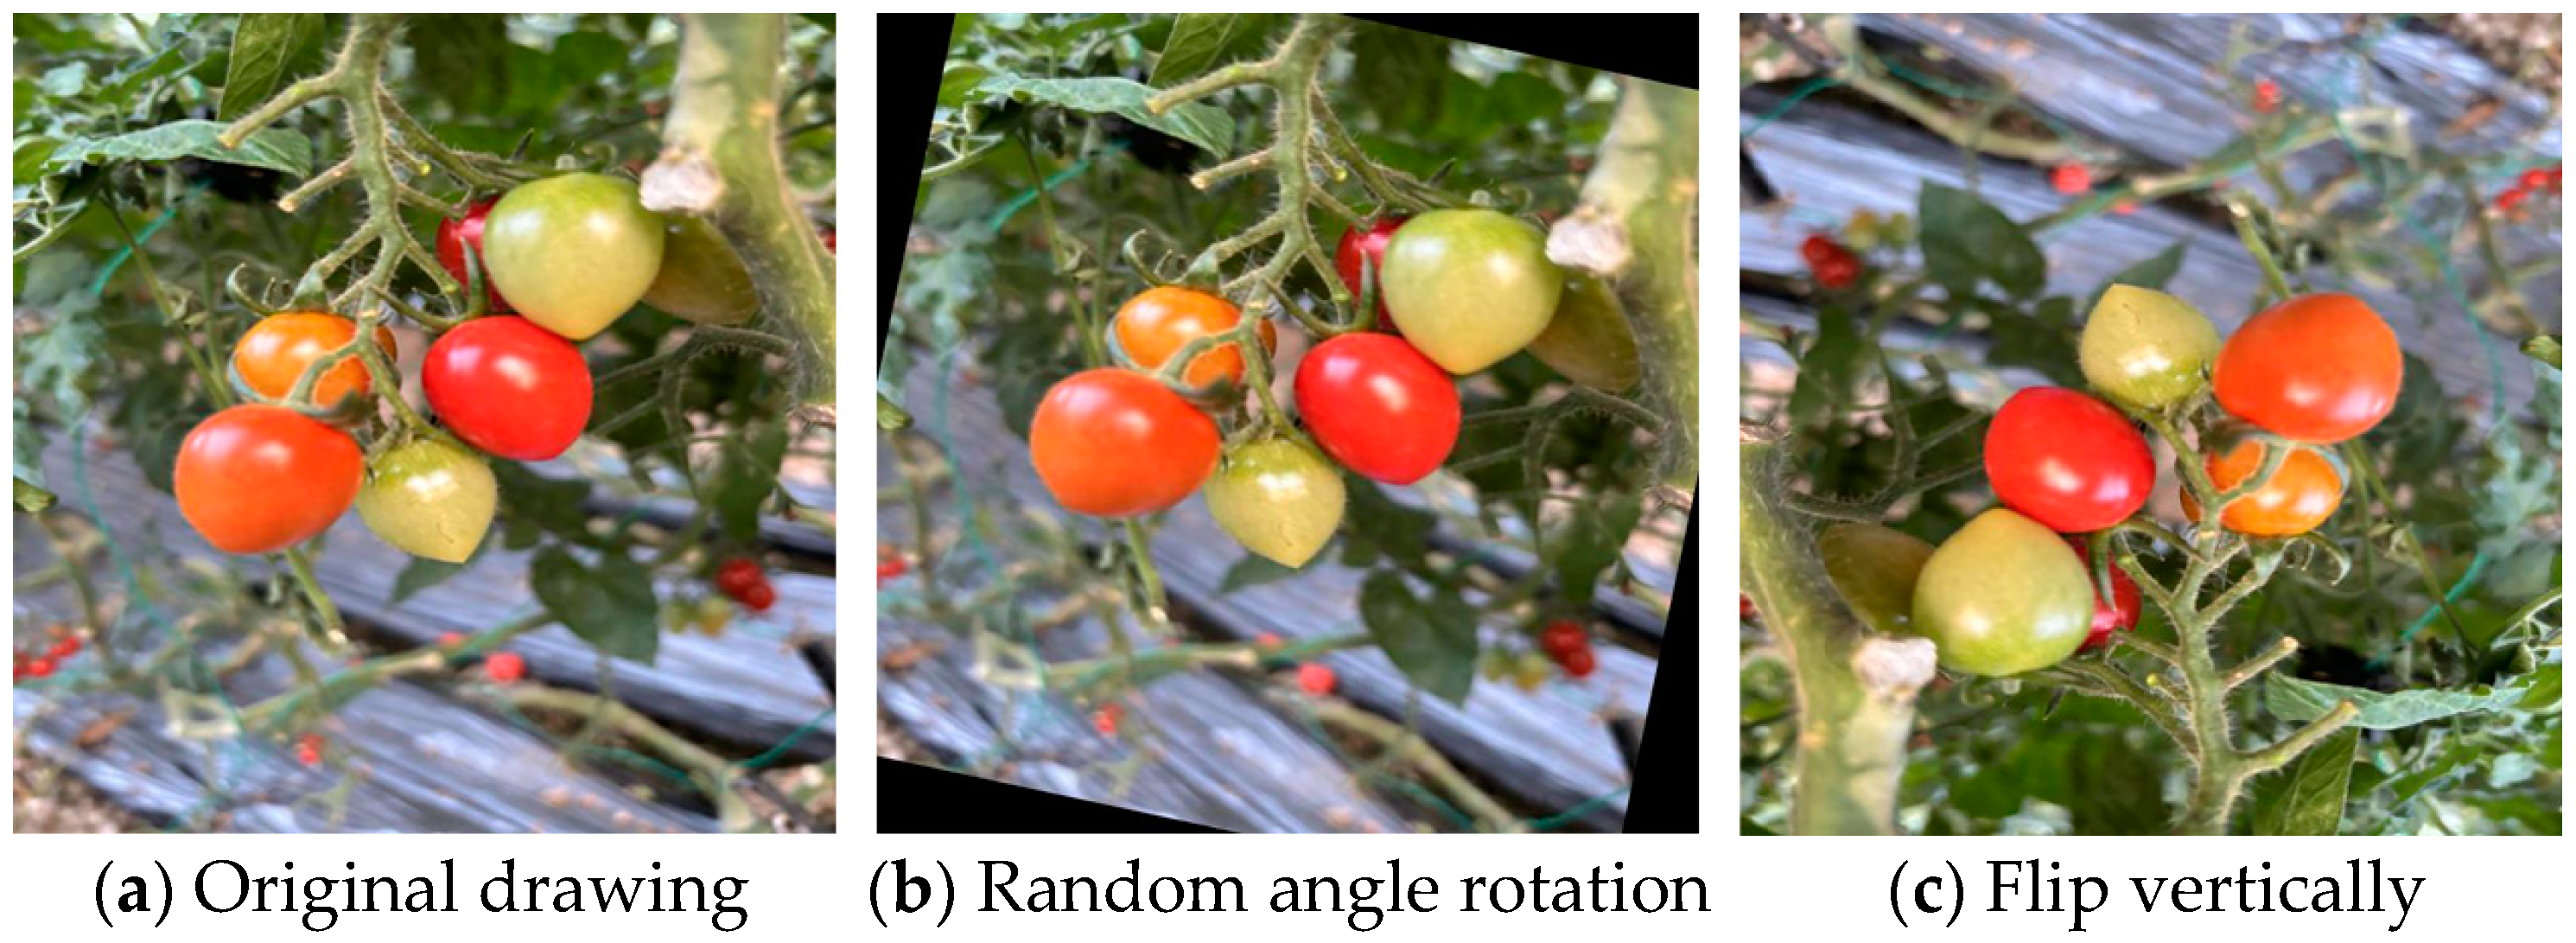
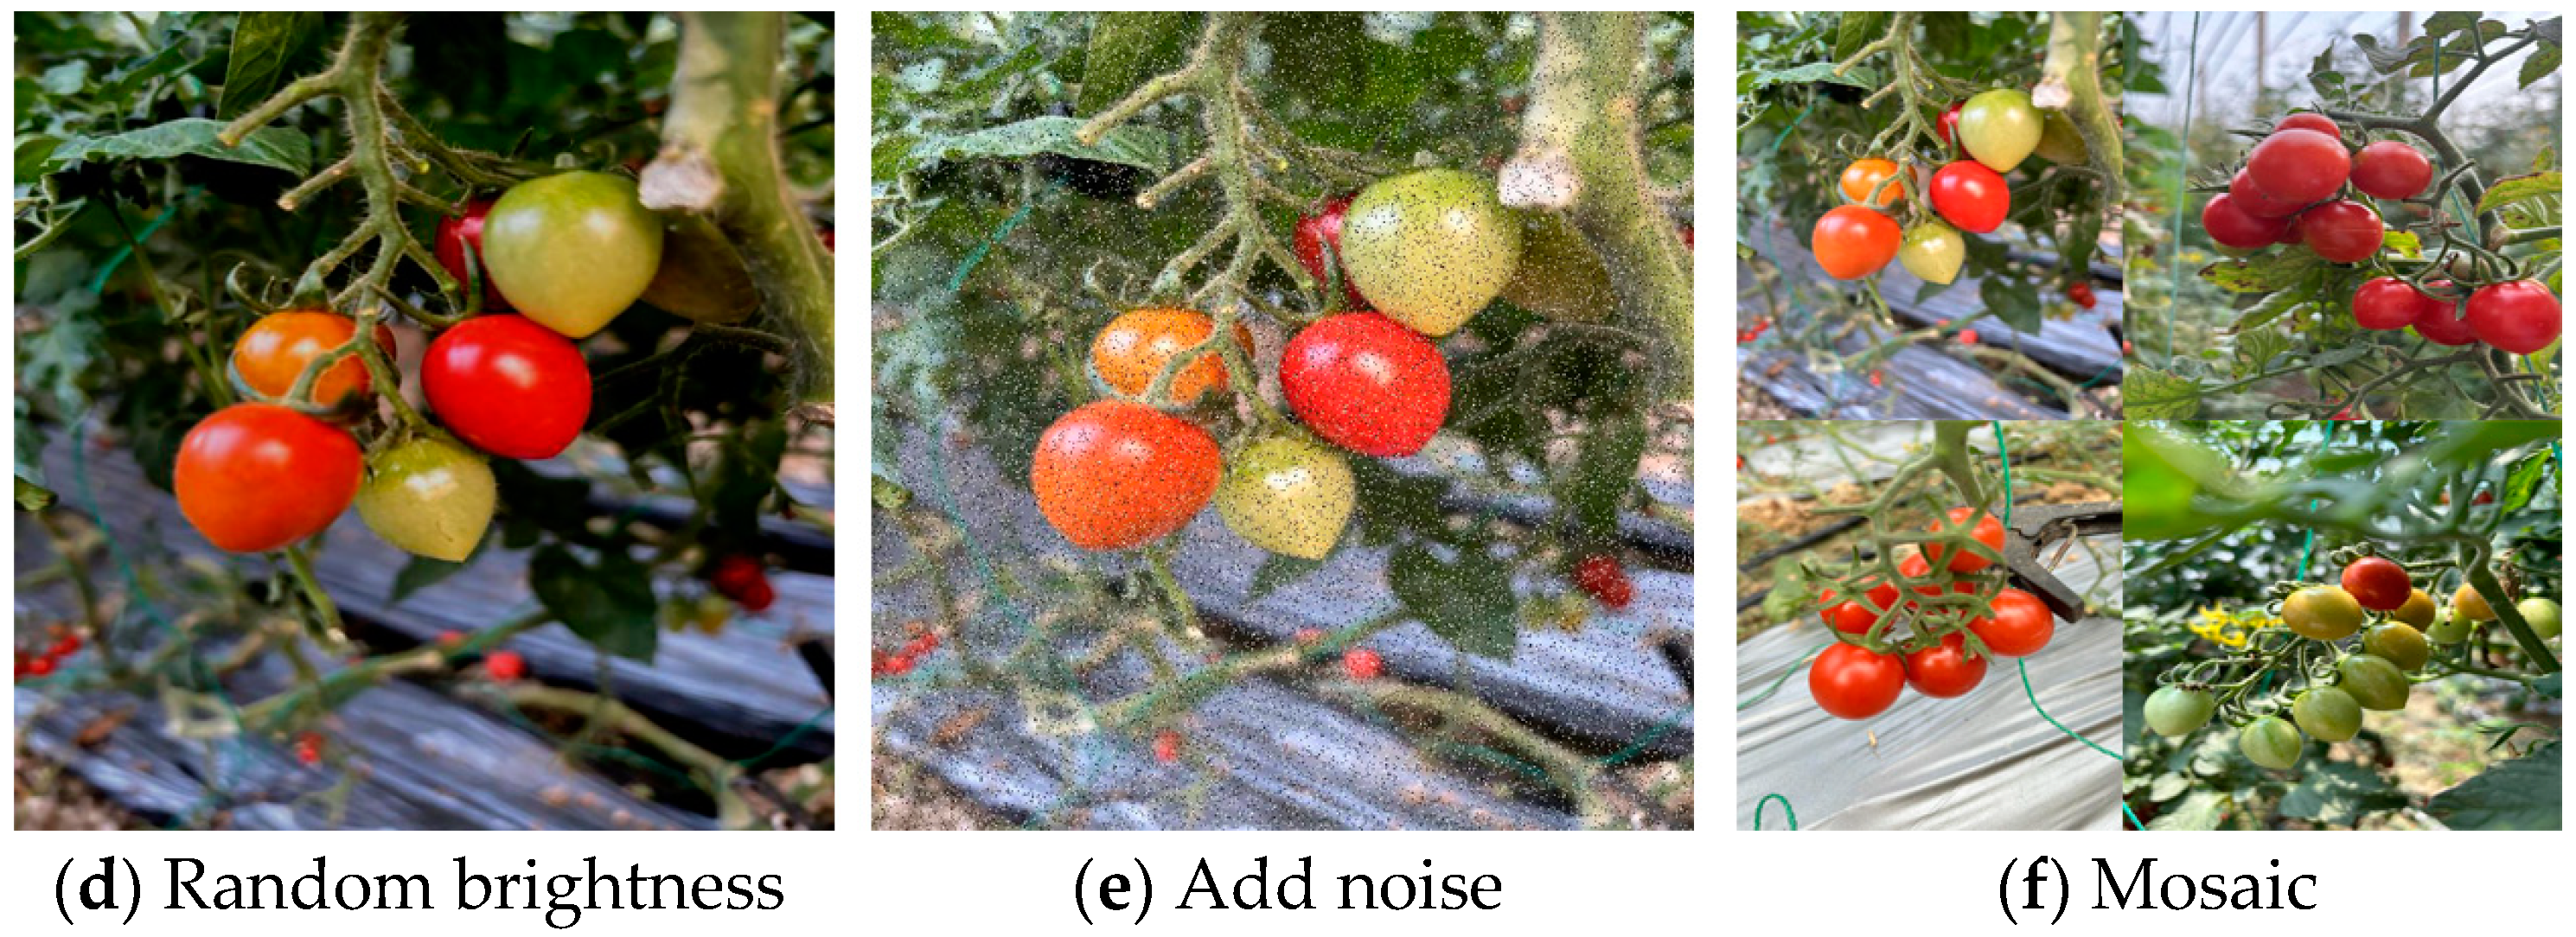
2.1.2. Data Enhancement

The image is augmented by means of data enhancement, including random angle rotation, vertical flip, random brightness adjustment, adding noise, mosaic, etc., and as shown in Figure 2, the following transformations were applied. Through the combination of geometric transformation and content transformation, the image attributes are comprehensively modified to enhance the robustness and generalization ability of the model; 9360 clear and complete images are left to ensure the quality of the dataset.

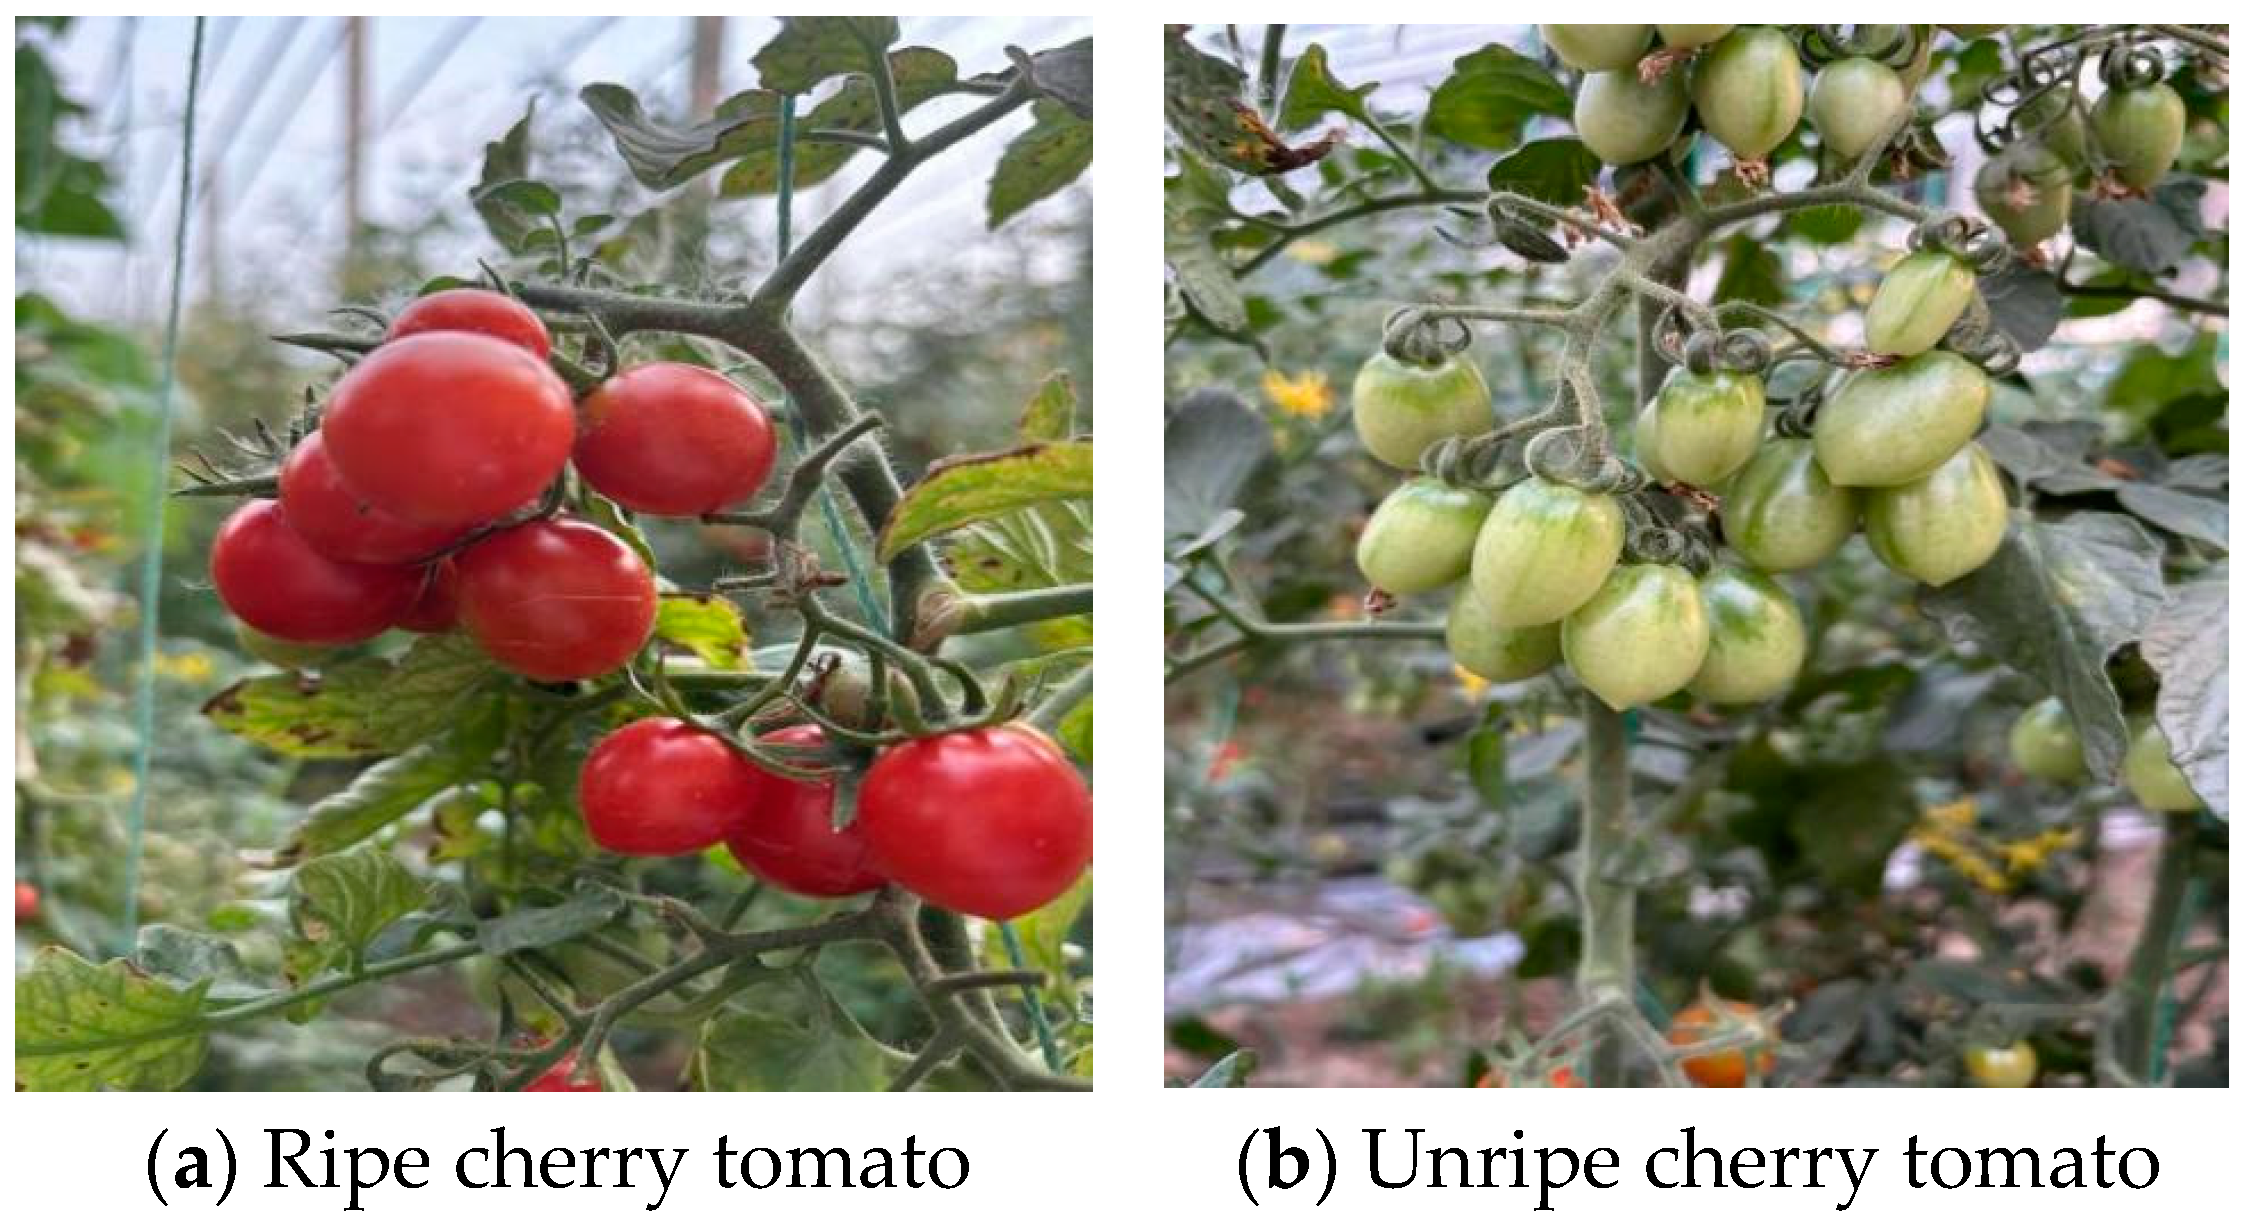
2.1.3. Data Labeling

To accurately identify cherry tomato maturity in natural environments, external interferences like shading and overlapping must be addressed. Ripening occurs in batches, with each batch containing 1 to 3 fruits at different stages—ripe, semi-ripe, and unripe. The surface color is a key maturity indicator: unripe fruits are green, blending with branches and leaves, while ripe ones turn bright red. During the ripening process, the color of cherry tomatoes will gradually transition from light green to dark red, and the color will gradually deepen until it is fully ripe.
According to the People’s Republic of China Supply and Marketing Cooperation Industry Standard, GH/T1193-2021 [36], which was issued on 11 March 2021 by the All-China Federation of Supply and Marketing Cooperatives, cherry tomatoes are divided into six periods: unripe, green ripe, discolored, pre-red ripe, mid-red ripe, and late red ripe. The immature fruits and seeds are not yet fully developed or formed. The pericarp is green. The green mature fruits are fully formed. The fruit surface is shiny and turns from green to white green. The seeds have matured and have a gelatinous texture around them. The color change period is the transition period from green to red. Yellow or light red halos begin to appear around the navel, and the red surface of the fruit is less than 10%, at the early stage of red ripening, the fruit is 10–30% red, at the middle stage, the fruit is 40–60% red, and at the late stage, the fruit is 70–100% red. Algorithmic recognition aids precise target positioning and efficient labor allocation, supporting automated fruit picking. In this study, cherry tomatoes with less than 40% skin coloration are classified as unripe, while those exceeding 40% are considered ripe. Figure 3 illustrates different ripeness levels. Tomato images were manually labeled with rectangular regions using the Make Sense image annotation website, and cherry tomato fruits approaching mid-red ripeness and late-red ripeness were labeled as Ripe_tomato, while cherry tomato fruits from other periods were labeled as Unripe_tomato. When labeling, the labeling box shall be as close to the target as possible to reduce the interference of background pixels. After annotation, a series of text files is generated, and the image name corresponds to the text file name one by one. Each line in the text file corresponds to a target in the image. The labeled datasets were classified in the ratio of 8:1:1, including 7488 training sets, 936 validation sets, and 936 test sets. Table 1 shows the changes in the number of category labels before and after data enhancement.

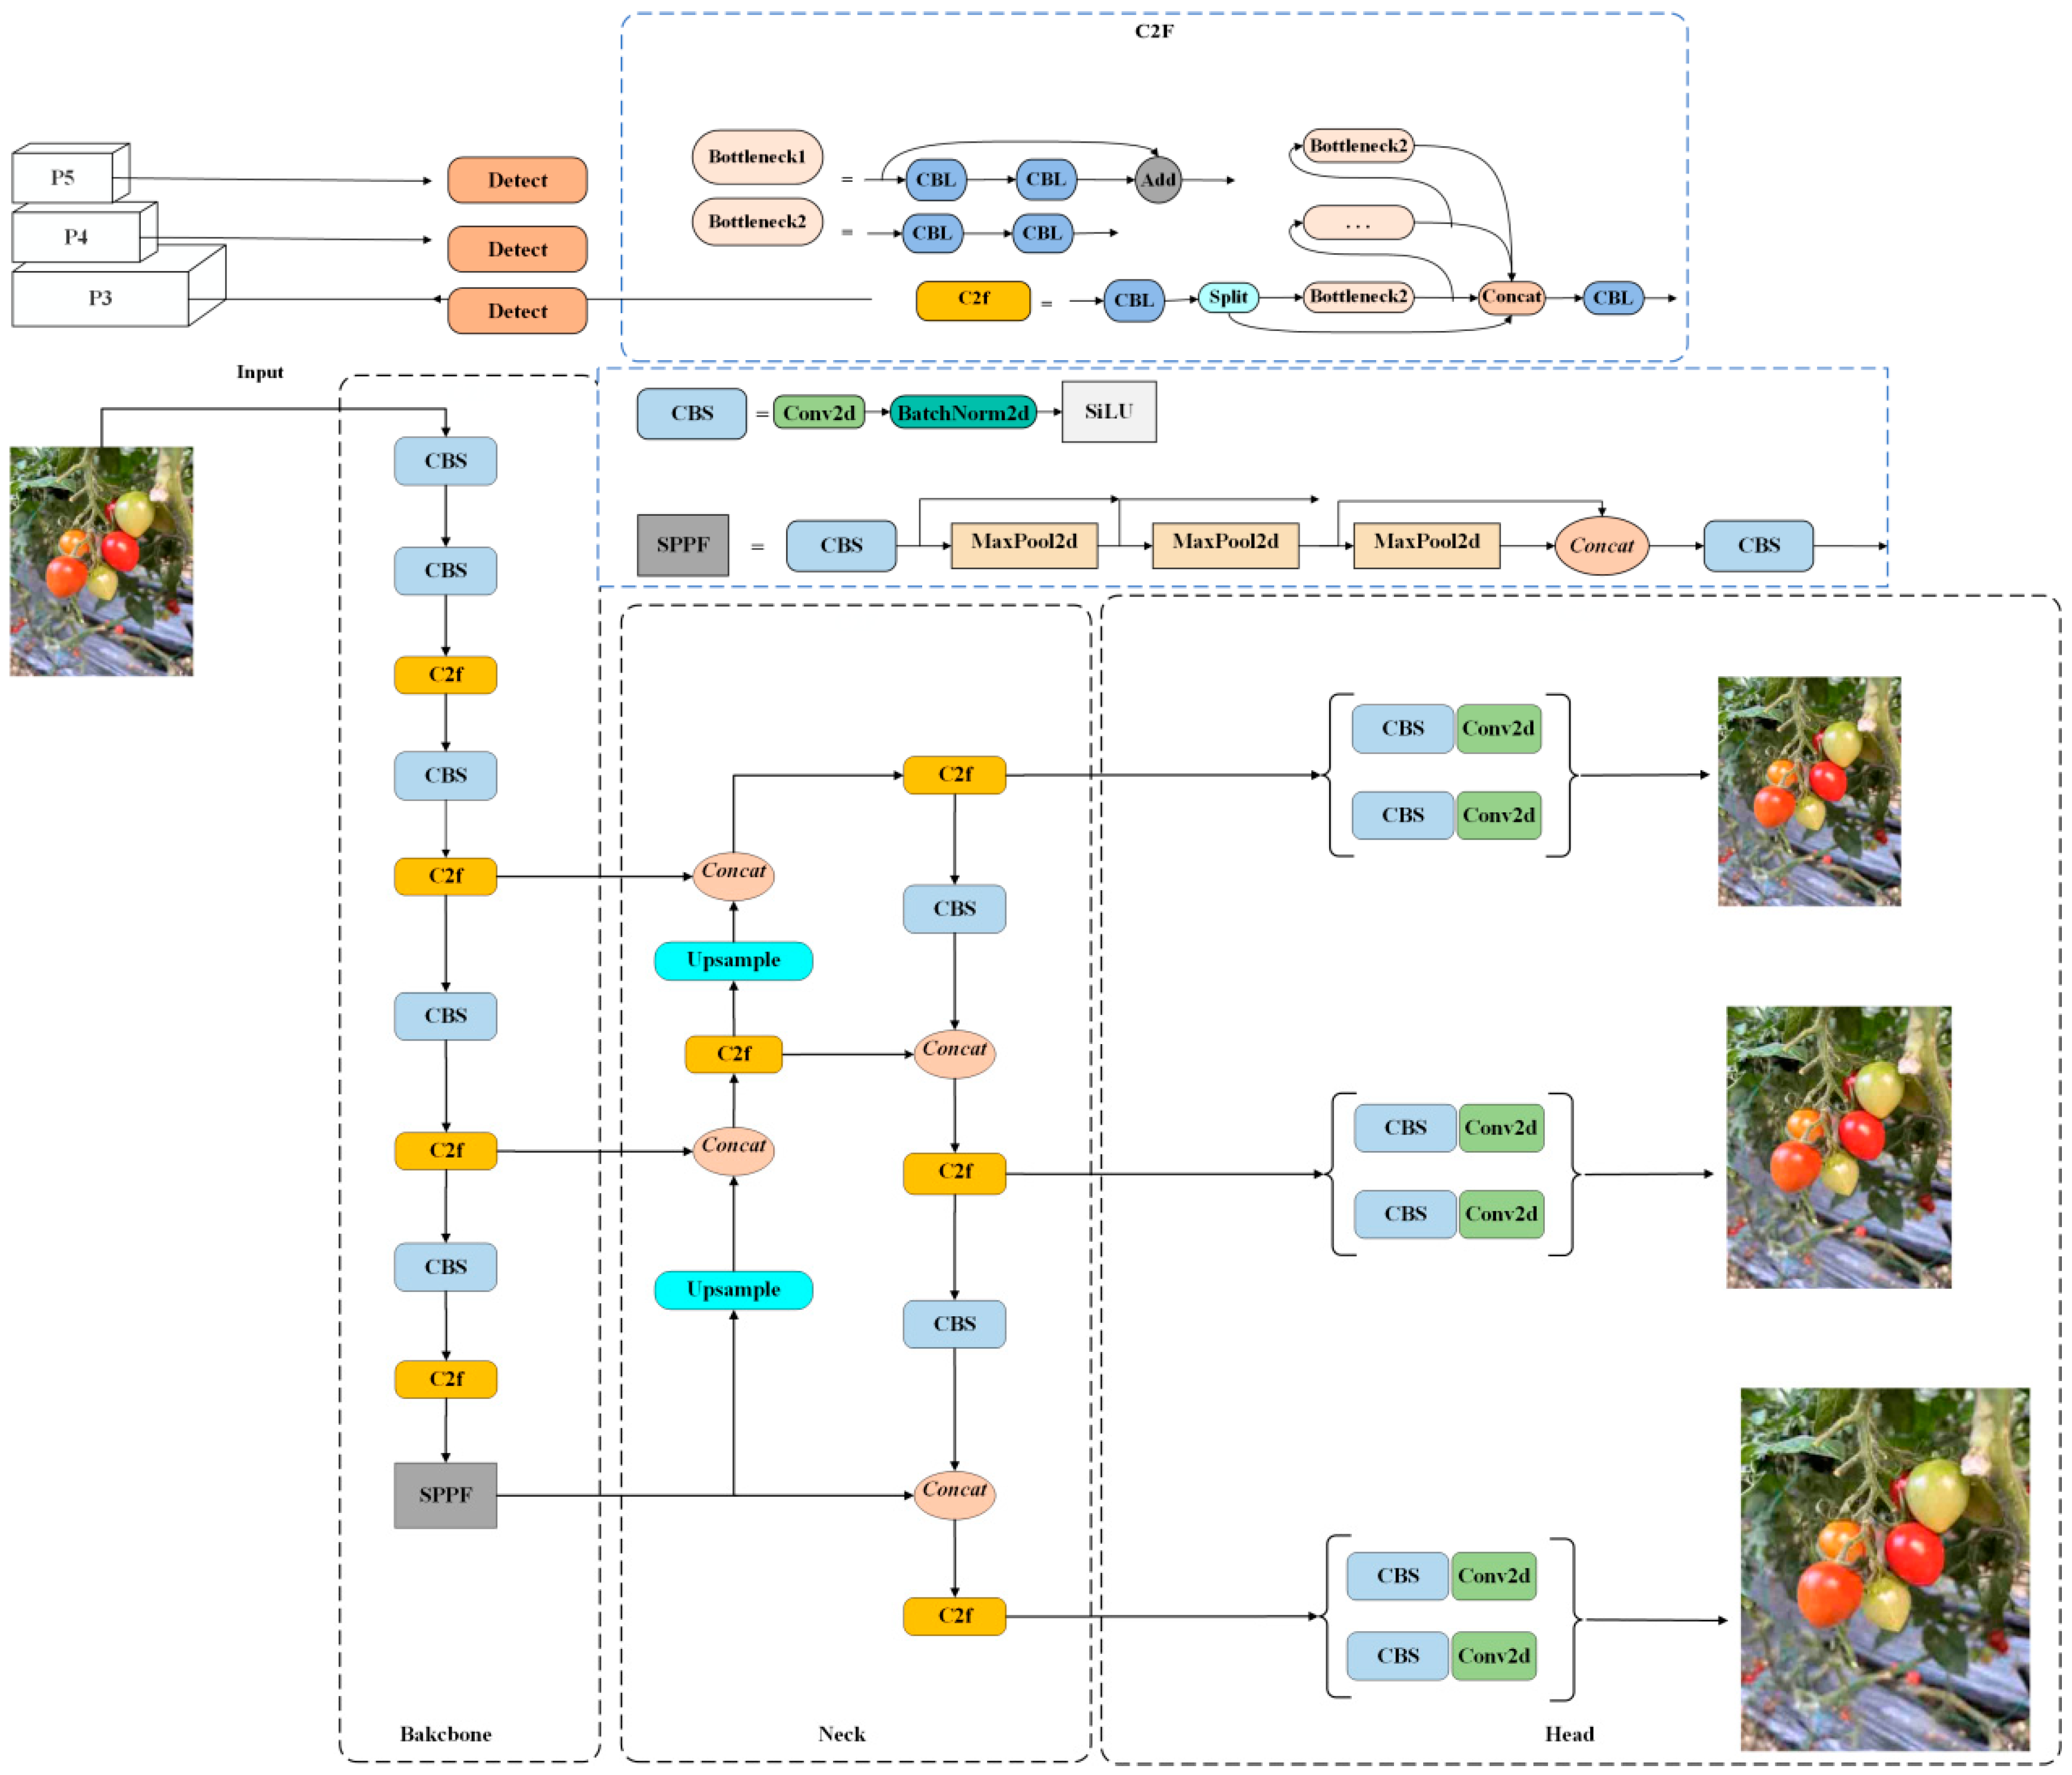
2.2. Standard YOLOv8 Model

In this paper, we choose the lightweight YOLOv8n. YOLOv8n is a lightweight parametric structure derived from the YOLOv8 algorithm. It consists of a backbone network, a neck network, and a prediction output header. The backbone network uses convolutional operations to extract features at various scales from RGB color images. Meanwhile, the role of the neck network is to merge the features extracted from the backbone network. Feature pyramid structures (FPNs) are commonly used to merge low-level features into higher-level representations. The header layer predicts target categories using three detectors of different sizes for content selection and detection. Figure 4 shows the standard YOLOv8 network structure.

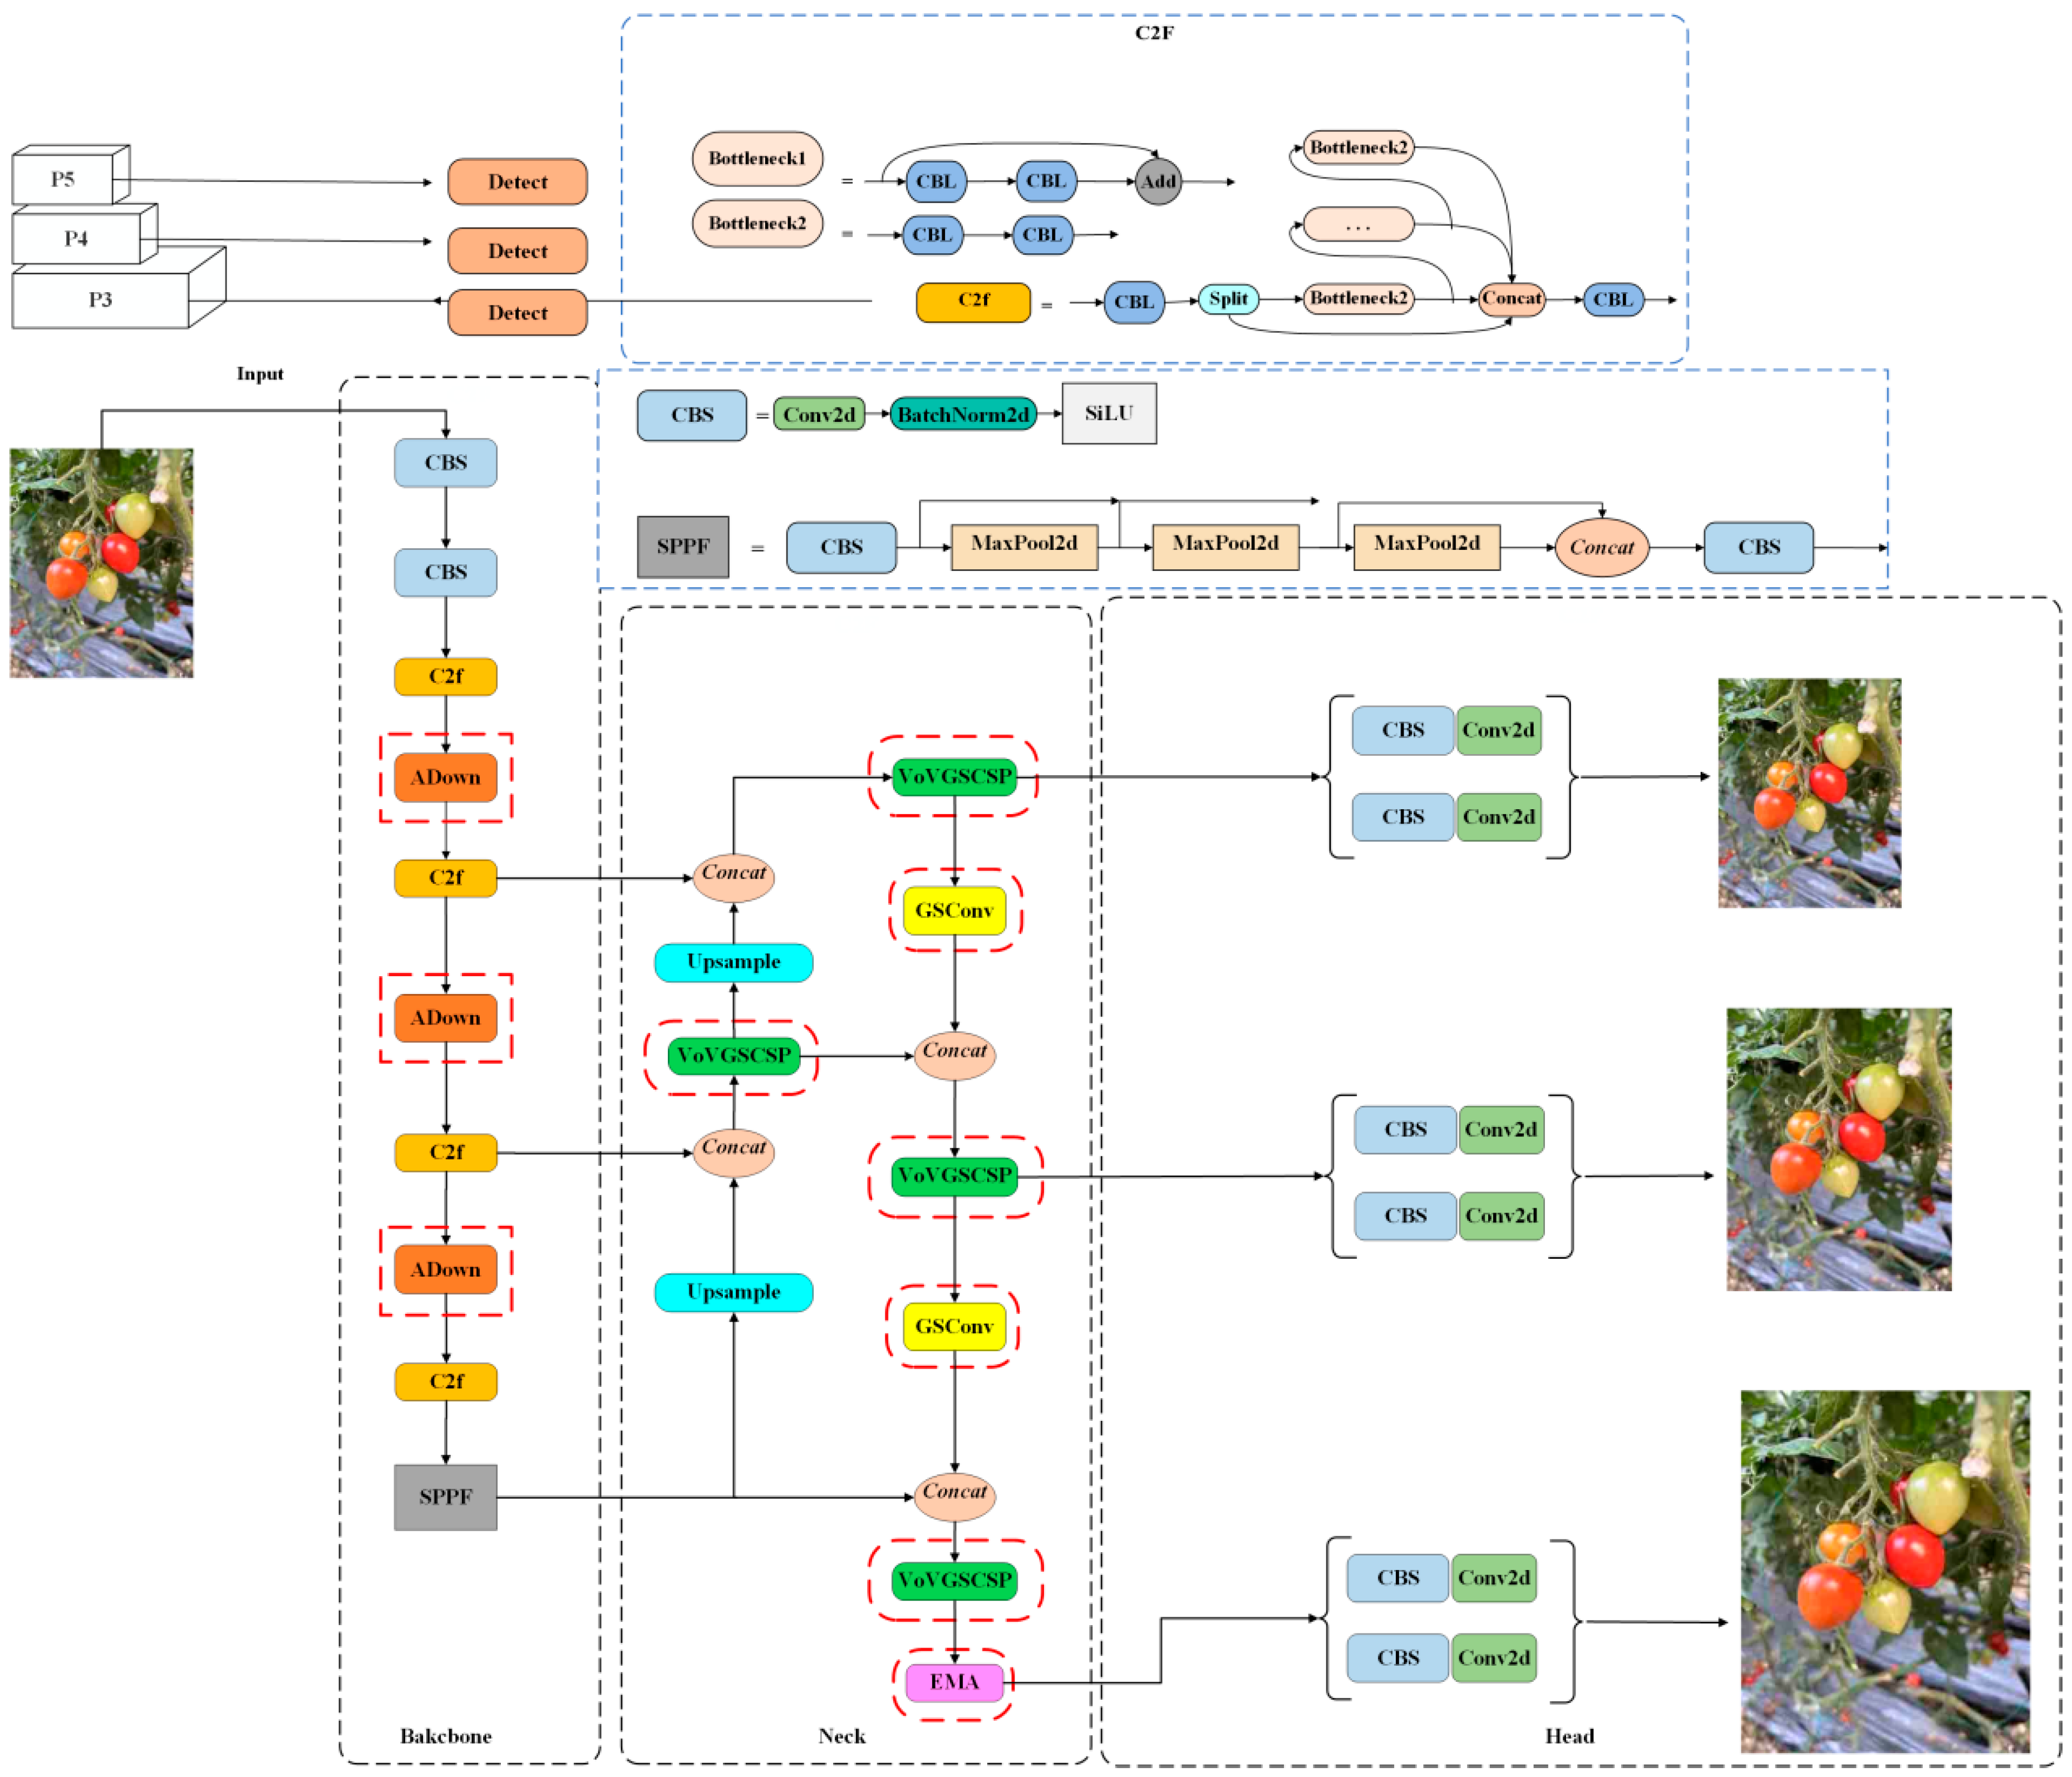
2.3. Improved YOLOv8 Model

This paper proposes an improved target-detection model (Figure 5) for fast and accurate cherry tomato detection in natural environments. The use of the ADown down-sampling module to replace some of the common convolutions of the original network backbone helps the model to capture the features of the image at a higher level for more accurate target detection, in addition to reducing the complexity of the model by decreasing the number of parameters, which helps to improve the efficiency of the model’s operation, especially in resource-constrained environments. Figure 5 presents specific changes, showing clear differences from Figure 4. In addition, in the neck part of the model, the conventional convolution paired with the C2f module is replaced with a more efficient lightweight convolution combining GSConv and VoV-GSCSP. In addition, the model introduces the EMA attention mechanism, implemented at layer P5, which is located before the network head in the integrated ASE-YOLOv8 network architecture. The EMA attention mechanism enhances the feature representation capability through channel dimensionality reshaping and parallel sub-network design while maintaining the computational efficiency of the model, which facilitates the network to extract the detailed features of the target more accurately. The red dashed box in Figure 5 indicates all the improvements.

2.3.1. YOLOv8-ADown Down-Sampling Module

ADown is an innovative down-sampling module in YOLOv9 that optimizes the accuracy and efficiency of target detection through its lightweight design and learning capability. During feature extraction in the backbone network, standard convolutional down-sampling increases the stride, reducing the feature map’s spatial size. As a result, small cherry tomatoes may merge into the background, losing important details. This diminishes their visibility, making it harder for the model to recognize them in later layers. In order to improve the recognition accuracy of small targets, the down-sampling method of ADown is used [37]. Among them, average pooling (AvgPool2d) retains global information [38], and maximum pooling (MaxPool2d) emphasizes salient features [39]. By performing convolution operations on the outputs of the two different pooling methods, respectively, the multi-level information is effectively retained, which helps to prevent the potential loss of information in the process of down-sampling and improves the model’s sensitivity to detailed features. As shown in Figure 6, the left side demonstrates the process of standard convolutional down-sampling, while the right side shows the process of ADown down-sampling. In standard convolutional down-sampling, the input data first pass through a standard convolutional layer (Conv) [40], and then, the convolutional output passes through batch normalization (BatchNorm) [41], followed by a nonlinear activation function (SiLU) [42], which ultimately generates an output feature map after down-sampling. The ADown down-sampling process is different. First, the input feature maps are average pooled through an average pooling layer and divided into two sub-feature maps, X1 and X2, in the channel dimension. X1 goes through a convolution operation directly, while X2 first goes through a maximum pooling layer to extract the maximum value within the pooling window and then goes through a convolution layer for down-sampling in order to extract local features. Finally, the output feature maps of these two paths are merged by a splicing operation, and the merged feature map is used as the final output. The function of this module is to transform from the number of input channels c1 to the number of output channels c2 and perform 2-fold down-sampling. The core idea is to split the input feature map into two parts, which are subjected to different down-sampling operations, and then spliced in the channel dimension, so as to improve the feature-extraction capability. The specific realization steps and formulas are as follows:
1.
Channel splitting:
Input X is preprocessed by 2 × 2 average pooling (stride = 1) to minimize local information loss:
X = AvgPool2d (X, 2, 1, 0)
Then, X is divided into X1 and X2 along the channel dimension (dim = 1):
X1, X2 = split (X, dim = 1)
2.
Different ways of down-sampling:
  • Convolutional down-sampling (X1 part):
X1 feature extraction and down sampling via 3 × 3 convolution with step = 2 and padding = 1:
y1 = Conv (x1, 3, 2, 1)
Maximum pooling down-sampling (X2 part):
X2 down-sampling via 3 × 3 maximum pooling with stride = 2 and padding = 1:
X2 = MaxPool2d (X2, 3, 2, 1)
Then, X2 performs channel transformation through 1 × 1 convolution:
y2 = Conv (X2, 1, 1, 0)
3.
Feature integration:
Finally, y1 and y2 are spliced in the channel dimension to form the final output:
Y = Concat (y1, y2, dim = 1)

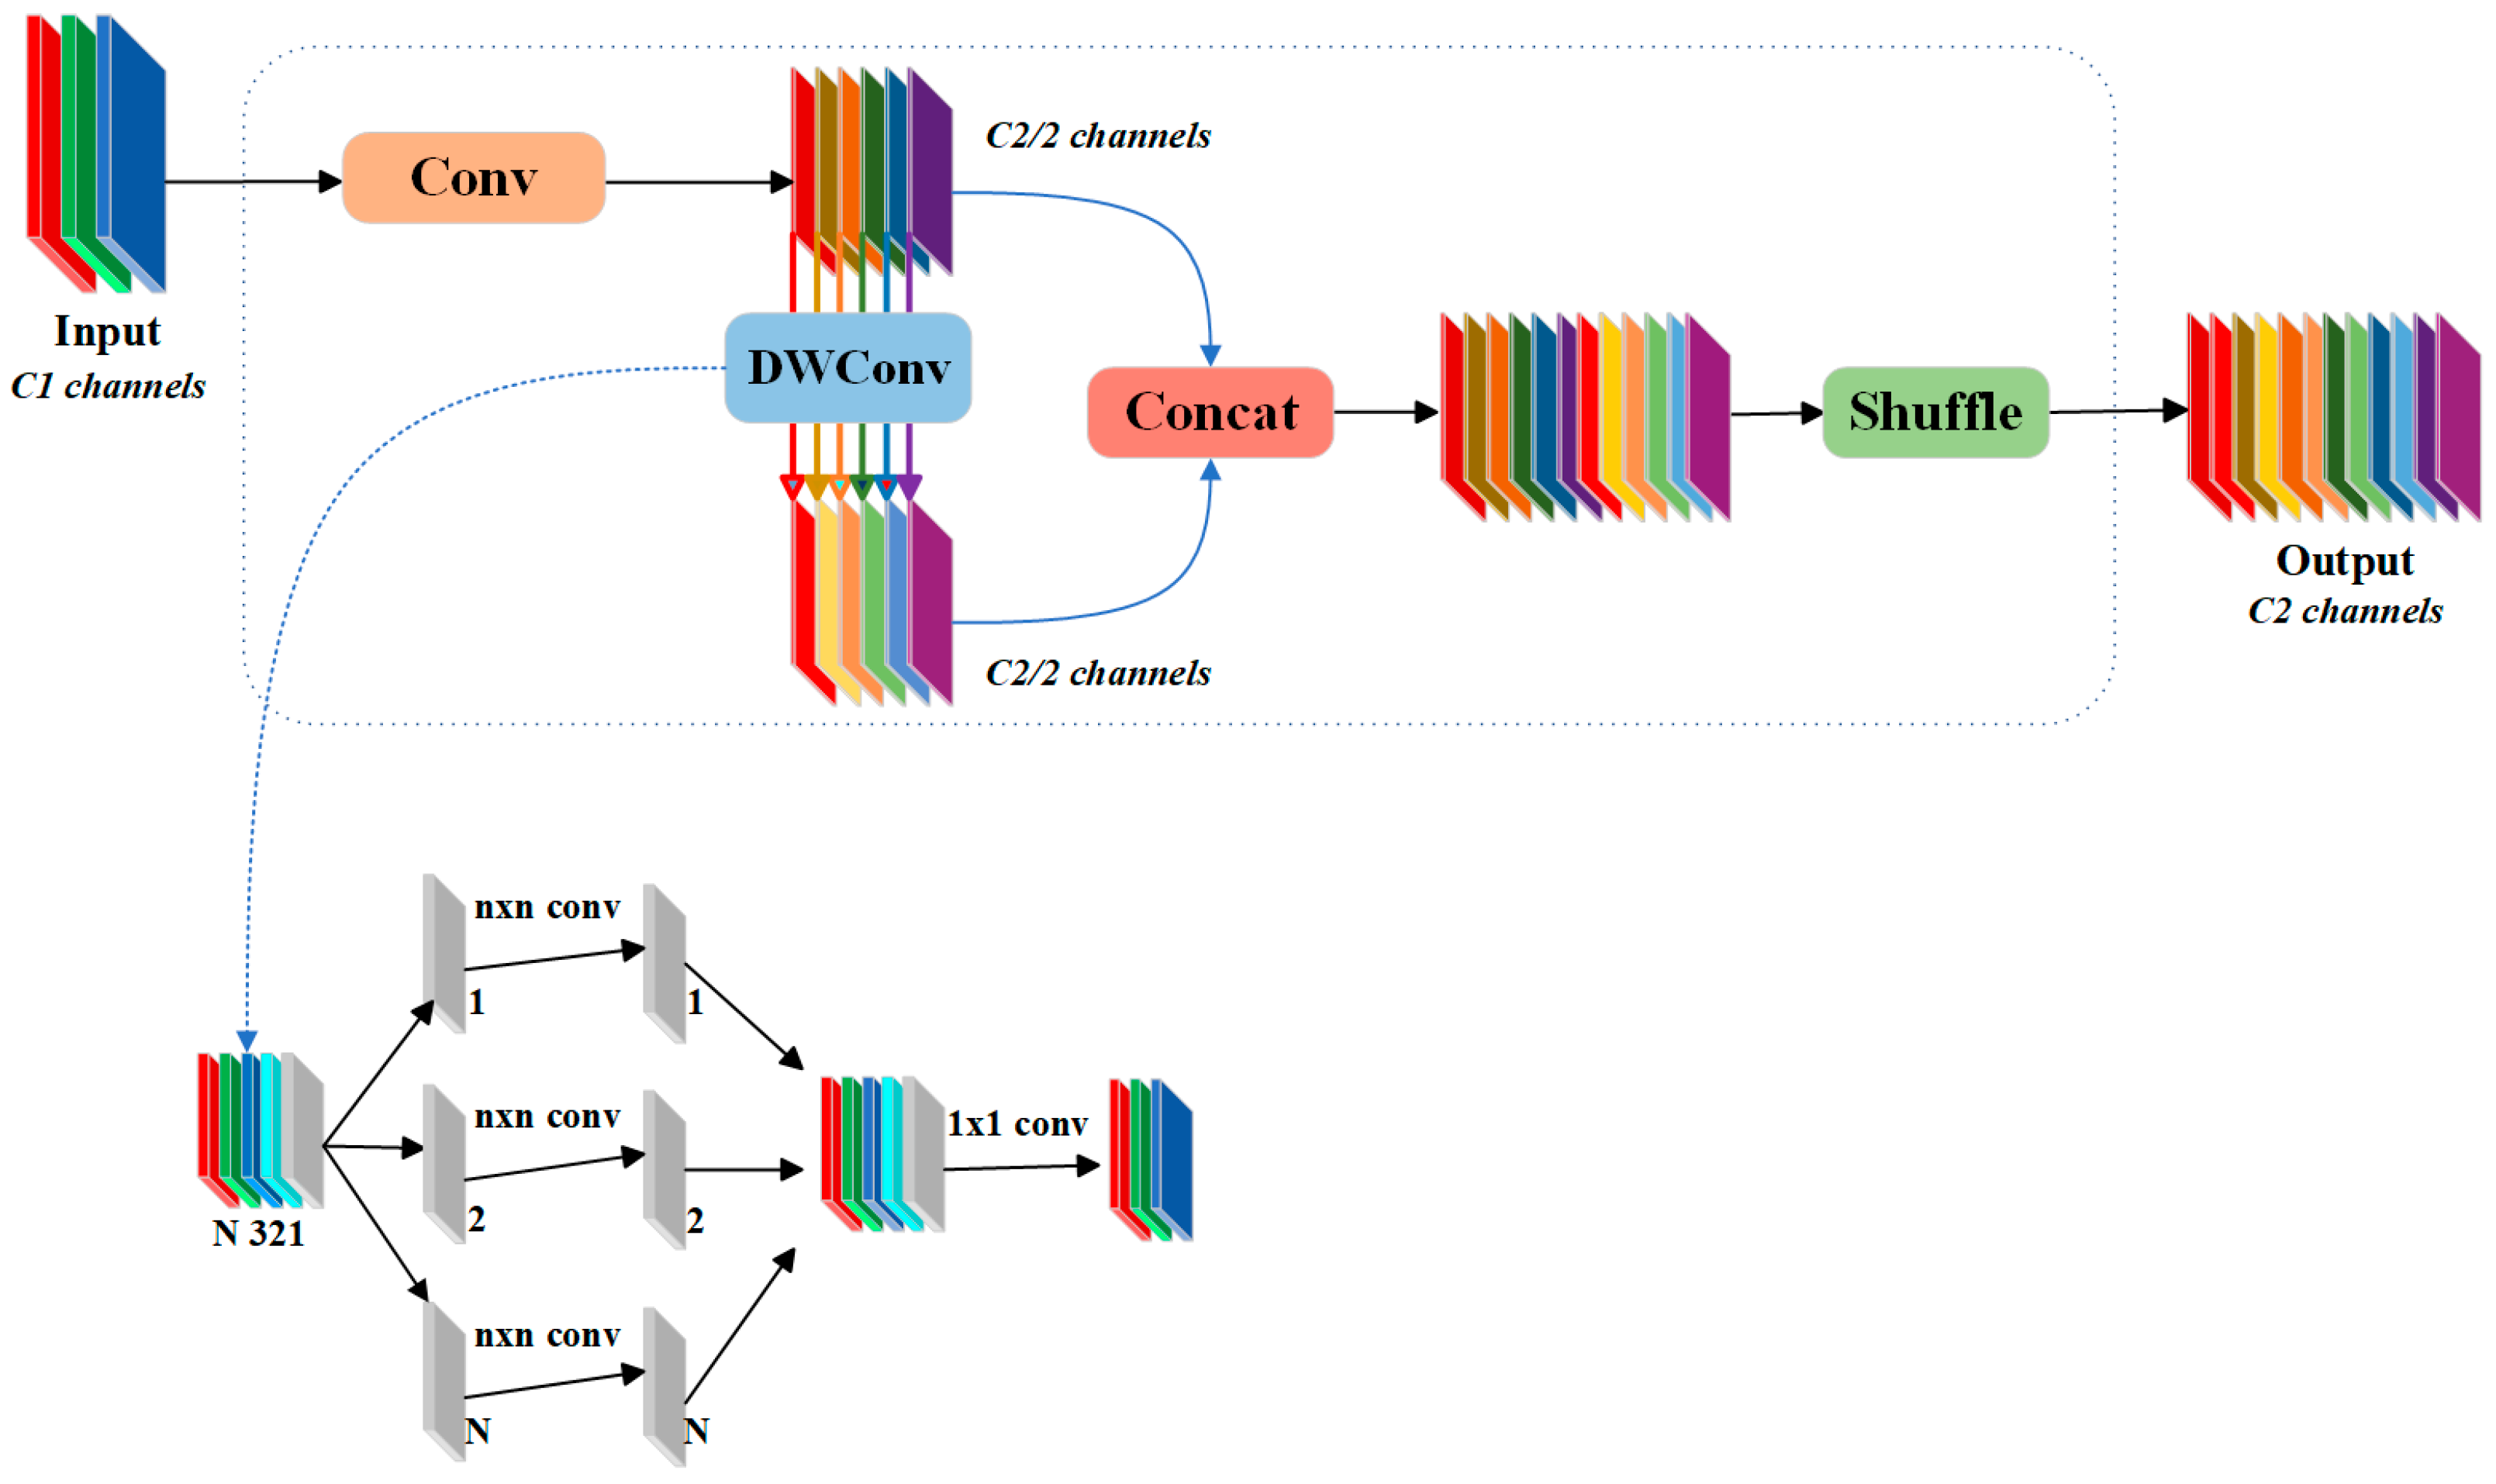
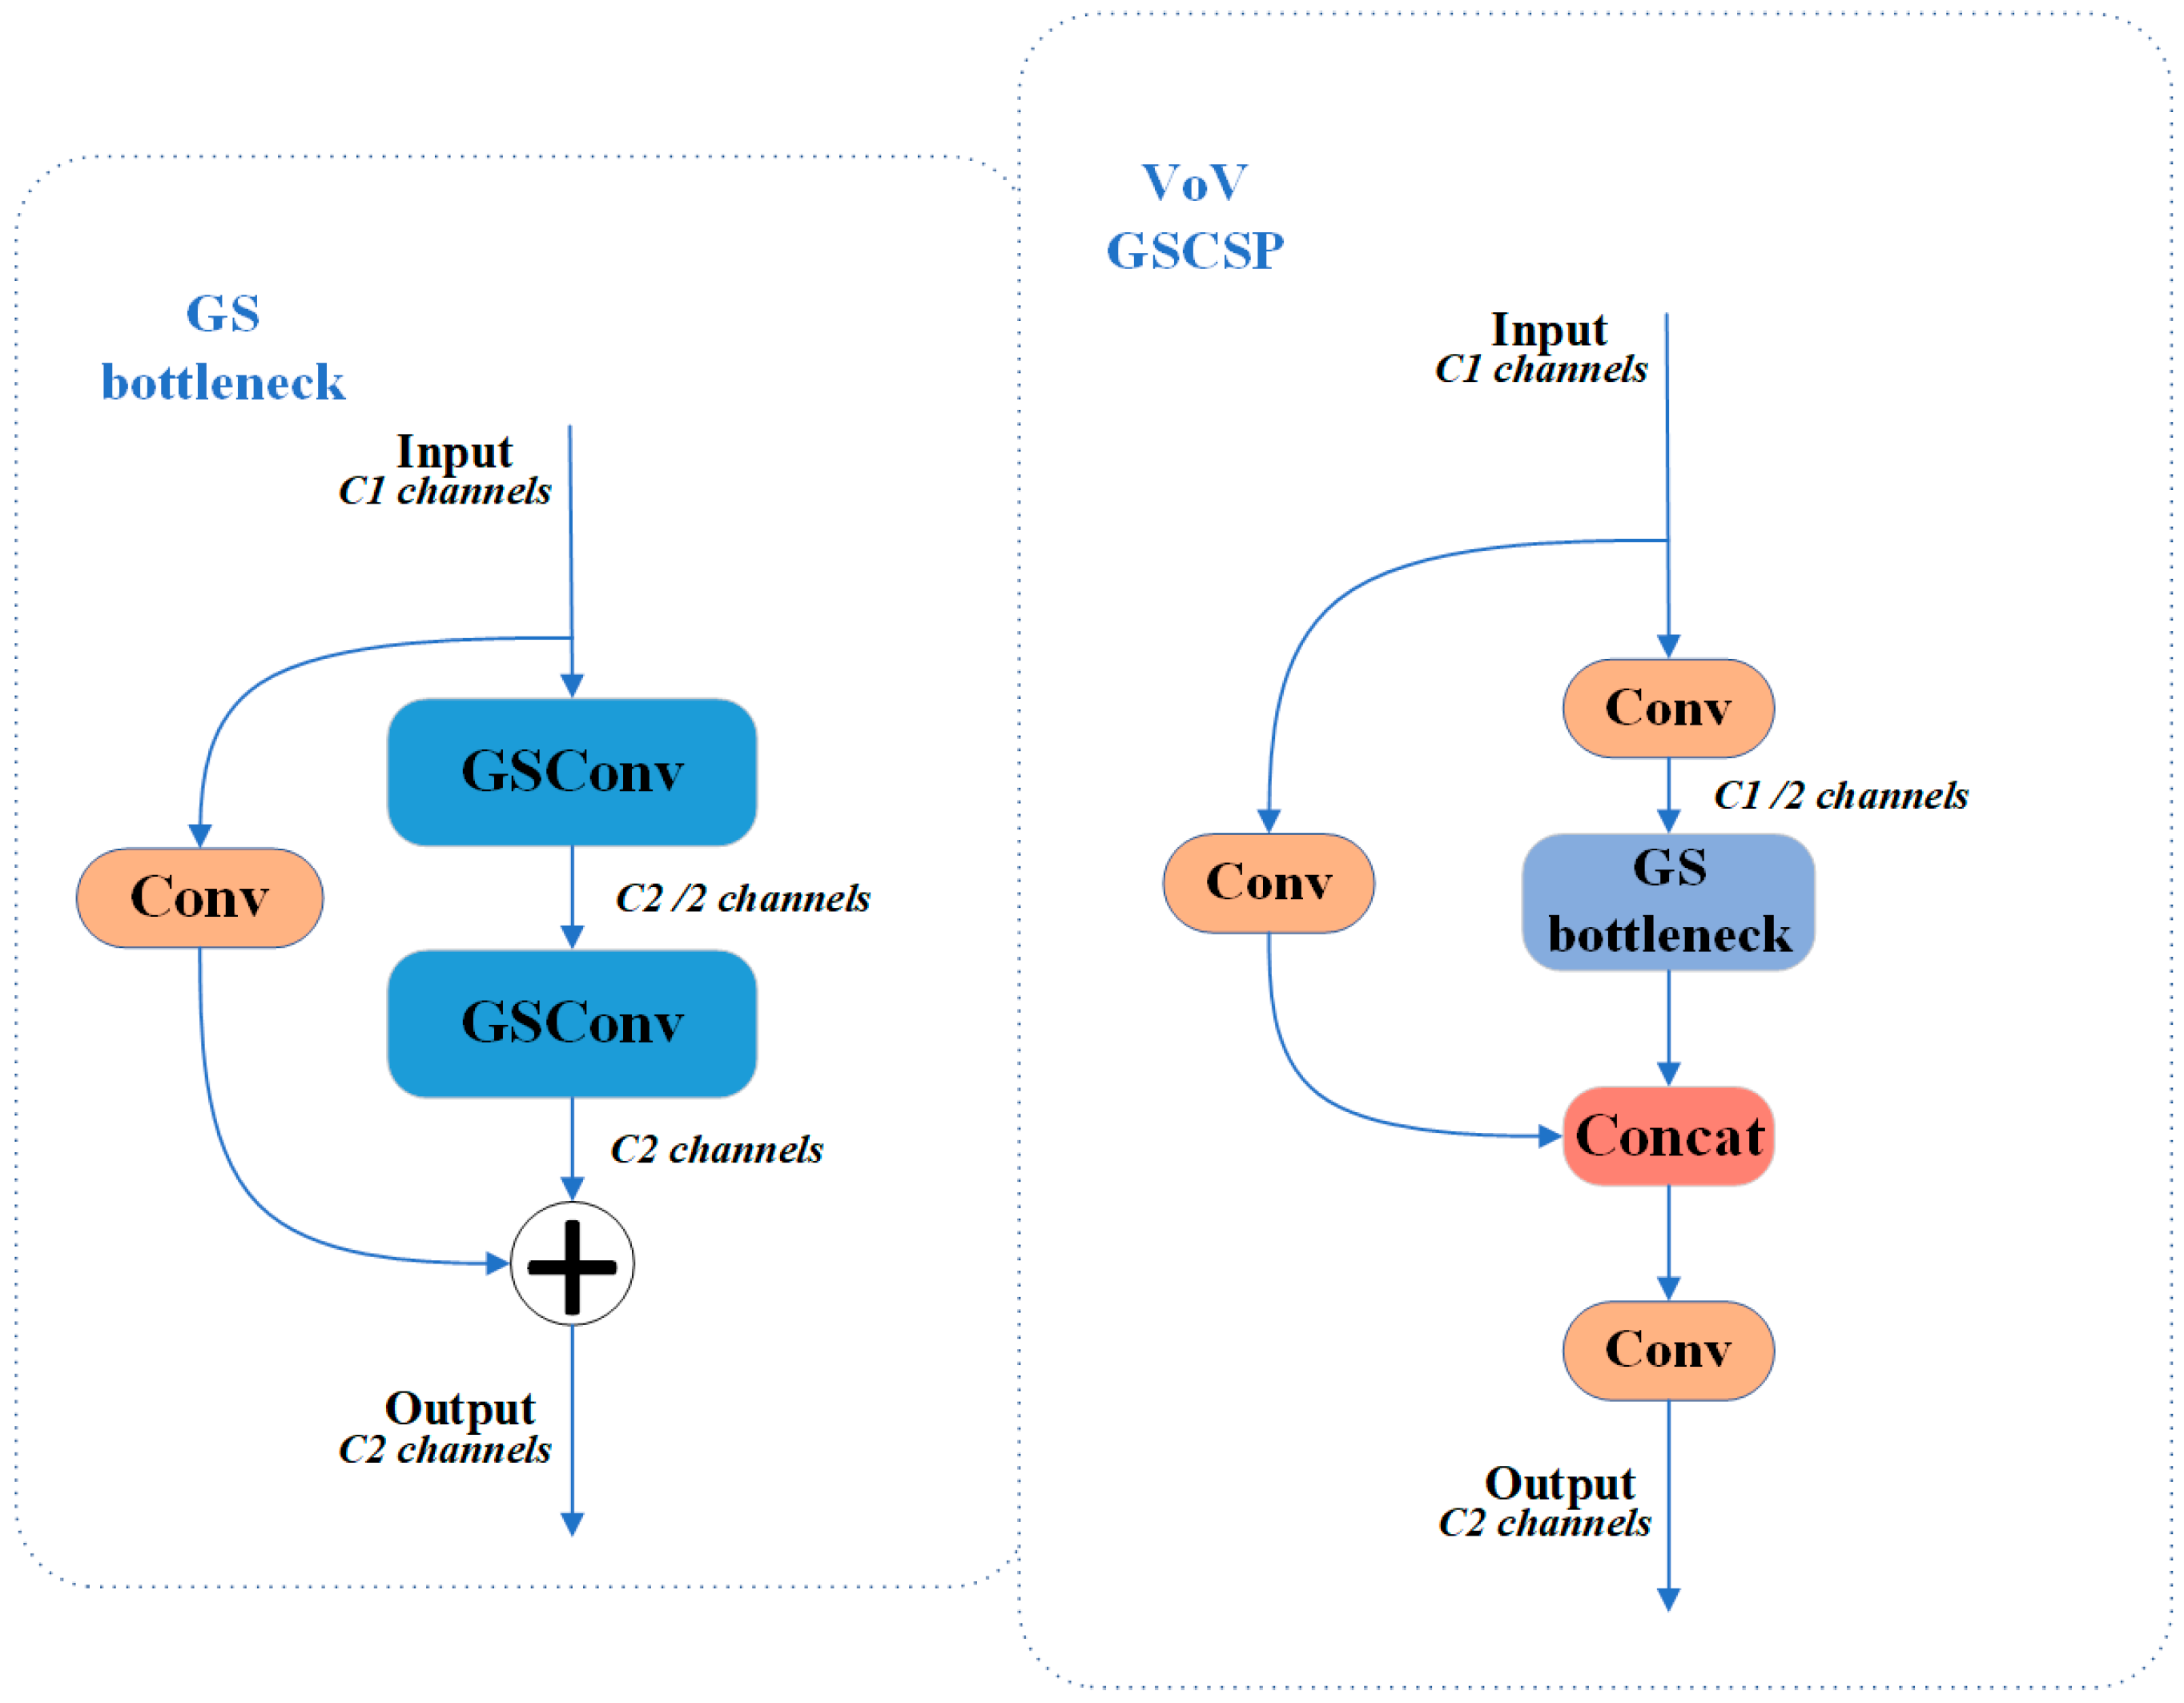
2.3.2. YOLOv8-Slim-Neck

ASE-YOLOv8 incorporates the Slim-Neck module, consisting of GSConv and VoV-GSCSP. Specifically, GSConv is added to the neck structure, replacing the original C2F module with VoV-GSCSP. GSConv [43], which was introduced in 2022, is a lightweight convolution method that has demonstrated strong performance in recent deep learning research. It comprises Conv, DWConv [44], Concat [45], and Shuffle modules [46], as shown in Figure 7. GSConv enhances the model accuracy, speeds up convergence, and optimizes detection by refining feature extraction. By reducing the computational complexity and parameter count, it strengthens the attention module, allowing the model to focus more precisely on key image areas. Additionally, GSConv serves as an alternative to traditional convolution. While integrating it into the backbone deepens the network hierarchy, it also increases data flow resistance and the inference time. Therefore, researchers tend to deploy GSConv at the front end of the network, at which stage the feature map is compact enough to avoid unnecessary conversions and improve the overall computational efficiency. The computational cost of GSConv for processing feature mapping is about 60% to 70% of that of standard convolutional methods, effectively reducing redundancy and eliminating duplicate information. Researchers introduced a multi-scale image pyramid model with a feature-extraction algorithm that transforms a 2D feature map into a 3D tensor, refines it using 3D convolution, and reconstructs it into a 2D feature map via GSConv, ensuring efficient mapping. To further enhance model performance, the Slim-Neck module plays a key role. By simplifying the network and reducing parameters, it lowers computational costs and boosts the inference speed, making it ideal for real-time applications and resource-limited devices. Optimizing information flow and streamlining the feature layer minimizes unnecessary computations while maintaining accurate feature extraction. While reducing the computational redundancy, Slim-Neck can still retain key information, thereby optimizing the feature-extraction process and improving the convergence speed and detection accuracy of the model. Experimental results show that in a variety of tasks, especially in application scenarios with high requirements for fast responses and efficient computing, the Slim-Neck structure performs better than traditional deep network architectures. This model combines Slim-Neck and GSConv technologies, not only achieving a breakthrough in lightweight design, but also reaching a new level in accuracy and speed.
GSConv is an efficient tool for mitigating redundant information in feature maps to improve cherry tomato appearance-detection modeling. However, a further reduction of the inference time without compromising accuracy remains a challenge. To this end, this paper proposes a GS bottleneck architecture and VoV-GSCSP network based on the GSConv framework. Figure 8 shows the architecture of the VoV-GSCSP backbone network, which uses a pair of GSConv operations to perform up-sampling and down-sampling processes, thereby effectively promoting the transfer of robust semantic features. In the neck structure of the model, the VoV-GSCSP module is used to replace the traditional C2f module. This optimization strategy reduces the computational complexity while maintaining a high accuracy. This improvement is crucial for the cherry tomato appearance-detection system, which helps to improve the system’s operating efficiency while ensuring detection accuracy, making it more suitable for practical agricultural applications.

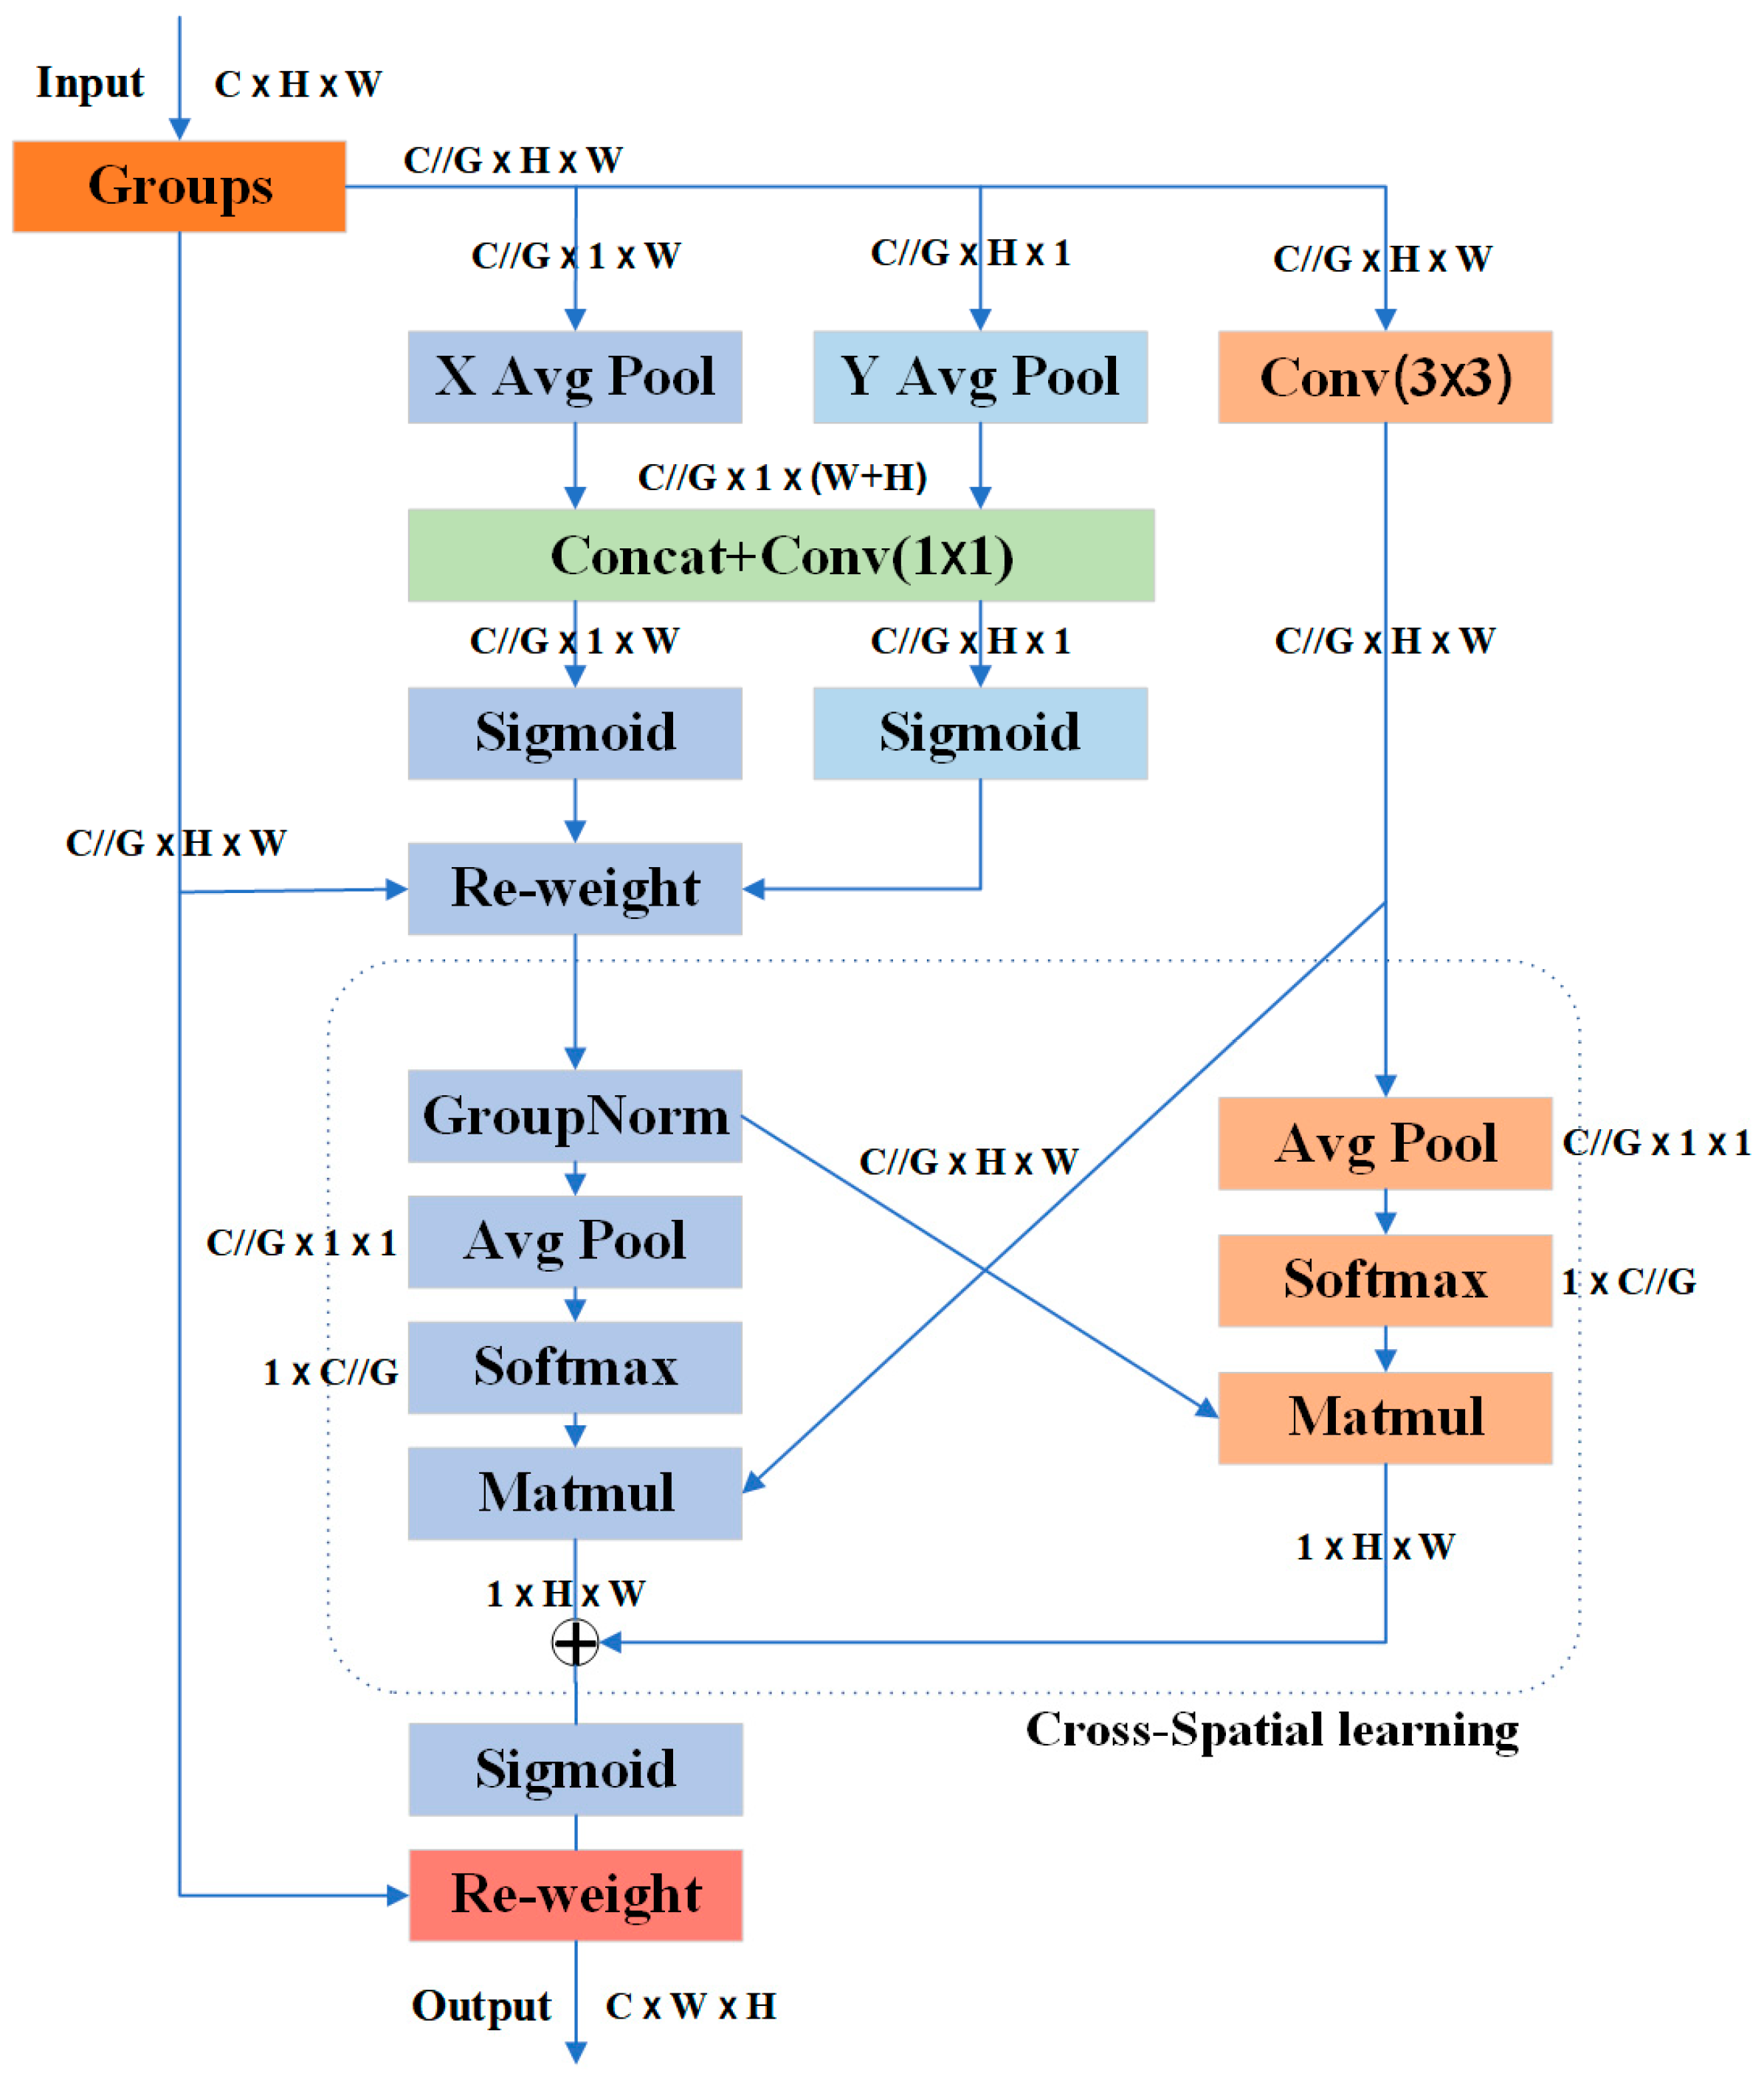
2.3.3. YOLOv8-EMA (Efficient Multi-Scale Attention)

The EMA (Efficient Multi-Scale Attention) module is a novel efficient multi-scale attention mechanism designed to improve feature representation in computer vision tasks. By combining channel and spatial information, adopting a multi-scale parallel sub-network structure, and optimizing the coordinate attention mechanism, the EMA attention module achieves a more efficient and effective feature representation, which provides important technical support for the performance improvement of computer vision tasks [47]. The EMA attention mechanism learns channel features without dimensionality reduction and enriches feature aggregation through cross-spatial learning. The parallel processing of input features through EMA avoids the problem of too deep a network and outputs high-quality feature maps under extremely limited computation. The structure of the EMA attention mechanism is shown in Figure 9. The input feature map size is C × H × W. C denotes the number of feature channels, and H and W denote the height and width of the feature map. The feature dimensions are first split into C/G for each group, and different semantic features are learned separately. Three parallel branches are used to extract features for each group. The three sets of branches are further divided into two 1 × 1 convolutional branches and one 3 × 3 convolutional branch. The two paths of the 1 × 1 branch, corresponding to the width and height of the image, undergo one-dimensional global average pooling in the corresponding directions, followed by splicing and splitting the output of the 1 × 1 convolution into two directions using a Sigmoid activation function [48], and then, cross-channel interactions are performed on the two branches. The other branch extracts multiscale features through a 3 × 3 convolution of the relative depth. The three-branch parallel structure enables EMA to not only encode cross-channel feature information, but also to preserve the precise spatial structure information into the channel. Then, it enters the cross-space learning module to improve the response speed so as to reduce the computational overhead and effectively improve the performance of the model [49], so that the model has a stronger feature-extraction capability, thus improving the detection capability of subsequent recognition. Two of the three 1x1 branches are merged into one. Two-dimensional global average pooling is performed on the two branches to encode spatial feature information, which transforms the header to the appropriate dimension. A linear transform is fitted to the outputs of the two branches, the two branches are processed in parallel, and the outputs are aggregated using a matrix dot product operation to form the first spatial attention map. Finally, the feature maps of the different sets of outputs are weighted and the global context of all pixels is highlighted. This attention mechanism can dynamically learn the weights of cherry tomato images, and for very small cherry tomato image targets, the EMA can automatically adjust the weights according to the current input, so that the model can pay more attention to the target information, thus improving the model’s performance of detecting cherry tomato targets in complex situations. The EMA does not change the size of the input image, as well as the feature dimensions, and it has strong generalizability. In this paper, this mechanism is embedded into the network and achieves high accuracy based on the dataset [50].

2.4. Training Equipment and Parameter Setting

2.4.1. Experimental Environment and Parameter Adjustment

The experiment runs on Windows 11, with the deep learning model developed using PyTorch. Table 2 details the experimental environment parameters. During training, stochastic gradient descent (SGD) is used for optimization, with an initial learning rate of 0.001, a momentum factor of 0.937, and a weight decay of 0.0005. Input images are normalized to 640 × 640, with a batch size of 32, and optimization occurs over 200 training rounds.

2.4.2. Model Evaluation Indicators

This study evaluates the performance of YOLOv8 and its improved models using the recall, precision, AP (average precision), mAP (mean average precision), and F1 score. TP (True Positive) is correctly detected cherry tomatoes. FP (False Positive) is non-cherry tomatoes mistakenly identified as cherry tomatoes. FN (False Negative) is cherry tomatoes missed by the model.
Metrics: Recall (R): the proportion of actual cherry tomatoes successfully detected (TP/(TP + FN)), indicating the model’s ability to identify relevant instances. Precision (P): the proportion of predicted cherry tomatoes that are correct (TP/(TP + FP)), reflecting the prediction accuracy. AP (Average Precision): measures the detection accuracy for a category based on precision at varying recall levels. mAP (Mean Average Precision): the average AP across all categories, with higher values indicating better overall accuracy. F1 Score: the harmonic mean of precision and recall, balancing both metrics, especially useful for imbalanced datasets. The calculation follows the formula below.
Recall = TP TP + FN
Precision = TP TP + FP
AP i = TP TP + FP N
mAP = i = 1 Q AP i Q × 100 %
F 1 = 2 × Recall × Precision Recall + Precision

3. Experiment and Result Analysis

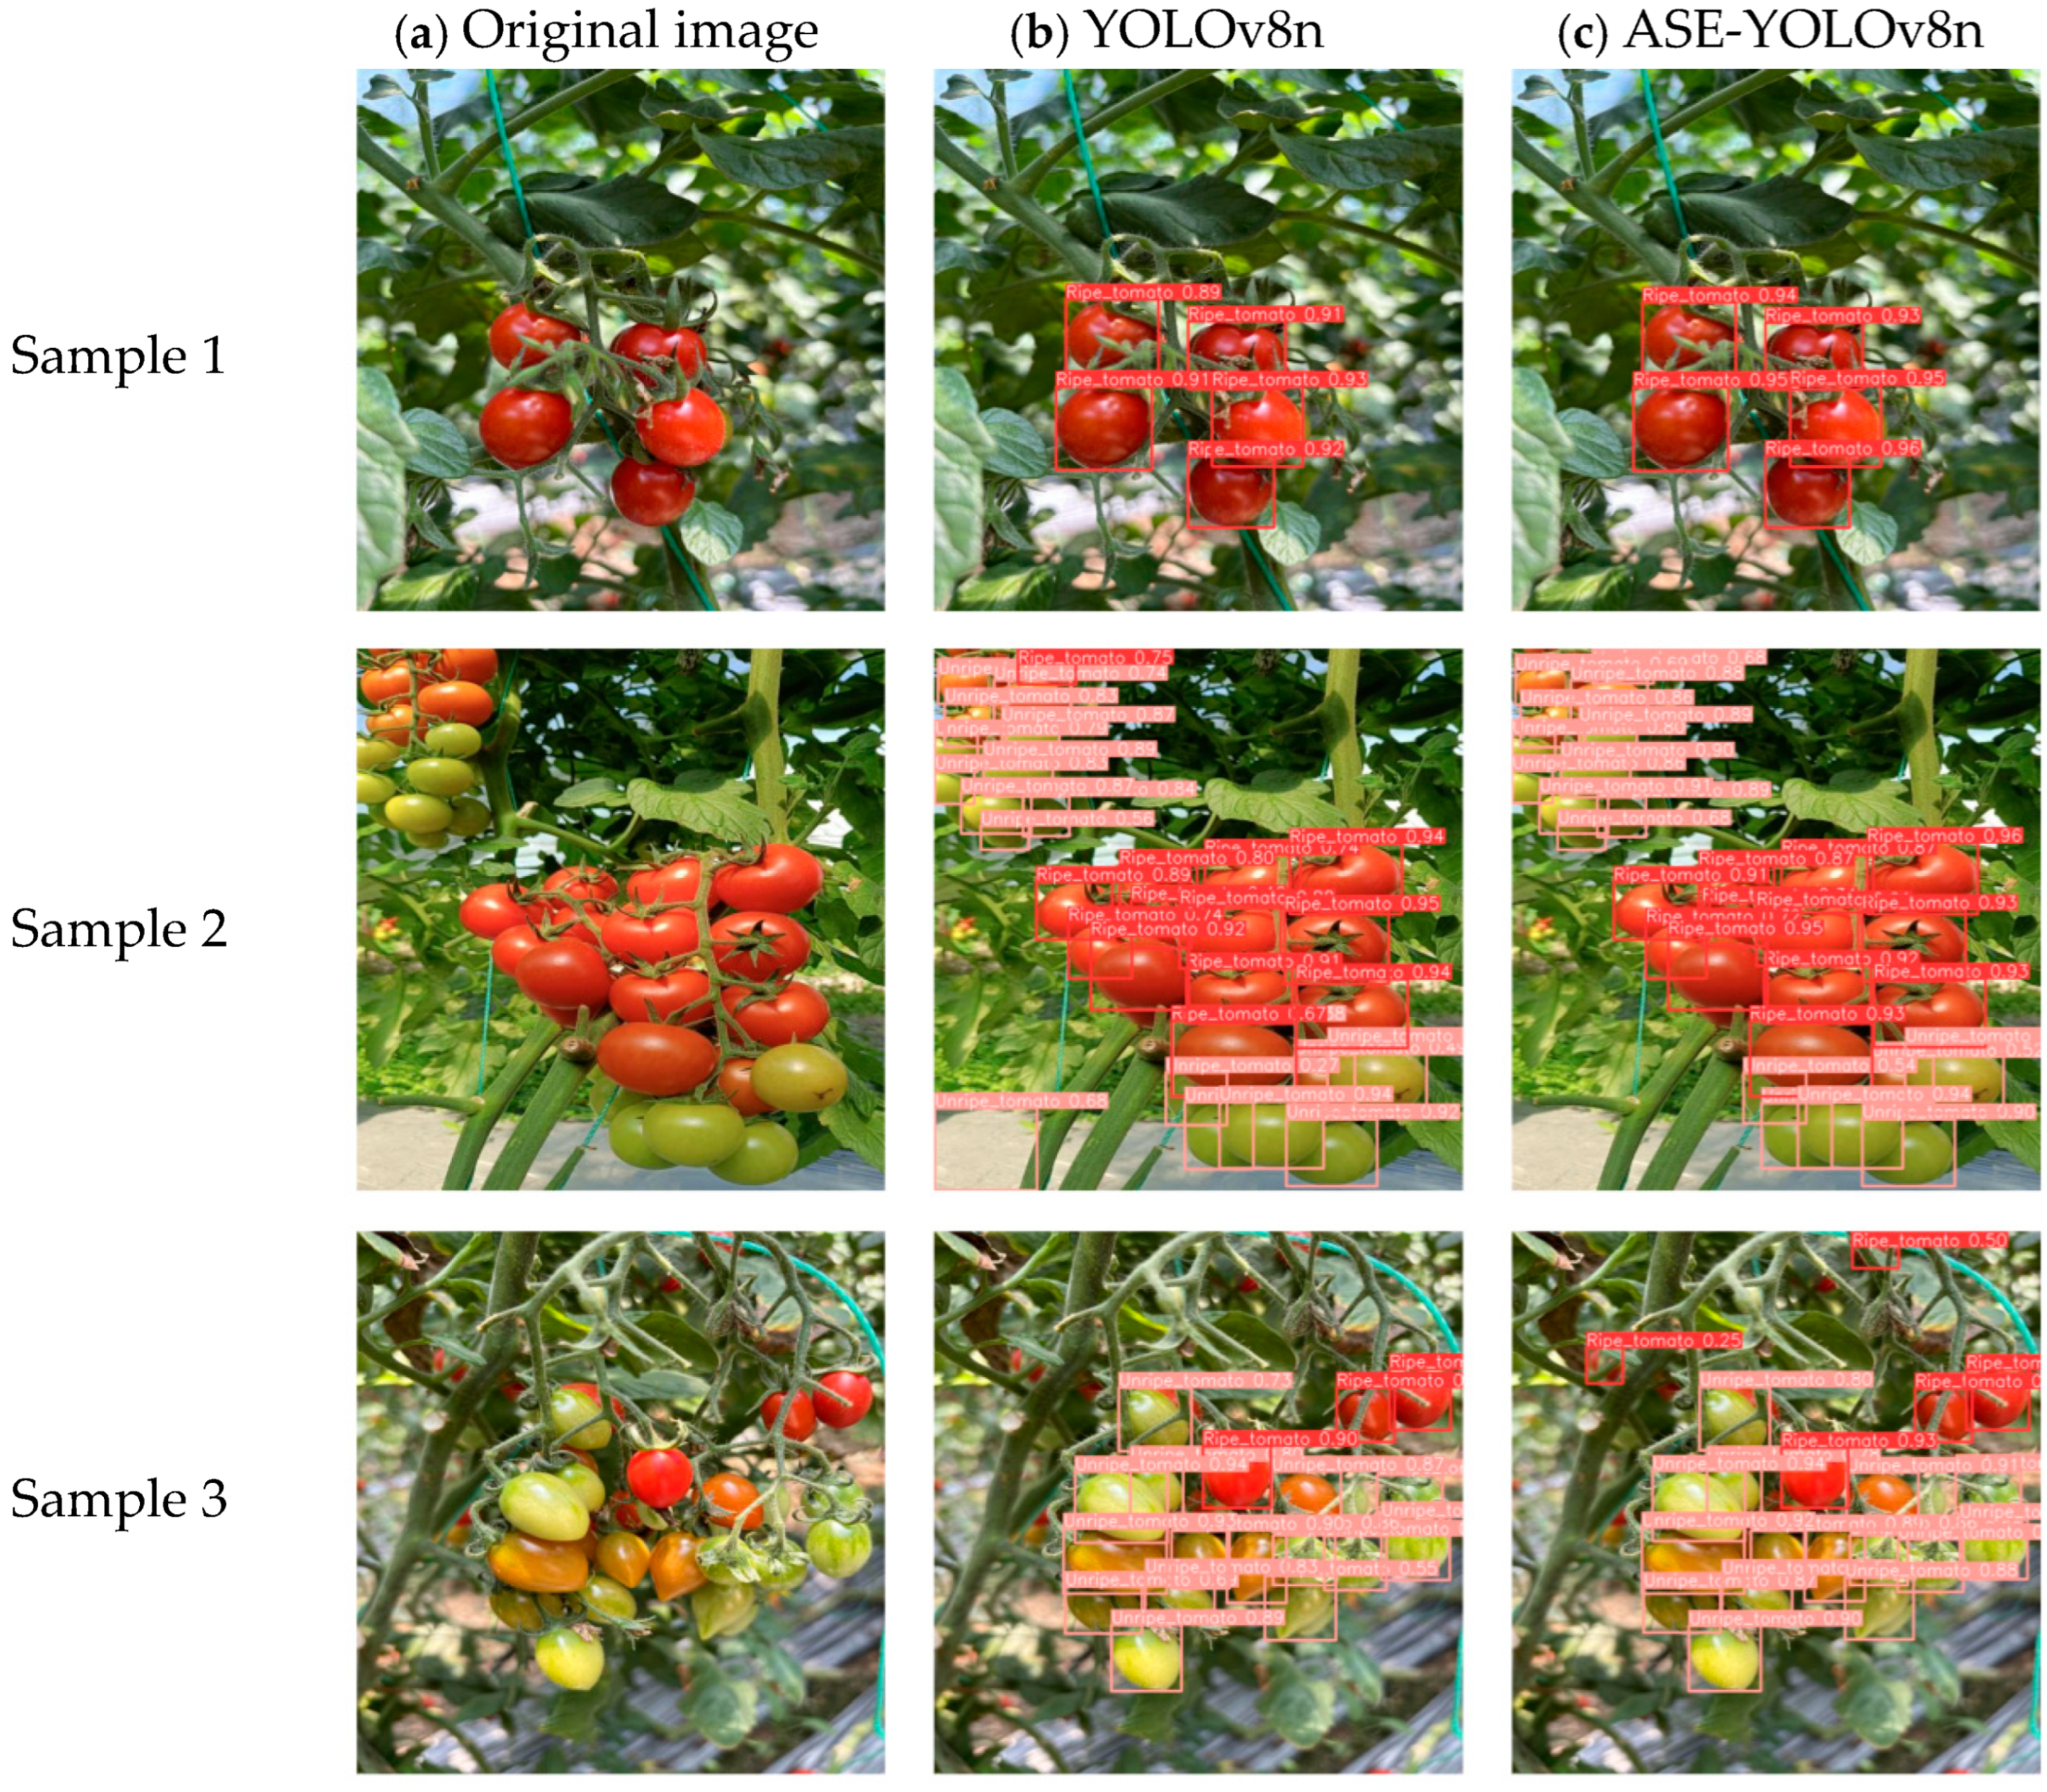
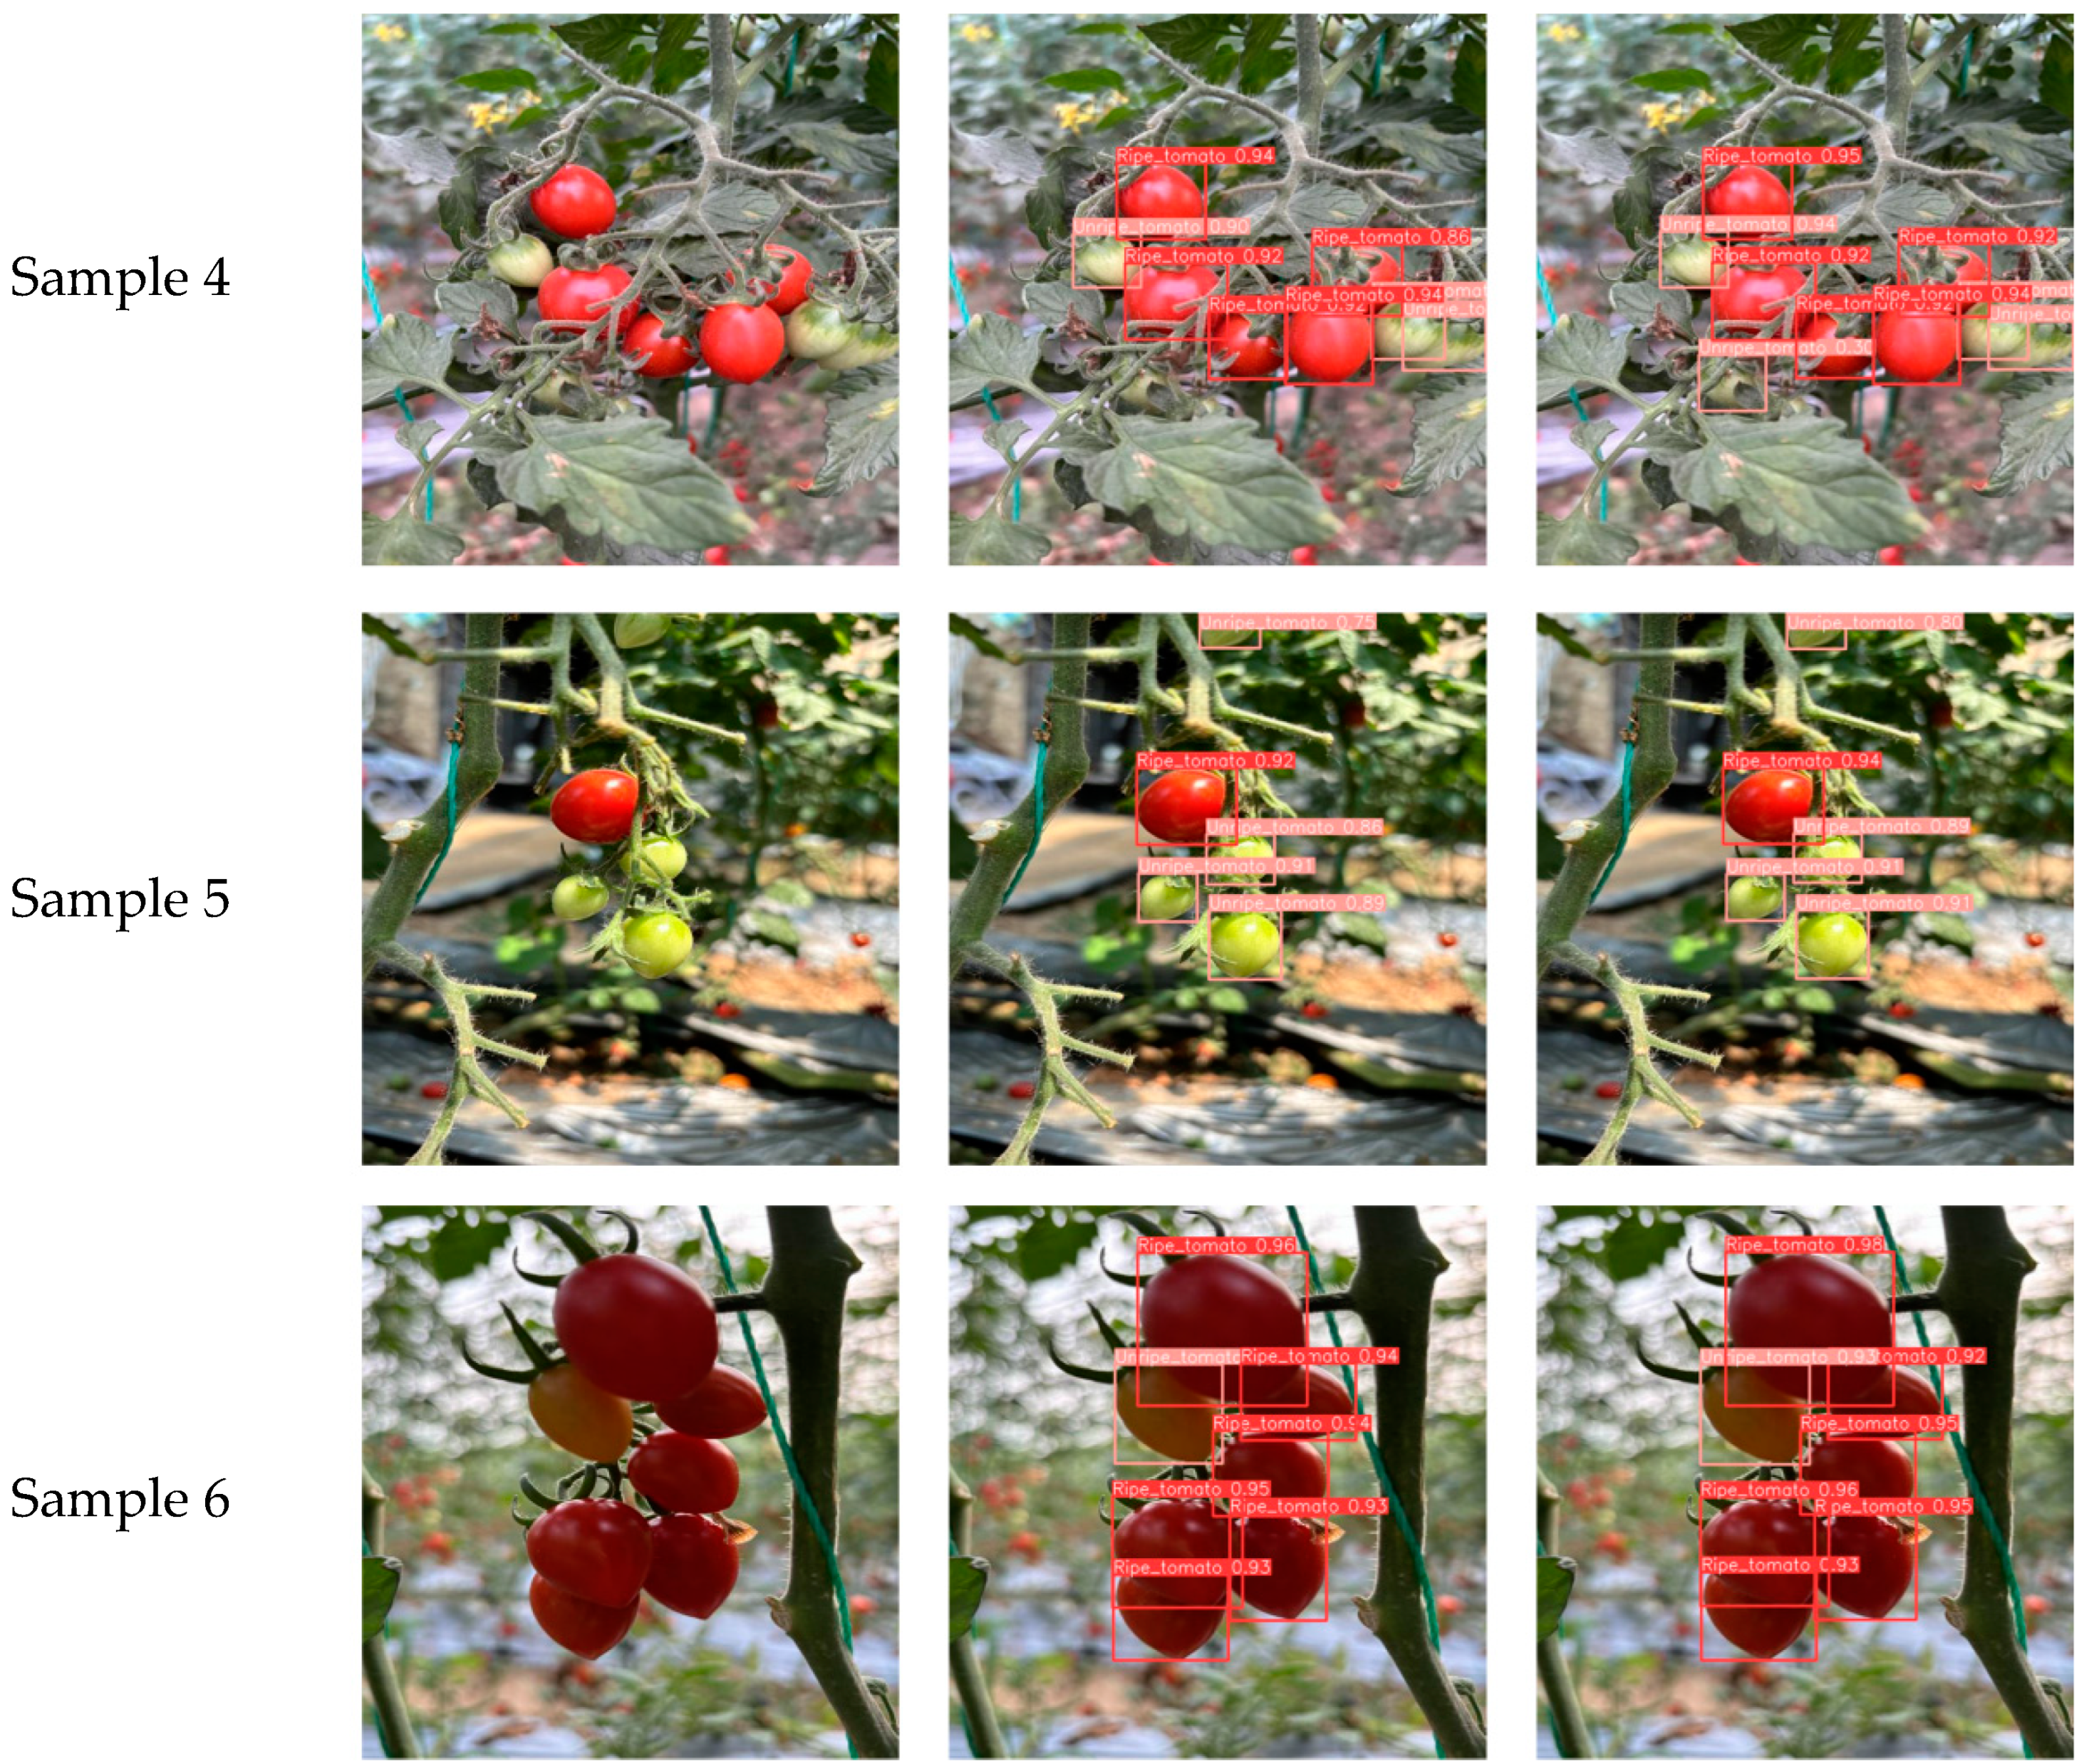
3.1. Experimental Comparison Before and After Model Improvement

Figure 10 shows the superiority of ASE-YOLOv8 in four key performance indicators, including Precision, Recall, mAP50, and mAP50-95, where mAP50 (IoU (intersection and concurrency ratio) = 0.5, which is the overlap between the predicted and real frames. When IoU ≥ 0.5, it is considered a correct detection. Calculate the APs for all categories and average them to obtain mAP@0.5, and mAP50-95 (combined evaluation at multiple IoU thresholds from 0.5 to 0.95). mAP is calculated once for each IoU threshold and finally averaged), and it continues to outperform the original YOLOv8 model over 200 training cycles. Throughout the training process, ASE-YOLOv8 consistently shows higher accuracy than YOLOv8 and is more stable, indicating its better ability to reduce false detections. In addition, ASE-YOLOv8 performs well at different IoU thresholds, especially in the mAP50 and mAP50-95 indicators, which are particularly significant in the middle and late stages of training, further improving the accuracy of target detection. Experimental results show that ASE-YOLOv8 significantly enhances the robustness of the model while improving the detection accuracy, enabling it to have better detection performance in complex environments.
Table 3 demonstrates that after 200 training epochs, the improved ASE-YOLOv8 model surpasses the original YOLOv8 in multiple evaluation metrics. Specifically, ASE-YOLOv8 enhances the overall accuracy, recall, F1 score, mAP50, and mAP50-95 by 3.18%, 1.43%, 2.30%, 1.57%, and 1.37%, respectively. For ripe classification, ASE-YOLOv8 shows notable improvements, with accuracy, recall, F1 score, mAP50, and mAP50-95 increasing by 2.40%, 1.93%, 2.17%, 2.11%, and 3.63%, respectively. The model also performs well in the unripe category, where accuracy, recall, F1 score, mAP50, and mAP50-95 improve by 3.98%, 0.93%, 2.42%, 1.94%, and 1.52%, respectively. These results highlight ASE-YOLOv8’s superior detection accuracy and precision, demonstrating substantial advancements in overall and category-specific performance.
To evaluate the proposed algorithm’s detection performance, randomly selected test images were analyzed, with results shown in Figure 11. The highlighted areas represent the network’s detection results, while the text above each box indicates the identified cherry tomato category and its corresponding confidence level. We selected six special cherry tomato dataset samples for detection to compare with the YOLOv8 standard model.
Sample 1 is a single cluster of cherry tomatoes, and the improved ASE-YOLOv8 model has higher recognition accuracy as can be seen from the figure.
Sample 2 is multiple clusters of cherry tomatoes, and, as can be seen in the upper left corner of the original YOLOv8 model recognition figure, the original YOLOv8 model makes a mistake in recognizing an unripe cherry tomato as a ripe cherry tomato, and the lower left corner of the original YOLOv8 model shows that the original YOLOv8 model makes a mistake in recognizing something that is not a cherry tomato as an unripe cherry tomato, whereas the improved ASE-YOLOv8 model avoids these mistakes and is capable of recognizing cherry tomatoes of different ripeness levels with more accuracy than the original model.
Sample 3 is an overlapping sample of cherry tomatoes, and, as can be seen from the improved ASE-YOLOv8 model recognition graph, the improved ASE-YOLOv8 model not only performs better in recognizing the accuracy of different kinds of cherry tomatoes but also is able to recognize more cherry tomatoes, indicating that the improved model is able to more comprehensively recognize the targets in the graph, which is intended to show that the improved ASE-YOLOv8 model is able to better locate cherry tomatoes and is able to achieve less misjudgment of cherry tomato recognition by the model. YOLOv8 model is able to better localize cherry tomatoes and can achieve less misclassification of cherry tomato recognition by the model.
Sample 4 is the occluded sample of cherry tomatoes; in the original YOLOv8 model recognition graph it can be seen that there are occluded cherry tomatoes that are not recognized, and from the improved ASE-YOLOv8 model recognition graph, it can be seen that the improved model is able to recognize the occluded cherry tomatoes better than the original model, which indicates that the improved ASE-YOLOv8 model has a stronger feature-extraction capability.
Sample 5 is a sample of cherry tomatoes under bright light; from the figure we can see that the improved ASE-YOLOv8 model has improved the recognition accuracy of different kinds of cherry tomatoes and can make correct recognition judgments based on some of the displayed cherry tomatoes, which indicates that the improved ASE-YOLOv8 model is more adaptive in the real scene and able to effectively cope with the complex detection task. It shows that the improved ASE-YOLOv8 model is more adaptable in real-life scenes and can effectively handle complex detection tasks.
Sample 6 is a sample of cherry tomato under dim backlight, and it can be seen from the original YOLOv8 model and the improved ASE-YOLOv8 recognition graph that the improved ASE-YOLOv8 model shows better accuracy compared to the original YOLOv8 model. The comparison between the original YOLOv8 and the improved ASE-YOLOv8 model demonstrates notable enhancements in feature extraction, contextual understanding, robustness, and generalization.
These improvements make ASE-YOLOv8 more adaptable to real-world scenarios and better equipped for complex detection tasks. The integration of the EMA attention mechanism expands the receptive field, enhancing sensitivity and adaptability for small object detection. Additionally, the ADown down-sampling module boosts accuracy in recognizing different cherry tomato types while improving feature extraction and reducing detection omissions and model parameters. By incorporating Slim-Neck in the lightweight optimization process, deployment is simplified. The improved YOLOv8 exhibits higher detection accuracy and confidence than the standard version in certain cases. However, some missed detections persist, indicating the need for further optimization to enhance the overall performance and adaptability.

3.2. Comparison of Ablation Experiments

To assess the improved algorithm’s effectiveness, seven ablation experiments were conducted using the same equipment and dataset to ensure result comparability and experimental fairness. These seven experiments include the original YOLOv8n, YOLOv8n combined with ADown, YOLOv8n combined with EMA, YOLOv8n combined with ADown and Slim-Neck, YOLOv8n combined with ADown and EMA, YOLOv8n combined with Slim-Neck and EMA, and the proposed combined method. ADown, Slim-Neck, and EMA modules were introduced to enhance YOLOv8n’s ability to recognize cherry tomato ripeness. Replacing some of the original network’s convolutions with ADown’s down-sampling module improves high-level feature capture, enhances the target detection accuracy, and reduces model complexity by lowering the parameter counts, improving efficiency in complex environments. As shown in Table 4, after adding ADown, accuracy increased from 88.65% to 90.92%, recall from 88.36% to 89.48%, F1 score from 88.50% to 90.20%, mAP50 from 94.83% to 96.03%, and mAP50-95 from 79.48% to 80.91%. Meanwhile, parameters were decreased to 2.73 M, and model weights were reduced to 5.42 MB. These improvements optimize both the detection performance and model efficiency, enhancing small-target detection like cherry tomatoes. The Slim-Neck module further reduces parameters while preserving or improving feature extraction, lowering parameters to 2.80 M, reducing model weights to 5.6 MB, and improving the accuracy to 90.21%, F1 score to 89.23%, mAP50 to 95.42%, and mAP50-95 to 80.2%. This makes Slim-Neck well-suited for lightweight applications without compromising performance. The EMA (Efficient Multi-Scale Attention) module introduces a novel and efficient multi-scale attention mechanism to improve the feature representation of the model in this task. By combining the channel and spatial information, adopting a multi-scale parallel sub-network structure, and optimizing the coordinate attention mechanism, the EMA Attention module achieves more efficient and effective feature representation. It is not only able to encode cross-channel feature information, but also able to retain the precise spatial structure information into the channel. It then enters the cross-space learning module to improve the response speed, thus reducing the computational overhead and effectively improving the performance of the model. All these do not significantly increase the computational complexity. With 3.01 M parameters and model weights of 5.95 MB, the model’s accuracy reaches 90.23%, with recall of 88.71%, an F1 score of 89.46%, mAP50 of 95.69%, and mAP50-95 of 80.21%. The EMA module enhances feature extraction, improving the recognition of cherry tomato details. Combining ADown and Slim-Neck reduces parameters to 2.52 M—a decrease of 490 K compared to the original model—while lowering model weights to 5.08 MB, demonstrating its lightweight potential without sacrificing performance. The ADown-EMA combination not only minimizes parameters but also boosts overall recognition through enhanced feature extraction. Integrating Slim-Neck and EMA further reduces parameters while improving precision and attention to fine details. The combined ADown, Slim-Neck, and EMA modules achieve superior performance: 91.83% accuracy, 89.79% recall, 90.80% F1 score, 96.40% mAP50, and 80.85% mAP50-95, with parameters at 2.52 M and model weights of 5.08 MB. This integration effectively extracts cherry tomato features in complex environments while balancing performance and efficiency. The lightweight design and attention mechanisms ensure high practicality in real-world applications. Experimental results are shown in Table 4.

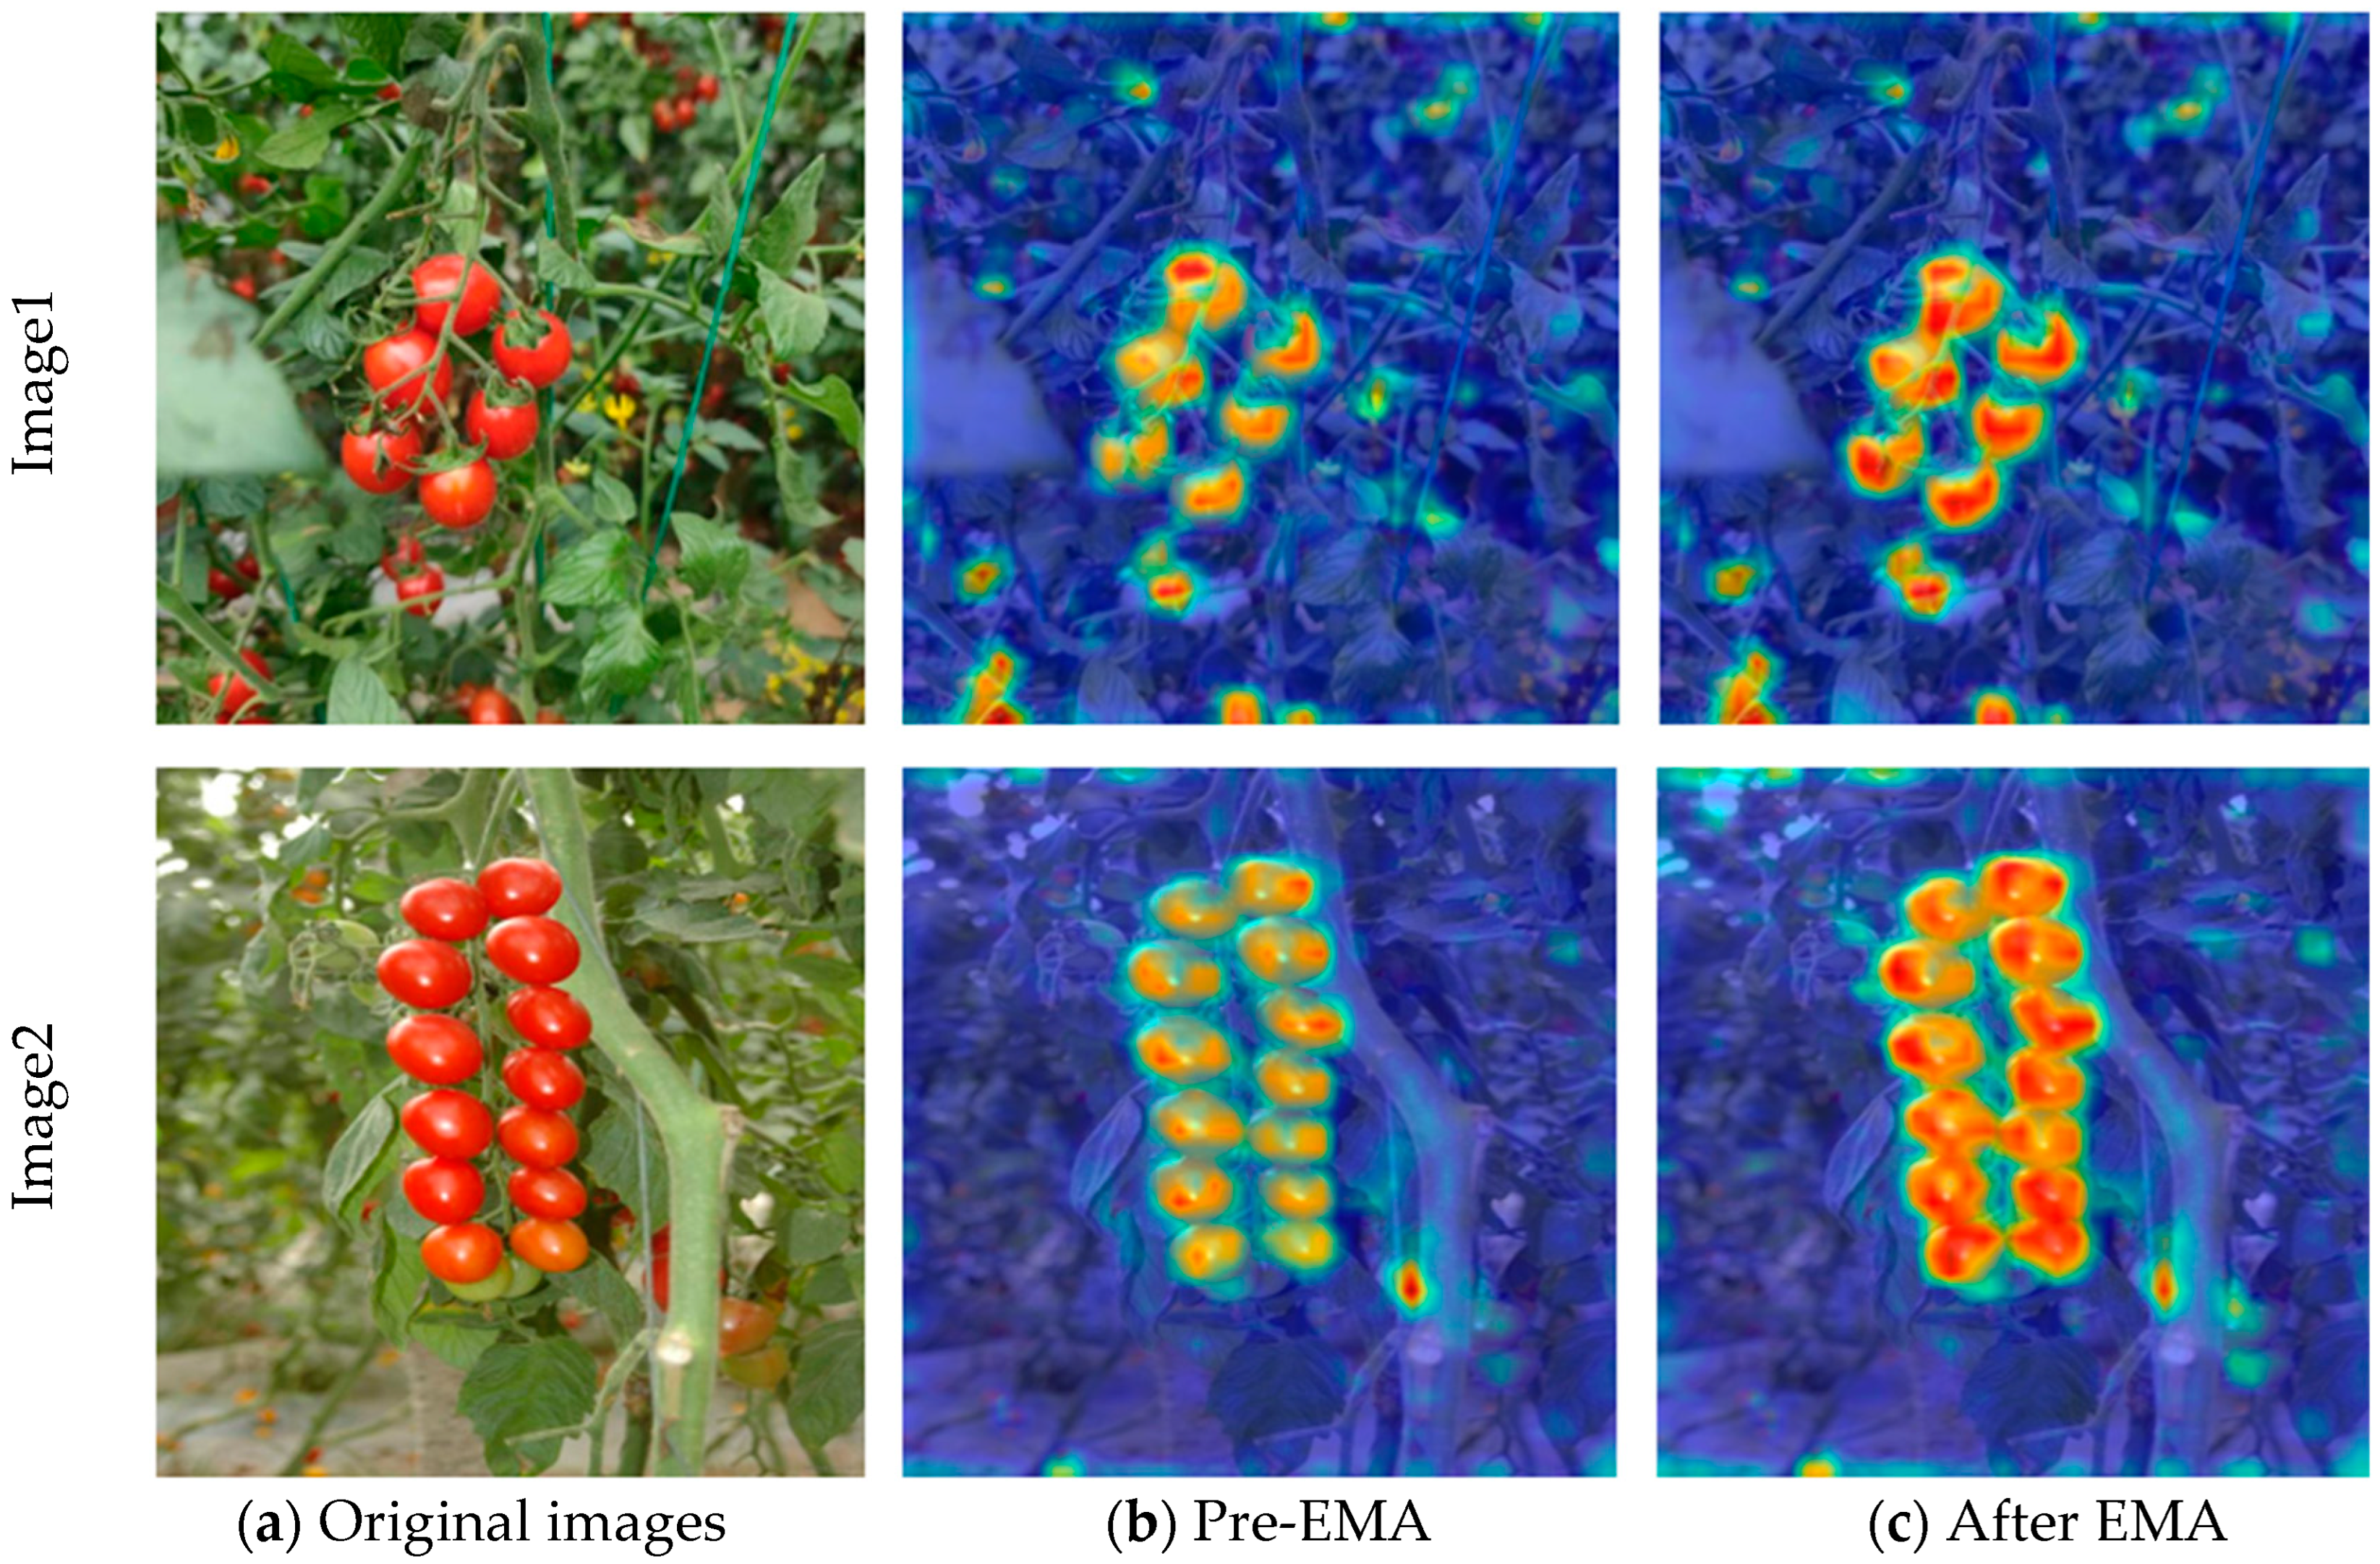
3.3. Comparison of Results for Different Attention Mechanisms

Within this research, the impact of different attentional mechanisms on the efficacy of neural network models was meticulously evaluated by integrating them into an enhanced version of the YOLOv8 architecture. The following attention mechanisms are integrated into the framework: BRA (Bi-Level Routing Attention) [51], which enhances feature representation through bi-directional information flow and dynamic routing mechanisms. This mechanism enables the more efficient capture of key features while reducing computational redundancy. CBAM (Convolutional Block Attention Module) [52], which integrates channel and spatial attention to enhance feature extraction. CA (Coordinate Attention) [53], which incorporates coordinate information to effectively capture remote dependencies. ECA (Efficient Channel Attention) [54], reduces model complexity while maintaining or improving accuracy by improving the channel attention mechanism. The advantages of ECA are capturing long-range dependencies, a small number of parameters, and being computationally efficient. The GAM (Global Attention Mechanism) [55] leverages the global context to integrate feature interdependencies. The NAM (Non-Local Attention Mechanism) [56] stabilizes attention weight computations through normalization. SE (Squeeze-and-Excitation) [57] enhances feature representation by adjusting channel weights via global average pooling. SimAM (Similarity-Aware Activation Module) [58] has a simple attention design and is particularly suitable for lightweight models to reduce computational overhead. EMA (Efficient Multi-Scale Attention) features a more efficient and effective feature representation by combining channel and spatial information, employing a multi-scale parallel sub-network structure, and optimizing the coordinate attention mechanism. Table 5 below describes the empirical results, in which most of the models equipped with the attention mechanism outperform the base model without this enhancement based on all evaluation metrics. The precision of the model with the addition of the BRA attention mechanism was 90.52%, the recall was 90.14%, the F1 score was 90.33%, the mAP50 was 95.59%, and the mAP50-95 was 80.83%.The precision of the model with the addition of the CBAM attention mechanism was 90.79%, the recall was 89.64%, the F1 score was 90.21%, the mAP50 was 96.08%, and the mAP50-95 was 80.75%. From these data, it is clear that the performance of BRA and CBAM is slightly lower than the performance of the model without the attention mechanism, which shows that the combination of partial attention mechanisms does not serve the purpose of optimizing the model. CA and ECA attention mechanisms can adaptively emphasize important parts of the input features, thus helping the network to better capture key information and improve feature representation. The precision of the model after the addition of the CA attention mechanism was 91.40%, the recall was 89.92%, the F1 score was 90.65%, the mAP50 was 96.28%, and the mAP50-95 was 80.84%.The precision of the model after adding the ECA attention mechanism was 90.97%, the recall was 89.95%, the F1 score was 90.46%, the mAP50 was 96.28%, and the mAP50-95 was 80.84%. In addition, both GAM and NAM are attentional mechanisms used in deep learning to enhance feature representation, which can improve the generalization ability of the model by focusing on important features in an adaptive manner. The accuracy of the model after the addition of the GMA attention mechanism was 90.90%, the recall was 89.95%, the F1 score was 90.42%, the mAP50 was 96.12%, and the mAP50-95 was 80.79%.The accuracy of the model with the addition of the NAM attention mechanism was 91.40%, the recall was 89.53%, the F1 score was 90.46%, the mAP50 was 96.13%, and the mAP50-95 was 80.62%. SE and SimAM effectively capture global information, enhance the contextual awareness, and improve the model performance, making it more efficient and adaptable for various applications. With SE, the model achieved 91.79% accuracy, 89.30% recall, a 90.53% F1 score, 96.23% mAP50, and 80.96% mAP50-95. Adding SimAM resulted in 91.61% accuracy, 89.58% recall, a 90.58% F1 score, 96.21% mAP50, and 80.80% mAP50-95. Comparison of the various parameters of the above six attention mechanisms shows that the accuracy aspect is improved over the no-attention-mechanism model, but the other performance aspects do not show significant improvements. EMA achieves the highest accuracy among all attention mechanisms, reaching 91.83%, with a recall of 89.79%, an F1 score of 90.80%, an mAP50 of 96.40%, and an mAP50-95 of 80.85%. While recall is slightly lower than the model without attention, EMA significantly enhances the classification accuracy for cherry tomato ripeness, demonstrating strong feature extraction and precision. These findings highlight EMA’s effectiveness in boosting the model performance, leading to its final selection. Additionally, BRA, CBMA, CA, ECA, GAM, NAM, SE, and SimAM also play key roles in improving the robustness and accuracy.
To aesthetically assess the efficacy of the model, the researchers used the Gradient-weighted Class Activation Mapping (Grad-CAM) technique [59], which depicts key regions of the model’s focus in the image. Insights into the performance of the model can be gathered by analyzing the test images with optimal weights obtained from the training phase. As shown in Figure 12, the heatmaps generated by the YOLOv8 model showed weak strength in highlighting cherry tomato features. In contrast, the heatmap from the ASE-YOLOv8 model shows enhanced focus on the target region, with clusters of highly activated regions highlighted. Combined with the EMA (Efficient Multi-Scale Attention) attention mechanism, it significantly improves the model’s ability to focus on the target domain and enhances the model’s discriminative ability.

3.4. The k-Fold Across-Validation Experiment of Improved YOLOv8 Model

In order to verify the robustness and generalization ability of the improved YOLOv8 model on different datasets, 10-fold cross-validation experiments are conducted in this section. The dataset was randomly divided into 10 parts, one of which was used as the validation set, one as the test set, and the rest as the training set, and a total of 10 sets of experiments were organized to test ripe, unripe, and total cherry tomato fruits, respectively. The specific sets of experiments are shown in Table 6. In this study, the average of these ten experiments can not only be used as the model evaluation results but also reflect the model error. As can be seen from Table 6, for cherry tomato fruit detection, the improved YOLOv8 model achieved an average p-value of 91.47%, an average R-value of 91.17%, an average F1-value of 91.32%, an average mAP50-value of 96.82%, and an average mAP50-95-value of 83.05% for the detection of ripened cherry tomato fruits. For the unripe cherry tomato fruits tested, the average p value reached 92.59%, the average R value was 88.83%, the average F1 value was 90.67%, the average mAP50 value was 95.77%, and the average mAP50-95 value was 78.51%. For the total cherry tomato fruit assay, the average p value reached 91.92%, the average R value was 89.79%, the average F1 value was 90.84%, the average mAP50 value was 96.35% and the average mAP50-95 value was 80.76%. The experimental data show that the improved YOLOv8 model exhibits stable and high fruit detection accuracy on different test sets, proving the generalizability of the model.

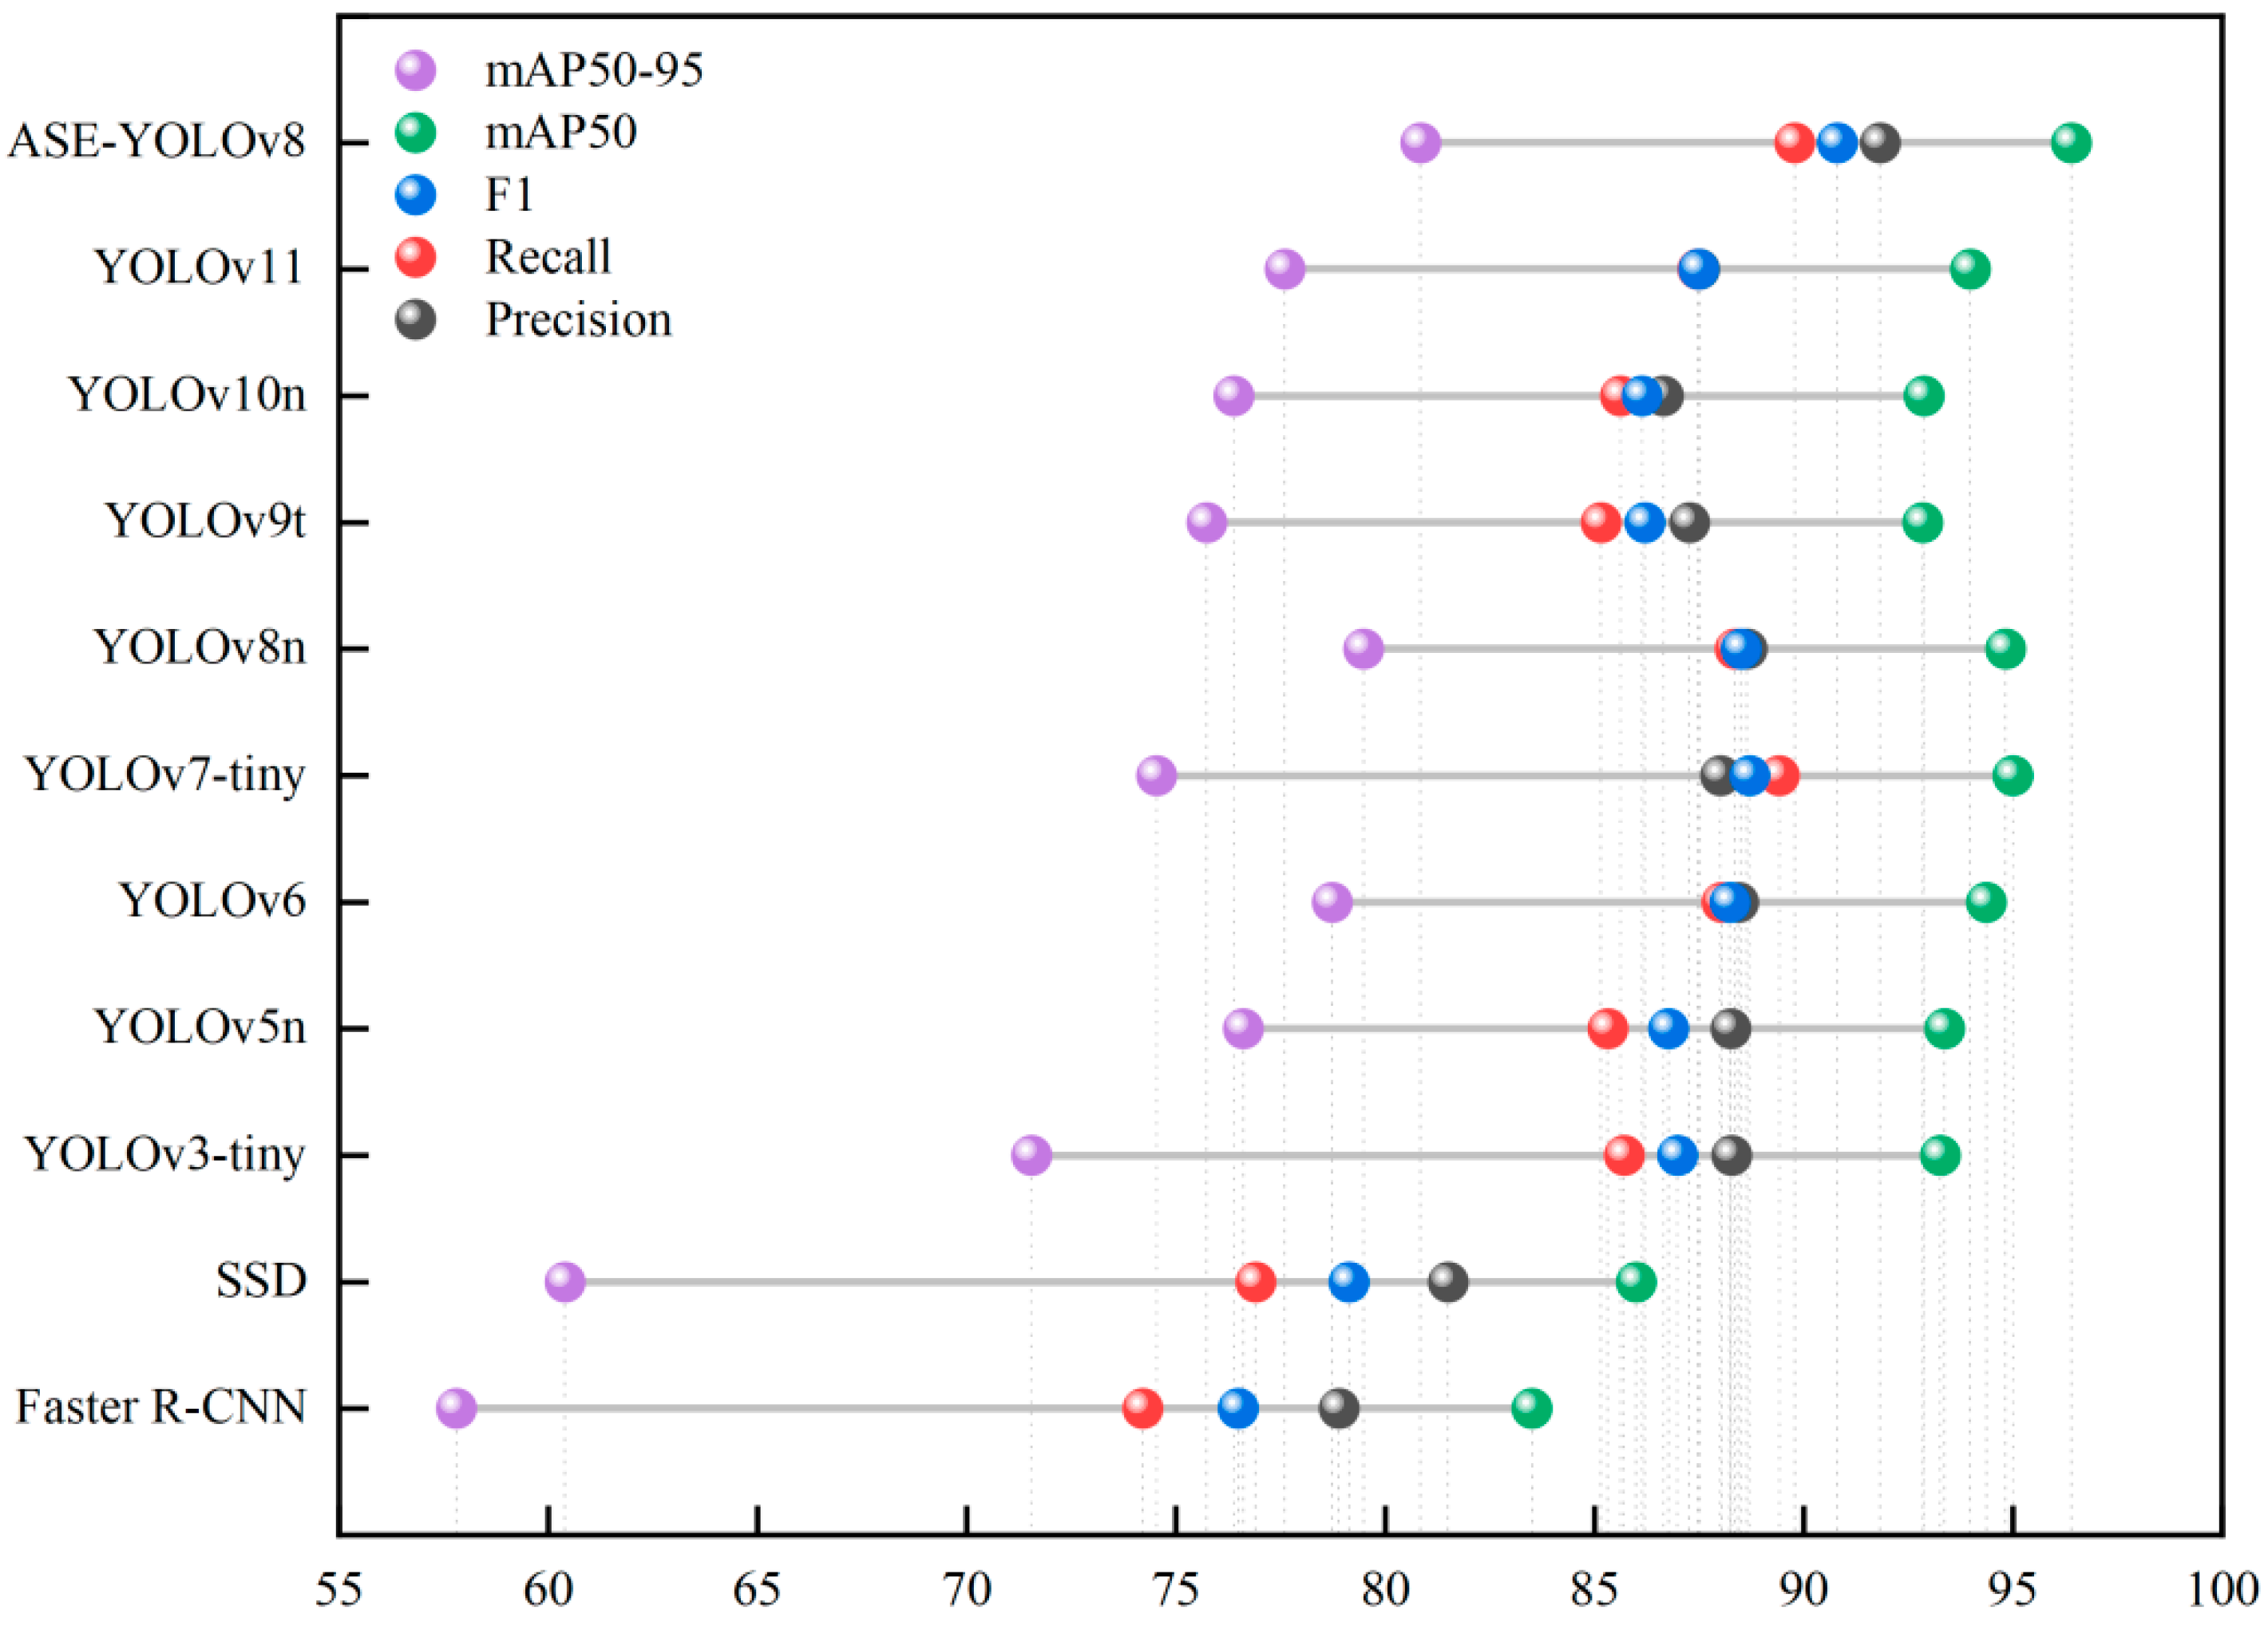
3.5. Comparative Experiments

In order to comprehensively evaluate the performance of the ASE-YOLOv8 model, we systematically compared it with various advanced object-detection models, including the earlier deep learning object detection models Faster R-CNN, SSD, and different versions of YOLOv3-tiny, YOLOv5n, YOLOv6, YOLOv7-tiny, YOLOv8n, YOLOv9t, YOLOv10, and YOLOv11. The experimental results (Table 7 and Figure 13) show that ASE-YOLOv8 performs well in multiple key performance indicators, demonstrating its high feasibility in practical applications. This study evaluated the performance of each model based on five core indicators, precision, recall, F1 score, mAP50, and mAP50-95, and analyzed the number of parameters and the file size of the model. The comprehensive comparison results show that ASE-YOLOv8 outperforms other models in most performance indicators. In contrast, although Faster R-CNN, SSD, YOLOv3-tiny, and YOLOv7-tiny perform better in some indicators, their parameters and file sizes are large, which affects their applicability in lightweight applications. For example, YOLOv3-tiny has an accuracy of 88.28%, a Recall value of 85.71%, an F1 value of 86.98%, and an mAP50 of 93.27%, whereas YOLOv7-tiny has an accuracy of 88.01%, a Recall value of 89.42%, an F1 value of 88.71%, and a mAP50 of 95.00%, with 74.53% for mAP50-95. The large number of parameters and file size of these models limit their usefulness. Although YOLOv5n, YOLOv9t, YOLOv10, and YOLOv11 have fewer parameters, they are still inferior to ASE-YOLOv8 in some performance metrics. The superior performance of ASE-YOLOv8 is largely attributed to its use of specific features and enhancements, such as ADown, Slim-Neck, and EMA. ADown replaces some common convolutions in the original network backbone, enabling the model to extract image features at a higher level, thereby improving the accuracy of object detection. At the same time, this module reduces the complexity of the model by reducing the number of parameters, improves the computational efficiency, and enhances the ability to recognize the maturity of cherry tomatoes in complex environments. As a lightweight neck network structure, Slim-Neck maintains efficient feature fusion capabilities while reducing the model parameters and file size, thereby optimizing the overall performance. In addition, the introduction of the EMA attention mechanism further enhances the feature representation ability of the model and effectively improves the detection performance. The comparative analysis results show that ASE-YOLOv8 performs well in accuracy and stability, shows higher confidence in object-detection tasks, and significantly improves the accuracy of bounding boxes and the ability to locate objects. Compared with other models, ASE-YOLOv8 has a more compact bounding box and is more accurately aligned with the detection target.

4. Discussion

The key point of this paper is to cite an updated module to improve the YOLOv8 model, the ADown module in YOLOv9, which not only enables more accurate target detection, but at the same time, reduces the model complexity by reducing the number of parameters. Hong Qiu et al. [60]. used the ADown module to replace the traditional down-sampling module in YOLOv8 for mulberry fruit detection. The results demonstrate that the introduction of this method not only enables more comprehensive multi-scale feature information extraction for small targets but also directly participates in the size of the feature map for convolutional computation, thus significantly reducing the overall computational load. In addition, the neck of the model employs a slender neck (GSConv+VoV-GSCSP) instead of the traditional C2f convolution, replacing this combination with the more efficient GSConv and replacing the C2f module with a VoV-GSCSP. Lijuan Zhang et al. [61]. referenced this model in a YOLOv8 ginseng appearance detection model based on YOLOv8, which was shown to be effective in improving the accuracy while reducing the number of model parameters. Finally, the EMA attention mechanism was introduced into the YOLOv8 model, and also different attention mechanism comparison experiments were conducted. The attention mechanisms can enhance the feature representation capability and enable the network to extract the detailed features of the target more accurately. Xin Gao et al. [62]. introduced the attention mechanism in the YOLOv8 tomato maturity detection based model. The results proved that the integrated attention mechanism can improve the detection accuracy.
With the rapid advancement of machine learning and deep learning technologies, these cutting-edge technologies are becoming increasingly widely used in various fields. The research on cherry tomato ripeness recognition has made significant progress during the last several years. Traditional cherry tomato ripeness classification methods rely heavily on manual detection, which is not only time-consuming and labor-intensive but also prone to human errors, affecting the overall efficiency and accuracy. Although existing CNN-based models have improved this problem to some extent, they still face many challenges in terms of the computational efficiency and edge device deployment. Especially in resource-constrained environments, these models may be limited by high computational requirements and storage occupancy. Therefore, further optimizing the model structure and improving the inference efficiency are crucial to improving its adaptability in practical applications. Within this research, random angle rotation, vertical flip, random brightness adjustment, noise addition, mosaic, and other data augmentation methods are used to enhance the dataset and improve the robustness of the ASE-YOLOv8 model. This approach has yielded reliable and accurate results in cherry tomato testing, ensuring good model performance under a wide range of conditions. The ASE-YOLOv8 model proposed in this paper shows significant advantages over manual classification methods and existing CNN-based classification models:
(1) The ASE-YOLOv8 model has superior detection and classification performance, which ensures the consistency and reliability of the results in cherry tomato ripeness detection and evaluation. Compared with previous studies and methods, this improvement further highlights its superiority in practical applications. Experimental results show that the method has improved accuracy, stability, and adaptability, making its application in practical scenarios more efficient and reliable. In the future, further optimization and expansion will help enhance its applicability in different environments and tasks.
(2) The ASE-YOLOv8 model is optimized for efficiency, featuring a smaller size, fewer parameters, and faster real-time processing than traditional CNN models. This reduces computational resource consumption while enhancing the operational efficiency, making it ideal for resource-limited environments like edge devices and embedded systems—crucial for real-time agricultural applications. Additionally, the model maintains high accuracy while delivering superior performance, offering an efficient solution for real-time detection tasks.
Despite these achievements, improving the model’s generalizability remains a challenge. Its validation is currently limited to specific conditions and cherry tomato varieties, restricting broader applicability. To address this, future research should focus on the following:
(1) Expanding the dataset: in order to improve the adaptability of the model, it is important to expand the dataset to include a wider range of other cherry tomato varieties, such as the American Chadwick cherry tomato, which is small and rounded, with a homogeneous fruit shape, and a distinctive appearance and shape characteristics. Such expansion should also include samples from different geographical regions and cultivation practices to ensure the diversity and representativeness of the data. The introduction of this diversity will enhance the adaptability of the model, making it easier to generalize to different forms of cherry tomatoes and a variety of environmental conditions. Further optimization and expansion of the dataset will help improve the generalization performance of the model, thereby maintaining efficient and stable detection results in complex and changing planting environments.
(2) Future research should assess the model’s performance across diverse environments, including complex scenarios, seasonal variations, and varying backgrounds. This will allow for a more comprehensive analysis of the model’s adaptability in practical applications and ensure that it can effectively cope with the changes in cherry tomatoes at different growth stages and environments. In addition, by testing the model under diverse conditions, it will help to further optimize its robustness and generalization capabilities, providing more reliable technical support for precision agriculture applications.
(3) Cross-domain application: exploring the applicability of the model in related fields, such as other agricultural types of fruits and vegetables with similar morphological characteristics, can provide insights into its generalization and validity for different types of plants. This method helps to build more generalizable models, thus promoting their application in a wider range of agricultural fields. By resolving these challenges, the generalization ability of the ASE-YOLOv8 model can be greatly enhanced, enhancing its effectiveness across a wide range of conditions and cherry tomato varieties, making it able to respond effectively to complex detection tasks.

5. Conclusions

Within this research, taking the YOLOv8 architecture as the basic framework, the ASE-YOLOv8 model has been improved and optimized in many aspects to improve its overall performance. Data-augmentation techniques, such as random rotation, vertical flip, brightness adjustment, noise addition, and mosaic, are applied to simulate the natural appearance of cherry tomatoes and their surroundings. Experimental validation confirms that the ASE-YOLOv8 model achieves significant performance gains, with key metrics including 91.83% accuracy, 89.79% recall, a 90.80% F1 score, a mAP50 of 96.40%, and a mAP50-95 of 80.85%. The model size is 2.52 M, and its weights are 5.08 MB, demonstrating strong detection and classification capabilities. Compared to earlier object-detection models, like Faster R-CNN, SSD, and various YOLO iterations (YOLOv3-tiny, YOLOv5n, YOLOv6, YOLOv7-tiny, YOLOv8n, YOLOv9t, YOLOv10, and YOLOv11), ASE-YOLOv8 delivers superior performance. Its computational efficiency makes it particularly suited for agricultural applications requiring fast processing and real-time decision-making. This study provides a practical solution for precise, automated cherry tomato maturity detection, addressing the limitations of manual methods and traditional CNN-based models. A key innovation of ASE-YOLOv8 is its efficiency based on edge devices, enabling real-time analytics in field conditions. This enhances the accuracy and reliability of crop monitoring and management, supporting advancements in smart agriculture.
It is worth noting that in cherry-tomato-harvesting practices, the fruit is not always picked at full ripeness, but rather at the early ripening stage, depending on the geographic location and distribution needs of the sales market. This differentiated picking strategy plays a crucial role in production and marketing, logistics arrangements, and revenue maximization. Therefore, this study not only focuses on the accuracy of image recognition, but also strives to bring the modeling capability close to the physiological ripening potential of fruits, so that producers can accurately judge the timing of harvesting based on the ripening state of fruits and predict the distribution pattern and rhythm of overall harvesting.
Future improvements will focus on optimizing the model by expanding sample diversity, integrating additional environmental factors, and adapting it to different cherry tomato varieties to further enhance precision agriculture technology. Additionally, more advanced deep learning methods and data augmentation techniques will be explored to further enhance the detection precision and generalization ability. The continuous advancement of this research not only helps to improve the technological level of intelligent agriculture but also provides more precise and efficient solutions for applications such as crop management, pest and disease monitoring, and yield prediction, driving modern agriculture towards intelligence and automation.

Author Contributions

Conceptualization, H.J.; Data curation, H.J. and X.W.; Formal analysis, D.L.; Funding acquisition, M.Y.; Investigation, H.W.; Methodology, H.J., Z.W., H.Y. and D.L.; Project administration, H.J.; Resources, D.L.; Software, Z.W. and H.Y.; Supervision, X.L., L.Z. and D.L.; Validation, R.L.; Visualization, W.L.; Writing—original draft, H.J.; Writing—review and editing, X.L., H.J. and L.Z. All authors have read and agreed to the published version of the manuscript.

Funding

This research was funded by the Jilin Provincial Key Laboratory of Optical Agriculture, grant number YDZJ202502CXJD006; the “Light of the Taihu Lake” scientific and technological research project for Wuxi Science and Technology Development Fund (No. K20241044); and the Wuxi University Research Start-up Fund for Introduced Talents (No. 2023r004, 2023r006).

Data Availability Statement

The data that support the findings of this study are available from the corresponding author upon reasonable request.

Acknowledgments

We thank all the authors for their support. The authors would like to thank all the reviewers who participated in this review.

Conflicts of Interest

The authors declare no conflicts of interest.

References

  1. Soare, R.; Dinu, M.; Apahidean, A.-I.; Soare, M. The evolution of some nutritional parameters of the tomato fruit during the harvesting stages. Hortic. Sci. 2019, 46, 132–137. [Google Scholar] [CrossRef]
  2. Lowenberg-DeBoer, J.; Huang, I.Y.; Grigoriadis, V.; Blackmore, S. Economics of robots and automation in field crop production. Precis. Agric. 2020, 21, 278–299. [Google Scholar] [CrossRef]
  3. Chen, Z.; Lei, X.; Yuan, Q.; Qi, Y.; Ma, Z.; Qian, S.; Lyu, X. Key Technologies for Autonomous Fruit-and Vegetable-Picking Robots: A Review. Agronomy 2024, 14, 2233. [Google Scholar] [CrossRef]
  4. Rong, J.; Wang, P.; Wang, T.; Hu, L.; Yuan, T. Fruit pose recognition and directional orderly grasping strategies for tomato harvesting robots. Comput. Electron. Agric. 2022, 202, 107430. [Google Scholar] [CrossRef]
  5. Gill, H.S.; Murugesan, G.; Mehbodniya, A.; Sajja, G.S.; Gupta, G.; Bhatt, A. Fruit type classification using deep learning and feature fusion. Comput. Electron. Agric. 2023, 211, 107990. [Google Scholar] [CrossRef]
  6. Tsouvaltzis, P.; Gkountina, S.; Siomos, A.S. Quality traits and nutritional components of cherry tomato in relation to the harvesting period, storage duration and fruit position in the truss. Plants 2023, 12, 315. [Google Scholar] [CrossRef] [PubMed]
  7. Hou, G.; Chen, H.; Jiang, M.; Niu, R. An Overview of the Application of Machine Vision in Recognition and Localization of Fruit and Vegetable Harvesting Robots. Agriculture 2023, 13, 1814. [Google Scholar] [CrossRef]
  8. Bai, Y.; Mao, S.; Zhou, J.; Zhang, B. Clustered tomato detection and picking point location using machine learning-aided image analysis for automatic robotic harvesting. Precis. Agric. 2023, 24, 727–743. [Google Scholar] [CrossRef]
  9. Mao, S.; Li, Y.; Ma, Y.; Zhang, B.; Zhou, J.; Wang, K. Automatic cucumber recognition algorithm for harvesting robots in the natural environment using deep learning and multi-feature fusion. Comput. Electron. Agric. 2020, 170, 105254. [Google Scholar] [CrossRef]
  10. Guzmán, E.; Baeten, V.; Pierna, J.A.F.; García-Mesa, J.A. Determination of the olive maturity index of intact fruits using image analysis. J. Food Sci. Technol. 2015, 52, 1462–1470. [Google Scholar] [CrossRef]
  11. Li, H.; Lee, W.S.; Wang, K. Identifying blueberry fruit of different growth stages using natural outdoor color images. Comput. Electron. Agric. 2014, 106, 91–101. [Google Scholar] [CrossRef]
  12. Zhou, R.; Damerow, L.; Sun, Y.; Blanke, M.M. Using colour features of cv.‘Gala’apple fruits in an orchard in image processing to predict yield. Precis. Agric. 2012, 13, 568–580. [Google Scholar] [CrossRef]
  13. Song, Y.; Glasbey, C.; Horgan, G.; Polder, G.; Dieleman, J.; Van der Heijden, G. Automatic fruit recognition and counting from multiple images. Biosyst. Eng. 2014, 118, 203–215. [Google Scholar] [CrossRef]
  14. Bulanon, D.; Burks, T.; Alchanatis, V. Image fusion of visible and thermal images for fruit detection. Biosyst. Eng. 2009, 103, 12–22. [Google Scholar] [CrossRef]
  15. Maldonado, W., Jr.; Barbosa, J.C. Automatic green fruit counting in orange trees using digital images. Comput. Electron. Agric. 2016, 127, 572–581. [Google Scholar] [CrossRef]
  16. Lin, G.; Tang, Y.; Zou, X.; Xiong, J.; Fang, Y. Color-, depth-, and shape-based 3D fruit detection. Precis. Agric. 2020, 21, 1–17. [Google Scholar] [CrossRef]
  17. Lin, G.; Tang, Y.; Zou, X.; Cheng, J.; Xiong, J. Fruit detection in natural environment using partial shape matching and probabilistic Hough transform. Precis. Agric. 2020, 21, 160–177. [Google Scholar] [CrossRef]
  18. Saleem, M.H.; Potgieter, J.; Arif, K.M. Automation in agriculture by machine and deep learning techniques: A review of recent developments. Precis. Agric. 2021, 22, 2053–2091. [Google Scholar]
  19. Lawal, O.M. YOLOMuskmelon: Quest for fruit detection speed and accuracy using deep learning. IEEE Access 2021, 9, 15221–15227. [Google Scholar] [CrossRef]
  20. Pal, A.; Leite, A.C.; From, P.J. A novel end-to-end vision-based architecture for agricultural human–robot collaboration in fruit picking operations. Robot. Auton. Syst. 2024, 172, 104567. [Google Scholar] [CrossRef]
  21. Ismail, N.; Malik, O.A. Real-time visual inspection system for grading fruits using computer vision and deep learning techniques. Inf. Process. Agric. 2022, 9, 24–37. [Google Scholar] [CrossRef]
  22. Kuznetsova, A.; Maleva, T.; Soloviev, V. Using YOLOv3 algorithm with pre-and post-processing for apple detection in fruit-harvesting robot. Agronomy 2020, 10, 1016. [Google Scholar] [CrossRef]
  23. Gai, R.; Chen, N.; Yuan, H. A detection algorithm for cherry fruits based on the improved YOLO-v4 model. Neural Comput. Appl. 2023, 35, 13895–13906. [Google Scholar] [CrossRef]
  24. Zhang, F.; Chen, Z.; Ali, S.; Yang, N.; Fu, S.; Zhang, Y. Multi-class detection of cherry tomatoes using improved Yolov4-tiny model. Int. J. Agric. Biol. Eng. 2023, 16, 225–231. [Google Scholar]
  25. Wang, C.; Wang, C.; Wang, L.; Wang, J.; Liao, J.; Li, Y.; Lan, Y. A lightweight cherry tomato maturity real-time detection algorithm based on improved YOLOV5n. Agronomy 2023, 13, 2106. [Google Scholar] [CrossRef]
  26. Zhang, C.; Ding, H.; Shi, Q.; Wang, Y. Grape cluster real-time detection in complex natural scenes based on YOLOv5s deep learning network. Agriculture 2022, 12, 1242. [Google Scholar] [CrossRef]
  27. Liu, Y.; Wang, H.; Liu, Y.; Luo, Y.; Li, H.; Chen, H.; Liao, K.; Li, L. A trunk detection method for camellia oleifera fruit harvesting robot based on improved YOLOv7. Forests 2023, 14, 1453. [Google Scholar] [CrossRef]
  28. Gu, B.; Wen, C.; Liu, X.; Hou, Y.; Hu, Y.; Su, H. Improved YOLOv7-tiny complex environment citrus detection based on lightweighting. Agronomy 2023, 13, 2667. [Google Scholar] [CrossRef]
  29. Zhao, Y.; Gong, L.; Zhou, B.; Huang, Y.; Liu, C. Detecting tomatoes in greenhouse scenes by combining AdaBoost classifier and colour analysis. Biosyst. Eng. 2016, 148, 127–137. [Google Scholar] [CrossRef]
  30. Wang, J.; Zhou, Y. Electronic-nose technique: Potential for monitoring maturity and shelf life of tomatoes. New Zealand J. Agric. Res. 2007, 50, 1219–1228. [Google Scholar] [CrossRef]
  31. Dai, C.; Sun, J.; Huang, X.; Zhang, X.; Tian, X.; Wang, W.; Sun, J.; Luan, Y. Application of hyperspectral imaging as a nondestructive technology for identifying tomato maturity and quantitatively predicting lycopene content. Foods 2023, 12, 2957. [Google Scholar] [CrossRef] [PubMed]
  32. Lawal, M.O. Tomato detection based on modified YOLOv3 framework. Sci. Rep. 2021, 11, 1447. [Google Scholar] [CrossRef]
  33. Li, R.; Ji, Z.; Hu, S.; Huang, X.; Yang, J.; Li, W. Tomato maturity recognition model based on improved YOLOv5 in greenhouse. Agronomy 2023, 13, 603. [Google Scholar] [CrossRef]
  34. Salim, N.O.; Mohammed, A.K. Comparative Analysis of Classical Machine Learning and Deep Learning Methods for Fruit Image Recognition and Classification. Trait. Du Signal 2024, 41, 1331–1343. [Google Scholar] [CrossRef]
  35. Goyal, K.; Kumar, P.; Verma, K. Tomato ripeness and shelf-life prediction system using machine learning. J. Food Meas. Charact. 2024, 18, 2715–2730. [Google Scholar] [CrossRef]
  36. GH T1193-2021; Standards for Supply and Distribution Cooperation in the People’s Republic of China. All China Federation of Supply and Marketing Cooperatives (ACFSMC): Beijing, China, 2021.
  37. Wang, Y.; Rong, Q.; Hu, C. Ripe Tomato Detection Algorithm Based on Improved YOLOv9. Plants 2024, 13, 3253. [Google Scholar] [CrossRef]
  38. Hasan, M.M.; Nishi, J.S.; Habib, M.T.; Islam, M.M.; Ahmed, F. A Deep Learning Approach to Recognize Bangladeshi Shrimp Species. In Proceedings of the 2023 14th International Conference on Computing Communication and Networking Technologies (ICCCNT), Delhi, India, 6–8 July 2023; pp. 1–5. [Google Scholar]
  39. Boutin, V.; Franciosini, A.; Chavane, F.; Perrinet, L.U. Pooling strategies in V1 can account for the functional and structural diversity across species. PLOS Comput. Biol. 2022, 18, e1010270. [Google Scholar] [CrossRef]
  40. Persello, C.; Stein, A. Deep fully convolutional networks for the detection of informal settlements in VHR images. IEEE Geosci. Remote Sens. Lett. 2017, 14, 2325–2329. [Google Scholar] [CrossRef]
  41. Bjorck, N.; Gomes, C.P.; Selman, B.; Weinberger, K.Q. Understanding batch normalization. In Proceedings of the 32nd Conference on Neural Information Processing Systems (NeurIPS 2018), Montréal, QC, Canada, 2–8 December 2018; Volume 31. [Google Scholar]
  42. Elfwing, S.; Uchibe, E.; Doya, K. Sigmoid-weighted linear units for neural network function approximation in reinforcement learning. Neural Netw. 2018, 107, 3–11. [Google Scholar] [CrossRef]
  43. Li, H.; Li, J.; Wei, H.; Liu, Z.; Zhan, Z.; Ren, Q. Slim-neck by GSConv: A better design paradigm of detector architectures for autonomous vehicles. arXiv 2022, arXiv:2206.02424. [Google Scholar]
  44. Chollet, F. Xception: Deep learning with depthwise separable convolutions. In Proceedings of the IEEE Conference on Computer Vision and Pattern Recognition, Honolulu, HI, USA, 21 July 2017; pp. 1251–1258. [Google Scholar]
  45. Doğan, Y. Which pooling method is better: Max, avg, or concat (Max, Avg). Commun. Fac. Sci. Univ. Ank. Ser. A2-A3 Phys. Sci. Eng. 2023, 66, 95–117. [Google Scholar] [CrossRef]
  46. Stofa, M.M.; Zulkifley, M.A.; Mohamed, N.A. Exploration of Group and Shuffle Module for Semantic Segmentation of Sea Ice Concentration. In Proceedings of the 2024 IEEE 8th International Conference on Signal and Image Processing Applications (ICSIPA), Kuala Lumpur, Malaysia, 3–5 September 2024; pp. 1–5. [Google Scholar]
  47. Li, X.; Zhong, Z.; Wu, J.; Yang, Y.; Lin, Z.; Liu, H. Expectation-maximization attention networks for semantic segmentation. In Proceedings of the IEEE/CVF International Conference on Computer Vision, Seoul, Republic of Korea, 27 October–2 November 2019; pp. 9167–9176. [Google Scholar]
  48. Menon, A.; Mehrotra, K.; Mohan, C.K.; Ranka, S. Characterization of a class of sigmoid functions with applications to neural networks. Neural Netw. 1996, 9, 819–835. [Google Scholar] [CrossRef] [PubMed]
  49. Yi, F.; Yu, Z.; Chen, H.; Du, H.; Guo, B. Cyber-physical-social collaborative sensing: From single space to cross-space. Front. Comput. Sci. 2018, 12, 609–622. [Google Scholar] [CrossRef]
  50. Ouyang, D.; He, S.; Zhang, G.; Luo, M.; Guo, H.; Zhan, J.; Huang, Z. Efficient multi-scale attention module with cross-spatial learning. In Proceedings of the ICASSP 2023—2023 IEEE International Conference on Acoustics, Speech and Signal Processing (ICASSP), Rhodes Island, Greek, 4–10 June 2023; pp. 1–5. [Google Scholar]
  51. Zhu, L.; Wang, X.; Ke, Z.; Zhang, W.; Lau, R.W. Biformer: Vision transformer with bi-level routing attention. In Proceedings of the IEEE/CVF Conference on Computer Vision and Pattern Recognition, Vancouver, BC, Canada, 17–24 June 2023; pp. 10323–10333. [Google Scholar]
  52. Woo, S.; Park, J.; Lee, J.-Y.; Kweon, I.S. Cbam: Convolutional block attention module. In Proceedings of the European Conference on Computer Vision (ECCV), Munich, Germany, 8–14 September 2018; pp. 3–19. [Google Scholar]
  53. Hou, Q.; Zhou, D.; Feng, J. Coordinate attention for efficient mobile network design. In Proceedings of the IEEE/CVF Conference on Computer Vision and Pattern Recognition, Nashville, TN, USA, 20–25 June 2021; pp. 13713–13722. [Google Scholar]
  54. Wang, Q.; Wu, B.; Zhu, P.; Li, P.; Zuo, W.; Hu, Q. ECA-Net: Efficient channel attention for deep convolutional neural networks. In Proceedings of the IEEE/CVF Conference on Computer Vision and Pattern Recognition, Seattle, WA, USA, 13–19 June 2020; pp. 11534–11542. [Google Scholar]
  55. Liu, Y.; Shao, Z.; Hoffmann, N. Global attention mechanism: Retain information to enhance channel-spatial interactions. arXiv 2021, arXiv:2112.05561. [Google Scholar]
  56. Liu, Y.; Shao, Z.; Teng, Y.; Hoffmann, N. NAM: Normalization-based attention module. arXiv 2021, arXiv:2111.12419. [Google Scholar]
  57. Hu, J.; Shen, L.; Sun, G. Squeeze-and-excitation networks. In Proceedings of the IEEE Conference on Computer Vision and Pattern Recognition, Salt Lake City, UT, USA, 18–23 June 2018; pp. 7132–7141. [Google Scholar]
  58. Yang, L.; Zhang, R.-Y.; Li, L.; Xie, X. Simam: A simple, parameter-free attention module for convolutional neural networks. In Proceedings of the International Conference on Machine Learning, Virtual Event, 18–24 July 2021; pp. 11863–11874. [Google Scholar]
  59. Selvaraju, R.R.; Cogswell, M.; Das, A.; Vedantam, R.; Parikh, D.; Batra, D. Grad-CAM: Visual explanations from deep networks via gradient-based localization. Int. J. Comput. Vis. 2020, 128, 336–359. [Google Scholar] [CrossRef]
  60. Qiu, H.; Zhang, Q.; Li, J.; Rong, J.; Yang, Z. Lightweight Mulberry Fruit Detection Method Based on Improved YOLOv8n for Automated Harvesting. Agronomy 2024, 14, 2861. [Google Scholar] [CrossRef]
  61. Zhang, L.; You, H.; Wei, Z.; Li, Z.; Jia, H.; Yu, S.; Zhao, C.; Lv, Y.; Li, D. DGS-YOLOv8: A Method for Ginseng Appearance Quality Detection. Agriculture 2024, 14, 1353. [Google Scholar] [CrossRef]
  62. Gao, X.; Ding, J.; Zhang, R.; Xi, X. YOLOv8n-CA: Improved YOLOv8n Model for Tomato Fruit Recognition at Different Stages of Ripeness. Agronomy 2025, 15, 188. [Google Scholar] [CrossRef]
Figure 1. Sample of cherry tomatoes in different scenarios.
Agronomy 15 01088 g001
Figure 2. Sample image after raw image and data enhancement.
Agronomy 15 01088 g002aAgronomy 15 01088 g002b
Figure 3. Examples of cherry tomatoes at different maturity levels.
Agronomy 15 01088 g003
Figure 4. Structure of the standard YOLOv8 network.
Agronomy 15 01088 g004
Figure 5. Improved YOLOv8 model (ASE-YOLOv8).
Agronomy 15 01088 g005
Figure 6. Conv down-sampling and ADown down-sampling structure.
Agronomy 15 01088 g006
Figure 7. GSConv module structure.
Agronomy 15 01088 g007
Figure 8. Gsbottleneck and VoVGSCSP module architecture.
Agronomy 15 01088 g008
Figure 9. EMA module structure.
Agronomy 15 01088 g009
Figure 10. Comparison of indicators before and after model improvement.
Agronomy 15 01088 g010
Figure 11. Comparison of cherry tomato detection before and after improvement.
Agronomy 15 01088 g011aAgronomy 15 01088 g011b
Figure 12. Visualization results of thermal characteristics before and after the introduction of EMA.
Agronomy 15 01088 g012
Figure 13. Comparison experiments with other models.
Agronomy 15 01088 g013
Table 1. Number of category labels before and after data enhancement.
CategoryOriginalData Enhancement
Ripe_tomato506355,342
Unripe_tomato474551,974
Table 2. Experimental environment configuration.
CategoryConfiguration
CPU12th Gen Intel Core i7-12700KF@3.60 GHz
GPUNVIDIA GeForce RTX 4060ti 16 G
System environmentWindows 11
FrameworkPytorch 2.1.0
Programming voicePython 3.8
Table 3. Improved classification results of cherry tomatoes.
LevelModelPrecision (%)Recall (%)F1 (%)mAP50 (%)mAP50-95 (%)
RipeYOLOv888.7589.1288.9394.8379.48
ASE-YOLOv891.1591.0591.1096.9483.11
UnripeYOLOv888.5487.5988.0693.9277.07
ASE-YOLOv892.5288.5290.4895.8678.59
ALLYOLOv888.6588.3688.5094.8379.48
ASE-YOLOv891.8389.7990.8096.4080.85
Table 4. Ablation experiments.
YOLOv8nADownSlim-NeckEMAPrecision (%)Recall (%)F1
(%)
mAP50 (%)mAP50-95 (%)Parameters (M)Weight (MB)
88.6588.3688.5094.8379.483.015.97
90.9289.4890.2096.0380.912.735.42
90.2188.2789.2395.4280.202.805.60
90.2388.7189.4695.6980.213.015.95
90.8490.1290.4896.1980.832.525.08
91.5189.7590.6296.1980.762.735.43
89.6889.0189.3495.5479.842.805.61
91.8389.7990.8096.4080.852.525.08
Table 5. Comparison of results of different attention mechanisms.
Attention MechanismsPrecision (%)Recall (%)F1 (%)mAP50 (%)mAP50-95 (%)
No90.8490.1290.4896.1980.83
BRA90.5290.1490.3395.9080.73
CBAM90.7989.6490.2196.0880.75
CA91.4089.9290.6596.2880.84
ECA90.9789.9590.4696.0880.78
GAM90.9089.9590.4296.1280.79
NAM91.4089.5390.4696.1380.62
SE91.7989.3090.5396.2380.96
SimAM91.6189.5890.5896.2180.80
EMA91.8389.7990.8096.4080.85
Table 6. Ten-fold cross-validation experiment of the improved YOLOv8 model.
GroupTrain
Set
Val
Set
Test
Set
CategoryPrecision
(%)
Recall
(%)
F1
(%)
mAP50
(%)
mAP50-95
(%)
1 Ripe92.0590.4791.2596.5483.62
1, 2, 3, 4, 5, 6, 7, 8910Unripe
All
93.22
92.31
87.91
90.35
90.49
91.32
95.18
96.44
78.54
80.02
2 Ripe91.0691.2291.1496.7182.63
2, 3,4, 5, 6, 7, 8, 1091Unripe
All
93.32
92.68
89.11
90.03
91.17
91.34
96.55
97.27
78.58
80.64
3 Ripe91.4191.2191.3196.0582.19
1, 3, 4, 5, 6, 7, 8, 1092Unripe
All
92.72
92.18
88.73
88.88
90.68
90.50
95.27
95.69
78.57
81.37
4 Ripe91.1790.9191.0497.0282.93
1, 2, 4, 5, 6, 7, 8, 1093Unripe
All
92.37
92.33
88.60
90.11
90.45
91.21
96.01
96.94
78.79
80.76
5 Ripe92.4592.1092.2796.7482.82
1, 2, 3, 5, 6, 7, 8, 1094Unripe
All
92.05
91.10
88.57
89.94
90.28
90.52
96.03
96.85
77.76
80.42
61, 2, 3, 4, 6, 7, 8, 1095Ripe
Unripe
All
90.85
92.32
92.15
91.38
88.87
89.25
91.11
90.56
90.68
97.29
95.94
96.61
83.58
78.41
80.65
71, 2, 3, 4, 5, 7, 8, 1096Ripe
Unripe
All
91.39
92.53
91.56
92.06
88.86
89.55
91.72
90.66
90.54
96.81
96.19
95.50
83.09
78.62
81.02
81, 2, 3, 4, 5, 6, 8, 1097Ripe
Unripe
All
92.11
92.59
91.52
90.67
89.12
89.60
91.38
90.82
90.55
97.14
95.38
96.44
83.03
78.59
81.78
91, 2, 3, 4, 5, 6, 7, 1098Ripe
Unripe
All
90.98
92.39
91.55
91.09
89.36
90.71
91.03
90.85
91.13
96.86
96.28
95.89
83.43
78.82
79.71
101, 2, 3, 4, 5, 6, 7, 8109Ripe
Unripe
All
91.27
92.35
91.77
90.54
89.14
89.50
90.90
90.72
90.62
97.03
94.88
95.86
83.21
78.46
81.20
Ave. Ripe
Unripe
All
91.47
92.59
91.92
91.17
88.83
89.79
91.32
90.67
90.84
96.82
95.77
96.35
83.05
78.51
80.76
Table 7. Comparison experiments with other models.
ModelPrecision (%)Recall (%)F1
(%)
mAP50
(%)
mAP50-95 (%)Parameters (M)Weight (MB)
Faster R-CNN78.9074.2076.4883.5057.8028.48113.92
SSD81.5076.9079.1386.0060.4014.3457.36
YOLOv3-tiny88.2885.7186.9893.2771.5512.1323.20
YOLOv5n88.2685.3286.7793.3776.612.505.04
YOLOv688.4488.0488.2494.3678.734.238.30
YOLOv7-tiny88.0189.4288.7195.0074.536.0211.70
YOLOv8n88.6588.3688.5094.8379.483.015.97
YOLOv9t87.2785.1686.2092.8575.731.974.44
YOLOv1086.6585.6286.1392.8876.382.705.50
YOLOv1187.5187.4787.4993.9977.602.585.23
ASE-YOLOv891.8389.7990.8096.4080.852.525.08
Disclaimer/Publisher’s Note: The statements, opinions and data contained in all publications are solely those of the individual author(s) and contributor(s) and not of MDPI and/or the editor(s). MDPI and/or the editor(s) disclaim responsibility for any injury to people or property resulting from any ideas, methods, instructions or products referred to in the content.

