1. Introduction
Olives are one of the four major woody oil crops and are widely cultivated in regions such as Longnan in Gansu, Dazhou in Sichuan, Lijiang in Yunnan, and Langzhong in Sichuan, China. Olive fruits can be pressed to extract olive oil, which is rich in unsaturated fatty acids and holds significant economic value [
1,
2]. Currently, a major factor limiting the development of the olive industry is its reliance on manual harvesting, which is costly and inefficient and often fails to ensure that the fruits are picked at their optimal ripeness. Therefore, there is an urgent need for automated harvesting methods. An automatic ripeness-detection system with high recognition accuracy is of great importance for identifying the areas where fruits at different ripeness levels are distributed and achieving automated olive harvesting.
Traditional methods for detection of fruit ripeness rely primarily on manual inputs from experienced individuals or image-processing techniques based on shallow features such as color and texture [
3,
4,
5]. Alamprese et al. proposed a classification model based on Fourier Transform Near-Infrared (FT-NIR) spectroscopy of whole olive fruits to predict their values on the olive-ripeness index, achieving sensitivity and specificity values both exceeding 81% [
6]. Lal et al. introduced a method for automatic detection and classification of apple ripeness based on color features. Image-processing techniques were applied to extract color components of apples, and an artificial neural network was used as a classifier to identify and count ripe and unripe apples based on these components. The proposed model achieved an accuracy of 98.1% [
7]. SriMulyani et al. applied a fuzzy model to classify the ripeness levels of Fuji apples and described its accuracy. The fuzzy model output categorized the ripeness of Fuji apples in three classes: unripe, semi-ripe, and ripe. The accuracy for test data was 85.71%, with an error rate of 14.29% [
8]. Min et al. proposed a digital image-processing method, testing over 100 mango samples at six different ripeness stages. A total of 24 image features were extracted, and the most informative feature set was selected based on correlation and information gain. Classification was performed using a decision tree and achieved accuracy of up to 96% [
9]. Mahmod et al. developed a novel model for mango classification. The grading system was programmed with a color sensor to analyze mango-ripeness indicators. The decision process employed fuzzy logic to train the data and classify the mangoes simultaneously. The proposed model achieved over 85% accuracy in automatically distinguishing among three different categories of mangoes [
10]. However, these methods have various limitations: they are susceptible to interference from variations in lighting intensity, as well as from leaf occlusion and fruit overlap, resulting in poor robustness in complex natural scenes; they struggle to capture variations in surface features caused by wax-layer reflections and shadows; and their reliance on manually designed features leads to insufficient generalization across different varieties and growing environments.
In recent years, methods for detection of fruit ripeness based on deep learning have made significant progress through their ability to autonomously learn features [
11,
12,
13,
14]. BADEKA et al. proposed an improved algorithm for detection of grape ripeness that integrated a lightweight network and attention mechanism with YOLOv7, significantly reducing the model’s parameter count [
15]. To achieve automated detection of fruit and fruit-cluster ripeness, Chen et al. introduced an improved multi-task deep convolutional neural network (DCNN) detection model based on YOLOv7. Experimental results demonstrated that MTD-YOLOv7 achieved an overall score of 86.6% in multi-task learning, with an average inference time of 4.9 ms [
16]. Zhu et al. addressed the issues of low efficiency in detection of camellia fruit ripeness and the complexity of target-detection models, which hinder deployment on selective harvesting robots, by proposing an improved lightweight You Only Look Once model (YOLO-LM) based on YOLOv7-tiny for detecting camellia fruit ripeness in orchards [
17]. Zhu et al. proposed a novel model, Olive-EfficientDet, for detecting the ripeness of multi-variety olive fruits in orchard environments. Experimental results showed that Olive-EfficientDet provides an effective method for detection of olive fruit ripeness in orchard environments. Additionally, Olive-EfficientDet demonstrated strong adaptability to complex lighting, occlusion, and overlap in uncontrolled and challenging orchard environments [
18]. To achieve accurate, fast, and robust recognition of blueberry fruit ripening stages for edge devices such as orchard-inspection robots, Xiao et al. proposed a lightweight detection method based on an improved YOLOv5 algorithm. Experimental results indicated that this method could effectively detect blueberry fruits and identify their ripening stages in orchard environments. The average recall rate (R) was 92.0%, and the mean average precision (mAP) at a threshold of 0.5 was 91.5%. The average detection speed was 67.1 frames per second (fps) [
19].
However, the existing research still faces challenges: the low pixel proportion of fruits in images leads to insufficient feature extraction for small targets by current models, resulting in missed or false detections. Additionally, the large parameter count of these models makes deployment to mobile harvesting equipment in the field difficult. To address these issues, this paper proposes a lightweight algorithm for the detection and grading of olive ripeness. While maintaining the detection accuracy of the network, the algorithm significantly enhances the model’s advantages in terms of its light weight, endowing it with excellent potential for practical deployment. This study aims to provide a reference for the development of automated olive-harvesting technologies. The contributions of this paper are as follows:
Innovative detection algorithm. We developed a lightweight algorithm for the detection and grading of olive maturity based on an improved YOLOv11n, incorporating EfficientNet-B0, an LSKA attention mechanism, and BiFPN to improve detection accuracy, reduce model size and computational complexity, speed up reasoning, and provide efficient technical support for maturity grading.
Following a comparison of the mainstream YOLO series algorithms, YOLOv11n was selected as the basic model because of its obvious advantages in initial detection performance, which lay the foundation for subsequent improvement.
Key factor analysis. Following an in-depth study of the impact of different backbone networks and attention mechanisms on detection models, it was found that EfficientNet-B0 can ensure accuracy while keeping the model lightweight and that LSKA can effectively improve the model’s detection performance.
Comprehensive performance verification. The comprehensive performance analysis and comparative experiment conducted on the improved model showed that it has outstanding advantages in terms of its light weight, high detection speed and capacity for small-object detection in complex backgrounds; additionally, it has good potential for deployment and application, where it could effectively promote the automation of olive picking.
2. Materials and Methods
2.1. Data Collection and Processing
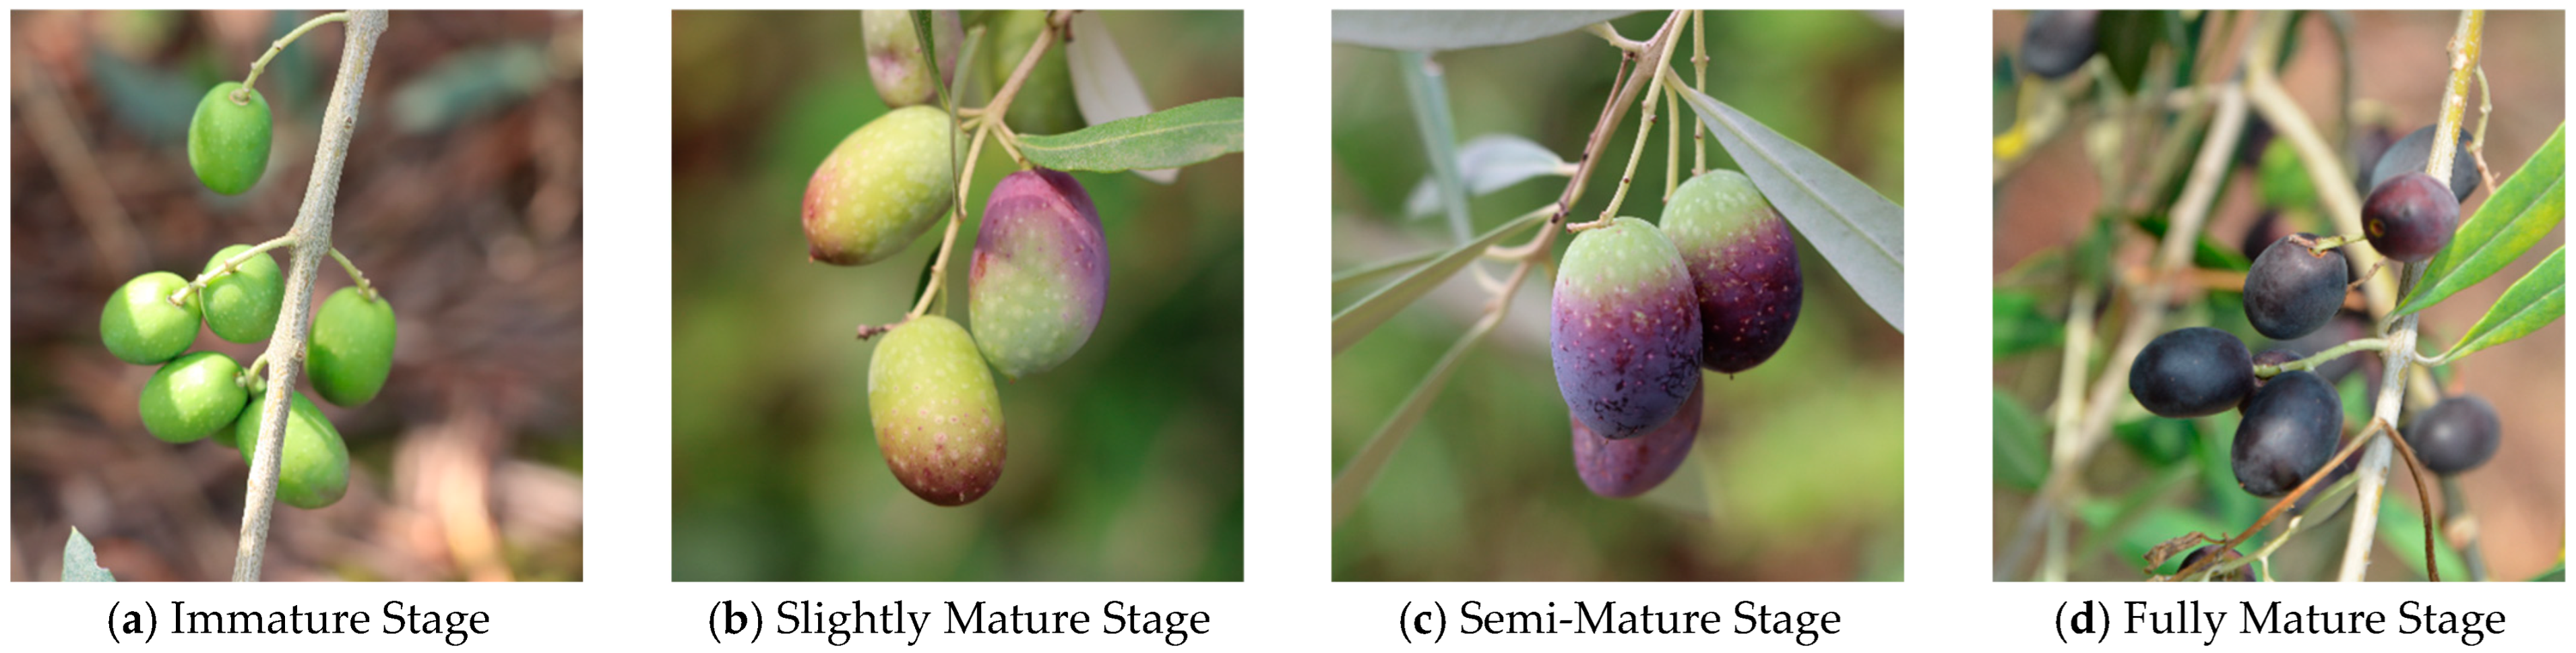
The olive images were collected from the Olive Demonstration Garden in Jintang County, Chengdu City, Sichuan Province, China, under favorable conditions with ample light and an ambient temperature of approximately 22 °C. The images were captured using a smartphone at distances ranging from 20 cm to 50 cm, resulting in a total of 349 raw images saved in .jpg format. The constructed dataset includes images of olives at different maturity levels captured from various distances. The olives in the images are mostly small to medium-sized targets, although some severely occluded smaller targets were also included. Olives mature in batches, and typically, each cluster contains one to four maturity levels: fully mature (black fruit), semi-mature (purple fruit), slightly mature (color transition), and immature (green fruit), as shown in
Figure 1.
In this study, the annotation tool LabelImg was used to annotate the images in the PascalVOC dataset format, generating annotation files in .txt format. Training deep neural networks requires a large amount of data, as an insufficient dataset cannot adequately train the network. Therefore, data augmentation was applied to the collected data. In this study, flipping, scaling, translation, rotation, mixing and other methods were used to transform the collected olive images to expand the dataset. In the flipping operation, two methods were used: horizontal flipping and vertical flipping. Horizontal flipping involved flipping the image left and right, with the vertical central axis of the image as the axis of symmetry, and vertical flipping involved flipping the image up and down, with the horizontal central axis as the axis of symmetry; scaling operations included zooming in and zooming out, with the scaling factor set in the range 0.6–1.8; translation included horizontal translation and vertical translation, with the image moved by setting random pixel values in the horizontal and vertical directions; rotation was carried out at random angles ranging from 0 to 30; mixing involves fusing two different images in a certain proportion, the mixing factor set to 0.3. Through these methods, the sample set was expanded to 1745 images and randomly divided into training datasets (1221 images), validation sets (349 images), and test sets (175 images), for a ratio of 7:2:1. The data-enhanced dataset also contained the original images. In the enhanced datasets, the numbers of olives in the immature, micro-mature, semi-mature, and mature stages were 3497, 5314, 4503, and 2674, respectively.
2.2. Improved YOLOv11n Model
This study tested the detection performance of five different versions of the model, namely YOLOv7-tiny, YOLOv8n, YOLOv9-tiny, YOLOv10n, and YOLOv11n [
20]. The results are shown in
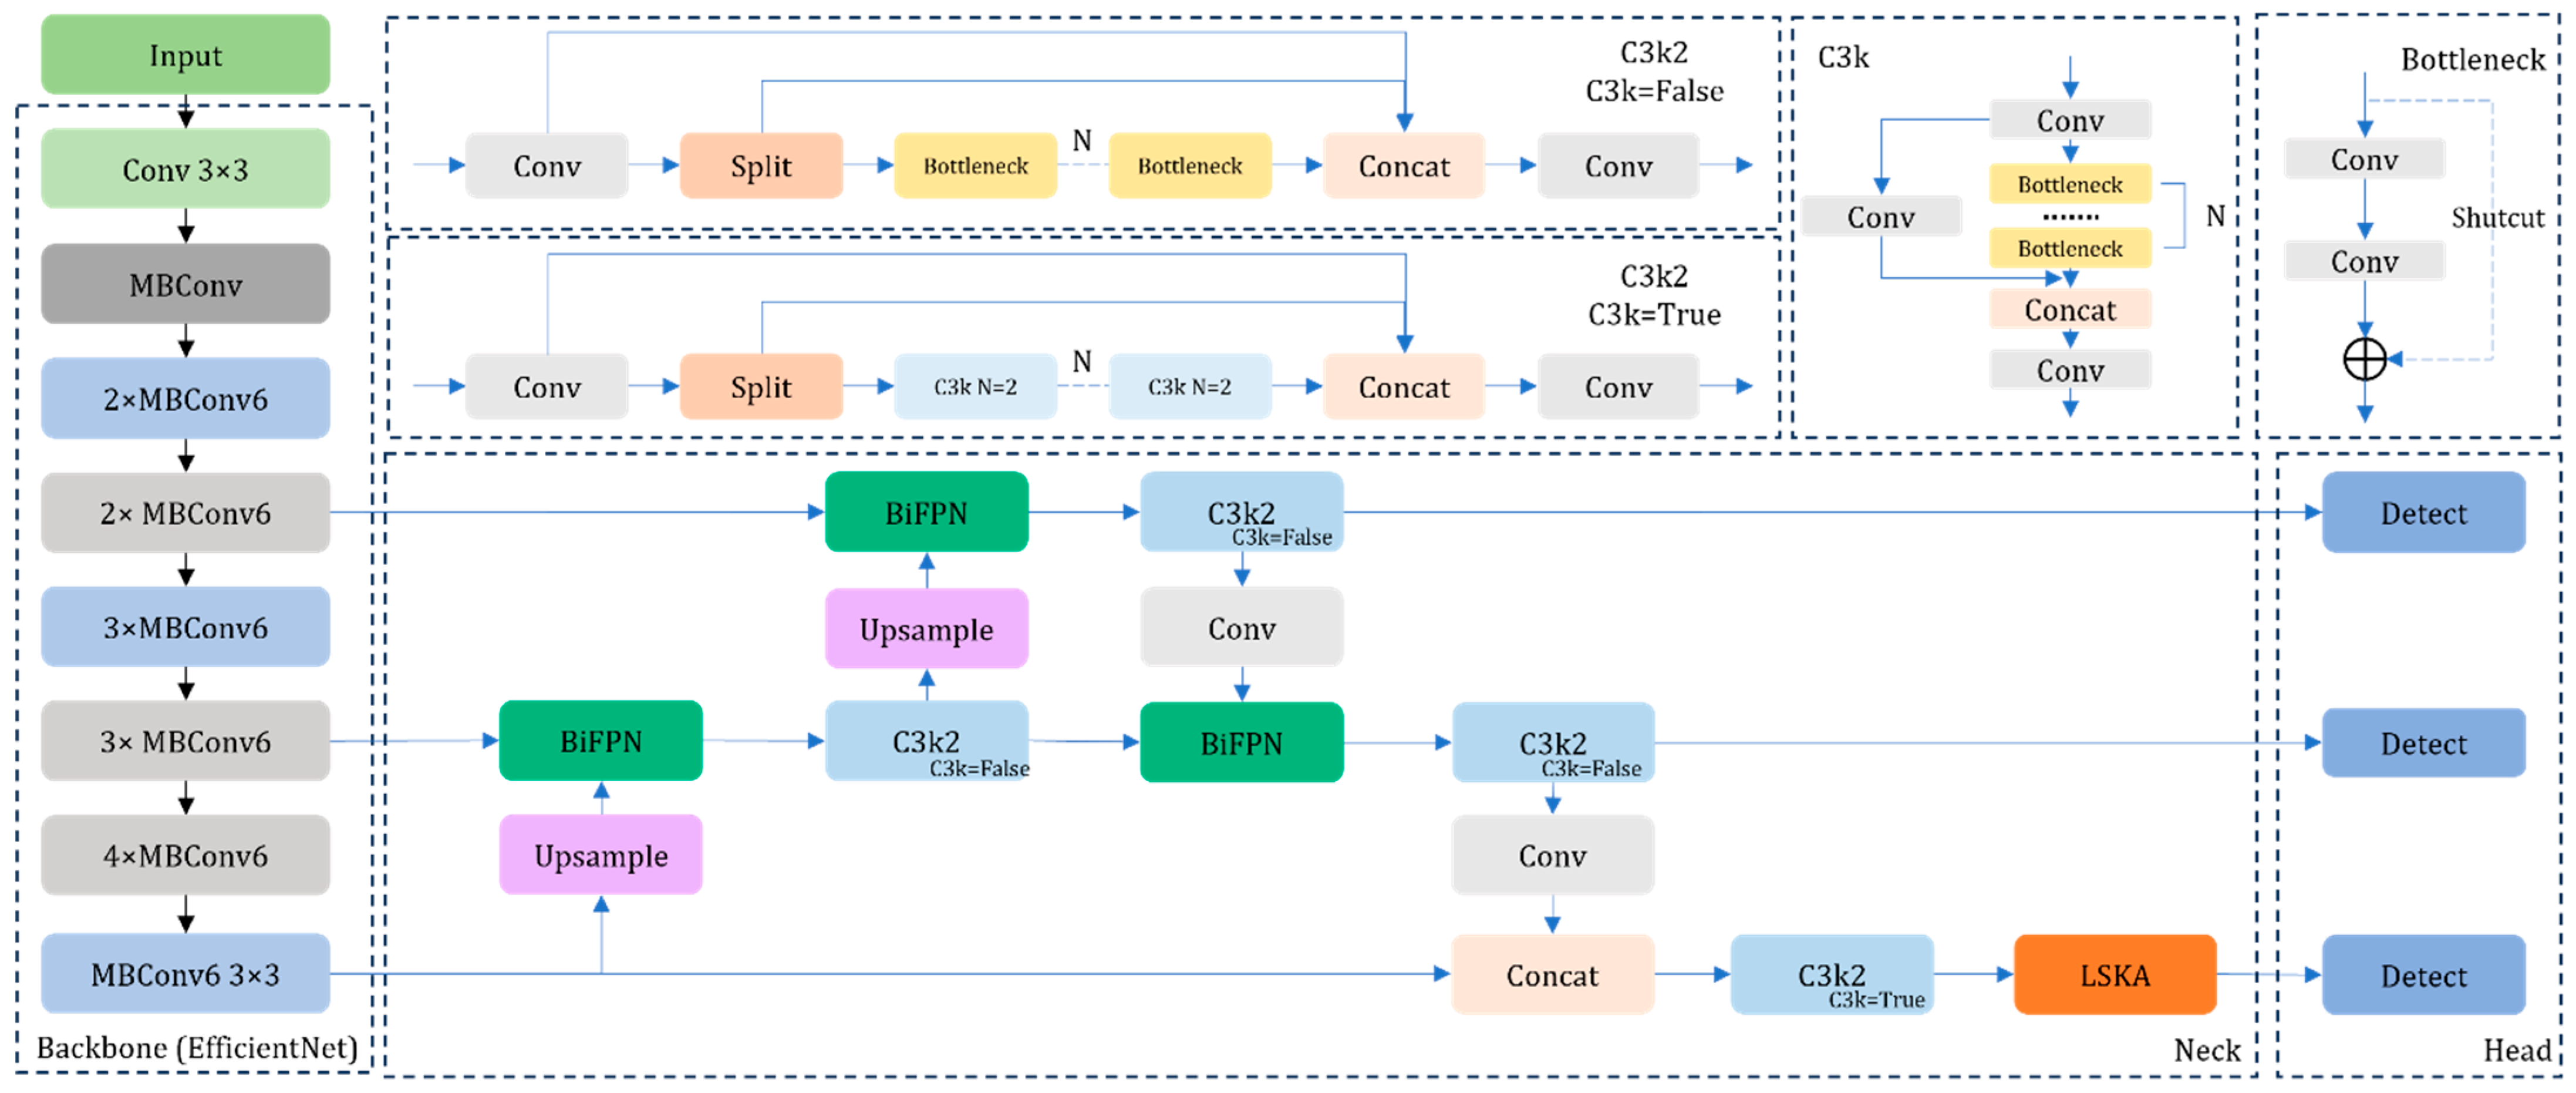
Table 1. Considering its computational cost and deployability, as well as its detection speed and accuracy, YOLOv11n performed well compared to the other models; it was finally selected as the original model and improved. The improved YOLOv11n network structure is shown in
Figure 2. First, the backbone network of the original model was replaced with EfficientNet-B0, which maintained high accuracy while significantly saving computational resources. Subsequently, the LSKA attention mechanism was incorporated to enhance the model’s focus on contextual information. Finally, the BiFPN network was introduced to improve the model’s feature-fusion capability.
2.2.1. Backbone Network
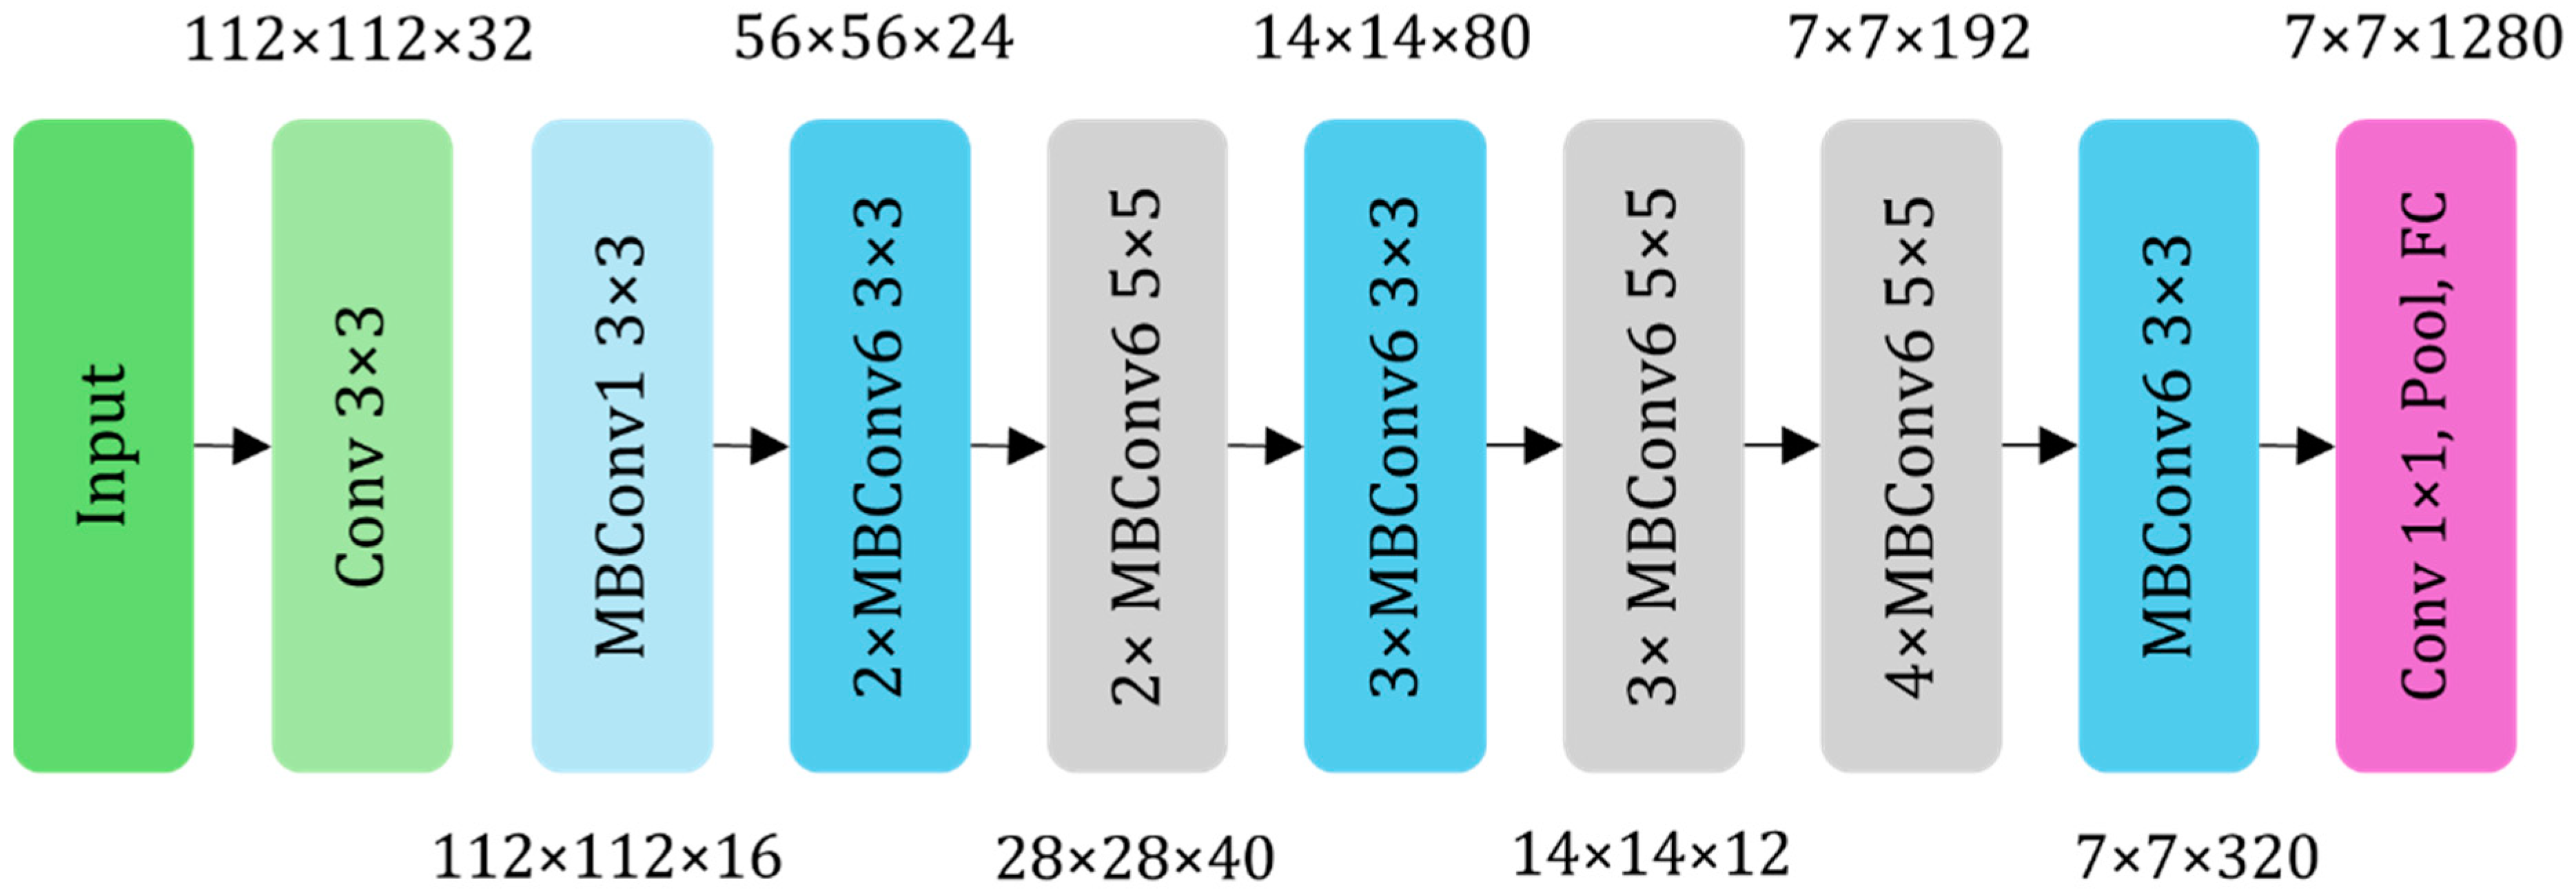
To maintain high accuracy while minimizing consumption of computational resources, the backbone network of the original YOLOv11n was replaced with the lightweight EfficientNet model [
21], as shown in
Figure 3. The EfficientNet network has multiple versions, each differing in performance and complexity. Considering the practical requirements of performance and complexity, this study ultimately selected EfficientNet-B0, the version with the lowest complexity, as the backbone model for feature extraction.
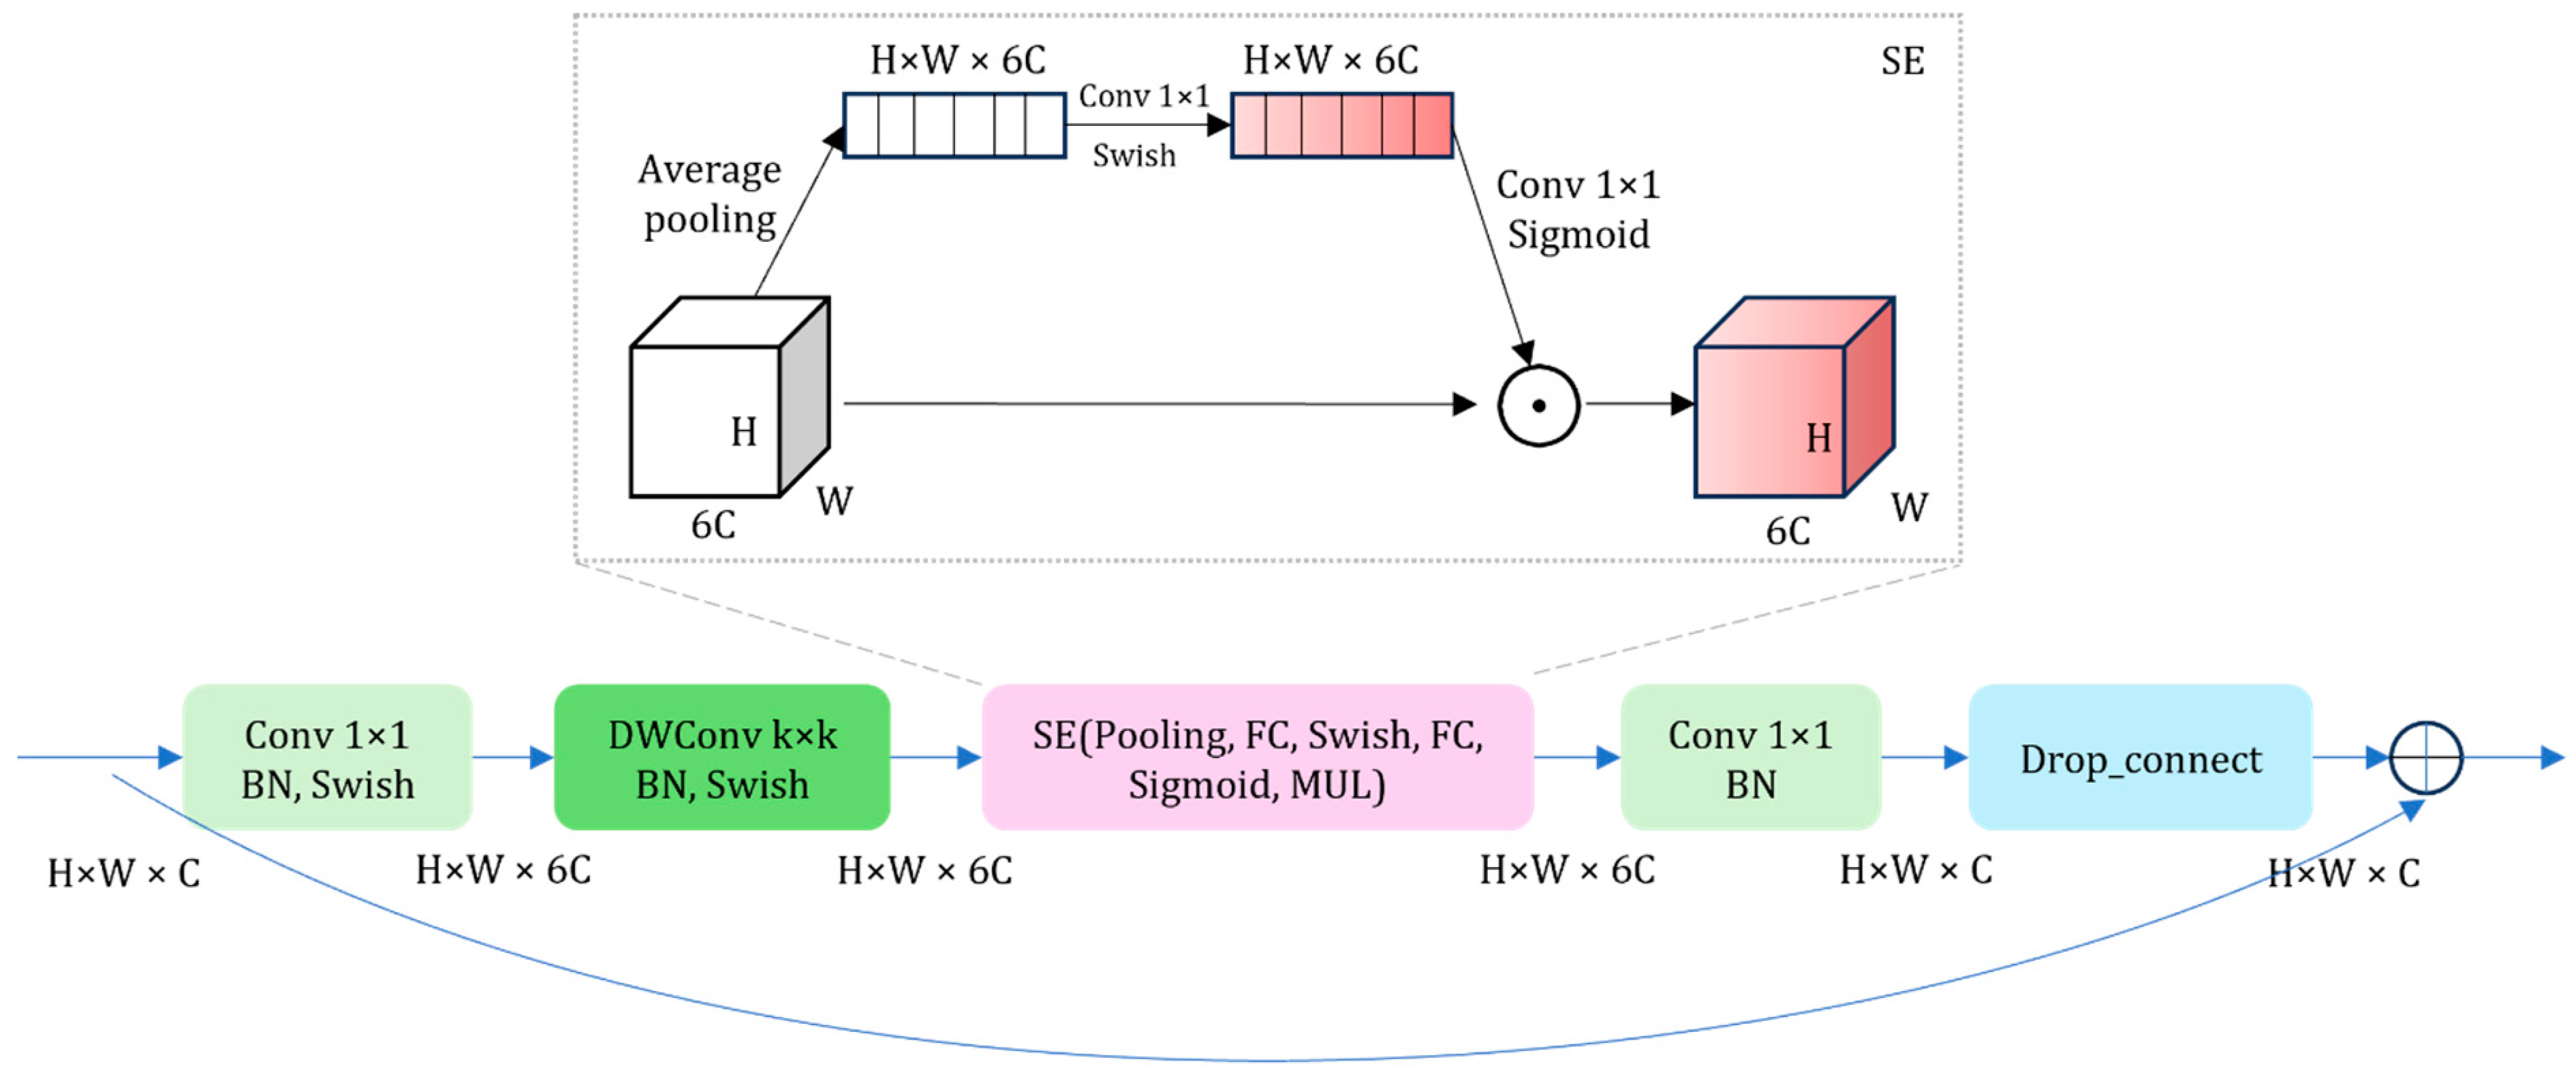
The model was constructed by stacking multiple Mobile Inverted Bottleneck Convolution (MBConv) modules; its specific structure is illustrated in
Figure 4. In each MBConv module, the process begins with a 1 × 1 convolution to increase the dimensionality of the input residual block’s feature maps, thereby expanding the number of channels to enhance feature representation. Subsequently, depthwise separable convolution is employed to further extract image features, efficiently capturing key information while reducing computational load. Following this step, the Squeeze-and-Excitation (SE) attention mechanism is introduced to assign different weights to various channels of the feature maps, emphasizing important features and suppressing less significant ones. Next, a 1 × 1 convolution is applied again to reduce the dimensionality of the feature maps, decreasing the number of channels and lowering the model’s complexity. Finally, the reduced feature maps are fed into a Dropout layer, where some neurons are randomly discarded to prevent overfitting, yielding the final output. Additionally, when the input and output residual blocks have the same number of feature map channels and a stride of 1, a shortcut operation is performed; this involves adding the input feature maps to the output feature maps elementwise. This accelerates model convergence and mitigates the “vanishing gradient” problem.
2.2.2. LSKA
Due to the complex environmental background of olives, in which parts are obscured by branches and leaves, YOLOv11n may not be able to effectively distinguish the obscured olives from the background, resulting in a decrease in detection accuracy. The LSKA (Large Kernel Separable Attention Module) is a module used to optimize a model’s ability to capture and process image features [
22] and can enhance the model’s attention to key areas and contextual information. Therefore, this paper introduced the LSKA attention mechanism to help the model pay more attention to the key characteristics of olives and reduce the rates of missed detections and false detections.
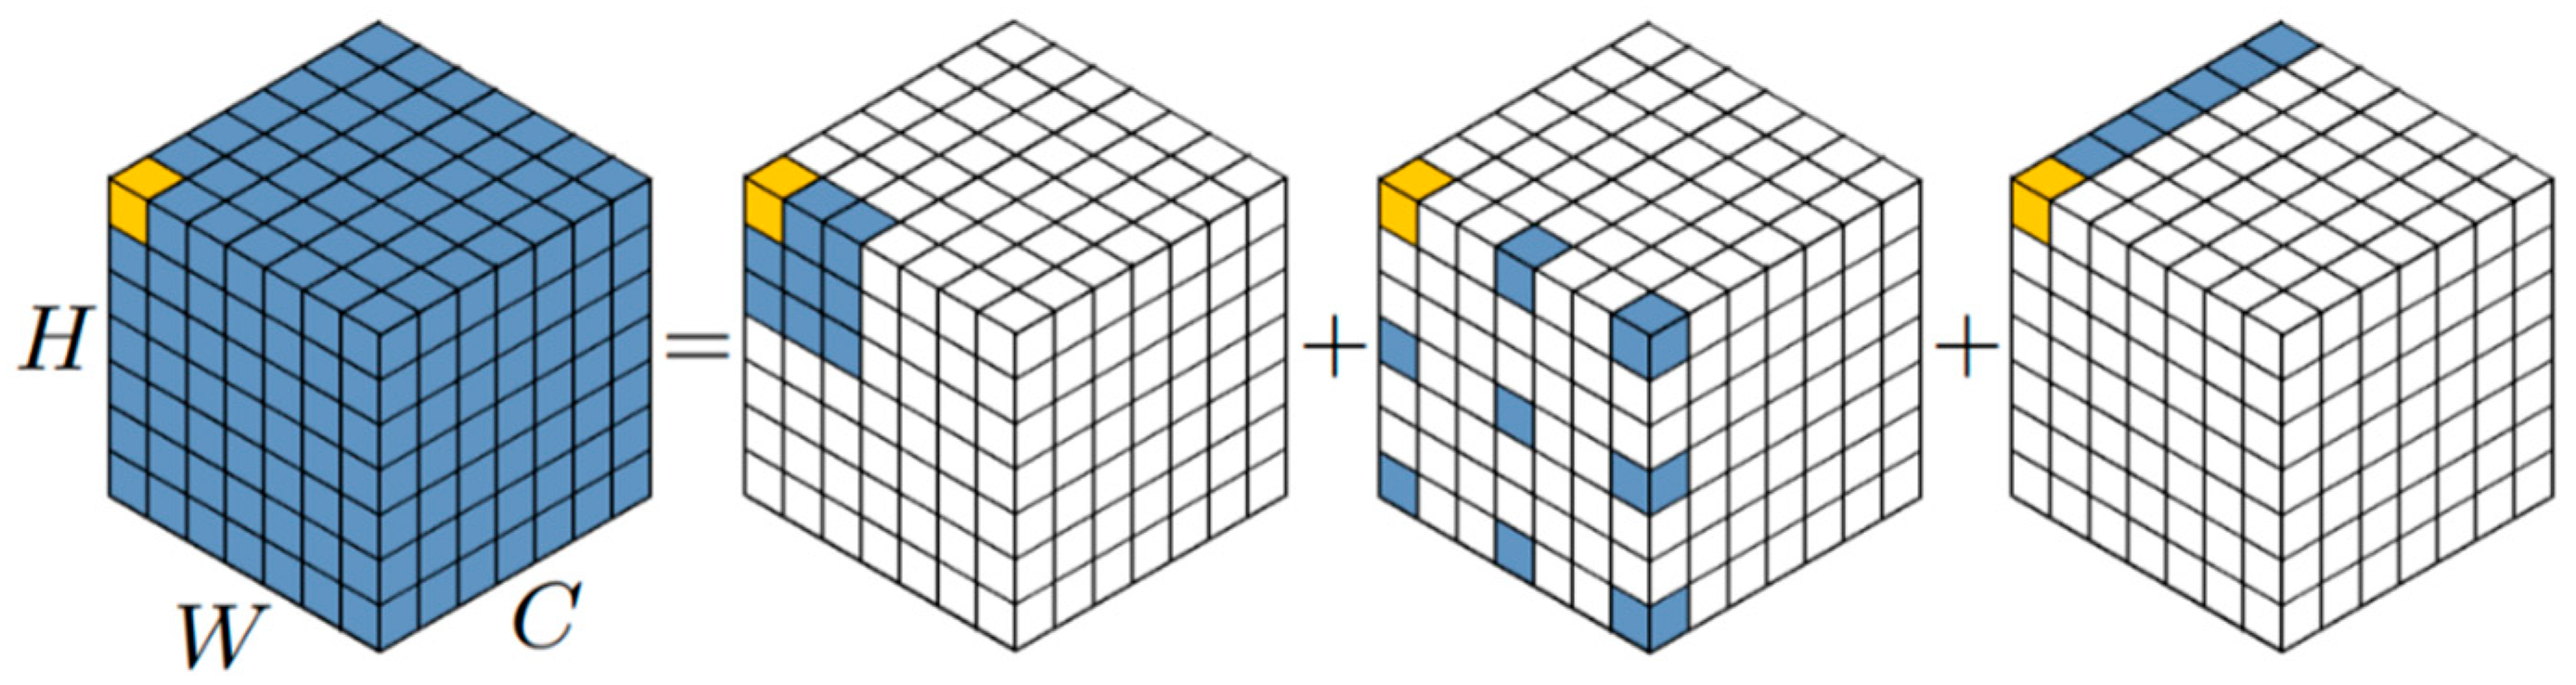
Its workflow begins with the initialization of convolutional layers. At the front end of LSKA, two convolutional layers are set up to extract features from the input feature map in both the horizontal and vertical directions, generating an attention map. This map guides the model to focus on key regions within the image. Subsequently, LSKA incorporates dilated convolution [
23], as shown in
Figure 5, utilizing different dilation rates to further explore features over a larger range in the attention map, thereby capturing richer contextual information. Next, LSKA employs a final convolutional layer to fuse the extracted features, producing the ultimate attention map. This attention map is then applied to the original feature map through elementwise multiplication, emphasizing important features in the original image and enhancing the model’s ability to analyze and recognize images. The structure of LSKA is illustrated in
Figure 6.
In this way, this mechanism enabled the network to focus more on key features, further enhancing the overall performance of the model. The output of LSKA is represented by Equations (1)–(4), where the symbol “*” denotes the convolution operation and “⊗” denotes the Hadamard product operation.
In the above equations, represents the output of the depthwise convolution and is obtained by convolving the input feature map with a kernel of size . is the output of LSKA, which is the result of the Hadamard product between the attention map and the input feature map . It is important to note that each channel in is convolved with the corresponding channel in the kernel . These improvements to the backbone feature-extraction network significantly enhance its ability to extract features, further strengthening the model’s capacity to recognize detection targets in object-detection task and thereby improving overall detection performance.
2.2.3. BiFPN
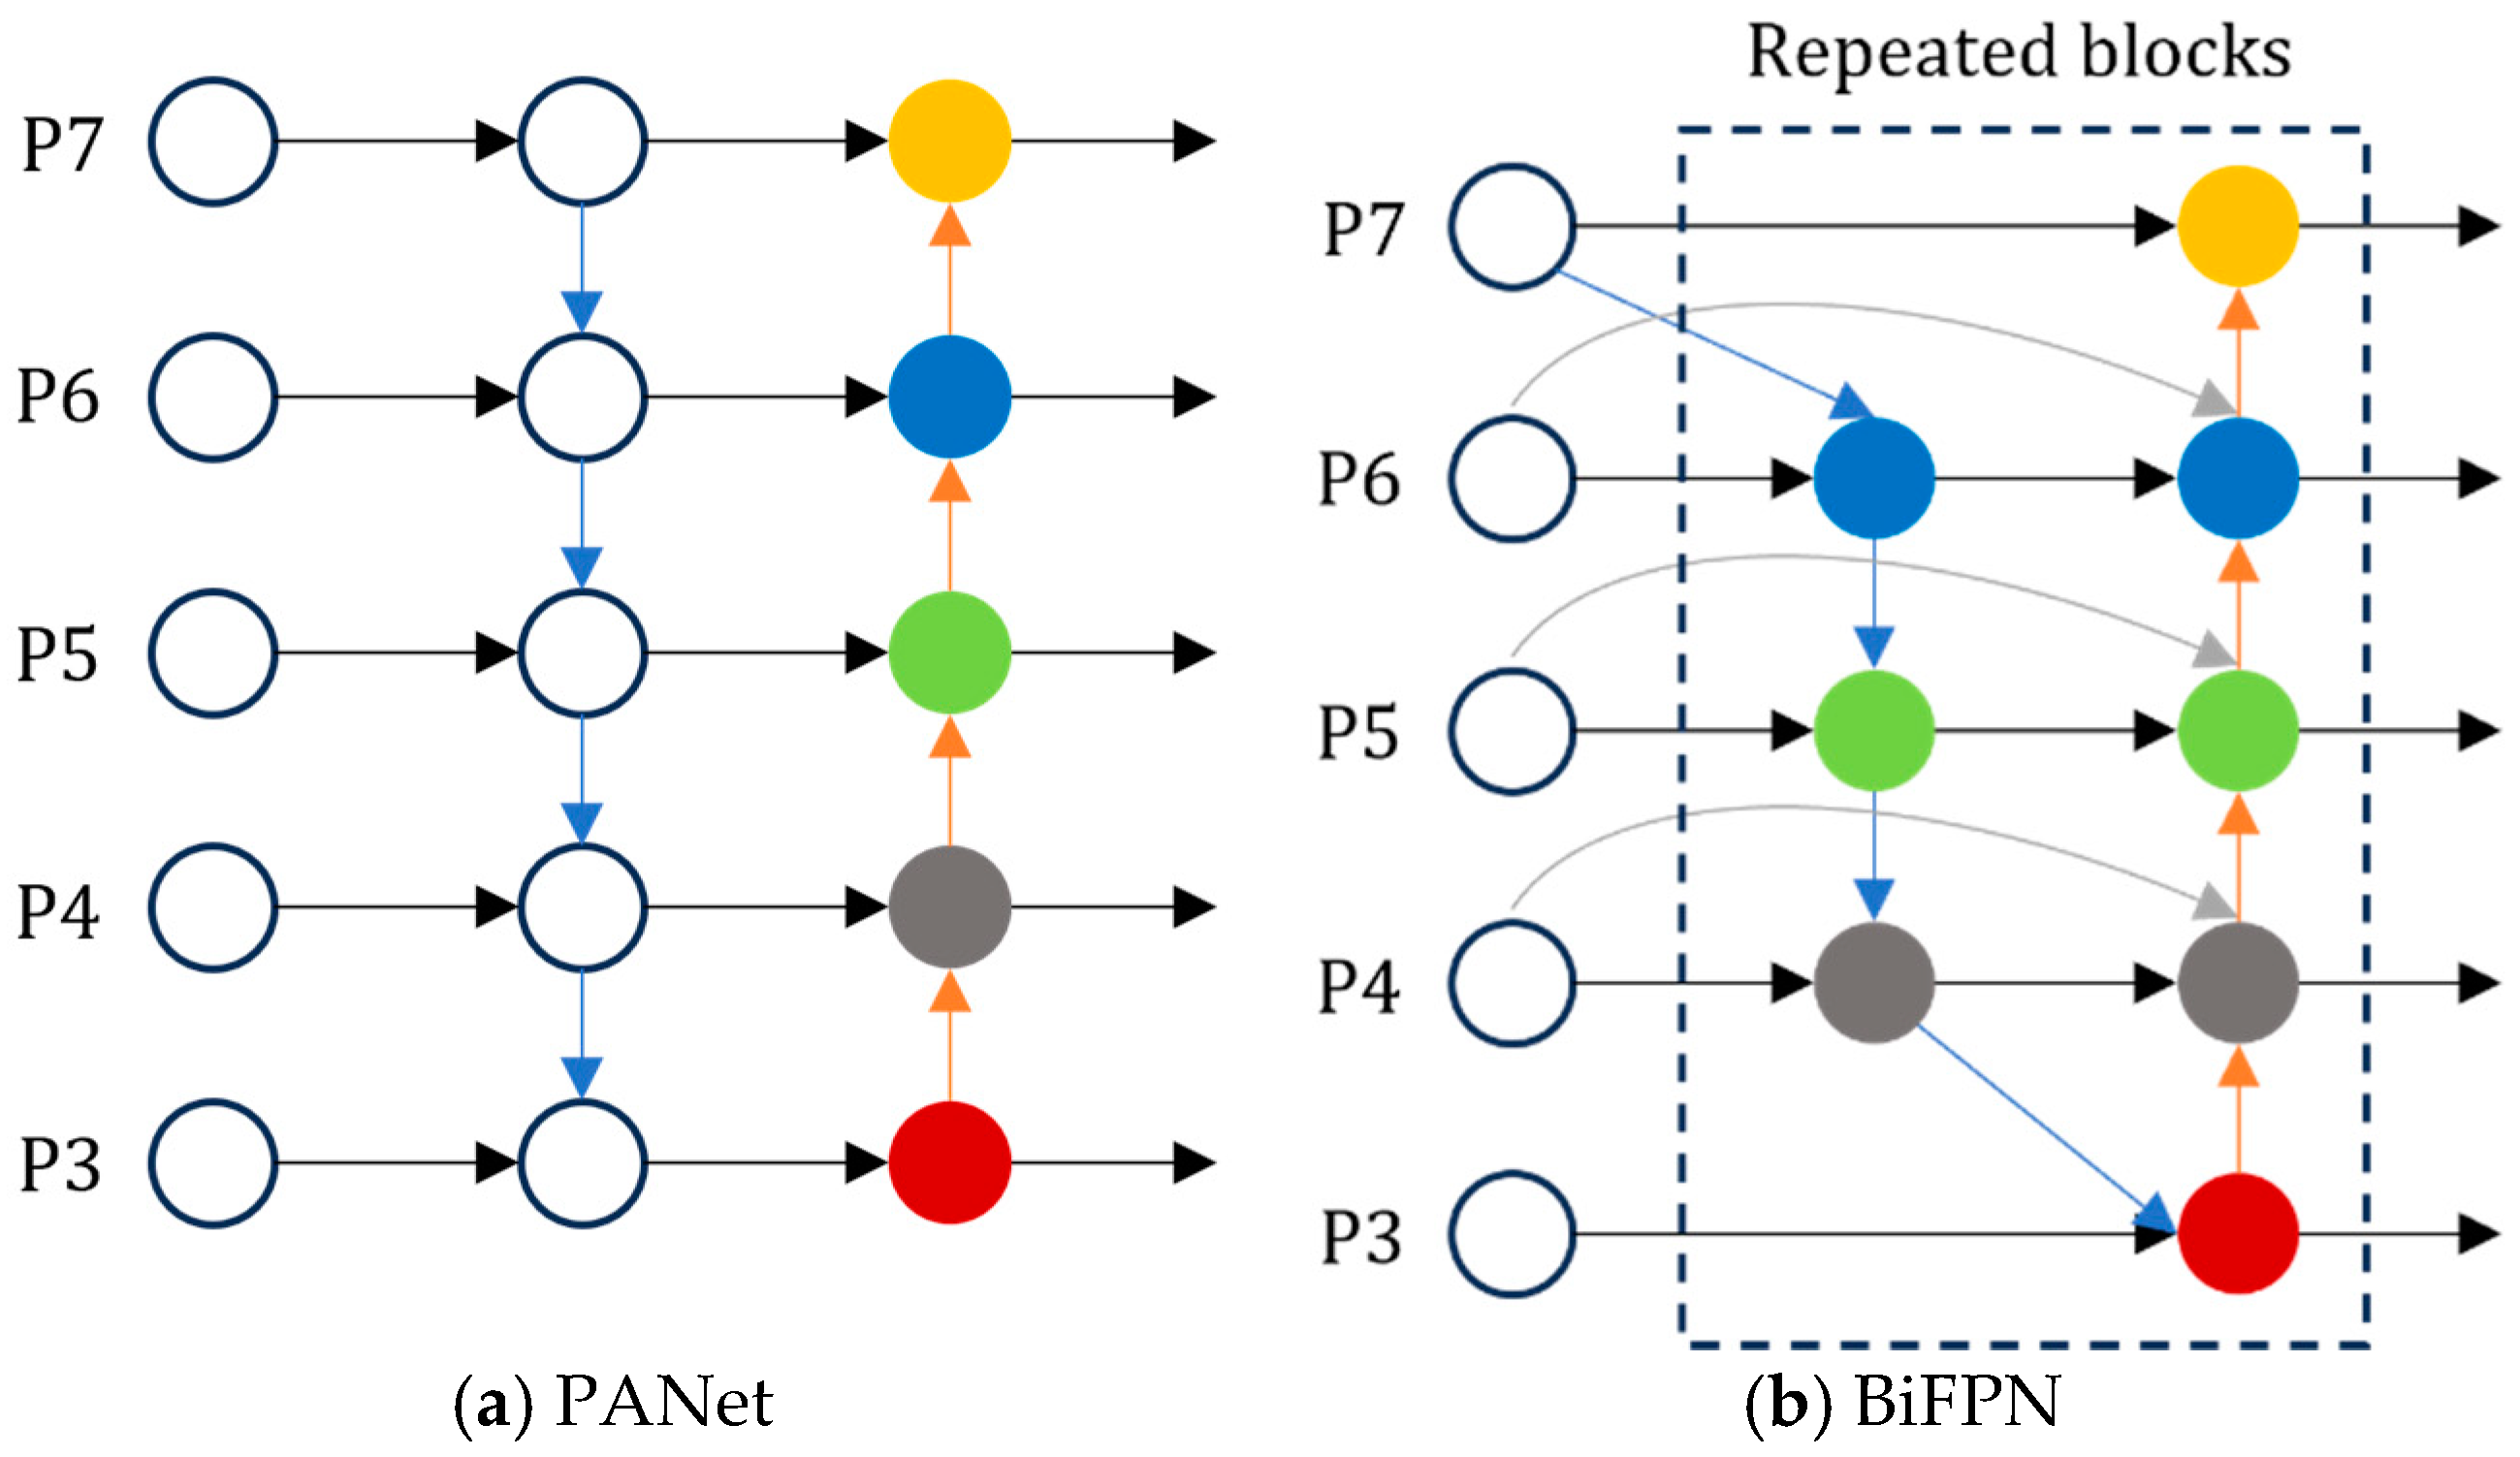
When models are used to detect olives of varying sizes and irregular distributions, the contribution of input features at different resolutions to the fused output features varies; however, conventional feature-fusion methods do not consider this. As shown in
Figure 7a, the PANet module adopts a simple feature layer-addition method to achieve data fusion. This method is indeed feasible when the targets to be identified are of relatively consistent size [
24], but it is not effective for detection targets with large size variation. However, BiFPN fully considers the different contributions of different input-feature resolutions to the fused feature map and learns weights to assign importance to different input features. This weighted feature-fusion method enables BiFPN to better extract deep information and confers a degree of robustness to interference caused by environmental changes. YOLOv11n does not have such a sophisticated feature-fusion mechanism. When detecting olive targets of different sizes, it cannot make full use of multilevel feature information, a weakness that limits its detection accuracy.
BiFPN assigns different weights to different feature layers, enabling a more refined feature-fusion process [
25]. First, the BiFPN module removes an intermediate node that does not participate in feature fusion. Second, BiFPN adds a cross-layer feature branch between the input and output nodes at the same level to enhance the effectiveness of feature fusion. During the bottom-up process, BiFPN fuses the original features with intermediate-layer features, taking into account the varying contributions of different input feature resolutions to the fused feature map. The introduction of weights allows BiFPN to learn their values during the feature-fusion stage, which allows it to assign importance to different input features. This approach enhances BiFPN’s ability to extract deep information and provides some robustness to interference caused by environmental variations. The weighted feature fusion is expressed in Equation (5), as follows:
In the above equation,
represents the output information;
is the weight corresponding to the
-th feature layer;
is a minimal learning rate, used to limit numerical oscillations and set to
;
is the sum of the weights of all feature layers; and
represents the input information of the
-th layer. The specific calculation method is as follows:
In the above equation, represents the intermediate feature of in the top-down path; denotes the convolution operation; , and
represent the weights of the first, second, and third layers, respectively; denotes upsampling or downsampling operations; represents the output feature of in the bottom-up path; represents the input feature within the path; , and represent the weights of the first, second, and third layers after feature fusion, respectively; and denotes a very small non-zero constant, set to 0.0001.
2.3. Experimental Environment
Training of the network model in this experiment was conducted using the PyTorch 2.0.0+cu118 deep learning framework. The hardware environment for testing included an Intel(R) Core (TM) i7-12700F CPU with a clock speed of 2.10 GHz, 32 GB of RAM and an NVIDIA GeForce RTX 4070 GPU with 12 GB of VRAM. The Intel CPU is manufactured by Intel Corporation, and the NVIDIA GPU is produced by NVIDIA Corporation, both of which are headquartered in Santa Clara, CA, USA. The operating system used was Windows 10, and the Python version was 3.10. The hyperparameters of the network were balanced and optimized, with the total number of training epochs set to 200 and the batch size per epoch set to 64. The learning rate, which affects the speed of network weight updates, was initially set to 0.01, with a decay rate of 0.1, achieving optimal training performance under these conditions.
2.4. Evaluation Metrics
Deep learning-based detection models require certain evaluation metrics to validate their detection performance. In this paper, we use six evaluation metrics: precision (P), recall (R), mAP (mean average precision), F1 score, parameters, and FLOPs (that is, the number of floating-point operations per second, a metric often used to evaluate the computational complexity of a model). These six metrics provide a comprehensive assessment of the model’s effectiveness in detection tasks, reflecting its performance in terms of accuracy, recall, speed, and efficiency from different perspectives (AP refers to the area under the precision–recall (P–R) curve, and mAP is the average value of AP for each class).
TP represents the number of samples for which the model correctly identifies positive samples as positive classes (for example, the model accurately identifies images of fully ripe olives as showing fully ripe olives). FP represents the number of samples for which the model incorrectly identifies negative samples as positive classes (for example, the model identifies images of immature olives as showing fully ripe olives). FN represents the number of samples for which the model incorrectly identifies positive samples as negative classes (for example, the model identifies images of fully mature olives as showing olives in other stages of maturity).
3. Results
3.1. Comparison of Original Model Performance
Table 1 shows the performance-test results for the original models. It can be seen from the data in the table that YOLOv11n had the highest mAP and F1 values, at 0.918 and 0.889, respectively. YOLOV9-Tiny had the fewest model-related parameters, with a model size of 4.6 MB, 7.7 G floating-point operations, and 1.98 M parameters. Overall, YOLOV9-Tiny had advantages in terms of model size, FLOPs, and the number of parameters, but its performance indicators were relatively low. YOLOV11n, on the other hand, performed outstandingly in performance indicators such as precision, recall, mAP, and F1, and its model size, FLOPs, and the number of parameters were also relatively small. Therefore, in this study, YOLOv11n was selected as the basic model for the detection of olive maturity.
Figure 8 shows the P–R curves of different network models. The P–R curve is plotted with the precision and recall of the model as the coordinate axes. This figure shows that compared with other models, all the P–R curves corresponding to YOLOv11n are located on the outer side and the balance point (P = R) is closer to (1,1); these metrics demonstrate that this model had the optimal performance among the evaluated approaches.
3.2. Backbone-Network-Replacement Experiment
Different backbone networks have different numbers of parameters, and these variations affect the complexity and computation of the model.
Table 2 shows the results of replacement tests for different backbone networks (including ShuffleNetv2 [
26], EfficientViT [
27], SimRepCSP [
28], Swin-Transformer [
29], and EfficientNet). It can be seen from the data in the table that the original model had the highest mAP value, at 0.918. The network with SimRepCSP as the backbone network had the fewest layers (194 layers). The next-best choice was EfficientNet, with 270 layers. When the backbone network was replaced with ShuffleNetv2, the FLOPs and model size were reduced to their lowest values, at 4.4 G and 3.3 MB, respectively. Again, the next-best choice was EfficientNet, with a FLOPs of 5.2 G and a model size of 3.7 MB. Overall, EfficientNet performed relatively well in terms of precision, with a value of 0.908, which is close to the 0.909 of YOLOv11n. At the same time, its model size was only 3.7 MB, which is relatively small. It is relatively lightweight while still ensuring a certain degree of detection accuracy and also has relatively good average detection accuracy. Therefore, in this paper, the backbone network of the original model was replaced with EfficientNet, and the network detection accuracy was further improved through subsequent improvements.
3.3. Comparison of Attention Mechanisms
The use of different attention mechanisms affects the model’s ability to recognize and classify objects.
Table 3 shows the results of adding different attention mechanisms (including SE [
30], CBAM [
31], ECA [
32], LKA [
23], and LSKA) to the network in testing.
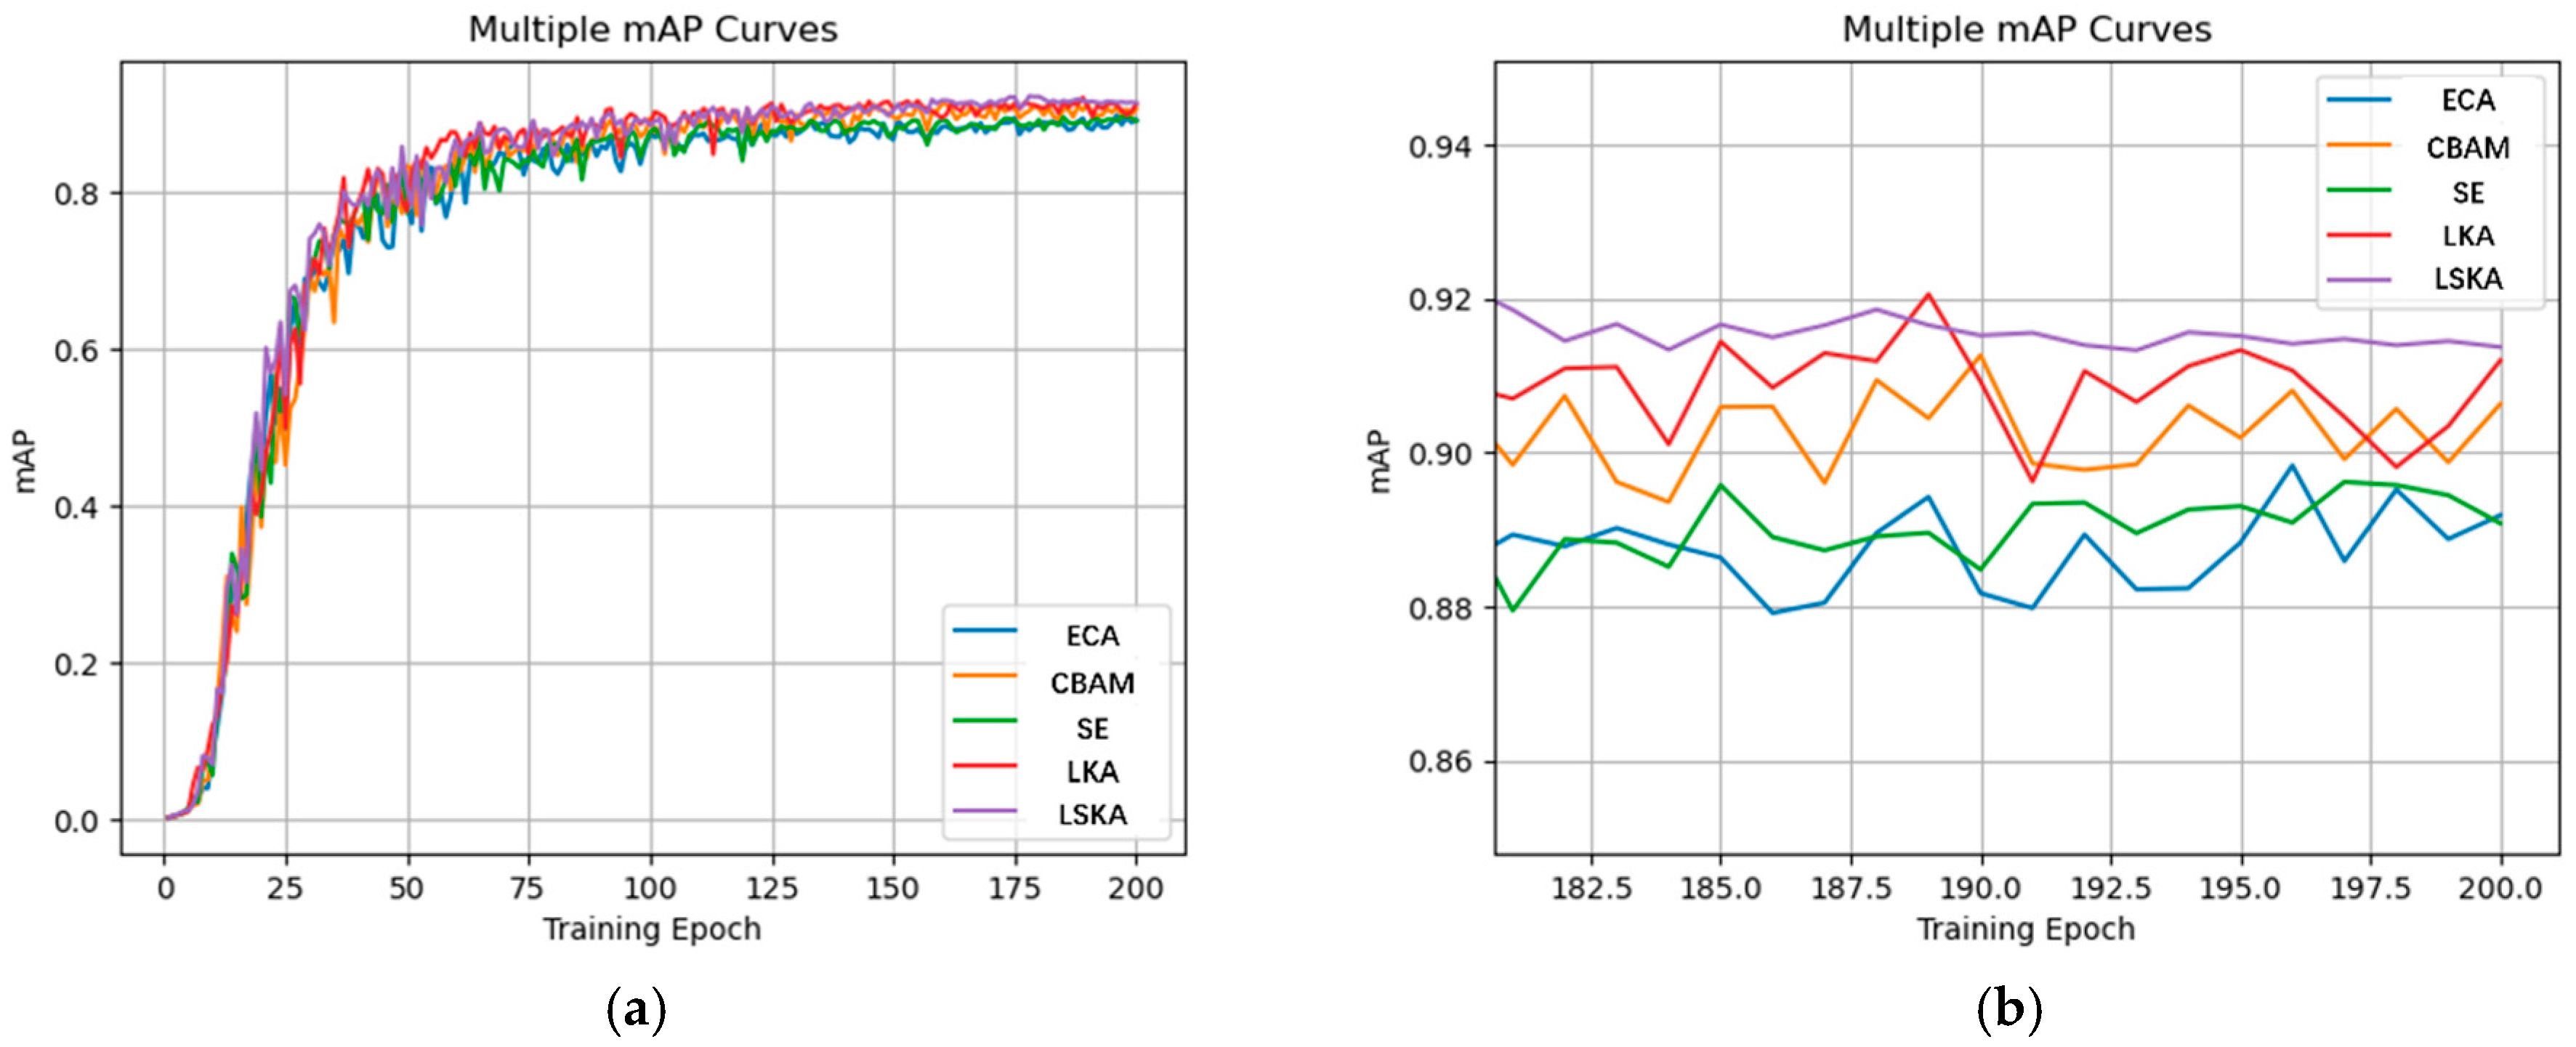
Table 3 shows the results of adding different attention mechanisms to the network in testing. As can be seen from the data in the table, when the LSKA attention mechanism was added, the model achieved its highest mAP, at 0.914. The network has 276 layers, with FLOPs of 5.3 G and a model size of 3.9 MB; these metrics are relatively optimal. Therefore, in this study, the LSKA attention mechanism was selected to enhance the detection performance of the improved network.
Figure 9a shows the mAP training curves based on adding different attention mechanisms to the network.
Figure 9b shows a visualization of the result with the last 20 rounds of the training process magnified. It can be seen that the addition of the LSKA module yielded better detection performance compared to the addition of other modules.
3.4. Ablation Experiment on the Convolution Kernel Size of LSKA
Table 4 shows the ablation experiment on the convolution kernel of LSKA. As can be seen from the data in the table, when the convolution kernel size of LSKA was adjusted to 41 (the default size is 7), the model achieved the best detection performance, with a value of 0.914. Meanwhile, there were no significant changes in the number of network layers, FLOPs, and model size of the model. Therefore, in this study, the convolution kernel size of LSKA is adjusted to 41.
3.5. Overall Improvement Ablation Experiment
Table 5 shows the comparison data from the process of improving the network model. As can be seen from the data in the table, after the EfficientNet module was added, the number of model parameters was significantly reduced, while the precision, recall, and mAP changed relatively little. At the same time, in order to further improve the detection performance of the model, this paper also introduced the BiFPN module. After the LSKA and BiFPN modules were continuously added, the precision, recall, and mAP were somewhat improved, while the number of parameters was basically unchanged; this result indicates that this combination of modules can enhance and optimize the performance of the model.
3.6. Performance Comparison Before and After Improvement
Table 6 shows the performance comparison results before and after the improvement of the model. It can be seen that the detection performance of the improved model is comparable to that of the original model, but the model size, FLOPs, number of parameters, and the detection time for a single image (Time) have all been significantly improved, decreasing by 2.2 MB, 2.4 G, 1.12 M, and 0.2 ms, respectively. This indicates that the improved model has a good, lightweight advantage.
3.7. Comparison of Detection Effects of Different Models
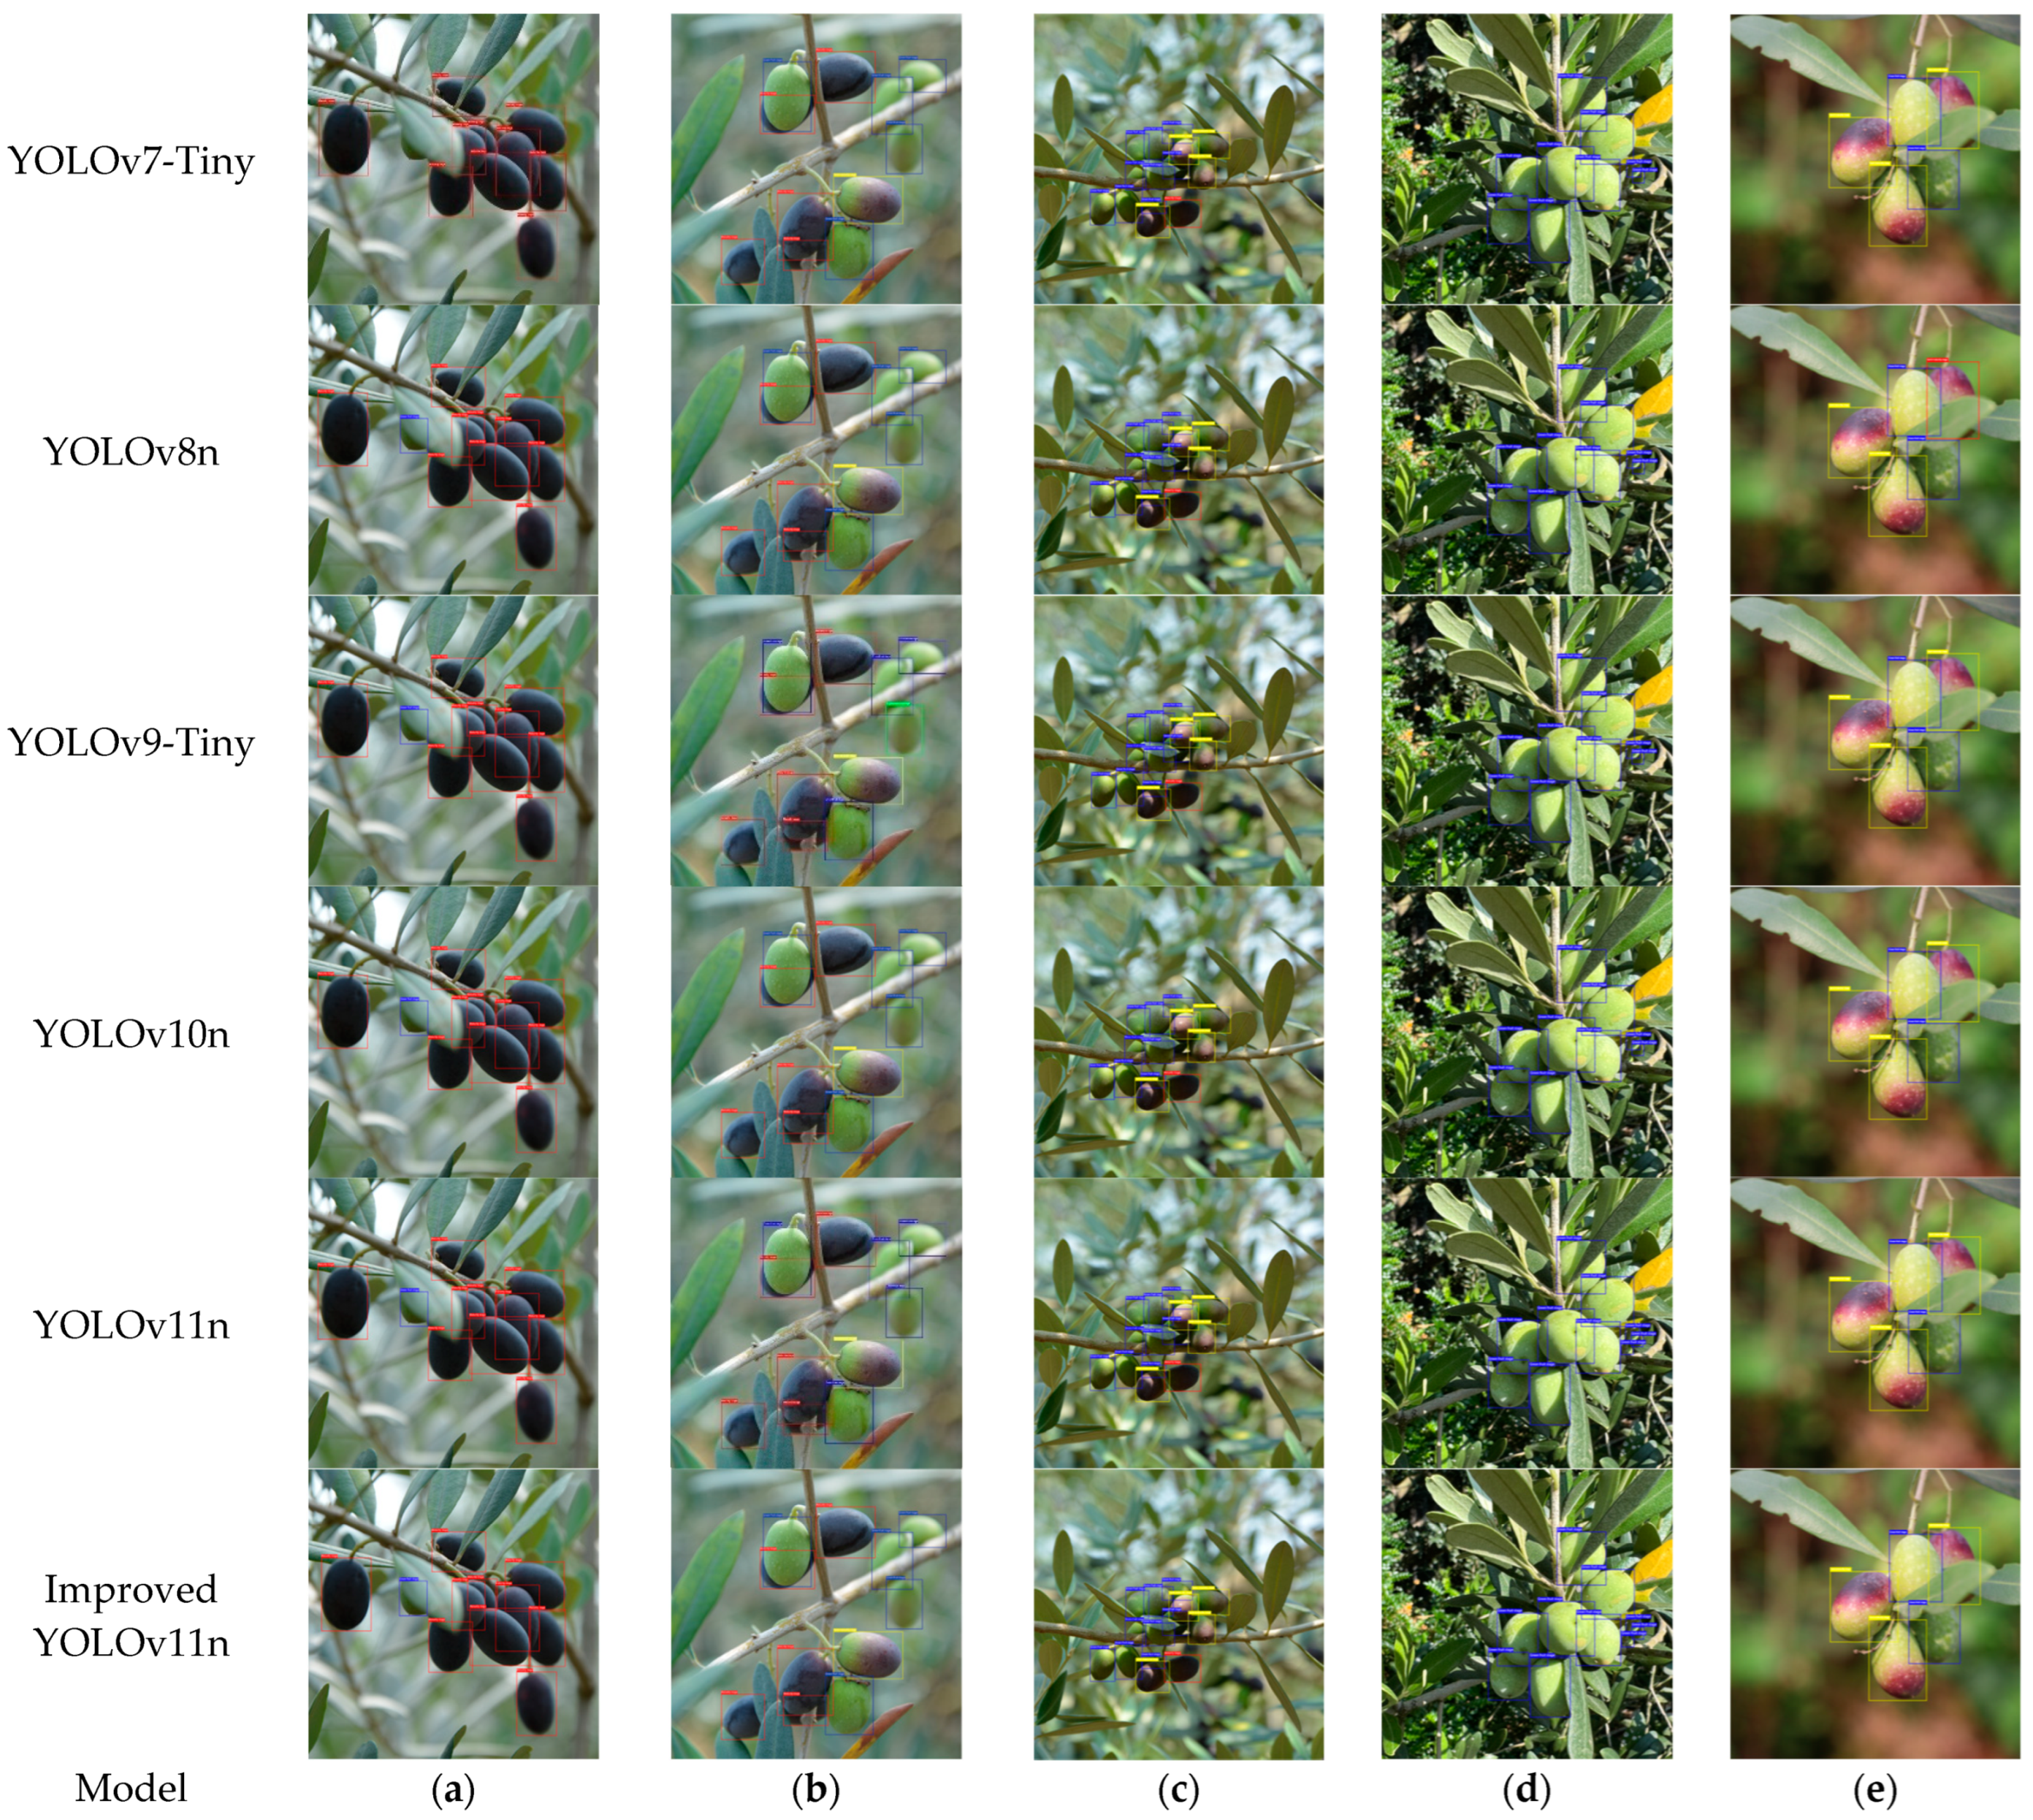
In this study, five representative olive images were selected for contrast testing, as shown in
Figure 10a–e. The detection results for these images are displayed on the images via different color markers, which indicate olive fruit maturity as detected by the model: blue markers indicate the detection of immature fruit; green markers indicate the detection of micromature fruit; yellow markers indicate the detection of semimature fruit; and red markers indicate the detection of mature fruit. In addition,
Figure 10a mainly shows the fully ripe olive fruit and includes some occlusion cases.
Figure 10b,c contain the mixed cases, with fruits of different maturity levels, which helps to illustrate the ability of the model to detect fruits in complex maturity scenarios.
Figure 10d shows the immature olive fruit and contains a complex background similar in color to the fruit.
Figure 10e contains the semi-mature olive fruit, reflecting the detection performance of the model for semi-mature olives.
It can be seen that the detection performance of the original model was comparable to that of the improved YOLOv11n network in this study and that both could detect the olive targets in the images relatively accurately. However, other detection models had different rates of missed detection and false detection in the detection of small targets against complex backgrounds (for example, the YOLOv7-Tiny model in
Figure 10a missed some detections in a severely occluded environment. The YOLOv7-Tiny, YOLOv8n, YOLOv9-Tiny, and YOLOv10n models in
Figure 10d missed some detections under conditions of complex backgrounds and severe occlusion. The YOLOv9-Tiny model had a false detection in
Figure 10b. The YOLOv10n model had a false detection in
Figure 10c, and the YOLOv8n model had a false detection in
Figure 10e). This shows that the improved network in this study can still maintain relatively strong detection performance while remaining advantageously lightweight and that its overall performance is better than that of other networks.
4. Discussion
The lightweight algorithm for detection and grading of olive maturity based on the improved YOLOv11n proposed in this study represents an important step in solving the problem of olive-picking automation. Through a series of experiments, the algorithm showed significant advantages, but there are also some areas worth exploring and improving.
Based on the experimental results, the improved model successfully achieved a lightweight design while maintaining detection accuracy. Replacing the backbone network with EfficientNet-B0 significantly reduced the model size and computational complexity, a result of great significance for deployment on mobile picking equipment with limited resources. At the same time, the integration of the LSKA attention mechanism and BiFPN network effectively improved the model’s ability to detect olive targets in complex backgrounds, reducing missed and false detections. This shows that the improved strategy is effective in enhancing the model performance and provides more reliable technical support for detection of olive maturity.
The model can also be compared with those from similar studies: the mAP (0.918) of the model in this paper is better than the mAP (91.5) of the YOLOv5-ShuffleNet-CBAM model of Xiao et al. [
19] and that of the improved YOLOv8-GP (mAP = 0.897) of Chen et al. [
33], and there are fewer parameters. However, the dragon-fruit-detection model of Li et al. [
34] (based on YOLOv5) performed better in terms of its light weight (2.5 M), indicating that different crops may need customized lightweight strategies.
However, there are still some aspects of this work that remain to be optimized. Although the improved model shows progress in detection accuracy and light weight, the performance of the model may be affected in extremely complex natural environments, such as when there are drastic changes in lighting conditions or when there is severe overlap of olive fruits or occlusion by a large number of branches and leaves. In addition, when the number of samples is relatively limited, random partitioning of the data may indeed lead to biases in the results, making the results overly dependent on a specific partition. Due to the limited resources and time committed to this study, we were unable to carry out multiple repeated simulations and use ANOVA boxplots to evaluate the average results. In the future, it will be necessary to conduct k repeated simulation experiments for each model to accurately determine whether the observed differences are statistically significant and further consolidate the reliability of the research results.
From the perspective of practical application, integrating the model into an automated picking system also requires consideration of compatibility and collaborative work with other hardware devices. For example, the question of how to ensure that the detection results of the model can be transmitted to the picking manipulator accurately and in a timely manner to achieve efficient and accurate picking is a practical problem that needs to be solved in the future.
5. Conclusions
This study successfully developed a lightweight algorithm for detection and grading of olive maturity based on an improved YOLOv11n; this algorithm significantly improved the efficiency and accuracy of olive-maturity detection. During the research process, replacing the backbone network with EfficientNet-B0, introducing the LSKA attention mechanism, and adopting the BiFPN network allowed the computational complexity and size of the model to be effectively reduced. While high detection accuracy was maintained, the detection speed was accelerated; the model is additionally lightweight and provides strong technical support for automation of olive picking.
Due to the similarities shared by fruits in different stages of ripeness, ripeness detection involves the identification and classification of multiple features of fruit appearance, such as color, shape, texture, etc. This architecture can effectively capture these key features through efficient feature extraction and fusion mechanisms. Therefore, after proper adjustment and optimization, it is expected that the architecture will be applied to other fruits such as apples, bananas, oranges, etc., in ripeness-detection tasks, thus contributing to the automated development of the fruit industry.
Author Contributions
Conceptualization, F.Z., S.W., M.L., W.W. and W.F.; data curation, F.Z., S.W., M.L., W.W. and W.F.; formal analysis, F.Z., S.W., M.L., W.W. and W.F.; investigation, F.Z., S.W., M.L., W.W. and W.F.; methodology, F.Z., S.W., M.L., W.W. and W.F.; resources, F.Z., S.W., M.L., W.W. and W.F.; software, F.Z.; supervision, S.W.; validation, F.Z. and M.L.; visualization, F.Z. and M.L.; writing—original draft, F.Z.; writing—review and editing, F.Z. and S.W. All authors have read and agreed to the published version of the manuscript.
Funding
This research received no external funding.
Data Availability Statement
The data presented in this study can be requested from the corresponding author. The data are not currently available for public access because they are part of an ongoing research project.
Acknowledgments
The authors would like to thank the anonymous reviewers for their critical comments and suggestions for improving the manuscript.
Conflicts of Interest
The authors declare no conflicts of interest.
References
- Zhang, Y.; Zhang, C.; Xu, C.; Deng, Y.; Wen, B.; Xie, P.; Huang, L. Effect of geographicallocation and soil fertility on main phenolic compounds and fatty acids compositions of virgin olive oil from Leccinocultivar in China. Food Res. Int. 2022, 157, 111207. [Google Scholar] [CrossRef] [PubMed]
- Zhu, Z.; Li, X.; Zhang, Y.; Wang, J.; Dai, F.; Wang, W. Profiling of phenoliccompounds in domestic and imported extra virgin olive oils in China by high performance liquid chromatography-electrochemical detection. LWT-Food Sci. Technol. 2023, 174, 114424. [Google Scholar] [CrossRef]
- Tu, S.; Xue, Y.; Zheng, C.; Qi, Y.; Wan, H.; Mao, L. Detection of passion fruitsand maturity classification using Red-Green-Blue depthimages. Biosyst. Eng. 2018, 175, 156–167. [Google Scholar] [CrossRef]
- Gupta, A.K.; Medhi, M.; Chakraborty, S.; Yumnam, M.; Mishra, P. Development of rapid and non-destructive technique for the determination of maturity indices of pomelo fruit (Citrus grandis). J. Food Meas. Charact. 2021, 15, 1463–1474. [Google Scholar] [CrossRef]
- Lavindi, E.E.; Kusuma, E.J.; Shidik, G.F.; Pramunendar, R.A.; Fanani, A.Z. Neural networkbased on GLCM, and CIE L*a*b* color space to classifytomatoes maturity. In Proceedings of the International Seminar on Applicationfor Technology of Information and Communication (iSemantic), Semarang, Indonesia, 21–22 September 2019; IEEE: New York, NY, USA, 2019; pp. 1–6. [Google Scholar]
- Alamprese, C.; Grassi, S.; Tugnolo, A.; Casiraghi, E. Prediction of olive ripening degree combining image analysis and FT-NIR spectroscopy for virgin olive oil optimisation. Food Control. 2021, 123, 107755. [Google Scholar] [CrossRef]
- Lal, S.; Behera, S.K.; Sethy, P.K.; Rath, A.K. Identification and counting of mature apple fruit based on BP feed forwardneural network. In Proceedings of the Third International Conference on Sensing, Signal Processing and Security (ICSSS), Chennai, India, 4–5 May 2017; IEEE: New York, NY, USA, 2019; pp. 361–368. [Google Scholar]
- Mulyani, E.D.S.; Susanto, J.P. Classification of maturity levelof fuji apple fruit with fuzzy logic method. In Proceedings of the International Conference on Cyber and IT Service Management (CITSM), Denpasar, Indonesia, 8–10 August 2017; IEEE: New York, NY, USA, 2019; pp. 1–4. [Google Scholar]
- Mim, F.S.; Galib, S.M.; Hasan, M.F.; Jerin, S.A. Automatic detectionof mango ripening stages: An application of informationtechnology to botany. Sci. Hortic. 2018, 237, 156–163. [Google Scholar] [CrossRef]
- Othman, M.; Bakar, M.N.A.; Ahmad, K.A.; Razak, T.R. Fuzzy ripeningmango index using RGB colour sensor model. ResearchersWorld 2014, 5, 1–9. [Google Scholar]
- Altaheri, H.; Alsulaiman, M.; Muhammad, G. Date fruit classification for robotic harvesting in a natural environmentusing deep learning. IEEE Access 2019, 7, 117115–117133. [Google Scholar] [CrossRef]
- Faisal, M.; Albogamy, F.; Elgibreen, H.; Algabri, M.; Alqershi, F.A. Deep learning and computer vision for estimating date fruits type, maturity level, and weight. IEEE Access 2020, 8, 206770–206782. [Google Scholar] [CrossRef]
- Fan, Y.; Zhang, S.; Feng, K.; Qian, K.; Wang, Y.; Qin, S. Strawberry maturityrecognition algorithm combining dark channel enhancementand YOLOv5. Sensors 2022, 22, 419. [Google Scholar] [CrossRef]
- Ni, X.; Li, C.; Jiang, H.; Takeda, F. Deep learning image segmentationand extraction of blueberry fruit traits associated withharvestability and yield. Hortic. Res. 2020, 7, 1–14. [Google Scholar] [CrossRef] [PubMed]
- Badeka, E.; Karapatzak, E.; Karampatea, A.; Bouloumpasi, E.; Kalathas, I.; Lytridis, C.; Tziolas, E.; Tsakalidou, V.N.; Kaburlasos, V.G. Adeep learning approach for precision viticulture, assessing grape maturity via YOLOv7. Sensors 2023, 23, 8126. [Google Scholar] [CrossRef] [PubMed]
- Chen, W.; Liu, M.; Zhao, C.; Li, X.; Wang, Y. MTD-YOLO: Multi-task deep convolutional neural network for cherry tomato fruit bunch maturity detection. Comput. Electron. Agric. 2024, 216, 108533. [Google Scholar] [CrossRef]
- Zhu, X.; Chen, F.; Zheng, Y.; Chen, C.; Peng, X. Detection of Camellia oleifera fruit maturity in orchards based on modified lightweight YOLO. Comput. Electron. Agric. 2024, 226, 109471. [Google Scholar] [CrossRef]
- Zhu, X.; Chen, F.; Zhang, X.; Zheng, Y.; Peng, X.; Chen, C. Detection the maturity of multi-cultivar olive fruit in orchard environments based on Olive-EfficientDet. Sci. Hortic. 2024, 324, 112607. [Google Scholar] [CrossRef]
- Xiao, F.; Wang, H.; Xu, Y.; Shi, Z. A Lightweight Detection Method for Blueberry Fruit Maturity Based on an Improved YOLOv5 Algorithm. Agriculture 2024, 14, 36. [Google Scholar] [CrossRef]
- Rahima, K.; Muhammad, H. YOLOv11: An Overview of the Key Architectural Enhancements. arXiv 2024, arXiv:2410.17725. [Google Scholar] [CrossRef]
- Tan, M.; Le, Q. EfficientNet: Rethinking Model Scaling for Convolutional Neural Networks. arXiv 2019, arXiv:1905.11946. [Google Scholar] [CrossRef]
- Lau, K.; Po, L.; Rehman, Y. Large Separable Kernel Attention: Rethinking the Large Kernel Attention Design in CNN. arXiv 2023, arXiv:2309.01439. [Google Scholar] [CrossRef]
- Guo, M.-H.; Lu, C.-Z.; Liu, Z.-N.; Cheng, M.-M.; Hu, S.-M. Visual Attention Network. arXiv 2022, arXiv:2202.09741. [Google Scholar] [CrossRef]
- Liu, S.; Qi, L.; Qin, H.; Shi, J.; Jia, J. Path Aggregation Network for Instance Segmentation. arXiv 2018, arXiv:1803.01534. [Google Scholar] [CrossRef]
- Tan, M.; Pang, R.; Le, Q.V. EfficientDet: Scalable and Efficient Object Detection. arXiv 2020, arXiv:1911.09070. [Google Scholar] [CrossRef]
- Ma, N.; Zhang, X.; Zheng, H.T.; Sun, J. ShuffleNet V2: Practical Guidelines for Efficient CNN Architecture Design. In Proceedings of the European Conference on Computer Vision (ECCV), Munich, Germany, 8–14 September 2018; pp. 116–131. [Google Scholar]
- Liu, X.; Peng, H.; Zheng, N.; Yang, Y.; Hu, H.; Yuan, Y. EfficientViT: Memory Efficient Vision Transformer with Cascaded Group Attention. In Proceedings of the IEEE/CVF Conference on Computer Vision and Pattern Recognition, Vancouver, BC, Canada, 17–24 June 2023; pp. 1–12. [Google Scholar]
- Chukaew, N.; Wettayaprasit, W.; Aiyarak, P. Modified YOLO Model for Small Platform Application Using SimRepCSP Module with Case Study: Objects Detection Model on GlobalWheat2020 Dataset. In Proceedings of the 27th International Computer Science and Engineering Conference (ICSEC), Samui Island, Thailand, 14–15 September 2023; pp. 138–142. [Google Scholar]
- Liu, Z.; Lin, Y.; Cao, Y.; Hu, H.; Wei, Y.; Zhang, Z.; Lin, S.; Guo, B. Swin Transformer: Hierarchical Vision Transformer using Shifted Windows. In Proceedings of the IEEE/CVF International Conference on Computer Vision, Montreal, BC, Canada, 11–17 October 2021; pp. 10012–10022. [Google Scholar]
- Hu, J.; Shen, L.; Sun, G. Squeeze-and-excitation networks. In Proceedings of the IEEE Conference on Computer Vision and Pattern Recognition, Salt Lake City, UT, USA, 18–23 June 2018; pp. 7132–7141. [Google Scholar]
- Woo, S.; Park, J.; Lee, J.Y.; Kweon, I.S. Cbam: Convolutional block attention module. In Proceedings of the European Conference on Computer Vision (ECCV), Munich, Germany, 8–14 September 2018; pp. 3–19. [Google Scholar]
- Wang, Q.; Wu, B.; Zhu, P.; Li, P.; Zuo, W.; Hu, Q. ECA-Net: Efficient Channel Attention for Deep Convolutional Neural Networks. In Proceedings of the IEEE/CVF Conference on Computer Vision and Pattern Recognition, Seattle, WA, USA, 13–19 June 2020; pp. 11534–11542. [Google Scholar]
- Chen, J.; Ma, A.; Huang, L.; Li, H.; Zhang, H.; Huang, Y.; Zhu, T. Efficient and lightweight grape and picking point synchronous detection model based on key point detection. Comput. Electron. Agric. 2024, 220, 108914. [Google Scholar] [CrossRef]
- Li, H.; Gu, Z.; He, D.; Wang, X.; Huang, J.; Mo, Y.; Li, P.; Huang, Z.; Wu, F. A lightweight improved YOLOv5s model and its deployment for detecting pitaya fruits in daytime and nighttime light—Supplement environments. Comput. Electron. Agric. 2024, 220, 108914. [Google Scholar] [CrossRef]
| Disclaimer/Publisher’s Note: The statements, opinions and data contained in all publications are solely those of the individual author(s) and contributor(s) and not of MDPI and/or the editor(s). MDPI and/or the editor(s) disclaim responsibility for any injury to people or property resulting from any ideas, methods, instructions or products referred to in the content. |
© 2025 by the authors. Licensee MDPI, Basel, Switzerland. This article is an open access article distributed under the terms and conditions of the Creative Commons Attribution (CC BY) license (https://creativecommons.org/licenses/by/4.0/).


