Article

Research on the Optimal Water and Fertilizer Scheme for Maize in a Typical Hydrological Year Based on the DSSAT Model

School of Water Conservaney, North China University of Water Resources and Electric Power, Zhengzhou 450046, China
*
Author to whom correspondence should be addressed.
Agronomy 2025, 15(5), 1085; https://doi.org/10.3390/agronomy15051085
Submission received: 25 March 2025 / Revised: 27 April 2025 / Accepted: 28 April 2025 / Published: 29 April 2025
(This article belongs to the Section Water Use and Irrigation)

Abstract

:
Maize is vital for global and Chinese food security. Yet, in Henan Province, a key maize-growing region in China, water scarcity, uneven rainfall, and inefficient irrigation and fertilization limit its yield and quality. This study combines a two-year field experiment (2023–2024) with the DSSAT model to optimize irrigation and fertilization for typical hydrological years (wet, normal, and dry). After calibration and validation with field data, the DSSAT model showed strong performance. Results indicate that optimal irrigation timing and volume vary with hydrological years: no irrigation is needed in wet years, one 30 mm irrigation at the tasseling (VT) stage in normal years, and three irrigations (total 90 mm) at the emergence (VE), jointing (VT), and grain filling (R2) stages in dry years. The optimal nitrogen fertilizer is 240 kg·ha−1 in water-rich and normal years and 180 kg·ha−1 in dry years. These optimized schemes can achieve 98–100% of maximum potential maize yields across hydrological years, offering practical insights for enhancing agricultural water and nutrient management in central Henan to support sustainable development and reduce environmental impacts.

1. Introduction

Maize is one of the most critical cereal crops globally, accounting for over 26% of China’s total cultivated area [1]. Henan Province, a vital maize production region in China, holds significant national importance in both planting area and yield [2]. However, escalating water scarcity, uneven rainfall distribution during the maize growing season (June to September), and substantial interannual precipitation variability [3] have subjected maize crops to varying degrees of water stress, severely compromising their yield and quality.
Furthermore, unscientific irrigation and irrational fertilization practices in current maize cultivation [4], including localized over-irrigation and excessive fertilizer application, exacerbate resource inefficiency [5] and induce environmental degradation such as soil salinization, nutrient imbalance, and water pollution, thereby constraining sustainable maize production [6,7,8]. In semi-arid regions, water and nitrogen management play decisive roles in crop growth, development, and ultimate yield [9]. Drip irrigation, by delivering water and nutrients precisely to the root zone, minimizes evaporation and leaching losses, thereby enhancing resource use efficiency [10,11]. Optimal water–fertilizer management is crucial for maize productivity [12,13], with field experiments demonstrating that coordinated irrigation and fertilization strategies can regulate root zone dynamics and improve yield [14].
Traditional approaches to optimizing water–nitrogen regimes rely heavily on labor-intensive field trials [15,16], which fail to systematically quantify interactions among climatic conditions, crop genotypes, soil types, and agronomic practices across diverse regions and years [17]. Crop growth models, particularly the Decision Support System for Agrotechnology Transfer (DSSAT), have emerged as powerful tools to address these limitations [18,19,20].
Allakonon et al. [21] identified optimal irrigation–fertilization combinations for off-season maize using the CERES-Maize module; Shen et al. [22] developed an irrigation decision framework for winter wheat using support vector machine algorithms integrated with DSSAT; Bai et al. [23] coupled DSSAT with genetic algorithms to optimize water–nitrogen regimes, achieving yield increases of 1.9–2.6% and economic returns of 7.3–8.9%; Jing et al. [24] analyzed water management impacts on spring wheat yield and water stress in Canada; Rugira et al. [25] optimized irrigation scheduling and planting dates for spring maize in the Loess Plateau (Fen River Basin).
Although there has been progress in optimizing water and nitrogen management based on models, there are still some gaps. First, there is a need for further exploration of systematically optimizing the irrigation and fertilization of summer maize in Henan Province, especially in typical hydrological years (wet, normal, and dry). Second, the potential of the DSSAT model to address these challenges in central Henan has not been fully evaluated. In response to the above issues and challenges, this study proposes the following hypothesis: optimizing the irrigation and fertilization strategies for maize in central Henan using the DSSAT model can improve yield and water use efficiency and reduce resource waste and environmental impacts.
To gain a deeper understanding of the irrigation and fertilization schemes in the Henan region and to make the simulation methods more easily applicable, this study conducted a two-year field experiment from 2023 to 2024 to calibrate and verify the DSSAT model. In addition, the DSSAT model was used to optimize the irrigation and fertilization schemes for typical years based on weather data from Zhengzhou from 1995 to 2024. The main objectives of this study are to test the applicability of the DSSAT model for simulating maize growth under the climatic and soil conditions of central Henan; determine the optimal timing, amount of irrigation, and nitrogen application rates for summer maize under wet, normal, and dry hydrological years; and provide scientific recommendations for improving regional agricultural water and nutrient management to support sustainable development and resource efficiency.

2. Materials and Methods

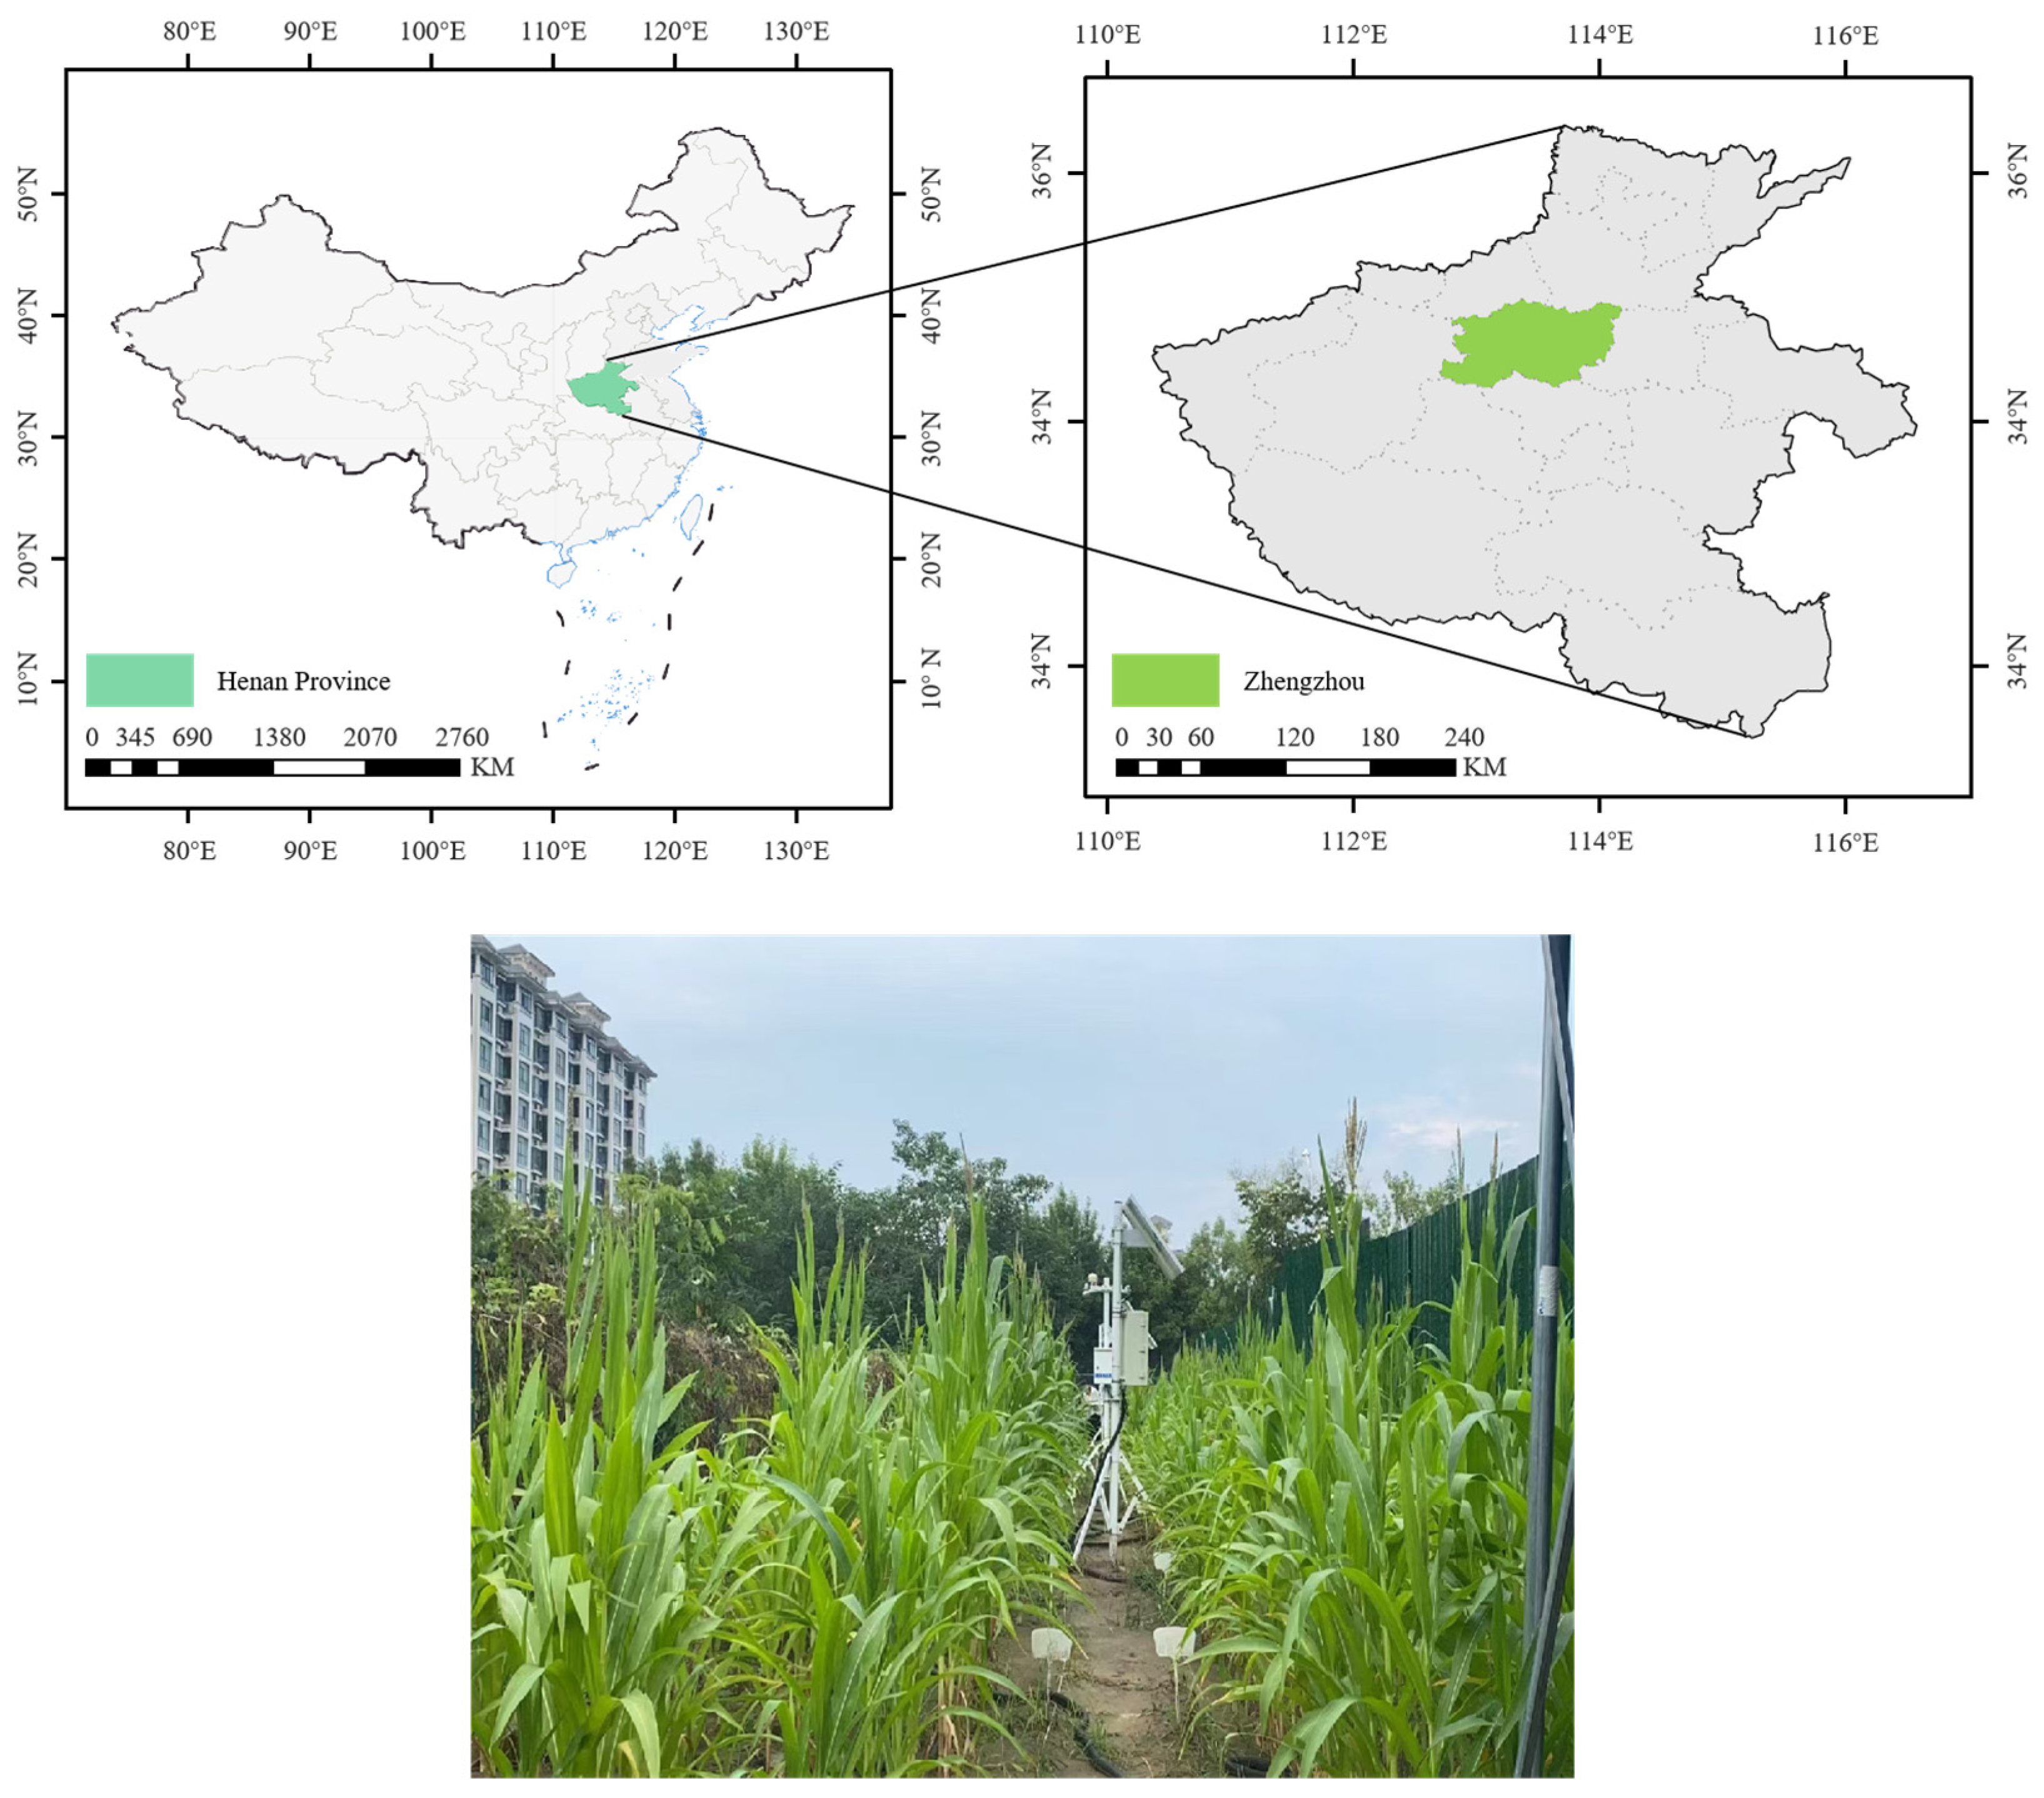
2.1. Subsection Overview of the Study Area

The field experiment was conducted during 2023–2024 at the Agricultural High-Efficiency Water Use Experimental Station on the Longzihu Campus of North China University of Water Resources and Electric Power, Zhengzhou City, Henan Province (Figure 1). The site (34.78° N, 113.76° E; 110 m above sea level) lies within the Central China Plain and experiences a warm temperate continental monsoon climate characterized by distinct seasonal variations with hot, rainy summers (June–September precipitation accounts for ~70% of annual rainfall) and relatively dry springs and winters. The average annual rainfall is 800 mm, and the average sunshine duration is about 6.57 h·d−1. The irrigation water is public tap water, with a pH of 8.1, an electrical conductivity of 96 μS·cm−1, a salinity of 0.12 g·L−1, a sodium ion concentration of 26.13 mg·L−1, and a chloride ion concentration of 14.21 mg·L−1. The content of potential pollutants (such as heavy metals, organic substances, and disinfection by-products) is extremely low and negligible. The experimental field features a flat topography with surface soil classified as sandy loam. The concentration of soil organic matter at 0–100 cm was 831 mg·kg−1; the concentration of available potassium was 101.3 mg·kg−1; the concentration of available phosphorus was 12.1 mg·kg−1; the concentration of total nitrogen was 512.5 mg·kg−1, and the concentration of alkali-hydrolyzable nitrogen was 53.4 mg·kg−1. The effective concentrations of copper, zinc, iron, and manganese were 10.02, 27.63, 2.72, and 0.12 mg·kg−1 respectively. The soil cation exchange capacity was 7.19 cmol·kg−1, and the alkali saturation was 81%.

2.2. Field Experiment Design

The field trials utilized the maize cultivar Zhengdan 958 (bought at the local agricultural store) across both experimental years (2023–2024). In 2023, sowing occurred on June 10 at a depth of 3 cm with a planting density of 66,667 plants·ha−1, followed by harvesting on 29 September. The 2024 season featured an earlier sowing date (8 June) with identical planting depth but increased density (70,408 plants·ha−1), concluding with harvest on 25 September. In the past two years, before planting maize, winter wheat was planted. The experimental treatments included one rain-reared treatment (A1), one drip irrigation treatment (B1), and two nitrogen fertilizer treatments (N1 and N2). All treatments were based on nitrogen application at 68 kg·ha−1, and the remaining nitrogen fertilizers were evenly distributed, with topdressing during the jointing stage and the grain filling stage. The amount of water applied for each drip irrigation treatment is 30 mm (Table 1). The experiment adopted a split-plot design with three replications using 4 × 4 m plots. Maize phenological development was monitored across five critical growth stages: emergence (VE), jointing (VJ), tasseling (VT), grain filling (R2), and physiological maturity (R6).

2.3. Data Measurement and Sources

2.3.1. Plant Growth Measurements

Five representative plants per plot were selected for measurement. The leaf area index (LAI) was determined using an LAI-2200C Plant Canopy Analyzer (LI-COR Biosciences, Lincoln, NE, USA). Plant height was measured with a tape measure (1 mm precision), while ear length and diameter were quantified using vernier calipers (1 mm accuracy). At each growth stage, five plants per plot, representing average growth conditions, were sampled. After removing underground biomass, shoots were deactivated at 105 °C for 0.5 h and oven-dried at 75 °C to a constant weight. Aboveground biomass was calculated by multiplying the dry weight by planting density. Post-harvest, maize ears were sun-dried to a safe moisture content (14%) before measuring the ear count, kernel number per ear, and 100-grain weight. Grain yield was subsequently computed based on these parameters.

2.3.2. Water Use Efficiency and Yield

  • Water consumption of crops (ET, mm)
    E T = I + Δ W + P + K D
    where I represents the irrigation volume within a certain period (mm); Δ W represents the variation in water storage in the soil layer at a depth of 1 m within the period (mm); P represents the effective rainfall during the period (mm); K represents the groundwater replenishment volume (mm) within the time period; and D represents the leakage volume within a certain period (mm). Because the average groundwater burial depth in the test area is relatively large (greater than 7 m) and the rated drip irrigation water is small, K and D are not considered.
  • Water use efficiency (WUE, mm)
    W U E = Y / ( E T × 10 )
    where Y is grain yield (kg·ha−1), E T is crop water consumption (mm), and 10 is the proportional factor.
  • Partial factor productivity of nitrogen fertilizer (PFPN, kg·kg−1)
    P F P N = Y N / N
    where Y N represents the yield in the nitrogen application area (kg·ha−1) and N represents the nitrogen application rate (kg·ha−1).

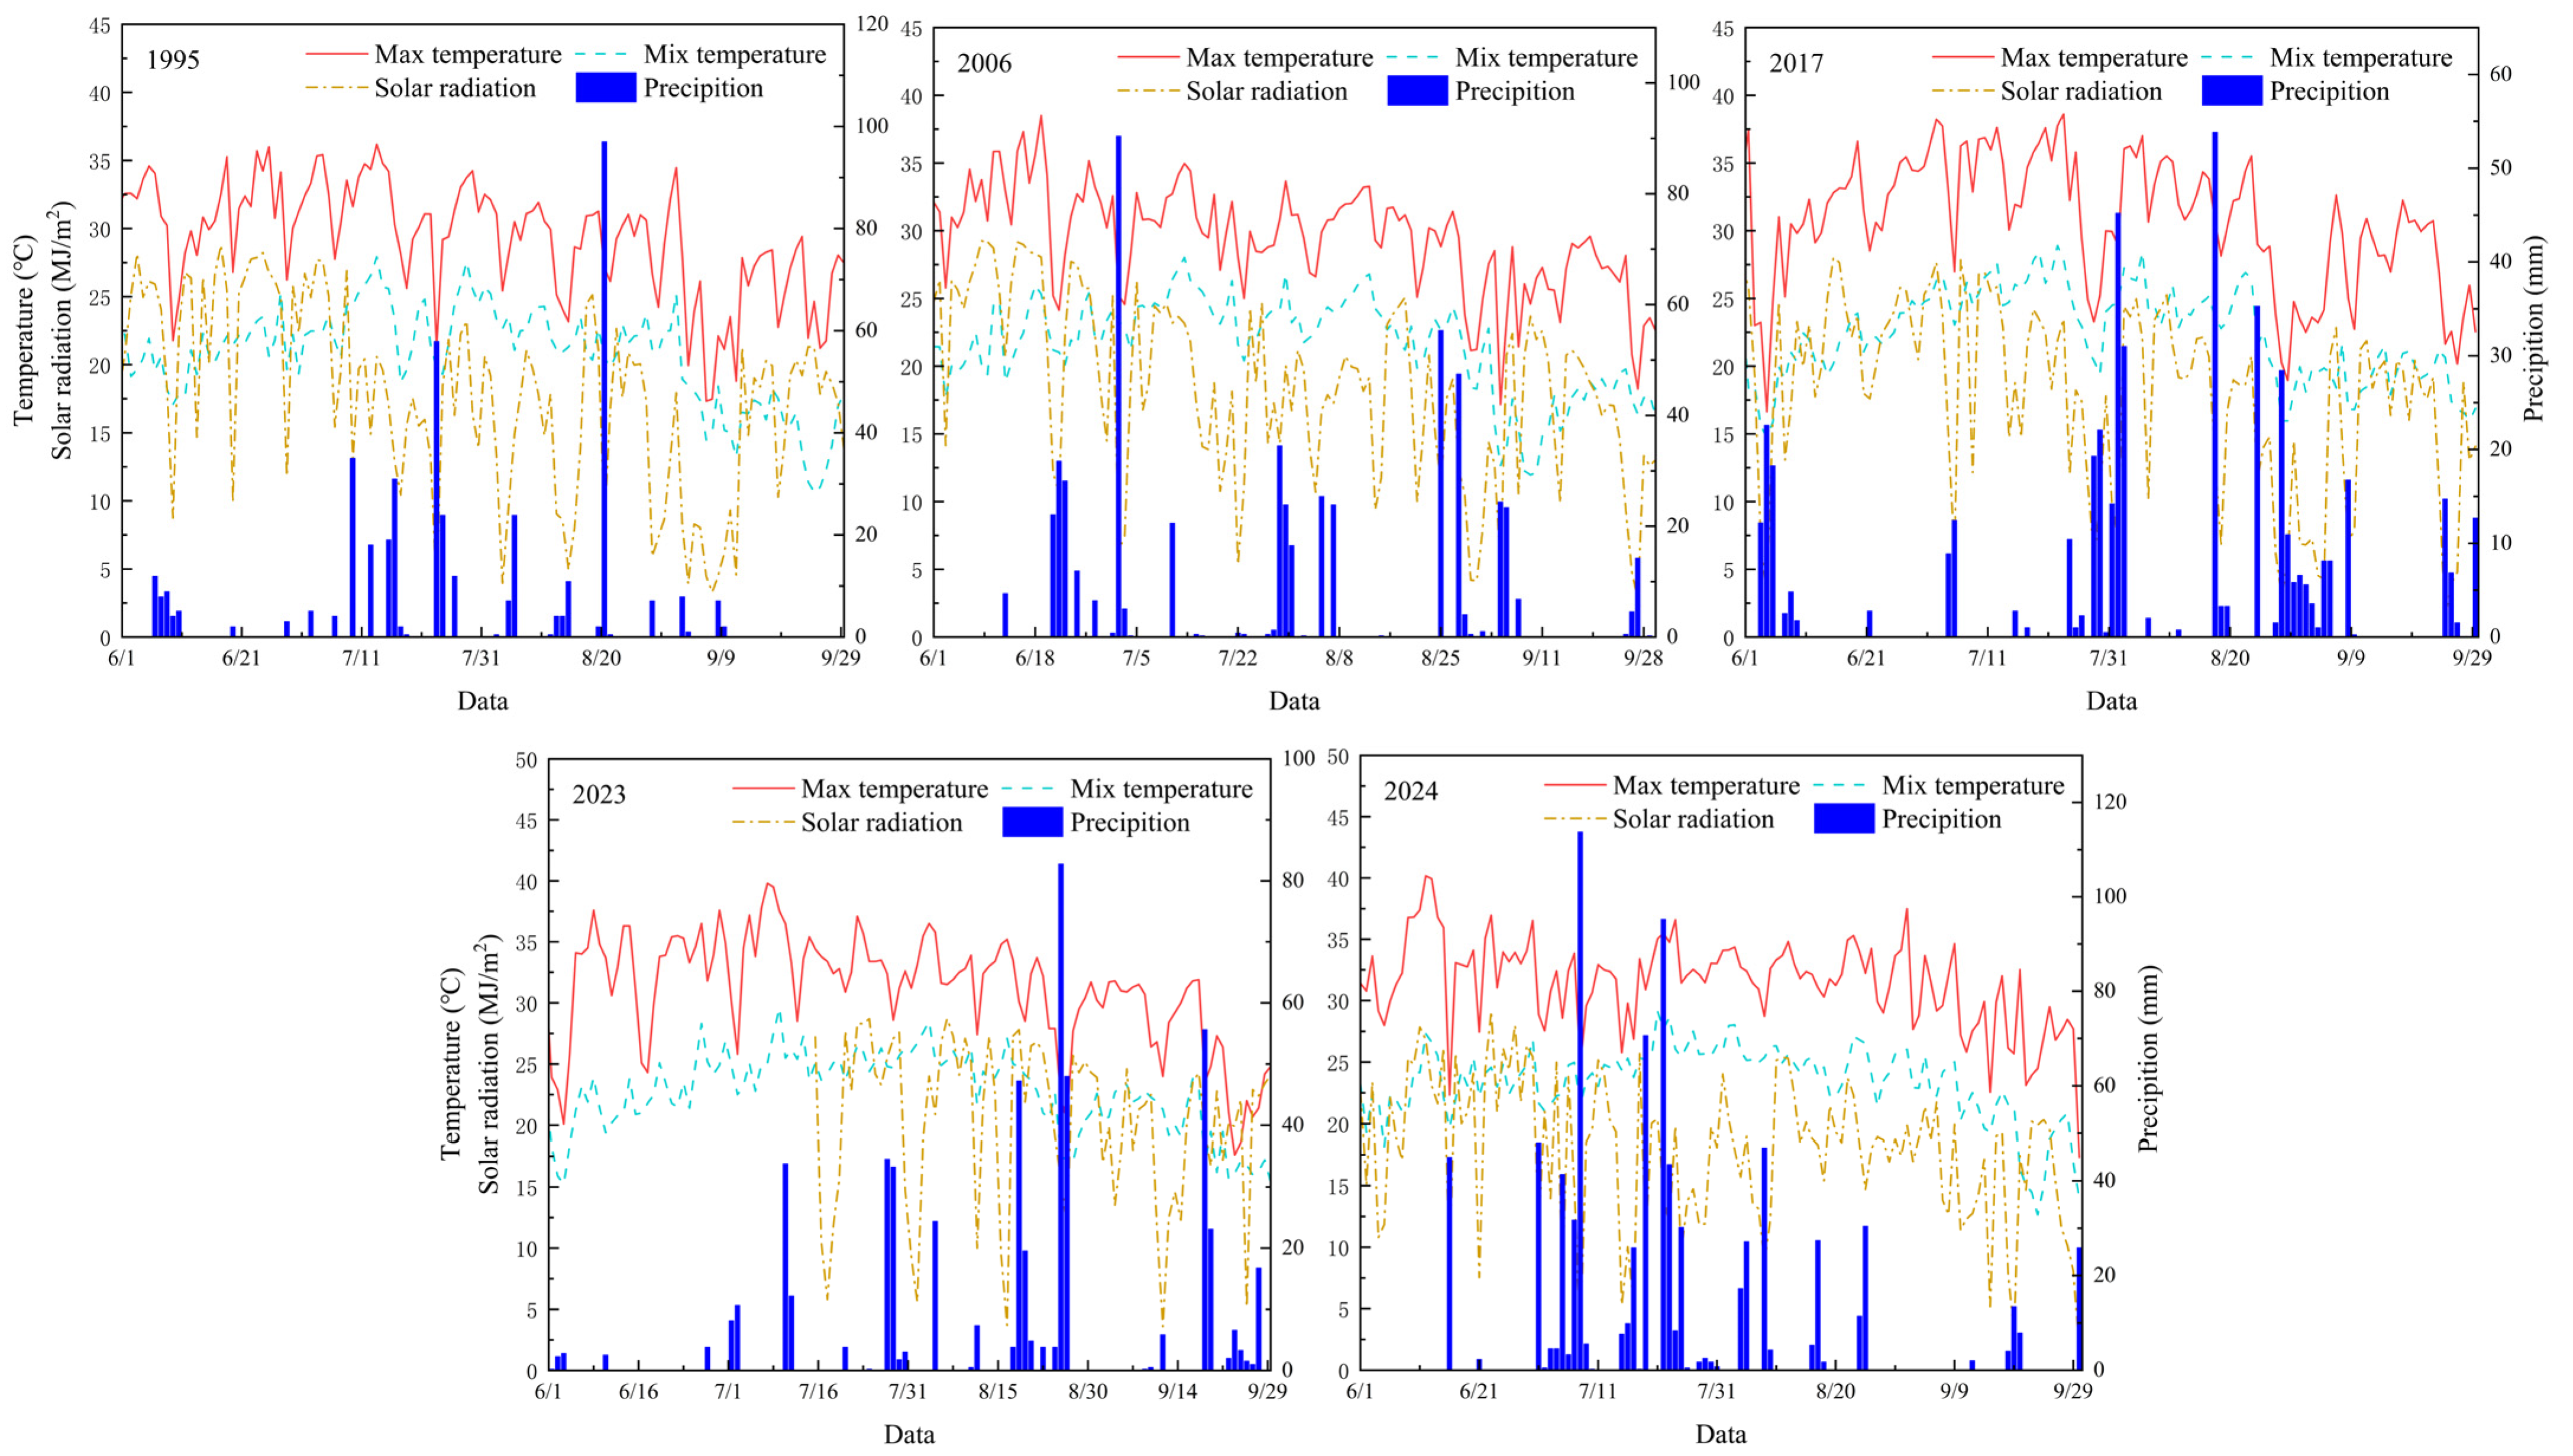
2.3.3. Meteorological Data

Meteorological data collected in this study included the daily maximum temperature, minimum temperature, precipitation, and solar radiation. The data for 2023–2024 are from the automatic weather station in the test field. During the growth period of maize (June to September), the relative humidity is between 45% and 98%, and the reference evapotranspiration is between 350 and 430 mm. The historical records from 1995 to 2022 are from the National Meteorological Science Data Sharing Service Platform. Based on a 30-year precipitation series (1995–2024) during maize growing seasons, typical hydrological years were classified using Pearson Type III frequency distribution analysis. Rainfall thresholds corresponding to cumulative probabilities of P = 25%, 50%, and 75% and were designated as wet, normal, and dry hydrological years, respectively. Specific representative years were identified as follows: wet year (2006, 536.7 mm), normal year (2017, 467.36 mm), and dry year (1995, 427.23 mm). The meteorological characteristics of these typical years are summarized in Figure 2.

2.3.4. Soil Data

Soil data were derived from field-measured parameters (Table 2). Soil particle size distribution was determined using a Rise-2002 wet-process laser (Runzhi Instrument Co., Ltd., Jinan, China) particle size analyzer. Field capacity, saturated water content, and bulk density were measured via the core cutter method. Organic carbon content was quantified with a TOC analyzer. Nitrate nitrogen and ammonium nitrogen were analyzed through ion chromatography and distillation methods, respectively. Soil moisture and water potential were measured using soil moisture sensors and soil water potential meters.

2.4. DSSAT Model Configuration and Scenario Setup
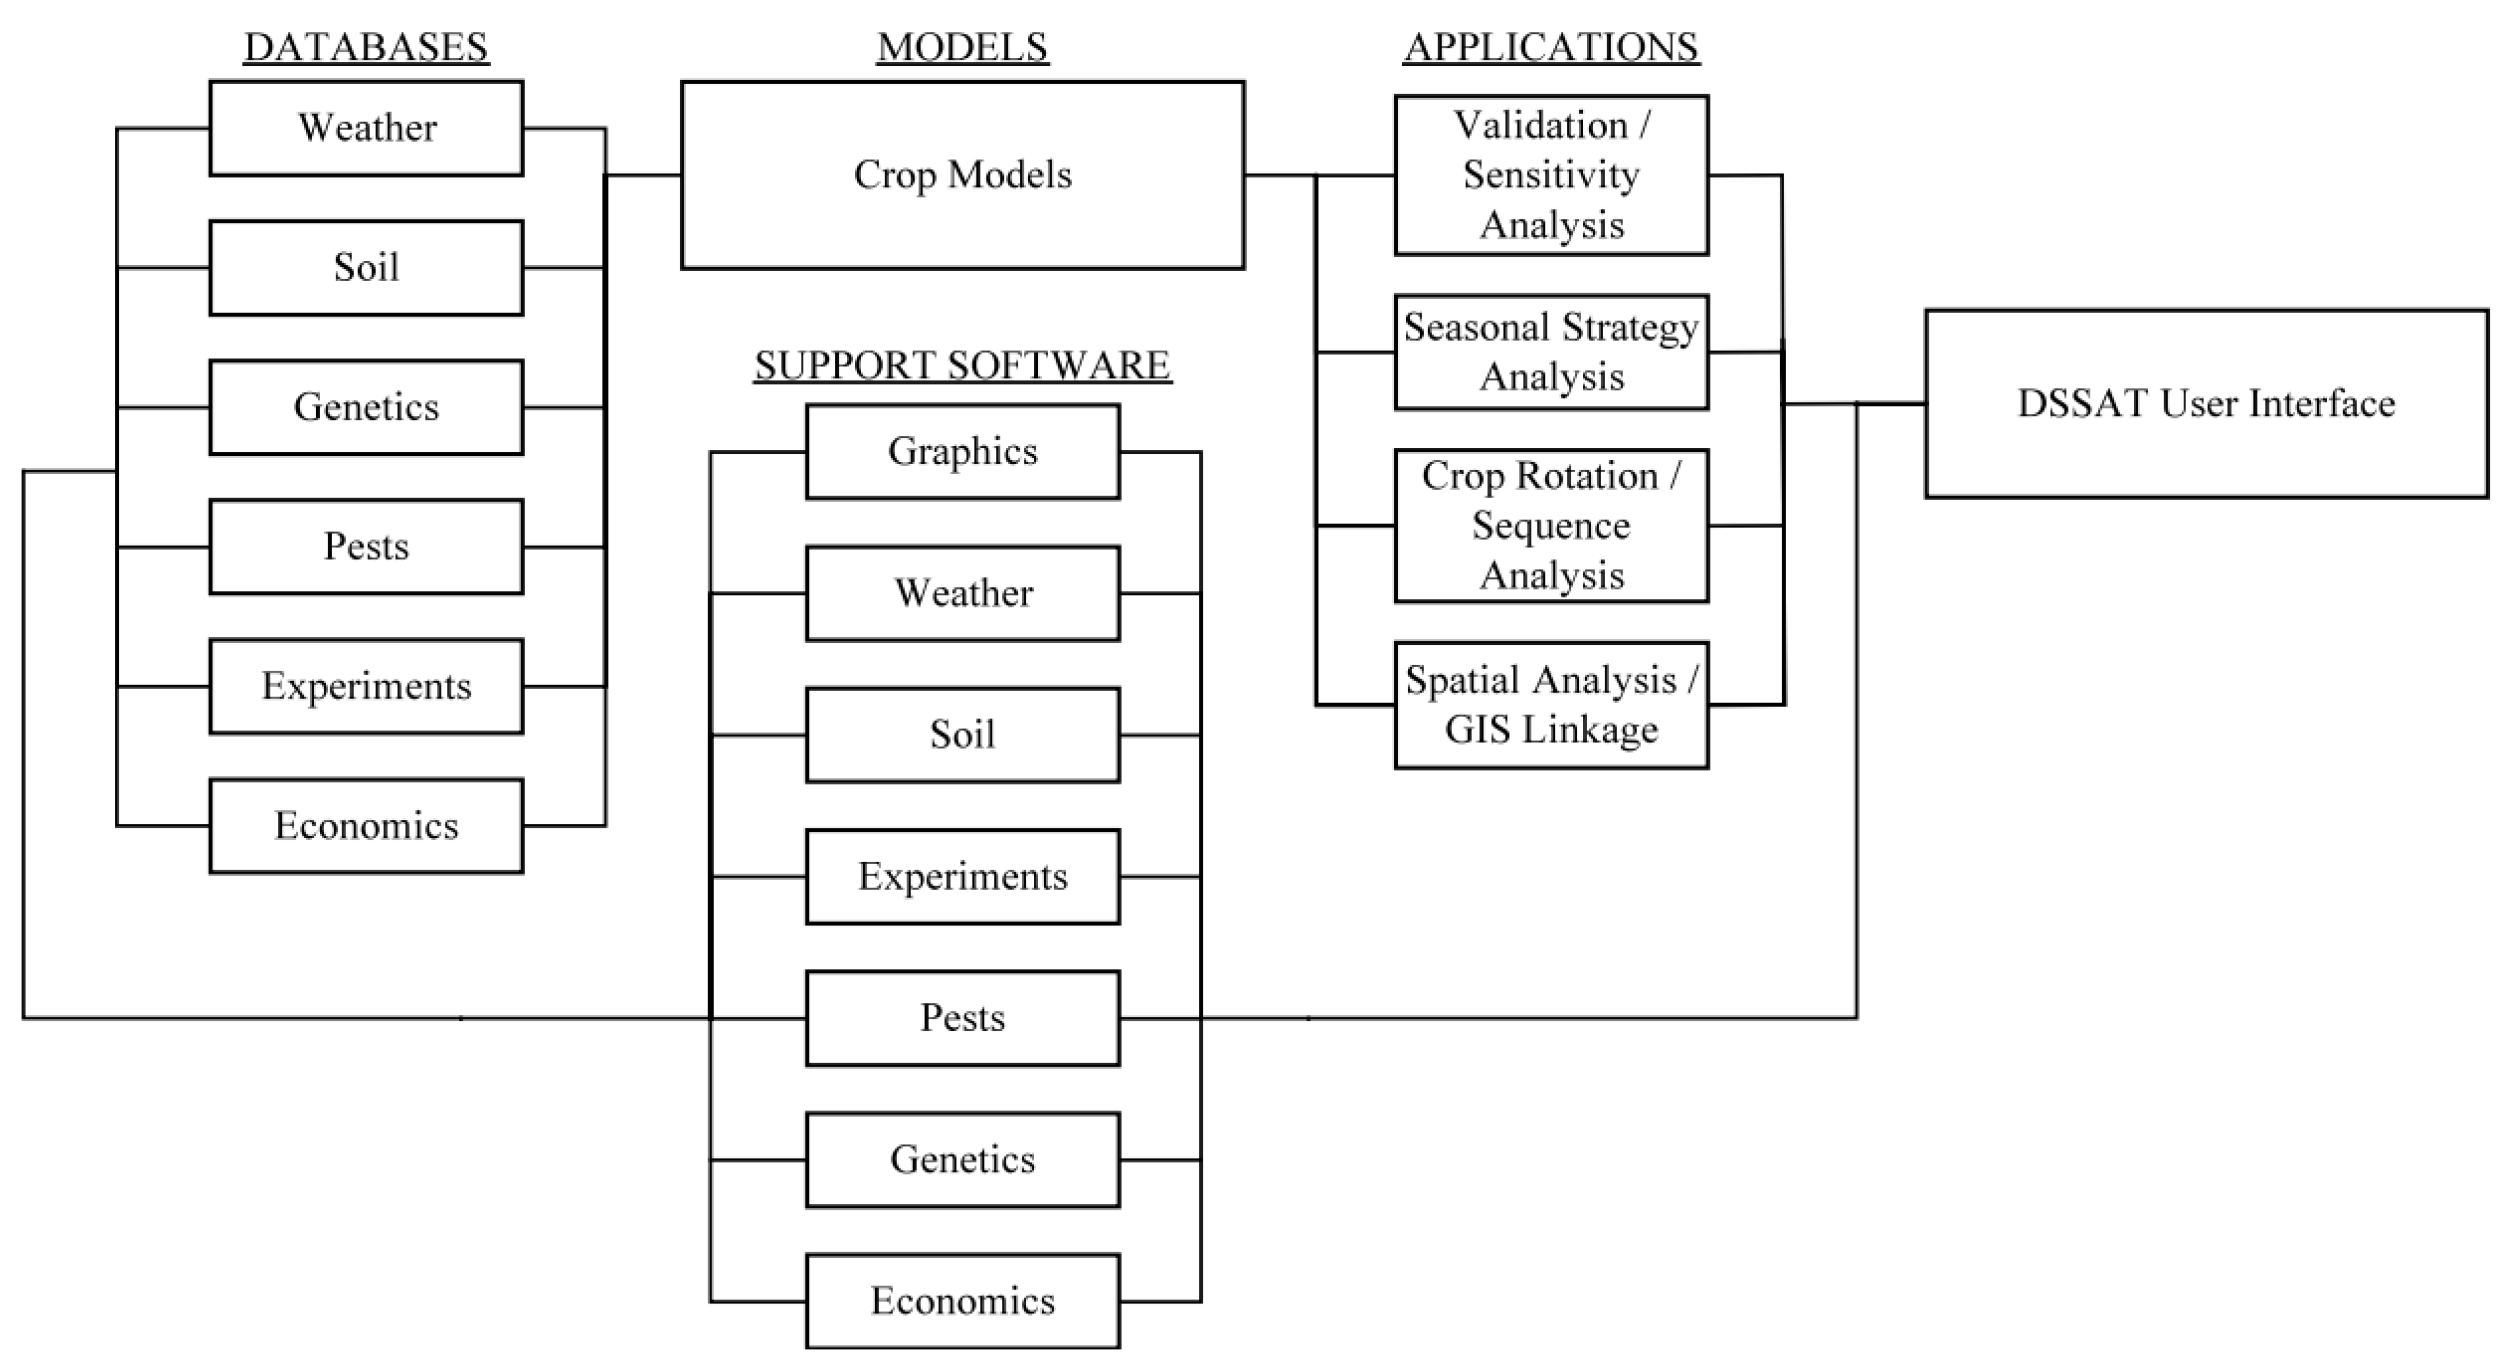
2.4.1. DSSAT Model

The DSSAT model integrates four primary input datasets: soil properties, meteorological conditions, field management practices, and cultivar-specific genetic parameters. According to the DSSAT model user manual, the crop variety parameters are P1: thermal time required to complete the juvenile phase under non-photosensitive conditions (°C·d−1); P2: photoperiod sensitivity coefficient (°C·d−1); P5: grain filling duration parameter (°C·d−1); G2: maximum potential kernel number per plant; G3: maximum kernel growth rate parameter (mg·kernel−1·d−1); and PHINT: characteristic parameters of leaf ejection interval (°C·d−1). Operating at a daily time step, the model simulates maize growth dynamics and outputs critical variables including the yield, phenological stages, leaf area index (LAI), biomass accumulation, and soil moisture content. These outputs facilitate model calibration and validation against observed field data. The structure of the DSSAT model is shown in Figure 3.

2.4.2. Irrigation Period Simulation

Under the condition of no nutritional stress, 5 drip irrigation modes were set based on 4 key growth periods (VE, VJ, VT, and R2): no irrigation, one irrigation, two irrigations, three irrigations, and four irrigations, with each irrigation comprising 50 mm for a total of 16 irrigation combinations (Table 3).

2.4.3. Irrigation Amount Simulation

Based on the optimized irrigation period results, irrigation volume simulations were conducted during the identified critical growth stages. Six irrigation levels were tested, corresponding to 10, 20, 30, 40, 50, and 60 mm per application, to systematically quantify yield responses under varying water supply intensities.

2.4.4. Fertilization Rate Simulation

Building upon the optimized irrigation period and volume, this study simulated the effects of varying nitrogen application rates on maize yield across typical hydrological years. The fertilization time and method are consistent with the above, with four nitrogen application rates examined: 120, 180, 240, and 300 kg·ha−1.

2.5. Data Analysis and Model Evaluation

Statistical analyses were performed using SPSS 26 to evaluate treatment effects on target variables through the analysis of variance (ANOVA) at a significance level of α = 0.05, with post hoc comparisons differentiated using Duncan’s multiple range test (denoted by lowercase letters). The Shapiro–Wilk test results showed that the p values of all key variables were greater than 0.05, indicating that there was no significant deviation from the normal distribution. The Levene test results showed that the p values of all comparisons were not significant (p > 0.05), indicating that the differences among the groups were uniform. These findings prove that it is reasonable to conduct data analysis using the analysis of variance. The coefficient of determination (R2), root mean square error (RMSE), normalized mean root mean square error (nRMSE), and mean bias (MB) were used for model evaluation. The formula is as follows:
R 2 = 1 i = 1 n ( S i M i ) 2 i = 1 n ( M i M ¯ ) 2
R M S E = 1 n i = 1 n ( S i M i ) 2
n R M S E = R M S E M ¯
M B = 1 n i = 1 n ( S i M i )
where n represents the sample size, S denotes simulated values, M indicates measured values, and M ¯ is the mean of measured values.

3. Results

3.1. Analysis of Maize Growth Characteristics

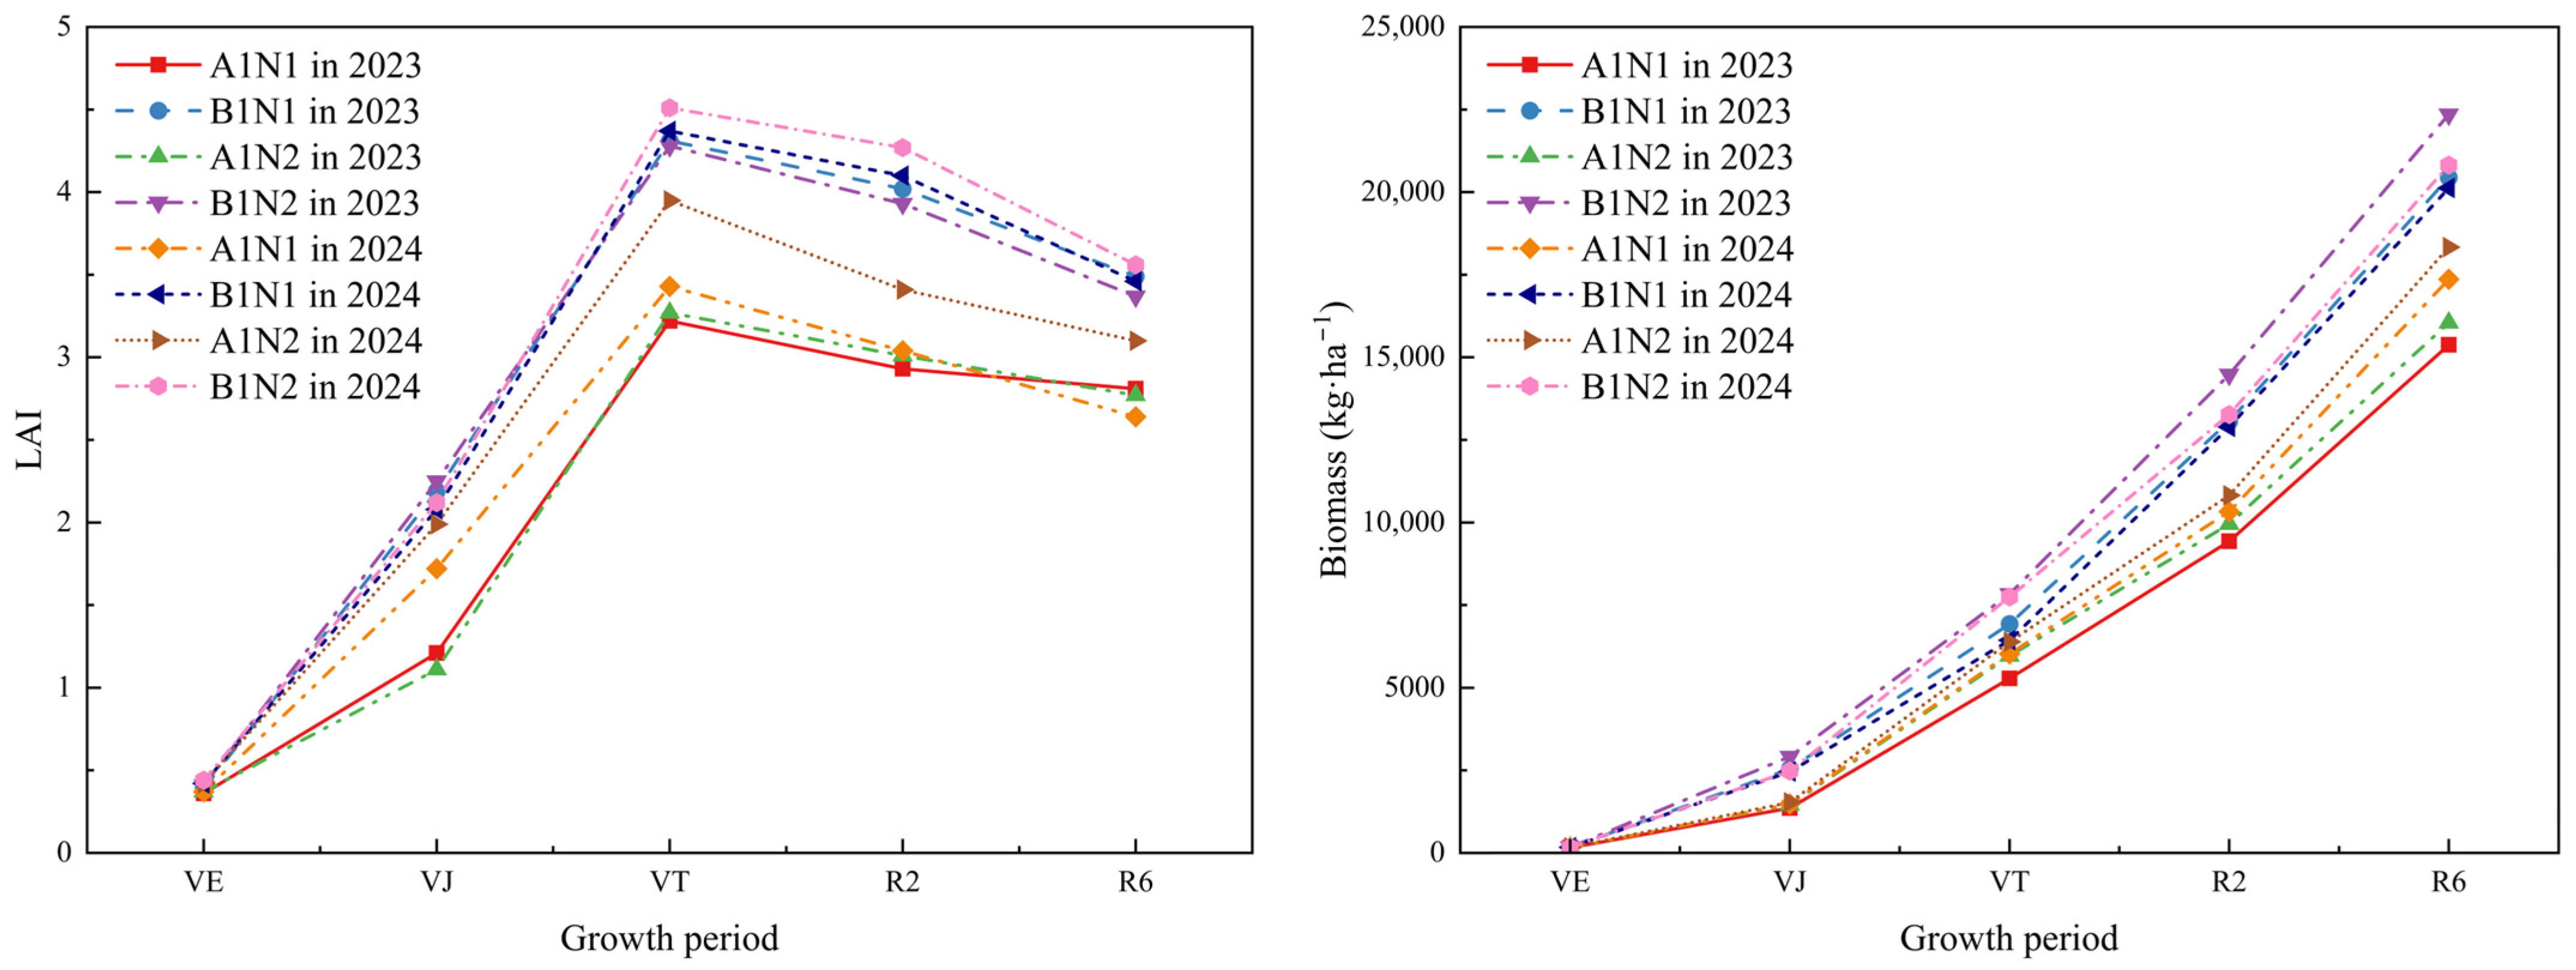
3.1.1. LAI and Biomass

The leaf area index (LAI), a critical indicator of canopy development and photosynthetic capacity, exhibited unimodal trends across both experimental years (2023–2024), as illustrated in Figure 4. During the VE stage, the LAI increased gradually, followed by accelerated growth from VJ to VT, peaking at VT. Under the B1 treatment, the LAI at the VT stage in 2023 and 2024 was 32.37% and 26% higher than under the A1 treatment, respectively. Similarly, the LAI under the N2 treatment showed a slight increase compared to the N1 treatment. Post-VT, the LAI declined progressively during grain filling (R2) due to nutrient reallocation to reproductive organs. Comparatively lower LAI values under A1 indicated water stress-induced premature leaf senescence and reduced functional leaf duration.
Biomass accumulation, a key determinant of yield formation, showed consistent growth across phenological stages (Figure 4). Drip irrigation consistently outperformed rainfed conditions, demonstrating enhanced water availability that promoted biomass production. Similarly, maize biomass showed an increasing trend as nitrogen application increased. Initial biomass at VE remained comparable between treatments (158–175 kg·ha−1). From VJ onward, B1N2 exhibited accelerated biomass accumulation, particularly in 2023, achieving a maximum biomass of 22,355 kg·ha−1—the highest recorded across both years. The 2024 B1N2 treatment followed closely, reaching 20,818 kg·ha−1 at physiological maturity.

3.1.2. Maize Yield and Yield Components

Table 4 presents the maize yield and yield components under different treatments during 2023–2024. Over the two-year study, the ear length across all treatments ranged from 12.36 to 16.42 cm. This indicates that irrigation and fertilization have a positive effect on maize ear length. Specifically, the irrigated maize showed an ear length increase of 19.95% compared to the rainfed treatment. Meanwhile, the ear length in the N2 fertilization treatment was 7.21% longer than in the N1 treatment. Furthermore, irrigation enhanced the ear diameter by 11.50% (2023) and 8.35% (2024) relative to rainfed treatments, though no statistically significant differences were observed between treatments. Irrigation significantly increased the kernel number per ear, with 15.93% (2023) and 13.49% (2024) improvements over rainfed counterparts. Over the two years, the N2 treatment showed a 5.68% and 3.88% higher grain number per ear than the N1 treatment. The 100-grain weight across treatments varied from 24.73 to 32.57 g. On average, the irrigated treatment was 19.20% higher than the rainfed treatment, and the N2 treatment was 7.56% higher than the N1 treatment. The yield of the irrigation treatment was significantly higher than that of the rainfed treatment, showing that irrigation can boost maize output. Compared to the N1 treatment, the yield of the N2 treatment also rose markedly, indicating that increasing the fertilizer application rate can likewise enhance maize yield.

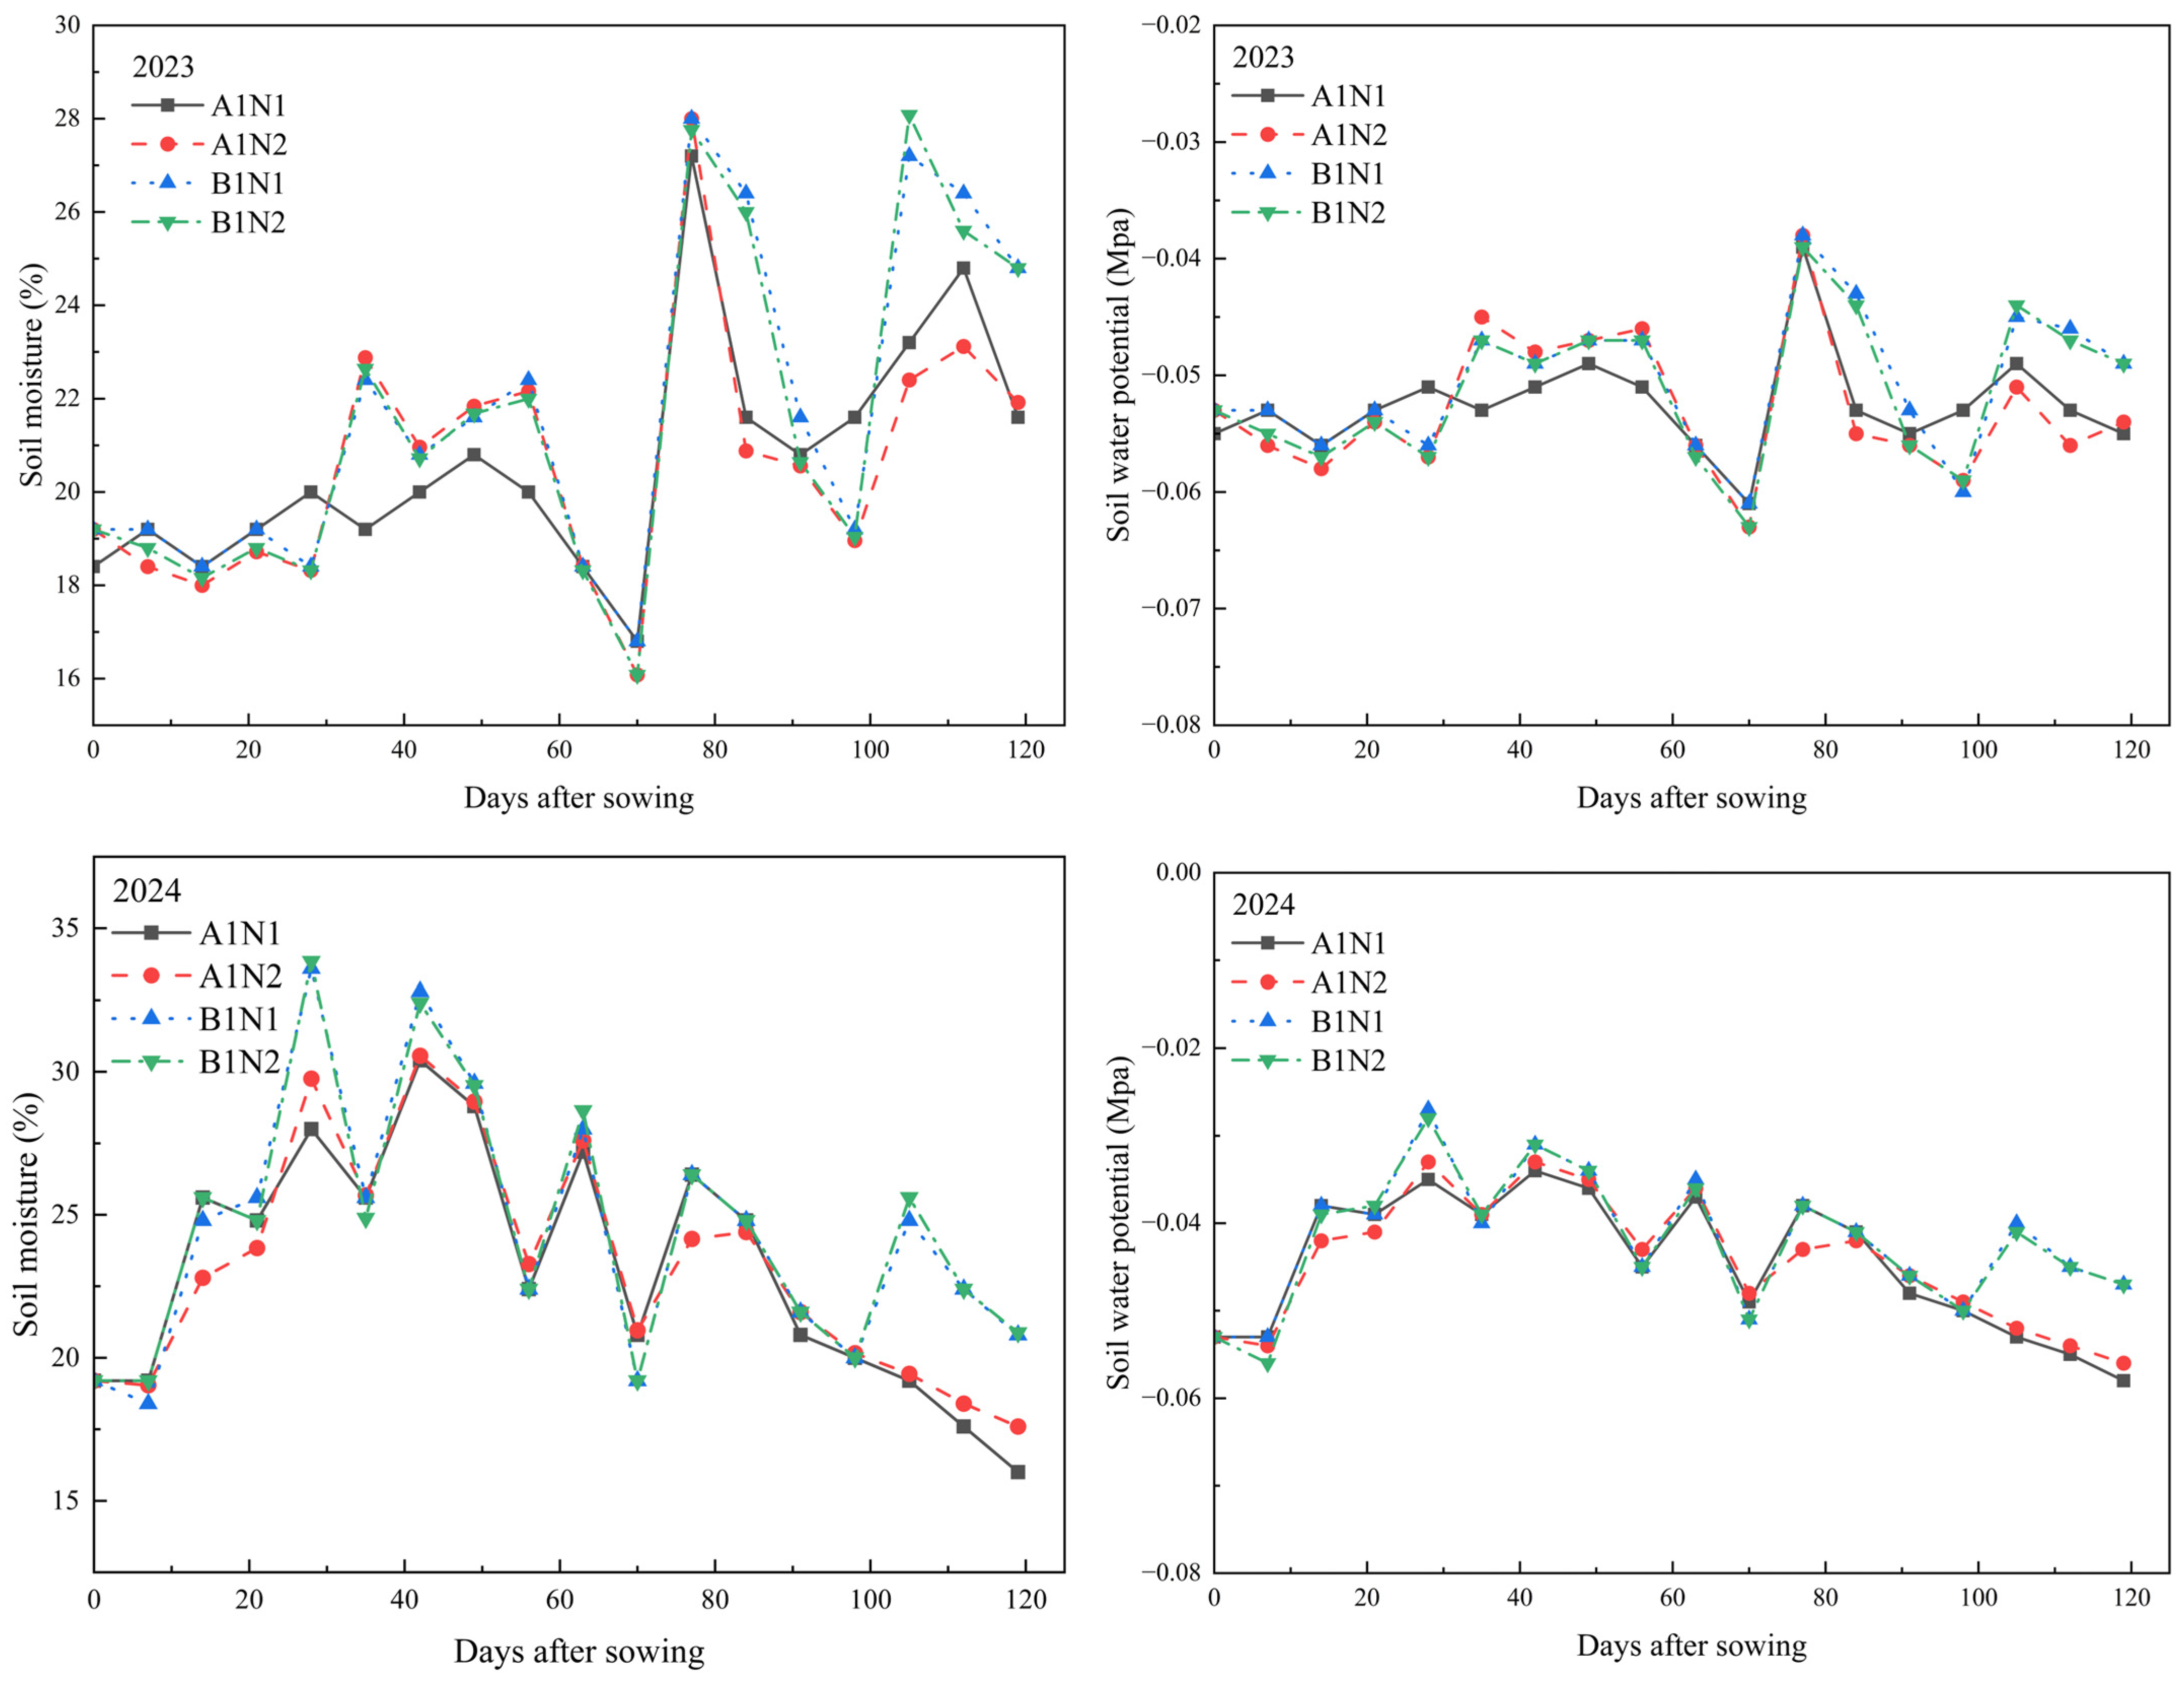
3.1.3. Soil Water Balance and Soil Water Variation Analysis

Table 5 shows that in 2023, the B1N1 and B1N2 treatments, which involved irrigation, had higher evapotranspiration (366.24 mm and 381.13 mm) and larger water balance differences (225.29 mm and 210.4 mm) than the A1N1 and A1N2 treatments, which had no irrigation. Consequently, the maize yields of B1N1 and B1N2 were also higher. In 2024, a similar trend was observed, with B1N1 and B1N2 still outperforming A1N1 and A1N2 in evapotranspiration and maize yield. Figure 5 indicates that in the non-irrigated A1N1 and A1N2 treatments, the water potential declined due to crop growth and increased evapotranspiration. In contrast, irrigation in B1N1 and B1N2 mitigated soil water depletion, maintaining higher water potential. Overall, the irrigated B1N1 and B1N2 treatments surpassed the non-irrigated A1N1 and A1N2 treatments in soil water potential, moisture, and maize yield, proving that irrigation is an effective way to boost crop output and enhance soil moisture conditions.

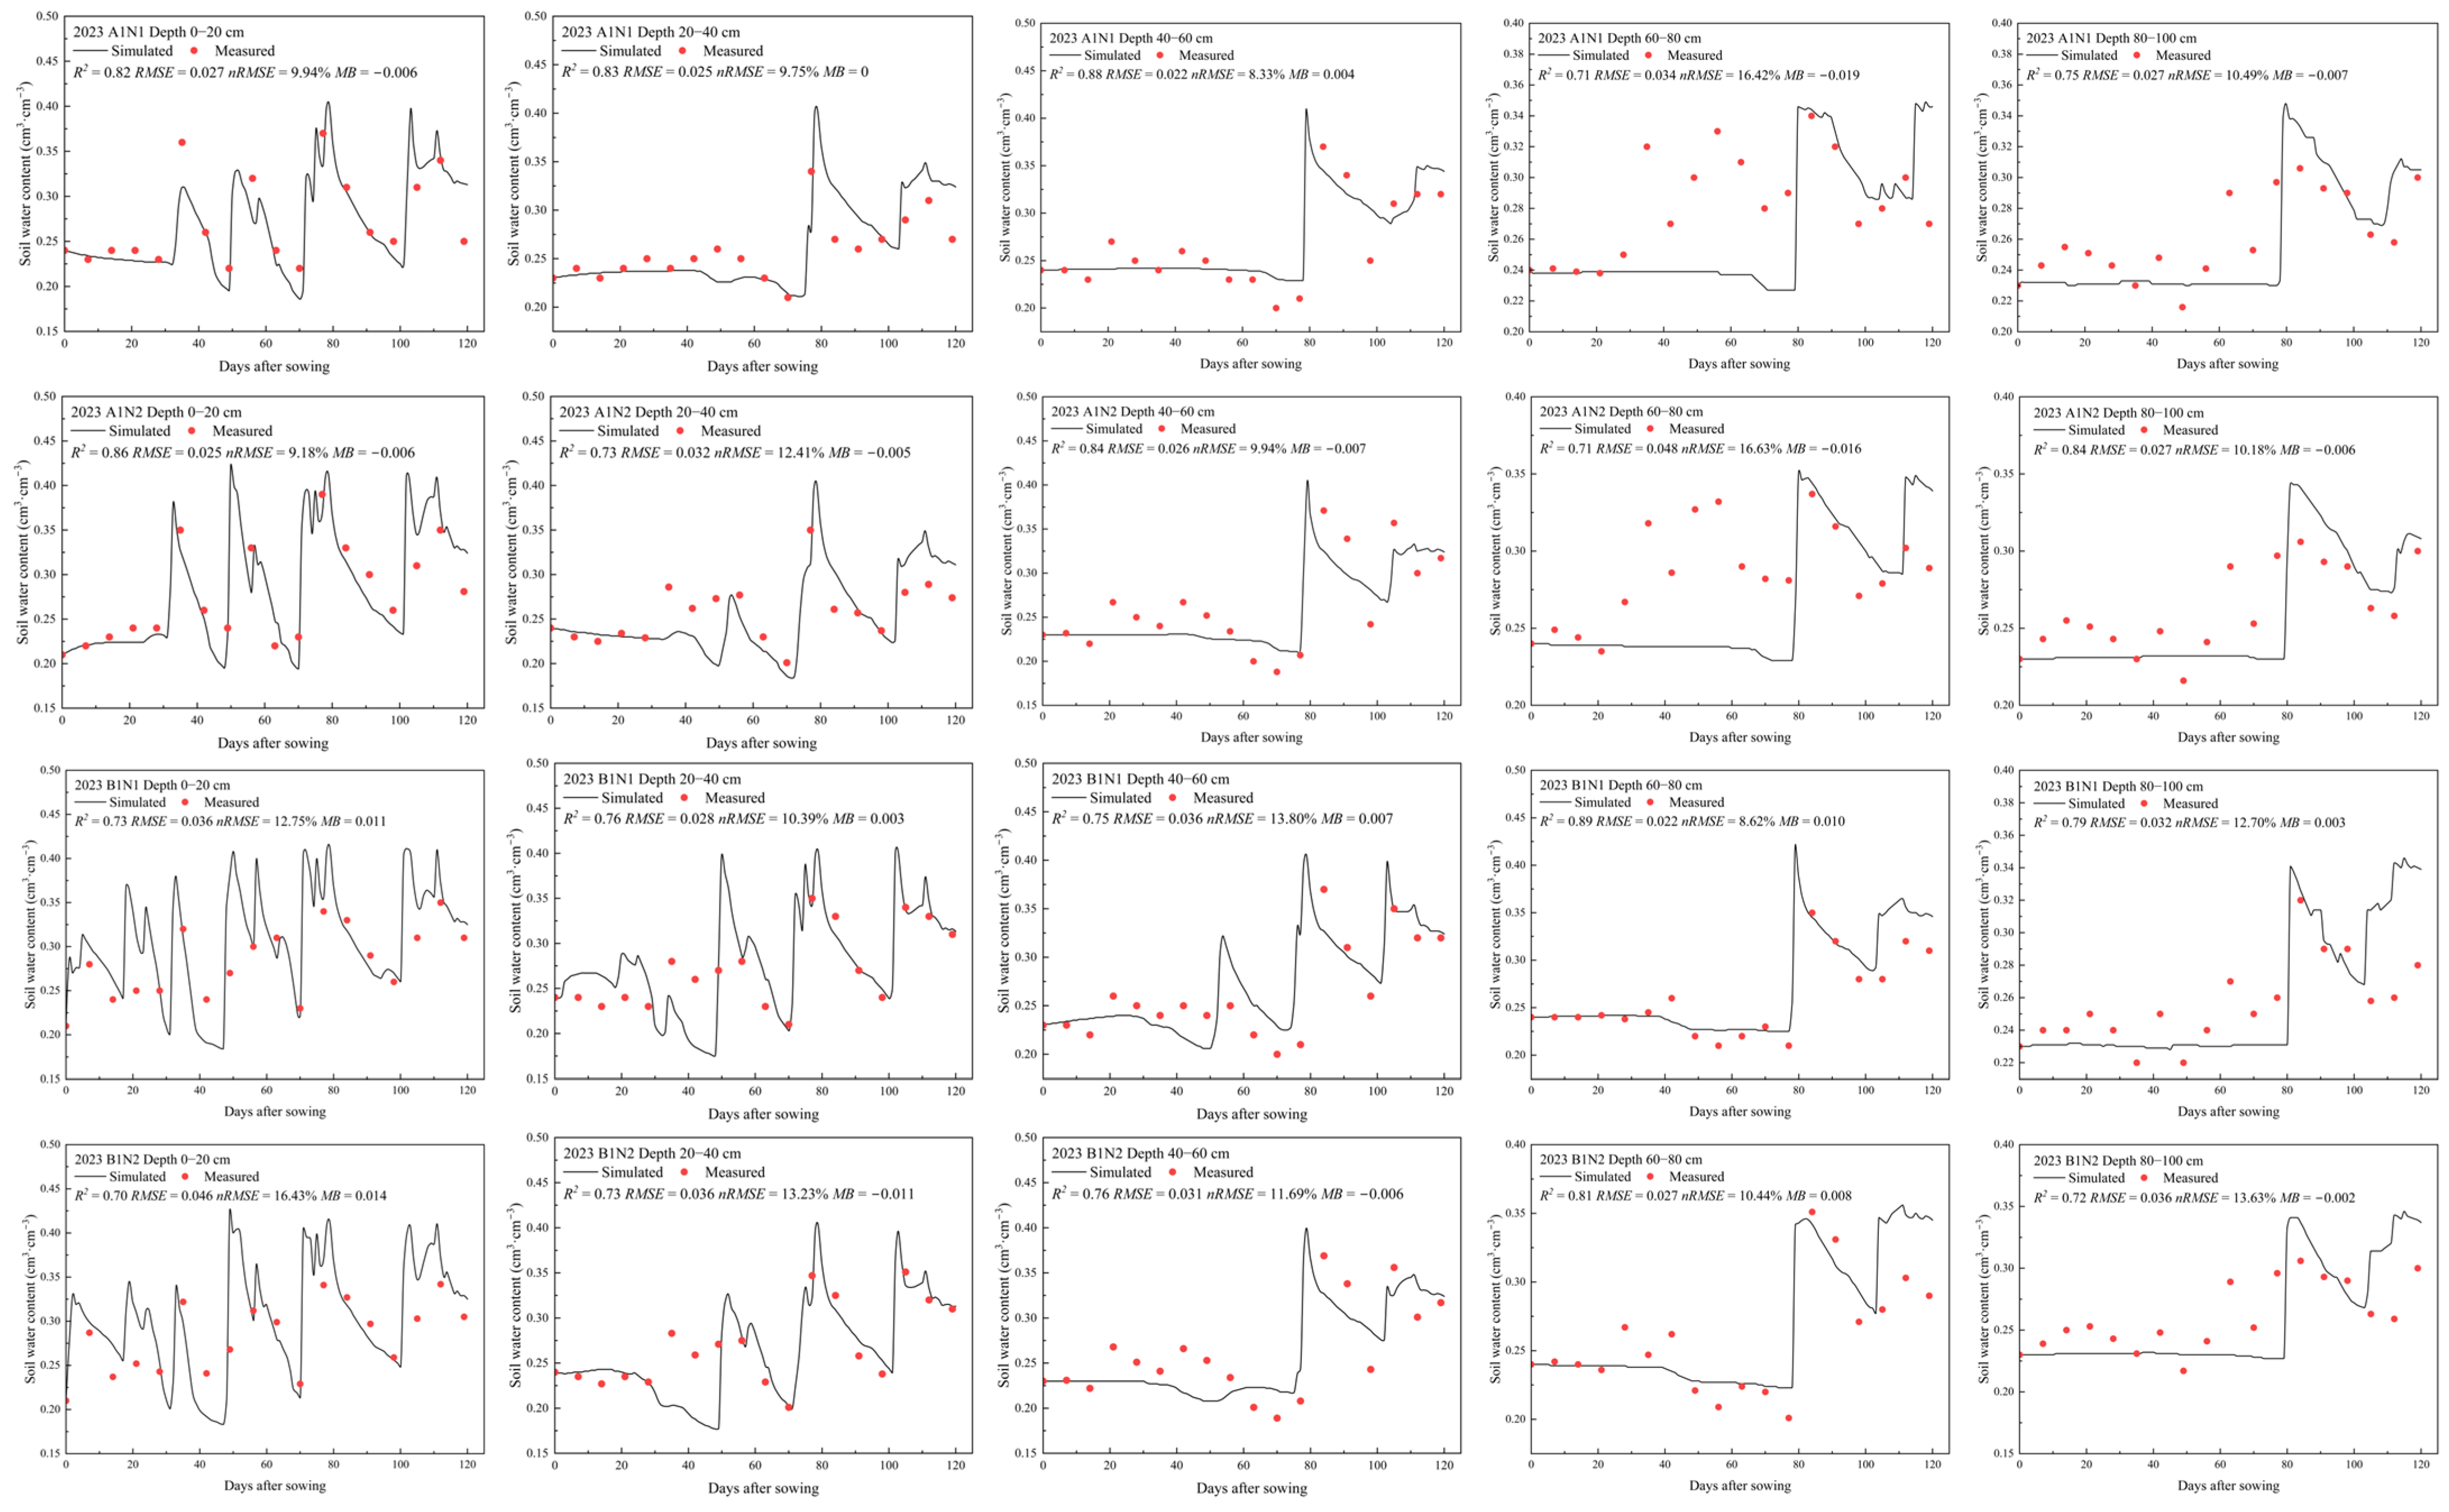
3.2. Model Parameter Calibration and Validation

This study employed a hybrid approach that combines the DSSAT-GLUE (generalized likelihood uncertainty estimation) module and trial-and-error methods for parameter estimation. The 2023 experimental data were used for model calibration, while the 2024 dataset was used for validation. Error metrics (R2, nRMSE, RMSE, and MB) for the phenological stages, maximum leaf area index (LAIX), aboveground biomass, and yield during 2023–2024 are summarized in Table 6. The calibration results demonstrated a strong model performance, with nRMSE values in 2023 of 3.07% (anthesis), 2.33% (maturity), 5.91% (LAIX), 10.54% (biomass at flowering), 9.98% (biomass at maturity), and 9.51% (yield). Only the nRMSE value for silking-stage biomass was slightly above 10%. The R2 values in 2023 were all above 0.94, indicating a satisfactory calibration. The 2024 validation further confirmed the model’s robustness, with reduced errors: nRMSE values were 2.14% (anthesis), 1.76% (maturity), 2.82% (LAIX), 9.87% (biomass at flowering), 8.64% (biomass at maturity), and 8.28% (yield), and R2 values were all above 0.96, demonstrating excellent model performance.
Figure 6 and Figure 7 illustrate the comparative analyses of soil moisture content (R2, nRMSE, RMSE, and MB) across soil layers for 2023 and 2024. During calibration (2023), R2 ranged from 0.70 to 0.89, RMSE from 0.022 to 0.048, nRMSE from 8.33% to 16.63%, and MB from −0.020 to 0.011. Validation (2024) exhibited improved precision, with R2 = 0.75–0.94, RMSE = 0.015–0.035, nRMSE = 5.44–11.54%, and MB = −0.016–0.014, demonstrating excellent simulation consistency. Table 7 shows the optimization results of the genetic parameters of the maize varieties.

3.3. Scenario Simulation Analysis

3.3.1. Simulation Analysis of the Irrigation Period Under Typical Hydrological Years

As illustrated in Figure 8, under wet hydrological years (2006), the rainfed treatment (W1) achieved a grain yield of 12,056.31 kg·ha−1. However, the maximum yield across all irrigation treatments reached only 12,284.63 kg·ha−1, showing no significant improvement over W1. Notably, the WUE of the rainfed treatment (2.03 kg·m−3) consistently surpassed that of irrigated regimes. These results indicate that supplemental irrigation is unnecessary in wet years, with the rainfed treatment (W1) being optimal. In normal hydrological years (2017), WUE peaked at 2.92 kg·m−3 under the W4 treatment (single irrigation at the VT stage). Further increases in irrigation frequency did not significantly enhance the yield, demonstrating that a single irrigation event during the tasseling (VT) stage represents the optimal strategy for normal years. Under dry hydrological years (1995), both irrigation frequency and volume markedly improved the yield. The rainfed treatment yielded only 6525 kg·ha−1. Among single-irrigation scenarios, the VT-stage application (W4) maximized the yield (9980.61 kg·ha−1). Two irrigation events at the VT and R2 stages (W11) further increased the yield to 11,205.31 kg·ha−1. The highest yield (11,972.41 kg·ha−1) and WUE (1.81 kg·m−3) were achieved with three irrigation events at the VE, VT, and R2 stages (W14). Thus, three irrigations during the VE, VT, and R2 stages constitute the optimal strategy for dry hydrological years.

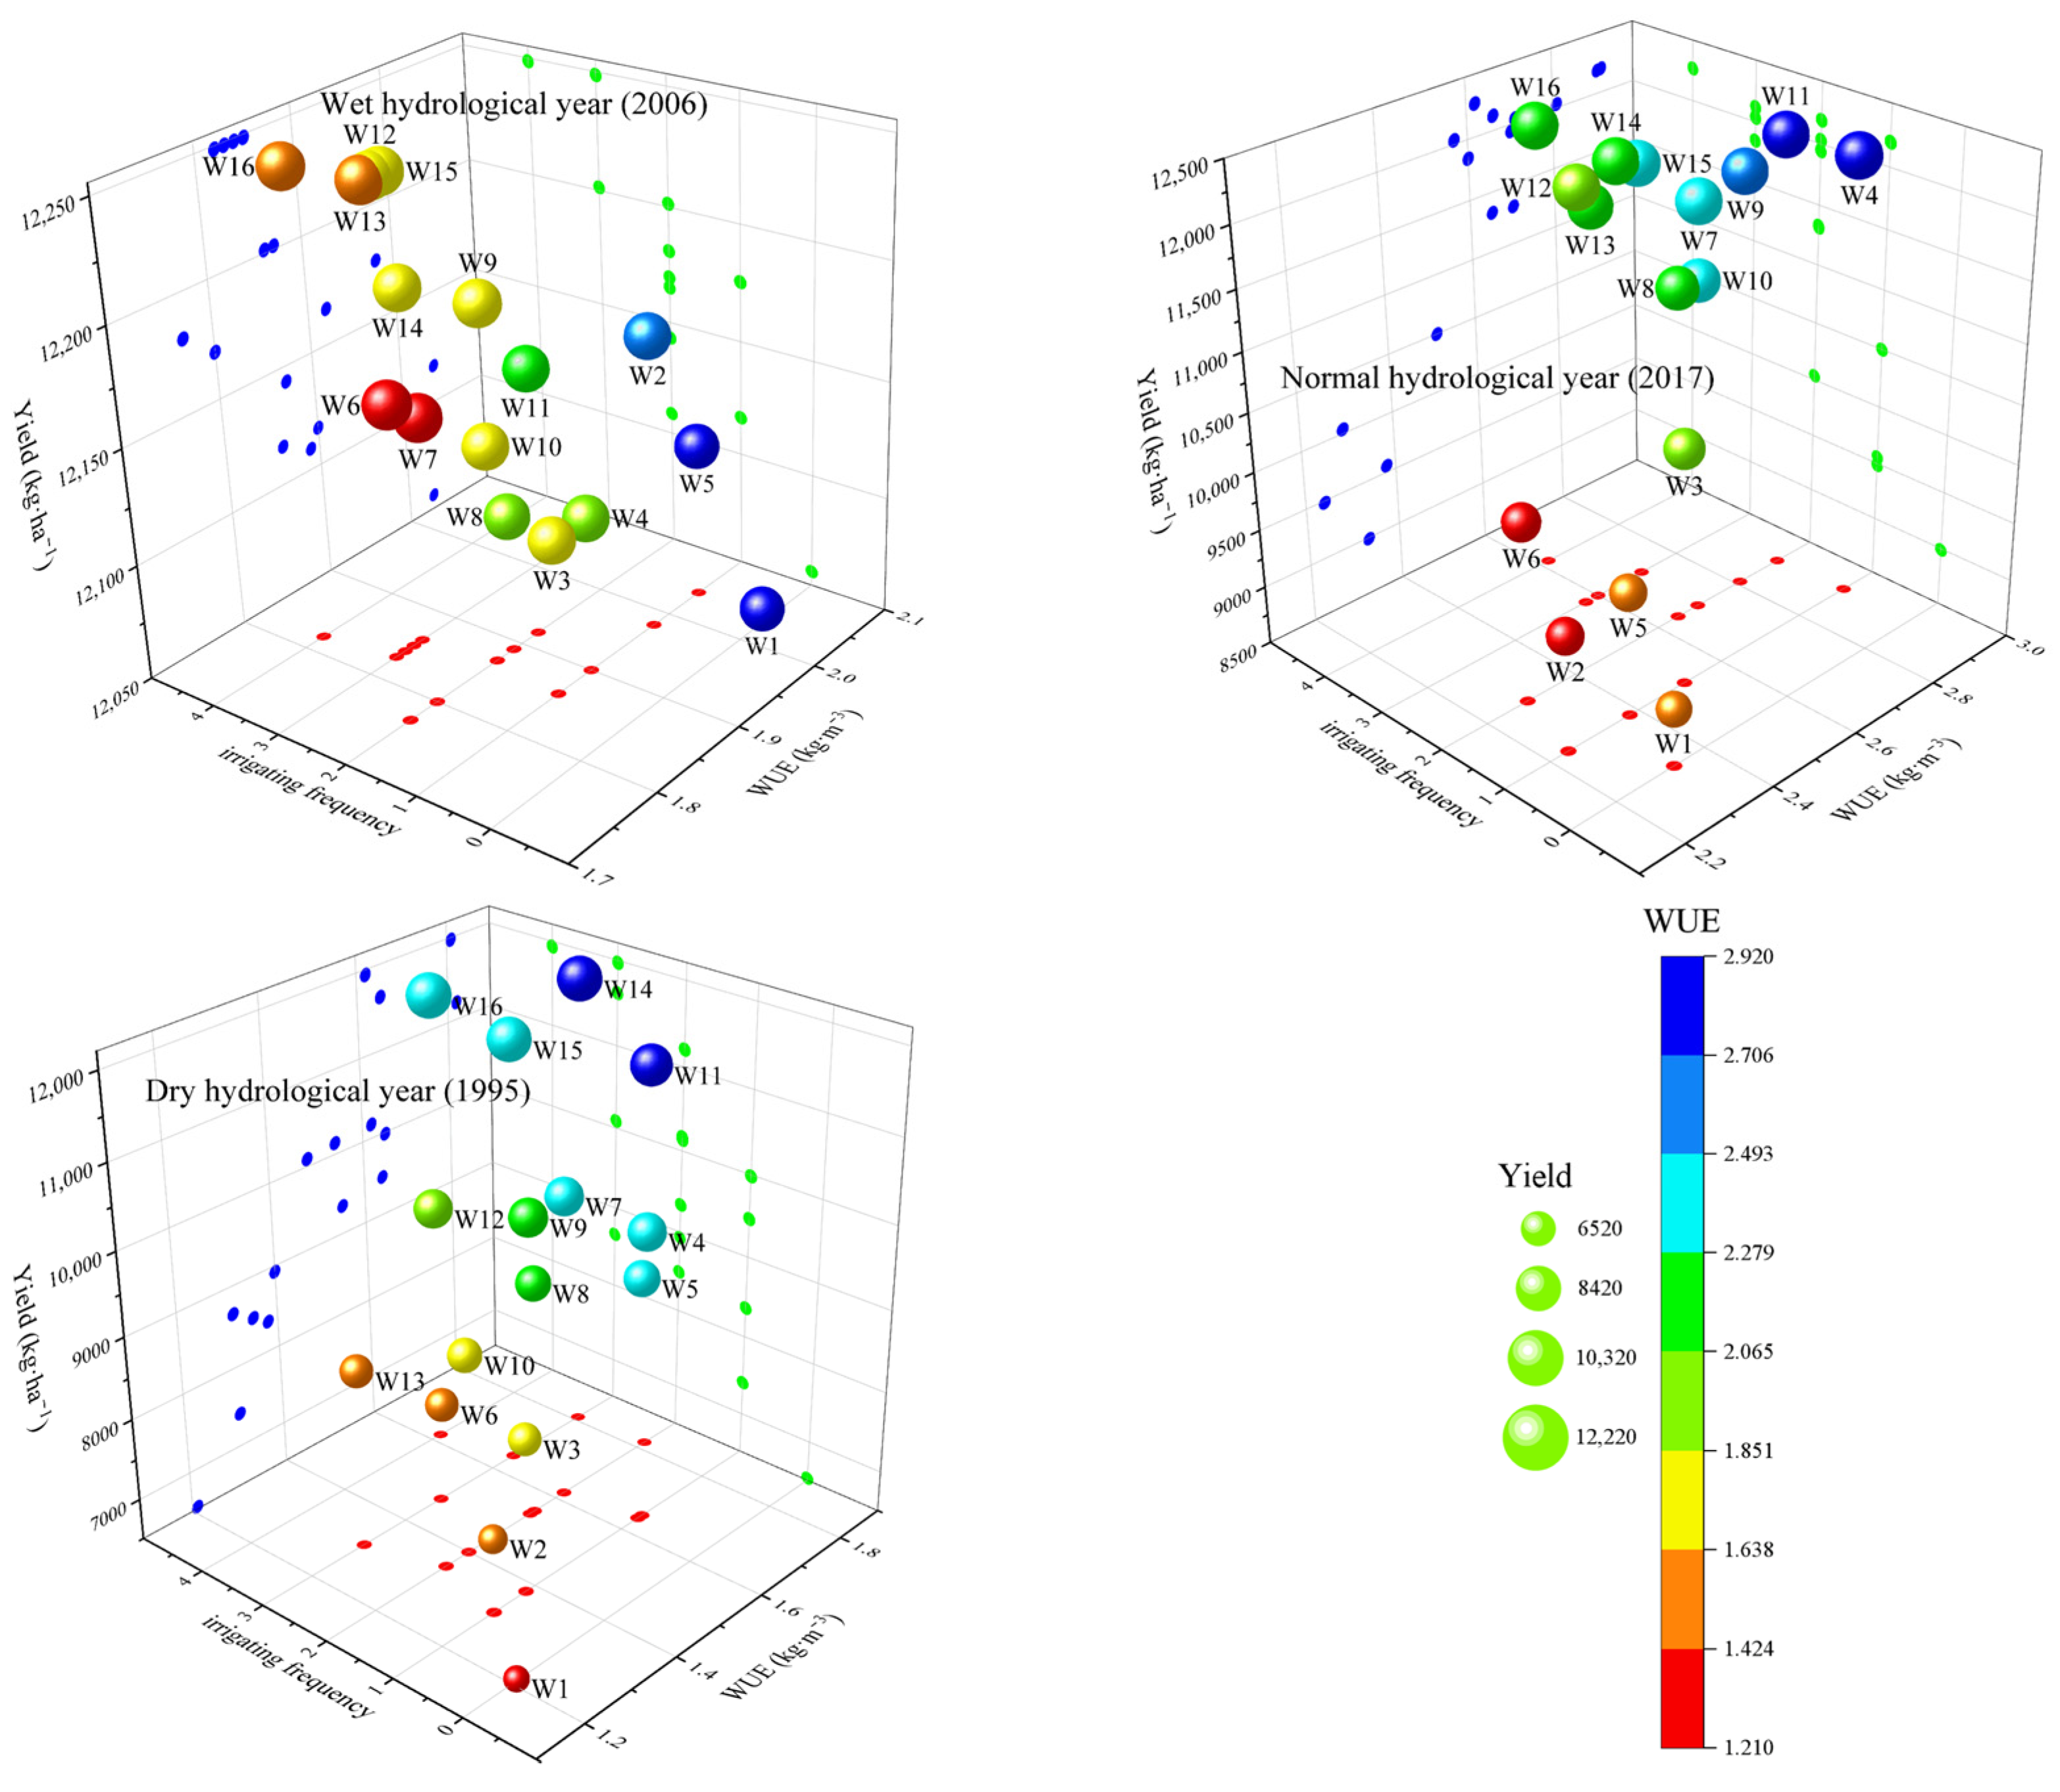
3.3.2. Simulation Analysis of Irrigation Volume Under Typical Hydrological Years

As mentioned above, the optimal irrigation mode in wet hydrological years is rainfed, so only the irrigation volume simulation analysis based on normal and wet years in the best irrigation period is carried out here. For normal hydrological years (Figure 9), the grain yield increased progressively with irrigation volume, peaking at 12,114.35 kg·ha−1 under a 30 mm irrigation quota. Beyond this threshold, the yield plateaued despite additional water inputs, while WUE concurrently reached its maximum (2.90 kg·m−3). These results confirm 30 mm as the optimal irrigation quota for normal years, balancing yield maximization and water conservation. Under dry hydrological years, the maximum yield (11,969.60 kg·ha−1) occurred at a 120 mm irrigation quota. However, the highest WUE (1.85 kg·m−3) and near-maximum yield (11,824.34 kg·ha−1) were achieved at a 90 mm quota. This divergence reflects diminishing water productivity returns beyond 90 mm, where incremental yield gains fail to offset escalating water inputs. Thus, 90 mm is recommended as the optimal irrigation quota for dry years, prioritizing both yield stability and resource efficiency.

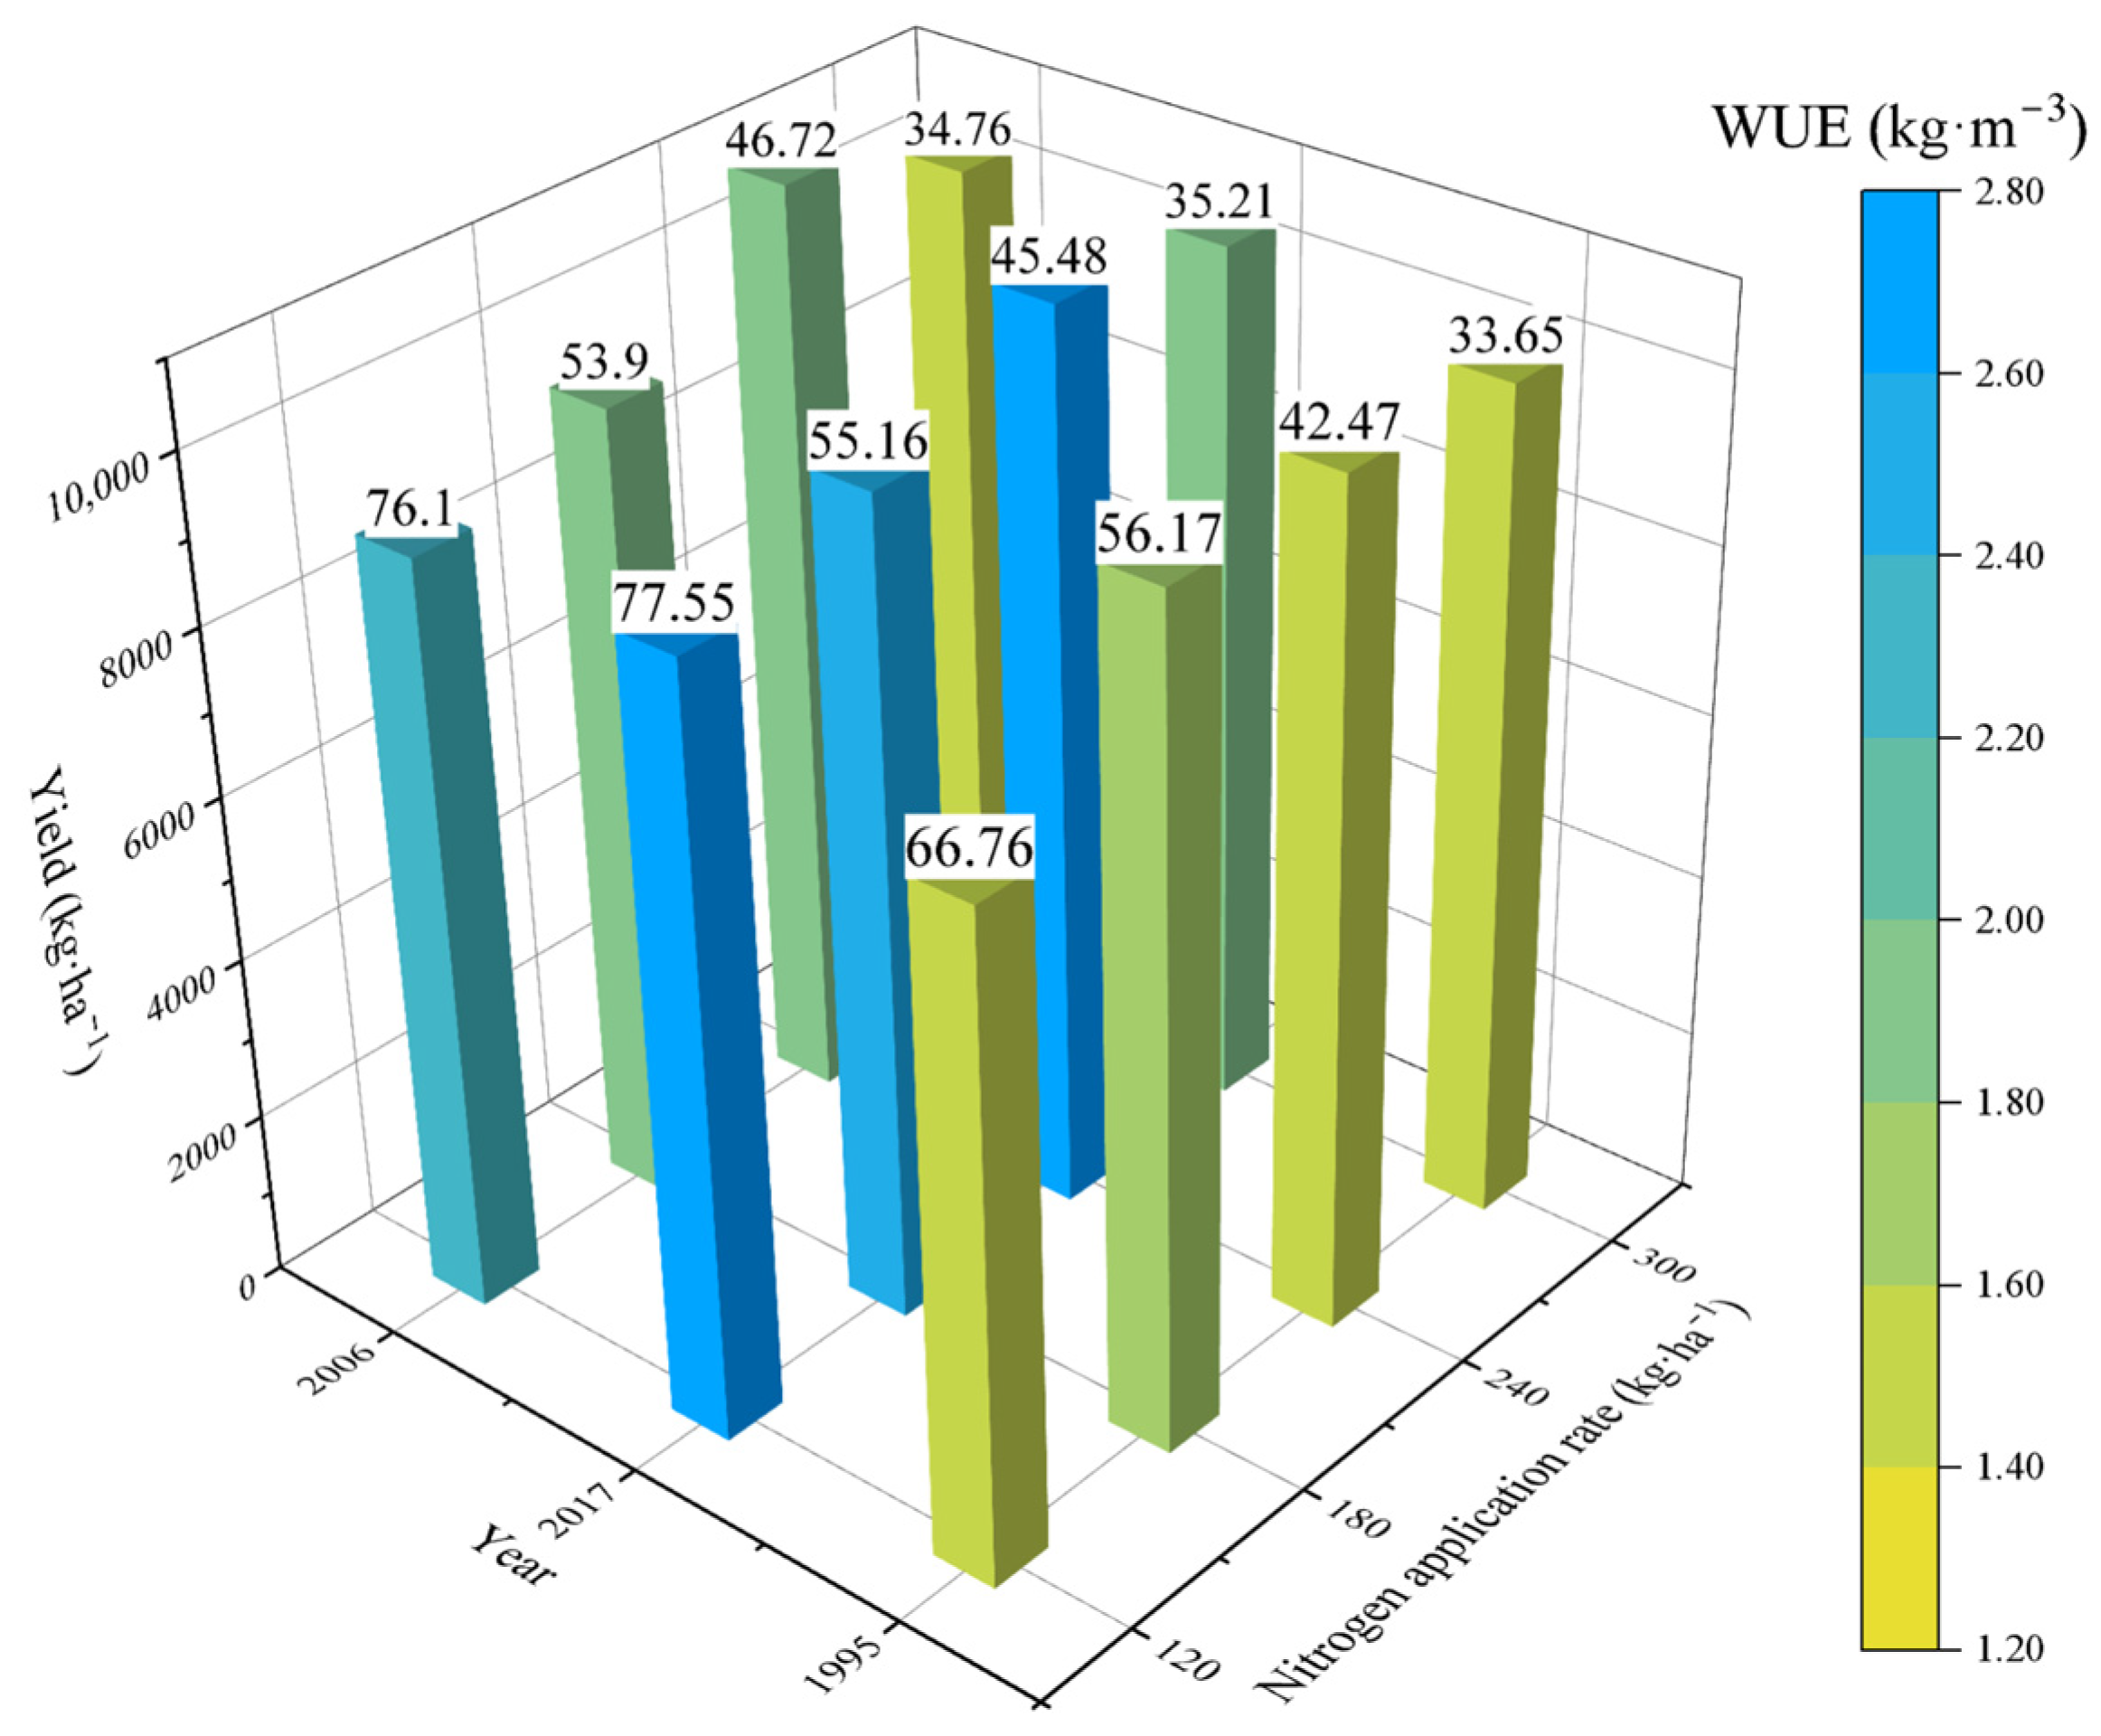
3.3.3. Simulation Analysis of Nitrogen Application Rates Under Typical Hydrological Years

Figure 10 shows that in nitrogen application treatments, PFPN decreases as the nitrogen application rate increases. In wet hydrological years, the maximum yield of 11,213.25 kg·ha−1 was achieved at a nitrogen application rate of 240 kg·ha−1, with the highest WUE of 1.89 kg·m−3 and a PFPN of 46.72 kg·kg−1. In normal hydrological years, the yield plateaus at a nitrogen application rate of 240 kg·ha−1, with a PFPN of 45.48 kg·kg−1 and a WUE of 2.61 kg·m−3. In dry hydrological years, the maximum yield of 10,193.54 kg·ha−1 occurred at a nitrogen application rate of 240 kg·ha−1. However, at 180 kg·ha−1, the WUE peaked at 1.61 kg·m−3, with a yield of 10,110.42 kg·ha−1.
As outlined above, the optimal irrigation timing, volume, and nitrogen application rates for maize in different typical hydrological years are shown in Table 8.

4. Discussion

4.1. Maize Growth

The experimental results demonstrate that drip irrigation (B1) outperformed rainfed conditions (A1) in enhancing the LAI, plant height, and grain yield. This is mainly attributed to the stable water supply reducing the impact of drought stress on crop growth [26,27,28]. As a critical indicator of canopy development, the LAI directly governs light interception capacity [29]. The study by Wang et al. [30] confirms that elevated LAI enhances solar radiation utilization, thereby promoting biomass accumulation and yield. In this study, drip irrigation achieved peak LAI values at the tasseling (VT) stage, indicating optimal water availability for leaf expansion and photosynthetic efficiency [26,31]. Controlled irrigation through drip systems has been shown to significantly improve the LAI, yield, and WUE [32,33], as corroborated by our results.
Drip-irrigated maize exhibited greater plant height across all growth stages, particularly during VT and grain filling (R2). This indicates that consistent water supply promotes stalk elongation [27], a structural prerequisite for high yields. Notably, drip irrigation increased the grain yield by 32.54% (2023) and 24.24% (2024) compared to rainfed conditions, primarily attributed to improved water availability that mitigates drought-induced yield losses [34,35,36]. Enhanced yield components under drip irrigation, including ear length, diameter, kernel number, and 100-grain weight, further validate its efficacy in optimizing productivity [37]. In this study, the yield of drip-irrigated maize was significantly higher than that of rainfed maize. This indicates that maize growth responds significantly to annual precipitation changes [38]. In 2024, with higher rainfall, the yield gap between rainfed and drip-irrigated treatments narrowed. But in the drier 2023, drip irrigation showed a more pronounced advantage. This shows that irrigation strategies should be adjusted according to annual precipitation changes to maximize yield [39].

4.2. Model Calibration

Calibrating and validating model parameters are essential for reliable simulation results [40]. The DSSAT model requires calibration and validation before use in different regions and under different management conditions [41]. DOKOOHAKI et al. [42] calibrated and validated the model using experimental data from various irrigation and nitrogen levels in Iran. In the Mediterranean region, Di et al. [43] calibrated and validated the DSSAT model for different nitrogen supply conditions. In this study, we used 2023 data for calibration and 2024 data for validation. The results show that the model performed well in simulating maize’s phenological stages, biomass, and yield during both calibration and validation. The nRMSE for the silking and maturity stages was below 10%, indicating the accurate simulation of the maize growth period, which was consistent with the previous research results [44,45,46]. The soil water content simulation was also precise, with RMSE and nRMSE within acceptable ranges, reflecting good soil moisture dynamics and providing a reliable basis for optimizing irrigation and fertilization schemes.

4.3. Model Application

Crops respond differently to water stress at various growth stages [47]. Regarding irrigation timing, Jin et al. [48] found that it significantly impacts crop yield across years. Zhu et al. [49] identified the seedling, tasseling, and silking stages as critical water-need periods for maize, aligning with the optimized irrigation timing in this study. Different irrigation frequencies and volumes affect maize growth and yield [50]. Our results show that no irrigation is needed in wet years, one irrigation at VT stage (30 mm) in normal years, and three irrigations (90 mm total) at the VE, VT, and R2 stages in dry years, consistent with Jiang and Liu [51,52]. Xu et al. [53] found that maize in North China achieves high productivity and nitrogen efficiency with nitrogen application rates of 217–252 kg·ha−1, matching our findings. In wet and normal years, the optimal nitrogen rate is 240 kg·ha−1. In dry years, while 240 kg·ha−1 maximizes the yield (10,110.42 kg·ha−1), 180 kg·ha−1 achieves higher WUE. In dry years, soil moisture is low, reducing nitrogen leaching losses [54]. Reducing nitrogen application from 240 to 180 kg·ha−1 cuts soil nitrate accumulation and leaching [55]. This also lowers the nitrogen content in farm drainage, reducing pollution risks to nearby waters [56]. Thus, optimizing nitrogen use mitigates agricultural non-point-source pollution and supports sustainable ecological development. In practice, maize farmers can utilize historical climate data analysis, real-time weather monitoring, and soil moisture measurements to classify the upcoming growing season. By establishing hydrological year categories based on long-term precipitation records and leveraging seasonal forecasts and soil moisture sensors, farmers can make informed decisions on irrigation scheduling tailored to the predicted hydrological conditions.

4.4. Limitations and Future Research Directions

The DSSAT model assumes soil uniformity within a specific depth range, yet real-world fields show significant soil property variations that affect water infiltration, retention, and evaporation [57,58]. This can cause simulation inaccuracies. Extreme weather events, like severe droughts or heavy rains, often fall outside the model’s calibration range, leading to deviations between simulation results and actual observations [59].
Future research should integrate high-resolution soil data and use layered modeling or soil heterogeneity parameters to enhance the model’s ability to simulate complex field conditions. Introducing dynamic stress response mechanisms and calibration data for extreme weather events can boost the model’s adaptability and predictive power under extreme conditions. Additionally, this study’s validation was confined to central Henan. Future research should combine long-term field experiments and multi-site validation to deeply explore the long-term impacts of different management practices on maize production and promote precision agriculture technology.

5. Conclusions

By conducting field experiments and simulating crop growth under different precipitation years with a crop model, this study explored an optimized maize irrigation and fertilization scheme and confirmed its feasibility in central Henan Province. The key findings are as follows:
(1)
We defined six genetic parameters for Zhengdan 958 maize (Beijing Denong Seed Industry Co., Ltd., Beijing, China) in the DSSAT model (P1: 224, P2: 0.78, P5: 813, G2: 857, G3: 8.57, and PHINT: 45). After calibrating with 2023 data and validating with 2024 data, we obtained a highly accurate DSSAT model.
(2)
Based on this, we simulated optimal irrigation and fertilization strategies for different precipitation years using 30-year weather data. In wet years, no irrigation is needed, with a fertilizer rate of 240 kg·ha−1. In normal years, irrigate once at the VT stage (30 mm), with a nitrogen application rate of 240 kg·ha−1. In dry years, irrigate three times at the VE, VT, and R2 stages (total 90 mm), with a nitrogen application rate of 180 kg·ha−1.
The optimized irrigation and fertilization schemes from this study not only enhance maize yield but also significantly reduce water waste and nutrient loss, thus lowering soil salinization and water pollution risks. These findings offer a scientific basis for promoting sustainable agricultural development in central Henan.

Author Contributions

Conceptualization, J.M.; methodology, Y.W.; software, Y.W.; validation, J.M., Y.W. and L.L.; formal analysis, Y.W.; investigation, B.C.; resources, Y.D.; data curation, Y.Z.; writing—original draft preparation, Y.W.; writing—review and editing, Y.W.; visualization, Y.W.; supervision, L.L.; project administration, J.M.; funding acquisition, J.M. All authors have read and agreed to the published version of the manuscript.

Funding

This research was supported by the Key R & D projects in Henan Province (241111112600), the North China University of Water Resources and Electric Power ‘double first-class’ innovation team project (CXTDPY-8), and this project was supported by a special fund of the Henan Key Laboratory of Water Pollution Control and Rehabilitation Technology (CJSZ2024008). Therefore, we thank the Department of Education and the Department of Science and Technology of Henan Province for their strong support.

Data Availability Statement

The data that support the findings of this study are available from the corresponding author upon reasonable request.

Conflicts of Interest

The authors declare no conflicts of interest.

References

  1. Li, Z.; Zhang, Z.; Zhang, J.; Luo, Y.; Zhang, L. A New Framework to Quantify Maize Production Risk from Chilling Injury in Northeast China. Clim. Risk Manag. 2021, 32, 100299. [Google Scholar] [CrossRef]
  2. Li, Y.; Yin, Y.; Zhang, W. Water Footprint Assessment of Major Crops in Henan Province and Reduction Suggestions. Water 2023, 15, 1135. [Google Scholar] [CrossRef]
  3. Tilman, D.; Balzer, C.; Hill, J.; Befort, B.L. Global Food Demand and the Sustainable Intensification of Agriculture. Proc. Natl. Acad. Sci. USA 2011, 108, 20260–20264. [Google Scholar] [CrossRef]
  4. Hou, Y.; Xu, X.; Kong, L.; Zhang, L.; Zhang, Y.; Liu, Z. Improving Nitrogen Contribution in Maize Post-Tasseling Using Optimum Management under Mulch Drip Irrigation in the Semiarid Region of Northeast China. Front. Plant Sci. 2022, 13, 1095314. [Google Scholar] [CrossRef] [PubMed]
  5. Muhammad, I.; Yang, L.; Ahmad, S.; Zeeshan, M.; Farooq, S.; Ali, I.; Khan, A.; Zhou, X.B. Irrigation and Nitrogen Fertilization Alter Soil Bacterial Communities, Soil Enzyme Activities, and Nutrient Availability in Maize Crop. Front. Microbiol. 2022, 13, 833758. [Google Scholar] [CrossRef] [PubMed]
  6. Chen, X.; Zhang, H.; Yu, S.; Zhou, C.; Teng, A.; Lei, L.; Ba, Y.; Li, F. Optimizing Irrigation and Nitrogen Application Strategies to Improve Sunflower Yield and Resource Use Efficiency in a Cold and Arid Oasis Region of Northwest China. Front. Plant Sci. 2024, 15, 1429548. [Google Scholar] [CrossRef]
  7. Liu, D.; An, Y.; Tao, X.; Wang, X.; Lü, D.; Guo, Y.; Chen, X.; Zhang, W. Effects of Different Nitrogen Gradients on Yield and Nitrogen Uptake of Hybrid Seed Maize in Northwest China. Sci. Agric. Sin. 2023, 56, 441–452. [Google Scholar] [CrossRef]
  8. Yu, C.; Huang, X.; Chen, H.; Godfray, H.C.J.; Wright, J.S.; Hall, J.W.; Gong, P.; Ni, S.; Qiao, S.; Huang, G.; et al. Managing Nitrogen to Restore Water Quality in China. Nature 2019, 567, 516–520. [Google Scholar] [CrossRef]
  9. Wang, Z.; Zhang, B.; Li, J.; Lian, S.; Zhang, J.; Shi, S. Effects of Deficit-Regulated Irrigation on Root-Growth Dynamics and Water-Use Efficiency of Winter Wheat in a Semi-Arid Area. Water 2024, 16, 2678. [Google Scholar] [CrossRef]
  10. Yan, F.; Zhang, F.; Fan, X.; Fan, J.; Wang, Y.; Zou, H.; Wang, H.; Li, G. Determining Irrigation Amount and Fertilization Rate to Simultaneously Optimize Grain Yield, Grain Nitrogen Accumulation and Economic Benefit of Drip-Fertigated Spring Maize in Northwest China. Agric. Water Manag. 2021, 243, 106440. [Google Scholar] [CrossRef]
  11. Zou, H.; Fan, J.; Zhang, F.; Xiang, Y.; Wu, L.; Yan, S. Optimization of Drip Irrigation and Fertilization Regimes for High Grain Yield, Crop Water Productivity and Economic Benefits of Spring Maize in Northwest China. Agric. Water Manag. 2020, 230, 105986. [Google Scholar] [CrossRef]
  12. Han, Y.; Gao, H.; Zhang, D.; Wang, Y.; Sun, Y.; Zhang, F.; Zhu, X.; Yuan, M.; Ma, H.; Liu, X.; et al. Farming Modes and Fertilizer Management Practices to Improve Chlorophyll Fluorescence, Agronomic Efficiency and Maize Productivity in Semi-Arid Regions. J. Soil Sci. Plant Nutr. 2023, 23, 3857–3871. [Google Scholar] [CrossRef]
  13. Liu, P.; Ning, F.; Li, H.; Zhang, Y.; Zhang, Q.; Wang, R.; Wang, X.; Chen, X.; Li, J. Adaptive Nitrogen Inputs Sustain Water-Nitrogen Use and Improve Maize Productivity with Varied Precipitation Conditions on a Semi-Arid Agroecosystem. J. Sci. Food Agric. 2023, 103, 2262–2272. [Google Scholar] [CrossRef]
  14. Azad, N.; Behmanesh, J.; Rezaverdinejad, V.; Abbasi, F.; Navabian, M. An Analysis of Optimal Fertigation Implications in Different Soils on Reducing Environmental Impacts of Agricultural Nitrate Leaching. Sci. Rep. 2020, 10, 7797. [Google Scholar] [CrossRef]
  15. Zhang, T.; Zou, Y.; Kisekka, I.; Biswas, A.; Cai, H. Comparison of Different Irrigation Methods to Synergistically Improve Maize’s Yield, Water Productivity and Economic Benefits in an Arid Irrigation Area. Agric. Water Manag. 2021, 243, 106497. [Google Scholar] [CrossRef]
  16. Zhang, H.; Wang, J.; Liu, M.; Shen, Y.; Pei, H. Water Budget of Urban Turf Field and Optimal Irrigation Schedule Simulation in an Ecotone between Semi-Humid and Semi-Arid Regions, Northern China. Agronomy 2023, 13, 273. [Google Scholar] [CrossRef]
  17. Chen, S.; Jiang, T.; Ma, H.; He, C.; Xu, F.; Malone, R.W.; Feng, H.; Yu, Q.; Siddique, K.H.M.; Dong, Q.; et al. Dynamic Within-Season Irrigation Scheduling for Maize Production in Northwest China: A Method Based on Weather Data Fusion and Yield Prediction by DSSAT. Agric. For. Meteorol. 2020, 285–286, 107928. [Google Scholar] [CrossRef]
  18. Figueiredo Moura da Silva, E.H.; Hoogenboom, G.; Boote, K.J.; Cuadra, S.V.; Porter, C.H.; Scivittaro, W.B.; Steinmetz, S.; Cerri, C.E.P. Implications of Water Management on Methane Emissions and Grain Yield in Paddy Rice: A Case Study under Subtropical Conditions in Brazil Using the CSM-CERES-Rice Model. Agric. Water Manag. 2025, 307, 109234. [Google Scholar] [CrossRef]
  19. Li, L.; Wang, Q.; Zhao, Y.; Zhai, J.; Li, H.; Han, S.; Wang, L.; Gui, Y. Development Potential of Multi-Cropping Systems and Its Influence on Agricultural Water Consumption in the Huang–Huai–Hai River Basin of China. Agric. Water Manag. 2025, 308, 109298. [Google Scholar] [CrossRef]
  20. Quintero, D.; Mishra, V.; Limaye, A.S.; Van Abel, N.; Bright Ross, J.; Rashid, A. Bayesian Calibration of Management Practices for a Crop Model Implemented in a Subsistence Farming Region. Eur. J. Agron. 2025, 164, 127524. [Google Scholar] [CrossRef]
  21. Allakonon, M.G.B.; Tovihoudji, P.G.; Akponikpè, P.B.I.; Bielders, C.L. Optimizing Deficit Irrigation and Fertilizer Application for Off-Season Maize Production in Northern Benin. Field Crops Res. 2024, 318, 109613. [Google Scholar] [CrossRef]
  22. Shen, H.; Jiang, K.; Sun, W.; Xu, Y.; Ma, X. Irrigation Decision Method for Winter Wheat Growth Period in a Supplementary Irrigation Area Based on a Support Vector Machine Algorithm. Comput. Electron. Agric. 2021, 182, 106032. [Google Scholar] [CrossRef]
  23. Bai, Y.; Yue, W.; Ding, C. Optimize the Irrigation and Fertilizer Schedules by Combining DSSAT and Genetic Algorithm. Environ. Sci. Pollut. Res. 2022, 29, 52473–52482. [Google Scholar] [CrossRef]
  24. Jing, Q.; McConkey, B.; Qian, B.; Smith, W.; Grant, B.; Shang, J.; Liu, J.; Bindraban, P.; Luce, M.S. Assessing Water Management Effects on Spring Wheat Yield in the Canadian Prairies Using DSSAT Wheat Models. Agric. Water Manag. 2021, 244, 106591. [Google Scholar] [CrossRef]
  25. Rugira, P.; Ma, J.; Zheng, L.; Wu, C.; Liu, E. Application of DSSAT CERES-Maize to Identify the Optimum Irrigation Management and Sowing Dates on Improving Maize Yield in Northern China. Agronomy 2021, 11, 674. [Google Scholar] [CrossRef]
  26. Kaur, A.; Singh, K.B.; Brar, A.S.; Gupta, R.K.; Kingra, P.K. Interactive Effect of Nitrogen and Irrigation on Evapotranspiration, Growth, Yield and Water Productivity of Subsurface Drip-Irrigated Spring Maize: Field and Simulation Studies. Irrig. Drain. 2023, 72, 644–663. [Google Scholar] [CrossRef]
  27. Liu, M.; Liang, F.; Li, Q.; Wang, G.; Tian, Y.; Jia, H. Enhancement Growth, Water Use Efficiency and Economic Benefit for Maize by Drip Irrigation in Northwest China. Sci. Rep. 2023, 13, 8392. [Google Scholar] [CrossRef]
  28. Du, R.; Li, Z.; Xiang, Y.; Sun, T.; Liu, X.; Shi, H.; Li, W.; Huang, X.; Tang, Z.; Lu, J.; et al. Drip Fertigation Increases Maize Grain Yield by Affecting Phenology, Grain Filling Process, Biomass Accumulation and Translocation: A 4-Year Field Trial. Plants 2024, 13, 1903. [Google Scholar] [CrossRef]
  29. Guo, H.; Li, S.; Kang, S.; Du, T.; Liu, W.; Tong, L.; Hao, X.; Ding, R. Comparison of Several Models for Estimating Gross Primary Production of Drip-Irrigated Maize in Arid Regions. Ecol. Model. 2022, 468, 109928. [Google Scholar] [CrossRef]
  30. Wang, C.; Wang, J.; Zhang, Y.; Xu, D. Temporal and Spatial Variation of Morpho-Physiological Characteristics of Spring Maize under Mulched Drip Irrigation in Northeastern China. Crop Pasture Sci. 2022, 73, 1131–1141. [Google Scholar] [CrossRef]
  31. He, L.; Li, H.; He, J.; Han, D.; Li, R.; Wang, H. Irrigation at Appearance of Top 2nd or Flag Leaf Could Improve Canopy Photosynthesis by Regulating Light Distribution and LAI at Each Leaf Layer. Field Crops Res. 2023, 295, 108883. [Google Scholar] [CrossRef]
  32. Jiang, L.; Tong, C.; Hu, M.; Li, S.; Zhou, L.; Qi, Z.; Zhang, T. Responses of Maize Photosynthesis and Yield to Different Drip Irrigation Amounts with Full Film Mulching in the Hetao Irrigation District. Soil Water Conserv. 2017, 31, 289–297. [Google Scholar] [CrossRef]
  33. Marek, G.W.; Marek, T.H.; Xue, Q.; Gowda, P.H.; Evett, S.R.; Brauer, D.K. Simulating Evapotranspiration and Yield Response of Selected Corn Varieties under Full and Limited Irrigation in the Texas High Plains Using DSSAT-CERES-Maize. Trans. ASABE 2017, 60, 837–846. [Google Scholar] [CrossRef]
  34. Lamlom, S.F.; Abdelghany, A.M.; Ren, H.; Ali, H.M.; Usman, M.; Shaghaleh, H.; Hamoud, Y.A.; El-Sorady, G.A. Revitalizing Maize Growth and Yield in Water-Limited Environments through Silicon and Zinc Foliar Applications. Heliyon 2024, 10, e35118. [Google Scholar] [CrossRef]
  35. Zhou, B.; Ma, D.; Sun, X.; Ding, Z.; Li, C.; Ma, W.; Zhao, M. Straw Mulching under a Drip Irrigation System Improves Maize Grain Yield and Water Use Efficiency. Crop Sci. 2019, 59, 2806–2819. [Google Scholar] [CrossRef]
  36. Yu, J.; Wang, W.; Chen, Z.; Cao, M.; Qian, H. Disentangling the Dominance of Atmospheric and Soil Water Stress on Vegetation Productivity in Global Drylands. J. Hydrol. 2025, 657, 133043. [Google Scholar] [CrossRef]
  37. Wang, C.; Zhang, Y.; Wang, J.; Xu, D.; Gong, S.; Wu, Z.; Mo, Y.; Zhang, Y. Plastic Film Mulching with Drip Irrigation Promotes Maize (Zea Mays L.) Yield and Water-Use Efficiency by Improving Photosynthetic Characteristics. Arch. Agron. Soil Sci. 2021, 67, 191–204. [Google Scholar] [CrossRef]
  38. Gao, J.; Liu, Z.; Wang, P.; Huang, S. Drip Irrigation Coupled with Appropriate N Input Increased Maize (Zea Mays L.) Yield and Lodging Resistance via Optimizing Root and Stem Trait. Eur. J. Agron. 2024, 160, 127298. [Google Scholar] [CrossRef]
  39. Bai, Y.; Gao, J. Research on High Photosynthetic Efficient Cultivation with Drip Irrigation under Different Mulch of Maize. Water Supply 2020, 20, 3172–3182. [Google Scholar] [CrossRef]
  40. Bai, Y.; Gao, J. Optimization of the Nitrogen Fertilizer Schedule of Maize under Drip Irrigation in Jilin, China, Based on DSSAT and GA. Agric. Water Manag. 2021, 244, 106555. [Google Scholar] [CrossRef]
  41. Amouzou, K.A.; Naab, J.B.; Lamers, J.P.A.; Becker, M. CERES-Maize and CERES-Sorghum for Modeling Growth, Nitrogen and Phosphorus Uptake, and Soil Moisture Dynamics in the Dry Savanna of West Africa. Field Crops Res. 2018, 217, 134–149. [Google Scholar] [CrossRef]
  42. Dokoohaki, H.; Gheysari, M.; Mousavi, S.-F.; Zand-Parsa, S.; Miguez, F.E.; Archontoulis, S.V.; Hoogenboom, G. Coupling and Testing a New Soil Water Module in DSSAT CERES-Maize Model for Maize Production under Semi-Arid Condition. Agric. Water Manag. 2016, 163, 90–99. [Google Scholar] [CrossRef]
  43. Di Paolo, E.; Rinaldi, M. Yield Response of Corn to Irrigation and Nitrogen Fertilization in a Mediterranean Environment. Field Crops Res. 2008, 105, 202–210. [Google Scholar] [CrossRef]
  44. Liu, H.; Liu, H.; Lei, Q.; Zhai, L.; Wang, H.; Zhang, J.; Zhu, Y.; Liu, S.; Li, S.; Zhang, J.; et al. Using the DSSAT Model to Simulate Wheat Yield and Soil Organic Carbon under a Wheat-Maize Cropping System in the North China Plain. J. Integr. Agric. 2017, 16, 2300–2307. [Google Scholar] [CrossRef]
  45. Jiang, R.; He, W.; Zhou, W.; Hou, Y.; Yang, J.Y.; He, P. Exploring Management Strategies to Improve Maize Yield and Nitrogen Use Efficiency in Northeast China Using the DNDC and DSSAT Models. Comput. Electron. Agric. 2019, 166, 104988. [Google Scholar] [CrossRef]
  46. Wang, Y.; Jiang, K.; Shen, H.; Wang, N.; Liu, R.; Wu, J.; Ma, X. Decision-Making Method for Maize Irrigation in Supplementary Irrigation Areas Based on the DSSAT Model and a Genetic algorithm. Agric. Water Manag. 2023, 280, 108231. [Google Scholar] [CrossRef]
  47. Liao, Q.; Gu, S.; Gao, S.; Du, T.; Kang, S.; Tong, L.; Ding, R. Crop Water Stress Index Characterizes Maize Productivity under Water and Salt Stress by Using Growth Stage-Specific Non-Water Stress Baselines. Field Crops Res. 2024, 317, 109544. [Google Scholar] [CrossRef]
  48. Jin, X.; Feng, H.; Zhu, X.; Li, Z.; Song, S.; Song, X.; Yang, G.; Xu, X.; Guo, W. Assessment of the AquaCrop Model for Use in Simulation of Irrigated Winter Wheat Canopy Cover, Biomass, and Grain Yield in the North China Plain. PLoS ONE 2014, 9, e86938. [Google Scholar] [CrossRef]
  49. Zhu, H.; Zheng, B.; Nie, W.; Fei, L.; Shan, Y.; Li, G.; Liang, F. Optimization of Maize Irrigation Strategy in Xinjiang, China by AquaCrop Based on a Four-Year Study. Agric. Water Manag. 2024, 297, 108816. [Google Scholar] [CrossRef]
  50. Hou, L.; Wang, X.-S.; Zhou, Y.; Zhu, G.; Gao, Y.; Zhou, J. Cropland-Scale Interaction between Maize Evapotranspiration and Groundwater in a Well-Irrigation District in Mu Us Sandy Land, Northwest China. Agric. Ecosyst. Environ. 2025, 378, 109282. [Google Scholar] [CrossRef]
  51. Jiang, Y.; Zhang, L.; Zhang, B.; He, C.; Jin, X.; Bai, X. Modeling Irrigation Management for Water Conservation by DSSAT-Maize Model in Arid Northwestern China. Agric. Water Manag. 2016, 177, 37–45. [Google Scholar] [CrossRef]
  52. Liu, Y.; Guan, X.; Yang, M.; Ding, C.; Cui, J.; Huang, J.; Mei, F.; Wang, H.; Wang, T. Optimization simulation of summer maize irrigation system in northern Henan Province based on DSSAT model. Acta Ecol. Sin. 2019, 39, 5348–5358. [Google Scholar]
  53. Xu, M.; Zhang, Y.; Wang, Y.; Wang, L.; Bai, Y.; Lu, Y. Optimizing Nitrogen Input and Nitrogen Use Efficiency through Soil Nitrogen Balance in a Long-Term Winter Wheat-Summer Maize Rotation System in North China. Eur. J. Agron. 2023, 149, 126908. [Google Scholar] [CrossRef]
  54. Li, B.; Yan, L.; Zhang, W. Study on N Application and N Reduction Potential of Farmland in China. Environ. Monit. Assess. 2023, 195, 1156. [Google Scholar] [CrossRef]
  55. Mosaad, I.S.M.; El-Samit, R.M.; Seadh, A.K.; Abdelhamied, A.S.; Mustafa, A.E.-Z.M.A.; Elshikh, M.S. Quantitative Nitrate Leaching Relationship Models Based on Nitrogen Fertilisation and the Intervals between Maize Irrigations in the Salt-Affected Soil. J. King Saud Univ. Sci. 2024, 36, 103187. [Google Scholar] [CrossRef]
  56. Wei, Q.; Wei, Q.; Xu, J.; Liu, Y.; Wang, D.; Chen, S.; Qian, W.; He, M.; Chen, P.; Zhou, X.; et al. Nitrogen Losses from Soil as Affected by Water and Fertilizer Management under Drip Irrigation: Development, Hotspots and Future Perspectives. Agric. Water Manag. 2024, 296, 108791. [Google Scholar] [CrossRef]
  57. Kumar, K.; Parihar, C.M.; Nayak, H.S.; Sena, D.R.; Godara, S.; Dhakar, R.; Patra, K.; Sarkar, A.; Bharadwaj, S.; Ghasal, P.C.; et al. Modeling Maize Growth and Nitrogen Dynamics Using CERES-Maize (DSSAT) under Diverse Nitrogen Management Options in a Conservation Agriculture-Based Maize-Wheat System. Sci. Rep. 2024, 14, 11743. [Google Scholar] [CrossRef]
  58. Ome, U.K.; Eke, J.; Ojili, S.N. Simulation-Based Modeling of Soil Dynamics for Understanding Crop Responses. Int. J. Latest Technol. Eng. Manag. Appl. Sci. 2024, XIII, 19–28. [Google Scholar] [CrossRef]
  59. Eitzinger, J.; Thaler, S.; Schmid, E.; Strauss, F.; Ferrise, R.; Moriondo, M.; Bindi, M.; Palosuo, T.; Rötter, R.; Kersebaum, K.C.; et al. Sensitivities of Crop Models to Extreme Weather Conditions during Flowering Period Demonstrated for Maize and Winter Wheat in Austria. J. Agric. Sci. 2013, 151, 813–835. [Google Scholar] [CrossRef]
Figure 1. Location of the study area. Note: the picture below the map shows the on-site photos of the experimental field.
Agronomy 15 01085 g001
Figure 2. Meteorological conditions during maize growing seasons in experimental and typical hydrological years.
Agronomy 15 01085 g002
Figure 3. DSSAT model structure.
Agronomy 15 01085 g003
Figure 4. Dynamics of the LAI and biomass accumulation in maize under different treatments across phenological stages during 2023–2024.
Agronomy 15 01085 g004
Figure 5. Soil moisture and water potential changes in each treatment in 2023–2024.
Agronomy 15 01085 g005
Figure 6. Simulated and measured values of soil moisture in each soil layer under the A1 and B1 treatments in 2023.
Agronomy 15 01085 g006
Figure 7. Simulated and measured values of soil moisture in each soil layer under the A1 and B1 treatments in 2024.
Agronomy 15 01085 g007
Figure 8. Maize grain yield, irrigation frequency, and water use efficiency at different irrigation periods in a typical hydrological year.
Agronomy 15 01085 g008
Figure 9. Maize grain yield and water use efficiency under different irrigation volume treatments in typical hydrological years.
Agronomy 15 01085 g009
Figure 10. Maize grain yield and PFPN under different fertilization treatments in typical hydrological years. Note: the number at the top of each column represents the PFPN processed accordingly.
Agronomy 15 01085 g010
Table 1. Field trial of the irrigation and fertilization plan.
YearTreatmentIrrigation DateIrrigation Quota (mm)Base Fertilizer (kg·ha−1)Top Dressing (kg·ha−1)
2023A1N1--6853
N2-76
B1N16.10
6.27
7.27
9.18
12053
N276
2024A1N1--6853
N2-76
B1N16.8
6.29
9.10
9053
N276
Table 2. Soil physicochemical properties.
Soil Layer (cm)0–2020–4040–6060–8080–100
Bulk density (g·cm−3)1.471.441.521.541.46
Field capacity (cm3·cm−3)0.260.250.320.30.22
Volumetric water (cm3·cm−3)0.210.230.210.240.23
Nitrate nitrogen (mg·cm−3)4.773.011.611.290.81
Ammonium nitrogen (mg·cm−3)1.010.970.220.140.06
Organic carbon (%)1.210.820.620.610.5
pH8.128.28.118.228.21
Sand (%)31.934.429.940.566.1
Silt (%)46.544.249.348.323.5
Clay (%)21.621.420.811.210.4
Table 3. Simulation test scheme of maize irrigation period under typical precipitation years.
TreatmentIrrigation Quota (mm)Irrigation PeriodTreatmentIrrigation Quota (mm)Irrigation Period
W10rainfedW9100VJ and VT
W250VEW10100VJ and R2
W350VJW11100VT and R2
W450VTW12150VE, VJ, and VT
W550R2W13150VE, VJ, and R2
W6100VE and VJW14150VE, VT, and R2
W7100VE and VTW15150VJ, VT, and R2
W8100VE and R2W16200VE, VJ, VT, and R2
Table 4. Maize yield and components under different treatments in 2023–2024.
YearTreatmentEar Length (cm)Ear Diameter (cm)Kernel Number per Ear (Kernel)100-Grain Weight (g)Yield (kg·ha−1)
2023A1N112.36 b2.93 b403.5 b24.73 b7165 b
A1N213.12 b3.07 ab422.54 b26.75 b7454 b
B1N114.62 ab3.26 a459.31 a29.47 a10,783 a
B1N216.03 a3.43 a489.83 a32.34 a11,049 a
2024A1N112.67 b3.04 ab416.38 b25.92 b8463 b
A1N213.45 b3.31 a427.64 b27.65 b8801 b
B1N115.36 a3.41 a461.94 a30.83 a10,642 a
B1N216.42 a3.46 a485.32 a32.57 a10,934 a
Note: different lowercase letters indicate significant differences among treatments at the α = 0.05 level.
Table 5. Water balance of each treatment in 2023–2024.
YearTreatmentIrrigation Volume (mm)Precipitation (mm)Evapotranspiration (mm)Water Balance Difference (mm)
2023A1N10471.53357.25114.28
A1N2369.51102.02
B1N1120453.62137.91
B1N2467.39124.14
2024A1N10528.17412.63115.54
A1N2425.24102.93
B1N190467.36150.81
B1N2486.49131.68
Table 6. Error metrics for the calibration and validation of maize phenological stages, LAIX, biomass, and yield during 2023–2024.
Item 2023 (Calibration)R2RMSEnRMSEMB2024 (Verification)R2RMSEnRMSEMB
A1N1A1N2B1N1B1N2A1N1A1N2B1N1B1N2
Anthesis
(DAP)
Measured data52525353111.9154545353111.870.75
Simulated data5353545455555454
Maturity (DAP)Measured data103103104104121.932102103102102110.971
Simulated data105105106106104104105105
Maximum leaf area index Measured data3.223.271054.280.980.225.910.183.433.624.734.510.960.112.821.11
Simulated data3.273.344.314.563.513.534.574.62
Biomass at Flowering (kg/ha)Measured data528459634.5278390.94685.4910.54630.2560246388634777480.98653.799.87648
Simulated data60486957693183126574703971328354
Biomass at Maturity (kg/ha)Measured data15,37516,045722122,3550.971851.19.981793.517,36418,33720,12720,8480.981655.338.641408.25
Simulated data16,78318,62120,44623,95317,85618,93422,53722,952
Yield (kg/ha)Measured data7165745422,03811,0490.96866.389.51712.258463880110,64210,9340.98803.868.28791.75
Simulated data7634801610,78312,5969457953111,25711,762
Table 7. Optimization results of genetic parameters of maize varieties.
ParameterP1P2P5G2G3PHINT
Range100–4000–4600–1000500–10005–1230–75
Optimal value2240.788138578.5745
Table 8. Optimal irrigation and fertilization schemes for different typical hydrological years.
Typical Hydrological YearsIrrigation PeriodIrrigation Quota (mm)Nitrogen Application Rate (kg·ha−1)
Wet hydrological yearsRainfed0240
Normal hydrological yearsVT30240
Dry hydrological yearsVE, VT, R290180
Disclaimer/Publisher’s Note: The statements, opinions and data contained in all publications are solely those of the individual author(s) and contributor(s) and not of MDPI and/or the editor(s). MDPI and/or the editor(s) disclaim responsibility for any injury to people or property resulting from any ideas, methods, instructions or products referred to in the content.

