Article

Cover Crops Optimize Soil Fertility and Soybean Productivity in the Cerrado of MATOPIBA, Brazil

by
Hosana Aguiar Freitas de Andrade
1,
Edvaldo Sagrilo
2,
José Oscar Lustosa de Oliveira Júnior
2,
Daiane Conceição de Sousa
3,
Carlos Pedro de Menezes Costa
4,
Paula Muniz Costa
5,
Raimundo Bezerra de Araújo Neto
2,
Rosa Maria Cardoso Mota de Alcantara
2,
Luiz Fernando Carvalho Leite
2,
Mariléia Barros Furtado
6,
Marcelo Javier Beltrán
7,
Nicolas Cafaro La Menza
8 and
Henrique Antunes de Souza
2,*
1
Center of Agricultural Sciences, Federal University of Piauí, Rua Dirce Oliveira, 3397, Ininga, Teresina 64048-550, Piauí, Brazil
2
Brazilian Agricultural Research Corporation, Embrapa Meio-Norte, Avenida Duque de Caxias, Buenos Aires, Teresina 64008-780, Piauí, Brazil
3
Department of Agroforestry Sciences, Federal University of Southern Bahia, Rodovia Ilheus—Km 22, Itabuna 45604-811, Bahia, Brazil
4
Federal Institute of Education, Science, and Technology of Piauí, Rua Projetada, S/N—Uberaba II, Oeiras 64500-000, Piauí, Brazil
5
Department of Soil Science, Federal University of Lavras, Aquenta Sol, Lavras 37200-900, Minas Gerais, Brazil
6
Chapadinha Science Center, Federal University of Maranhão, MA-230, KM 04, S/N, Boa Vista, Chapadinha 65500-000, Maranhão, Brazil
7
National Institute of Agricultural Technology (Instituto Nacional de Tecnología Agropecuária, INTA), Rivadavia 1439, Cidade Autônoma de Buenos Aires C1033AAE, Argentina
8
West Central Research, Extension and Education Center, Department of Agronomy and Horticulture, University of Nebraska-Lincoln, 402 W State Farm Road, North Platte, NE 69101-7751, USA
*
Author to whom correspondence should be addressed.
Agronomy 2025, 15(5), 1083; https://doi.org/10.3390/agronomy15051083
Submission received: 11 March 2025 / Revised: 12 April 2025 / Accepted: 26 April 2025 / Published: 29 April 2025

Abstract

:
The main challenge of soybean cultivation in Brazil’s last agricultural frontier is to ensure sustainable production. This study aimed to evaluate the use of cover crops (CC) to improve soil fertility, plant nutrition, and soybeans productivity grown in the Cerrado of Brazil. The study was carried out on a farm located in the state of Maranhão, Brazil, with nine treatments, fallow and CC preceding soybean cultivation: (i) Millet (Pennisetum glaucum L.); (ii) Marandu (Urochloa brizantha); (iii) Ruziziensis (Urochloa ruziziensi); (iv) Tanzania (Megathyrsus maximum); (v) Massai (Megathyrsus maximum); (vi) cowpea (Vigna unguiculata L.); (vii) pigeon pea (Cajanus cajan L.); and (viii) Crotalaria (Crotalaria juncea). An analysis for the characterization of the biomass of cover crops and fallow was carried out. Soil chemical and biological properties, soybean foliar nutrient concentrations, and the soybean seed yield and quality grown in sequence to the CC were also analyzed. Soil microbial carbon was favored by the cultivation of ‘Marandu’, ‘Ruziziensis’, ‘Tanzania’, and cowpea. Nutrient cycling promoted by CC contributed to the maintenance of soil quality and increases in the leaf nutrient concentrations of soybeans. The cultivation of millet, ‘Tanzania’, ‘Massai’, cowpea, and C. juncea increased the soybean yield. Cover crops improved soil fertility while increasing soybean productivity, thus being an effective strategy for the achievement of sustainable soybean production.

1. Introduction

Brazil is known worldwide as the leading producer and exporter of soybeans [1]. This prominence was only achieved recently due to the expansion of soybean cultivation in the last agricultural frontier area of the Cerrado biome, called MATOPIBA [2,3]. MATOPIBA is a strategic region that encompasses the states of Maranhão, Tocantins, Piauí, and Bahia [4]. Agricultural expansion for soybean production in the Cerrado of Brazil arises as a component in the achievement of global food security. On the other hand, the conversion of native vegetation typical of the Cerrado biome into agricultural areas remains the main challenge for the sustainable development of soybean production systems [2,5].
The use of techniques such as no-till systems associated with cover crops (CC), provides an appreciable alternative for the reduction of the possible negative impacts of land use [6]. Previous studies show that the use of CC can either maintain or improve soil quality [7,8] by increasing the concentrations and quality of organic matter and influencing microbial biomass and activity [9], as well as enzymatic activity [10]. The production of CC biomass in the off-season also has effects on soil fertility [6] and regulates nutrient cycling [11,12,13], with a consequent increase in seed yield, seed protein content, and oil concentrations in soybean grown in the subsequent season [14].
In this context, the use of CC adapted to each region can maximize soybean productivity [15] while improving the soil quality, alleviating trade-offs in the agricultural system [16]. However, regarding the agricultural frontier in the Cerrado, there is a notable gap in scientific knowledge, because, unlike other soybean-producing regions in Brazil, in this frontier, the cover crops indicated for the soybean cultivation system have not yet been consolidated. Since the accumulation of biomass from cover crops is limited in the dry winter [17,18], one of the greatest challenges and contrasts with many soybean-producing regions in Brazil is the low accumulation of rainfall in the off-season [19]. In addition, the agricultural frontier region still presents soybean production with low technological input. Therefore, the cultivation options after the soybean harvest converge mainly towards millet. Millet has been able to promote improvements in soil quality and the productivity of soybeans grown in sequence, even under water deficit conditions [20]. However, growing only millet can compromise agricultural productivity, especially when there is a wide variety of cover crops that can be explored and that are adaptable to the tropical climate, such as grasses Megathyrsus [21] and Urochloa [22] and the legumes cowpea (Vigna unguiculata L.) [23], pigeon pea (Cajanus cajan L.) [24], and Crotalarea [25]. Therefore, this study sought to explore potential cover crops that promote sustainable soybean production in an agricultural frontier region. Based on this, the objectives of this study were to (i) identify cover crop species that promote improvements in soil microbiological attributes; (ii) evaluate the effects of cover crops on soil chemical attributes and the soybean nutritional status; and (iii) test whether cover crops boost the soybean seed yield and quality in the Cerrado of Northeastern Brazil.

2. Materials and Methods

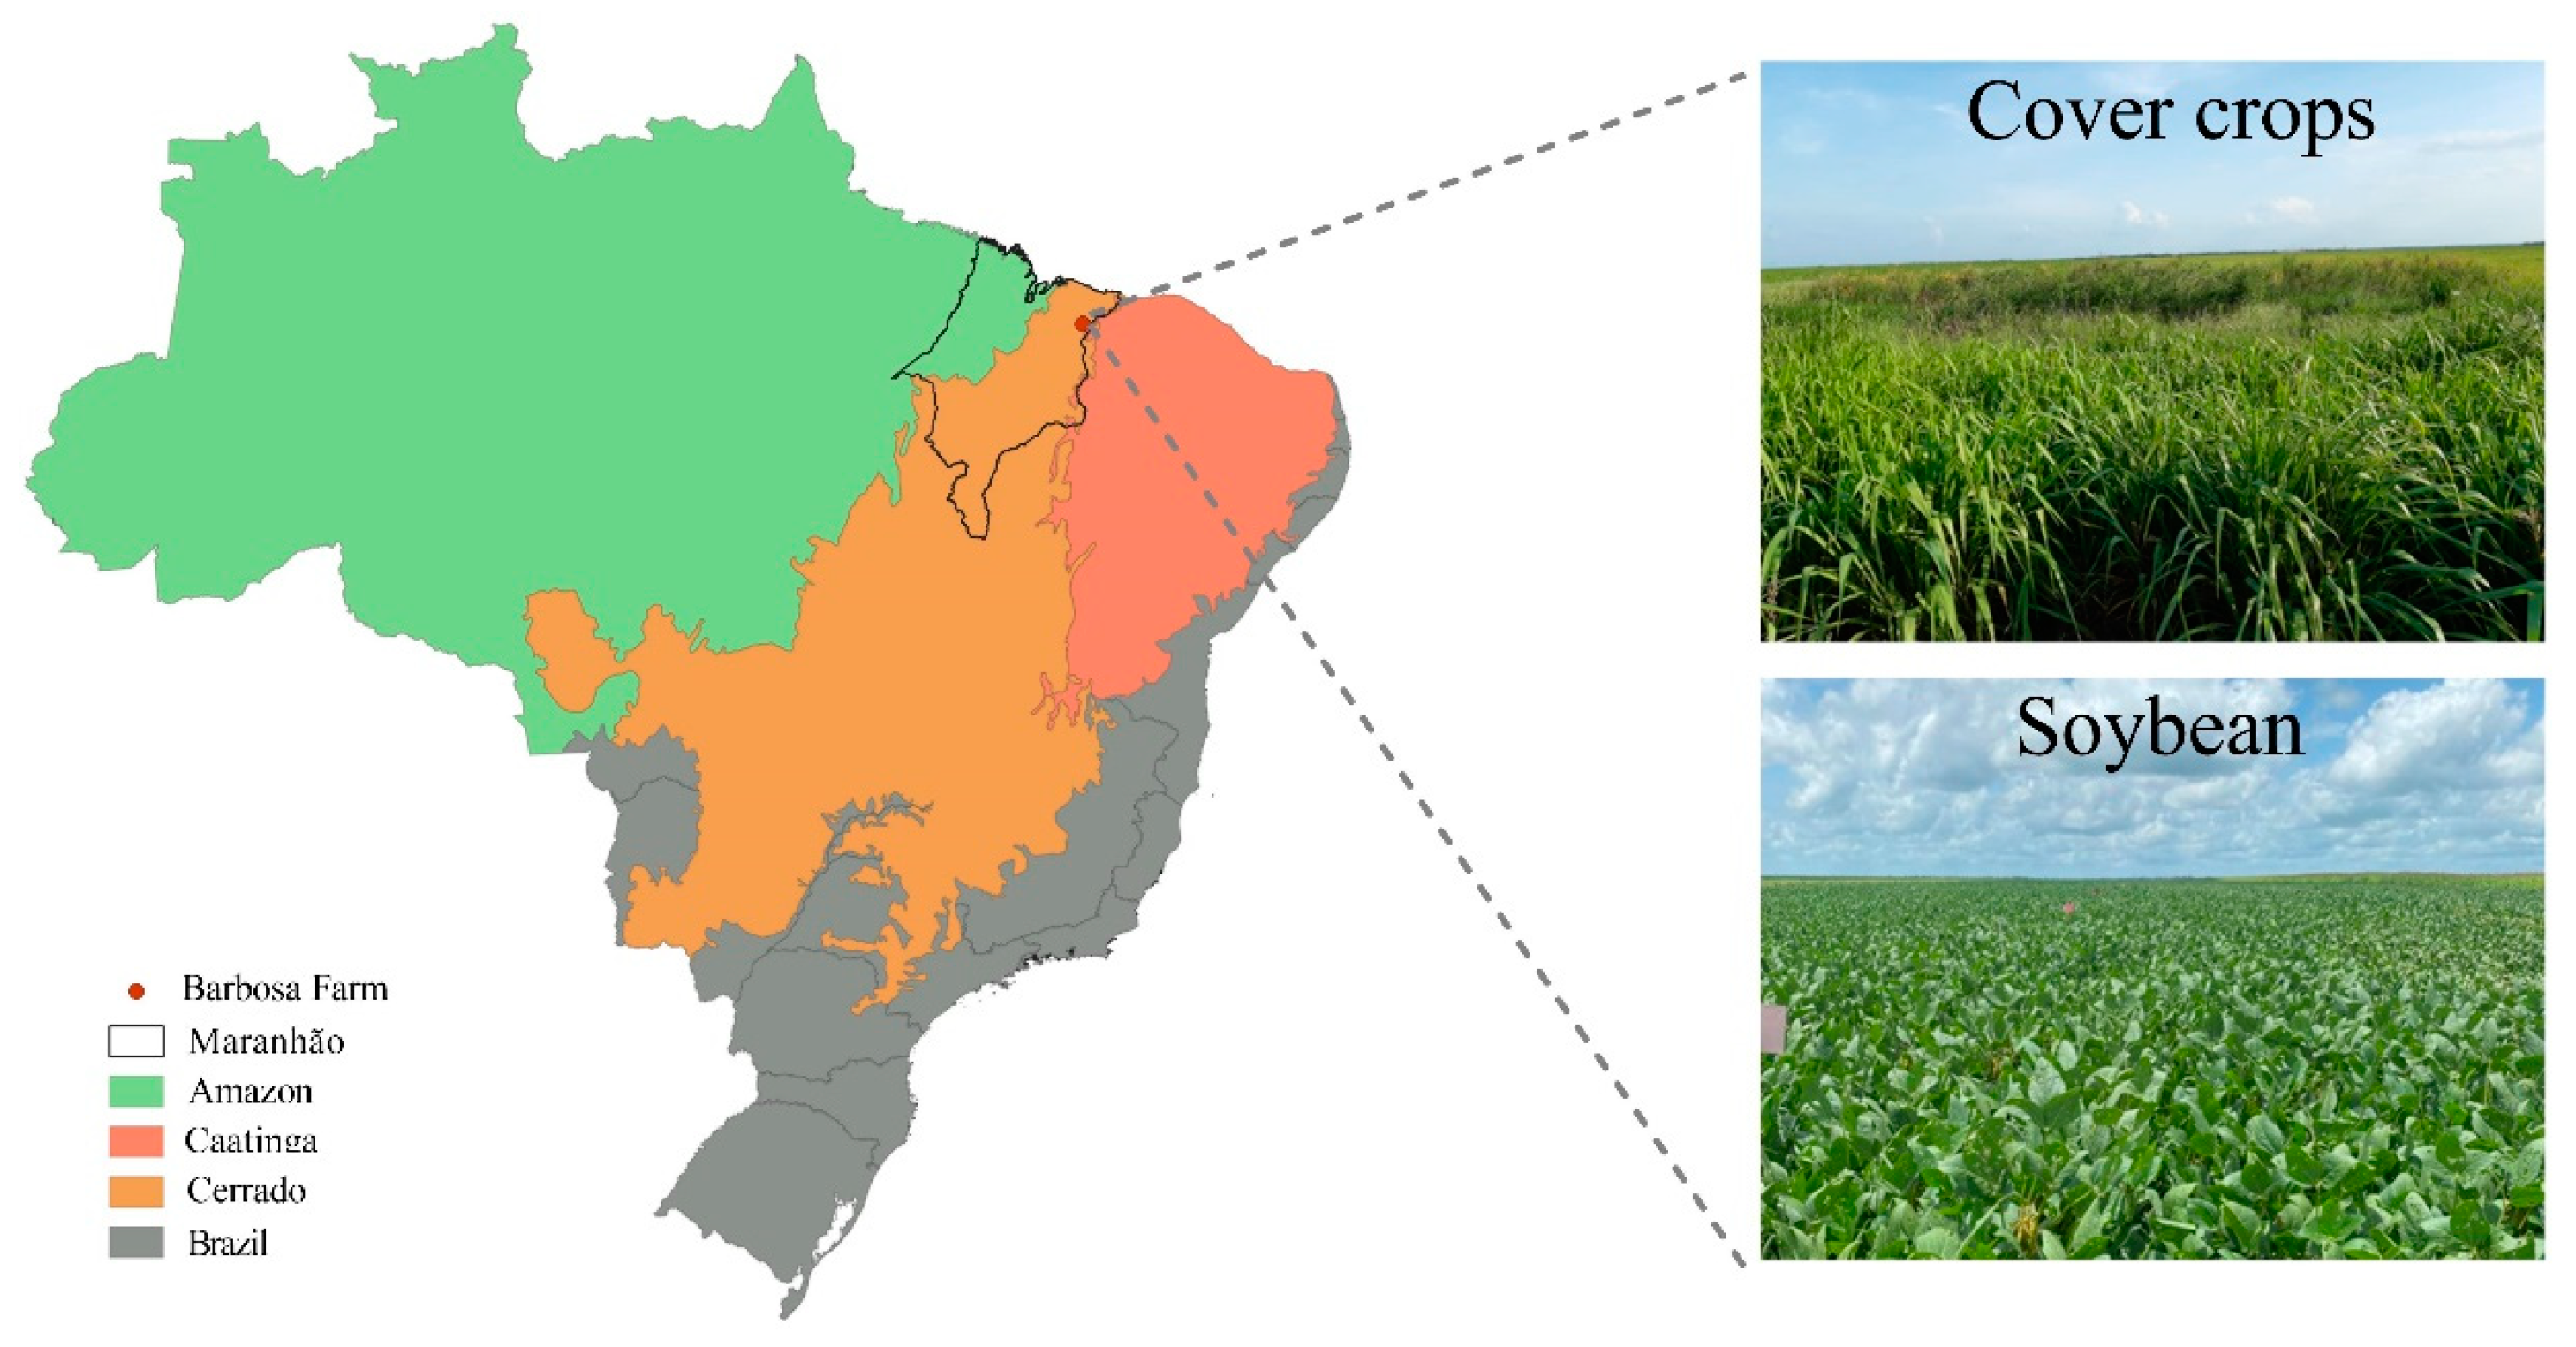
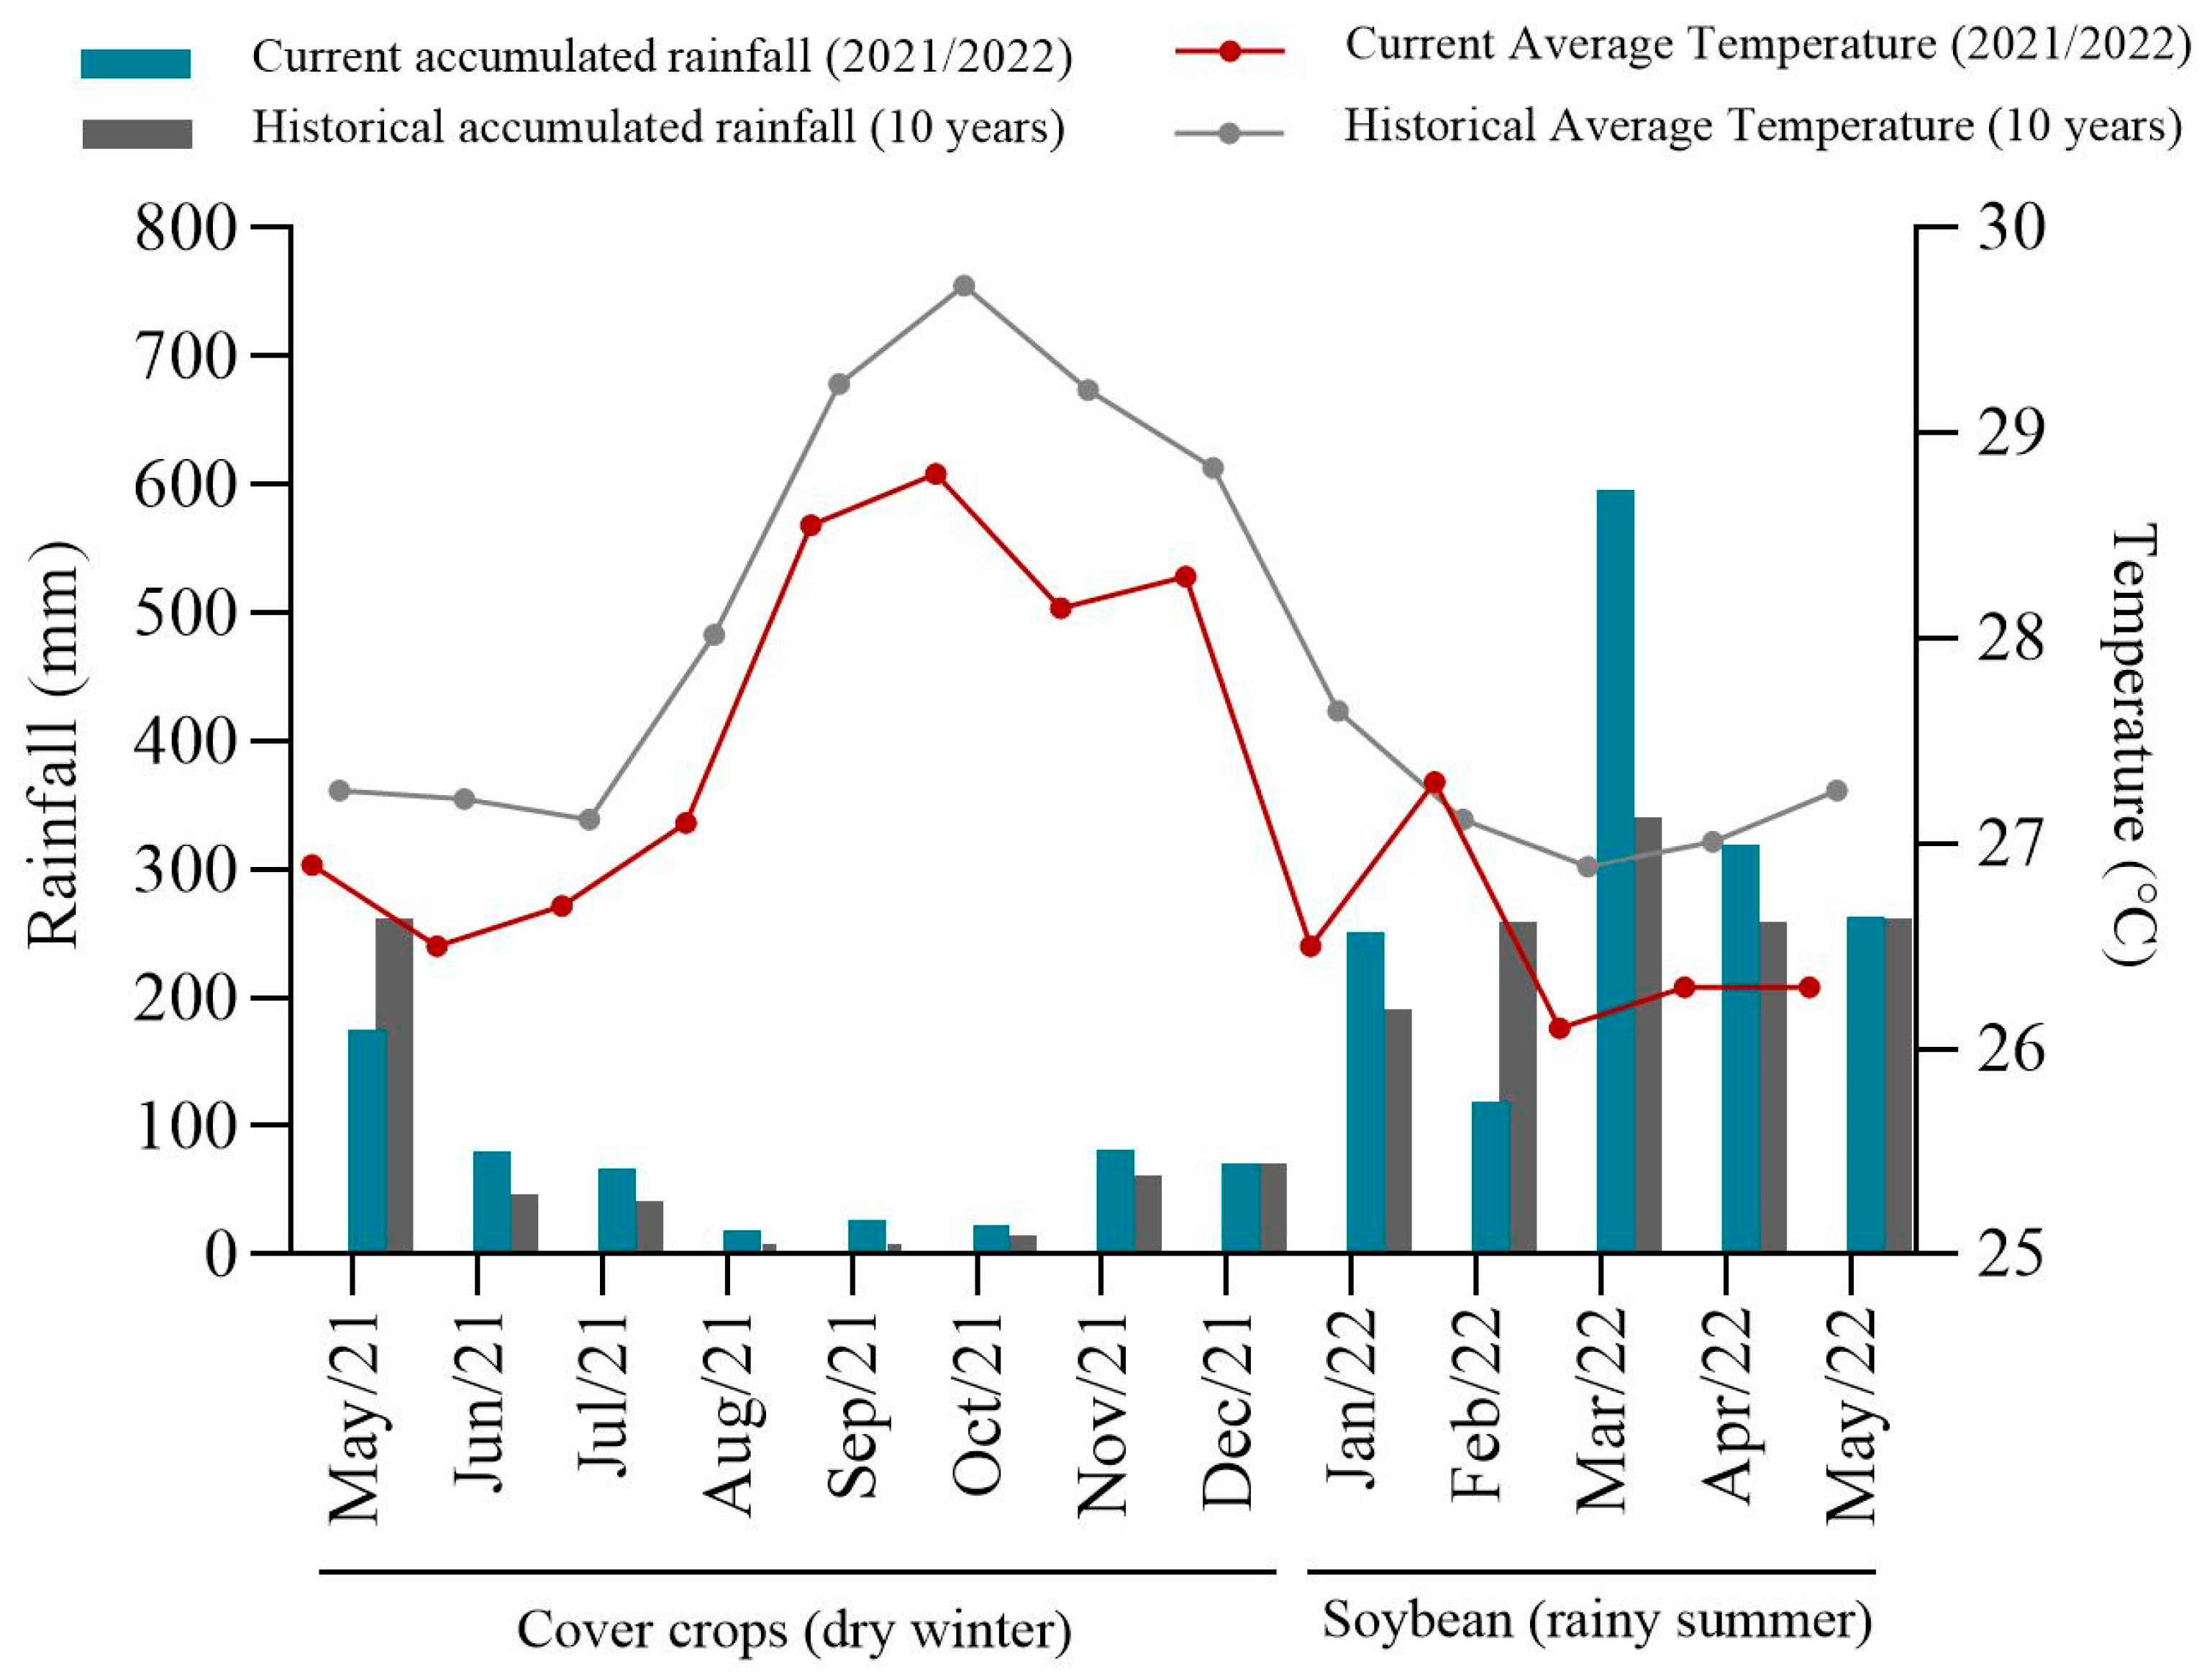
2.1. Site Details and Experimental Design

This study was conducted at Barbosa Farm during the 2021/2022 crop season. The farm is located in the municipality of Brejo, in the Cerrado of Eastern Maranhão, Brazil (03°42′44′′ S; 42°55′44′′ W; 102 m altitude) (Figure 1). The experimental area is a transition region between a drier condition typical of the semi-arid northeast (Caatinga) and a wetter condition due to the proximity to the north of Brazil and the Amazon rainforest [19]. The region’s climate type is Aw (tropical, with dry winters and rainy summers) according to the Köppen classification [26]. The rainfall and temperature data during the experimental period are shown in Figure 2.
Cover crops were sown in the off-season, in May 2021. During the development of the cover crops, the accumulated precipitation was 353 mm and the average temperature was 27.6 °C. The historical average (2011–2012) revealed that, during the off-season period, accumulated precipitation of 514 mm and an average temperature of 28.3 °C were found. Soybeans were sown in the rainy summer, in January 2022. During the soybean development cycle, accumulated precipitation of 1586 mm and an average temperature of 26.5 °C were recorded. The historical average indicates accumulated precipitation of 1312 mm and an average temperature of 27.2 °C during the soybean development cycle.
Barbosa Farm has been cultivating soybeans under a no-till system for ten years. From the 2014/2015 season, the experimental area was composed of maize intercropped with Urochloa brizantha cv. ‘Marandu’, rotated biennially with soybeans—that is, after soybean cultivation, the intercropped maize was rotated every two years. The soil was classified as a Yellow Argisol according to the Brazilian Soil Classification System [27], corresponding to Ultisol [28]. Before sowing the cover crops, soil samples were collected from the area at a depth of 0–0.20 m and subjected to particle size and chemical analyses (Table 1) [29].
The experiment was conducted in a randomized block design, consisting of three blocks and nine treatments, corresponding to the following CC preceding soybeans: 1—fallow in the off-season of soybean cultivation (control: with the presence of spontaneous soybean, from seed germination from the soil); 2—millet (Pennisetum glaucum L.) cv. ADR300; 3—Urochloa brizantha cv. Marandu; 4—Urochloa ruziziensis cv. Ruziziensis; 5—Megathyrsus maximum cv. Tanzania; 6—Megathyrsus maximum cv. Massai; 7—cowpea cv. Tumucumaque; 8—pigeon pea cv. Mandarin; and 9—Crotalaria juncea. Each experimental plot consisted of an area of 4 × 6 m, totaling 24 m2.

2.2. Conducting and Evaluating Cover Crops

Cover crops were sown immediately after the soybean harvest in May 2021. The forage grass seeds were broadcast at a sowing rate of 5 kg ha1 of viable pure seeds, except for millet, which was sown at a sowing rate of 20 kg ha1 of viable pure seeds. The legumes were sown in planting furrows, with a spacing of 0.5 m between rows and 0.2 m between plants.
At the beginning of August 2021, the CC were evaluated for dry mass productivity with the help of a 0.25 m2 frame, randomly placed in each plot, to delimit the area for the collection of plant material. The plant material was dried in a forced-air circulation oven at 65 °C until a constant mass was reached and was then weighed. From the plant material collected, the nutrient concentration [30] and the amount of lignin [31] were determined, and its relationship with nitrogen (N) was calculated. Carbon (C) concentration [32] was also quantified, from which the C/N ratio was calculated. The biomass production in the area under fallow was also quantified, mainly due to the occurrence of spontaneous soybean plants.

2.3. Conducting and Evaluating Soybeans

After desiccating the CC, soybean seeds were sown in January 2022. Desiccation occurred 5 days before soybean sowing. The soybean cultivar was Pampeana 90 RR, which has a semi-determined growth habit and a maturity group of 9.2. Soybean plants were cultivated at a spacing of 0.5 m between rows and with a population of 280,000 plants ha1. Before sowing, the seeds were inoculated with strains of Bradyrhizobium japonicum in the planting furrow. Fertilization was carried out based on the soil properties, and the same fertilization was carried out for all plots. Soybean plants were fertilized using 100 kg ha1 of KCl (60% K2O) broadcast and 150 kg ha1 of MAP (11% N and 52% P2O5), applied to the planting furrow. As topdressing, 200 kg ha1 of 10–00–30 NPK was applied. At 39 days after soybean sowing (DAS), 0.30 kg ha1 of Kellus manganese® (13% Mn) and 0.15 kg ha1 of Kellus zinc® (15% Zn) were applied.
In each experimental plot, at the phenological stage between the beginning of flowering (R1) and full flowering (R2), twelve newly expanded leaves with petioles, corresponding to the third and fourth trifoliate leaves from the apex of the plant, were collected to evaluate the nutritional status of the plants. Plant tissue samples were washed with water, 3% hydrochloric acid, and deionized water (v/v). The samples were placed in paper bags and dried in a forced-air circulation oven at 65 °C until a constant mass was reached. After drying, the material was ground in a Willey mill and passed through a sieve with 1 mm openings. The ground samples were used to determine the nitrogen (N), phosphorus (P), potassium (K), calcium (Ca), magnesium (Mg), sulfur (S), copper (Cu), zinc (Zn), iron (Fe), manganese (Mn), and (boron) B concentrations, according to procedures described in [30]. The plant samples were subjected to sulfuric digestion, followed by distillation using the Kjeldahl method to determine the N content. The B concentration was determined by the azomethine-H method after the incineration of the samples in a muffle furnace, with subsequent quantification in a molecular absorption spectrophotometer. The Ca, Mg, K, P, S, Fe, Cu, Mn, and Zn concentration was analyzed by nitric–perchloric digestion and determination by atomic absorption spectrophotometry for Ca, Mg, K, Fe, Cu, Mn, and Zn, metavanadate colorimetry for P, and barium sulfate turbidimetry for S.
At the full maturity phenological stage of soybean (R8), the biological and chemical attributes of the soil were assessed, and the analyses were performed in triplicate. Initially, in each plot, two soil samples were collected within the row and two soil samples between the rows at a depth of 0.0–0.10 m. The samples were mixed to form a composite sample. For the analysis of soil biological properties, the samples were kept under refrigeration (~3 °C) for less than 30 days. Total organic carbon (TOC) was determined using the modified method originally proposed by Walkley and Black [29]. Regarding the biological attributes of the soil, the microbial biomass carbon (MBC), microbial biomass nitrogen (MBN) [33], and basal soil respiration (BSR) [34] were quantified. The determination of MBC and MBN occurred after the sample irradiation method in a microwave oven and extraction with potassium sulfate. The BSR was measured after the incubation of the soil for seven days; the released CO2 was captured with a sodium hydroxide solution, followed by titration with hydrochloric acid. From these data, the metabolic quotient (qCO2) [35] and microbial quotient (qMic) [36] were calculated. Fluorescein diacetate hydrolysis (FDA) [37,38] and dehydrogenase activity (DHA) [39,40] were used to measure enzymatic activity. DHA determination was performed in a spectrophotometer after the addition of the compound triphenyltetrazolium formazan (TTF) and subsequent incubation in a water bath for 24 h. To determine the FDA, the method used was the addition of fluorescein diacetate to the soil and incubation in a shaker at 24 °C. The reaction was stopped by the addition of acetone and the FDA of the solution was quantified in a spectrophotometer.
For the soil chemical properties, the samples were subjected to chemical analysis according to the procedures described in [29]. The soil pH was determined by the potentiometer method, at a soil–water ratio of 1:2.5; the available potassium (K+) and phosphorus (P) were extracted using Mehlich-1 solution, with the K+ availability determined by atomic absorption spectroscopy and the P availability determined by spectrophotometry; calcium (Ca2+) and magnesium (Mg2+) were determined by atomic absorption spectroscopy after extraction with 1 mol L1 KCl. Sulfate (S-SO42−) was determined by turbidimetry in a spectrophotometer after extraction with Ca(H2PO4)2 containing 500 mg L1 of P in HOAc 2 mol L1. The micronutrients zinc (Zn), copper (Cu), iron (Fe), and manganese (Mn) were extracted using Mehlich-1 solution and determined using atomic absorption spectroscopy. Boron (B) was determined by spectrophotometry after using the hot water extraction method. The cation exchange capacity (CEC) was calculated.
After soil collection, soybean productivity was estimated by harvesting the seeds in the central area of each plot (2 m2), from which the seed mass was determined by adjusting the dry weight to 13% moisture and transforming it to kg ha1. The oil and protein content of the soybeans was also determined [41]. The oil was extracted by petroleum ether with Soxhlet-type equipment. The nitrogen concentration of the grains was determined according to the Kjeldahl method, and the protein concentration was estimated by multiplying the nitrogen content found by the factor 6.25. Protein and oil yields (kg ha1) were calculated by multiplying the sample seed yield by the corresponding sample seed protein and oil concentrations [42].

2.4. Statistical Analysis

The data were subjected to a normality test (Shapiro–Wilk, p < 0.05). Once the criterion was met, the data were subjected to an analysis of variance (ANOVA) to determine the effects of the treatments (cover crops). When a significant effect was found by the F test (p < 0.05), the treatments were grouped using the Scott–Knott test. The analyses were carried out using the Infostat statistical software (InfoStat/Professional V1.1 software) [43]. Additionally, a multivariate analysis was performed to compare the structures of the dependent variables among treatments using principal component analysis (PCA) on log-transformed data, as well as to identify similarities between the cover crop/soybean sequences, using the statistical package R [44].

3. Results

3.1. Quantity and Quality of Cover Crop Biomass

The biomass of ‘Massai’ was 48% higher than that of the other CC and 51% higher than that of the fallow (Table 2). The N concentration was higher (+58%) in the fallow biomass. Legumes and fallow had the highest P concentrations in the biomass. The highest K concentration was found in the biomass of cowpea and grasses, except millet. Cowpea had higher Ca, Mg, and B concentrations in the biomass compared to CC. The highest S concentration was found in the biomass of ‘Ruziziensis’, cowpea, and pigeon pea. In addition to these CC, the highest Cu concentration was also found in the biomass of C. juncea. The biomass from the fallow treatment showed the highest Fe concentration. Cowpea and millet had the highest Zn concentrations, although they were similar to that of fallow. The highest Mn concentration was found in the biomass of cowpea and the grasses ‘Marandu’, ‘Ruziziensis’, and ‘Massai’. The data also revealed that pigeon pea, millet, and ‘Massai’ showed a higher lignin/N ratio than CC, and both grasses also showed the highest C/N ratio.

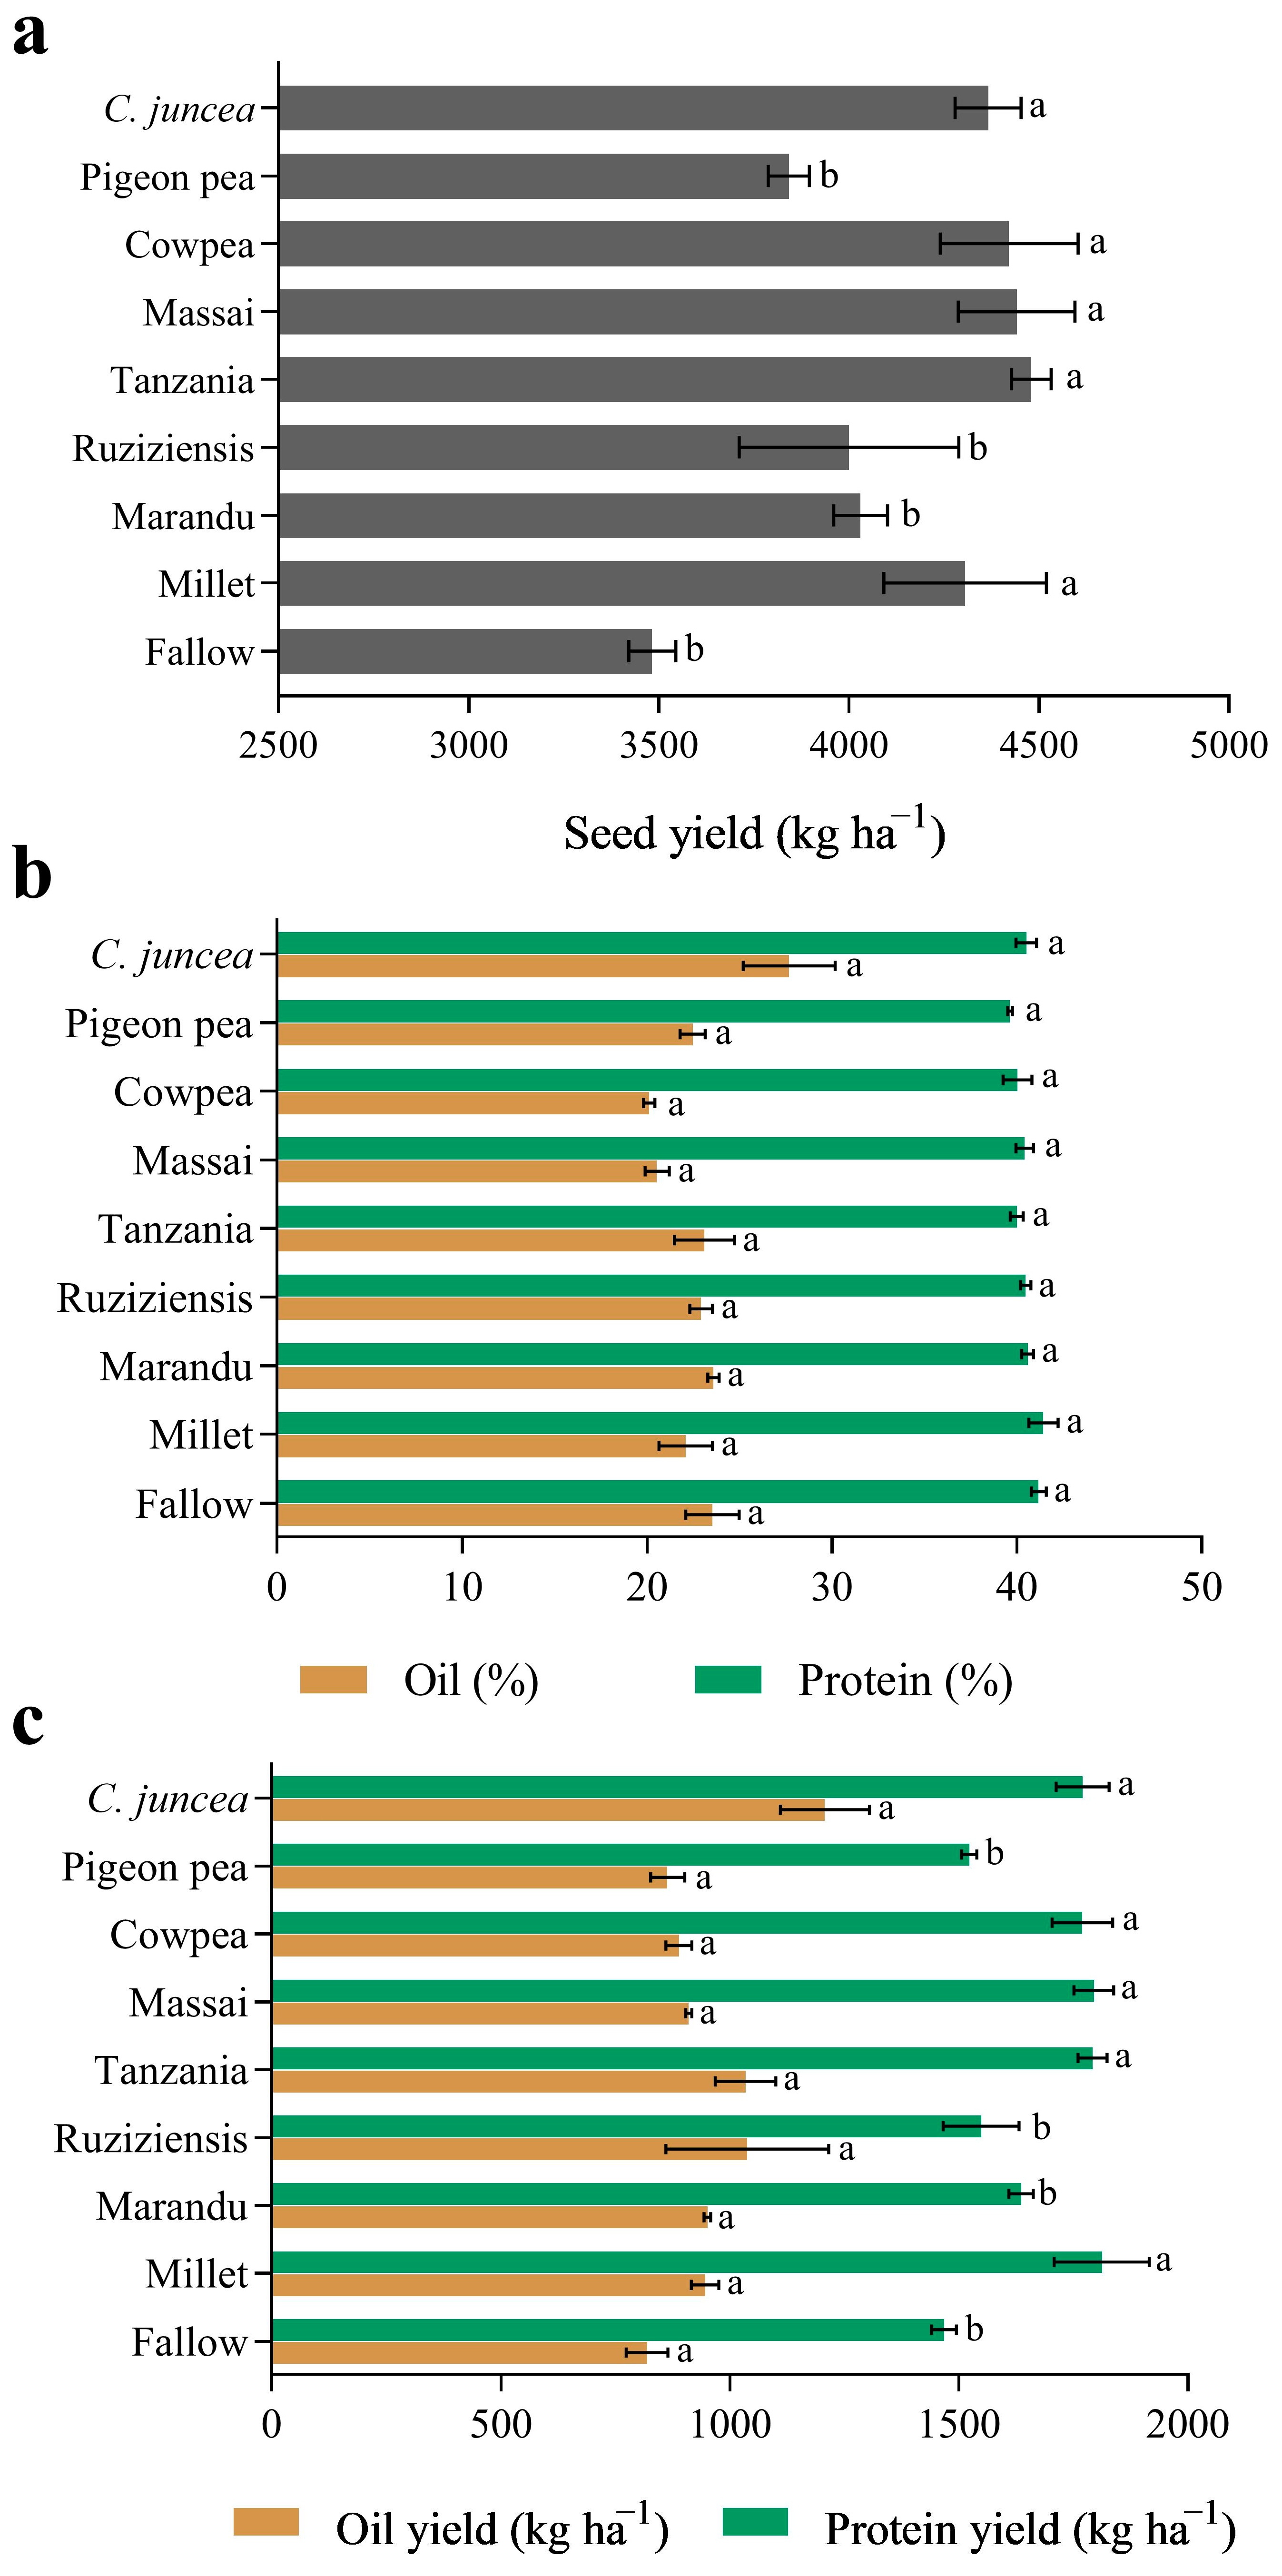
3.2. Productivity and Composition of Soybean Seeds

When grown after CC, the soybean yield was consistently higher (p < 0.05) after millet (+19%), ‘Tanzania’ (+22%), ‘Massai’ (+22%), cowpea (+21%), and C. juncea (+20%) compared to the absence of CC cultivation (Figure 3a). The use of CC did not significantly (p > 0.05) affect the protein and oil concentrations in soybean seeds, which remained at average values of 40.48 and 23.31% on a dry basis, respectively (Figure 3b). Nevertheless, when the yield of protein and oil was considered, soybean cultivated in sequence to C. juncea, Cowpea, ‘Tanzania’, ‘Massai’, and Millet showed higher values for protein compared to fallow and other cover crops (Figure 3c); for the oil yield, however, there were no differences among the cover crops.

3.3. Soil Biological Properties

Except for millet and ‘Massai’, the cover crops provided, on average, a 10% increase in TOC. The MBC values were significantly increased by the cultivation of cowpea (+10%), ‘Marandu’ (+15%), ‘Ruziziensis’ (+25%), and ‘Tanzania’ (+26%), compared to fallow (Table 3). The legumes cowpea, pigeon pea, and C. juncea resulted in the highest MBN values, corresponding to increases of 86, 89, and 86%, respectively, in relation to fallow. The ‘Marandu’, ‘Ruziziensis’, and ‘Massai’ cover crops resulted in higher BSR values (28.39, 29.61, and 33.11 mg C-CO2 g−1 day−1, respectively) compared to the other treatments. ‘Massai’ grass, together with millet, also presented the highest values of qCO2. qMic responded positively to the cultivation of ‘Marandu’, ‘Ruziziensis’, ‘Tanzania’, ‘Massai’, and cowpea, with an increase, on average, of 116.2% compared to fallow. Regarding the dehydrogenase enzyme, ‘Marandu’ and cowpea presented the highest values.

3.4. Soil Chemical Properties

The cover crop/soybean sequence did not affect (p > 0.05) the pH, CEC, Fe, Mn, and B in the soil (Table 4). Grasses and legumes showed contrasting results regarding the availability of the macronutrients P, K+, Ca2+, Mg2+, and S-SO42− in the soil. The cultivation of ‘Marandu’, ‘Ruziziensis’, cowpea, and pigeon pea resulted in higher P availability after the end of the soybean cultivation cycle, without differing, however, from fallow. The cultivation of ‘Marandu’, ‘Massai’, cowpea, and C. juncea provided a significant increase in soil K+ availability compared to the other CC (16.4% on average) and fallow. The cultivation of pigeon pea resulted in the highest soil Ca+2 concentration. Cowpea and pigeon pea increased the soil Mg+2 concentration. Pigeon pea, ‘Marandu’, and fallow increased the concentration of S-SO42− in the soil after soybean cultivation. The soil Cu availability increased with the pre-cultivation of pigeon pea, with a value that was, on average, 35% higher than that recorded for fallow and other CC. The concentrations of Zn after the cultivation of millet, ‘Marandu’, ‘Ruziziensis’, ‘Tanzania’, and the legume cowpea were higher compared to the other CC (+43% on average) and fallow (+49%).

3.5. Determination of Nutritional Status of Soybeans

The results reveal that the CC increased the K concentrations in soybean leaves, except millet (Table 5). There was no significant (p > 0.05) effect of the CC on the leaf concentrations of other macronutrients. The micronutrients Fe, Mn, and B responded to the cultivation of CC, but in different ways. ‘Marandu’, ‘Ruziziensis’, ‘Tanzania’, cowpea, and pigeon pea increased the Fe concentrations in soybean leaves compared to the other CC and fallow. Conversely, ‘Marandu’, ‘Ruziziensis’, cowpea, and pigeon pea, in addition to fallow, promoted the highest Mn concentrations in soybean leaves. The data also showed that both legumes, cowpea and pigeon pea, were responsible for the highest leaf B concentrations.

3.6. Principal Component Analysis

The PCA showed that the two selected components (PC1: 25.5% and PC2: 19.6%) explained 45% of the total variance in the data (Figure 4). The negative scores for PC1, such as biomass and the C/N ratio of CC, seed and protein yields, qCO2, and BSR, were positively correlated with millet, Tanzania, and Massai. The positive scores for PC1 and PC2, such as lignin in CC and NBM, were positively correlated with pigeon pea. Positive scores for PC2 and negative scores for PC1, such as Ca and Mg in CC and DHA, were positively correlated with fallow and cowpea.

4. Discussion

The data from the present study demonstrate the short-term responses of soil microbiota to cover crop cultivation, corroborating studies that relate the responses of microorganisms to the effects of plants [45,46]. The development of CC coincided with a period of low precipitation in the dry season. Overall, plants that maintain their growth under such conditions can make more resources available to soil microorganisms [45]. Thus, the increased residue supply after the cultivation of ‘Marandu’, ‘Ruziziensis’, ‘Tanzania’, and cowpea enables the incorporation of more carbon into the microbial biomass. The symbiotic relationship between nitrogen-fixing bacteria and leguminous cover crops increases the MBN [47]. This result corroborates the present study, since the cultivation of the legumes pigeon pea, cowpea, and C. juncea increased the MBN.
The cultivation of legumes also increased the TOC, possibly because these species produce a more readily available source of C [48]. Therefore, although legumes promote MBC and TOC in the short term, these effects may not necessarily last for long periods. However, grasses as CC may provide greater long-term benefits regarding TOC in soybean cultivation systems, due to the large amount of residues. The viability of including CC during the off-season depends on their biomass production [49]. In this study, ‘Massai’ stood out due to exhibiting the greatest contribution of plant residues to the soil. Likely, the lower short-term incorporation of TOC to the soil in this treatment was related to the high C/N and lignin/N ratios, which affected the residue decomposition rate [50,51]. These high values slowed the degradation process and controlled the transformation of C from plant residues into TOC [52].
Residues with a low C/N ratio stimulate BSR [53] by increasing the microbial activity in the soil [10]. However, even grasses with higher C/N ratios, such as ‘Marandu’, ‘Ruziziensis’, and ‘Massai’, showed high BSR, which persisted even after the soybean harvest. It is possible that the high C/N ratio of the residues from these CC limited microbial growth in the early soybean development periods [54], which in turn was subsequently stimulated by the addition of nitrogen fertilizer and senescent soybean residues, with a consequent increase in the release of CO2 [53,55]. Despite the high BSR after the cultivation of ‘Marandu’ and ‘Ruziziensis’, these CC were efficient in converting biomass C to MBC, resulting in a low qCO2. This same trend was not demonstrated by ‘Massai’, which showed a high qCO2, possibly as a consequence of the high C/N ratio of this grass [56]. Under conditions of high C/N plant residue availability, excess C is released through respiration, while N is incorporated into the tissue of decomposers [57]. The highest qMic values after the cultivation of ‘Marandu’, ‘Ruziziensis’, ‘Tanzania’, ‘Massai’, and cowpea indicate the greater conversion of TOC into new microbial biomass units [58]. Therefore, the use of these CC is of fundamental importance because higher values of qMic represent a greater balance in the organic C reservoir [59].
One important contribution provided by CC is the mitigation of possible soil nutrient losses during the fallow period [60,61], as observed for K+, Ca2+, Mg2+, Cu, and Zn. However, it is also necessary to determine whether CC can absorb nutrients and make them available promptly to meet the demands of the main crop [62]. In this study, synchronism between the availability due to CC and uptake by soybeans was observed for K+. The potential of grasses for K+ cycling is recognized [63] because grasses absorb non-exchangeable K and make it available in exchangeable forms [64]. Legumes also contributed to leaf K nutrition in soybeans, possibly due to K+ uptake from deeper layers and availability in topsoil. Therefore, long-term increases in K and other soil nutrients would be expected as a consequence of turnover processes promoted by CC [65].
The increased soil P availability provided by ‘Marandu’, ‘Ruziziensis’, cowpea, and pigeon pea may be associated with different P uptake strategies, including the exploitation of a greater volume of soil provided by the root architecture or the mobilization of poorly soluble P forms [11]. Urochloa can solubilize P previously bound to Fe and Al oxides, or even to soil organic matter, through the exudation of organic anions [66]. Despite this, the availability of P and S-SO42− in the soil after fallow was similar to the availability of P and S-SO42− in the soil after the cultivation of ‘Marandu’ and pigeon pea. These responses may have two possible explanations: (i) some cover crops allowed greater P and S-SO42− uptake by soybean plants, reducing their concentrations in the soil [67]; (ii) P and S were absorbed by CC but not mineralized at a sufficient rate to increase their concentrations in the soil. The highest availability of S-SO42− in soil cultivated with ‘Marandu’ and pigeon pea can be attributed to its accumulation not only in the aboveground biomass but also in the belowground biomass due to the high capacity of these species’ roots to explore the soil and the mobility of S-SO42− in the soil profile [68].
Soil organic matter has a great influence on the solubility and availability of soil nutrients, including Fe [69] and Mn [70]. However, typically acidic soils, such as those in the Cerrado, normally have high Fe and Mn availability [71]. Therefore, despite the differences between CC there may be no limitation in the Fe and Mn concentrations for the plants, even though these micronutrients are required in greater quantities by soybeans [72]. Unlike Fe and Mn, there is a B deficiency in Brazilian Cerrado soils [73]. Therefore, the data from this study demonstrate the potential of cowpea and pigeon pea in supplying B to soybean. On the other hand, the B concentration in cowpea biomass helps to explain how this CC contributes to the increase in the soybean leaf B concentration. Although pigeon pea did not have a higher B concentration in the aboveground biomass, it appears that the lignin concentration delayed enzymatic degradation by microorganisms [74] and promoted later B mineralization, coinciding with the stage (physiological maturity) with a higher B uptake peak [72].
The time for which the CC remained in the plots differed according to the life cycle of each crop in the off-season, which allowed each crop to achieve different levels of biomass production, as well as a distinct C/N ratio between the CC. There is a consensus that high C/N ratios in CC residues negatively impact the N supply for the following crop [75,76]. Despite the absence of effects of the CC on the leaf N concentration, this does not necessarily mean that the soybean plants were not limited by N availability, especially when considering that the soybean protein yield differed between CC. This occurs because the remobilization of N from senescent tissue for seed filling depends mainly on the stalk, an important source of N in the crop, and defines the potential seed yield [77]. For this reason, it is important to minimize the N limitation in soybeans through the use of CC that can provide a higher protein yield. Such an approach would allow us to overcome a possible N limitation, since the N supply allows soybean plants to substantially increase the protein yield and seed yield [41,78].
The data indicate that increases in the soybean seed yield are related to the production of CC biomass in the off-season, as the maintenance of soil cover results in positive effects on soil quality [79]. In addition to the beneficial effects of cover crop residues on soil quality and nutrient cycling, cover crop residues can regulate the soil temperature and provide more favorable thermal conditions for the development of soybean plants, especially when considering crop development in a tropical region. Therefore, the results of this study provide data highlighting a range of species that can be used as alternatives to millet, allowing producers to diversify the use of cover crops during the dry winter and benefit during the harvest season.

5. Conclusions

Cover crop cultivation in the off-season improves soil fertility properties and soybean productivity in the subsequent harvest. Cover crop residues lead to improved soil biological quality by keeping the soil’s microbial biomass active. Legumes increase nitrogen storage in microbial biomass. ‘Marandu’, ‘Ruziziensis’, ‘Tanzania’, ‘Massai’, and cowpea increase the efficiency of carbon storage in microbial biomass in soybean cultivation systems. The cultivation of ‘Marandu’, ‘Ruziziensis’, cowpea, and pigeon pea increased the soil P availability. On the other hand, K cycling by cover crops improved the foliar K concentration in soybeans. Crotalaria juncea, cowpea, Massai, and Tanzania have potential as cover crops in the off-season and as alternatives to millet, as they provide highest seed and protein yields in soybeans in the Cerrado of Brazil.

Author Contributions

Conceptualization, R.B.d.A.N., R.M.C.M.d.A., M.B.F. and H.A.d.S.; methodology, H.A.F.d.A., J.O.L.d.O.J., E.S. and M.B.F.; validation, H.A.F.d.A.; formal analysis, H.A.F.d.A., E.S. and H.A.d.S.; investigation, H.A.F.d.A., D.C.d.S., C.P.d.M.C. and P.M.C.; resources, E.S. and J.O.L.d.O.J.; data curation, H.A.F.d.A., D.C.d.S., C.P.d.M.C. and P.M.C.; writing—original draft preparation, H.A.F.d.A.; writing—review and editing, E.S., R.M.C.M.d.A., M.J.B., N.C.L.M. and L.F.C.L.; visualization, H.A.F.d.A., E.S., M.J.B. and N.C.L.M.; supervision, H.A.d.S.; project administration, R.M.C.M.d.A., M.B.F., L.F.C.L. and H.A.d.S.; funding acquisition, R.B.d.A.N. and H.A.d.S. All authors have read and agreed to the published version of the manuscript.

Funding

This research was funded by the Brazilian Agricultural Research Corporation—Embrapa (grant number: 20.22.03.036.00.00) and the National Council for Scientific and Technological Development—CNPq (financial aid: 443153/2023-0; grant numbers: 313039/2023-2 and 200095/2024-2).

Data Availability Statement

The data generated or analyzed during this study are available from the corresponding author upon reasonable request.

Acknowledgments

We would like to thank the Coordination of Superior Level Staff Improvement (CAPES) for the scholarship provided to the first author. The authors would also like to thank Barbosa Farm for their support with the field research.

Conflicts of Interest

The authors declare no conflicts of interest.

References

  1. USDA. United States Department of Agriculture. World Agricultural Production. 2023. Available online: https://apps.fas.usda.gov/psdonline/circulars/production.pdf.ANO (accessed on 1 November 2024).
  2. Araújo, M.L.S.; Sano, E.E.; Bolfe, É.L.; Santos, J.R.N.; Santos, J.S.; Silva, F.B. Spatiotemporal dynamics of soybean crop in the Matopiba region, Brazil (1990–2015). Land Use Policy 2019, 80, 57–67. [Google Scholar] [CrossRef]
  3. Araújo, M.L.S.D.; Rufino, I.A.A.; Silva, F.B.; Brito, H.C.D.; Santos, J.R.N. The relationship between climate, agriculture and land cover in Matopiba, Brazil (1985–2020). Sustainability 2024, 16, 2670. [Google Scholar] [CrossRef]
  4. Reis, L.; Silva, C.M.S.E.; Bezerra, B.; Mutti, P.; Spyrides, M.H.; Silva, P.; Magalhães, T.; Ferreira, R.; Rodrigues, D.; Andrade, L. Influence of climate variability on soybean yield in Matopiba, Brazil. Atmosphere 2020, 11, 1130. [Google Scholar] [CrossRef]
  5. Pompeu, J. Legal deforestation can jeopardize plant diversity conservation in an agricultural frontier in the brazilian Cerrado: A spatial explicit contribution to Santana and Simon (2022). Biodivers. Conserv. 2022, 31, 2899–2903. [Google Scholar] [CrossRef]
  6. Nascente, A.S.; Stone, L.F. Cover crops as affecting soil chemical and physical properties and development of upland rice and soybean cultivated in rotation. Rice Sci. 2018, 25, 340–349. [Google Scholar] [CrossRef]
  7. Ghimire, R.; Ghimire, B.; Mesbah, A.O.; Sainju, U.M.; Idowu, O.J. Soil health response of cover crops in winter wheat–fallow system. Agron. J. 2019, 111, 2108–2115. [Google Scholar] [CrossRef]
  8. Jian, J.; Du, X.; Reiter, M.S.; Stewart, R.D. A meta-analysis of global cropland soil carbon changes due to cover cropping. Soil Biol. Biochem. 2020, 143, 107735. [Google Scholar] [CrossRef]
  9. Martínez-García, L.B.; Korthals, G.; Brussaard, L.; Jørgensen, H.B.; De Deyn, G.B. Organic management and cover crop species steer soil microbial community structure and functionality along with soil organic matter properties. Agric. Ecosyst. Environ. 2018, 263, 7–17. [Google Scholar] [CrossRef]
  10. Kim, N.; Zabaloy, M.C.; Guan, K.; Villamil, M.B. Do cover crops benefit soil microbiome? A meta-analysis of current research. Soil Biol. Biochem. 2020, 142, 107701. [Google Scholar] [CrossRef]
  11. Hallama, M.; Pekrun, C.; Lambers, H.; Kandeler, E. Hidden miners–the roles of cover crops and soil microorganisms in phosphorus cycling through agroecosystems. Plant Soil 2019, 434, 7–45. [Google Scholar] [CrossRef]
  12. Hallama, M.; Pekrun, C.; Pilz, S.; Jarosch, K.A.; Frąc, M.; Uksa, M.; Marhan, S.; Kandeler, E. Interactions between cover crops and soil microorganisms increase phosphorus availability in conservation agriculture. Plant Soil 2021, 463, 307–328. [Google Scholar] [CrossRef]
  13. Romdhane, S.; Spor, A.; Busset, H.; Falchetto, L.; Martin, J.; Bizouard, F.; Bru, D.; Breuil, M.; Philippot, L.; Cordeau, S. Cover crop management practices rather than composition of cover crop mixtures affect bacterial communities in no-till agroecosystems. Front. Microbiol. 2019, 10, 1618. [Google Scholar] [CrossRef] [PubMed]
  14. Balbinot Junior, A.A.; Debiasi, H.; Franchini, J.C.; Oliveira, M.A.; Coelho, A.E.; Moraes, M.T. Soybean yield, seed protein and oil concentration, and soil fertility affected by off-season crops. Eur. J. Agron. 2024, 153, 127039. [Google Scholar] [CrossRef]
  15. Krenchinski, F.H.; Cesco, V.J.S.; Rodrigues, D.M.; Albrecht, L.P.; Wobeto, K.S.; Albrecht, A.J.P. Agronomic performance of soybean grown in succession to winter cover crops. Pes. Agropec. Bras. 2018, 53, 909–917. [Google Scholar] [CrossRef]
  16. Theurl, M.C.; Lauk, C.; Kalt, G.; Mayer, A.; Kaltenegger, K.; Morais, T.G.; Teixeira, R.F.M.; Domingos, T.; Winiwarter, W.; Erb, K.; et al. Food systems in a zero-deforestation world: Dietary change is more important than intensification for climate targets in 2050. Sci. Total Environ. 2020, 735, 139353. [Google Scholar] [CrossRef]
  17. Castro, G.S.; Crusciol, C.A.; Calonego, J.C.; Rosolem, C.A. Management impacts on soil organic matter of tropical soils. Vadose Zone J. 2015, 14, vzj2014-07. [Google Scholar] [CrossRef]
  18. Silva, J.F.D.; Gontijo Neto, M.M.; Silva, G.F.D.; Borghi, E.; Calonego, J.C. Soil organic matter and aggregate stability in soybean, maize and Urochloa production systems in a very clayey soil of the brazilian Savanna. Agronomy 2022, 12, 1652. [Google Scholar] [CrossRef]
  19. Aparecido, L.E.O.; Meneses, K.C.; Lorençone, P.A.; Lorençone, J.A.; Moraes, J.R.D.S.C.D.; Rolim, G.S. Climate classification by Thornthwaite (1948) humidity index in future scenarios for Maranhão State, Brazil. Environ. Dev. Sustain. 2022, 25, 855–878. [Google Scholar] [CrossRef]
  20. Sousa, D.C.; Rosa, J.D.; Medeiros, J.C.; Boechat, C.L.; Nóbrega, R.S.A.; Souza, H.A.; Sagrilo, E. Microbial indicators of soil quality and soybean yield in agricultural production system using cover crops under no-tillage. Aust. J. Crop Sci. 2023, 17, 507–513. [Google Scholar] [CrossRef]
  21. Bublitz, L.R.; Gurgel, A.L.C.; Mauri, A.C.; Queiroz, V.C.; Lima, K.S.; Campelo, I.B.R.; Araújo, M.J.; Dias-Silva, T.P.; Barros, J.S.; Aguiar, I.O.M.; et al. Panicum maximum cultivars for use in integrated agricultural production systems in Cerrado biome soils. Grassland Sci. 2024, 70, 121–129. [Google Scholar] [CrossRef]
  22. Tanaka, K.S.; Crusciol, C.A.; Soratto, R.P.; Momesso, L.; Costa, C.H.; Franzluebbers, A.J.; Oliveira Júnior, A.; Calonego, J.C. Nutrients released by Urochloa cover crops prior to soybean. Nutr. Cycl. Agroecosyst. 2019, 113, 267–281. [Google Scholar] [CrossRef]
  23. Aiosa, M.L.; Neely, C.B.; Morgan, C.L.; Jessup, R.W.; Corriher-Olson, V.A.; Somenahally, A.C.; Norman, K.D.; Smith, G.R.; Rouquette Júnior, F.M. Cowpeas as a summer cover crop for forage rye. Agrosyst. Geosci. Environ. 2020, 3, e20057. [Google Scholar] [CrossRef]
  24. Rebonatti, M.D.; Cordeiro, C.F.S.; Volf, M.R.; Silva, P.C.G.; Tiritan, C.S. Effects of silage crops between crop seasons on soybean grain yield and soil fertility in tropical sandy soils. Eur. J. Agron. 2023, 143, 126685. [Google Scholar] [CrossRef]
  25. Atakoun, A.M.; Tovihoudji, P.G.; Diogo, R.V.; Yemadje, P.L.; Balarabe, O.; Akponikpè, P.I.; Sekloka, E.; Hougni, A.; Tittonell, P. Evaluation of cover crop contributions to conservation agriculture in northern Benin. Field Crops Res. 2023, 303, 109118. [Google Scholar] [CrossRef]
  26. Alvares, C.A.; Stape, J.L.; Sentelhas, P.C.; Gonçalves, J.D.M.; Sparovek, G. Köppen’s climate classification map for Brazil. Meteorol. Z. 2013, 22, 711–728. [Google Scholar] [CrossRef] [PubMed]
  27. Santos, H.G.; Jacomine, P.K.T.; Anjos, L.H.C.; Oliveira, V.A.; Lumbreras, J.F.; Coelho, M.R.; Almeida, J.A.; Araujo Filho, J.C.; Oliveira, J.B.; Cunha, T.J.F. Sistema Brasileiro de Classificação de Solos, 3rd ed.; Embrapa Solos: Brasília, Brazil, 2018; p. 356. [Google Scholar]
  28. USDA–NRCS. Keys to Soil Taxonomy, 12th ed.; USDA: Washington DC, USA, 2014; 142p. [Google Scholar]
  29. Teixeira, P.C.; Donagemma, G.K.; Fontana, A.; Teixeira, W.G. Manual de Métodos de Análise de Solo, 3rd ed.; Embrapa Cerrado: Brasília, Brazil, 2017; p. 574. [Google Scholar]
  30. Miyazawa, M.; Pavan, M.A.; Muraoka, T.; Carmo, C.A.F.S.; Melo, W.J. Análise química de tecido vegetal. In Manual de Análises Químicas de Solos, Plantas e Fertilizantes; Embrapa: Brasília, Brazil, 2009; pp. 191–234. [Google Scholar]
  31. Van Soest, P.J.; Robertison, J.B.; Lewis, B.A. Methods for dietary fiber, neutral detergent fiber and nonstarch polysaccharides in relation to animal nutrition. J. Dairy Sci. 1991, 74, 3583–3597. [Google Scholar] [CrossRef]
  32. Tedesco, M.; Gianello, G.; Bissani, C.; Bohnen, H.; Volkweiss, S. Análises de Solo, Plantas e Outros Materiais; Universidade Federal do Rio Grande do Sul: Rio Grande do Sul, Brazil, 1995; p. 174. [Google Scholar]
  33. Ferreira, A.S.; Camargo, F.A.O.; Vidor, C. Utilização de microondas na avaliação da biomassa microbiana do solo. Rev. Bras. Ciênc. Solo 1999, 23, 991–996. [Google Scholar] [CrossRef]
  34. Alef, K. Estimation of soil respiration. In Methods in Applied Soil Microbiology and Biochemistry; Alef, K., Nannipieri, P., Eds.; Academic Press: London, UK, 1995; pp. 464–467. [Google Scholar]
  35. Silva, E.E.; Azevedo, P.H.S.; De-Polli, H. Determinação do Carbono da Biomassa Microbiana do Solo (BMS-C); Embrapa Agrobiologia: Rio de Janeiro, Brazil, 2007; p. 6. [Google Scholar]
  36. Sparling, G.P. Ratio of microbial biomass carbon to soil organic carbon as a sensitive indicator of changes in soil organic matter. Aust. J. Soil Res. 1992, 30, 195–207. [Google Scholar] [CrossRef]
  37. Schnurer, J.; Rosswall, T. Fluorescein diacetate hydrolysis as a measure of total microbial activity in soil and litter. Appl Environ. Microb. 1982, 43, 1256–1261. [Google Scholar] [CrossRef]
  38. Chen, W.; Hoitink, H.A.J.; Madden, L.V. Microbial activity and biomass in container media for predicting suppressiveness to damping-off caused by Pythiumultimum. Phytopathology 1988, 78, 1447–1450. [Google Scholar] [CrossRef]
  39. Casida, L.E.J.; Klein, D.A.; Santoro, T. Soil dehydrogenase activity. Soil Sci. 1964, 98, 371–376. [Google Scholar] [CrossRef]
  40. Bitton, G.; Ben, K. Biochemical tests for toxicity screening. In Toxicity Testing Using Microorganisms; Bitton, G., Dutka, B.J., Eds.; CRC Press: Boca Raton, FL, USA, 1986; pp. 27–55. [Google Scholar]
  41. Silva, D.; Queiroz, A.C. Análise de Alimentos: Métodos Químicos e Biológicos; Universidade Federal de Viçosa: Viçosa, Brazil, 2006; p. 235. [Google Scholar]
  42. Cafaro La Menza, N.; Monzón, J.P.; Specht, J.E.; Grassini, P. Is soybean yield limited by nitrogen supply? Field Crop Res. 2017, 213, 204–212. [Google Scholar] [CrossRef]
  43. Di Rienzo, J.A.; Casanoves, F.; Balzarini, M.; González, L.; Tablada, M.; Robledo, C.W. InfoStat; Universidad Nacional de Córdoba: Córdoba, Argentina, 2020. [Google Scholar]
  44. R Core Team. R: A Language and Environment for Statistical Computing; R Foundation for Statistical Computing: Vienna, Austria, 2019; Available online: https://www.R-project.org/ (accessed on 3 February 2023).
  45. Steinauer, K.; Tilman, D.; Wragg, P.D.; Cesarz, S.; Cowles, J.M.; Pritsch, K.; Reich, P.B.; Weisser, W.W.; Eisenhauer, N. Plant diversity effects on soil microbial functions and enzymes are stronger than warming in a grassland experiment. Ecology 2015, 96, 99–112. [Google Scholar] [CrossRef] [PubMed]
  46. Zhou, Y.; Zhu, H.; Fu, S.; Yao, Q. Variation in soil microbial community structure associated with different legume species is greater than that associated with different grass species. Front. Microbiol. 2017, 8, 1007. [Google Scholar] [CrossRef]
  47. Liu, Q.; Zhao, Y.; Li, T.; Chen, L.; Chen, Y.; Sui, P. Changes in soil microbial biomass, diversity, and activity with crop rotation in cropping systems: A global synthesis. Appl. Soil Ecol. 2023, 186, 104815. [Google Scholar] [CrossRef]
  48. Ball, K.R.; Baldock, J.A.; Pendolf, C.; Power, S.A.; Woodin, S.J.; Smith, P.; Pendall, E. Soil organic carbon and nitrogen pools are increased by mixed grass and legume cover crops in vineyard agroecosystems: Detecting short-term management effects using infrared spectroscopy. Geoderma 2020, 379, 114619. [Google Scholar] [CrossRef]
  49. Wittwer, R.A.; Dorn, B.; Jossi, W.; Heijden, M.G.V.D. Cover crops support ecological intensification of arable cropping systems. Sci. Rep. 2017, 7, 41911. [Google Scholar] [CrossRef]
  50. Sievers, T.; Cook, R.L. Aboveground and root decomposition of cereal rye and hairy vetch cover crops. Soil Sci. Soc. Am. J. 2018, 82, 147–155. [Google Scholar] [CrossRef]
  51. Adhikari, A.D.; Shrestha, P.; Ghimire, R.; Liu, Z.; Pollock, D.A.; Acharya, P.; Aryal, D.R. Cover crop residue quality regulates litter decomposition dynamics and soil carbon mineralization kinetics in semi-arid cropping systems. Appl. Soil. Ecol. 2024, 193, 105160. [Google Scholar] [CrossRef]
  52. Duval, M.E.; Galantini, J.A.; Capurro, J.E.; Martinez, J.M. Winter cover crops in soybean monoculture: Effects on soil organic carbon and its fractions. Soil Tillage Res. 2016, 161, 95–105. [Google Scholar] [CrossRef]
  53. Marschner, P.; Hatam, Z.; Cavagnaro, T.R. Soil respiration, microbial biomass and nutrient availability after the second amendment are influenced by legacy effects of prior residue addition. Soil Biol. Biochem. 2015, 88, 169–177. [Google Scholar] [CrossRef]
  54. Mazzuchelli, R.C.L.; Araujo, A.S.F.; Moro, E.; Araujo, F.F. Changes in soil properties and crop yield as a function of early desiccation of pastures. J. Soil Sci. Plant Nutr. 2020, 20, 840–848. [Google Scholar] [CrossRef]
  55. Nguyen, T.T.; Cavagnaro, T.R.; Ngo, H.T.T.; Marschner, P. Soil respiration, microbial biomass and nutrient availability in soil amended with high and low C/N residue–Influence of interval between residue additions. Soil Biol. Biochem. 2016, 95, 189–197. [Google Scholar] [CrossRef]
  56. Spohn, M. Microbial respiration per unit microbial biomass depends on litter layer carbon-to-nitrogen ratio. Biogeosciences 2015, 12, 817–823. [Google Scholar] [CrossRef]
  57. Mooshammer, M.; Wanek, W.; Hämmerle, I.; Fuchslueger, L.; Hofhansl, F.; Knoltsch, A.; Schnecker, J.; Takriti, M.; Watzka, M.; Wild, B.; et al. Adjustment of microbial nitrogen use efficiency to carbon: Nitrogen imbalances regulates soil nitrogen cycling. Nat. Commun. 2014, 5, 3694. [Google Scholar] [CrossRef]
  58. Novak, E.; Carvalho, L.A.; Santiago, E.F.; Portilho, I.I.R. Chemical and microbiological attributes under different soil cover. Cerne 2017, 23, 19–30. [Google Scholar] [CrossRef]
  59. Balota, E.L.; Calegari, A.; Nakatani, A.S.; Coyne, M.S. Benefits of winter cover crops and no-tillage for microbial parameters in a Brazilian Oxisol: A long-term study. Agric. Ecosyst. Environ. 2014, 197, 31–40. [Google Scholar] [CrossRef]
  60. Segatelli, C.R.; Câmara, G.M.D.S.; Aguila, L.S.H.D.; Aguila, J.S.D.; Francisco, E.A.B.; Piedade, S.M.S. Soybean yield under no-tillage system with an early Eleusine coracana fertilization. Rev. Caatinga 2022, 35, 308–319. [Google Scholar] [CrossRef]
  61. Mubvumba, P.; Tyler, H.L. Evaluation of single and mixed cover crops species in a sandy loam soil under corn production. Agron. J. 2024, 116, 1655–1669. [Google Scholar] [CrossRef]
  62. Baptistella, J.L.C.; Andrade, S.A.L.; Favarin, J.L.; Mazzafera, P. Urochloa in tropical agroecosystems. Front. Sust. Food Syst. 2020, 4, 119. [Google Scholar] [CrossRef]
  63. Costa, N.R.; Andreotti, M.; Crusciol, C.A.C.; Pariz, C.M.; Bossolani, J.W.; Pascoaloto, I.M.; Calonego, J.C. Soybean yield and nutrition after tropical forage grasses. Nutr. Cycl. Agroecosyst. 2021, 121, 31–49. [Google Scholar] [CrossRef]
  64. Crusciol, C.A.; Nascente, A.S.; Borghi, E.; Soratto, R.P.; Martins, P.O. Improving soil fertility and crop yield in a tropical region with palisadegrass cover crops. Agron. J. 2015, 107, 2271–2280. [Google Scholar] [CrossRef]
  65. Romanuik, R.I.; Beltran, M.J.; Brutti, L.; Constantini, A.O.; Bacigaluppo, S.; Sainz Rozas, H.; Salvagiotti, F. Soil organic carbon, macro- and micronutrient changes in soil fractions with different lability in response to crop intensification. Soil Tillage Res. 2018, 181, 136–143. [Google Scholar] [CrossRef]
  66. Almeida, D.S.; Delai, L.B.; Sawaya, A.C.H.F.; Rosolem, C.A. Exudation of organic acid anions by tropical grasses in response to low phosphorus availability. Sci. Rep. 2020, 10, 16955. [Google Scholar] [CrossRef] [PubMed]
  67. Wei, X.; Hao, M.; Shao, M.; Gale, W.J. Changes in soil properties and the availability of soil micronutrients after 18 years of cropping and fertilization. Soil Tillage Res. 2006, 91, 120–130. [Google Scholar] [CrossRef]
  68. Cordeiro, C.F.S.; Echer, F.R.; Araujo, F.F. Cover crops impact crops yields by improving microbiological activity and fertility in sandy soil. J. Soil Sci. Plant Nutr. 2021, 21, 1968–1977. [Google Scholar] [CrossRef]
  69. Colombo, C.; Iorio, E.; Liu, Q.; Jiang, Z.; Barrón, B. Iron oxide nonanoparticles in soils: Environmental and agronomical importance. J. Nanisci. Nanotechnol. 2017, 17, 4449–4460. [Google Scholar] [CrossRef]
  70. Beltrán, M.; Galantini, J.A.; Salvagiotti, F.; Tognetti, P.; Bacigaluppo, S.; Sainz Rozas, H.R.; Barraco, M.; Barbieri, P.A. Do soil carbon sequestration and soil fertility increase by including a gramineous cover crop in continuous soybean? Soil Sci. Soc. Am. J. 2021, 85, 1380–1394. [Google Scholar] [CrossRef]
  71. Lopes, A.S.; Cox, F.R. A Survey of the Fertility Status of Surface Soils Under “Cerrado” Vegetation in Brazil. Soil Sci. Soc. Am. J. 1977, 41, 742–747. [Google Scholar] [CrossRef]
  72. Pires, M.F.M.; Souza, H.A.; Medeiros, J.C.; Dalla Rosa, J.; Martins, R.V.S.; Sobral, A.H.S.; Carvalho, S.P.; Vera, G.S.; Vieira, P.F.M.J.; Sagrilo, E. Nutrient uptake by soybean plants in succession of cover crops in northeast of Brazil. Commun. Soil Sci. Plant Anal. 2023, 54, 945–963. [Google Scholar] [CrossRef]
  73. Rodrigues, L.U.; Silva, R.R. Boron availability in building up fertility in Cerrado soil of Tocantins. Commun. Soil Sci. Plant Anal. 2020, 51, 595–603. [Google Scholar] [CrossRef]
  74. Silva, L.S.; Laroca, J.V.S.; Coelho, A.P.; Gonçalves, E.C.; Gomes, R.P.; Pacheco, L.P.; Carvalho, P.C.F.; Pires, G.C.; Oliveira, R.L.; Souza, J.M.A.; et al. Does grass-legume intercropping change soil quality and grain yield in integrated crop-livestock systems? Appl. Soil Ecol. 2022, 170, 104257. [Google Scholar] [CrossRef]
  75. Finney, D.M.; White, C.M.; Kaye, J.P. Biomass production and carbon/nitrogen ratio influence ecosystem services from cover crop mixtures. Agron. J. 2016, 108, 39–52. [Google Scholar] [CrossRef]
  76. Lewis, K.L.; Burke, J.A.; Keeling, W.S.; McCallister, D.M.; DeLaune, P.B.; Keeling, J.W. Soil benefits and yield limitations of cover crop use in Texas High Plains cotton. Agron. J. 2018, 110, 1616–1623. [Google Scholar] [CrossRef]
  77. Sinclair, T.R.; Farias, J.R.; Neumaier, N.; Nepomuceno, A.L. Modeling nitrogen accumulation and use by soybean. Field Crop Res. 2003, 81, 149–158. [Google Scholar] [CrossRef]
  78. Cafaro La Menza, N.; Monzón, J.P.; Specht, J.E.; Lindquist, J.L.; Arkebauer, T.J.; Gref, G.; Grassini, P. Nitrogen limitation in high-yield soybean: Seed yield, N accumulation, and N-use efficiency. Field Crop Res. 2019, 237, 74–81. [Google Scholar] [CrossRef]
  79. Kirkpatrick, D.; Roberts, T.L.; Brye, K.; Ross, J. Influence of cover crops on soybean yield and partial returns as an alternative to double-crop soybean in Arkansas. Agron. J. 2023, 115, 1373–1383. [Google Scholar] [CrossRef]
Figure 1. Location of the experimental area. Maranhão, MATOPIBA, Brazil. 2021/22.
Agronomy 15 01083 g001
Figure 2. Rainfall and temperature data from the experimental area during the test period. Maranhão, Brazil. 2021/22.
Agronomy 15 01083 g002
Figure 3. Total yield (a), crude protein and oil concentration (b), and crude protein and oil yields (c) of soybean seeds after the cultivation of cover crops. Note: Values represent means ± standard deviations. Means followed by the same letters in the column belong to the same group according to the Scott–Knott test (p > 0.05).
Agronomy 15 01083 g003
Figure 4. Biplot of relationships between soil parameters, determination of nutritional status, quality of CC, and yields of soybean and different cover crop/soybean sequences for the first two principal components (PC1 and PC2).
Agronomy 15 01083 g004
Table 1. Chemical attributes and particle sizes of the soil before the cover crop/soybean sequence.
pH (H2O)TOCPK+Ca2+Mg2+S-SO42−Al3+CEC
g kg−1mg dm−3cmolc dm−3 mg dm−3cmolc dm−3
5.3515850.040.970.445.730.104.66
BSCuFeMnZnBsandsiltclay
%mg dm−3 g kg−1
310.09640.332.90.2077492134
Legend: pH, hydrogen potential; TOC, total organic carbon; P, phosphorus; K+, potassium; Ca2+, calcium; Mg2+, magnesium; S-SO42−, sulfur; Al+3, aluminum; CEC, cation exchange capacity; BS, base saturation; Cu, copper; Fe, iron; Mn, manganese; Zn; zinc; B, boron.
Table 2. Productivity (dry biomass) and nutrient concentrations of the cover crops used in the experiment.
Cover CropBiomassNPKCaMgS
kg ha−1g kg−1
Fallow1515 ± 247 c41 ± 2 a3.8 ± 0.2 a15 ± 0 b7.1 ± 0.7 b5.1 ± 0.5 b1.7 ± 0.2 b
Millet2027 ± 456 b12 ± 1 d2.4 ± 0.4 b13 ± 1 b5.0 ± 1.1 c3.6 ± 0.4 c1.1 ± 0.4 b
Marandu2100 ± 361 b15 ± 3 d2.7 ± 0.4 b26 ± 2 a3.6 ± 0.4 c4.5 ± 1.4 b1.3 ± 0.3 b
Ruziziensis1813 ± 280 b14 ± 3 d2.6 ± 0.6 b28 ± 0 a4.6 ± 1.4 c4.0 ± 0.8 c2.4 ± 0.8 a
Tanzania1980 ± 275 b13 ± 1 d1.1 ± 0.5 c25 ± 2 a5.0 ± 0 c2.8 ± 0.9 c1.0 ± 0.2 b
Massai3093 ± 193 a10 ± 1 d1.4 ± 0.7 c25 ± 4 a3.7 ± 0.5 c2.6 ± 0.3 c1.3 ± 0.2 b
Cowpea728 ± 271 c32 ± 4 b4.3 ± 0.5 a27 ± 3 a12.1 ± 1.4 a6.9 ± 0.3 a2.3 ± 0.2 a
Pigeon pea1480 ± 175 c20 ± 3 c4.3 ± 0.1 a17 ± 1 b5.3 ± 0.3 c2.8 ± 0.3 c2.2 ± 0.4 a
C. juncea1068 ± 412 c20 ± 1 c3.6 ± 0.1 a16 ± 4 b4.6 ± 0.7 c3.4 ± 0.7 c1.3 ± 0.3 b
F test**************
CV (%)16.813.215.711.113.417.723.7
Cover CropCuFeZnMnBLignin/NC/N
mg kg−1
Fallow9 ± 3 b326 ± 24 a42 ± 8 a14 ± 1 b18 ± 2 b0.8 ± 0.1 c10 ± 1 d
Millet12 ± 2 b213 ± 25 b46 ± 1 a25 ± 1 b13 ± 4 b5.6 ± 1.2 a35 ± 3 a
Marandu14 ± 4 b178 ± 4 c22 ± 3 c31 ± 12 a11 ± 1 b3.2 ± 1.2 b27 ± 6 b
Ruziziensis17 ± 5 a209 ± 36 b25 ± 1 b36 ± 13 a14 ± 3 b2.8 ± 0.1 b31 ± 6 b
Tanzania14 ± 1 b193 ± 1 c18 ± 3 c21 ± 5 b7 ± 1 c3.1 ± 0.4 b30 ± 4 b
Massai14 ± 1 b81 ± 4 d16 ± 1 c48 ± 16 a5 ± 3 c6.6 ± 1.4 a40 ± 2 a
Cowpea19 ± 1 a218 ± 20 b47 ± 8 a34 ± 7 a27 ± 4 a1.5 ± 0.2 c11 ± 2 d
Pigeon pea20 ± 3 a72 ± 17 d31 ± 6 b14 ± 1 b14 ± 4 b7.6 ± 1.3 a23 ± 4 c
C. juncea19 ± 3 a54 ± 6 d28 ± 8 b20 ± 6 b11 ± 2 b4.3 ± 1.2 b21 ± 1 c
F test**************
CV (%)18.39.717.925.120.622.114.4
Legend: **, significant at 1% (p < 0.01), respectively. Means ± standard deviations followed by the same letters in the column belong to the same group according to the Scott–Knott test (p > 0.05). N, nitrogen; P, phosphorus; K, potassium; Ca, calcium; Mg, magnesium; S, sulfur; Cu, copper; Fe, iron; Zn, zinc; Mn, manganese; B, boron; Lignin/N, ratio between lignin and nitrogen; C/N, ratio between carbon and nitrogen.
Table 3. Biological attributes of the soil after the cover crop/soybean sequence.
Cover Crop TOCMBCMBNBSRqCO2qMicDHAFDA
g kg−1mg kg−1 mg C-CO2 kg−1 d−1mg C-CO2 kg−1 MBC d−1%µl de H g−1µg FDA g−1
Fallow18 ± 0.7 b105 + 7 b0.23 + 0 c25.7 + 6.0 b0.21 + 0.02 b0.57 + 0.03 b4.3 + 0.1 b20.1 + 2.3
Millet16 ± 2.4 b84 + 6 b0.98 + 0.1 b23.6 + 3.8 b0.32 + 0.02 a0.52 + 0.06 b4.5 + 1.3 b32.7 + 0.9
Marandu20 ± 1.1 a123 + 12 a0.80 + 0.2 b28.4 + 5.0 a0.25 + 0.05 b0.63 + 0.10 a5.7 + 0.6 a26.6 + 0.8
Ruziziensis19 ± 0.4 a139 + 19 a0.72 + 0.2 b29.6 + 1.0 a0.22 + 0.02 b0.72 + 0.06 a3.9 + 0.7 b26.4 + 4.0
Tanzania21 ± 1.0 a140 + 9 a0.73 + 0.1 b24.1 + 1.5 b0.20 + 0.03 b0.68 + 0.02 a4.3 + 1.2 b24.9 + 1.1
Massai17 ± 2.9 b100 + 14 b0.59 + 0.1 b33.1 + 2.0 a0.29 + 0.07 a0.69 + 0.04 a3.7 + 0.9 b26.0 + 3.2
Cowpea21 ± 0.6 a115 + 20 a1.34 + 0.2 a23.5 + 0.4 b0.21 + 0.03 b0.66 + 0.04 a6.4 + 0.2 a26.9 + 4.0
Pigeon pea22 ± 1.3 a98 + 6 b2.13 + 0.3 a25.9 + 3.1 b0.24 + 0.01 b0.45 + 0.03 b4.0 + 0.1 b29.8 + 1.4
Crotalaria juncea20 ± 0.1 a99 + 7 b1.76 + 0.3 a25.3 + 0.1 b0.25 + 0.01 b0.48 + 0.03 b2.5 + 0.2 b28.1 + 1.5
F test**************ns
CV (%)7.413.319.410.613.510.117.78.9
Legend: ns and **, non-significant and significant at 1% (p < 0.01), respectively. Means ± standard deviations followed by the same letters in the column belong to the same group according to the Scott–Knott test (p > 0.05). TOC, total organic carbon; MBN, microbial biomass nitrogen; MBC, microbial biomass carbon; BSR, soil basal respiration; qCO2, metabolic quotient; qMic, microbial quotient; DHA, dehydrogenase activity; FDA, fluorescein diacetate hydrolysis.
Table 4. Chemical attributes of the soil after the cover crop/soybean sequence.
Cover CroppH (H2O)PK+Ca2+Mg2+S-SO42−
mg dm−3------------ cmolc dm−3 ------------mg dm−3
Fallow5.35 ± 0.354 ± 13 a0.10 ± 0.00 b0.86 ± 0.01 d0.49 ± 0.05 b4.88 ± 1.3 a
Millet5.17 ± 0.247 ± 1 b0.09 ± 0.00 b0.84 ± 0.12 d0.44 ± 0.09 b3.15 ± 0.7 b
Marandu5.20 ± 0.261 ± 9 a0.11 ± 0.02 a1.00 ± 0.00 c0.49 ± 0.02 b5.79 ± 0.3 a
Ruziziensis5.35 ± 0.165 ± 7 a0.09 ± 0.01 b1.08 ± 0.02 c0.50 ± 0.05 b4.09 ± 0.9 b
Tanzania5.31 ± 0.139 ± 5 b0.09 ± 0.00 b1.10 ± 0.02 c0.50 ± 0.04 b3.77 ± 0.7 b
Massai5.27 ± 0.340 ± 5 b0.11 ± 0.00 a0.83 ± 0.01 d0.54 ± 0.15 b2.65 ± 0.9 b
Cowpea5.33 ± 0.154 ± 3 a0.11 ± 0.01 a1.42 ± 0.28 b0.68 ± 0.13 a3.87 ± 0.3 b
Pigeon pea5.28 ± 0.364 ± 8 a0.09 ± 0.01 b1.80 ± 0.02 a0.71 ± 0.06 a5.06 ± 0.6 a
Crotalaria juncea5.26 ± 0.148 ± 2 b0.11 ± 0.01 a1.04 ± 0.05 c0.57 ± 0.08 b4.07 ± 0.2 b
F testns**********
CV (%)3.513.18.09.014.516.3
Cover CropCuFeMnZnBCEC
mg dm−3 cmolc dm−3
Fallow0.11 ± 0.02 b36 ± 30.52 ± 0.030.70 ± 0.29 b0.19 ± 0.015.38 ± 0.4
Millet0.12 ± 0.01 b46 ± 10.51 ± 0.101.61 ± 0.42 a0.18 ± 0.025.06 ± 0.5
Marandu0.12 ± 0.03 b47 ± 140.62 ± 0.211.39 ± 0.31 a0.19 ± 0.024.99 ± 0.4
Ruziziensis0.11 ± 0.00 b45 ± 70.66 ± 0.041.21 ± 0.51 a0.20 ± 0.015.13 ± 0.0
Tanzania0.11 ± 0.02 b35 ± 110.49 ± 0.091.18 ± 0.36 a0.17 ± 0.035.20 ± 0.6
Massai0.10 ± 0.03 b46 ± 30.56 ± 0.020.85 ± 0.48 b0.18 ± 0.034.99 ± 0.7
Cowpea0.10 ± 0.01 b38 ± 10.68 ± 0.031.46 ± 0.12 a0.18 ± 0.015.81 ± 0.5
Pigeon pea0.17 ± 0.05 a42 ± 90.62 ± 0.210.92 ± 0.21 b0.18 ± 0.036.11 ± 0.3
Crotalaria juncea0.11 ± 0.02 b47 ± 130.46 ± 0.170.57 ± 0.20 b0.14 ± 0.025.26 ± 0.4
F test*nsns**nsns
CV (%)18.219.616.723.811.88.0
Legend: ns, * and **, non-significant and significant at 5% (p < 0.05) and 1% (p < 0.01), respectively. Means ± standard deviations followed by the same letters in the column belong to the same group according to the Scott–Knott test (p > 0.05). pH, hydrogen potential; P, phosphorus; K+, potassium; Ca2+, calcium; Mg2+, magnesium; S-SO42−, sulfur; Cu, copper; Fe, iron; Mn, manganese; Zn, zinc; B, boron; CEC, cation exchange capacity.
Table 5. Nutritional status of soybeans after the cover crop/soybean sequence.
Cover Crop NPKCaMgSCuFeMnZnB
-------------------g kg−1 ---------------------------------mg kg−1 --------------
Fallow49.8 ± 0.04.2 ± 0.322.7 ± 0.8 b6.2 ± 0.34.3 ± 0.23.3 ± 0.19 ± 0.684 ± 5 b86 ± 19 a121 ± 3375 ± 0 b
Millet49.7 ± 1.44.0 ± 0.320.7 ± 0.3 b5.7 ± 0.74.3 ± 0.13.2 ± 0.010 ± 1.782 ± 7 b69 ± 1 b84 ± 274 ± 6 b
Marandu50.3 ± 1.74.4 ± 0.224.9 ± 1.8 a6.1 ± 0.04.2 ± 0.23.9 ± 0.910 ± 2.690 ± 6 a109 ± 1 a111 ± 3865 ± 1 b
Ruziziensis50.6 ± 1.44.7 ± 0.424.5 ± 1.0 a5.8 ± 0.94.3 ± 0.13.6 ± 0.79 ± 1.690 ± 6 a88 ± 38 a131 ± 2376 ± 9 b
Tanzania49.8 ± 0.74.7 ± 0.124.3 ± 1.7 a5.7 ± 0.94.3 ± 0.23.1 ± 0.18 ± 1.292 ± 6 a52 ± 3 b74 ± 470 ± 9 b
Massai50.4 ± 2.44.8 ± 0.623.6 ± 0.1 a5.2 ± 0.84.2 ± 0.23.6 ± 0.110 ± 0.982 ± 5 b56 ± 1 b89 ± 2373 ± 8 b
Cowpea51.3 ± 0.94.8 ± 0.824.0 ± 0.5 a5.5 ± 0.04.1 ± 0.63.2 ± 0.312 ± 0.287 ± 5 a101 ± 4 a114 ± 2890 ± 0 a
Pigeon pea48.7 ± 1.34.5 ± 0.525.4 ± 3.0 a5.7 ± 0.34.6 ± 0.43.2 ± 0.611 ± 1.478 ± 1 b90 ± 32 a109 ± 1280 ± 1 a
Crotalaria juncea50.4 ± 0.14.8 ± 0.324.3 ± 1.5 a5.5 ± 0.74.3 ± 0.23.6 ± 0.210 ± 1.687 ± 8 a75 ± 25 b98 ± 2569 ± 0 b
F testnsns**nsnsnsns***ns**
CV (%)2.57.65.47.96.213.413.65.619.620.77.3
Legend: ns, * and **, non-significant and significant at 5% (p < 0.05) and at 1% (p < 0.01), respectively. Means ± standard deviations followed by the same letters in the column belong to the same group according to the Scott–Knott test (p > 0.05). N, nitrogen; P, phosphorus; K, potassium; Ca, calcium; Mg, magnesium; S, sulfur; Cu, copper; Fe, iron; Mn, manganese; Zn, zinc; B, boron.
Disclaimer/Publisher’s Note: The statements, opinions and data contained in all publications are solely those of the individual author(s) and contributor(s) and not of MDPI and/or the editor(s). MDPI and/or the editor(s) disclaim responsibility for any injury to people or property resulting from any ideas, methods, instructions or products referred to in the content.

