Article

Design and Performance Evaluation of a Multi-Fluid Swirling Mixing Atomizer for Efficient Generation of Ozonated Droplets in Agricultural Applications

1
School of Agricultural Engineering, Jiangsu University, Zhenjiang 212013, China
2
Key Laboratory for Theory and Technology of Intelligent Agricultural Machinery and Equipment of Jiangsu University, Jiangsu University, Zhenjiang 212013, China
3
Jiangsu Province and Education Ministry Co-Sponsored Synergistic Innovation Center of Modern Agricultural Equipment, Jiangsu University, Zhenjiang 212013, China
4
School of the Environment and Safety Engineering, Jiangsu University, Zhenjiang 212013, China
*
Authors to whom correspondence should be addressed.
Agronomy 2025, 15(5), 1082; https://doi.org/10.3390/agronomy15051082
Submission received: 26 February 2025 / Revised: 17 April 2025 / Accepted: 28 April 2025 / Published: 29 April 2025

Abstract

:
With the widespread application of ozone technology in agricultural plant protection, developing an ozonated water atomizer that integrates efficient mixing and precise spraying has been recognized as a significant challenge. Swirling flow is considered a method to enhance hydrodynamics and mass transfer in gas–liquid mixing. This study innovatively combines an axial nozzle with a swirling mixing chamber, utilizing the negative pressure generated by the high-speed central airflow at the nozzle throat as the driving force for swirling mixing and initial atomization, completing mass transfer and preliminary atomization before the formation of the mist, thereby improving gas–liquid contact and mass transfer efficiency. Through numerical simulations, the impact of geometric parameters at key locations on the internal flow of the atomizer was analyzed. The optimized inlet diameter of the atomizer was found to be 9 mm, with a throat length of 3 mm and a self-priming hole diameter of 1.5 mm. Experimental results on droplet size and ozone droplet concentration verified that at the optimal spraying pressure of 0.6 MPa, a concentration of up to 3.73 mg·L−1 with an average droplet size of 102 µm, evenly distributed, could be generated at a distance of 40 cm from the target. This work provides a technological framework for advancing precision ozone-based plant protection, aligning with global efforts to reduce agrochemical footprints through innovative application systems. It offers theoretical guidance and data support for the development and design of high-efficiency ozone atomizers in agricultural applications, aiming to minimize the use of agricultural chemicals and promote the growth of green plant protection technologies.

1. Introduction

In recent years, China’s continuous emphasis on and support for alternative technologies to fertilizers and pesticides have led to a gradual decline in their usage [1]. Ozonated water (OW) spraying technology, known for its environmentally friendly characteristics, has emerged as a significant alternative to agricultural chemicals, playing a crucial role [2]. This has sparked widespread discussion among researchers regarding the reduction in fertilizers and pesticides while maintaining efficiency. Studies indicate that optimizing the design of atomizers allows OW to be applied to plant surfaces in appropriate concentrations and more uniform, finer states. This efficiently inactivates various pathogenic microorganisms, including bacteria, fungi, and viruses, thereby reducing reliance on chemical pesticides. For instance, Ebihara et al. [2] reported a 3-log reduction in Xanthomonas pathogens on crop surfaces using OW at 1.5mg·L−1. Similarly, Tanuwidjaja demonstrated that ozonated water (2.5 mg·L−1) reduced E. coli and Fusarium spp. populations by 99.8% and 94.6%, respectively, within 5 min of exposure [2,3]. Furthermore, the application of OW spray can significantly improve the microbial environment, enhance photosynthesis, stimulate the production of plant growth hormones, and increase nutrient absorption efficiency, ultimately promoting the growth of roots, stems, and leaves [4]. Currently, most OW spraying equipment operates on a “synthesize first, spray later” model, where OW is produced by synthesis devices and subsequently applied to crop surfaces through spraying systems for purposes such as sterilization or fertilization [5]. However, OW is characterized by low stability and rapid decomposition [6]. As a result, the concentration of OW synthesized and transported to the target crops via the spraying system significantly diminishes, adversely affecting its efficacy in the field [7]. To address this issue, a multi-fluid mixing atomizer is designed to integrate gas–liquid mixing and atomization. This innovative device aims to improve droplet size and spray uniformity, increase the concentration of OW during application, and enhance the integration of OW spraying equipment, thereby strengthening its effectiveness in field operations. This work directly contributes to the global effort to reduce synthetic pesticide dependency by optimizing OW spraying technology, a key pillar of sustainable agriculture. By enhancing atomization efficiency and ozone concentration in droplets, the proposed design supports the Special Issue’s focus on precision application and agrochemical minimization.
Conventional OW spraying systems (e.g., hydraulic nozzles and static mixers) face limitations such as rapid ozone decomposition during transport (40–60% loss within 10 min) and non-uniform droplet distribution (CV > 25%). These shortcomings reduce field efficacy and necessitate frequent reapplication. In contrast, the proposed atomizer integrates in situ gas–liquid mixing and swirl-enhanced atomization, minimizing ozone degradation (<15% loss at 0.6 MPa) while achieving uniform droplets, thereby addressing stability and precision challenges. Multi-fluid mixing atomization involves the interaction of various fluids (typically liquids and gases) during the atomization process. In this process, a pressure gradient generated by high-speed airflow at the throat of the atomizer facilitates the smooth intake of OW through the self-aspirating hole into the axial nozzle. As the OW passes through the self-aspirating hole, it is fragmented into small liquid columns and sheets. These small liquid forms are further divided into numerous fine droplets by the action of high-speed airflow within the nozzle, achieving optimal mixing and atomization effects [8]. Currently, this atomization technology has garnered significant attention from scholars worldwide due to its advantages of uniformity, strong controllability, and high atomization efficiency. It is widely applied in agricultural plant protection [9], food and pharmaceutical coatings [10], and chemical fuel combustion [11].
In terms of atomizer design and performance evaluation, Wang et al. [12] developed a novel three-phase atomizing nozzle for gas–liquid flows and studied the atomization fragmentation process under different pressure conditions. An orthogonal response experiment was conducted to further optimize the geometric parameters of the nozzle. The results indicated that optimal atomization was achieved under conditions of 0.3 MPa gas pressure, 3.4 m·s−1 wind speed, a nozzle height of 0.5 m, and a spray angle of 60°. Zhang et al. [13] investigated the droplet size distribution generated by dual-fluid atomization, employing a Bettersize 2000S particle size analyzer to test droplet size distribution at various pressures. The results showed that dual-fluid atomization can achieve a primary atomization effect with droplet sizes below 200 μm at low pressures. When liquid pressure decreases at a constant gas pressure, droplet sizes gradually increase, while droplet sizes decrease as gas pressure rises with constant liquid pressure. Yao et al. [14] developed a swirling atomizer and examined the effects of geometric parameters on spraying characteristics, such as orifice area ratio, orifice shape, and porous ring diameter. Experiments indicated that a circular nozzle with an orifice area ratio of 0.429 and a porous fiber ring with a porosity of 25 µm could achieve superior spraying performance. In the realm of computational fluid dynamics (CFD), the choice of turbulence model is crucial for simulating multiphase fluid flow, spraying processes, and convective heat and mass transfer [15]. The RNG k-ε model is widely regarded as a superior choice for simulating complex flows, including jet impacts, secondary flows, and swirling flows [16]. In the CFD module, multiphase flow models include the VOF (Volume of Fluid) model, Eulerian model, and Mixture model [17]. The VOF model is suitable for simulating free surface flows, flows with a large number of gas bubbles in liquids, and dam break scenarios; it uses fluid volume fractions to describe the distribution of phases within a unit [18]. Based on these modeling studies, numerous practical investigations have been conducted by scholars. Wilson et al. [19] conducted three types of gas–liquid flow experiments and CFD simulations, showing that reducing water flow and increasing airflow leads to smaller droplet sizes. CFD simulations revealed that the aspect ratio and divergence angle of the atomizer throat have minimal effects on droplet diameter distribution. Wu et al. [20] designed an air atomization nozzle and employed Ansys 2022 CFD software for transient numerical simulations of the internal flow of the nozzle, yielding results that more accurately reflect the actual conditions within the nozzle.
This paper presents a detailed description of the design concept and scheme for a multi-fluid swirling mixing atomizer aimed at efficiently generating ozonated droplets. Simulation calculations were employed to analyze the impact of structural dimensions of key components—specifically the inlet inner diameter, self-priming hole diameter, and throat length—on atomization performance and self-priming efficiency. A comprehensive evaluation of the designed atomizer’s performance was conducted by combining droplet size experiments with ozonated droplet concentration tests, thereby providing data support for its application in agricultural production.

2. Materials and Methods

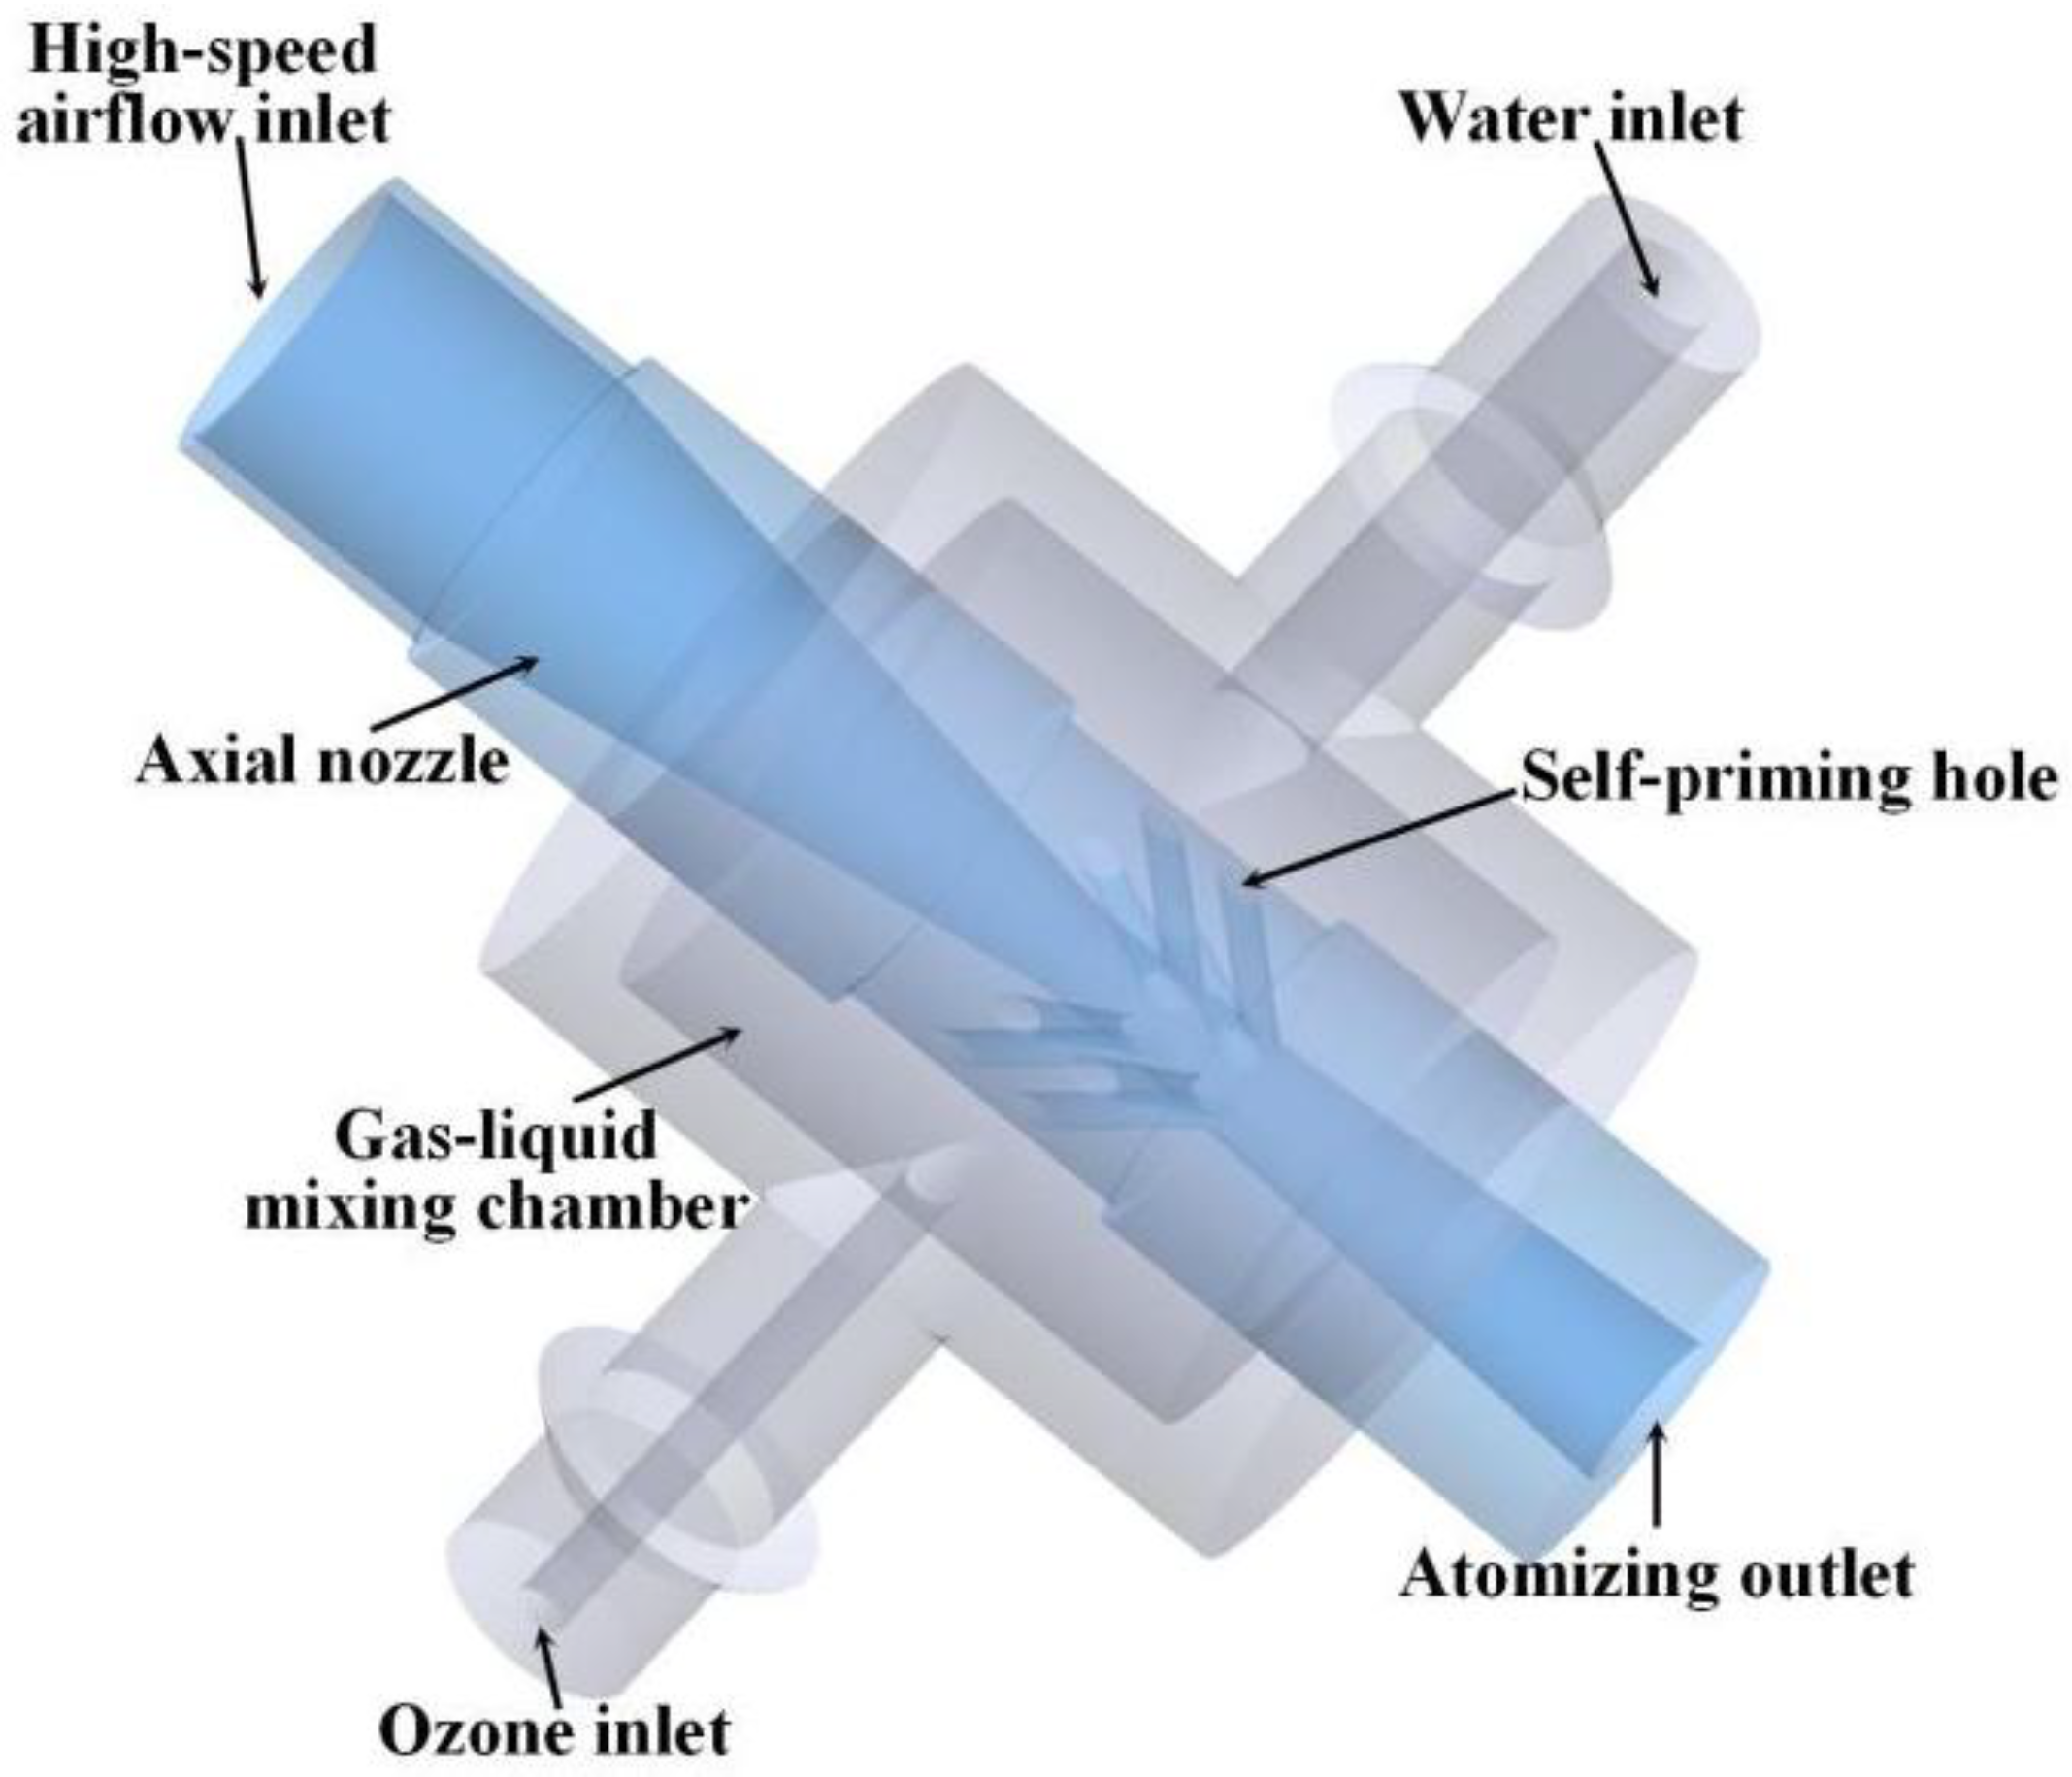
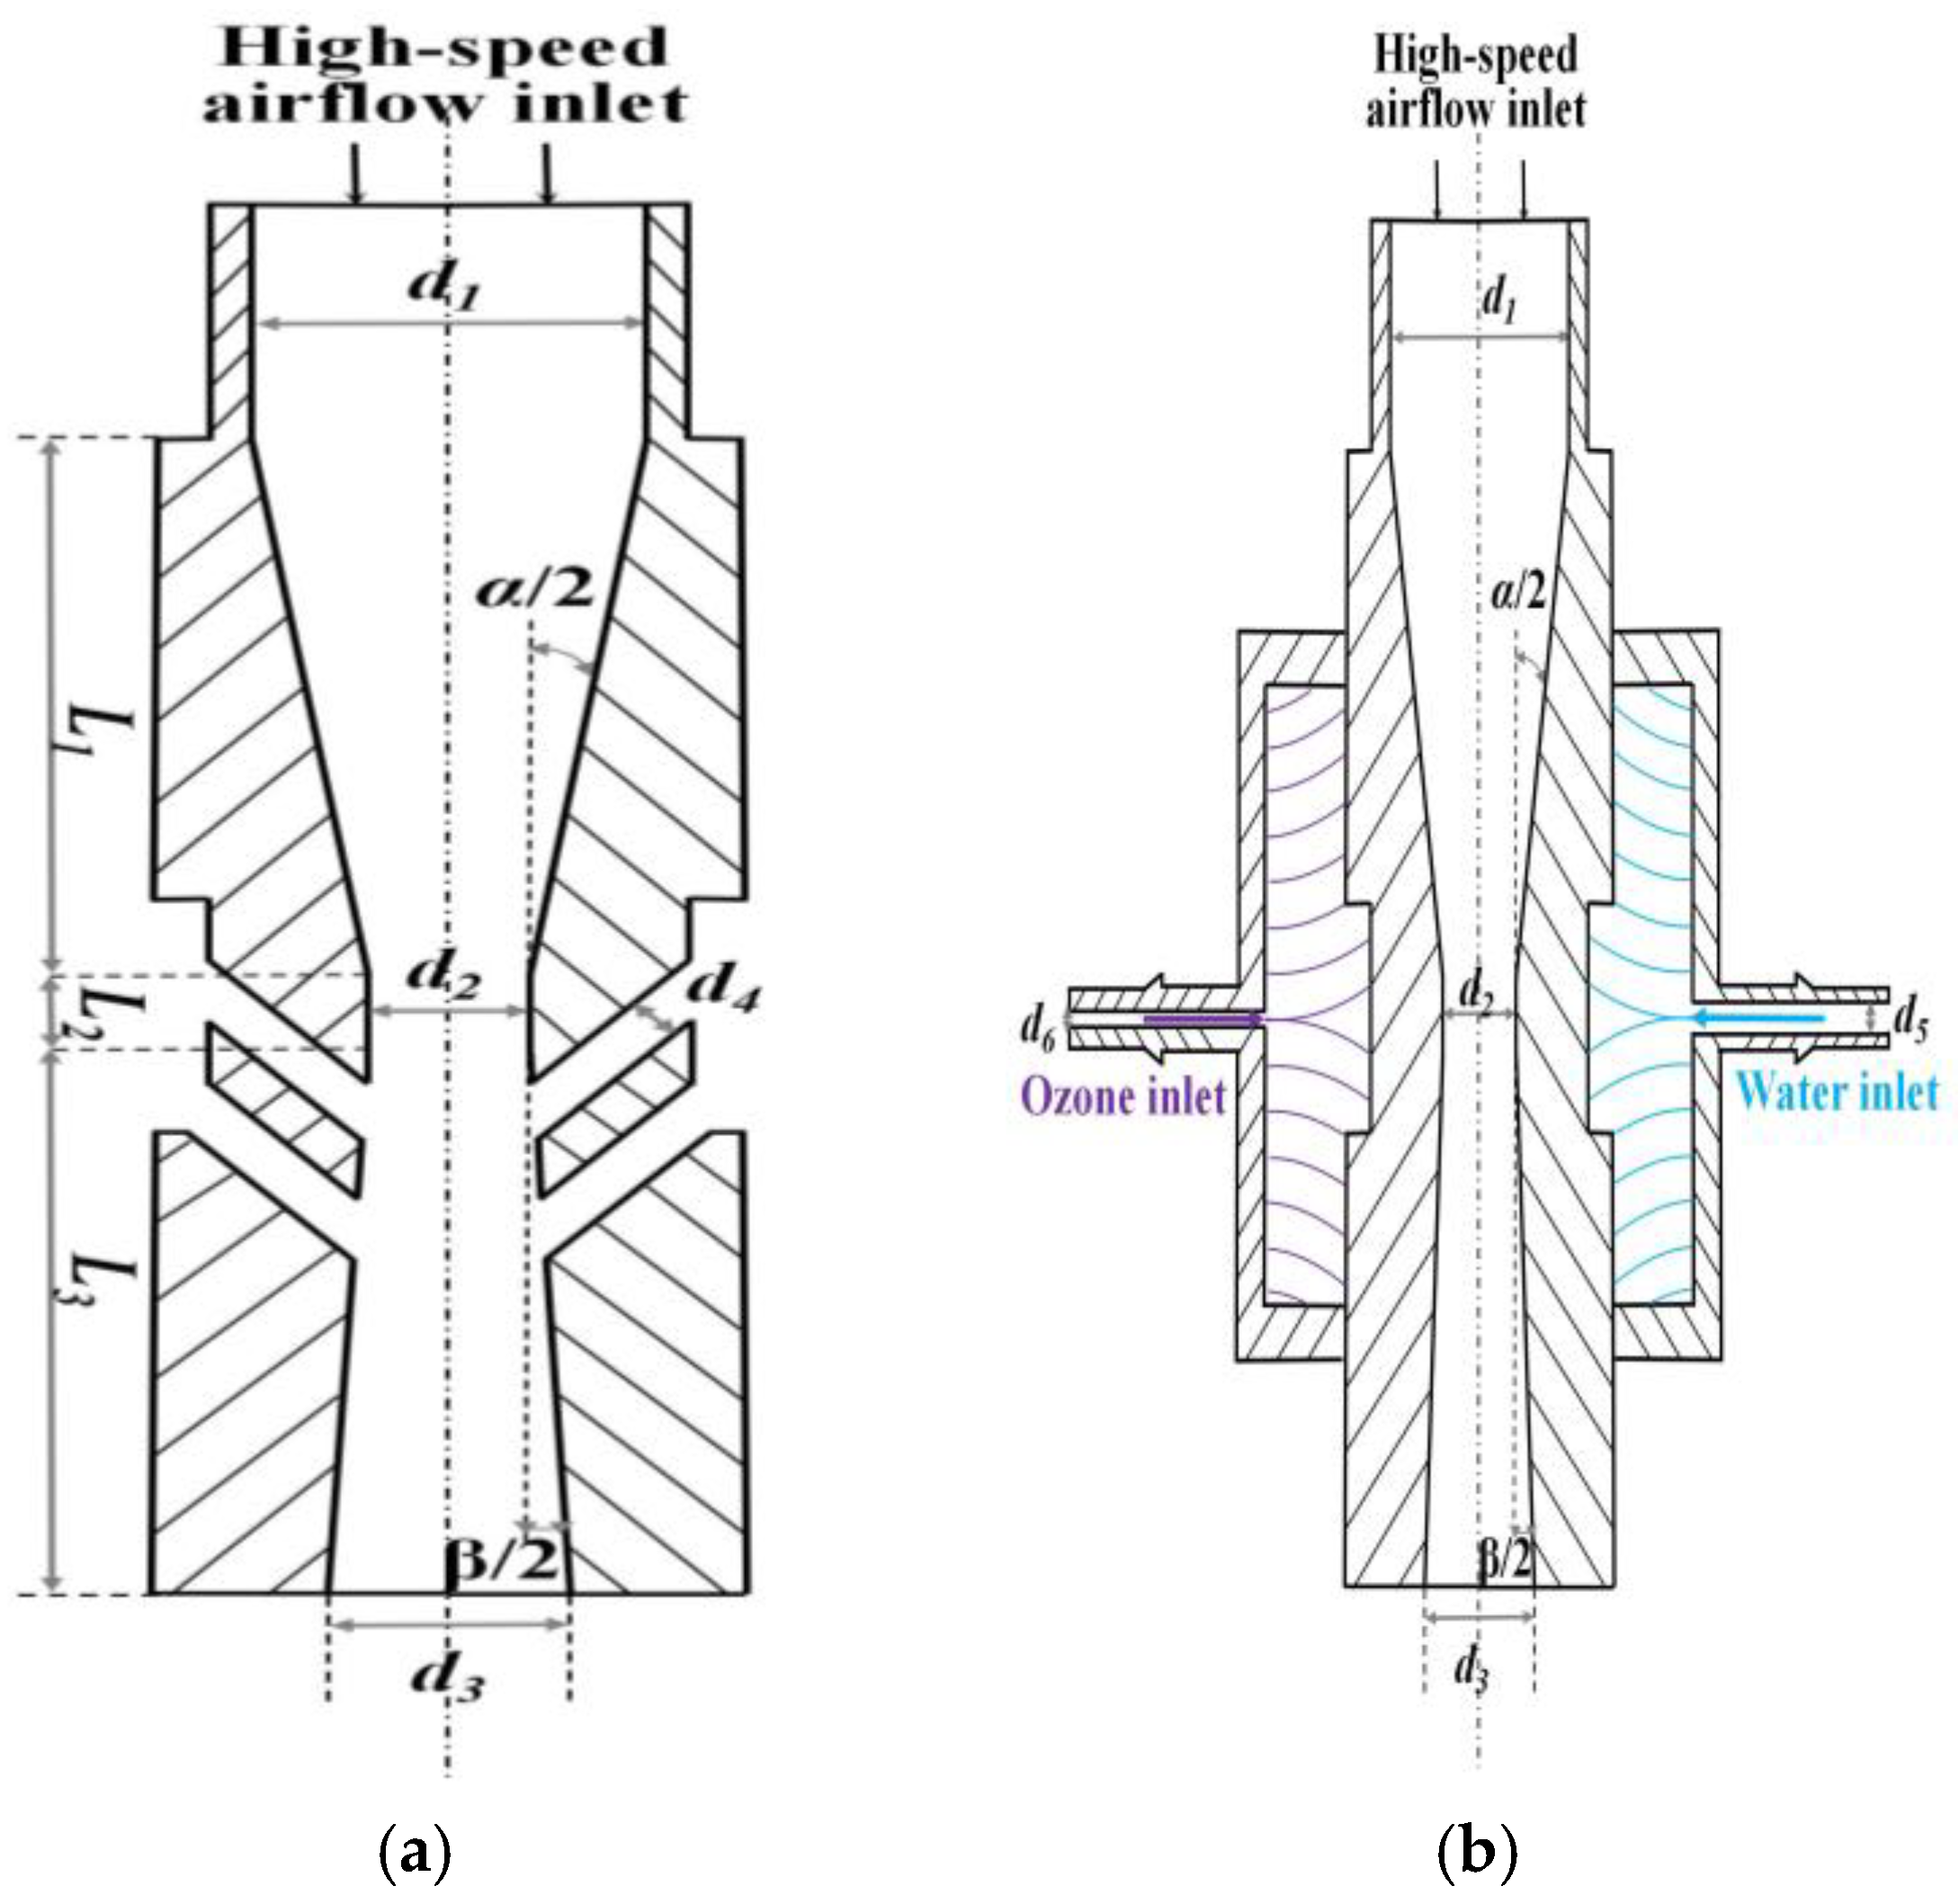
2.1. Design of Swirling Mixing Atomizer

The atomizer’s operating principle leverages Venturi-driven swirl mixing, inspired by dual-fluid nozzles in aerospace fuel injection [11]. High-speed airflow through the nozzle throat generates a pressure gradient (Bernoulli’s principle), inducing self-priming of ozone and water. Swirl stabilization (Coriolis effect) ensures prolonged gas–liquid contact, enhancing ozone dissolution—a concept validated in prior work on microbubble generators. The structure of the atomizer is shown in Figure 1. Its design is based on the principle of jet, which is divided into two parts: axial nozzle and mixing chamber. The high-speed airflow flows through the contraction end to the nozzle throat, and its velocity further increases. The pressure gradient generated in the narrow part of the atomizer throat, according to the siphon effect, the swirl chamber can absorb ozone and water for reaction, and then enter the axial nozzle through the self-priming hole. Under the impact of high-speed airflow, the mixed liquid is atomized and sprayed onto the target object [21].
The axial nozzle of the atomizer consists of three parts: the contraction section, the throat and the expansion section. The key structural parameters are shown in Figure 2, including the inlet diameter d1, the throat diameter d2, the outlet diameter d3, the self-priming hole diameter d4, the length of the contraction section L1, the length of the throat L2, the length of the expansion section L3, the contraction angle α and the expansion angle β. The main structural dimensions of the swirl chamber part involve the inlet hole diameter d5 and the gas free radical inlet diameter d6, which together determine the performance and atomization effect of the atomizer.

2.1.1. Design and Computation of Throat Inner Diameter d2

In the design of a multi-fluid swirling mixing atomizer, the throat diameter is directly related to liquid flow and energy dissipation. The specific design is referenced from Wang et al.’s research [12], and the calculation formula is as follows:
π 4 d 2 2 = Q m 0 T 0 P 0 k R 2 k + 1 k + 1 k 1 1 2
The interpretation of the symbols in the formula is shown in nomenclature.
According to the table, the air density at 25 °C is 7.0146 kg·m−3. In the theoretical design of the atomizer, when the stable working pressure of the air compressor is 0.6 Mpa, the air mass flow rate is 1.1714 × 10⁻² kg·s−1, the adiabatic index k is 1.41, and the gas constant R is 286.8. Substituted into the calculation d2 = 3.25 mm, in order to facilitate processing, d2 = 3 mm.

2.1.2. Design and Computation of Shrinkage L1 Design Calculation

Considering the factors such as the difficulty of manufacturing and the complexity of the process in the Vitoshinsky theory design method, the axial nozzle contraction section defaults to linear processing.
R 0 = R 2 L 1 1 R 2 R 1 2 1 x 2 2 1 + x 2 3 3 1
Experiments show that [22,23], when the contraction angle is in the range of 10~45°, the flow field distribution in the axial nozzle is more uniform, the eddy current is less, and the atomization efficiency is higher. Therefore, the axial nozzle contraction angle α is 15°.
The formula for calculating the inner diameter of the inlet of the axial tube:
d 1 = 3 ~ 5 d 2
In order to ensure that the high-speed airflow in the throat obtains a better expansion effect and airflow into the throat uniformity, producing a better siphon effect, d1 = 3d2 = 9 mm. The length of the contraction segment was calculated to be L1 = 23 mm.

2.1.3. Design and Computation of Expansion L3 Design Calculation

According to the axial nozzle exit cross-sectional area formula [22]:
d 3 = 0.66 d 2 × ( 2.07 ) lg B
In the formula, B is the axial nozzle inlet and outlet pressure ratio formula, the value is 12.5; calculated d3 = 4.39 mm, in order to facilitate the processing: d3 = 4.5 mm.
The expansion angle of the axial nozzle is denoted by β, and the length of the expansion section L3 is:
L 3 = d 3 d 2 2 tan β / 2
The expansion angle β of the axial nozzle is 10°. According to the formula, L3 = 8.6 mm, and L3 = 9 mm.

2.1.4. Design of Self-Priming Hole d4

The inner diameter of the self-priming hole is one of the key factors affecting liquid decomposition in atomizer design. The final particle size of the droplets is determined by two atomization processes: the first atomization is that the liquid is torn into a liquid column and a liquid sheet through a self-priming hole; the secondary atomization is that the liquid column and liquid sheet after the primary atomization are further broken into small droplets under the action of high-speed airflow in the atomizer. In order to further explore the influence of the inner diameter of the self-priming hole on the spray performance, this study specially designed three self-priming holes with different diameter specifications, the diameter d4 is 1.0 mm, 1.5 mm and 2.0 mm, respectively, and the position is set at the outlet end of the throat. The inner cavity structure of the axial nozzle and the cross section of the nozzle are shown in Table 1, respectively.

2.1.5. Design of Swirl Mixing Chamber

The swirl mixing chamber design of the atomizer includes the inner diameter of the outer chamber, the diameter of the water inlet and the ozone inlet. As the synthetic OW reaction chamber, according to the theoretical calculation of the axial nozzle of the atomizer, the inner diameter of the swirl chamber is 16 mm. The amount of liquid is mainly determined by the pressure gradient generated by the axial inner cavity, and the diameter of the liquid inlet hole d5 is 2 mm. The ozone content directly determines the concentration of synthetic OW. According to the previous study of our team [3], the ozone inlet diameter has little effect on the concentration of synthetic OW. Therefore, the ozone inlet diameter d6 is set to 0.5 mm as a constant, and the specific structure size is as following table.

2.2. Computational Fluid Dynamics Simulation

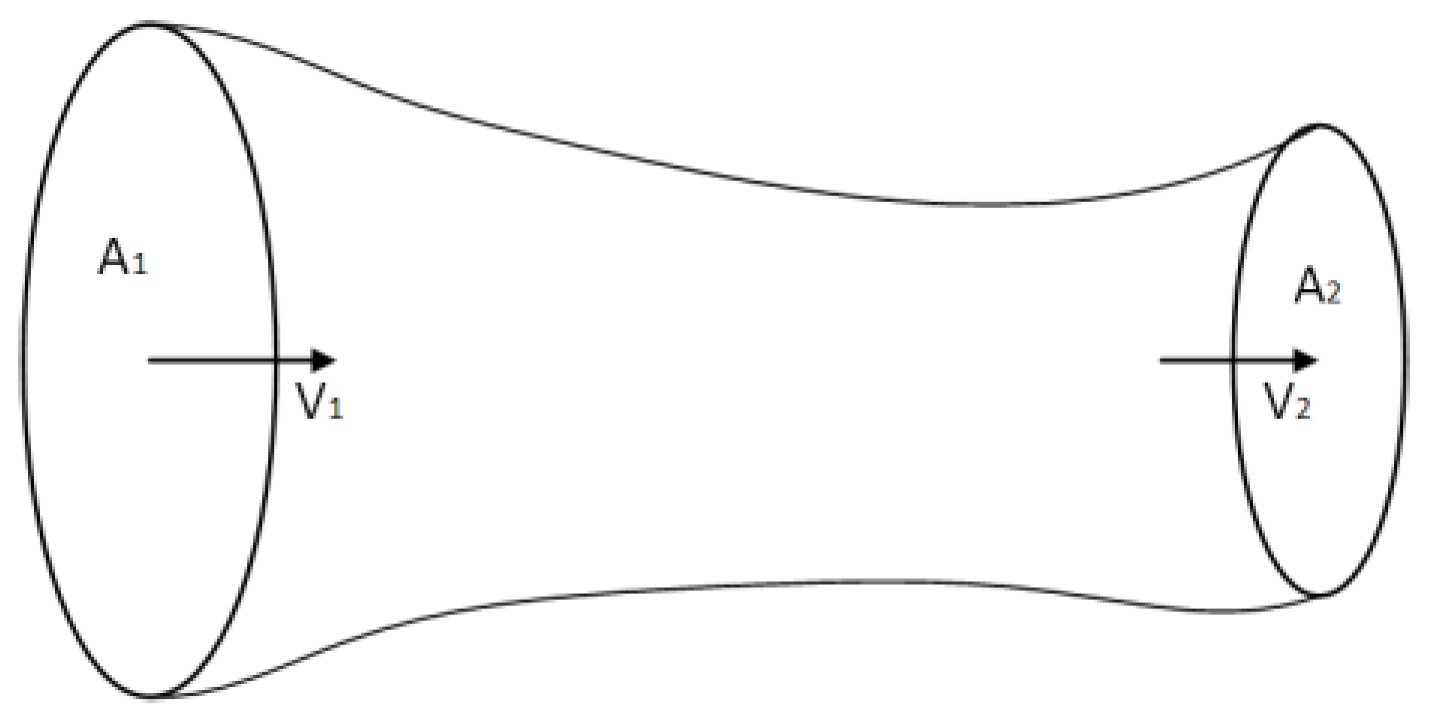
2.2.1. Mass Conservation and Energy Equation

(1) Law of conservation of mass
In order to simulate and optimize the relevant parameters of the axial nozzle in the later stage, the changes in heat transfer, temperature and other factors are ignored, and only the changes in the internal geometric parameters of the axial nozzle are considered. As shown in Figure 3, the cross-sections A1 and A2 are taken at any two ends. The flow velocities at the cross-sections are v1 and v2, and the densities are ρ1 and ρ2, respectively. The fluid mass conservation equation at the cross-section is shown in (5).
ρ 1 A 1 v 1 = ρ 2 A 2 v 2
(2) Energy equation
The flow of ideal fluid in the atomizer can be regarded as isentropic flow, and the gas state satisfies the following equations. The law of fluid velocity and pressure in the axial nozzle with the change of cross-sectional area can be calculated [24].
d H g + V g 2 2 = 0
d p g ρ g + v g d v g = 0
ρ g v g = n R T g
The interpretation of the symbols in the formula is shown in nomenclature.

2.2.2. Multiphase Model and Turbulence Model

(1) Turbulence model
The turbulence equation and turbulence dissipation rate equation are as follows:
Turbulence equation k:
ρ D k D t = μ + μ t σ k k x i x i + G k + G b ρ ε Y M
Turbulent dissipation rate ε:
ρ D ε D t = μ + μ t σ k ε x i x i + C 1 ε ε k G k + C 3 ε G b C 2 ε ρ ε 2 k
Turbulent viscosity coefficient:
μ t = ρ C μ k 2 ε
The interpretation of the symbols in the formula is shown in nomenclature.i is 1, 2, 3; x is the coordinate; the turbulent Prandtl numbers of turbulent kinetic energy k and dissipation rate ε are σk = 1.0 and σε = 1.3, respectively. The values of constants are C = 1.44, C = 1.92, C = 0.09 and Cμ = 0.0845, respectively.
(2) Two-phase flow model
Therefore, the two-phase flow VOF model is used to simulate the interaction between the gas phase and the liquid phase in the internal flow field. The mass conservation equation and the momentum conservation equation are expressed as follows:
Mass conservation equation:
ρ t + ρ u i x i = S m
Momentum conservation equation:
ρ u i t + ρ u i u j x i = p x i + τ i j c j + ρ g i + F i
Stress tensor:
τ i j = μ u i x j + u j x i 2 3 μ u t x t δ i j
The interpretation of the symbols in the formula is shown in nomenclature.

2.2.3. Mesh Generation

The three-dimensional model of the atomizer was obtained by Creo6.0 modeling, and the calculation domain of the three-dimensional model composed of the internal flow field of the atomizer was established by ANSYS Mesh, as shown in Figure 4a.
The internal flow of the atomizer is a two-phase flow problem, and the local pressure at the intersection of gas and liquid phases is large and the turbulence is intense. Therefore, unstructured tetrahedrons are used to mesh the fluid domain of the atomizer to adapt to the complex geometry of each part, as shown in Figure 4b. Through the verification of grid independence, the average grid size is defined as 0.5 mm, and 245,349 tetrahedral elements and 47,758 nodes are used in the simulation, with a unit mass of 0.878.

2.2.4. Boundary Conditions and Numerical Setting

(1) Turbulence and laminar flow
The fluid flow state is often evaluated by Reynolds number Re:
Re = ρ u L μ
The interpretation of the symbols in the formula is shown in nomenclature.
The atomizer simulation analysis mainly analyzes the internal two-phase flow, in which the main phase is air, and its density under standard atmospheric pressure is 1.225 kg·m−3. With the change in the inlet pressure of the atomizer, the air density will also change. The secondary phase is water, which does not involve the analysis of the external flow field. The specific parameters of the two-phase fluid are shown in Table 2 below.
Before CFD simulation in ANSYS 2022, boundary conditions must be established, and three inlet boundaries are set, which are high-speed airflow inlet, liquid inlet and ozone inlet. Different pressure values (0.4 Mpa, 0.6 Mpa, 0.8 Mpa) are set at the high-speed airflow inlet. Because the swirl atomizer is designed as a self-priming type, the external cavity pressure of the ozone and liquid inlets is set to 0 Mpa. In the simulation setting, the pressure-based solver and the absolute velocity format are selected, and the steady-state calculation method is adopted. At the same time, the influence of gravity is considered. The VOF model in the two-phase flow model is selected, and the RNG k-ε model is selected for the turbulence model. Both the gas and liquid inlets adopt the pressure inlet type, and the outlet selects the free outflow type. In the solution process, the Coupled algorithm is used to solve the problem, the iterative residual is set to 10−5, and the iteration is 3000 steps. The second-order upwind discretization scheme is used to deal with the turbulent kinetic energy and turbulent dissipation ratio, and the heat transfer process adopts the uniform model and isothermal assumption to simplify the calculation process.

2.3. Experimental System

2.3.1. Orthogonal Experiment of Atomizer Axial Nozzle

The negative pressure at the axis of the self-priming hole of the axial nozzle is considered to be an important index to evaluate the performance of the multi-fluid swirl mixing atomizer. In order to ensure that the negative pressure generated in the inner cavity of the atomizer meets the requirements of atomization, the geometric size parameters of the key parts of the axial nozzle of the atomizer are optimized and analyzed by combining ANSYS 2022 CFD with orthogonal test, and the most critical factors affecting the negative pressure at the axis of the self-priming hole of the axial nozzle are obtained. According to the simulation analysis results of Section 2.2 atomizer, the inlet pressure is selected to be 0.6Mpa. At this time, the flow field distribution in the atomizer is more uniform.
In the orthogonal test, the stable local low-pressure effect of OW generated by high-speed airflow is mainly discussed, and the self-priming effect of ozone water entering the inner cavity of the atomizer is realized. To this end, nine new atomizer models were designed by Creo6.0, and the three main influencing factors of the inlet diameter d1, throat length L2 and self-priming hole diameter d4 of the axial nozzle of the atomizer were adjusted. Each factor takes three levels, and the negative pressure at the axis position of the self-priming hole of the axial nozzle of the atomizer is taken as the inspection index to evaluate the influence of different designs on the self-priming effect. The orthogonal test factor level table is shown in Table 3.
The orthogonal test of the structural parameters of the axial nozzle of the atomizer is designed by the L9 (34) orthogonal table [25] under the premise of ignoring the mutual influence between the factors. In order to evaluate the test error, an empty column is set up. The orthogonal test table is shown in Table 4.

2.3.2. Particle Size Experiment and Concentration Measurement

The particle size test and concentration detection system of the multi-fluid swirl mixing atomizer consists of four modules: water supply, ozone supply, high-pressure air supply and test (see Figure 5). In the water supply module, the deionized water is placed in a 5L plastic container, and the suction is provided by the water inlet of the mixing atomizer. The deionized water flows through the hydraulic gauge, the ball valve and the liquid flowmeter to the gas–liquid mixing chamber of the atomizer. In the ozone supply module, oxygen is released through the oxygen tank and flows through the ozone generator, where ozone is generated by ionization and superexcitation, and then flows through the flow controller, pressure gauge and check valve in turn to the gas–liquid mixing chamber of the atomizer for further gas–liquid mixing. In the high-pressure air supply module, the air compressor provides stable airflow, and the air flows through the pressure regulating valve, the check valve and the pressure gauge to the high-pressure air inlet of the atomizer in order to provide air support for efficient gas–liquid mixing, gas–water self-priming and atomization.
The experiment was carried out at a temperature of 25.0 °C and a relative humidity of 60%. In the test module, the particle size of the droplets generated by the atomizer is detected by using the DP-02 laser particle size analyzer. The analyzer is composed of a collimated laser generator, a signal acquisition device and a data processing system. When the collimated laser encounters small particles during the march, the scattering phenomenon will occur. The larger the particle, the smaller the scattering angle, and vice versa. The larger the scattering angle, this phenomenon can be accurately described by the electromagnetic wave theory, so the size of the droplets is calculated by measuring the distribution of the scattered light; the CL6587 ozone dissolution concentration detector of B&C Dectranics company is used to detect the collected spray droplet group with a special probe pen, and the ozone concentration of the spray can be quickly obtained. Each time, 30mL mixed spray solution is collected at different spray distances (10 cm~80 cm) for detection, and each working condition is measured three times to reduce the influence of accidental errors on the experimental results.

3. Results and Discussion

3.1. Analysis of Simulation Results (Optimum Working Pressure)

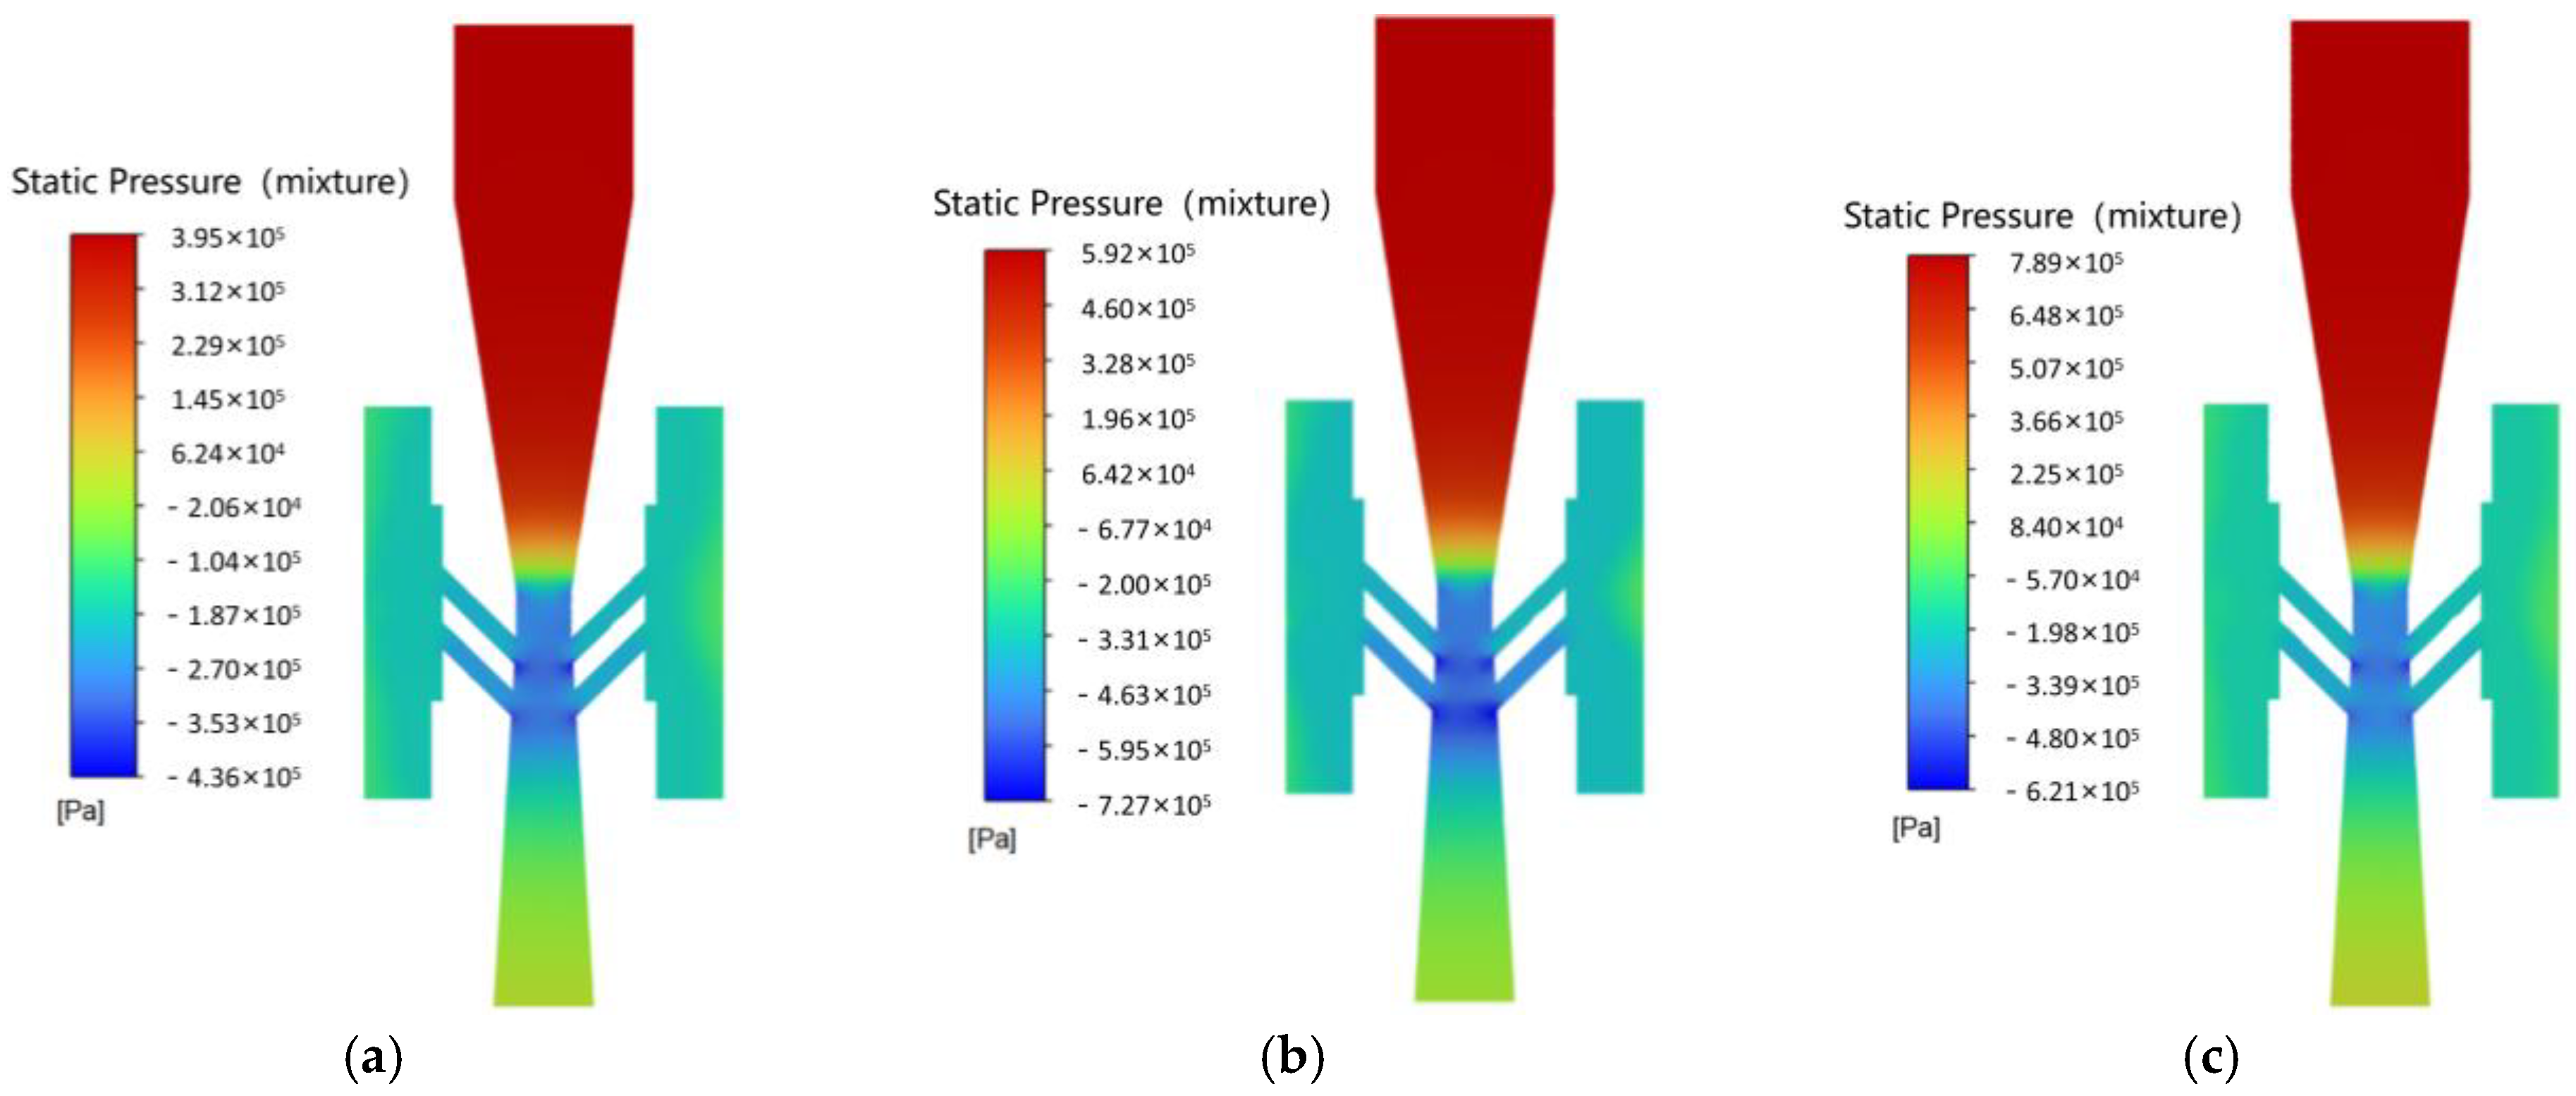
3.1.1. Pressure Distribution

The static pressure contour of the atomizer’s XZ cross-section is shown in Figure 6. The maximum negative pressure occurs at the junction of the contraction section’s self-priming hole and the inner chamber. In Figure 6a, the maximum negative pressure is −4.36 × 10⁵ Pa, with the negative pressure in the self−priming hole ranging from −1.87 × 10⁵ to −2.7 × 10⁵ Pa. In Figure 6b, the maximum negative pressure reaches −7.27 × 10⁵ Pa, and the self−priming hole pressure ranges from −3.31 × 10⁵ to −4.63 × 10⁵ Pa. In Figure 6c, the maximum negative pressure is −6.21 × 10⁵ Pa, with the self-priming hole pressure between −1.98 × 10⁵ and −3.39 × 10⁵ Pa. It can be observed that at an inlet pressure of 0.6 MPa, the negative pressure in the self-priming hole is at its peak. However, at 0.8 MPa, the negative pressure decreases primarily due to excessive inlet pressure, which causes severe turbulence at the throat of the atomizer, resulting in chaotic flow. This turbulence leads to some airflow entering the self-priming hole, thereby reducing the generated negative pressure.

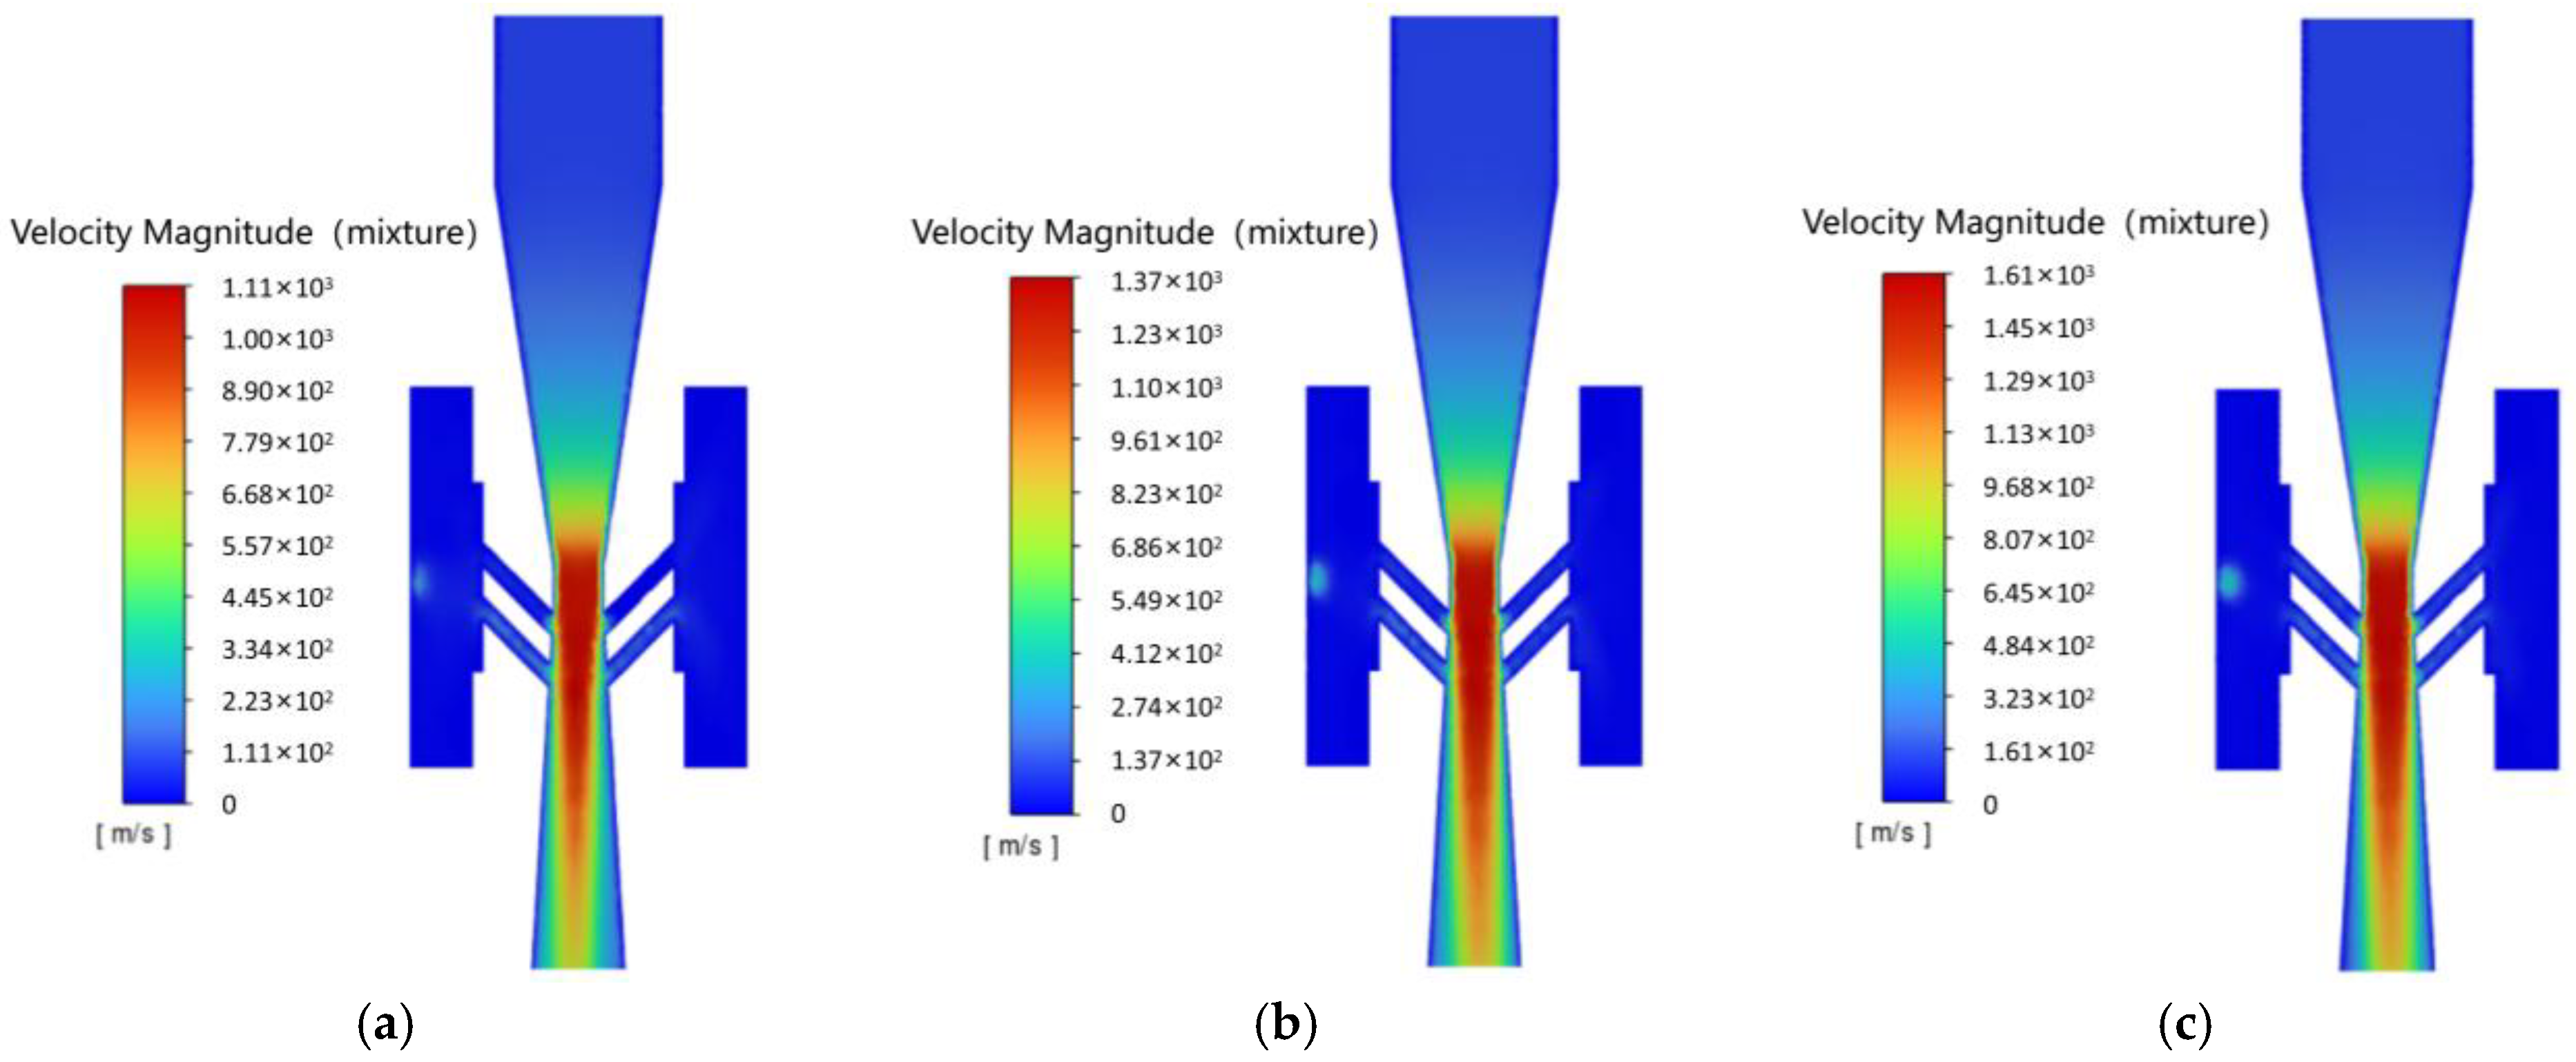
3.1.2. Speed Distribution

The velocity vector contour of the atomizer’s XZ cross-section is illustrated in Figure 7. As the gas pressure increases, the velocity within the atomizer’s inner chamber also progressively rises. At an inlet pressure of 0.8 MPa, the maximum velocity reaches 1.61 × 10³ m·s−1. A self-priming velocity is generated at the self-priming hole, allowing ozone and water to react fully before entering the inner chamber. This self-priming velocity ranges from approximately 303 to 450 m·s−1. The airflow velocity at the throat of the atomizer is further enhanced, leading to high-speed collisions with the ozone gas drawn in from the self-priming hole. This interaction creates an optimal environment for achieving a high-quality atomization effect.

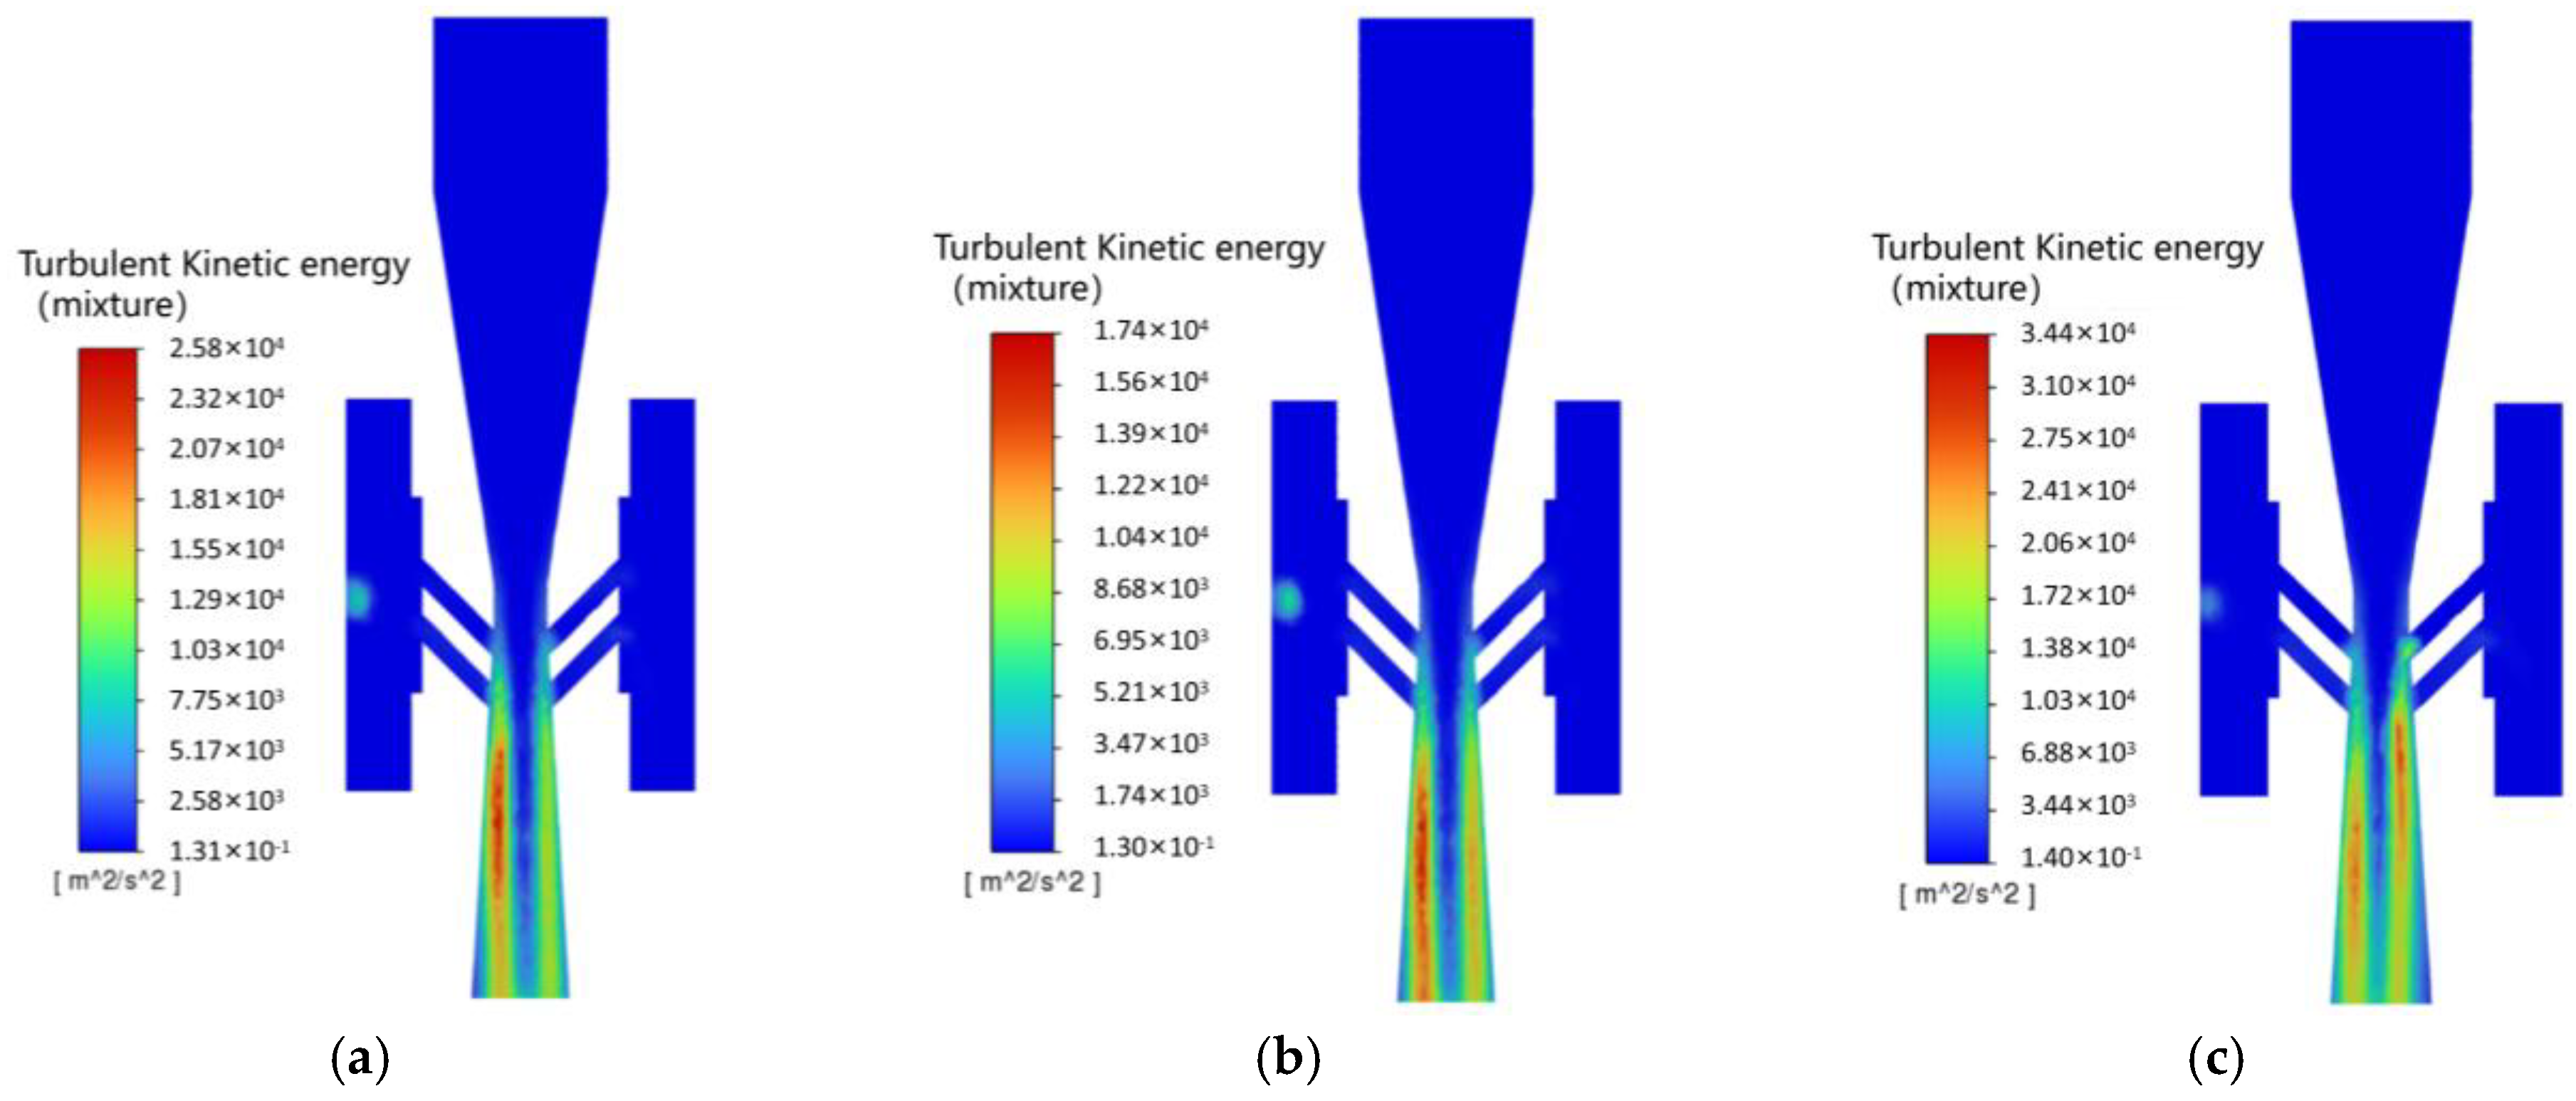
3.1.3. Turbulent Kinetic Energy

The turbulent kinetic energy (TKE) distribution at the XZ cross-section of the atomizer is illustrated in Figure 8. In panel (a), the maximum TKE reaches 2.58 × 10⁴ m2·s−2, showing an uneven distribution in the outlet section, which results in poor gas–liquid mixing and irregular droplet distribution. In panel (b), the maximum TKE is 1.74 × 10⁴ m2·s−2, with a more uniform TKE distribution on both sides of the outlet, facilitating adequate gas–liquid mixing. This enhances droplet shear, compression, and collision during the atomization process, leading to the generation of smaller droplets that improve target adhesion. In panel (c), the maximum TKE increases to 3.44 × 10⁴ m2·s−2, where a uniform distribution is also observed in the outlet section. However, the high inlet pressure causes significant TKE within the self-priming port, resulting in a decreased self-priming effect of the atomizer, corresponding to the lower negative pressure observed at 0.8 MPa. Overall, the optimal operating pressure for the swirl atomizer is determined to be 0.6 MPa.

3.2. Simulation and Orthogonal Experimental Results (Optimal Structural Parameters)

In the orthogonal test, the negative pressure of the axial position of the self-priming hole of the axial nozzle is analyzed, and the data processing is carried out by using the ANSYS post-processing module CFD-Post, and the results are shown in Table 5.
In Table 5, Kin represents the sum of the negative pressures at the position of the self-priming hole axis of the atomizer corresponding to the level i (i = 1, 2 or 3) on the nth column (n = 1, 2, 3); Kin/N represents the average value of the sum of the negative pressures at the corresponding position of the self-priming hole axis of the atomizer at the level of i (i = 1, 2 or 3) on the nth column (n = 1, 2, 3 or 4). N represents the number of levels, N = 3 in the table; r is the range, R = max {K1n/N, K2n/N, K3n/N} -min { K1n/N, K2n/N, K3n/N}. The order of the factors affecting the negative pressure of the axial position of the axial nozzle of the atomizer from primary to secondary is throat length L2, atomizer inlet diameter d1, self-priming hole diameter d4. According to the orthogonal test results, it is found that the throat length of the axial nozzle has the most significant effect on the negative pressure. If the throat length L2 is too short or too long, it will lead to the instability of the flow field in the axial nozzle, which will reduce the performance of the nozzle to produce negative pressure. In order to ensure that the atomizer has excellent atomization performance, it is important to select the appropriate throat length. The inlet diameter d1 of the atomizer also has a certain degree of influence on the negative pressure of the self-priming hole axis position. Compared with the influence of the throat length on the negative pressure, the range is smaller than the throat length range, and the negative pressure generated by the self-priming hole axis position is less affected. Changing the diameter of the self-priming hole d4 has a relatively small effect on the negative pressure of the self-priming hole axis position, because the absolute value of the range is the smallest. Based on the experimental results of the combination of simulation analysis and orthogonal test, the optimal structural parameters of the atomizer are obtained as follows: the inlet diameter d1 of the atomizer is 9 mm, the throat length L2 is 3 mm, and the self-priming hole diameter d4 is 1.5 mm.

3.3. Spray Characteristics and Ozone Droplet Group Concentration Test Results and Analysis

3.3.1. Gas–Liquid Ratio (GLR)

In the multi-fluid mixing atomization process of ozone and water, the higher gas–liquid ratio can significantly improve the effect and efficiency of OW by enhancing the dissolution of ozone, improving the reaction efficiency, and refining the atomization particle size.
G L R = Q g Q l
According to the mass transfer theory, the increase in gas flow rate can enhance the contact between ozone and liquid, which makes ozone more easily diffuse into water and further increases the concentration of the mixture [26]. It can be seen from the relationship between flow rate and gas–liquid ratio under different inlet pressures reflected in Figure 9 that when the inlet pressure is between 0.1 MPa and 0.3 MPa, the flow rates of ozone and water are at a low level. The reason may be that the negative pressure generated by the Venturi structure in the center of the axial nozzle is weak, and it is difficult to form self-suction for ozone and water. At the same time, because the density of water is much higher than that of gas, the effect on water is far less than that on ozone gas under the same negative pressure, which is also the main reason for the low gas–liquid ratio at 0.1~0.3 MPa.
Although the inlet pressure of 0.4~0.6 MPa may be more conducive to the generation of negative pressure in the central throat of the nozzle and the self-inhalation of more ozone gas to participate in the mixing, at a higher gas–liquid ratio, there may still be some liquid that cannot be effectively taken away, resulting in liquid accumulation in the mixing chamber, further affecting the stability of the spray.
When the inlet pressure exceeds 0.7 MPa, the gas–liquid flow rate and gas–liquid ratio decrease significantly, which may be attributed to the decrease in the negative pressure of the self-priming hole, the severe turbulence at the throat of the atomizer, and the chaotic flow state. A part of the air in the central air column flows back into the mixing chamber from the self-priming hole, thereby inhibiting the entry of some ozone gas and water, thereby affecting the spray quality. The results demonstrate a clear trend of increasing flow rate and GLR with pressure, peaking at 0.6 MPa. Statistical significance between pressure conditions was confirmed via paired t-tests (p < 0.05 for 0.6 MPa vs. 0.4/0.8 MPa). Combined with the analysis results of Section 3.1, it can be considered that 0.6MPa is more suitable for the operation pressure of the atomizer. Flow rate and GLR exhibited monotonic increases with inlet pressure up to 0.6 MPa, beyond which turbulence-induced instability reduced efficiency. Differences between pressure conditions were statistically significant (p < 0.05, paired t-test), with 0.6 MPa achieving the highest GLR (3.99 ± 0.15), ozone flow rate (671 ± 5.2 mL·min−1) and water flow rate (168 ± 3.1 mL·min−1).

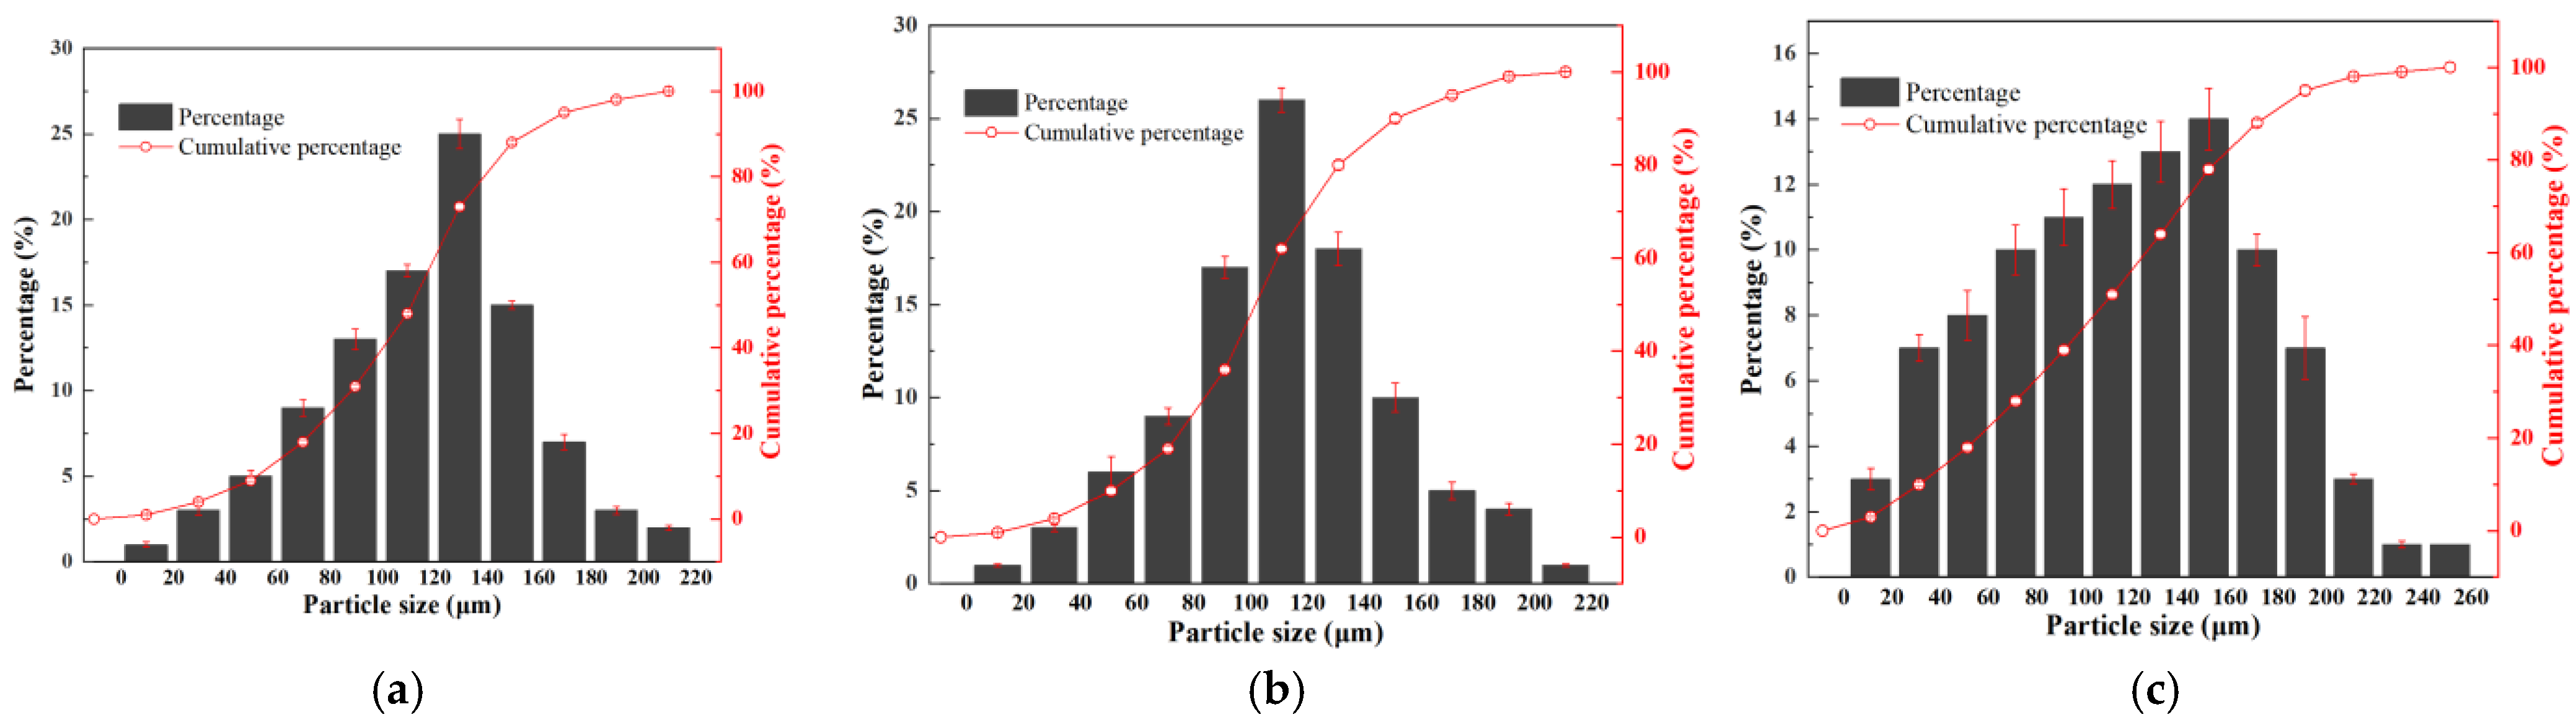
3.3.2. Droplet Size Distribution

Droplet size has always been an important index to measure the performance of spray atomization. An ideal atomizer should have the ability to produce small and uniform droplets [27]. In this study, the influence of droplet size and distribution on atomization performance is mainly reflected in atomization uniformity, sedimentation and diffusion, spray coverage and gas–liquid mixing efficiency. Firstly, the uniformity of particle size distribution directly affects the uniformity of the spray. If the distribution of particle size is wide, it may lead to excessive concentration in some areas and insufficient concentration in other areas, thus affecting the overall effect (see Figure 10c). Secondly, the droplets with smaller particle sizes have a longer suspension time in the air and can better diffuse to the target area (see Figure 10a). The larger droplets rebound and break up when they contact with the blade surface, which affects the sedimentation efficiency [28]. At the same time, small droplets can be evenly distributed in a larger area, increasing spray coverage, which is particularly important for agricultural disease prevention and control; for the sterilization reaction process, small ozonated droplets can fully contact with the target more quickly, so that the strong oxidizing substances rich in the droplets can quickly break through the cell wall, damage the nucleic acid of harmful bacteria, and cause intracellular protein denaturation, so as to achieve green and efficient farmland disease control effect.
It is not difficult to see that the structure design and optimization of the sprayer in the early stage undoubtedly have a positive impact on the droplet distribution under 0.4 MPa and 0.6 MPa. In particular, the average particle size of the droplets under 0.6 MPa is 102 μm, the distribution is uniform, and the coverage ability is strong, which provides more accurate data support for the actual operation of the sprayer in the field.

3.3.3. Ozonated Droplet Group Concentration Detection

In the previous study, Fujiwara et al. [29] compared the concentration detection and analysis of the prepared OW at different spray distances. In the three nozzles of the comparative study, the concentration of ozonated droplets decreased with the increase in spray distance. The rate of decrease in the concentration of ozonated droplets decreased exponentially with the increase in spray distance, and the maximum concentration of ozonated droplets was 0.7 mg·L−1. The concentration of ozonated droplets under different spray distances and different spray pressures in this swirling mixed atomizer is shown in Figure 11. It can be seen that compared with the spraying mode of preparing OW first and then spraying by hydraulic atomization, the spraying mode of spraying while mixing by pneumatic force shows different results. In this concentration detection, although the ozone droplet concentration of the atomizer under different operating pressures is inconsistent with the previous research results, it also shows a relatively consistent trend [30]; that is, with the increase in the spray distance, the concentration increases first and then decreases, and the spray distance with the highest concentration is between 40~60 cm, and the concentration is up to 3.73 mg·L−1. The reason for this phenomenon may be that the closer to the outlet of the atomizer (10~40 cm), the gas–liquid velocity is too large, and the high concentration of droplets under the condition of obstruction produces an eddy current (high-speed impact droplet collection container or plant leaves), which is, to a certain extent, from ozone to oxygen autolysis. At the spray distance of more than 60 cm, the concentration of ozone droplets showed a slow downward trend, which may be the attenuation of normal OW concentration with time. At the same time, the effect of inlet pressure on the concentration is also more significant. The suction caused by the negative pressure of the throat can increase the flow rate of the ozone channel and the water channel to a greater extent, forming a higher gas–liquid ratio. Because ozone is easily soluble in water, it is indeed more conducive to the increase in the ozone spray concentration of the atomizer at a higher gas–liquid ratio.
In order to quantify the relationship between concentration and spray distance, the quadratic polynomial model was used to nonlinearly fit the data under different pressures, and the nonlinear regression model of concentration and spray distance under three spray pressures (see Figure 11). All models passed the significance test (p > 0.92), the residuals conformed to the normal distribution (Shapiro–Wilk test p > 0.05), and there was no heteroscedasticity (Breusch–Pagan test p > 0.1). The model shows that the theoretical and experimental consistency is the best under 0.6 MPa pressure, and the optimal spray operation distance is 47 cm under this condition. Compared with the ‘synthesis before spraying’ mode, the atomizer increases the concentration of ozonized droplets by 4.3 times through gas–liquid synchronous mixing and swirl enhancement, and the transportation loss is reduced to less than 15%.

4. Conclusions

An innovative design concept is proposed that integrates the swirling mixing of ozonated water with precise spraying capabilities. This design creatively combines an axial nozzle with a swirling mixing chamber, utilizing the negative pressure generated at the throat of the nozzle by the high-speed central airflow as the driving force for swirling mixing and initial atomization. This approach enhances the efficiency of gas–liquid contact and mass transfer before droplet formation. Numerical simulations were conducted to analyze the effects of geometric parameters of key components on the internal flow of the atomizer. The optimized design features an inlet inner diameter of 9 mm, a throat length of 3 mm, and a self-priming hole diameter of 1.5 mm. Performance evaluations, including droplet size and ozonated droplet concentration experiments, demonstrated the superior capabilities of the designed atomizer. At an optimal spraying pressure of 0.6 MPa and a distance of 40 cm from the target, it produced uniformly distributed ultrafine droplets with an average particle size of 102 µm and a concentration of up to 3.73 mg·L−1. The multi-fluid swirling mixing atomizer described in this study exhibits high mixing efficiency and uniform droplet distribution. The developed atomizer not only improves ozone–water mixing efficiency but also exemplifies precision application technology, reducing environmental contamination by ensuring targeted droplet deposition. This innovation supports the integration of high-performance, low-impact plant protection systems in modern agriculture. The findings provide theoretical guidance and data support for the development and design of efficient ozonated atomizers and their application in agricultural production.

Author Contributions

Conceptualization, B.Z. and C.W.; methodology, B.Z.; software, Z.C.; validation, X.H., X.W. and Z.C.; formal analysis, X.W.; investigation, X.H.; resources, B.Z.; data curation, Z.C.; writing—original draft preparation, X.H.; writing—review and editing, X.H.; visualization, X.X.; supervision, B.Z.; project administration, C.W.; funding acquisition, C.W. All authors have read and agreed to the published version of the manuscript.

Funding

This research was funded by A Project Funded by the Priority Academic Program Development of Jiangsu Higher Education Institutions (No. PAPD2023_87), Project of Faculty of Agricultural Engineering of Jiangsu University (No. NZXB20200102), Postgraduate Research and Practice Innovation Program of Jiangsu Province (No. KYCX24_3990) and Key and General Projects of Jiangsu Province (No. BE2022338).

Data Availability Statement

Data are contained within the article.

Conflicts of Interest

The authors declare no conflicts of interest.

Nomenclature

P0The inlet pressure of the jetT0The inlet temperature of the jet
kAdiabatic indexRGas constant
Qm0Tube inlet air flow rate of the jetR0The radius of the contraction segment
R1Radius of the gas inletR2Radius of the laryngeal segment
xRelative coordinateBImport and export pressure ratio formula
HgEnthalpy of gaspgGas pressure
vgGas velocityρgdensity of gas
VgGas volumeTgGas temperature
ρFluid densitytTime
µFluid dynamical viscosityGkTurbulent kinetic energy induced by the velocity gradient
pStatic pressureYMEffect of turbulence on the overall dissipation rate
ρgiGravity volume forceGbThe turbulent kinetic energy caused by buoyancy force
FiOther volume forceτStress tensor
uvelocity vectorδijKronecker Delta tensor
QgGas flow rateQlLiquid flow rate

References

  1. Wu, J.; Xiang, J.; Yi, X.; Dai, X.; Tang, C.; Liu, Y. Market Participation and Farmers’ Adoption of Green Control Techniques: Evidence from China. Agriculture 2024, 14, 1138. [Google Scholar] [CrossRef]
  2. Ebihara, K.; Mitsugi, F.; Ikegami, T.; Nakamura, N.; Hashimoto, Y.; Yamashita, Y.; Baba, S.; Henryka, S.D.; Pawlat, J.; Teii, S.; et al. Sterilization Characteristics of Ozone-mist Spray for Chemical Free Agriculture. Int. J. Plasma Environ. Sci. Technol. 2016, 10, 11–15. [Google Scholar]
  3. Tanuwidjaja, I.; Mrkonjic, M.F. Ozone in Droplets and Mist in Inhibition of Phytopathogenic Microbiota. Agriculture 2022, 12, 1875. [Google Scholar] [CrossRef]
  4. Zhao, Q.; Guo, S.; Feng, J.; Li, D.; Yang, S.; Zhou, X. Suitable Water-Fertilizer Management and Ozone Synergy Can Enhance Substrate-Based Lettuce Yield and Water–Fertilizer Use Efficiency. Agronomy 2024, 14, 1619. [Google Scholar] [CrossRef]
  5. Hu, X. Design and Experiment of a Strongly Oxidative Free Radical Synthesis Spray System. Master’s Thesis, Jiangsu University, Zhenjiang, China, 2022. [Google Scholar]
  6. Liu, X.; Hou, Y.; Guo, J.; Wang, Y.; Zuo, Q.; Wang, C. Catalytic Ozone Aqueous Decomposition of Methylene Blue Using Composite Metal Oxides. IOP Conf. Ser. Mater. Sci. Eng. 2015, 87, 012031. [Google Scholar] [CrossRef]
  7. Brêda, A.L.M.; Conceição, M.L.S.D.; Oliveira, F.O. Evaluation of the Microbial Reduction Efficacy and Perception of Use of an Ozonized Water Spray Disinfection Technology. Sci. Rep. 2022, 12, 13019. [Google Scholar]
  8. Jiang, Y.; Li, H.; Chen, C.; Hua, L.; Zhang, D. Hydraulic Performance and Jet Breakup Characteristics of the Impact Sprinkler with Circular and Non-Circular Nozzles. Appl. Eng. Agric. 2019, 35, 911–924. [Google Scholar] [CrossRef]
  9. Lin, J.; Ma, J.; Liu, K.; Huang, X.; Xiao, L.; Ahmed, S.; Dong, X.; Qiu, B. Development and Test of an Autonomous Air-Assisted Sprayer Based on Single Hanging Track for Solar Greenhouse. Crop Prot. 2021, 142, 105502. [Google Scholar] [CrossRef]
  10. Choi, S.J.; Kong, M.Y. A Case Study on Sintering Characteristics of Yttria Stabilized Zirconia Powder Prepared by Two-Fluid Spray Drying. J. Korean Ceram. Soc. 2016, 53, 332–337. [Google Scholar] [CrossRef]
  11. Danh, V.; Akinyemi, O.S.; Taylor, C.E.; Frank, J.T.; Jiang, L. Investigators from University of Louisiana. Effect of Injector Swirl Number on Near-field Spray Characteristics of a Novel Twin-fluid Injector. J. Technol. 2019, 60, 5. [Google Scholar]
  12. Wang, B. Research on the Atomization Mechanism and Cooling Application of Three-Stage Atomizing Nozzles for Gas-Liquid Two-Phase Flow. Master’s Thesis, Qingdao University of Science and Technology, Qingdao, China, 2023. [Google Scholar]
  13. Zhang, S.; Gu, W.; Qiu, B.; Xue, X.; Zhou, L. Design and experiment of a hydraulic lifting wind field test platform for crop protection UAS. Int. J. Agric. Biol. Eng. 2021, 14, 166–174. [Google Scholar] [CrossRef]
  14. Yao, J.; Furusawa, S.; Kawahara, A. Influence of Some Geometrical Parameters on the Characteristics of Prefilming Twin-Fluid Atomization. Trans. Can. Soc. Mech. Eng. 2014, 38, 391–404. [Google Scholar] [CrossRef]
  15. Liu, Y.; Wang, X.; Li, K.; Liu, Y. Numerical Simulation of Jet Interaction Flow Field with Different Flow Rates. J. Phys. Conf. Ser. 2022, 2364, 012065. [Google Scholar] [CrossRef]
  16. Mohammad, N.; Nezameddin, S.A.; Hassan, S.H.; Hamidreza, K. CFD Simulation of Drag-Reducing Fluids in a Non-Newtonian Turbulent Pipe Flow. Chem. Eng. Sci. 2024, 285, 119612. [Google Scholar]
  17. Yan, W. Selection and Application of Three Multiphase Flow Models Based on FLUENT. Yunnan Chem. Ind. 2020, 47, 43–44. [Google Scholar]
  18. Liu, J.; Hussain, Z.; Wang, X.; Li, Y. Optimization and numerical simulation of the internal flow field of water-pesticide integrated microsprinklers. Irrig. Drain. 2023, 72, 328–342. [Google Scholar] [CrossRef]
  19. Alexander, D.W.; Kul, P.; Balan, P.G.; Faik, H. Geometrical Optimization of a Venturi-Type Microbubble Generator Using CFD Simulation and Experimental Measurements. Design 2021, 5, 4. [Google Scholar]
  20. Wu, Y.; Li, H.; Zhao, M. Transient Study of the Internal Flow Field of Air Atomization Nozzles. Automot. Pract. Technol. 2023, 48, 81–84. [Google Scholar]
  21. Ren, W.; Du, Y.; Li, X.; Yuan, R. Design Optimization and Flow Field Analysis of the Nozzle Structure of a Foreign Fiber Sorter. Text. Res. J. 2022, 92, 1987–1998. [Google Scholar] [CrossRef]
  22. Chen, X. Design of Ultrasonic Electrostatic Atomization Nozzles and Experimental Study of Droplet Adhesion on Roots. Master’s Thesis, Jiangsu University, Zhenjiang, China, 2021. [Google Scholar]
  23. Zhou, C. Design and Flow Field Analysis of Axial Nozzles with Adjustable Area for Rocket Engines. Master’s Thesis, Civil Aviation University of China, Tianjin, China, 2014. [Google Scholar]
  24. Fan, X.; Wang, Y.; Wang, X.; Zhang, S. Parameter Design and Simulation of Small Axial Nozzles. J. Liaoning Univ. (Nat. Sci. Ed.) 2023, 50, 146–153. [Google Scholar]
  25. Pang, C.; Huang, H. Design Optimization of Experimental Schemes and Data Analysis; Nanjing Southeast University Press: Nanjing, China, 2018. [Google Scholar]
  26. Levanov, V.A.; Lapina, V.A.; Isaikina, Y.O. Method for Determining the Ozone Mass Transfer Coefficient between the Gas and Liquid Phases in a Bubble Column Reactor. Russ. J. Phys. Chem. A 2024, 98, 1461–1465. [Google Scholar] [CrossRef]
  27. Jiang, Y.; Liu, J.; Li, H.; Hua, L.; Yong, Y. Droplet Distribution Characteristics of Impact Sprinklers with Circular and Noncircular Nozzles: Effect of Nozzle Aspect Ratios and Equivalent Diameters. Biosyst. Eng. 2021, 212, 200–214. [Google Scholar] [CrossRef]
  28. Wu, S.; Liu, J.; Wang, J.; Hao, D.; Wang, R. The Motion of Strawberry Leaves in an Air-Assisted Spray Field and Its Influence on Droplet Deposition. Trans. ASABE 2021, 64, 83–93. [Google Scholar] [CrossRef]
  29. Fujiwara, K.; Fujii, T. Research Note: Effects of Ozonated Water Spray Droplet Size and Distance on the Dissolved Ozone Concentration at the Spray Target. Ozone Sci. Eng. 2004, 26, 511–516. [Google Scholar] [CrossRef]
  30. Appah, S.; Jia, W.; Ou, M.; Wang, P.; Gong, C. Investigation of Optimum Applied Voltage, Liquid Flow Pressure, and Spraying Height for Pesticide Application by Induction Charging. Appl. Eng. Agric. 2019, 35, 795–804. [Google Scholar] [CrossRef]
Figure 1. The structural representation of the multi-fluid swirling mixing atomizer.
Agronomy 15 01082 g001
Figure 2. The key structural parameters. Annotation: Inlet inner diameter (d1); Throat inner diameter (d2); Outlet diameter (d3); Self-priming hole diameter (d4); Water inlet diameter (d5); Ozone inlet diameter (d6); Shrinkage length (L1); Throat length (L2); Diffuser length (L3); Angle of pinching (α); Angle of flare (β). (a) Section view of axial nozzle, (b) Section view of atomizer.
Agronomy 15 01082 g002
Figure 3. Schematic diagram of fluid mass conservation.
Agronomy 15 01082 g003
Figure 4. Flow domain and internal grid drawing of the atomizer. (a) Flow domain, (b) Internal grid drawing.
Agronomy 15 01082 g004
Figure 5. Droplet particle size and concentration of ozonated droplets test system.
Agronomy 15 01082 g005
Figure 6. Static clouds at different inlet pressures. (a) 0.4 Mpa, (b) 0.6 Mpa, (c) 0.8 Mpa.
Agronomy 15 01082 g006
Figure 7. Cloud map of velocity magnitude at different inlet pressures. (a) 0.4 Mpa, (b) 0.6 Mpa, (c) 0.8 MPa.
Agronomy 15 01082 g007
Figure 8. Cloud map of turbulent kinetic energy at different inlet pressures. (a) 0.4 Mpa, (b) 0.6 Mpa, (c) 0.8 MPa.
Agronomy 15 01082 g008
Figure 9. Flow rate and vapor–liquid ratio at different inlet pressures.
Agronomy 15 01082 g009
Figure 10. Particle size distribution of ozonated droplets at different inlet pressures. (a) 0.4 MPa, (b) 0.6 Mpa, (c) 0.8 MPa.
Agronomy 15 01082 g010
Figure 11. The concentration of ozonated droplets at different spray distances and different spray pressures. Annotation: Concentration of ozonized droplets (C), Spray distance (L), Maximum concentration of ozonized droplets (Cmax).
Agronomy 15 01082 g011
Table 1. Key structural parameters of the atomizer.
Key Structure NameParameter
Inlet inner diameter (d1)9 mm, 10 mm, 11 mm
Throat inner diameter (d2)3 mm
Outlet diameter (d3)4.5 mm
Self-priming hole diameter (d4)1.0 mm, 1.5 mm, 2.0 mm
Water inlet diameter (d5)2 mm
Ozone inlet diameter (d6)0.5 mm
Shrinkage length (L1)23 mm
Throat length (L2)2 mm, 3 mm, 4 mm
Diffuser length (L3)9 mm
Angle of pinching (α)15°
Angle of flare (β)10°
Table 2. Two-phase flow parameters.
Air
Density
(kg·m−3)
Air
Viscosity
(Pa·s)
Water
Density
(kg·m−3)
Water
Viscosity
(Pa·s)
Ozone
Density
(kg·m−3)
Ozone
Viscosity
(Pa·s)
Surface
Tension
(N·m−1)
1.2250.001997.31.789 × 10−52.141.332 × 10−70.0728
Table 3. Orthogonal test factor level table.
FactorInlet Inner Diameter (mm)Throat Length (mm)Self-Priming Hole Diameter (mm)
Level
1921
21031.5
31142
Table 4. Orthogonal test table.
FactorABCEmpty ColumnEvaluation Indicators
Inlet Inner DiameterThroat LengthSelf-Priming Hole DiametereNegative Pressure
Sequence (mm)(mm)(mm) (Mpa)
11 (9.0)1 (2.0)1 (1.0)1**
21 (9.0)2 (3.0)2 (1.5)2**
31 (9.0)3 (4.0)3 (2.0)3**
42 (10.0)1 (2.0)2 (1.5)3**
52 (10.0)2 (3.0)3 (2.0)1**
62 (10.0)3 (4.0)1 (1.0)2**
73 (11.0)1 (2.0)3 (2.0)2**
83 (11.0)2 (3.0)1 (1.0)3**
93 (11.0)3 (4.0)2 (1.5)1**
‘**’ is the value to be tested.
Table 5. Range analysis of orthogonal test results.
FactorABCEmptyEvaluation Indicators
SequenceInlet Inner Diameter
(mm)
Throat Length
(mm)
Self-Priming Hole Diameter
(mm)
eNegative Pressure
(Mpa)
11(9.0)1(2.0)1(1.0)1−0.334
21(9.0)2(3.0)2(1.5)2−0.423
31(9.0)3(4.0)3(2.0)3−0.379
42(10.0)1(2.0)2(1.5)3−0.316
52(10.0)2(3.0)3(2.0)1−0.364
62(10.0)3(4.0)1(1.0)2−0.348
73(11.0)1(2.0)3(2.0)2−0.315
83(11.0)2(3.0)1(1.0)3−0.361
93(11.0)3(4.0)2(1.5)1−0.338
K1n−1.136−0.965−1.043−1.036−3.178
K2n−1.028−1.148−1.077−1.086
K3n−1.014−1.065−1.058−1.056
K1n/N−0.379−0.322−0.348−0.345
K2n/N−0.343−0.383−0.359−0.362
K3n/N−0.338−0.355−0.353−0.352
Range0.0410.0610.0110.017
Disclaimer/Publisher’s Note: The statements, opinions and data contained in all publications are solely those of the individual author(s) and contributor(s) and not of MDPI and/or the editor(s). MDPI and/or the editor(s) disclaim responsibility for any injury to people or property resulting from any ideas, methods, instructions or products referred to in the content.

