Article

Phylogenetic Diversity and Quantitative PCR Detection of Erwinia amylovora in Xinjiang, China

1
College of Plant Protection, Northeast Agricultural University, Harbin 150030, China
2
State Key Laboratory for Biology of Plant Diseases and Insect Pests, Institute of Plant Protection, Chinese Academy of Agricultural Sciences, Beijing 100193, China
3
College of Life Sciences, Jilin Normal University, Siping 136000, China
4
Institute of Plant Protection, Xinjiang Academy of Agricultural Sciences, Urumqi 830091, China
5
College of Plant Protection, Shenyang Agricultural University, Shenyang 110866, China
*
Authors to whom correspondence should be addressed.
Agronomy 2025, 15(5), 1065; https://doi.org/10.3390/agronomy15051065
Submission received: 16 January 2025 / Revised: 22 April 2025 / Accepted: 25 April 2025 / Published: 27 April 2025
(This article belongs to the Section Pest and Disease Management)

Abstract

:
Fire blight, a devastating bacterial disease affecting Rosaceae plants, particularly pear and apple, has recently emerged in China’s Xinjiang Uyghur Autonomous Region, causing significant damage to the local Pyrus sinkiangensis industry. Phylogenetic analysis of identified Erwinia amylovora strains revealed that all eight Xinjiang isolates belonged to the A-genotype in CRR1 genotyping tests, aligning with findings from 53 strains isolated in Kazakhstan and Kyrgyzstan between 2011 and 2019. A quantitative PCR detection system based on the trp gene sequence was developed and optimized. The system performed optimally with primer concentrations of 200 nmol/L and an annealing temperature of 60 °C. The detection limits were established at 102 CFU/mL for bacterial suspensions and 0.05 pg/µL for bacterial DNA, demonstrating 100-fold greater sensitivity than conventional PCR. The system successfully detected E. amylovora in all 31 tested samples (25 symptomatic and six asymptomatic plant tissues), confirming the reliability of the detection method for pear fire blight.

1. Introduction

Pyrus sinkiangensis Yü, a commercially important species within the Rosaceae family’s Pyrus genus, produces over 1.5 million tons annually and serves as the cornerstone of the horticultural economy in China’s Xinjiang Uyghur Autonomous Region [1]. In addition to their excellent flavor, pears have long been acknowledged in traditional Chinese medicine for their diverse pharmacological effects, including soothing the intestines, relieving coughs, and eliminating phlegm [2]. Recent fire blight outbreaks have severely impacted P. sinkiangensis cultivation, causing branch dieback, blossom rot, and whole-tree mortality, particularly devastating the pear industry in Bayingolin Mongolian Autonomous Prefecture. The causative pathogen, Erwinia amylovora, has historically inflicted substantial economic losses on apple and pear industries worldwide, notably in the northwestern USA, Lebanon, and Italy [3,4,5]. Erwinia amylovora can proliferate and spread rapidly under favorable conditions [6], and global trade has facilitated its spread worldwide across North America, Europe, North Africa, the Middle East, Oceania, and Asia [3,6,7,8]. In Central/East Asia, the pathogen has been documented in Kyrgyzstan, Kazakhstan, and South Korea [8,9,10,11,12]. In China, fire blight was first identified in Xinjiang’s Ili Prefecture in May 2016 and subsequently spread to Gansu Province’s Zhangye and Wuwei regions in 2020, posing a significant threat to national fruit production [13].
Erwinia amylovora, the first bacterium identified to cause disease in plants, is a Gram-negative bacterium that infects the Rosaceae host through flowers, shoots, or wounds, and then spreads through the xylem to infect the whole plant systematically [3,14]. After infection, the flowers, fruits, leaves, and twigs turn brown and form dead spots, as if they had been burned by fire, but they still hang on the tree [3,15]. Current disease management strategies employing copper compounds, antimicrobial agents, and biological controls demonstrate limited efficacy in fire blight eradication, constrained by treatment inefficacy, emerging antibiotic tolerance, and ecological considerations [6,16]. Epidemiological investigations reveal that pathogen dissemination correlates strongly with high-risk nursery stock imports from endemic zones and compromised phytosanitary surveillance systems, as evidenced by multinational case studies [8,15].
Considering the significant impact of fire blight on pear and apple production, it is important to investigate the genetic background and diversity of the pathogen to better understand the spread and evolution of the pathogen [17]. As of April 2025, 268 assembled E. amylovora genomes at different levels are publicly available in NCBI Datasets. The genome size of E. amylovora (<4 Mb) is relatively small compared to other plant pathogenic bacteria such as Xanthomonas spp. (average 4.9–5.2 Mb) [3]. Regarding the genotyping of strains, E. amylovora has been divided into three subclasses: the Amygdaloideae-infecting (AI) group, whose strains predominantly infect apple and pear trees and can be further subdivided into the Widely Prevalent clade, the Eastern N.A. clade, and the Western N.A. clade; the Rubus-infecting (RI) group, which exhibits greater genetic diversity than strains in the AI superclade; and the B-group, strains of which show limited sequence identity to those in either the AI or RI group [3,6,18]. As most E. amylovora strains belong to the AI group, with a genetic similarity > 99.7%, it is difficult to investigate its genetic diversity [3,8,18]. While traditional methods such as rep-PCR fingerprinting [19], random amplified polymorphic DNA fragment (RAPD) analysis [20], amplified fragment length polymorphism (AFLP) analysis [19], pulsed field gel electrophoresis (PFGE) [21], SNP analysis [22], variable number of tandem repeats (VNTR) analysis [23], and whole-genome sequencing (WGS) [24] have been employed, recent studies increasingly utilize characterization of spacers in CRISPR repeat regions (CRR) as a robust tool for diversity analysis [3,6,8,16]. Kurz et al. [25] developed a PCR-based method distinguishing A- and D-genotypes through CRR1 CRISPR spacer analysis. Their study of 582 Eurasian E. amylovora isolates revealed two independent pathogen introduction events approximately 20 years ago, with primary spread originating from northeastern Europe and the Eastern Mediterranean Basin.
Studies on the genetic diversity of E. amylovora in China remain limited. In 2023, we first reported the genome of E. amylovora isolate in China [26]. Recently, Gong et al. [9] and Wang et al. [17] conducted comparative genomic analyses of some Chinese isolates with those from Central Asia (e.g., Kyrgyzstan and Kazakhstan) and other global regions. The findings led to preliminary speculation that fire blight may have been introduced to China via Central Asia, potentially originating from the Middle East and entering through Xinjiang [9,17].
Given the recent emergence of fire blight in China, early detection and monitoring are crucial for controlling its spread and minimizing its impact on the fruit industry. Current detection methods include selective media approaches such as CCT medium [27] and MS medium [28]; immunological techniques including indirect ELISA [29], membrane immunoassay (IIM), indirect immunofluorescence staining, and co-agglutination detection [30]; and molecular methods such as PCR detection using plasmid pEA29 sequences [31], quantitative PCR (qPCR), and PMA-qPCR [32].
In this study, we aim to construct a phylogenetic tree using housekeeping gene sequences from eight Xinjiang isolates, analyze their genotypes in comparison with international strains, and improve a rapid qPCR detection system to enhance monitoring and prevent further disease spread.

2. Materials and Methods

2.1. Strains and Culture Conditions

E. amylovora isolates were obtained from the Institute of Plant Protection, Xinjiang Academy of Agricultural Sciences, with additional strains sourced from internal laboratory collection (Table 1). All bacterial strains were cultured in LB medium (5 g tryptone, 2.5 g yeast extract, and 15 g NaCl, brought to 1 L with ddH2O, pH 7.0). Escherichia coli isolates were incubated at 37 °C, while all other strains were maintained at 28 °C.

2.2. Genetic Diversity Analysis of E. amylovora in Xinjiang

After pathogenicity and 16S r-DNA sequences analysis, E. amylovora isolate 99east-3-1, for which we had previously completed whole-genome sequencing, was selected as representative of eight Xinjiang isolates. The strains used in this experiment are listed in Supplementary Table S1, and the sequences of these strains were obtained from the NCBI database. Following whole-genome sequencing (NCBI accession number NZ_CP11754.1) [25], protein prediction was performed using Prodigal (V2.6.3), and orthologous single-copy genes were identified using OrthoFinder (V2.5.4). Multiple sequence alignment was conducted using MAFFT (V7.310), followed by sequence concatenation using Linux commands. Phylogenetic analysis was performed using IQ-TREE (V2.0.3) to establish taxonomic relationships between isolate 99east-3-1, closely related species, and common plant pathogens. Trees were constructed using the JTT DCMut+F+R4 model with maximum likelihood methods and 1000 ultrabootstrap replicates. A second phylogenetic analysis comparing isolate 99east-3-1 with 20 E. amylovora isolates from various countries was conducted using the JTT+F+R4 model under the same parameters.

2.3. Determination of the CRR1 Genotype by PCR

CRR1 genotyping of eight Xinjiang E. amylovora isolates was performed using specific primers C1f04/C1r09 (Table S2) [25]. PCR reactions (25 μL) contained 12.5 μL 2× PCR mix (KT201, TIANGEN, Beijing, China), 0.5 μL each primer (10 μM, synthesized by BGI Genomics Co., Ltd., Beijing, China), 1.0 μL template (108 CFU/mL total DNA), and 10.5 μL ddH2O. Amplification was conducted using a T100 thermal cycler (BIO-RAD, Hercules, CA, USA) with the following conditions: initial denaturation at 95 °C for 3 min; 35 cycles of 95 °C for 30 s, 60 °C for 30 s, and 72 °C for 30 s; final extension at 72 °C for 5 min. Products were analyzed by electrophoresis (100 V, 45 min) using a gel analysis system (BIO-RAD, Hercules, CA, USA) and confirmed by sequencing.

2.4. Development of qPCR Detection System

2.4.1. Primer Design

To construct the specific detection system, genomic sequences of strains from different genera and from those belonging to the same genus but distinct species were selected as references. The selected reference strains were identical to those listed in Table 1 and Table S1. Species-specific primers were designed using Primer 5.0 software, targeting conserved genes (100% homology) identified through inter- and intra-species genome BLAST alignment. Primers were synthesized by BGI Genomics Co., Ltd. (Beijing, China).

2.4.2. Specificity of the Primers

To validate the specificity of the designed primers, the eight E. amylovora isolates in this study, six E. amylovora strains donated by the Plant Protection Institute of Xinjiang Academy of Agricultural Sciences, and 15 non-E. amylovora strains (including phylogenetically proximal strains from distinct species within the same genus) comprising phylogenetically related species were used in this assay (Table 1). All the 29 strains were cultured on LB plates at 28 °C/37 °C for 48 h. Single colonies were grown in 5 mL LB broth to OD600 0.3. PCR reactions (25 μL) contained 12.5 μL 2× Taq PCR mix (TIANGEN, Beijing, China), 1.0 μL each primer (10 μM), 1.0 μL template, and 9.5 μL ddH2O. Amplification conditions matched those described in Section 2.3.

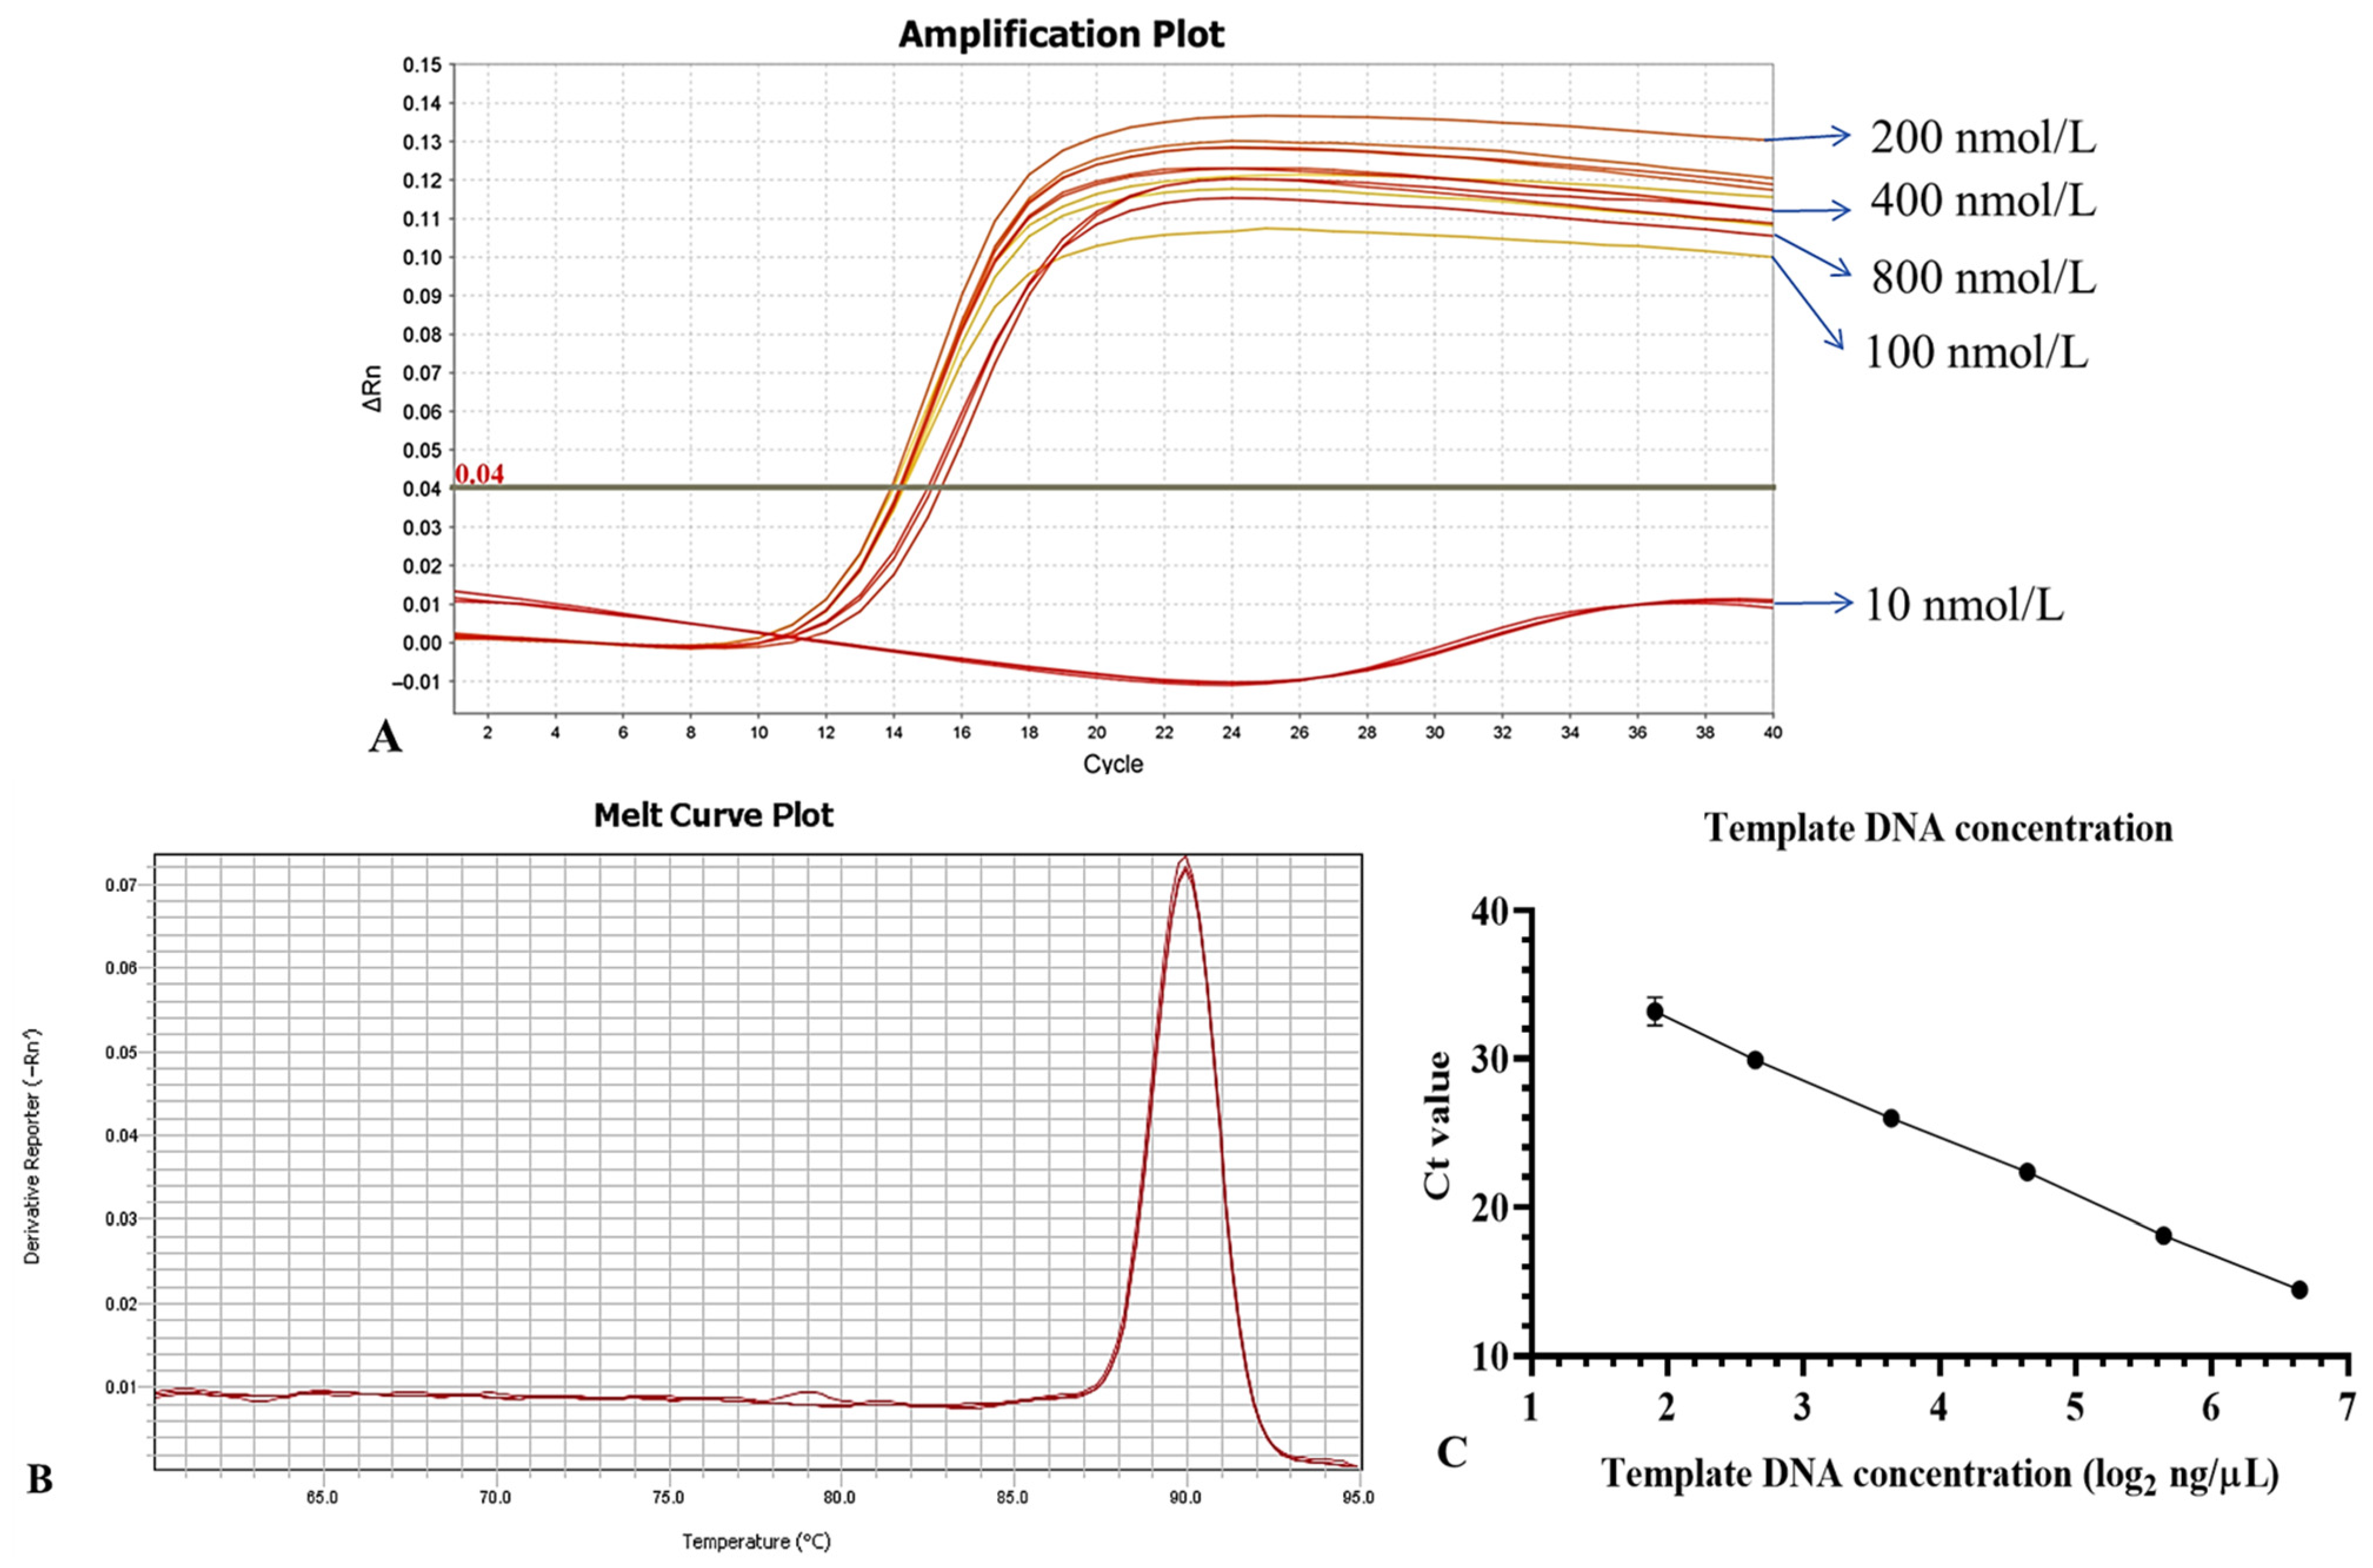
2.4.3. Optimization of Primer Concentration

Using DNA of E. amylovora strains as a template, qPCR was performed at five primer concentrations (10 nmol/L, 100 nmol/L, 200 nmol/L, 400 nmol/L, and 800 nmol/L), and the amplification results and melting curves were analyzed.

2.4.4. Optimization of Annealing Temperature

The annealing temperature was set at 56–63 °C, and qPCR was performed to verify annealing temperature effect on the fluorescence signal. The temperature of the melting curve with a relatively small Ct value and a single peak was chosen as the optimal annealing temperature.

2.4.5. Standard Curve of Quantitative PCR

Standard curves were constructed using serial 10-fold dilutions of E. amylovora DNA (50 ng/µL, 5 ng/µL, 0.5 ng/µL, 50 pg/µL, 5 pg/µL, and 0.5 pg/µL). The Ct value and log2 DNA concentration were used to construct standard curves.

2.5. Evaluation of Primer Sensitivity

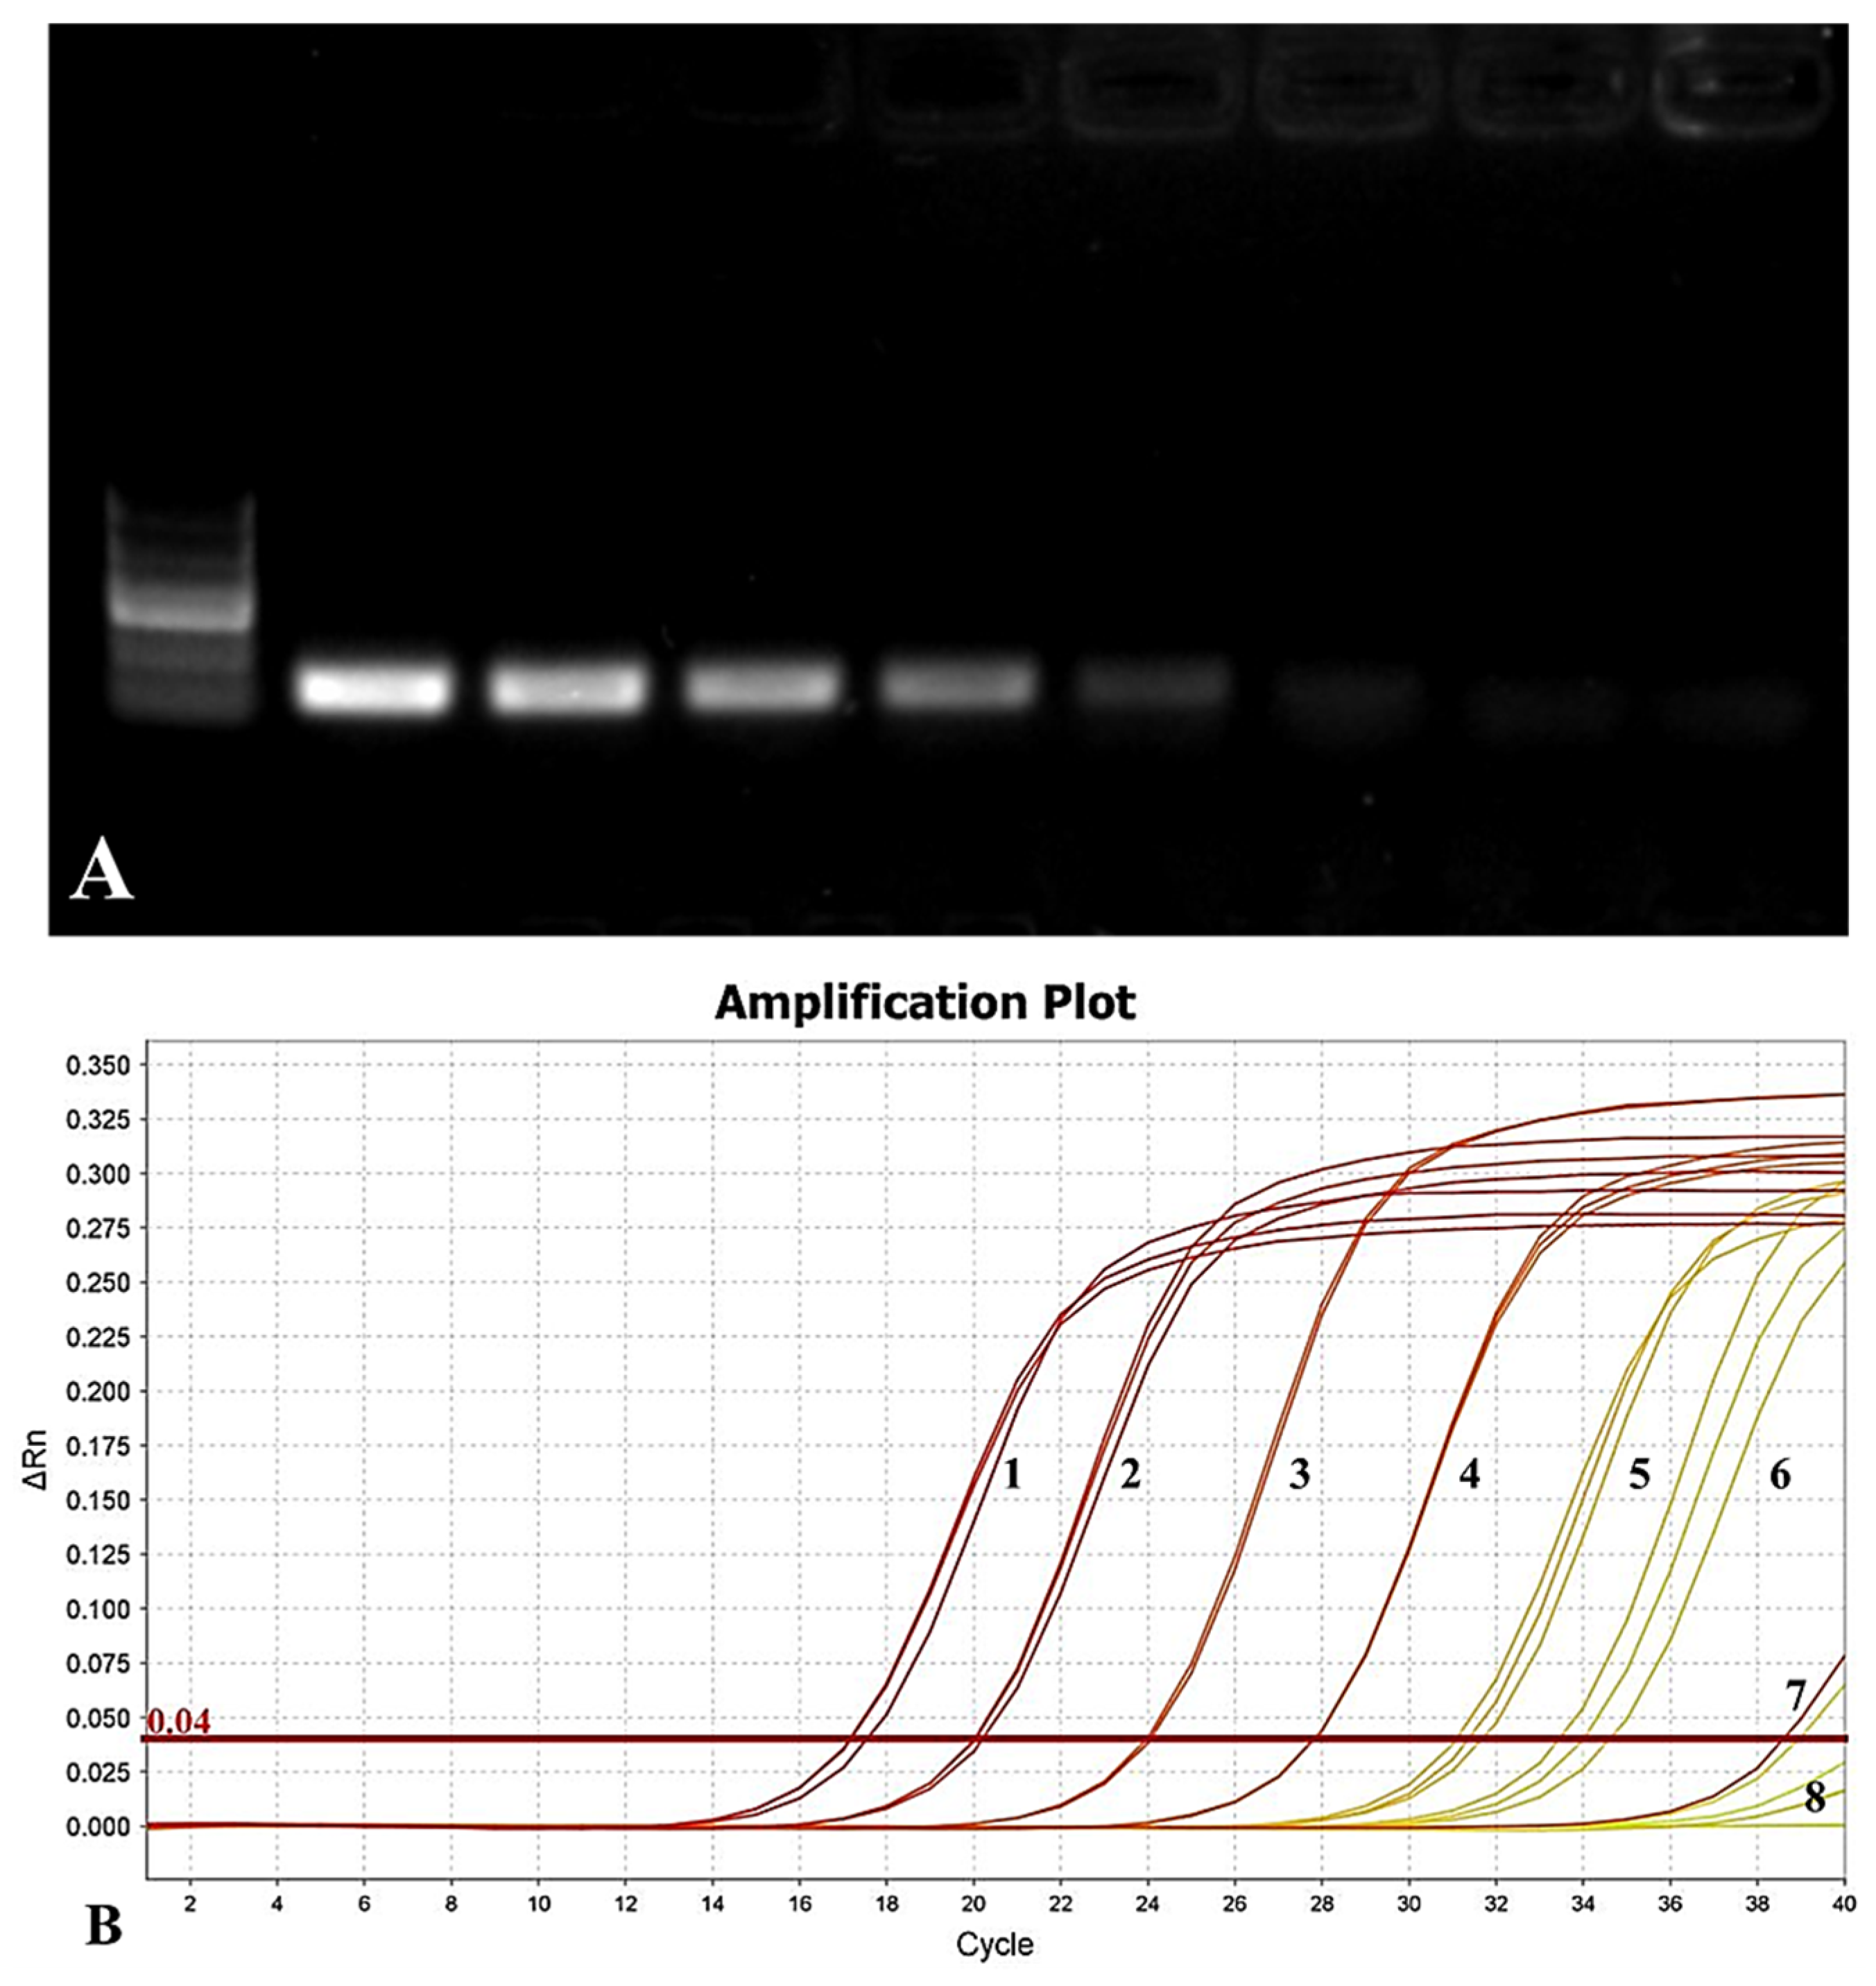
2.5.1. Sensitivity of the Primers in PCR

Sensitivity detection was conducted using bacterial suspensions (10–108 CFU/mL) and DNA preparations (50 ng/µL to 0.005 pg/µL) from the isolate 99east-3-1. DNA was extracted using a bacterial DNA extraction kit (TianGen, Beijing, China). The PCR conditions were the same as in Section 2.4.

2.5.2. qPCR Sensitivity

qPCR reactions (25 μL) contained 12.5 μL 2× SuperReal PreMix Plus (TIANGEN), 0.5 μL each primer, 1 μL template, and 0.5 μL 50× ROX Dye (SuperReal PreMix Plus SYBR Green Kit, FP205; TianGen, Beijing, China). Amplification conditions were 95 °C for 15 min, followed by 40 cycles of 95 °C for 10 s and 60 °C for 20 s [33].

2.6. qPCR Detection of Pear Tissues Infected by Fire Blight Pathogen

Total DNA was extracted from fresh infected leaf tissues. One hundred milligrams of each leaf sample was treated with liquid nitrogen and ground, with DNA extracted using a Plant Genomic DNA Extraction Kit (DP305, TIANGEN, Beijing, China).
Infected branches or leaves were surface disinfected with 75% alcohol for 5 min, washed three times with sterile water, cut into 1 cm2 pieces, and placed in a centrifuge tube with 300 µL of sterile water. Then, the mix was ground thoroughly. The supernatant was used as a qPCR template. The qPCR protocol is the same as in Section 2.5.2.
All experiments above were conducted with a minimum of three biological replicates to ensure the reliability of the results.

3. Results

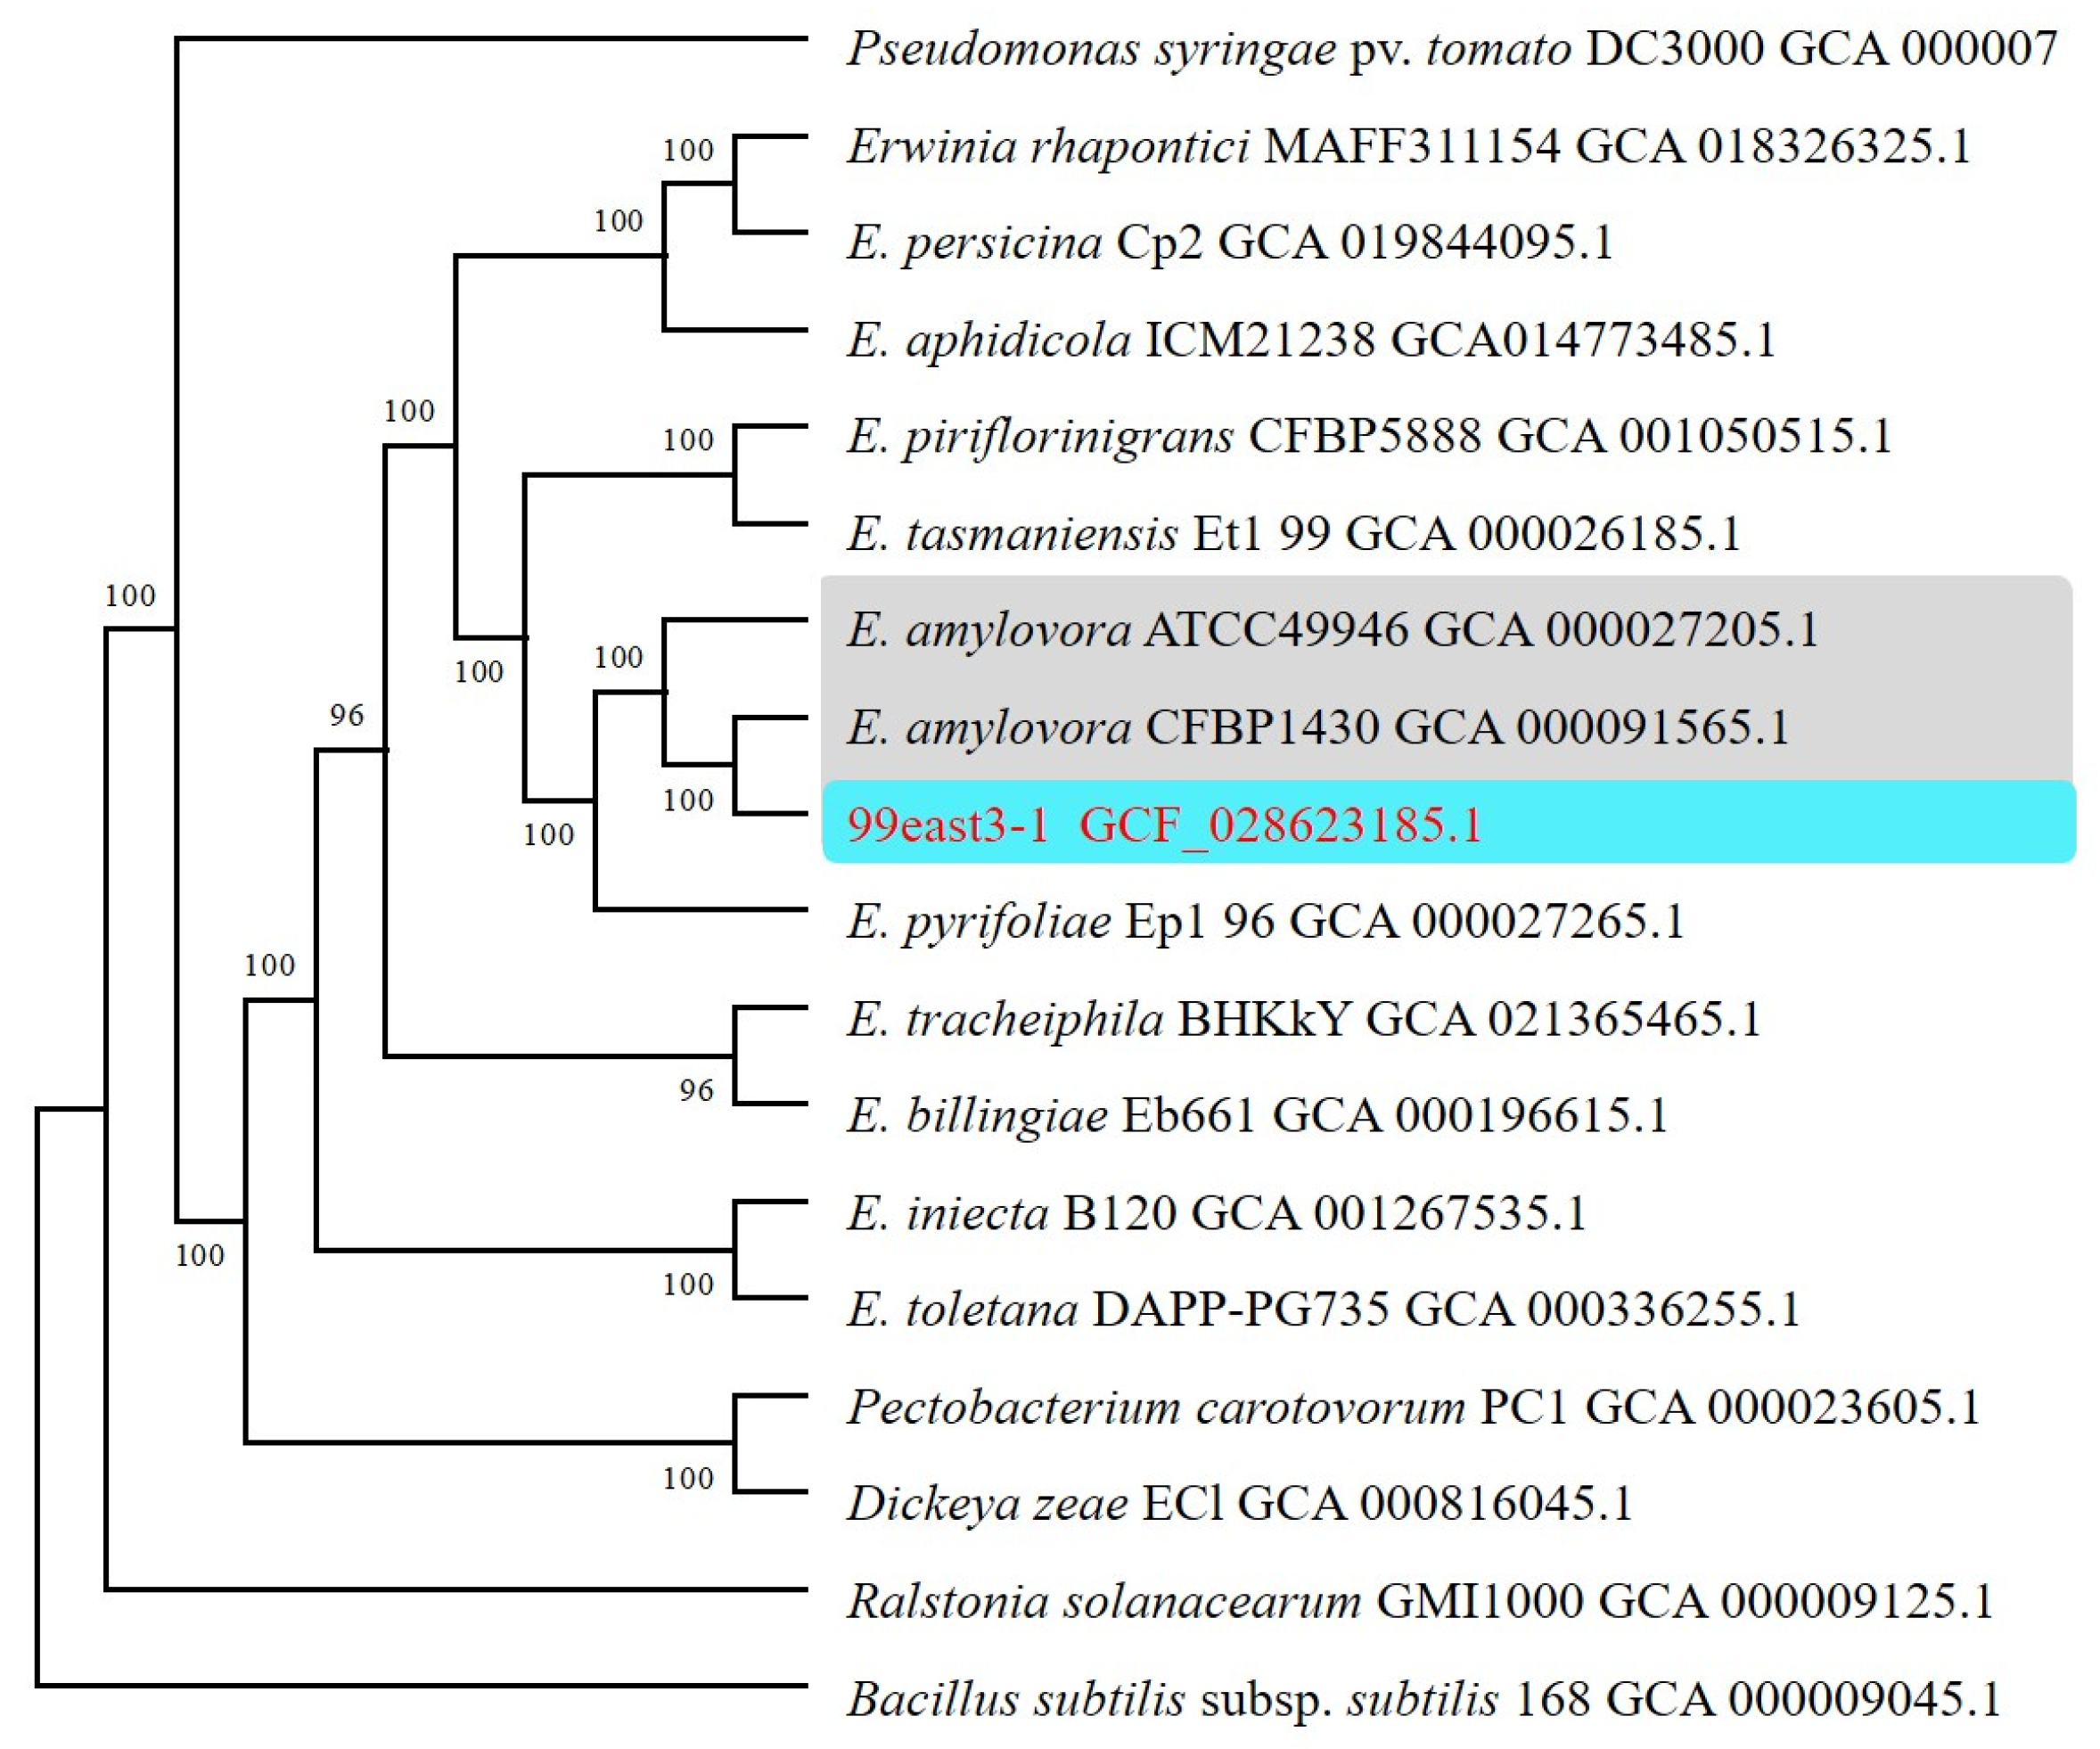
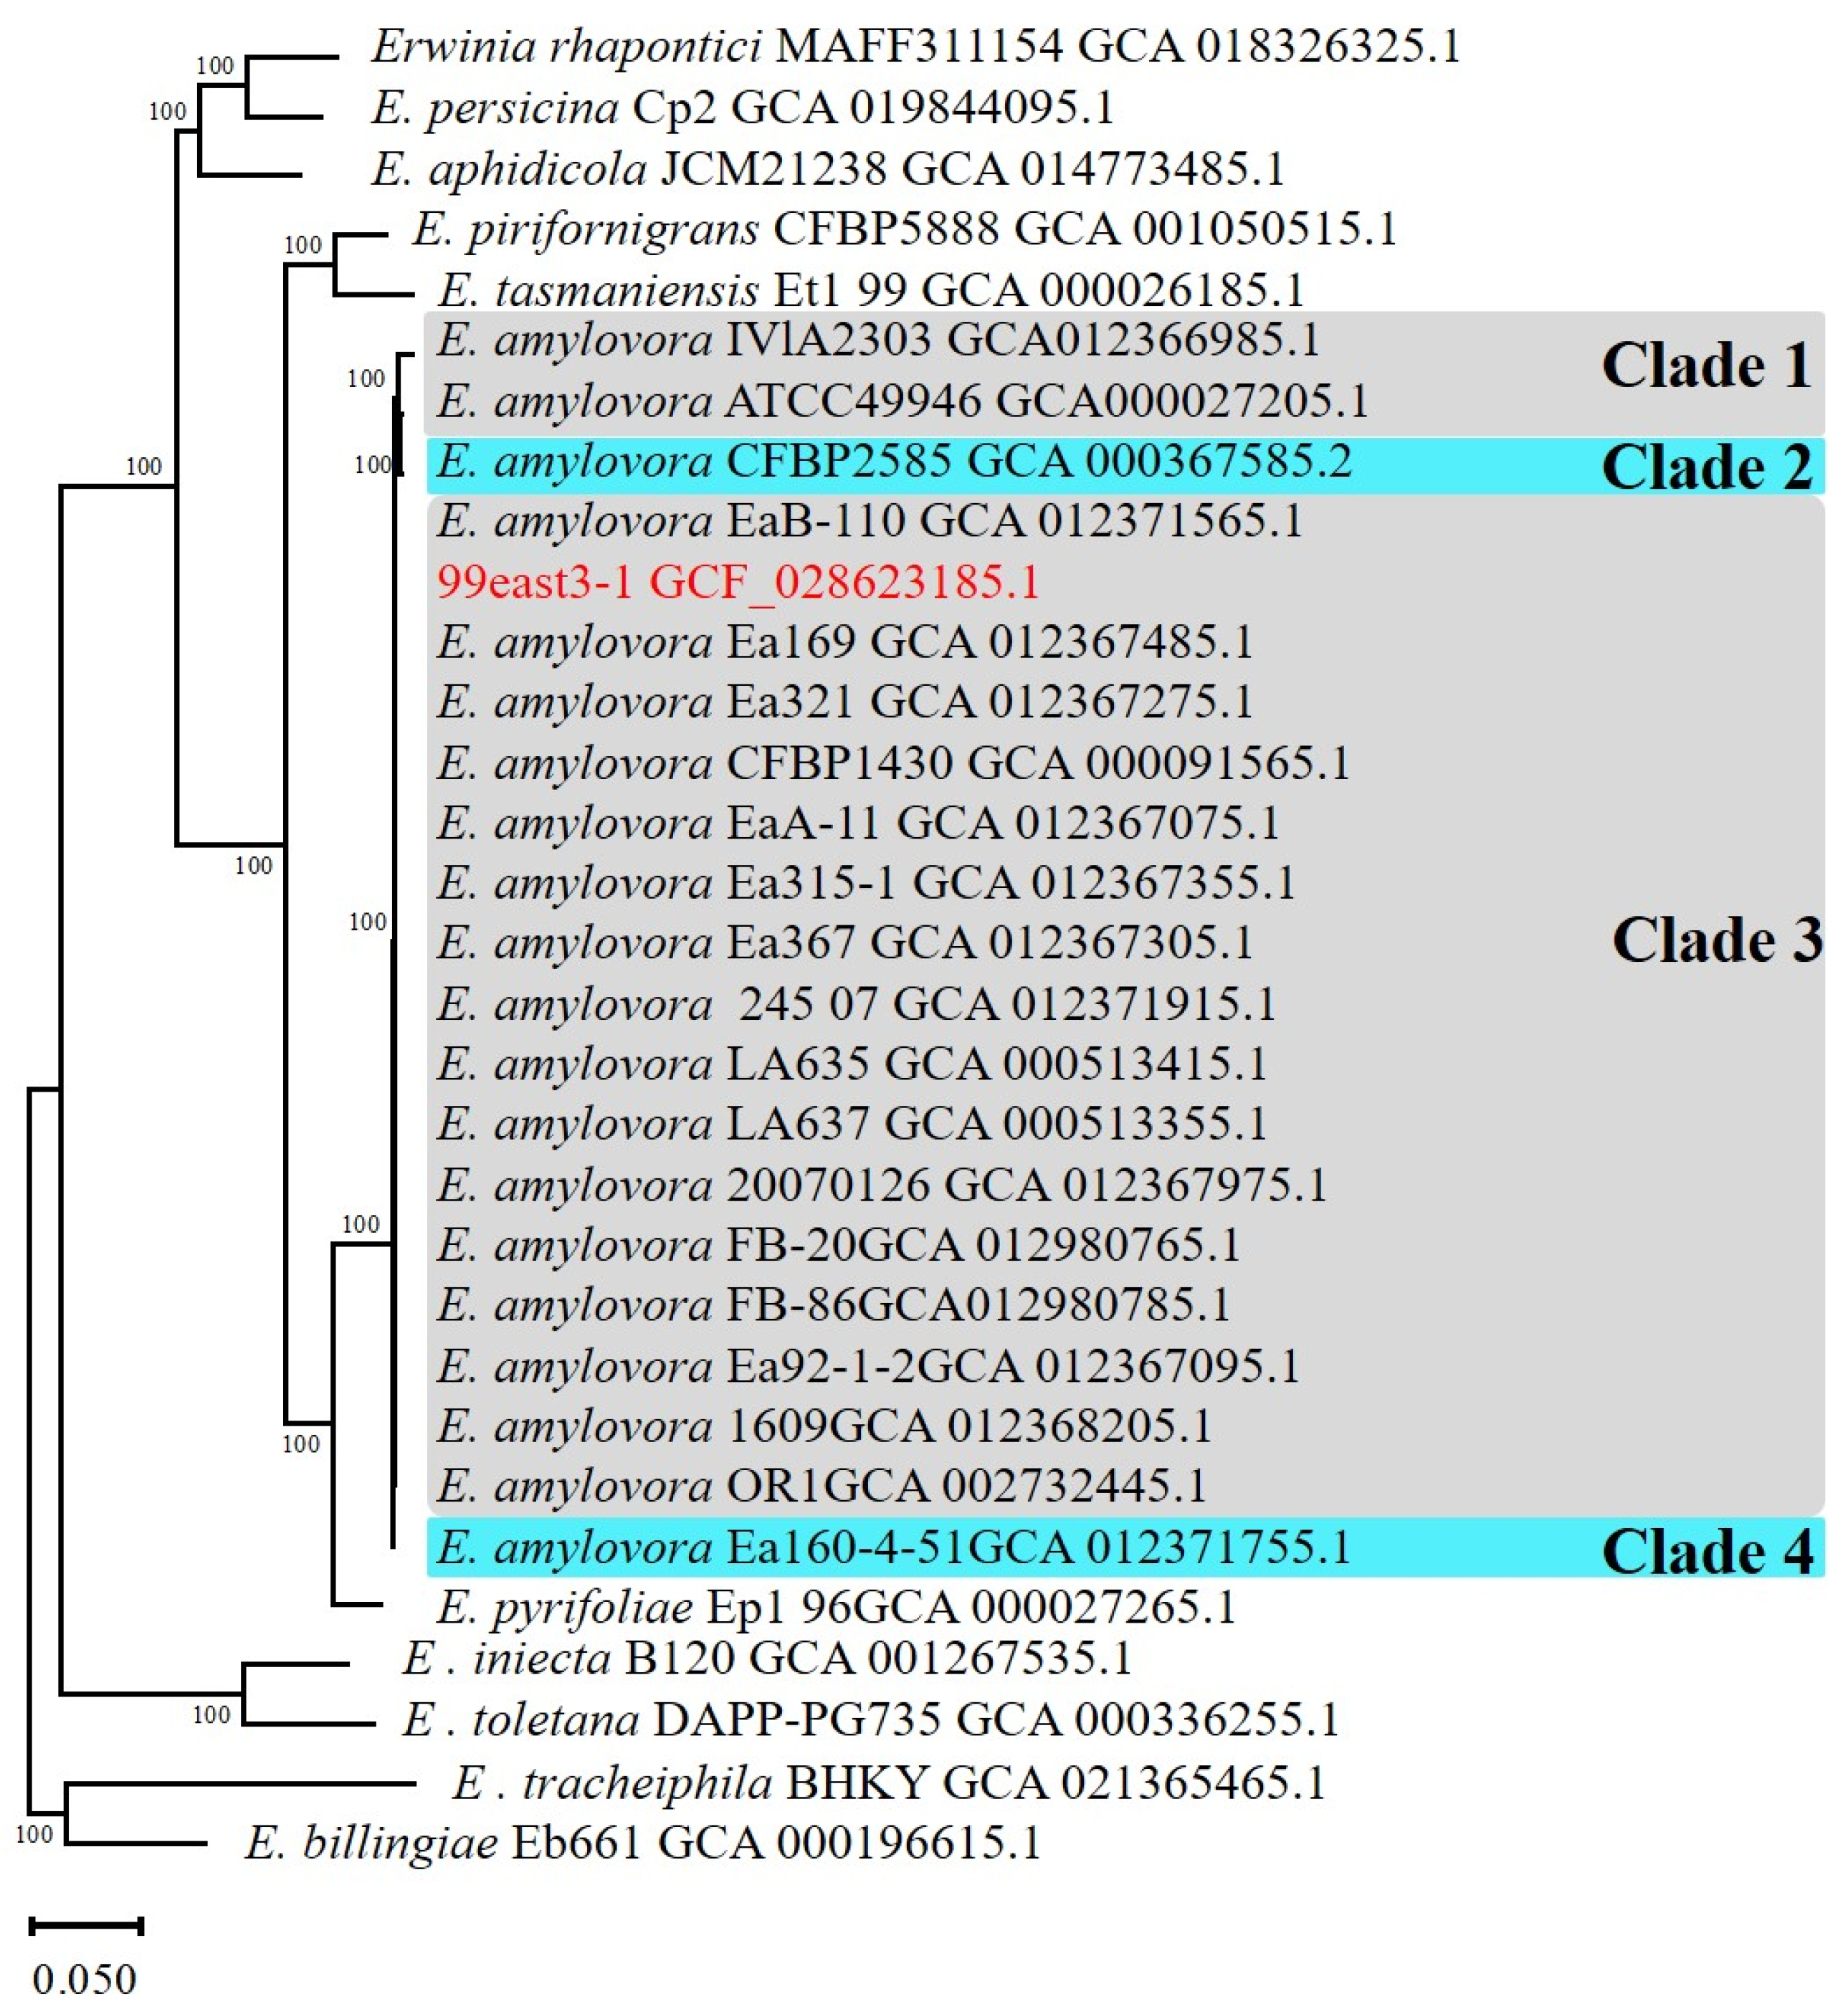
3.1. Phylogenetic Analysis

The phylogenetic analysis of E. amylovora strains and related species isolates revealed that the representative isolate 99east-3-1 clustered with other E. amylovora isolates (Table S1). It was positioned on distinct branches from Pectobacterium carotovorum subsp. carotovorum, Dickeya zeae, and other plant pathogens such as Ralstonia solanacearum and Pseudomonas syringae pv. tomato (Figure 1).
Analysis of intraspecific genetic diversity revealed that the 21 tested E. amylovora strains formed four distinct clades. Isolate ATCC49946 that from USA and isolate CFBP1430 which isolated from France were grouped into clades I and III, respectively. Similarly to the isolate CFBP1430 isolated from France, strain 99east-3-1 belonged to clade III, which contained the largest number of strains, including isolates from Asia, Europe, America, and Oceania. Clades II and IV were each represented by a single strain from Spain (Europe) and Canada (North America), respectively. No direct correlation was observed between clade distribution and geographic origin (Figure 2).

3.2. CRR1 Genotypes of E. amylovora Isolated from Xinjiang

Species-specific primers (C1f04/C1r09) [25] were used to perform PCR amplification on eight E. amylovora isolates from Xinjiang. All isolates produced a 276 bp PCR product (Figure 3), indicating that the Xinjiang isolates belong to the A-genotype.

3.3. Design of Specific Primers

Based on genome alignment results, the trp gene sequence (located at genome positions 1990481–1991214) was selected for primer design due to its conservation within the species and divergence from related species (strains in Table 1 and Table S1). The primers designated were EatrpF/EatrpR (EatrpF: 5′-CCAGTCTTCCGCTCAGACAT-3′; EatrpR:5′-CCACGGCAGAACCTGAGATA-3′).

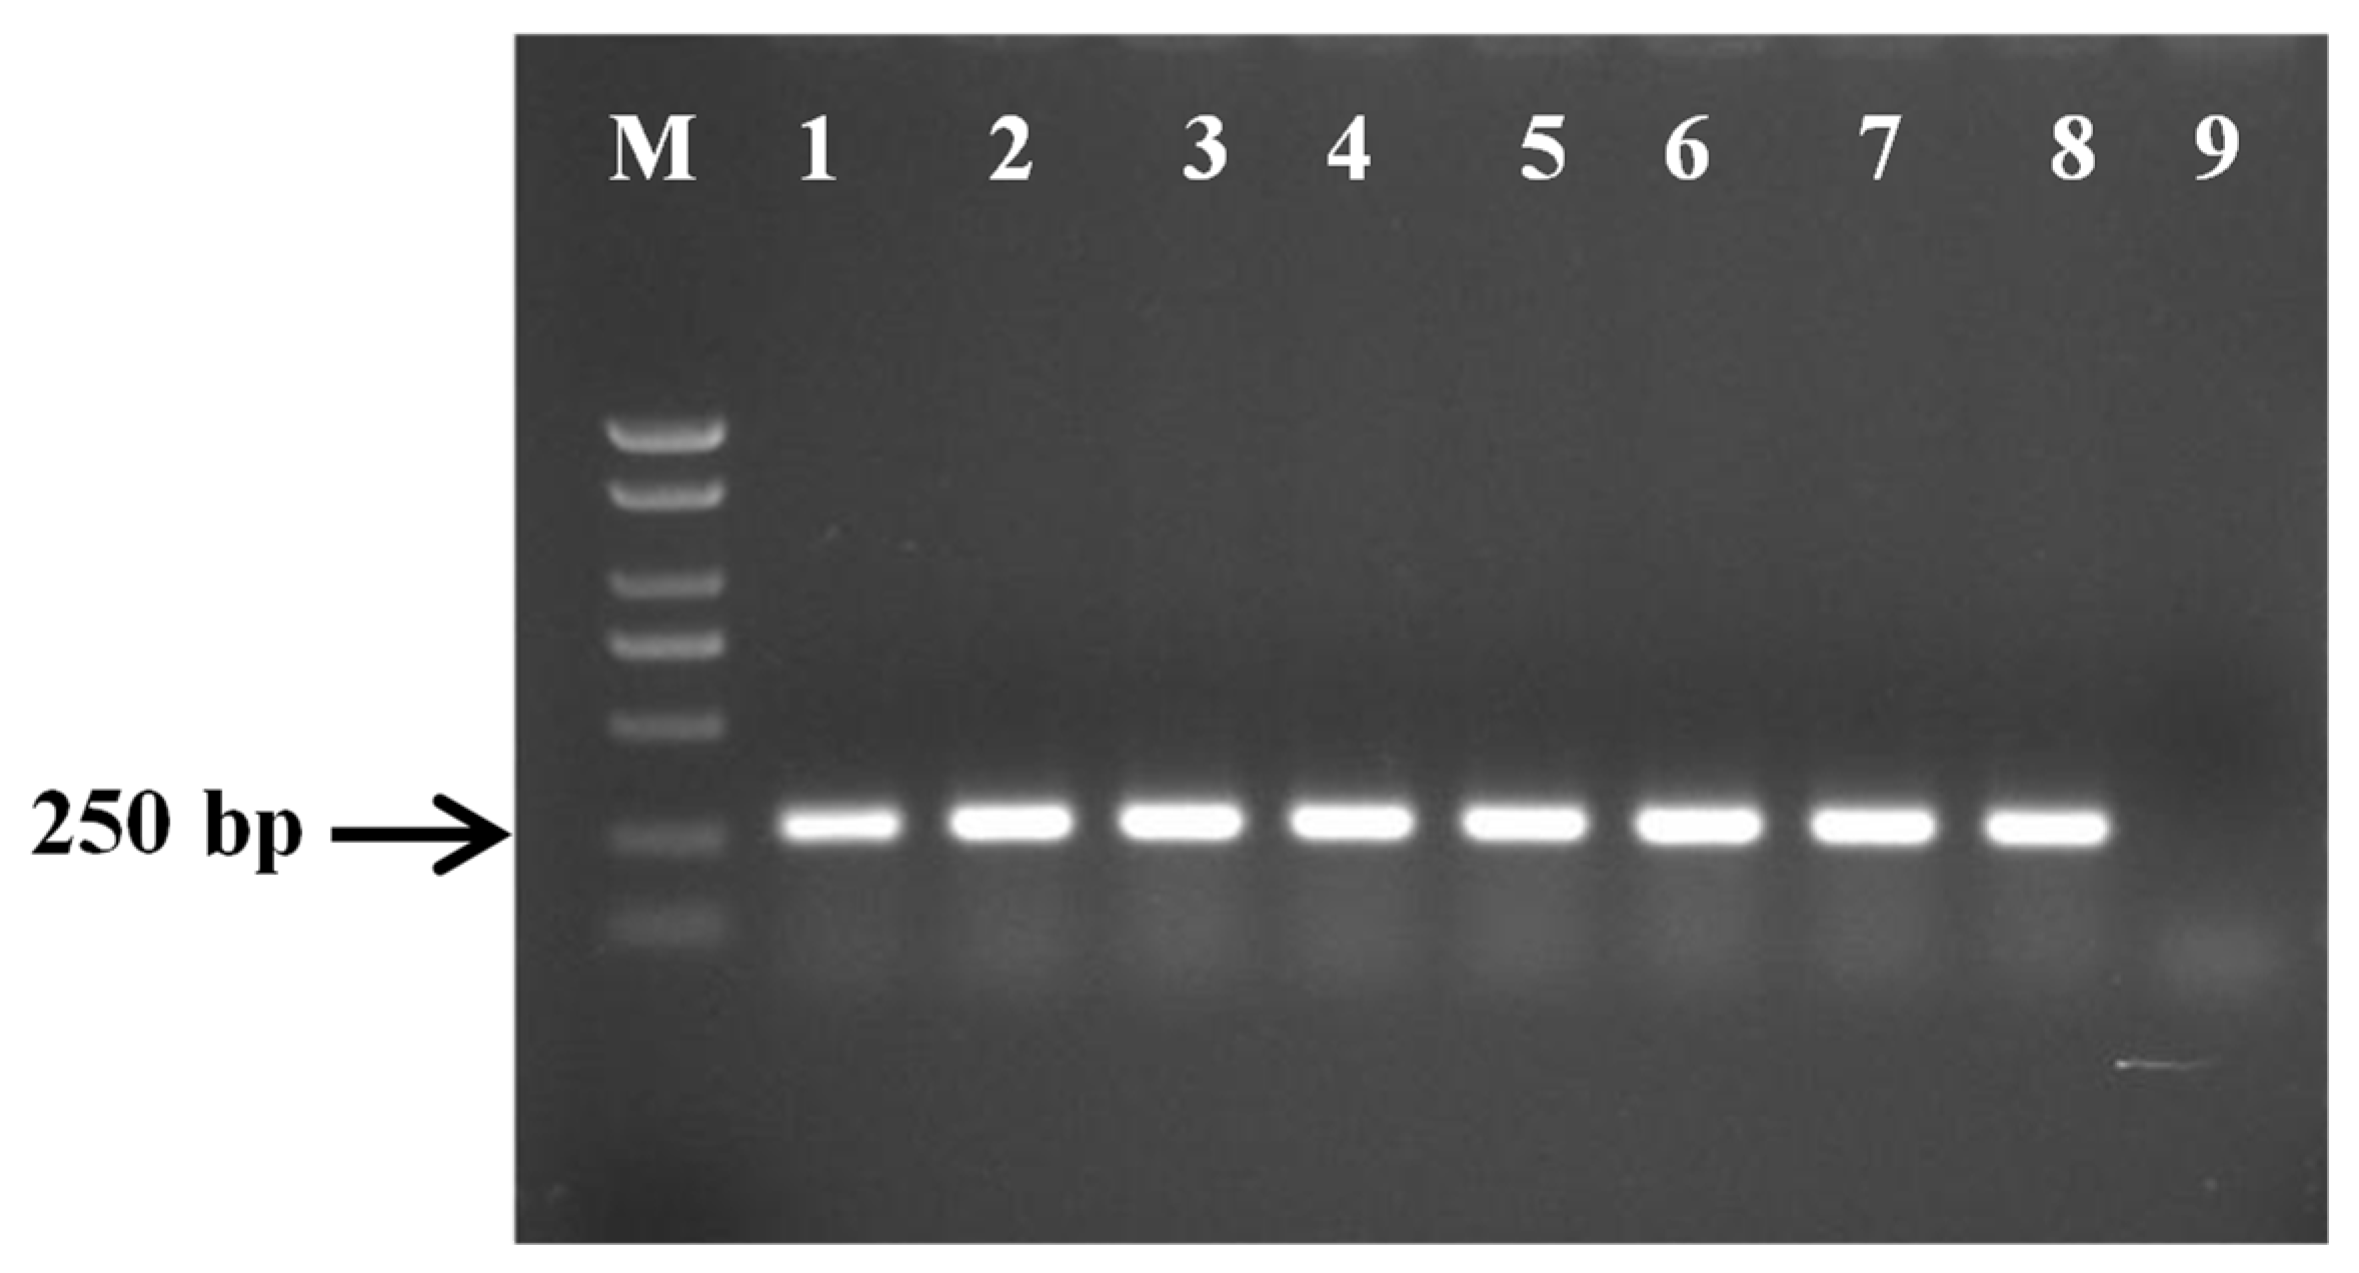
3.4. Specificity of PCR Primer

Fourteen E. amylovora isolates and 15 non-E. amylovora strains (Table 1 and Table S1) were tested using PCR and qPCR with the EatrpF/R primers. As shown in Figure 4 and Figure S1, all E. amylovora isolates produced a 147 bp amplicon, while no amplification was observed for 15 non-E. amylovora isolates, confirming the specificity of the primers.

3.5. Optimization of the qPCR Detection System

The qPCR experiments were conducted to determine optimal primer concentrations and annealing temperatures. Fluorescence signals were not detectable at 10 nmol/L but were observed at concentrations of 100 nmol/L, 200 nmol/L, 400 nmol/L, and 800 nmol/L, with peak fluorescence intensity and minimal Ct values occurring at 200 nmol/L (Figure 5A).
Annealing temperatures ranging from 58 to 63 °C were tested, with optimal performance at 60 °C, as indicated by the melt curve analysis (Figure 5B).
A standard curve was generated using a primer concentration of 200 nmol/L and an annealing temperature of 60 °C, demonstrating a strong linear relationship between DNA concentration and Ct value (y = 40.48 − 3.934x, R2 = 0.9966) (Figure 5C). These results confirm the qPCR system’s suitability for detecting E. amylovora in subsequent experiments.

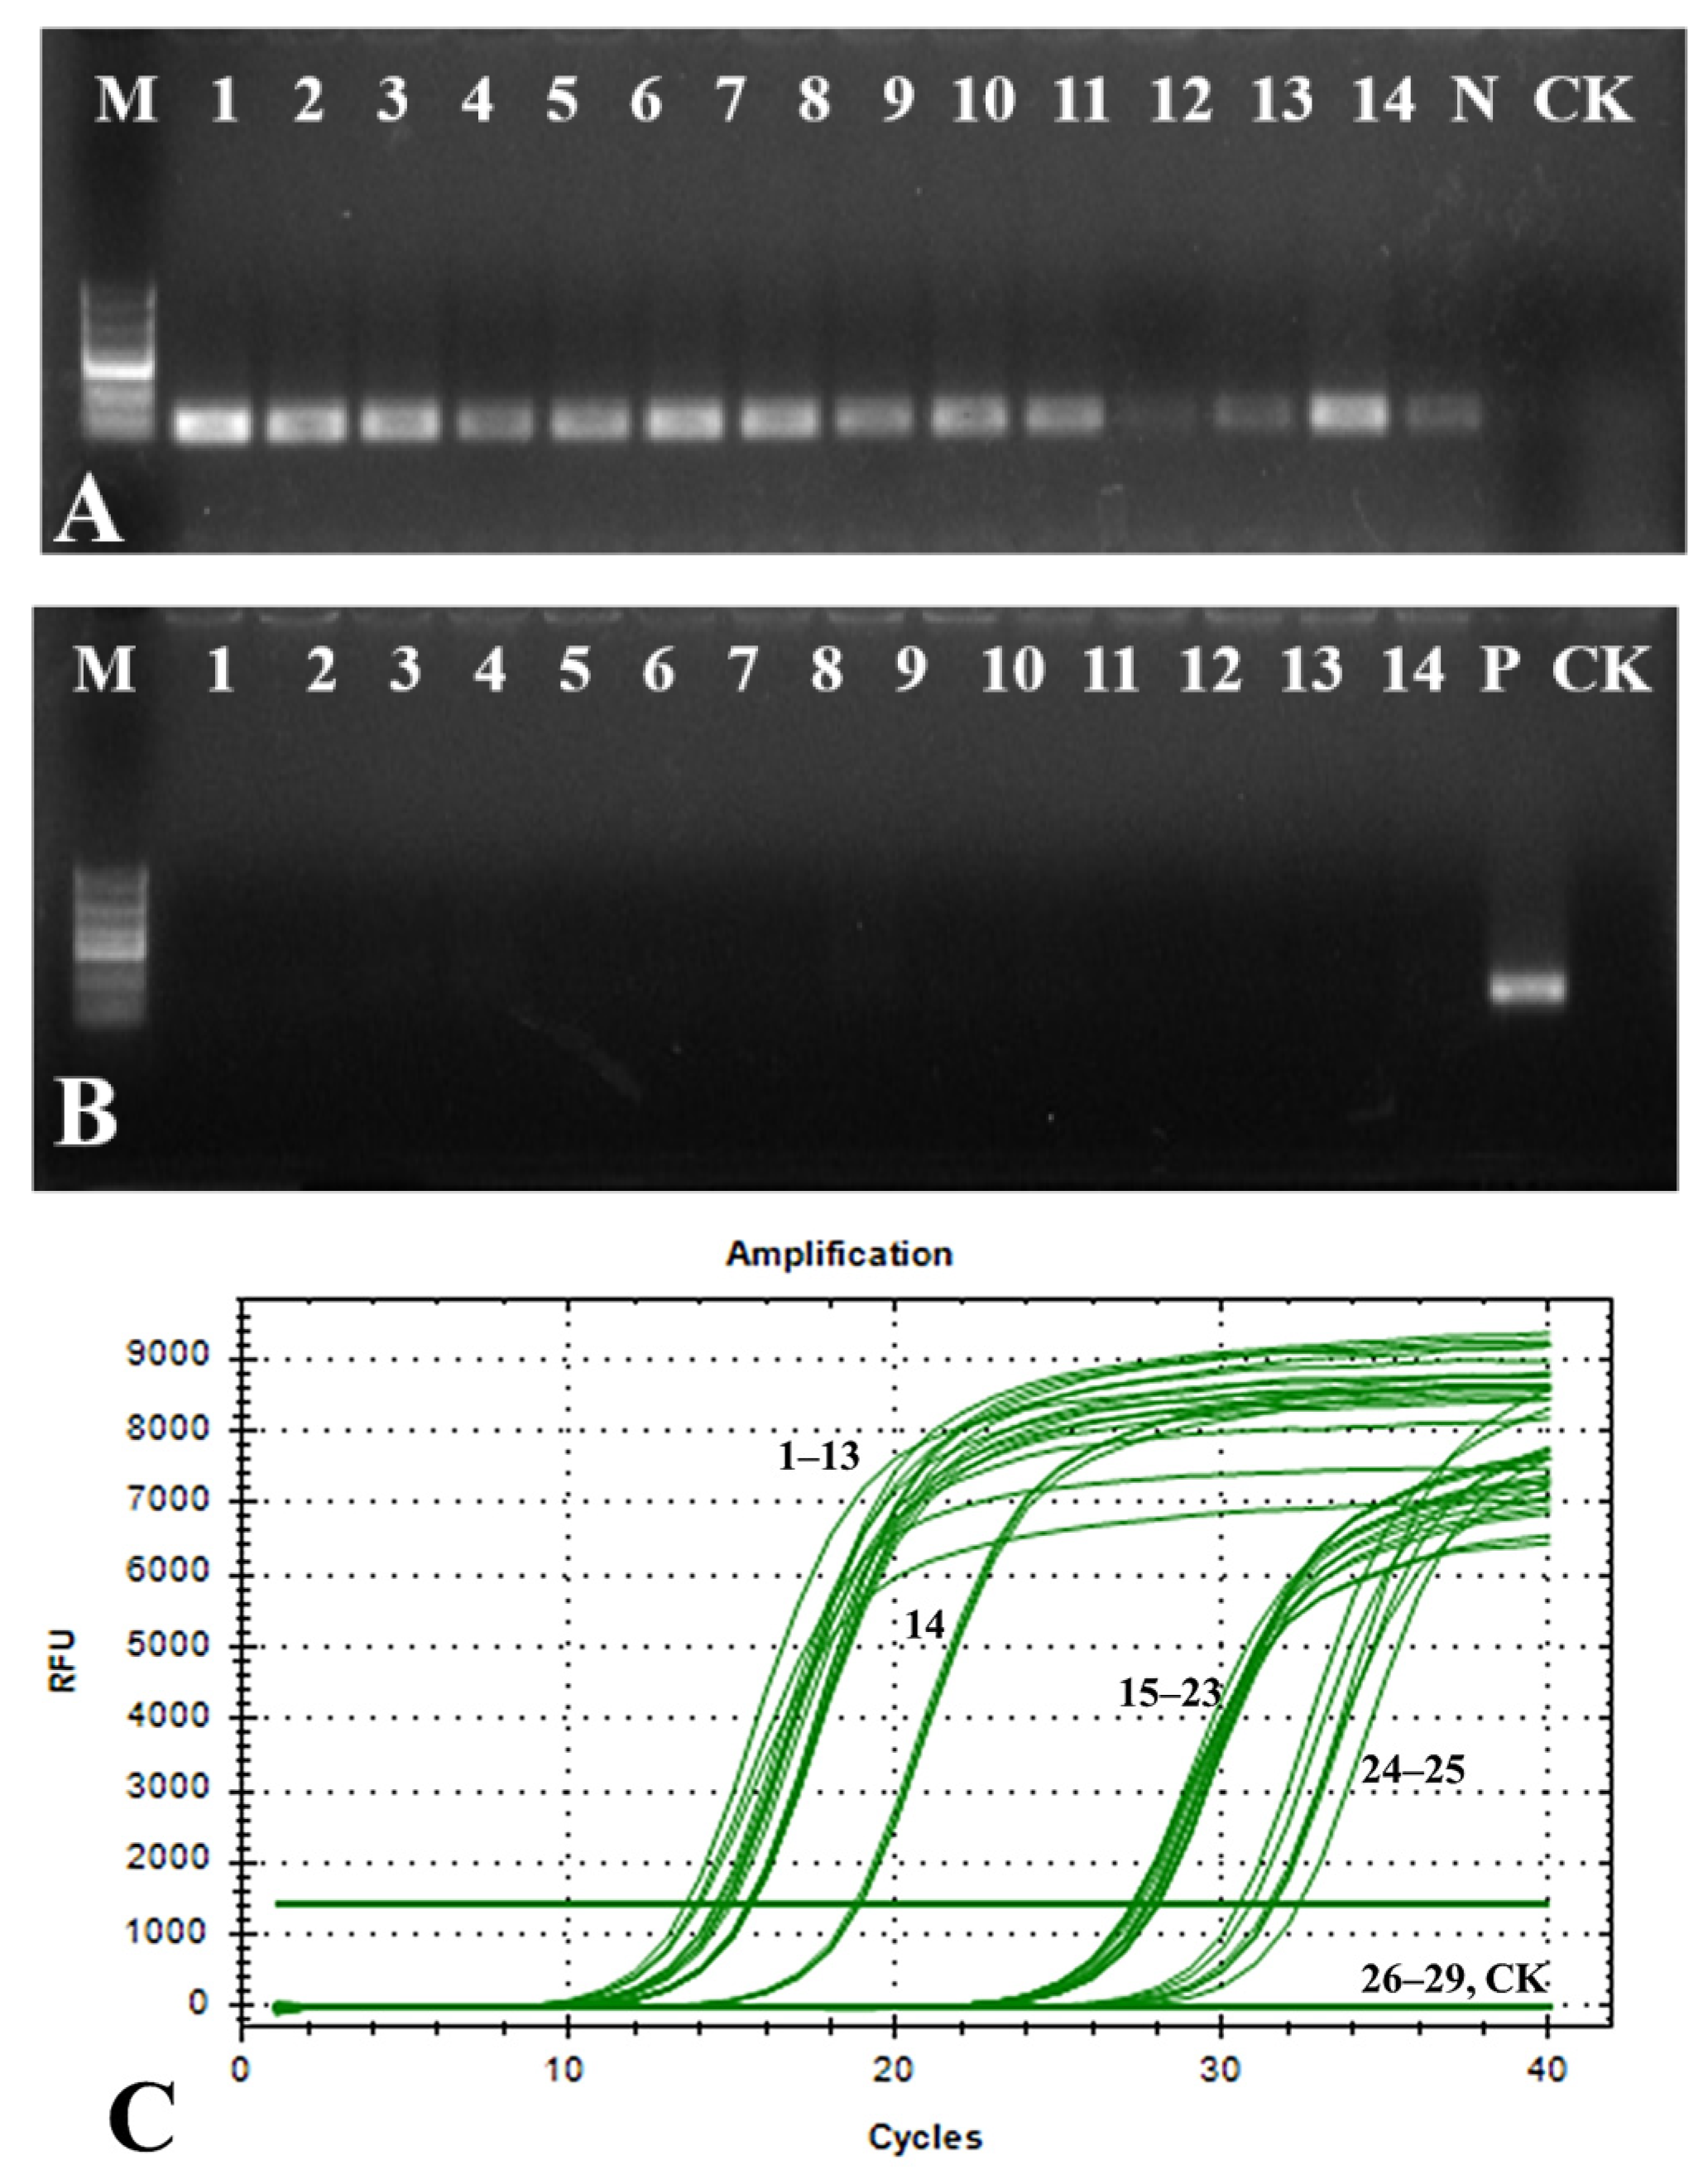
3.6. Sensitivity of Primers

3.6.1. Sensitivity Detection by Using Bacterial Suspension as a Template

A bacterial suspension of E. amylovora isolate 99east-3-1 was used to evaluate the detection sensitivity of the primers. PCR results showed distinct specific bands at a template concentration of 10⁴ CFU/mL, indicating this as the detection limit for regular PCR.
For qPCR, a concentration gradient of template ranging from 107 to 101 CFU/mL was tested. The bacteria were detectable across the range of 107 to 102 CFU/mL, while detection was marginal at 101 CFU/mL. Consequently, the detection limit for qPCR was determined to be 102 CFU/mL, which is 100 times more sensitive than PCR (Figure 6).

3.6.2. Sensitivity Detection Using E. amylovora DNA as a Template

Using DNA extracted from E. amylovora isolate 99east-3-1 as a template, PCR detected clear amplification bands at DNA concentrations ≥ 5 pg/µL.
For qPCR, a DNA concentration range from 50 ng/µL to 0.05 pg/µL (approximately 2~1 × 10⁷ DNA copies) was tested. Amplification signals were observed throughout this range, while no signals were detected at 0.005 pg/µL. The detection limit for qPCR was established at 0.05 pg/µL, making it 100 times more sensitive than PCR (Figure 7).

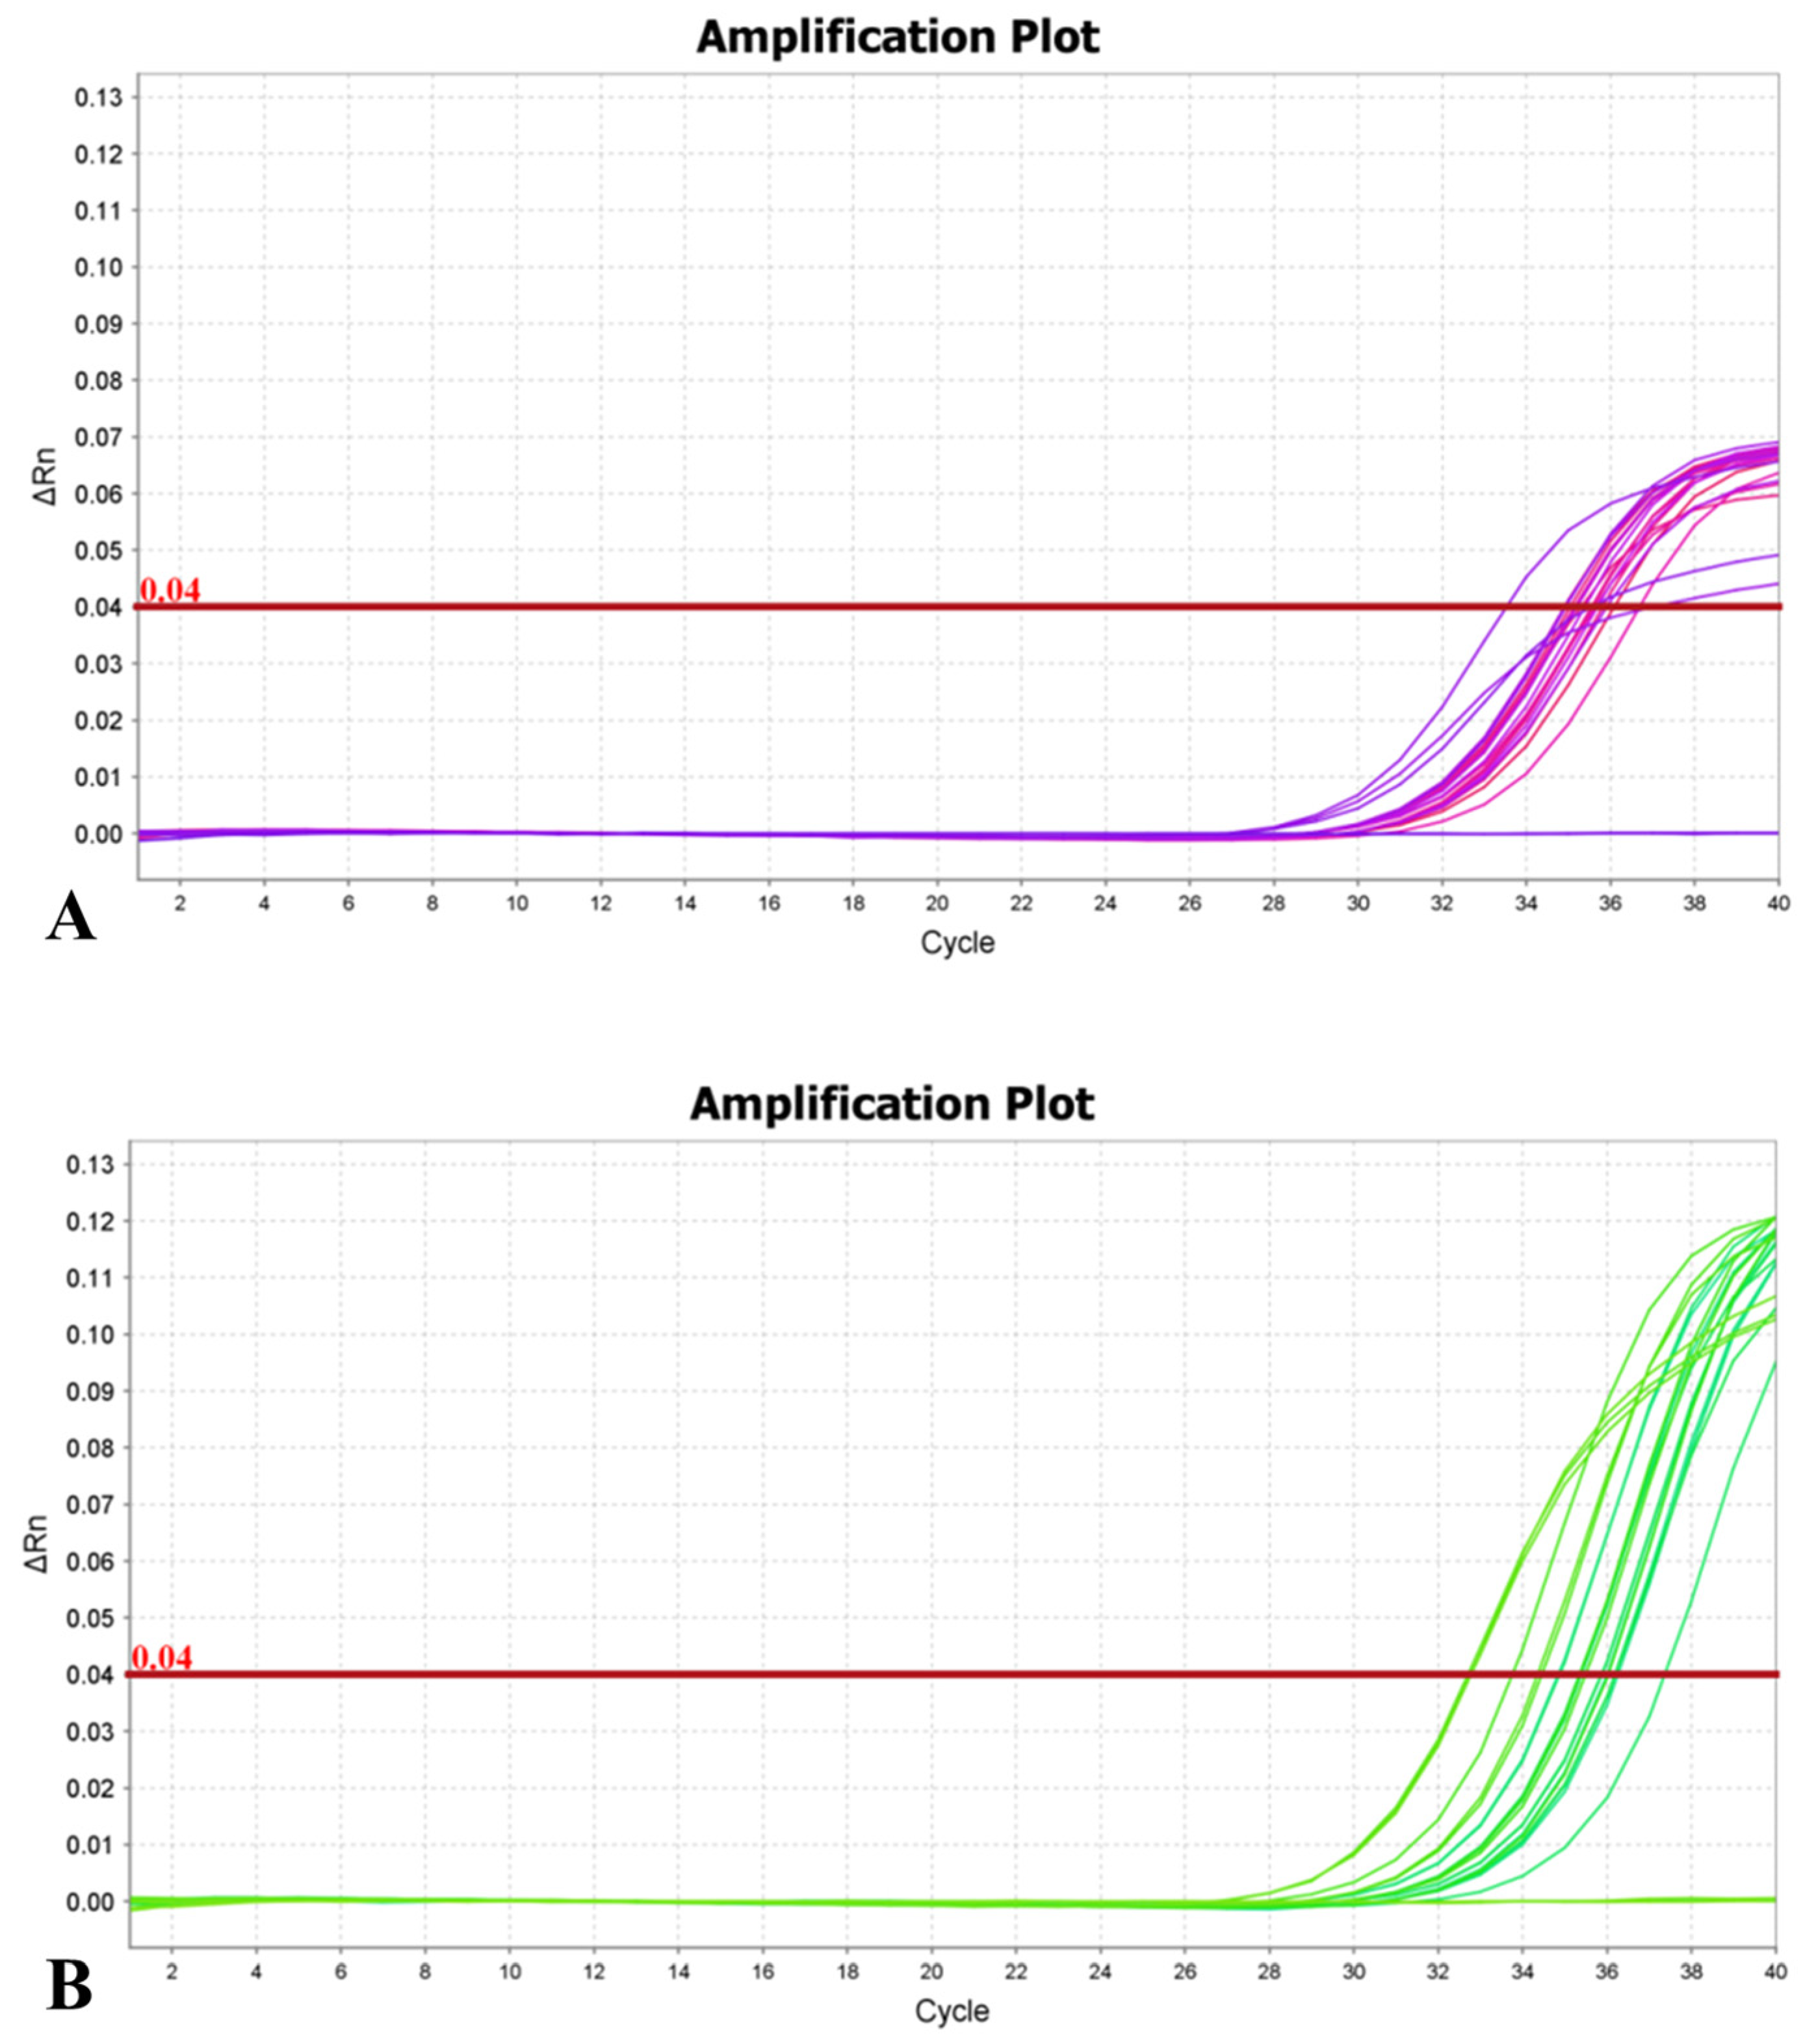
3.7. Detection of Infected Plant Tissues

3.7.1. Detection Using Total DNA Extracted from Infected Plant Tissues

Total DNA was extracted from infected leaves, branches, and blossoms of pear trees and used as templates for qPCR. E. amylovora was detected in tissues showing typical symptoms as well as in asymptomatic tissues. The asymptomatic tissues and symptomatic tissues were collected from the same pear tree, and the asymptomatic tissues were collected from areas adjacent to the symptomatic tissues. The results confirmed amplification for symptomatic and asymptomatic leaves, branches, and blossoms (Figure 8).

3.7.2. Detection of Plant Tissue Grinding Suspension as Templates

Seven symptomatic and asymptomatic leaves and blossoms were ground with sterilized glass rods, and the supernatant was used as a template for qPCR. Fluorescence signals were detected in all tested samples, with Ct values exceeding 30 for leaf samples. Blossom tissues showed significantly higher amplification compared to leaves, with fluorescence signals detected in both symptomatic and asymptomatic samples (Figure 9).

3.7.3. Application of qPCR Detection System

To assess the system’s applicability, 31 field samples, including pears, apples, and apricots, were collected from Korla and Yili in Xinjiang. The samples included 25 symptomatic and 6 asymptomatic plant tissues, and the asymptomatic tissues were collected from areas of the same plant adjacent to symptomatic tissues. All samples were rinsed with sterile water following surface sterilization, and total DNA was extracted for PCR and qPCR analysis using the specific primers in Section 3.3. All samples tested positive for E. amylovora using qPCR, showing significant fluorescence signals. However, PCR only detected amplification in the 25 symptomatic samples, while three of the six asymptomatic samples showed no amplification bands (Table 2).

4. Discussion

Since the first report of fire blight in China in 2016, the disease has been detected in the Xinjiang Uygur Autonomous Region and Gansu Province, causing significant economic damage. In this study, the sequenced isolate 99east-3-1 from Xinjiang was subjected to phylogenetic analysis alongside 20 isolates from various countries and regions with whole-genome sequences available on NCBI. The phylogenetic tree based on all single-copy genes in whole-genome sequences divided the 21 E. amylovora isolates into four clades. The isolate 99east-3-1 clustered in Clade III with the isolate CFBP1430 from France, Europe. This result was consistent with Gong et al. (2025) [9], where the strains isolated from various regions of Xinjiang exhibited 99.98% whole-genome sequence similarity with the representative strain CFBP1430. Clade III contains 16 out of 21 isolates from different countries and regions, including Europe (e.g., France, Germany, and Poland), America (e.g., Canada, United States, and Mexico), Lebanon, South Korea, and New Zealand. This analysis revealed no direct correlation between clades and geographical origin, highlighting the complexity of E. amylovora’s global dissemination.
Kurz et al. [25] analyzed the prevalence of archetypal genotype A and D E. amylovora isolates in the Mediterranean region, Russia, and Asia from 1982 to 2019. Their findings indicated that pear fire blight occurred in Kazakhstan and Kyrgyzstan, which border Xinjiang. From 2011 to 2019, Kazakhstan reported 20 isolates, and Kyrgyzstan reported 33 isolates, all classified as A-derived genotypes. Similarly, all four isolates in Georgia and seven out of eight isolates in Iran were of genotype A. Moving westward and northward, countries like Russia, Israel, and Lebanon exhibited a mixture of genotypes, with archetypal genotypes A and D each representing ~25%, and non-A or -D genotypes, with part or total loss of spacer 1029, accounting for ~50%. Gong et al. [9] conducted traceability analysis on 13 isolates in China, indicating that the Chinese isolates cluster in the same sub-branch, suggesting a potential common origin of Chinese isolates. At the same time, Chinese isolates are believed to have the closest clustering relationship with isolates from Kazakhstan and Kyrgyzstan. Our study analyzed spacer 1029 in the CRR1 region of eight E. amylovora genomes from Korla in China, revealing that all isolates belong to genotype A. This result is consistent with the findings of Rezzonico et al. [8], where all Chinese isolates are of type A. Based on Kurz et al.’s [25] analysis of genetic selection on a global scale, this study also agrees with Gong et al.’s [9] speculation that the transmission pathway of pear fire blight disease to China took the following route: North America→Europe→Middle East→Central Asia→Xinjiang of China.
Phytosanitary quarantine serves as the first defense barrier in plant protection. The development of rapid and efficient pathogen detection methods facilitates comprehensive monitoring of epidemic situations in affected areas amidst the high volume of commercial flows today and helps prevent the spread of pathogens. To prevent the spread of fire blight within China and mitigate its impact on the fruit industry, enhanced detection and monitoring are essential. This study developed a qPCR detection system with high sensitivity and specificity, providing a potentially valuable tool for identifying fire blight pathogens. Regarding the further optimization of the experiment, a comparison of the qPCR method with other similar or commonly used detection methods needs to be conducted.
To validate the applicability of this qPCR system, plant tissues from different parts of pear trees were tested. With total DNA as the template, the system effectively detected E. amylovora in both symptomatic and asymptomatic tissues. While the current investigation successfully validated the detection protocol, two limitations warrant attention: sample size constraints and spatial parameter definition. In this study, the number of asymptomatic tissue samples tested was relatively limited, so there needs to be a larger cohort of samples for further examination. Additionally, the asymptomatic tissues analyzed in this study were obtained from areas adjacent to symptomatic tissues. The maximum distance that allows the detection of pathogens in asymptomatic tissues between asymptomatic and symptomatic tissues remains to be determined. Further studies are necessary to validate the sensitivity and applicability of the qPCR detection system.
Since DNA extraction from plant tissues is complex and to facilitate quarantine, we explored the use of plant tissue grinding and soaking suspensions as templates for qPCR detection. Although using plant tissue grinding solution as the qPCR template provides operational convenience, it results in higher Ct values and lower amplification product yields compared to total DNA. These findings underscore the challenges of optimizing qPCR detection in plant tissue matrices and highlight the need for further refinements to improve amplification efficiency and reliability.

5. Conclusions

This study analyzed the genetic diversity of E. amylovora strains collected from P. sinkiangensis in Xinjiang, China. All eight isolates were identified as CRR1 genotype A, consistent with most strains from Kazakhstan and Kyrgyzstan. A qPCR detection system with high specificity and sensitivity (0.05 pg/µL DNA concentration and 102 CFU/mL bacterial suspension) was established, enabling the detection of fire blight pathogens. The test results of the 31 field samples collected from Korla and Yili in Xinjiang suggesting the qPCR detection system established in this study may be a potentially valuable tool for monitoring the spread of E. amylovora in China.

Supplementary Materials

The following supporting information can be downloaded at https://www.mdpi.com/article/10.3390/agronomy15051065/s1, Table S1: Strains used in genetic diversity analysis; Table S2: Primers used in this study; Figure S1: Specific detection of Erwinia amylovora using primers Eatrp F/R.

Author Contributions

Conceptualization, B.S., T.Z. and Y.Y.; methodology, N.F. and W.J.; validation, H.W., J.Y. and W.J.; resources, B.S.; data curation, W.G.; writing N.F., H.W. and J.Y.; project administration, Y.Y. and B.S.; funding acquisition, Y.Y. and B.S. All authors have read and agreed to the published version of the manuscript.

Funding

This study was supported by the Science and Technology Research Project of Jilin Provincial Department of Education (JJKH20240578KJ), the Major Science and Technology Project of Xinjiang Uygur Autonomous Region (2023A02006), and the Agricultural Science and Technology Innovation Program of the Chinese Academy of Agricultural Sciences (CAAS-ASTIP).

Data Availability Statement

The original contributions presented in this study are included in the article.

Conflicts of Interest

The authors declare no conflicts of interest.

References

  1. Liu, S.Q.; Zhang, L.; Wang, M.S.; Liu, W.W.; Cui, R.G.; Du, B.; Song, L.J. Effect of different pretreatment methods on soluble dietary fiber macromolecules extracted from Korla fragrant pear (Pyrus sinkiangensis Yü): Structure, physicochemical properties, and biological activity. Int. J. Biol. Macromol. 2025, 302, 140901. [Google Scholar] [CrossRef] [PubMed]
  2. Li, Y.; Huang, Y.; Long, H.; Yu, Z.; Huang, M.; Liu, X. Biodiversity and oenological property analysis of non-Saccharomyces yeasts isolated from Korla fragrant pears (Pyrus sinkiangensis Yu). Fermentation 2022, 8, 388. [Google Scholar] [CrossRef]
  3. Ham, H.; Lee, S.W.; Lee, Y.H. Genetic diversity and genotype distribution of Erwinia amylovora in Korea. Plant Pathol. J. 2025, 41, 88–99. [Google Scholar] [CrossRef] [PubMed]
  4. Calzolari, A.; Finelli, F.; Mazzoli, G.L. A severe unforeseen outbreak of fire blight in the Emilia-Romagna Region. Acta Hortic. 1999, 489, 171–176. [Google Scholar] [CrossRef]
  5. Albanese, D.; Cainelli, C.; Gualandri, V.; Larger, S.; Pindo, M.; Donati, C. Genome sequencing provides new insights on the distribution of Erwinia amylovora lineages in northern Italy. Environ. Microbiol. Rep. 2022, 14, 584–590. [Google Scholar] [CrossRef]
  6. Song, J.Y.; Lee, S.J.; Nam, M.; Lee, J.H.; Choi, E.J.; Cho, Y.R.; Lee, B.; Kim, J.F. Genomic epidemiology of Erwinia amylovora strains that caused the fire blight outbreak in Korea. Plant Dis. 2025. [Google Scholar] [CrossRef]
  7. CABI/EPPO (CAB International/European and Mediterranean Plant Protection Organization). EPPO Reporting Service; No. 2017/001; European and Mediterranean Plant Protection Organization: Paris, France, 2017. [Google Scholar]
  8. Rezzonico, F.; Bobushova, S.; Gaganidze, D.; Konurbaeva, M.; Mukhanov, S.; Jordan, S.; Sadunishvili, T.; Drenova, N.; Smits, T.H.M.; Doolotkeldieva, T. Epidemiological description of fire blight introduction patterns to Central Asia and the Caucasus region based on CRISPR spacer typing and genome analysis. Phytopathol. Res. 2024, 6, 66. [Google Scholar] [CrossRef]
  9. Gong, P.J.; Sun, W.B.; Yi, J.P.; Han, J.; Liu, M.L.; Han, C.Y.; Ming, L.; Wang, B.W.; Luo, M.; Zhao, Y.C.; et al. Comparative genomic analysis of Chinese Erwinia amylovora strains reveals genetic variations, plasmid diversity, and potential common ancestor. iMetaOmics 2025, 2, e44. [Google Scholar] [CrossRef]
  10. Drenova, N.V.; Isin, M.M.; Dzhaimurzina, A.A.; Zharmukhamedova, G.A.; Aitkulov, A.K. Bacterial fire blight in the Republic of Kazakhstan. Plant Health Res. Pract. 2013, 3, 44–48. [Google Scholar]
  11. Doolotkeldieva, T.; Bobusheva, S. Fire blight disease caused by Erwinia amylovora on Rosaceae plants in Kyrgyzstan and biological agents to control this disease. Adv. Microbiol. 2016, 6, 831–851. [Google Scholar] [CrossRef]
  12. Park, D.H.; Yu, J.G.; Oh, E.J.; Han, K.S.; Mi, C.Y.; Lee, S.J. First report of fire blight disease on Asian pear caused by Erwinia amylovora in Korea. Plant Dis. 2016, 100, 1946. [Google Scholar] [CrossRef]
  13. Sun, W.; Gong, P.; Zhao, Y.; Ming, L.; Zeng, Q.; Liu, F. Current Situation of Fire Blight in China. Phytopathology 2023, 113, 2143–2151. [Google Scholar] [CrossRef] [PubMed]
  14. Maltseva, E.R.; Zharmukhamedova, G.A.; Jumanova, Z.K.; Naizabayeva, D.A.; Berdygu-lova, Z.A.; Dmitriyeva, K.A.; Tezekbayeva, B.; Khassein, A.; Skiba, Y.A.; Malakhova, N.P.; et al. Fire blight cases in Almaty region of Kazakhstan in the proximity of wild apple distribution area. J. Plant Pathol. 2023, 106, 971–978. [Google Scholar] [CrossRef]
  15. Eunjung, R.; Madison, E.D.; Leslie, M.E.; Julianne, H.G. Whole genome sequences of eight Erwinia amylovora phages isolated from South Korea. Microbiol. Resour. Announc. 2025, 14, e0106224. [Google Scholar] [CrossRef]
  16. Talhi, L.; Barbé, S.; Herrero, I.N.; Sebaihia, M.; Noales, E.M. Intraspecific diversity of Erwinia amylovora strains from northern Algeria. BMC Microbiol. 2024, 24, 389. [Google Scholar] [CrossRef] [PubMed]
  17. Wang, J.; Zhao, Y.; Wu, S.; Gu, X.M.; Liu, X.R.; Tian, Y.L.; Hu, B.S.; Zhao, Y.F. Genome analysis reveals Erwinia amylovora in China is closely related to those of Kyrgyzstan and Kazakhstan. Phytopathol. Res. 2025, 7, 31. [Google Scholar] [CrossRef]
  18. Hyeonheui, H.; Suk, D.P. Novel approach toward the understanding of genetic diversity based on the two types of amino acid repeats in Erwinia amylovora. Sci. Rep. 2023, 13, 17876. [Google Scholar]
  19. Rico, A.; Führer, M.E.; Ortiz-Barredo, A.; Murillo, J. Polymerase chain reaction fingerprinting of Erwinia amylovora has a limited phylogenetic value but allows the design of highly specific molecular markers. Phytopathology 2008, 98, 260–269. [Google Scholar] [CrossRef]
  20. Momol, M.T.; Momol, E.A.; Lamboy, W.F.; Norelli, J.L.; Beer, S.V.; Aldwinckle, H.S. Charac-terization of Erwinia amylovora strains using random amplified polymorphic DNA fragments (RAPDs). J. Appl. Microbiol. 1997, 82, 389–398. [Google Scholar] [CrossRef]
  21. Jock, S.; Donat, V.; López, M.M.; Bazzi, C.; Geider, K. Following spread of ffre blight in Western, Central and Southern Europe by molecular differentiation of Erwinia amylovora strains with PFGE analysis. Environ. Microbiol. 2002, 4, 106–114. [Google Scholar] [CrossRef]
  22. Jock, S.; Wensing, A.; Pulawska, J.; Drenova, N.; Dreo, T.; Geider, K. Molecular analyses of Erwinia amylovora strains isolated in Russia, Poland, Slovenia and Austria describing further spread of fire blight in Europe. Microbiol. Res. 2013, 168, 447–454. [Google Scholar] [CrossRef]
  23. Bühlmann, A.; Dreo, T.; Rezzonico, F.; Pothier, J.F.; Smits, T.H.; Ravnikar, M.; Frey, J.E.; Duffy, B. Phylogeography and population structure of the biologically invasive phytopathogen Erwinia amylovora inferred using minisatellites. Environ. Microbiol. 2014, 16, 2112–2125. [Google Scholar] [CrossRef] [PubMed]
  24. Parcey, M.; Gayder, S.; Morley-Senkler, V.; Bakkeren, G.; Úrbez-Torres, J.R.; Ali, S. Comparative genomic analysis of Erwinia amylovora reveals novel insights in phylogenetic arrangement, plasmid diversity, and streptomycin resistance. Genomics 2020, 112, 3762–3772. [Google Scholar] [CrossRef]
  25. Kurz, M.; Carnal, S.; Dafny-Yelin, M.; Mairesse, O.; Rezzonico, F. Tracking the dissemination of Erwinia amylovora in the Eurasian continent using a PCR targeted on the duplication of a single CRISPR spacer. Phytopathol. Research. 2021, 3, 18. [Google Scholar] [CrossRef]
  26. Fei, N.; Yang, Y.; Song, B.; Zhu, X.; Guan, W.; Zhao, T. Complete Genome Sequence of Erwinia amylovora Strain 99east-3-1, Isolated from Pyrus sinkiangensis in China. Microbiol. Resour. Announc. 2023, 12, e0016123. [Google Scholar] [CrossRef] [PubMed]
  27. Ordax, M.; Piquer-Salcedo, J.E.; Santander, R.D.; Sabater-Muñoz, B.; Biosca, E.G.; López, M.M.; Marco-Noales, E. Medfly Ceratitis capitata as potential vector for fire blight pathogen Erwinia amylovora: Survival and transmission. PLoS ONE 2015, 10, e0127560. [Google Scholar] [CrossRef] [PubMed]
  28. Sedlak, J.; Paprstein, F.; Korba, J. Development of in vitro system for testing of pome fruit resistance to fire blight. In Proceedings of the XII International Workshop on Fire Blight, Warsaw, Poland, 16–20 August 2010; Volume 896, pp. 375–379. [Google Scholar]
  29. Chen, C.; Chen, J.; Hu, B.S.; Jiang, Y.H.; Liu, F.Q. Potential distribution of alien invasive species and risk assessment: A case study of Erwinia amylovora in China. Agric. Sci. China 2007, 6, 688–695. (In Chinese) [Google Scholar] [CrossRef]
  30. Hu, B.; Lu, L.; Liu, F.; Xu, Z.; Chen, J.; Jiao, G. Detection of Erwinia amylovora by indirect immuno-fluorescent staining and co-agglutination methods. J. Nanjing Agric. Univ. 2003, 26, 41–45. (In Chinese) [Google Scholar]
  31. Bereswill, S.; Bugert, P.; Bruchmüller, I.; Geider, K. Identification of the fire blight pathogen, Erwinia amylovora, by PCR assays with chromosomal DNA. Appl. Environ. Microbiol. 1995, 61, 2636–2642. [Google Scholar] [CrossRef]
  32. Gottsberger, R. Development and evaluation of a real-time PCR assay targeting chromosomal DNA of Erwinia amylovora. Lett. Appl. Microbiol. 2010, 51, 285–292. [Google Scholar] [CrossRef]
  33. Yang, Y.; Qiao, P.; Wang, T.; Ji, W.; Fei, N.; Zhang, L.; Guan, W.; Zhao, T. Further Characterization of Host Preference of Acidovorax citrulli Based on Growth Competition between Group I and Group II Strains. Horticulturae 2022, 8, 1173. [Google Scholar] [CrossRef]
Figure 1. Phylogenetic tree of E. amylovora isolates and other bacterial species produced based on orthologous single-copy genes (JTT DCMut+F+R4 model, maximum likelihood method, 1000 ultrabootstrap replicates). The detailed strain information is listed in Supplementary Table S1. The strains highlighted in gray serve as the reference strains for different genotypes, while the strain highlighted in blue indicates the representative strain of the eight Xinjiang isolates examined in this study.
Agronomy 15 01065 g001
Figure 2. A phylogenetic tree of the Erwinia genus based on orthologous single-copy genes. The detailed strain information is listed in Supplementary Table S1. The strains highlighted in grey were all Erwinia amylovora strains. The strains highlighted in blue serve as the reference strains for different genotypes, while the strain labeled in red indicates the representative strain of the eight Xinjiang isolates examined in this study.
Agronomy 15 01065 g002
Figure 3. Genotypes of eight E. amylovora isolates in Xinjiang confirmed using common species-specific primers (C1f04/C1r09) [25]. Strains in lines 1–8 represent 617SYD-2-2, 618-2-1, 617SYD-3-2, S617-2-2, 99east-3-1, Ea-F1, Ea-F2, and Ea-J respectively, while line 9 is the negative control.
Agronomy 15 01065 g003
Figure 4. Specific detection of E. amylovora using primers EatrpF/R. (A). PCR amplification of 14 E. amylovora isolates. Lines 1–14: 617SYD-2-2, 618-2-2, 617SYD-2-2, S617-2-2, 99east-3-1, Ea-F1, Ea-F2, Ea-J, Ea-8, Ea-11, Ea-14, Ea-38, Ea-39, and Ea-61; N: negative control. (B). Amplification of 14 non-E. amylovora strains. Lines 1–14: Tm10, RsLB, psl8, psJL, YN1, GD414, Pxl1, H1, ZY1, DH5α, RH05, Aac5, pslb65, and BNCC108207; P: positive control. (C). qPCR amplification using EatrpF/R primers. Lines 1–13: 617SYD-2-2, 618-2-2, 617SYD-2-2, S617-2-2, 99east-3-1, Ea-F1, Ea-F2, Ea-J, Ea-8, Ea-11, Ea-14, Ea-38, and Ea-61; line 14: Ea-39; lines 15–23: CICC 10449, Aac5, pslb65, Tm10, RsLB, YN1, GD414, Pxl1, and H1; lines 24–25: psl8, psJL; lines 26–29: ZY1, DH5α, RH05, and BNCC108207.
Agronomy 15 01065 g004
Figure 5. Optimization of qPCR detection for E. amylovora. (A). Primer concentration optimization. (B). Melt curve analysis at 60 °C. (C). Standard curve showing the relationship between DNA concentration and Ct value.
Agronomy 15 01065 g005
Figure 6. Sensitivity detection using bacterial suspension as a template. (A). Sensitivity detection with PCR. M: Marker; 1–7: Concentration of bacterial suspension from 108 to 102 CFU/mL; 8: CK. (B). Sensitivity detection with qPCR. 1–7: Bacterial suspension from 107 to 101 CFU/mL; 8: CK.
Agronomy 15 01065 g006
Figure 7. Sensitivity detection using E. amylovora DNA as a template. (A). PCR results of different DNA concentrations. M: Marker 2000; 1: 50 ng/µL; 2: 5 ng/µL; 3: 0.5 ng/µL; 4: 0.05 ng/µL; 5: 5 pg/µL; 6: 0.5 pg/µL; 7: 0.05 pg/µL; and 8: 0.005 pg/µL. (B). qPCR results. 1: 50 ng/µL; 2: 5 ng/µL; 3: 0.5 ng/µL; 4: 0.05 ng/µL; 5: 5 pg/µL; 6: 0.5 pg/µL; 7: 0.05 pg/µL; 8: 0.005 pg/µL; and 9: CK.
Agronomy 15 01065 g007
Figure 8. qPCR detection of total DNA from infected leaves, branches, and blossoms. (A). Results for leaves. 1–5: Symptomatic; 6–7: Asymptomatic; 8: CK. (B). Results for branches. 1–5: Symptomatic; 6–7: Asymptomatic; 8: CK. (C). Results for blossoms. 1–5: Symptomatic; 6–7: Asymptomatic; 8: CK.
Agronomy 15 01065 g008
Figure 9. qPCR detection of grinding suspensions from pear leaves and blossoms. Infected tissues were surface disinfected, washed, cut into pieces of 1 cm2, and ground thoroughly in 300 µL sterile water. The supernatant was used as a qPCR template. (A). Results for leaves. (B). Results for blossoms.
Agronomy 15 01065 g009
Table 1. Strains mainly used in this study.
No. of StrainBacteria SpeciesHostSource
SYD617-3-2Erwinia amylovoraPyrus sinkiangensisXinjiang Province, China
618-2-2E. amylovoraP. sinkiangensisXinjiang Province, China
99east-3-1E. amylovoraP.s sinkiangensisXinjiang Province, China
617SYD-2-2E. amylovoraP. sinkiangensisXinjiang Province, China
S617-2-2E. amylovoraP. sinkiangensisXinjiang Province, China
Ea-F1E. amylovoraP.s sinkiangensisXinjiang Province, China
Ea-F2E. amylovoraP.s sinkiangensisXinjiang Province, China
Ea-JE. amylovoraP. sinkiangensisXinjiang Province, China
Ea-8E. amylovoraP. sinkiangensisPlant Protection Institute of Xinjiang Academy of Agricultural Sciences
Ea-11E. amylovoraP. sinkiangensisPlant Protection Institute of Xinjiang Academy of Agricultural Sciences
Ea-14E. amylovoraP. sinkiangensisPlant Protection Institute of Xinjiang Academy of Agricultural Sciences
Ea-38E. amylovoraP.s sinkiangensisPlant Protection Institute of Xinjiang Academy of Agricultural Sciences
Ea-39E. amylovoraP. sinkiangensisPlant Protection Institute of Xinjiang Academy of Agricultural Sciences
Ea-61E. amylovoraP.s sinkiangensisPlant Protection Institute of Xinjiang Academy of Agricultural Sciences
CICC 10449E. piriflorinigransPyrusChina Center of Industrial Culture Collection, CICC
Tm10Ralstonia solanacearumNicotiana tabacumLab collection
RsLBR. solanacearumSolanum lycopersicumLab collection
psl8Pseudomonas syringae pv. lachrymansCucumis sativusLab collection
psJLP. syringae pv. lachrymansC. meloJilin Province, China
YN1Xanthomonas oryzae pv. oryzaeOryza sativaYunnan Province, China
GD414X. oryzae pv. oryzaeO. sativaGuangdong Province, China
Pxl1X. campestris pv. vesicatoriaSolanum lycopersicumLab collection
H1X. campestris pv. vesicatoriaCapsicum annuumLab collection
ZY1Bacillus amyloliquefaciensC. annuumBeijing, China
DH5αEscherichia coliLab collection
RH05E. coliLab collection
Aac5Acidovorax citrulliCitrullus lanatusTaiwan Province, China
pslb65A. citrulliC. meloXinjiang Province, China
BNCC108207Salmonella typhimuriumLab collection
Table 2. PCR and qPCR detection in various samples.
RegionSample Type (Number of Samples Without Typical Symptoms/Number of Samples with Typical Symptoms)PCR (Number of Positive Samples/Total Number of Samples)qPCR (Number of Positive Samples/Total Number of Samples)
Korla, XinjiangLeaves of pear (2/6)7/88/8
Branches of pear (2/6)7/88/8
Blossoms of pear (2/6)7/88/8
Ili, XinjiangLeaves of pear (0/3)3/33/3
Leaves of apricot (0/1)1/11/1
Leaves of apple (0/3)3/33/3
Disclaimer/Publisher’s Note: The statements, opinions and data contained in all publications are solely those of the individual author(s) and contributor(s) and not of MDPI and/or the editor(s). MDPI and/or the editor(s) disclaim responsibility for any injury to people or property resulting from any ideas, methods, instructions or products referred to in the content.

