Soil Organic Carbon Sequestration and Distribution, Soil Biological Characteristics, and Winter Wheat Yields Under Different Tillage Practices in Long-Term Field Experiment


Abstract
1. Introduction
2. Materials and Methods
2.1. Site Description
2.2. Field Trial
2.3. Analytical Procedures
2.3.1. Soil Organic Carbon (SOC)
2.3.2. Microbial Biomass C (Cmic)
2.3.3. Dehydrogenase Activity
2.3.4. Urease Activity
2.3.5. Nitrogen Content in Grain
2.4. Meteorological Data
2.5. Statistical Analyses
3. Results
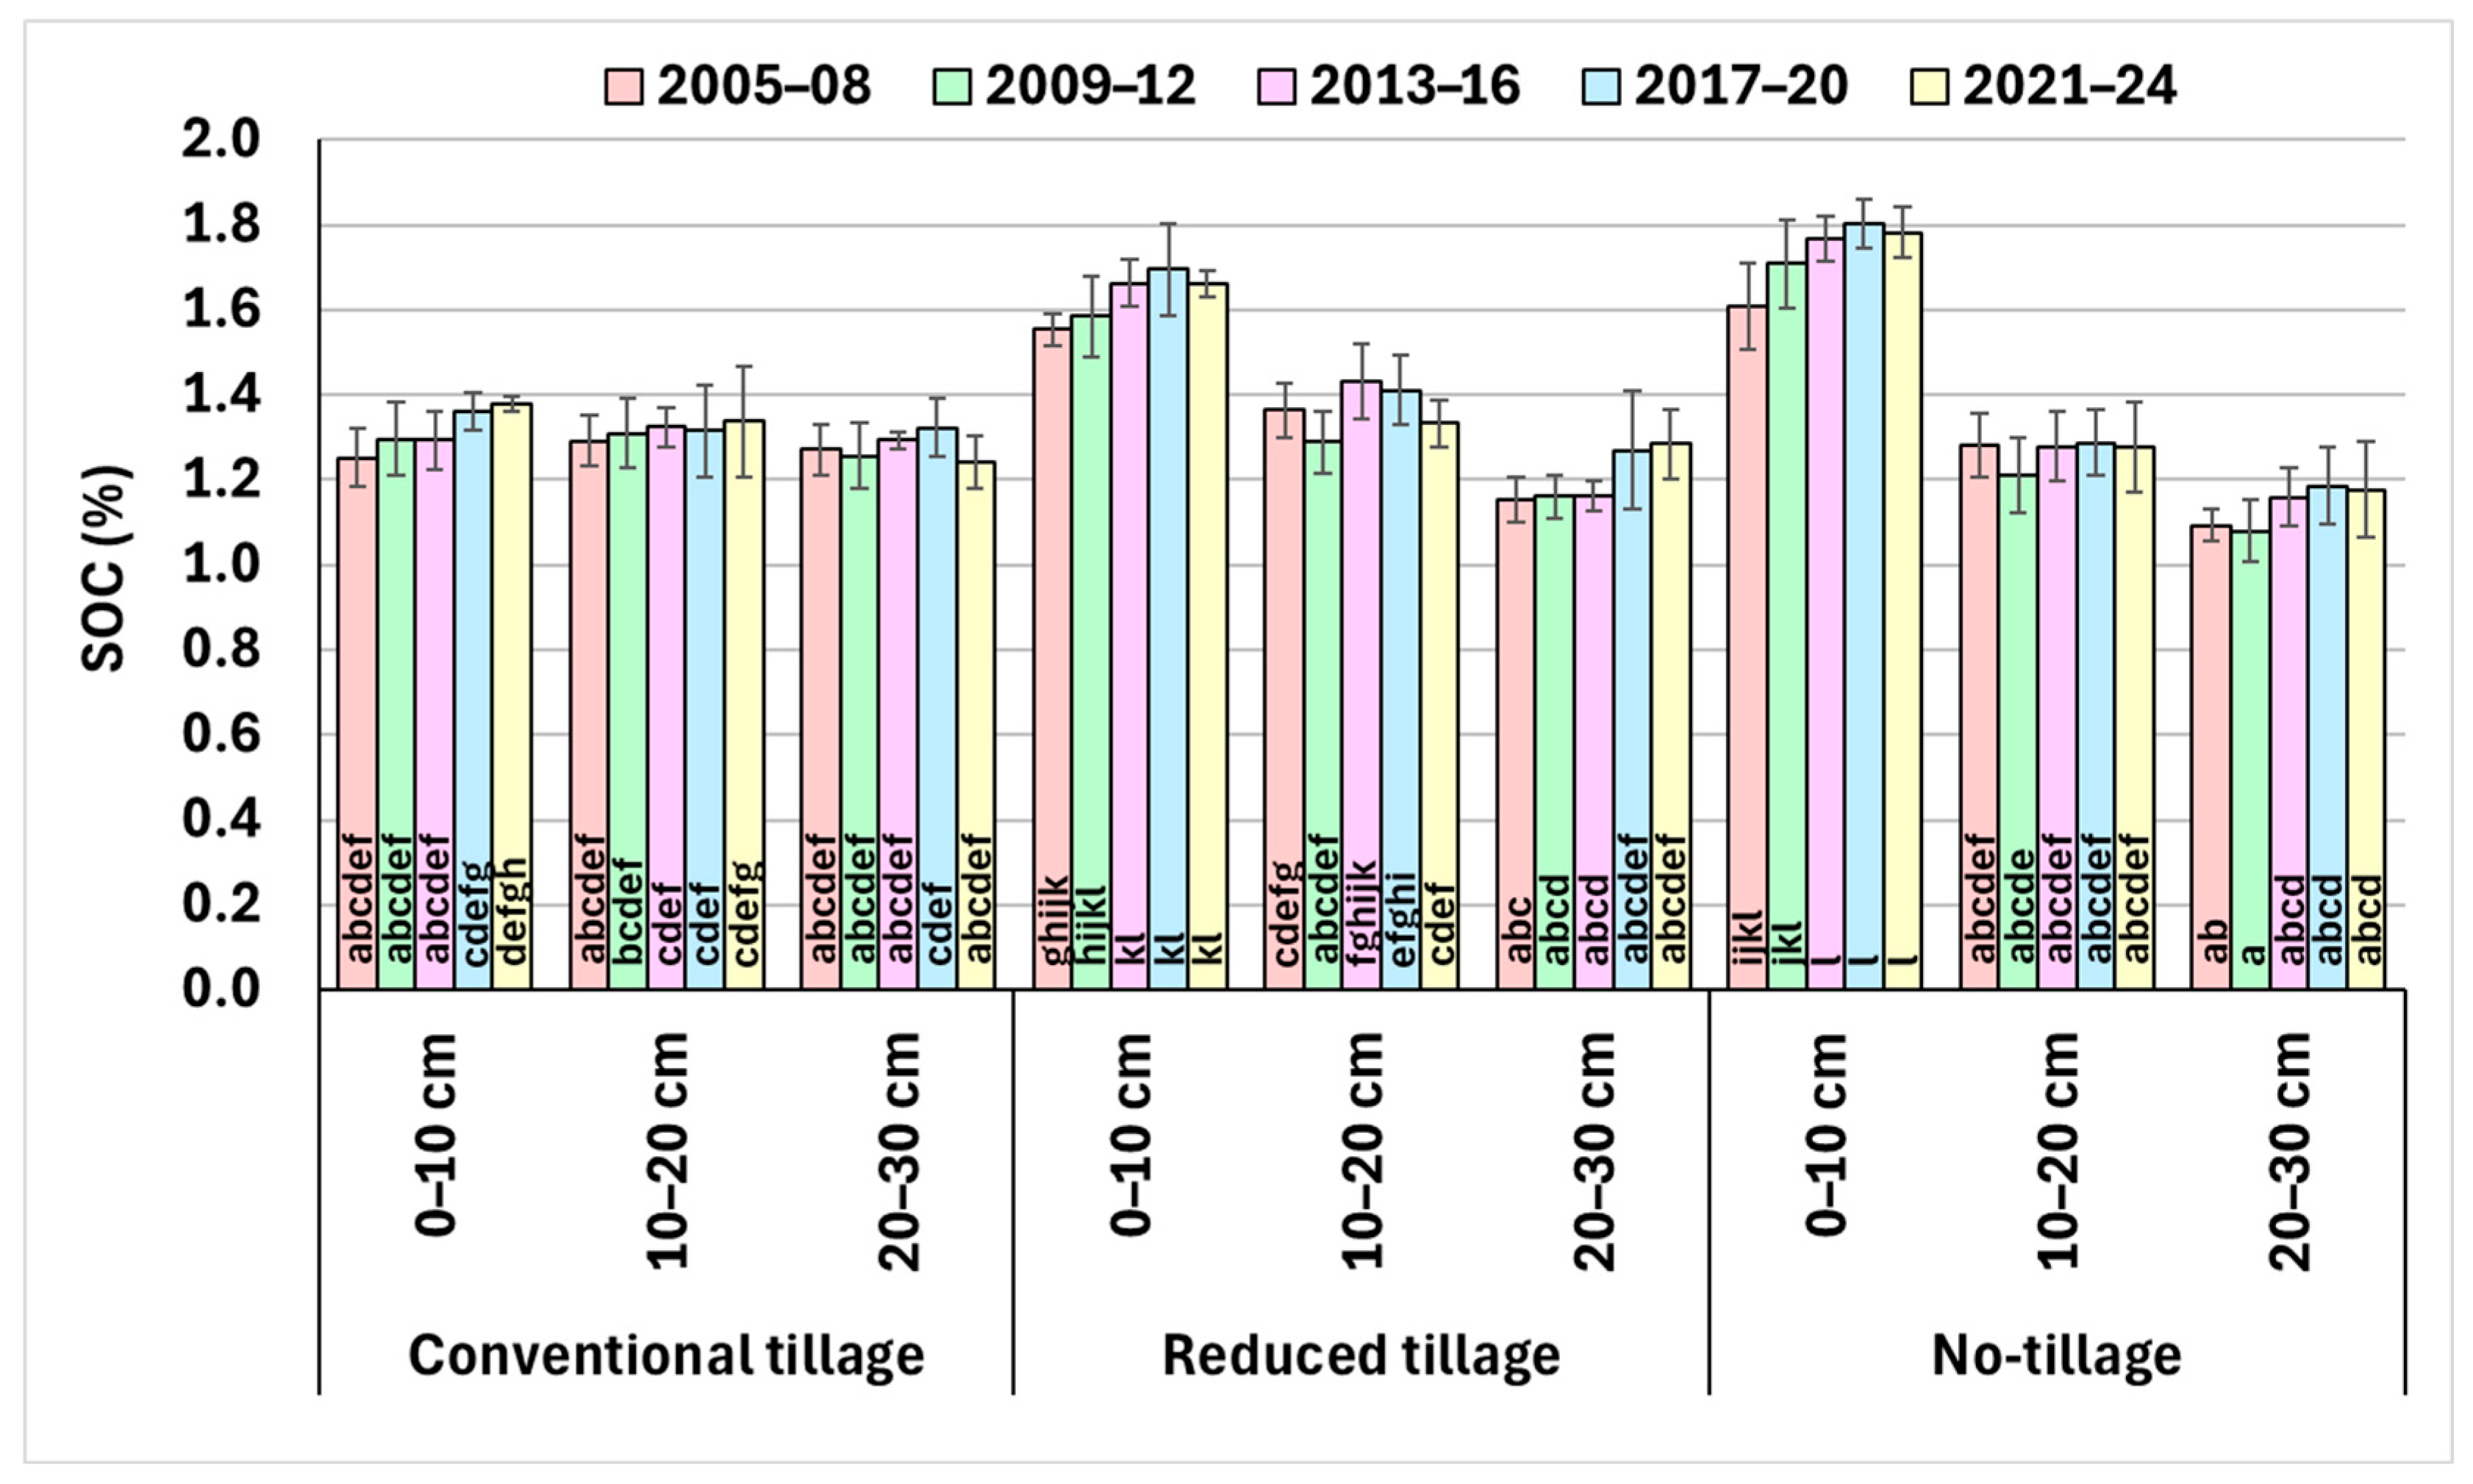
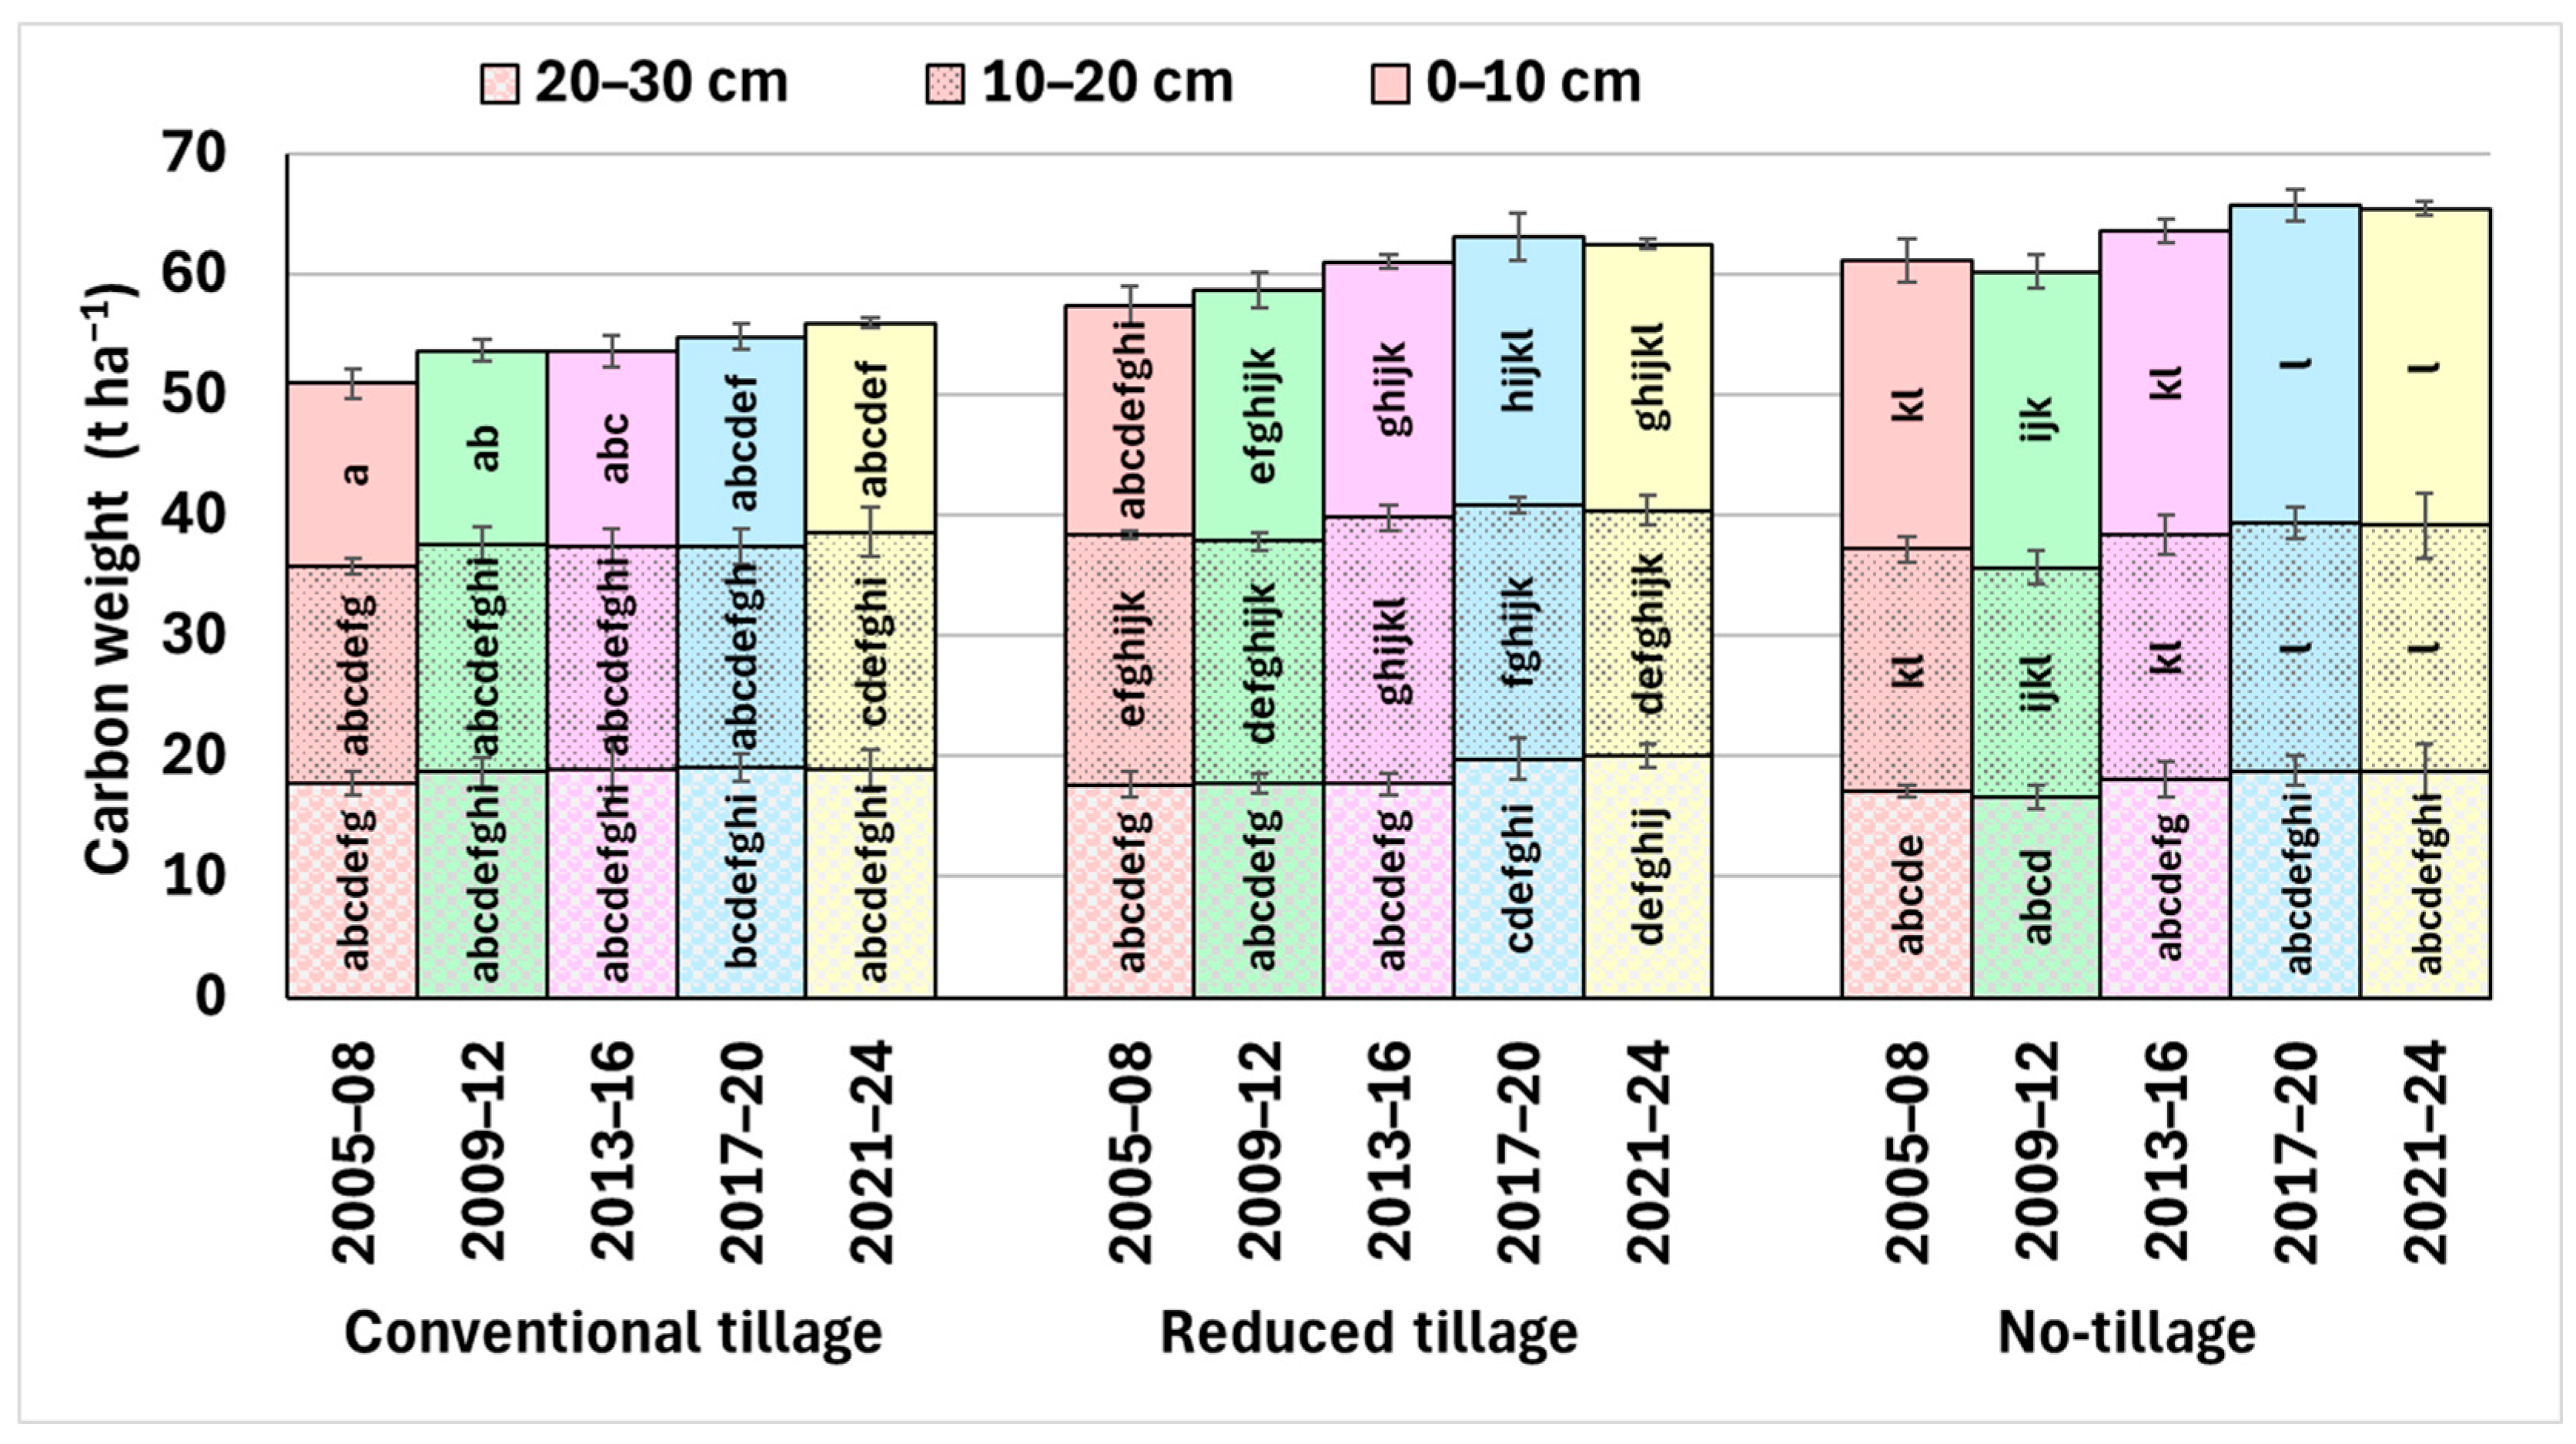
3.1. Soil Organic Carbon (SOC)
3.2. Soil Microbial Biomass (Cmic)
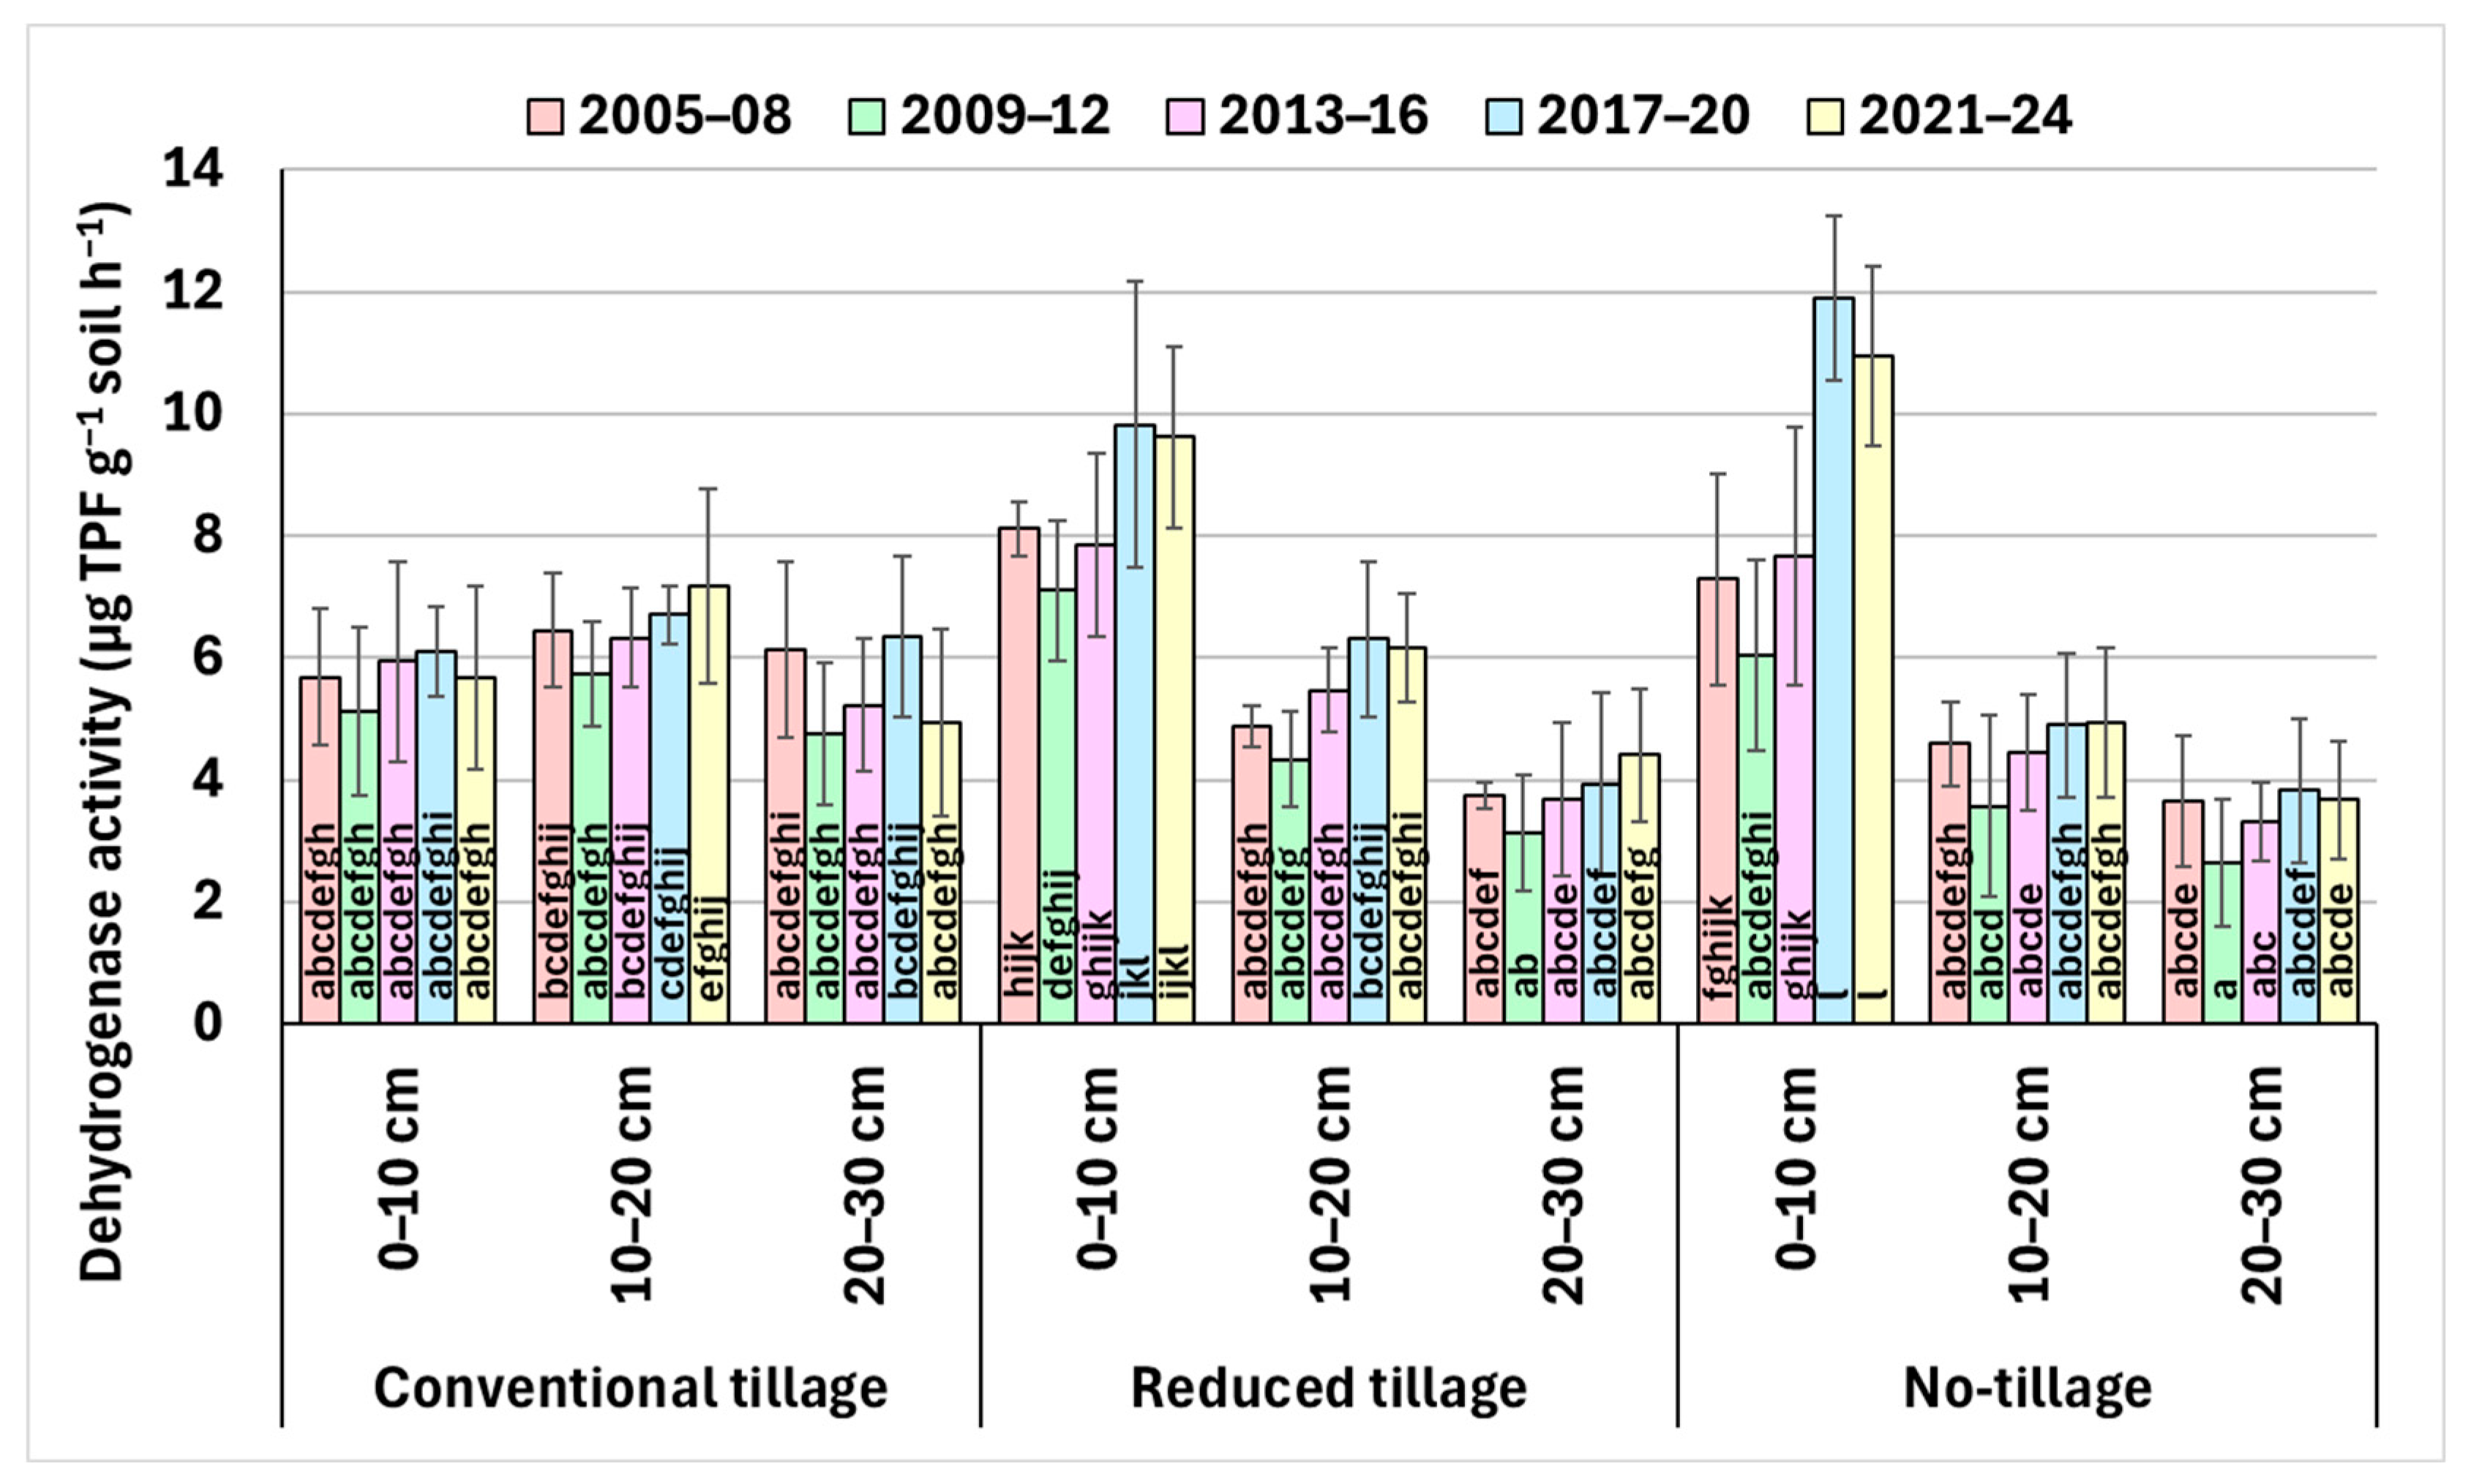
3.3. Dehydrogenase and Urease Activities
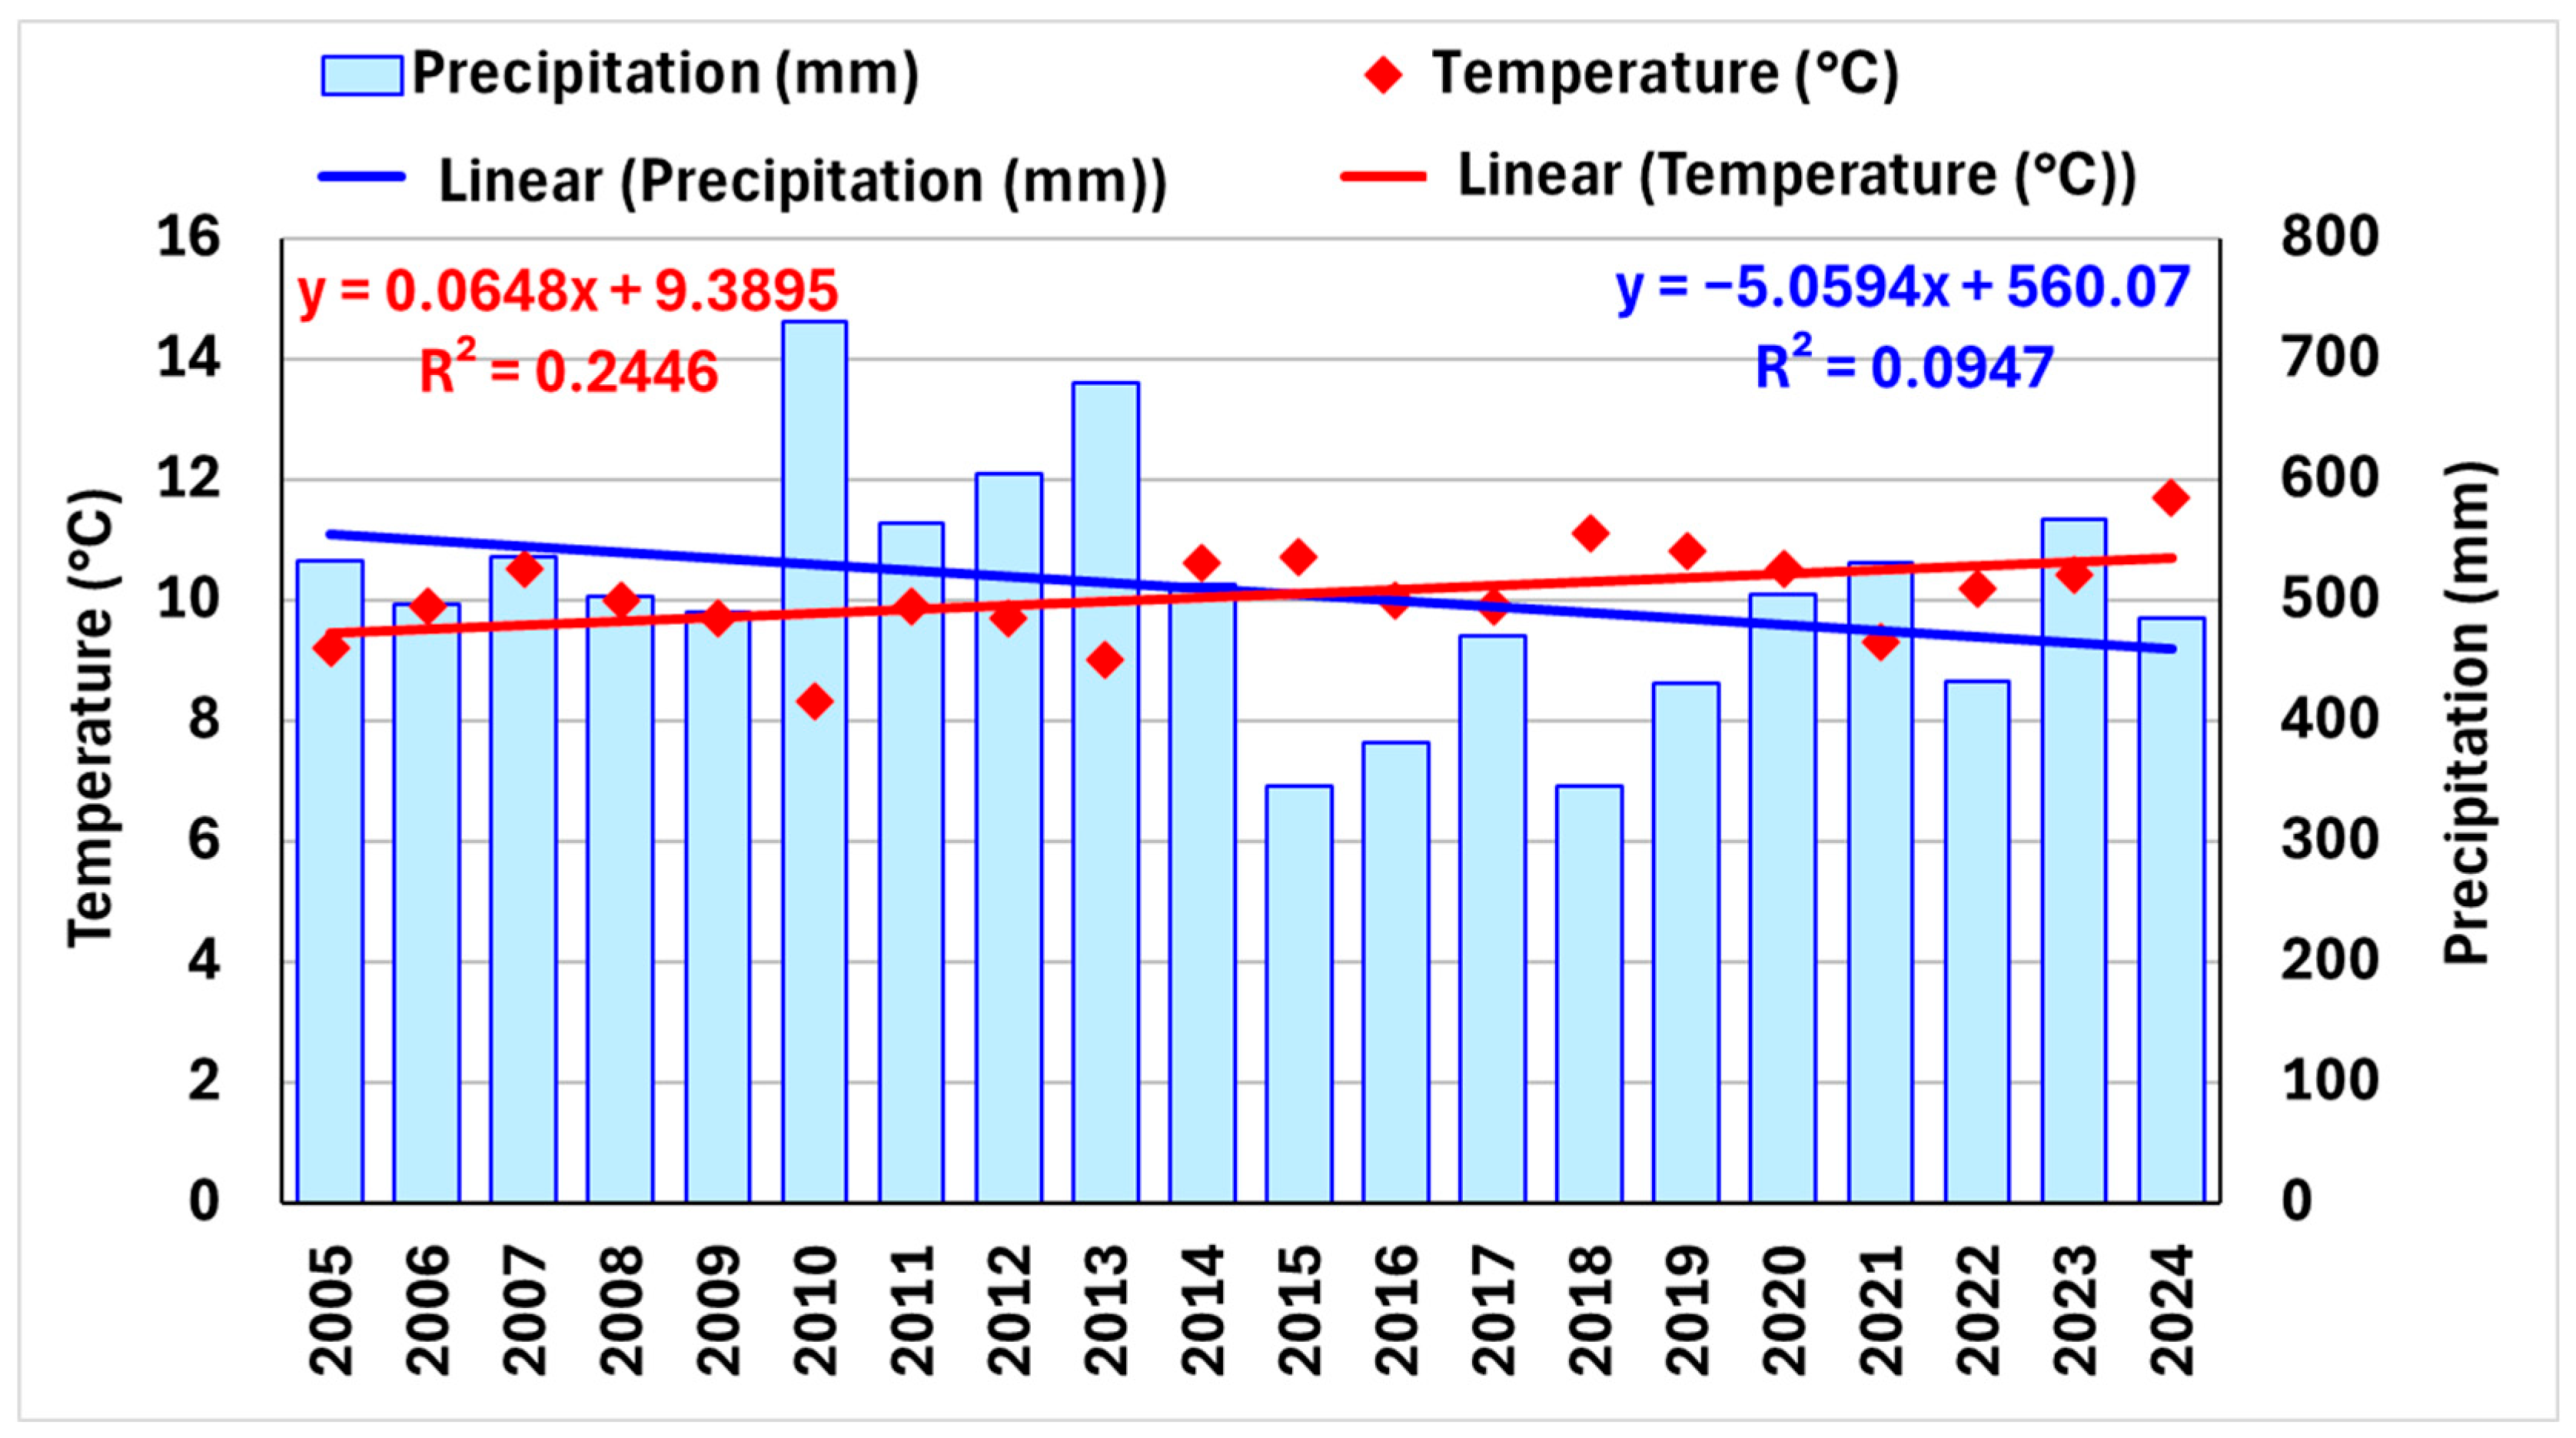
3.4. Air Temperatures and Precipitations
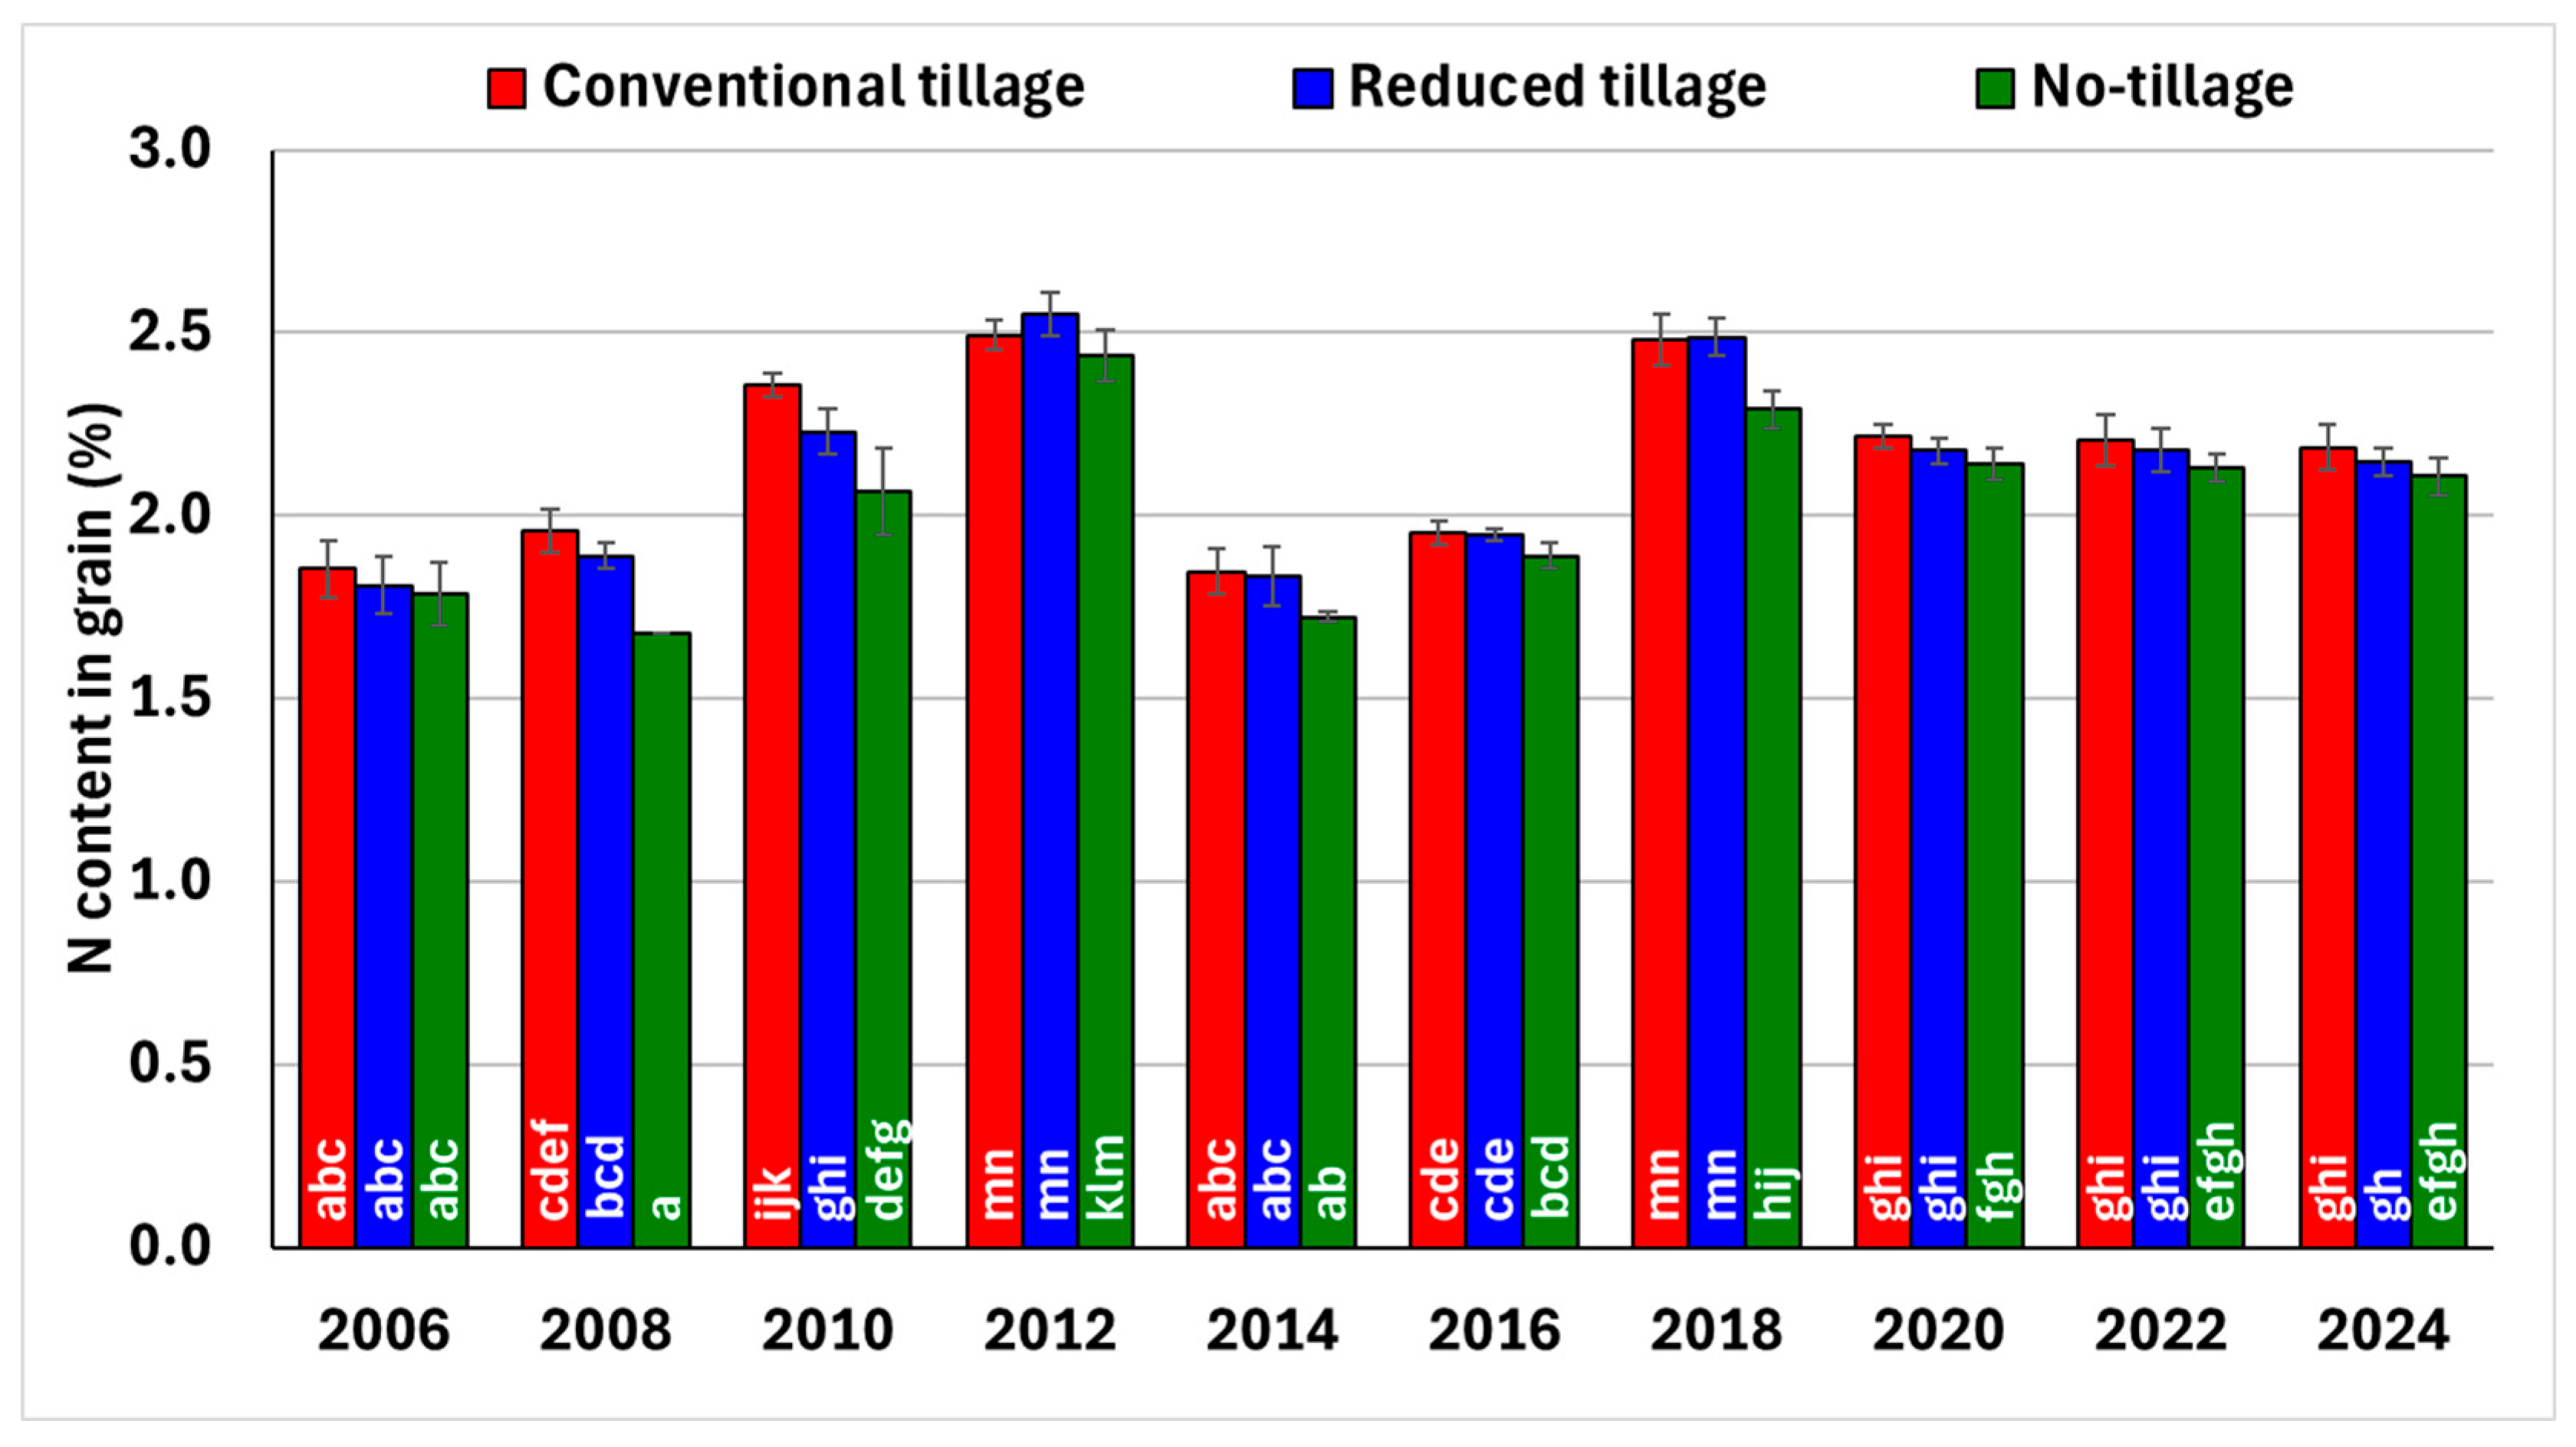
3.5. Winter Wheat Yields and N Content in Grain
4. Discussion
4.1. Soil Organic Carbon
4.2. Microbial Biomass (Cmic)
4.3. Dehydrogenase and Urease Activity
4.4. Air Temperatures and Precipitations
4.5. Winter Wheat Yields and N Content in Grain
5. Conclusions
Author Contributions
Funding
Data Availability Statement
Acknowledgments
Conflicts of Interest
Abbreviations
| CT | conventional tillage |
| RT | reduced tillage |
| NT | no tillage |
| SOC | soil organic carbon |
| SOM | soil organic matter |
| Cmic | soil microbial biomass |
| TTC | trichlortetrazolium chloride |
| TPF | triphenyl formazan |
| N content | nitrogen content |
References
- Zhu, K.; Ran, H.Y.; Wang, F.F.; Ye, X.; Niu, L.A.; Schulin, R.; Wang, G. Conservation tillage facilitated soil carbon sequestration through diversified carbon conversions. Agric. Ecosys. Environ. 2022, 337, 108080. [Google Scholar] [CrossRef]
- Skaalsveen, K.; Ingram, J.; Clarke, L.C. The effect of no-till farming on the soil fiction of water purification and retention in north-western Europe: A literature review. Soil Tillage Res. 2019, 189, 98–109. [Google Scholar] [CrossRef]
- He, L.; Lu, S.; Wang, C.; Mu, J.; Zhang, Y.; Wang, X. Changes in soil organic carbon fractions and enzyme activities in response to tillage practices in the Loess Plateau of China. Soil Tillage Res. 2021, 209, 104940. [Google Scholar] [CrossRef]
- Sae-Tun, O.; Bodner, G.; Rosinger, C.; Zechmeister-Boltenstern, S.; Mentler, A.; Keiblinger, K. Fungal biomass and microbial necromass facilitate soil carbon sequestration and aggregate stability under different soil tillage intensities. Appl. Soil Ecol. 2022, 179, 104599. [Google Scholar] [CrossRef]
- Iocola, I.; Bassu, S.; Farina, R.; Antichi, D.; Basso, B.; Bindi, M.; Dalla Marta, A.; Danuso, F.; Doro, L.; Ferrise, R.; et al. Can conservation tillage mitigate climate change impacts in Mediterranean cereal systems? A soil organic carbon assessment using long term experiments. Eur. J. Agron. 2017, 90, 96–107. [Google Scholar] [CrossRef]
- Sanginés de Cárcer, P.; Sinaj, S.; Santonja, M.; Fossati, D.; Jeangros, B. Long-term effects of crop succession, soil tillage and climate on beat yield and soil properties. Soil Tillage Res. 2019, 190, 209–219. [Google Scholar] [CrossRef]
- Fagodiya, R.K.; Sharma, G.; Verma, K.; Singh, A.; Singh, R.; Sheoran, P.; Rai, A.K.; Prajapat, K.; Kumar, S.; Chandra, P.; et al. Fourteen-years impact of crop establishment, tillage and residue management on carbon input, soil carbon sequestration, crop productivity and profitability of rice-wheat system. Eur. J. Agron. 2024, 161, 127324. [Google Scholar] [CrossRef]
- Torbenson, M.C.A.; Esper, J.; Brázdil, R.; Büntgen, U.; Olesen, J.E.; Semarádová, D.; Vlach, M.; Urban, O.; Balek, J.; Kolář, T.; et al. Past and Future Climate-Driven Changes of Agricultural Land in Central Europe. Geophys. Res. Lett. 2024, 51, e2024GL112363. [Google Scholar] [CrossRef]
- Zahradníček, P.; Trnka, M.; Brázdil, R.; Možný, M.; Štěpánek, P.; Hlavinka, P.; Žalud, Z.; Malý, A.; Semerádová, D.; Dobrovolný, P.; et al. The extreme drought episode of August 2011–May 2012 in the Czech Republic. Int. J. Clim. 2015, 35, 3335–3352. [Google Scholar] [CrossRef]
- Büntgen, U.; Urban, O.; Krusic, P.J.; Rybníček, M.; Kolář, T.; Kyncl, T.; Ač, A.; Koňasová, E.; Čáslavský, J.; Esper, J.; et al. Recent European drought extremes beyond Common Era background variability. Nat. Geosci. 2021, 14, 190–196. [Google Scholar] [CrossRef]
- Meitner, J.; Balek, J.; Bláhová, M.; Semerádová, D.; Hlavinka, P.; Lukas, V.; Jurečka, F.; Žalud, Z.; Klem, K.; Anderson, M.C.; et al. Estimating Drought-Induced Crop Yield Losses at the Cadastral Area Level in the Czech Republic. Agronomy 2023, 13, 1669. [Google Scholar] [CrossRef]
- Al-Kaisi, M.M.; Yin, X.H. Tillage and crop residue effects on soil carbon and carbon dioxide emission in corn-soybean rotations. J. Environ. Qual. 2005, 34, 437–445. [Google Scholar] [CrossRef] [PubMed]
- Lupwayi, N.Z.; Rice, W.A.; Clayton, G.W. Soil microbial biomass and carbon dioxide flux under wheat as influenced by tillage and crop rotation. Ca. J. Soil Sci. 1999, 79, 273–280. [Google Scholar] [CrossRef]
- Parihar, C.M.; Singh, A.K.; Jat, S.L.; Ghosh, A.; Dey, A.; Nayak, H.S.; Parihar, M.D.; Mahala, D.M.; Yadav, R.K.; Rai, V.; et al. Dependence of temperature sensitivity of soil organic carbon decomposition on nutrient management options under conservation agriculture in a sub-tropical Inceptisol. Soil Tillage Res. 2019, 190, 50–60. [Google Scholar] [CrossRef]
- Meng, X.C.; Meng, F.X.; Chen, P.; Hou, D.M.; Zheng, E.N.; Xu, T.Y. A meta-analysis of conservation tillage management effects on soil organic carbon sequestration and soil greenhouse gas flux. Sci. Tot. Environ. 2024, 954, 176315. [Google Scholar] [CrossRef]
- Jat, S.L.; Parihar, C.M.; Dey, A.; Nayak, H.S.; Ghosh, A.; Parihar, N.; Goswami, A.K.; Singh, A.K. Dynamics and temperature sensitivity of soil organic carbon mineralization under medium-term conservation agriculture as affected by residue and nitrogen management options. Soil Tillage Res. 2019, 190, 175–185. [Google Scholar] [CrossRef]
- Buongiorno, G.; Bünemann, E.K.; Oguejiofor, C.U.; Meier, J.; Gort, G.; Comans, R.; Mäder, P.; Brussaard, L.; de Goede, R. Sensitivity of labile carbon fractions to tillage and organic matter management and thein potential as comprehensive soil quality indicators Gross pedoclimatic conditions in Europe. Ecol. Indic. 2019, 99, 38–50. [Google Scholar] [CrossRef]
- Chenu, C.; Angers, D.A.; Barre, P.; Derrien, D.; Arrouayas, D.; Balesdent, J. Increasing organic stocks in agricultural soils: Knowledge gaps and potential innovations. Soil Tillage Res. 2019, 188, 41–52. [Google Scholar] [CrossRef]
- Dao, T.H. Tillage and crop residue effects on carbon dioxide evolution and carbon storage in a Paleustoll. Soil Sci. Soc. Am. J. 1998, 62, 250–256. [Google Scholar] [CrossRef]
- Dalal, R.C.; Allen, D.E.; Wang, W.J.; Reeves, S.; Gibson, I. Organic carbon and total nitrogen stocks in a Vertisol following 40 years of no-tillage, crop residue retention and nitrogen fertilisation. Soil Tillage Res. 2011, 112, 133–139. [Google Scholar] [CrossRef]
- Mühlbachová, G.; Růžek, P.; Kusá, H.; Vavera, R. CO2 Emissions from Soils under Different Tillage Practices and Weather Conditions. Agronomy 2023, 13, 3084. [Google Scholar] [CrossRef]
- Melero, S.; López-Garrido, R.; Murillo, J.M.; Moreno, F. Conservation tillage: Short- and long-term effects on soil carbon fractions and enzymatic activities under Mediterranean conditions. Soil Tillage Res. 2009, 104, 292–298. [Google Scholar] [CrossRef]
- Blagodatskaya, E.; Kuzyakov, Y. Mechanisms of real and apparent priming effects and their dependence on soil microbial biomass and community structure: Critical review. Biol. Fertil. Soils 2008, 45, 115–131. [Google Scholar] [CrossRef]
- Li, Y.; Li, Z.; Cui, S.; Liang, G.P.; Zhang, Q.P. Microbial-derived carbon components are critical for enhancing soil organic carbon in no-tillage croplands: A global perspective. Soil Tillage Res. 2021, 205, 104758. [Google Scholar] [CrossRef]
- Gholamhoseini, M.; Dolatabadian, A.; Habibzadeh, F. Ridge-Furrow Planting System and Wheat Straw Mulching Effects on Dryland, Sunflower Yield, Soil Temperature, and Moisture. Agron. J. 2019, 111, 3383–3392. [Google Scholar] [CrossRef]
- Kahlon, M.S.; Lal, R.; Varughese, M.A. Twenty two years of tillage and mulching impacts on soil physical characteristics and carbon sequestration in Central Ohio. Soil Tillage Res. 2013, 126, 151–158. [Google Scholar] [CrossRef]
- Quin, W.F.; Niu, L.L.; You, Y.L.; Cui, S.; Chen, C.; Li, Z. Effects of conservation tillage and straw mulching on crop yield, water use efficiency, carbon sequestration and economic benefits in the Loess Plateau region of China: A meta-analysis. Soil Tillage Res. 2024, 238, 106025. [Google Scholar] [CrossRef]
- Geisseler, D.; Horwath, W.R.; Joergensen, R.G.; Ludwig, B. Pathways of nitrogen utilization by soil microorganisms—A review. Soil Biol. Biochem. 2010, 42, 2058–2067. [Google Scholar] [CrossRef]
- Rüdiger, R.; Wei, J.; Islam, M.S.; Schmid, C.; Wissel, H.; Schröder, P.; Schloter, M.; Brüggemann, N. Potential of Wheat Straw, Spruce Sawdust, and Lignin as High Organic Carbon Soil Amendments to Improve Agricultural Nitrogen Retention Capacity: An Incubation Study. Front. Plant Sci. 2018, 9, 900. [Google Scholar]
- Lundy, M.E.; Pittelkow, C.M.; Linquist, B.A.; Liang, X.; van Groenigen, K.J.; Lee, J.; Six, J.; Venterea, R.T. Nitrogen fertilization reduces yield declines following no-till adoption. Field Crops. Res. 2015, 183, 204–210. [Google Scholar] [CrossRef]
- Van den Putte, A.; Govers, G.; Diels, J.; Gillijns, K.; Demuzere, M. Assessing the effect of soil tillage on crop growth: A meta-regression analysis on European crop yields under conservation agriculture. Europ. J. Agron. 2010, 33, 231–241. [Google Scholar] [CrossRef]
- Mühlbachová, G.; Růžek, P.; Kusá, H.; Vavera, R.; Káš, M. Nutrient Distribution in the Soil Profile Under Different Tillage Practices During a Long-Term Field Trial. Agronomy 2024, 14, 3017. [Google Scholar] [CrossRef]
- Hejcman, M.; Kunzová, E.; Šrek, P. Sustainability of winter wheat production over 50 years of crop rotation and N, P and K fertilizer application on illimerized luvisol in the Czech Republic. Field Crops. Res. 2012, 139, 30–38. [Google Scholar] [CrossRef]
- IUSS/ISTRIC/FAO. World Reference Base for Soil Resources 2014, Update 2015; FAO: Rome, Italy, 2015. [Google Scholar]
- Walkley, A.; Black, I.A. An Examination of Degtjareff Method for Determining Soil Organic Matter and a Proposed Modification of the Chromic Acid Titration Method. Soil Sci. 1934, 37, 29–37. [Google Scholar] [CrossRef]
- Králová, M.; Dražďák, K.; Pospíšil, F.; Hadačová, V.; Klozová, E.; Luštinec, J.; Kutáček, M.; Sahulka, J. Selected Methods of Chemical Analysis of Soils and Plants; Ceskoslovenska Akademie Ved/Czechoslovak Academy of Sciences: 1991. Available online: https://fao-agris-review-search-zwcsjik2pa-uc.a.run.app/search/en/records/6471e53f2a40512c710e8582 (accessed on 18 March 2025). (In Czech).
- Vance, E.D.; Brookes, P.C.; Jenkinson, D.S. An extraction method for measuring microbial biomass C. Soil Biol. Biochem. 1987, 19, 703–707. [Google Scholar] [CrossRef]
- Nannipieri, P.; Ceccanti, B.; Grego, S. Ecological significance of the biological activity in soil. In Soil Biochemistry; Bollag, J.M., Stotzky, G., Eds.; Marcel Dekker: New York, NY, USA, 1990; Volume 6, pp. 293–355. [Google Scholar]
- Kandeler, E.; Gerber, H. Short-term assay of soil urease activity using colorimetric determination of ammonium. Biol. Fertil. Soils 1988, 6, 68–72. [Google Scholar] [CrossRef]
- Valkama, E.; Kunypiyaeva, G.; Zhapayev, R.; Karabayev, M.; Zhusupbekov, E.; Perego, A.; Schillaci, C.; Sacco, D.; Moretti, B.; Grignani, C.; et al. Can conservation agriculture increase carbon sequestration? A modelling approach. Geoderma 2020, 369, 114298. [Google Scholar] [CrossRef]
- Topa, D.; Cara, I.G.; Jităreanu, G. Long term impact of different tillage systems on carbon pools and stocks, soil bulk density, aggregation and nutrients: A field meta-analysis. Catena 2021, 19, 105102. [Google Scholar] [CrossRef]
- Martínez, I.; Chervet, A.; Weisskopf, P.; Sturny, W.G.; Etana, A.; Stettler, M.; Forkman, J.; Keller, T. Two decades of no-till in the Oberracker long-term field experiment: Part, I. Crop yield, soil organic carbon and nutrient distribution in the soil profile. Soil Tillage Res. 2016, 163, 141–151. [Google Scholar] [CrossRef]
- Minasny, B.; Malone, B.P.; McBratney, A.B.; Angers, D.A.; Arrouays, D.; Chambers, A.; Chaplot, V.; Chen, Z.S.; Cheng, K.; Das, B.S.; et al. Soil carbon 4 per mille. Geoderma 2017, 292, 59–86. [Google Scholar] [CrossRef]
- Keel, S.G.; Anken, T.; Büchi, L.; Chervet, A.; Fliessbach, A.; Flisch, R.; Huguenin-Elie, O.; Mäder, P.; Mayer, J.; Sinaj, S.; et al. Loss of soil organic carbon in Swiss long-term agricultural experiments over a wide range of management practices. Agr. Ecosyst. Environ. 2019, 286, 106654. [Google Scholar] [CrossRef]
- Kumar, V.; Gathala, M.K.; Saharawat, Y.S.; Parihar, C.M.; Kumar, R.; Kumar, R.; Jat, M.L.; Jat, A.S.; Mahala, D.M.; Kumar, L.; et al. Impact of Tillage and crop establishment methods on crop yields, profitability and soil physical properties in rice-wheat system of Indo-Gangetic plains of India. Soil Use Manag. 2019, 35, 303–313. [Google Scholar] [CrossRef]
- Blanco-Canqui, H.; Ruis, S.J. No-tillage and soil physical environment. Geoderma 2018, 326, 164–200. [Google Scholar] [CrossRef]
- Pandey, D.; Agrawal, M.; Bohra, J.S. Effects of conventional tillage and no-tillage permutations on extracellular enzyme activities and microbial biomass under rice cultivation. Soil Tillage Res. 2014, 136, 51–60. [Google Scholar] [CrossRef]
- Ahl, C.; Joergensen, R.G.; Kandeler, E.; Meyer, B.; Woeler, V. Microbial biomass and activity in silt and sand kams after long-term shallow tillage in central Germany. Soil Tillage Res. 1998, 49, 93–104. [Google Scholar] [CrossRef]
- Leyrer, V.; Blum, J.; Marhan, S.; Kandeler, E.; Zimmermann, T.; Berauer, B.J.; Schweiger, A.H.; Canarini, A.; Richter, A.; Poll, C. Drought Impacts on Plant-Soil Carbon Allocation-Integrating Future Mean Climatic Conditions. Glob. Change Biol. 2025, 31, e70070. [Google Scholar] [CrossRef]
- Balota, E.L.; Kanashiro, M.; Filho, A.C.; Andrade, D.S.; Dick, R.P. Soil enzyme activities under long-term tillage and crop rotation systems in subtropical agro-ecosystems. Braz. J. Microbiol. 2004, 35, 300–306. [Google Scholar] [CrossRef]
- de Santiago, A.; Recena, R.; Perea-Torres, F.; Moreno, M.T.; Carmona, E.; Delgado, A. Relationship of soil fertility to biochemical properties under agricultural practices aimed at controlling land degradation. Land Degrad. Dev. 2019, 30, 1121–1129. [Google Scholar] [CrossRef]
- Omidi, H.; Tahmasebi, Z.; Torabi, H.; Miransari, M. Soil enzymatic activities and available P and Zn as affected by tillage practices, canola (Brassica napus L.) cultivars and planting dates. Eur. J. Soil Biol. 2008, 44, 443–450. [Google Scholar] [CrossRef]
- Daunoras, J.; Kacergius, A.; Gudiukait, R. Role of Soil Microbiota Enzymes in Soil Health and Activity Changes Depending on Climate Change and the Type of Soil Ecosystem. Biology 2024, 13, 85. [Google Scholar] [CrossRef]
- Sandor, M.S.; Brad, T.; Maxim, A.; Toader, C. The Influence of Selected Meteorological Factores on Microbial biomass of Two Organic Fertilizers. Energies 2011, 39, 107–113. [Google Scholar]
- Grzyb, A.; Wolna-Maruwka, A. Niewiadmska, A. Environmental Factors Affecting the Mineralization of Crop Residues. Agronomy 2020, 10, 1951. [Google Scholar] [CrossRef]
- Noor, M.A.; Nawaz, M.M.; Ma, W.; Zhao, M. Wheat straw mulch improves summer maize productivity and soil properties. Ital. J. Agron. 2021, 16, 1623. [Google Scholar] [CrossRef]
- Akmal, M.; Altaf, M.S.; Hayat, R.; Hassan, F.U.; Islam, M. Temporal changes in soil urease, alcaline phosphatase and dehydrogenase aktivity in rainfed wheat field in Pakistan. J. Anim. Plant Sci. 2012, 22, 457–462. [Google Scholar]
- Vargas, V.P.; Soares, J.R.; Oliveira, B.G.; Lourenco, K.S.; Martins, A.A.; Del Grosso, S.J.; do Carmo, J.B.; Canratella, H. Sugarcane Straw, Soil Temperature, and Nitrification inhibitor Impact N2O Emissions from N Fertilizer. Bioenerg. Res. 2019, 12, 801–812. [Google Scholar] [CrossRef]
- Cheschire, M.V.; Bedrock, C.N.; Williams, B.L.; Chapman, S.J.; Solntseva, I.; Thompsen, I. The immobilization of nitrogen by straw decomposing in soil. Eur. J. Soil Sci. 1999, 50, 329–341. [Google Scholar] [CrossRef]
- Buczek, J. The effect of tillage systems and weed control methods on grain yield and gluten protein compositional and content-related changes in hybrid bread wheat. Agriculture 2024, 14, 1558. [Google Scholar] [CrossRef]
- Ahmadi, H.; Hosseini, H.M.; Moshiri, F.; Alikhani, H.A.; Etesami, H. Impact of varied tillage practices and phosphorus fertilization regimes on wheat yield and grain quality parameters in a five-year corn-wheat rotation system. Sci. Rep. 2024, 14, 14717. [Google Scholar] [CrossRef]
- Sarker, J.R.; Singh, B.P.; Cowie, A.L.; Fang, Y.F.; Collins, D.; Dougherty, W.J.; Singh, B.K. Carbon and nutrient mineralisation dynamics in aggregate-size classes from different tillage systems after input of canola and wheat residues. Soil Biol. Biochem. 2018, 116, 22–38. [Google Scholar] [CrossRef]
- Mairashi, M.A.; Obour, A.K.; Moorberg, C.J.; Lollatom, R.P.; Holamn, J.D.; Du, J.; Mikha, M.M.; Assefa, Y. Tillage and nitrogen rate effects on winter wheat yield in a wheat–sorghum rotation. Ca. J. Soil Sci. 2023, 103, 671–683. [Google Scholar] [CrossRef]
- Buczek, J.; Migut, D.; Jańczak-Pieniążek, M. Effect of Soil Tillage Practice on Photosynthesis, Grain Yield and Quality of Hybrid Winter Wheat. Agriculture 2021, 11, 479. [Google Scholar] [CrossRef]
- Gawęda, D.; Haliniarz, M. Grain Yield and Quality of Winter Wheat Depending on Previous Crop and Tillage System. Agriculture 2021, 11, 133. [Google Scholar] [CrossRef]
- Junod, M.F.; Reid, B.; Sims, I.; Miller, A.J. Cover crops in cereal rotations: A quantitative review. Soil Tillage Res. 2024, 238, 105997. [Google Scholar] [CrossRef]
- Attia, A.; Shawon, R.; de Kock, A.; Strassemeyer, J. Do rotations with cover crops increase yield and soil organic carbon?—A modeling study in southwest Germany. Agric. Ecosys. Environ. 2024, 375, 109167. [Google Scholar] [CrossRef]


| Tillage | CT | RT | NT |
|---|---|---|---|
| Relationship | |||
| SOC (%) × Cmic | ns | 0.790 *** | 0.909 *** |
| SOC (%) × Dehydrogenase activity | 0.353 ** | 0.840 *** | 0.843 *** |
| SOC (%) × Urease activity | ns | 0.784 *** | 0.276 * |
| Cmic × Dehydrogenase activity | ns | 0.717 *** | 0.828 *** |
| Cmic × Urease activity | ns | 0.707 *** | 0.295 ** |
| Temperature (°C) | Precipitation (mm) | |||||||||
|---|---|---|---|---|---|---|---|---|---|---|
| Days Before Sampling | ||||||||||
| Year | 7 | 14 | 28 | 42 | 61 | 7 | 14 | 28 | 42 | 61 |
| 2005 | 12.2 | 12.0 | 11.5 | 11.3 | 9.3 | 21 | 63 | 67 | 75 | 79 |
| 2006 | 14.0 | 14.9 | 14.2 | 12.9 | 10.0 | 30 | 67 | 88 | 129 | 155 |
| 2007 | 21.3 | 16.7 | 15.6 | 14.7 | 11.6 | 0 | 36 | 37 | 39 | 48 |
| 2008 | 11.4 | 13.6 | 12.4 | 11.1 | 8.8 | 30 | 59 | 92 | 122 | 133 |
| 2009 | 17.1 | 14.4 | 14.1 | 14.1 | 11.2 | 26 | 59 | 69 | 83 | 102 |
| 2010 | 11.6 | 11.2 | 11.7 | 10.6 | 8.8 | 7 | 64 | 67 | 102 | 114 |
| 2011 | 15.9 | 13.3 | 13.3 | 12.5 | 10.5 | 9 | 30 | 38 | 49 | 84 |
| 2012 | 19.3 | 14.9 | 15.4 | 13.1 | 10.7 | 0 | 12 | 22 | 58 | 68 |
| 2013 | 11.2 | 13.6 | 13.3 | 12.4 | 8.7 | 16 | 46 | 69 | 84 | 93 |
| 2014 | 16.9 | 13.0 | 13.0 | 11.8 | 10.6 | 44 | 83 | 107 | 114 | 145 |
| 2015 | 13.2 | 14.1 | 12.9 | 11.7 | 9.3 | 10 | 25 | 52 | 56 | 84 |
| 2016 | 12.2 | 13.4 | 11.0 | 10.9 | 8.8 | 0 | 9 | 16 | 26 | 39 |
| 2017 | 16.0 | 15.1 | 12.6 | 11.2 | 9.6 | 1 | 20 | 49 | 69 | 97 |
| 2018 | 18.6 | 17.2 | 16.6 | 16.1 | 12.1 | 6 | 26 | 31 | 44 | 47 |
| 2019 | 14.3 | 11.7 | 10.9 | 13.5 | 12.1 | 20 | 40 | 66 | 66 | 68 |
| 2020 | 11.7 | 11.4 | 11.9 | 11.8 | 10.1 | 26 | 27 | 39 | 40 | 51 |
| 2021 | 11.9 | 13.0 | 11.4 | 9.6 | 8.8 | 2 | 63 | 101 | 108 | 116 |
| 2022 | 18.2 | 18.1 | 15.4 | 13.1 | 11.1 | 20 | 20 | 23 | 47 | 73 |
| 2023 | 14.7 | 14.1 | 12.5 | 11.4 | 9.7 | 0 | 8 | 13 | 44 | 77 |
| 2024 | 15.9 | 14.9 | 13.9 | 12.8 | 12.4 | 8 | 25 | 26 | 37 | 42 |
Disclaimer/Publisher’s Note: The statements, opinions and data contained in all publications are solely those of the individual author(s) and contributor(s) and not of MDPI and/or the editor(s). MDPI and/or the editor(s) disclaim responsibility for any injury to people or property resulting from any ideas, methods, instructions or products referred to in the content. |
© 2025 by the authors. Licensee MDPI, Basel, Switzerland. This article is an open access article distributed under the terms and conditions of the Creative Commons Attribution (CC BY) license (https://creativecommons.org/licenses/by/4.0/).
Share and Cite
Mühlbachová, G.; Kusá, H.; Růžek, P.; Vavera, R.; Káš, M. Soil Organic Carbon Sequestration and Distribution, Soil Biological Characteristics, and Winter Wheat Yields Under Different Tillage Practices in Long-Term Field Experiment. Agronomy 2025, 15, 947. https://doi.org/10.3390/agronomy15040947
Mühlbachová G, Kusá H, Růžek P, Vavera R, Káš M. Soil Organic Carbon Sequestration and Distribution, Soil Biological Characteristics, and Winter Wheat Yields Under Different Tillage Practices in Long-Term Field Experiment. Agronomy. 2025; 15(4):947. https://doi.org/10.3390/agronomy15040947
Chicago/Turabian StyleMühlbachová, Gabriela, Helena Kusá, Pavel Růžek, Radek Vavera, and Martin Káš. 2025. "Soil Organic Carbon Sequestration and Distribution, Soil Biological Characteristics, and Winter Wheat Yields Under Different Tillage Practices in Long-Term Field Experiment" Agronomy 15, no. 4: 947. https://doi.org/10.3390/agronomy15040947
APA StyleMühlbachová, G., Kusá, H., Růžek, P., Vavera, R., & Káš, M. (2025). Soil Organic Carbon Sequestration and Distribution, Soil Biological Characteristics, and Winter Wheat Yields Under Different Tillage Practices in Long-Term Field Experiment. Agronomy, 15(4), 947. https://doi.org/10.3390/agronomy15040947