Article

Yield, Stability, and Adaptability of Hybrid Japonica Rice Varieties in the East Coast of China

by
Rujia Chen
1,2,3,4,
Gaobo Wang
1,2,
Junjie Yu
5,
Yue Lu
1,2,
Tianyun Tao
1,2,
Zhichao Wang
1,2,
Yu Hua
1,2,
Nian Li
1,2,
Hanyao Wang
1,2,
Ahmed Gharib
1,2,
Yong Zhou
1,2,
Yang Xu
1,2,
Pengcheng Li
1,2,
Chenwu Xu
1,2,3,4 and
Zefeng Yang
1,2,3,4,*
1
Jiangsu Key Laboratory of Crop Genomics and Molecular Breeding/Zhongshan Biological Breeding Laboratory/Key Laboratory of Plant Functional Genomics of the Ministry of Education/Jiangsu Key Laboratory of Crop Genetics and Physiology, Agricultural College of Yangzhou University, Yangzhou 225009, China
2
Jiangsu Co-Innovation Center for Modern Production Technology of Grain Crops, Yangzhou University, Yangzhou 225009, China
3
Joint International Research Laboratory of Agriculture and Agri-Product Safety of the Ministry of Education, Yangzhou University, Yangzhou 225009, China
4
Yangzhou Modern Seed Innovation Institute, Yangzhou 225600, China
5
Jiangsu Provincial Seed Southern Propagation and Identification Station, Nanjing 210017, China
*
Author to whom correspondence should be addressed.
Agronomy 2025, 15(4), 901; https://doi.org/10.3390/agronomy15040901
Submission received: 19 February 2025 / Revised: 30 March 2025 / Accepted: 1 April 2025 / Published: 3 April 2025
(This article belongs to the Section Crop Breeding and Genetics)

Abstract

:
The high yield potential and stability of hybrid japonica rice varieties are crucial for sustainable agricultural development and food security. Rice varieties must undergo rigorous testing through multi-site regional trials before being introduced to the market in China. The assessment of these regional trials is essential for guiding rice breeding. In this study, we evaluated the yield performance of 13 hybrid japonica rice genotypes (g1–g13) across six regional trial sites (e1–e6) in Jiangsu province, China. Variance analysis revealed that genotype (G), environment (E), and genotype-by-environment (G × E) interactions significantly influenced the yield of hybrid japonica rice varieties. The effects of G × E interactions on the yield potential and stability of these tested rice varieties were further analyzed using Genotype plus Genotype-by-Environment interaction (GGE) biplot and additive main effects and multiplicative interaction (AMMI) model analyses. The results reveal that Zhegengyou2035 (g4) and Changyou20-2 (g3) exhibited superior yield potential and stability, while Huazhongyou9413 (g12) exhibited broad adaptability. Additionally, the assessment of discrimination and representativeness among regional trial sites revealed that the Wujin Rice Research Institute (e6) served as an optimal testing location. Our findings identify the most suitable rice varieties for the area and assess their potential as initial material in the selection processes for breeding new varieties. Additionally, this work contributes to the strategic selection of optimal testing locations.

1. Introduction

Rice (Oryza sativa L.), a crucial staple food crop worldwide, is a central focus of breeding programs aimed at enhancing both agricultural yield and nutritional value to satisfy the growing demands of the global population. The research and widespread application of hybrid rice represent a landmark achievement by Chinese scientists, significantly contributing to global food security [1,2]. This breakthrough not only addressed the challenge of feeding the Chinese population but also made a substantial impact on alleviating hunger worldwide. With the implementation of the “Super Hybrid Rice Breeding Plan” and “China Super Rice Breeding and Experimental Demonstration” project, an increasing number of high-yielding, superior-quality, and widely adaptable super-hybrid rice varieties are being developed [1]. Regional trials of crop varieties play a crucial role in both certifying new varieties and informing their strategic dissemination. These trials subject newly developed varieties and combinations to standardized testing protocols, allowing for a comprehensive evaluation of key agronomic traits. The assessment focuses on critical characteristics such as yield potential, yield stability, environmental adaptability, stress resistance, and quality. This systematic approach ensures a thorough examination of each variety’s performance across various trial sites, providing valuable insights for agricultural advancement and crop improvement. However, the complex interaction between genotype and environment presents a significant challenge in accurately assessing the yield stability and regional adaptability of test varieties [3].
Crop variety regional trials typically involve multiple testing sites over one or more growing seasons, generating complex datasets [4] A critical challenge in these trials is effectively utilizing these intricate data to objectively evaluate tested varieties. The ultimate goal is to identify varieties that achieve high and stable yields across a range of environments, along with strong adaptability [5,6]. Therefore, developing robust methodologies for analyzing and interpreting these complex data is essential for improving the efficacy of regional variety trials and informing varietal selection decisions. The additive main effects and multiplicative Interaction (AMMI) model is a powerful analytical tool for assessing the yield stability and adaptability of crop varieties across diverse environmental conditions [7,8]. This approach integrates principal component analysis with variance analysis, highlighting genotype-by-environment interactions [9,10]. Despite its effectiveness, the AMMI model has limitations. One notable drawback is its insufficient consideration of absolute yield performance, which may result in overlooking high-yielding varieties. Consequently, the model falls short in providing a comprehensive evaluation that balances both yield potential and stability—two critical factors in varietal assessment. The genotype plus genotype-by-environment interaction (GGE) analysis method effectively addresses this limitation [11]. Additionally, the “which won where” and “discriminativeness and representativeness” functions in GGE biplots enable an effective evaluation of test site characteristics while accounting for genotype–environment interactions [12]. This facilitates the classification of ecological regions for various varieties. Due to its comprehensive approach, the GGE biplot analysis method has gained widespread adoption in regional crop variety trials and in the evaluation of high and stable yields of germplasm materials [12,13,14,15,16].
Jiangsu Province is one of the major rice-producing areas in China, boasting a rice cultivation area exceeding 2.2 million hectares [17]. Currently, three main types of rice are grown in Jiangsu Province: conventional japonica rice, hybrid indica rice, and hybrid japonica rice. In addition, Jiangsu Province has established a robust foundation in rice breeding. Several varieties developed in the province have gained national recognition and widespread influence [18]. In recent years, Jiangsu Province has developed a comprehensive series of plans in hybrid japonica rice breeding, aimed at improving rice yield, quality, and stress resistance through scientific and technological innovation and policy support. Additionally, provincial joint trials for regional testing have been established to expedite the screening of varieties and evaluate their adaptability to different regions. In this study, we employed both the GGE biplot and AMMI model to analyze data from the 2021 annual regional trial of late hybrid japonica rice in Jiangsu Province. This analysis comprehensively evaluated the yield potential, stability, and adaptability of 13 hybrid japonica rice varieties across six regional trial sites. Additionally, we assessed the discrimination and representativeness of each ecological area. Our findings elucidate which rice varieties are most suitable for the area and whether they can serve as initial material in the selection process for breeding new varieties, as well as contribute to the strategic selection of optimal testing locations.

2. Materials and Methods

2.1. Description of the Regional Trial Sites

The regional trials were conducted at six different environments of Jiangsu Province, China (Figure 1). Jiangsu Province Zone is located between 30°45′ N and 35°08′ N latitudes and 116°21′ E and 121°56′ E longitudes. The landscape features a mix of plains, rivers, and lakes, complemented by a mild climate and fertile soil. This rich agricultural environment has earned it the reputation of being the “land of fish and rice”. The district is renowned for its cultivation of a variety of staple crops, primarily rice, maize, wheat, and barley. Six sites were designated for regional trials, labeled e1 through e6, comprising the following research institutions: Changshu Research Institute of Agricultural Sciences (e1), Jiangsu Academy of Agricultural Sciences (e2), Suzhou Seed Administration Station (e3), Jiangsu Taihu Area Institute of Agricultural Sciences (e4), Wuxi Agricultural Technology Extension Station (e5), and Wujin Rice Research Institute (e6).

2.2. Plant Materials

A total of 13 hybrid japonica rice varieties participated in the 2021 Jiangsu Province Late Hybrid Japonica Regional Trials, labeled g1 through g13 as follows: g1, Yongyou75; g2, Changyou19-19; g3, Changyou20-2; g4, Zhegengyou2035; g5, Shuyou212; g6, Zhegengyou2039; g7, Tianlongyou515; g8, Tongyougeng20-1; g9, Yongyou1836; g10, Zheyou921; g11, Zhongkenyou1922; g12, Huazhongyou9413; and g13, Yongyou1540. Among them, the certified variety Yongyou1540 (g13) was chosen as the control due to its high yield performance and widespread cultivation in major rice-producing regions of China.

2.3. Experimental Design and Management

The trials employed a randomized block design with three replications at each location. Individual plots, each dedicated to a single genotype, were established within uniform areas. Test plot area: 13.3–15.0 m2. Plant and row spacing: (13.2–16.5) × 30 cm. Rice seedlings per hole ranged from one to four, with an average of 80 seedlings per square meter. Similar agronomic practices were performed across different regional trial sites, including fertilization, pest control, and irrigation, to ensure optimal crop performance. Fertilizer application and crop management were adjusted according to local productivity levels, with topdressing applied one to four times, weeding conducted 1 to 4 times, and pest control measures implemented one to four times as needed. Data on grain yield at the maturity stage in each plot were collected and then converted to tons per hectare (t/hm2).

2.4. Description of the Influence of Climatic Conditions on the Growth of Rice

During this year’s rice growth period, the early vegetative stage experienced abundant rainfall but insufficient sunlight, promoting new shoot emergence and tiller formation but hindering robust seedling development. From mid-July through August, above-average rainy days impeded root system expansion, resulting in softer stems and taller plants. In the late grain-filling stage, strong typhoons and persistent rainfall caused widespread lodging, disrupting the grain-filling process. Some plants exhibited pre-harvest sprouting. These adverse conditions significantly impacted both rice quality and yield.

2.5. Data Analysis

2.5.1. Variance Analysis

The collected data were subjected to analysis of variance (ANOVA) to partition the main effects of genotype (G) and environment (E) and their interaction effect (G × E) on grain yield. ANOVA analysis was performed using “agricolae” package in R v4.3.3. Significant interactions prompted further analysis using both the additive main effects and multiplicative interaction (AMMI) model and the genotype plus genotype-by-environment (GGE) biplot.

2.5.2. AMMI Analysis

The AMMI analysis is a statistical approach for evaluating the effects of genotype and environment in multi-environment trials [10,19,20]. The AMMI model contributes to comprehending and visualizing the intricate genotype-by-environment interaction, making it possible to identify stable genotypes across different environments and assess crop yield stability. This method integrates ANOVA and principal component analysis (PCA) to assess the multiplicative effects of the genotype-by-environment interaction. AMMI model first decomposes the variation into the main effects of genotype (G) and environment (E), as well as the G × E interaction effect, using ANOVA. The interaction effect is then further decomposed into several significant principal component axes through PCA. The analysis of the interaction effect is conducted by calculating the sum of the products of the eigenvalues of each IPCA and the vector values of genotype and environmental characteristics along the respective axes [21].The stability parameters of genotype and environment are calculated by the Euclidean distance from the point where they are located in several significant IPCA axis spaces to the origin [22]. The specific calculation method is as follows:
D g = k m I P C A g k 2
Dg represents the genotypic stability parameters. m is the number of significant IPCAs. IPCAgk refers to the k-th principal component eigenvector value of genotype g.
AMMI analysis was conducted using “agricolae” package in R version 4.3.3. Stability parameters were calculated using Microsoft Excel software version 16.

2.5.3. GGE Biplot Assessment

GGE biplots were constructed to visualize the performance and interaction of genotypes across different environments. These biplots were utilized to identify ideal genotypes that exhibit both high mean yield and stability, as well as to characterize the testing environments in terms of representativeness and discrimination. In the GGE biplot analysis, the first step is to centralize the data from the regional trials by location. This involves calculating the difference between the yield data of each test variety at any given location and the average yield of all test varieties at that location. This process ensures that the treatment effect in the data only includes the genotype (G) and the genotype-by-environment (G × E) interaction effect. Subsequently, a PCA model is applied to perform eigenvalue decomposition on the yield data of the test varieties. The first two principal components are retained as the two coordinate axes of the biplot. GGE biplot analyses were performed using the “GGEBiplots” package [23] in R version 4.3.3.

3. Results

3.1. Variance Analysis and AMMI Model Analysis for Grain Yield of Hybrid Japonica Rice Varieties

The yield data collected are presented in Table 1. The average yield of 13 varieties in each of six regional trial sites ranged from 10.72 to 12.15 t/hm2, with low coefficients of variation (4.36% to 7.72%). In addition, the average yield of these varieties tested at six sites ranged from 10.6 to 12 t/hm2, with coefficients of variation ranging from 3.8% to 8.19%. These results indicate relatively low yield variability among the different varieties. The ANOVA results showed that genotype (G), environment (E), and genotype-by-environment (G × E) interaction significantly influenced rice grain yield, accounting for 17.19%, 32.52%, and 33.74% of the total sum of squares of variation, respectively (Table 2). These findings suggest that variations in grain yield among the tested hybrid japonica rice varieties are attributed to genotypic differences and environmental factors and their interaction.
The interaction principal component analysis (IPCA) within the AMMI model revealed that the G × E interaction effect can be decomposed into four significant components (IPCA1-IPCA4), which account for 35.28%, 29.53%, 19.57%, and 12.77% of the interaction effect, respectively (Table 2). Together, these four principal component axes explain 97.15% of the total sum of squares of the interaction effect, indicating that the principal component analysis has provided a comprehensive examination of the interaction effect.

3.2. AMMI Biplot Analysis and Stability Parameter Estimation

The AMMI model was employed to create an AMMI biplot, with the average yield as the horizontal axis and IPCA1 value as the vertical axis (Figure 2a). In this biplot, a horizontal line was drawn at an IPCA1 value of 0, and a vertical line was drawn at the average yield of all varieties, dividing the coordinate plane into four quadrants. For the varieties under examination, the interpretation of the biplot is as follows. (1) Yield potential: The further right a variety’s point is positioned on the horizontal axis, the higher its yield potential. (2) Yield stability: The closer a variety’s point is to the horizontal line at IPCA1 value of 0 (i.e., the smaller its vertical distance from this line), the greater its yield stability. The results revealed that, in terms of yield potential, Huazhongyou9413 (g12) exhibited the highest performance, followed by Zhegengyou2035 (g4), Changyou20-2 (g3), Zheyou921 (g10), Changyou19-19 (g2), Shuyou212 (g5), Zhongkenyou1922 (g11), and Zhegengyou2039 (g6). Notably, the grain yields of these eight varieties surpassed that of the control variety, Yongyou1540 (g13, CK). Regarding yield stability, Zhongkenyou1922 (g11) achieved the highest performance, followed by Changyou20-2 (g3), with both varieties exhibiting superior yield stability compared to Yongyou1540 (g13, CK). The vertical distance of each trial site from the horizontal line is indicative of its discrimination; the greater this distance, the better the site’s ability to differentiate between varieties (Figure 2). The results revealed that the trial sites with superior distinguishing ability were Wuxi Agricultural Technology Extension Station (e5) and Wujin Rice Research Institute (e6).
However, the IPCA1 selected in these analyses accounted for only 35.28% of the total variation among the significant principal component axes, while the IPCA2 and IPCA3 contributed an additional 49.1% of the variation (Table 2). To capture more information about interactions, we further utilized the biplot graph generated from the AMMI3 model analysis by combining the first three main axes in pairs (Figure 2b–d). The biplots of IPCA1 vs. IPCA2 and IPCA1 vs. IPCA3 identified Yongyou1540 (g13, CK) and Changyou20-2 (g3) as stable genotypes, while Wuxi Agricultural Technology Extension Station (e5) and Wujin Rice Research Institute (e6) were recognized as highly discriminative environments (Figure 2b,c). By contrast, the biplot of IPCA2 vs. IPCA3 identified Tianlongyou515 (g8) and Zheyou921 (g10) as the most stable genotypes, while Jiangsu Academy of Agricultural Sciences (e2) and Suzhou Seed Administration Station (e3) demonstrated strong discriminating ability (Figure 2d).
To provide a more comprehensive analysis, we employed the method developed by Zhang et al. [22] to calculate stability parameters for both varieties and regional trial sites. In terms of yield stability among varieties, the control variety, Yongyou1540 (g13, CK) achieved the best performance, followed by Tianlongyou515 (g7), Changyou20-2 (g3), Zhegengyou2035 (g4), Shuyou212 (g5), and Yongyou75 (g1). These varieties ranked in the top 50% for stability parameters among all the tested varieties, suggestive of their relatively good yield stability compared to the others (Table 3). Regarding the discrimination of regional trial sites, Wujin Rice Research Institute (e6), Changshu Research Institute of Agricultural Sciences (e1), and Suzhou Seed Administration Station (e3) showed relatively strong performances (Table 4). The stability parameters incorporate all IPCA values that reach a significant level, making the results more robust than those derived from using only the IPCA1 value. Consequently, the AMMI model combined with stability parameters provides a more accurate measurement of varietal yield stability. Based on the comprehensive analysis of these results, we can conclude that Changyou20-2 (g3) displayed superior yield stability among the tested varieties, while Wujin Rice Research Institute (e6) exhibited the strongest discrimination among the regional trial sites. These findings provide crucial insights for future rice breeding programs and the selection of optimal testing locations.

3.3. GGE Biplot Analysis

3.3.1. Yield Potential and Stability Analysis

Variance analysis revealed that genotypes and genotype–environment interaction ef fects (G + G × E) accounted for 50.93% of the total variation (Table 2). Further decomposition of the G + G × E variation through principal component analysis yielded two components: The first principal component (PC1) explained 43.58% of the G + G × E variation, while the second principal component (PC2) accounted for an additional 19.58%. The GGE biplot was used to construct a function chart illustrating “mean vs. stability” (Figure 3). In this chart, the small circle represents the “average environment”, while the straight line with a single arrow passing through the biplot origin and the average environment indicates the average environment axis. The closer a variety’s projection on this axis is to the direction of the arrow, the better its yield potential. The yield stability of a variety is reflected by the distance between its point and the average environment axis; shorter distances indicate better yield stability. In this analysis, the varieties identified with high yield potential included Huazhongyou9413 (g12), Zheyou921 (g10), Zhegengyou2035 (g4), Changyou20-2 (g3), Zhongkenyou1922 (g11), and Zhegengyou2039 (g6). The average yield of these varieties surpassed that of the control variety the control variety, Yongyou1540 (g13, CK). Regarding yield stability, Zheyou921 (g10) exhibited the best performance, followed by Changyou19-19 (g2), Tianlongyou515 (g7), Yongyou1540 (g13, CK), and Shuyou212 (g5).

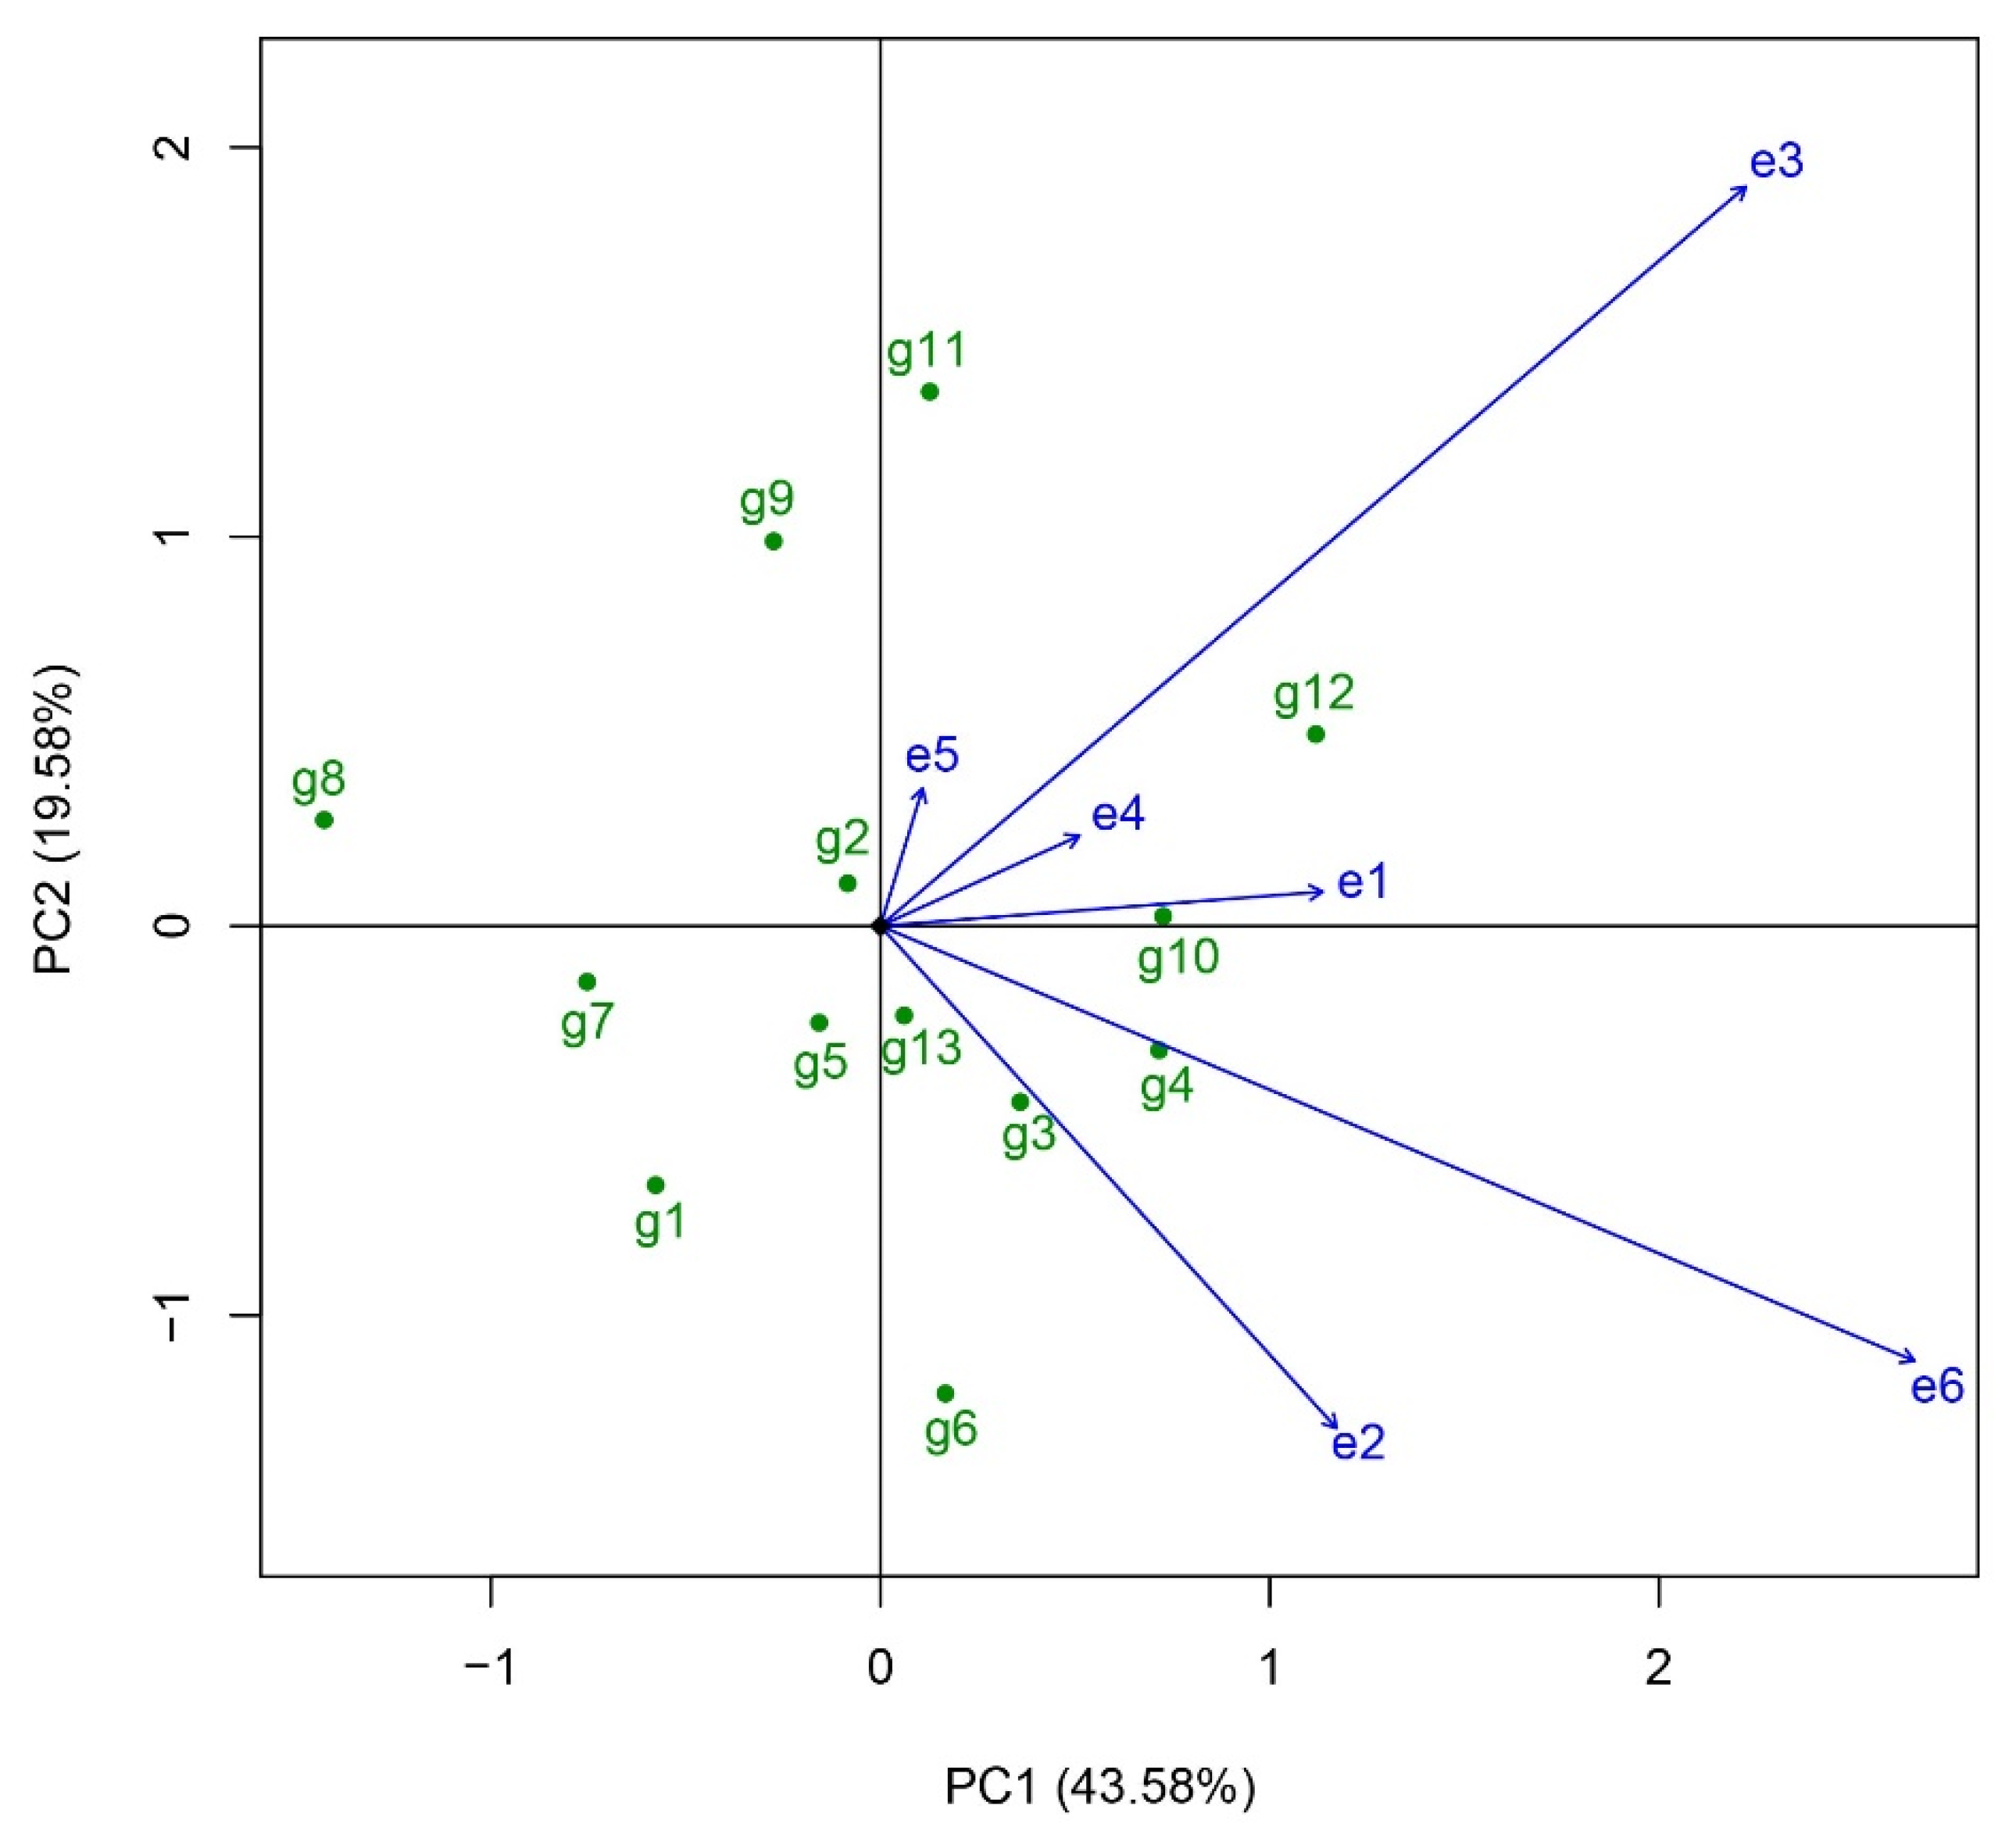
3.3.2. Analysis of Suitable Planting Site for the Tested Rice Varieties

The “which-won-where” function chart was employed to determine the optimal planting sites for the tested rice varieties (Figure 4). In this diagram, the outermost varieties are connected through the origin to form a polygon. The target area is then divided into six distinct sectors by drawing vertical lines from the origin to each side of the polygon. The varieties located at the vertices of the polygon represent the most suitable cultivars for planting in the trial districts that fall within their respective sectors. The results indicated that only three sectors contained regional trial sites within the fan zone. First, in the sector encompassing the Changshu Research Institute of Agricultural Sciences (e1), Suzhou Seed Administration Station (e3), Jiangsu Taihu Area Institute of Agricultural Sciences (e4), and Wujin Rice Research Institute (e6), Huazhongyou9413 (g12) was identified as the most suitable variety for planting. Second, in the fan-shaped area corresponding to the Wuxi Agricultural Technology Extension Station (e5), Zhongkenyou1922 (g11) emerged as the most suitable variety. Finally, in Jiangsu Academy of Agricultural Sciences (e2) zone, Zhegengyou2039 (g6) was determined to be the most suitable variety for planting.

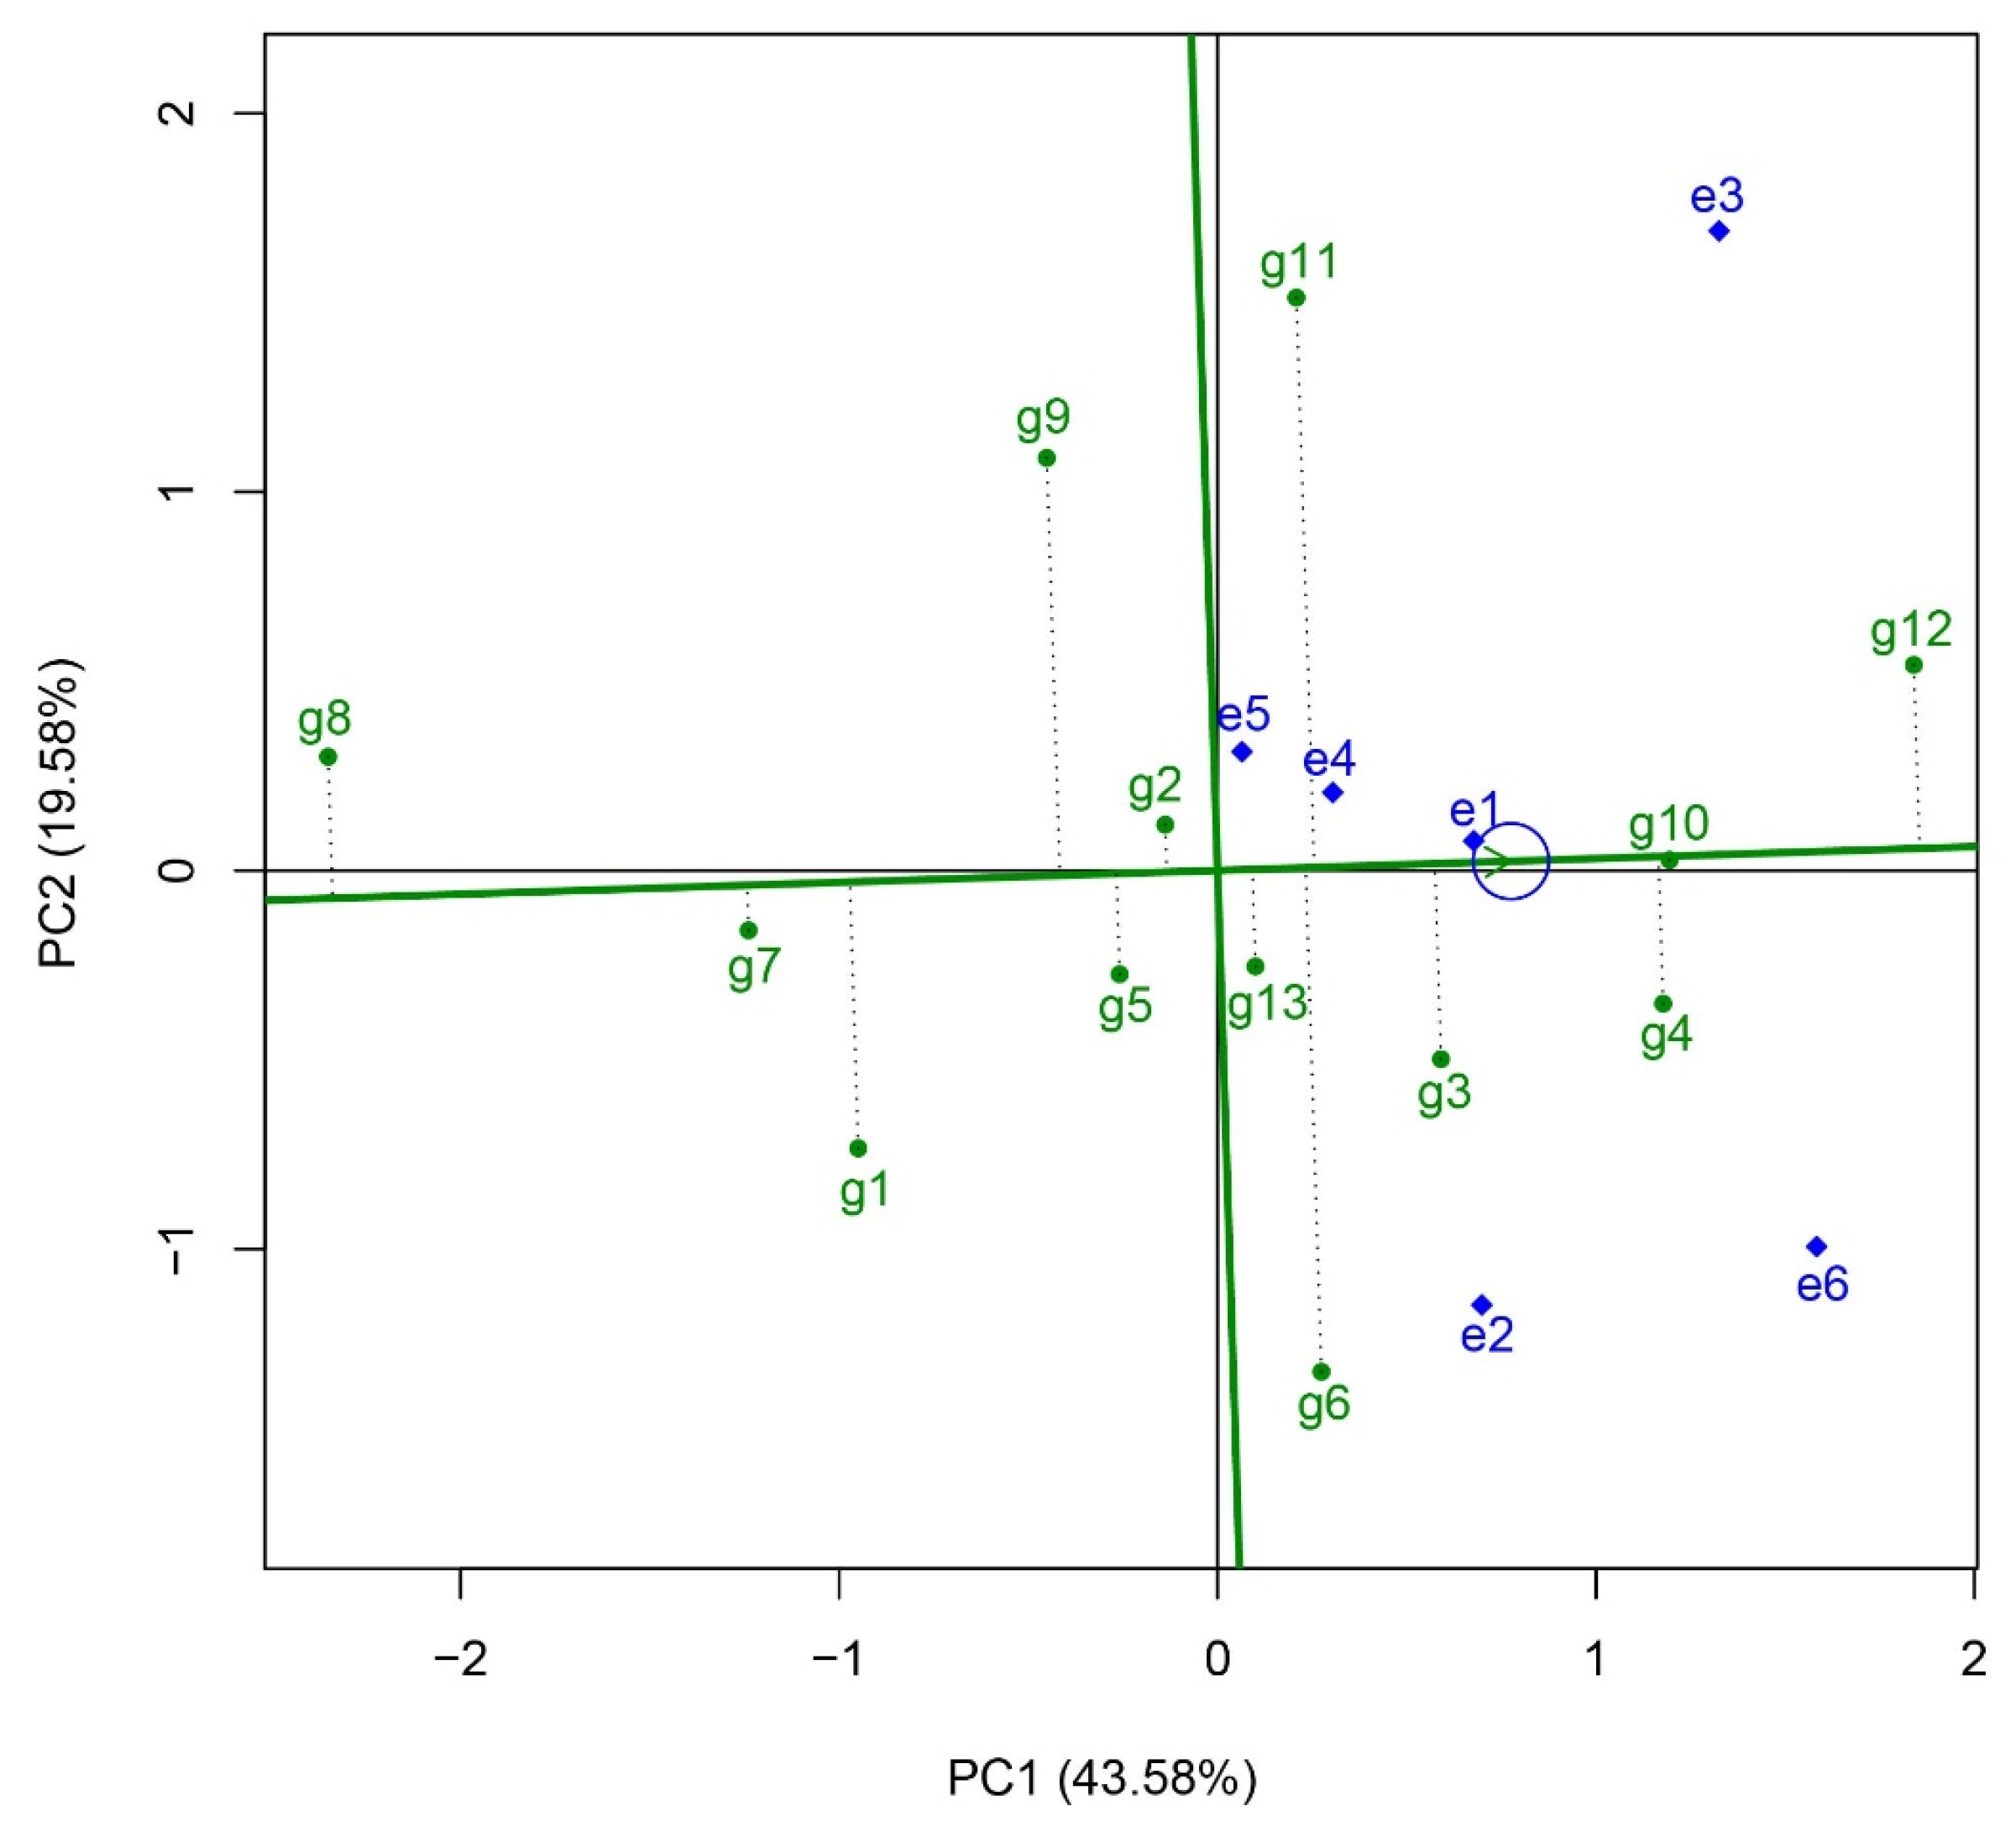
3.3.3. Discrimination and Representativeness Analysis of District Trial Sites

The “discriminativeness and representativeness” function chart in GGE Biplot was utilized to analyze the discrimination and representativeness of six regional trial sites (Figure 5). In the diagram, the representativeness of each regional trial site is determined by the angle between its vector and the positive average environmental axis. A smaller angle indicates stronger representativeness for the trial site. The vector modulus for each trial site reflects its discrimination, with a larger vector modulus signifying superior discrimination. The results revealed that, in terms of discrimination, Wujin Rice Research Institute (e6), Suzhou Seed Administration Station (e3), and Jiangsu Academy of Agricultural Sciences (e2) displayed relatively higher discrimination. Regarding representativeness, the angles between all trial sites and the average environmental axis of the six sites is acute, implying strong representativeness and suitability for these regional trial sites. Among these, Changshu Research Institute of Agricultural Sciences (e1), Jiangsu Taihu Area Institute of Agricultural Sciences (e4), and Wujin Rice Research Institute (e6) showed greater representativeness. Overall, Wujin Rice Research Institute (e6) exhibited both strong discrimination of the tested rice varieties, and good representativeness of the target ecological area, making it an ideal trial site for the regional variety in this regional trial.

3.3.4. Ideal Variety Analysis

In regional trials, varieties exhibiting both high and stable yields are designated as ideal varieties. The GGE biplot typically illustrates this concept using concentric circles centered on the ideal variety, allowing for an intuitive comparison of each variety’s relative ideality. The point of the arrow on the average environmental axis serves as the center of the circle; thus, the closer a variety is to the center, the more ideal it is considered. To identify potential ideal varieties in this year’s regional rice variety experiment, an “ideal variety” function diagram was constructed (Figure 6). The analysis revealed that Huazhongyou9413 (g12) was the closest to the ideal variety, followed by Zheyou921 (g10), Zhegengyou2035 (g4), and Changyou20-2 (g3). All of these varieties surpassed the control variety Yongyou1540 (g13, CK) in terms of ideality.

4. Discussion

Rice varieties must undergo rigorous testing through multi-site regional trials before being introduced to the market. Performance in these regional trials directly impacts the prospect and value of the variety. As one of the primary evaluation traits, crop yield is a complex quantitative trait influenced by three key components: varieties (genotype, G), experimental sites (environment, E), and genotype-by-environment (G × E) interaction [14]. In this study, the ANOVA results showed that the effect of genotypes is significant but explains only about 17.19% of the total variation observed in the experiments. In contrast, the effect of G × E interaction explains 33.74% of the total variation. These findings indicate that genotype-by-environment interactions have a substantially greater influence on yield than genotypic factors alone, which is in line with the results of previous studies showing that the interaction effect between genotype and environment often exceeds the main effect of genotype [24,25,26,27]. In addition, our comprehensive analysis evaluated the yield potential, stability, and adaptability of 13 hybrid japonica rice varieties across six diverse ecological areas, and the discrimination and representativeness of each regional trial site. The findings reveal that Zhegengyou2035 (g4) and Changyou20-2 (g3) exhibited superior yield potential and stability, while Huazhongyou9413 (g12) exhibited broad adaptability, making it suitable for promotion across a wider range of planting areas. Additionally, the Wujin Rice Research Institute (e6) served as an ideal trial site, showcasing both strong discrimination and representativeness.
A stable and well-adapted crop must thrive within its specific environment. However, due to variations in environmental conditions, crops are subject to genotype × environment (G × E) interactions [28]. These interactions are primarily influenced by a variety of environmental factors, including biotic stressors such as fungi, viruses, nematodes, and bacteria, as well as abiotic factors like rainfall patterns and temperature fluctuations. Additionally, soil characteristics, including chemistry, moisture content, and variations in soil type, also play a significant role [29]. These diverse environmental factors significantly contribute to G × E interaction effects, ultimately influencing crop performance and adaptability across various locations. The complex interplay between genetic factors and environmental variables ultimately determines a crop’s ability to thrive in various ecosystems, highlighting the importance of comprehensive multi-environment trials in plant breeding programs. In the present study, variance analysis revealed that genotype and environment, as well as their interaction (G × E), significantly influenced rice grain yield, with the impact of G × E interaction exceeding that of the main effect of genotype. For quantitative traits such as yield, a pronounced genotype-by-environment interaction can restrict the applicability of otherwise valid inferences and substantially hinder the identification of superior genotypes [3,9]. Given that the GGE biplot and AMMI model are effective statistical tools for analyzing G × E interactions [30,31,32,33,34,35,36,37,38,39], we employed a combined analysis using both the AMMI model and the GGE biplot to evaluate the yield performance of 13 rice varieties participating in regional trials. In terms of rice yield potential, both methods revealed that Huazhongyou9413 (g12) exhibited the highest yield potential, followed Zheyou921 (g10), Zhegengyou2035 (g4), Changyou20-2 (g3), Zhongkenyou1922 (g11), and Zhegengyou2039 (g6). The grain yields of these varieties surpassed that of the control variety, Yongyou1540 (g13, CK). Regarding yield stability, the results of the two models showed slight differences. Previous studies have demonstrated that the genotype–environment interaction effect is the primary factor influencing yield stability [40]. The AMMI model provides a more comprehensive explanation of this interaction by decomposing it into IPCA axes and calculating stability parameters [41,42]. Therefore, the stable yield of varieties can be measured more accurately by AMMI model and stability parameters. The results revealed that, in addition to the control variety Yongyou1540 (g13, CK), several other varieties including Tianlongyou515 (g7), Changyou20-2 (g3), Zhegengyou2035 (g4), Shuyou212 (g5), and Yongyou75 (g1) exhibited relatively good yield stability. Notably, the “ideal variety” function in GGE biplot analysis identified Huazhongyou9413 (g12), Zheyou921 (g10), Zhegengyou2035 (g4), and Changyou20-2 (g3) as being close to the “ideal variety,” displaying both high and stable yields. In a specific ecological environment, hybrid rice varieties with high and stable yields are considered the most ideal and are prioritized for promotion in the region. Based on the comprehensive analysis, Zhegengyou2035 (g4) and Changyou20-2 (g3) exhibited superior yield potential and stability compared to other varieties, making them the ideal choices for this regional trial. Notably, these varieties were recommended for the studied area; however, for other specific locations, different genotypes may be more suitable. The results have significant implications for advancing hybrid japonica rice variety development and evaluation processes, potentially leading to more efficient and effective agricultural practices.
The “which-won-where” function in GGE biplot analysis is an effective method for visualizing genotype-by-environment interaction patterns based on the correlation between genotype and environment [43]. This approach provides a clear illustration of the suitable planting areas for the tested varieties [44]. By utilizing this function, we can efficiently identify which genotypes perform best in specific environments, thus facilitating informed decisions regarding variety selection and deployment across diverse agricultural regions. Our results revealed that Huazhongyou9413 (g12) exhibited superior performance at four of the six trial sites, suggesting that Huazhongyou9413 has significant potential for successful cultivation and promotion across a wide range of planting areas. In addition, the “discriminativeness vs. representativeness” function chart in GGE biplot analysis serves as a valuable tool for identifying the most informative and representative environments. This function evaluates test environments based on two crucial aspects: their capacity to distinguish among genotypes (discriminativeness) and their ability to adequately represent the overall set of test environments (representativeness) [45,46]. In contrast, the AMMI biplot is limited to identifying only the discrimination of test environments. In this study, the combined analyses of the AMMI model and GGE biplots indicated that the Wujin Rice Research Institute (e6) serves as an ideal trial site, demonstrating not only excellent discrimination but also strong representativeness across the overall testing environments. These findings shed crucial insights that will inform and enhance future rice breeding initiatives and aid in the strategic selection of optimal testing locations.

5. Conclusions

The findings of this study reveal that Zhegengyou2035 (g4) and Changyou20-2 (g3) exhibited superior yield potential and stability, while Huazhongyou9413 (g12) exhibited broad adaptability. In addition, the Wujin Rice Research Institute (e6) served as an ideal trial site, showcasing both strong discrimination and representativeness. Our findings elucidate which rice varieties are most suitable for the area and whether they can serve as initial material in the selection process for breeding new varieties, as well as contribute to the strategic selection of optimal testing locations.

Author Contributions

R.C.: Writing—review and editing, Writing—original draft, Supervision, Funding acquisition, Data curation; G.W.: Writing—original draft, Data curation; J.Y.: Writing—original draft, Data curation; Y.L.: Data curation; T.T.: Data curation; Z.W.: Data curation; Y.H.: Data curation; N.L.: Data curation; H.W.: Formal analysis; A.G.: Formal analysis; Y.Z.: Methodology; Y.X.: Methodology; P.L.: Validation; C.X.: Funding acquisition, Validation; Z.Y.: Writing—review and editing, Funding acquisition, Supervision, Validation. All authors have read and agreed to the published version of the manuscript.

Funding

This research was funded by grants from the National Natural Science Foundation of China (32301826, 32061143030, 32170636, 32470621); National Key Research and Development Program of China (2024YFE0103400); Natural Science Foundation of Jiangsu Province (BK20230570); the China Postdoctoral Science Foundation (2023M731389); a project Funded by the Priority Academic Program Development of Jiangsu Higher Education Institutions (PAPD); the Seed Industry Revitalization Project of Jiangsu Province (JBGS [2021]009), and the Project of Zhongshan Biological Breeding Laboratory (ZSBBL-KY2023-01).

Data Availability Statement

All the data that support the findings of this study are available in the paper. Data will be made available on request.

Conflicts of Interest

The authors declare that they have no conflicts of interest.

References

  1. Zheng, X.; Wei, F.; Cheng, C.; Qian, Q. A historical review of hybrid rice breeding. J. Integr. Plant Biol. 2024, 66, 532–545. [Google Scholar] [PubMed]
  2. Li, J.; Luo, X.; Zhou, K. Research and development of hybrid rice in China. Plant Breed. 2024, 143, 96–104. [Google Scholar]
  3. Van Eeuwijk, F.A.; Bustos-Korts, D.V.; Malosetti, M. What should students in plant breeding know about the statistical aspects of genotype× environment interactions? Crop Sci. 2016, 56, 2119–2140. [Google Scholar] [CrossRef]
  4. Prus, M.; Piepho, H.-P. Optimizing the allocation of trials to sub-regions in multi-environment crop variety testing. J. Agric. Biol. Environ. Stat. 2021, 26, 267–288. [Google Scholar]
  5. Zhang, Q. Strategies for developing green super rice. Proc. Natl. Acad. Sci. USA 2007, 104, 16402–16409. [Google Scholar]
  6. Zeng, D.L.; Tian, Z.X.; Rao, Y.C.; Dong, G.J.; Yang, Y.L.; Huang, L.C.; Leng, Y.J.; Xu, J.; Sun, C.; Zhang, G.H.; et al. Rational design of high-yield and superior-quality rice. Nat. Plants 2017, 3, 17031. [Google Scholar]
  7. Gauch, H., Jr. Statistical Analysis of Regional Yield Trials: AMMI Analysis of Factorial Designs; Elsevier: Amsterdam, The Netherlands, 1992. [Google Scholar]
  8. Kılıç, H. Additive main effects and multiplicative interactions (AMMI) analysis of grain yield in barley genotypes across environments. J. Agric. Sci. 2014, 20, 337–344. [Google Scholar] [CrossRef]
  9. Rodrigues, P.C.; Malosetti, M.; Gauch, H.G., Jr.; van Eeuwijk, F.A. A weighted AMMI algorithm to study genotype-by-environment interaction and QTL-by-environment interaction. Crop Sci. 2014, 54, 1555–1570. [Google Scholar]
  10. Hongyu, K.; García-Peña, M.; de Araújo, L.B.; dos Santos Dias, C.T. Statistical analysis of yield trials by AMMI analysis of genotype× environment interaction. Biomed. Lett. 2014, 51, 89–102. [Google Scholar]
  11. Yan, W.; Kang, M.S.; Ma, B.; Woods, S.; Cornelius, P.L. GGE biplot vs. AMMI analysis of genotype-by-environment data. Crop Sci. 2007, 47, 643–653. [Google Scholar]
  12. Esan, V.I.; Oke, G.O.; Ogunbode, T.O.; Obisesan, I.A. AMMI and GGE biplot analyses of Bambara groundnut [Vigna subterranea (L.) Verdc.] for agronomic performances under three environmental conditions. Front. Plant Sci. 2023, 13, 997429. [Google Scholar] [CrossRef] [PubMed]
  13. Karimizadeh, R.; Mohammadi, M.; Sabaghni, N.; Mahmoodi, A.A.; Roustami, B.; Seyyedi, F.; Akbari, F. GGE biplot analysis of yield stability in multi-environment trials of lentil genotypes under rainfed condition. Not. Sci. Biol. 2013, 5, 256–262. [Google Scholar] [CrossRef]
  14. Luo, L.; Zhang, F.; Hong, M.; Zhang, X.; Guo, R. Evaluation of yield, stability and adaptability of national winter rapeseed regional trials in the upper Yangtze River region in 2017–2018. Oil Crop Sci. 2020, 5, 121–128. [Google Scholar]
  15. Bilate Daemo, B.; Belew Yohannes, D.; Mulualem Beyene, T.; Gebreselassie Abtew, W. AMMI and GGE Biplot analyses for mega environment identification and selection of some high-yielding cassava genotypes for multiple environments. Int. J. Agron. 2023, 2023, 6759698. [Google Scholar] [CrossRef]
  16. Khan, M.M.H.; Rafii, M.Y.; Ramlee, S.I.; Jusoh, M.; Al Mamun, M. AMMI and GGE biplot analysis for yield performance and stability assessment of selected Bambara groundnut (Vigna subterranea L. Verdc.) genotypes under the multi-environmental trials (METs). Sci. Rep. 2021, 11, 22791. [Google Scholar] [CrossRef]
  17. Solangi, F.; Zhu, X.; Solangi, K.A.; Khaskhali, S.; Yan, H. Predicting cropland and fertilizer consumption models and their effect on crop production in interior Jiangsu Province: A distributed autoregressive lag method. Cogent Food Agric. 2024, 10, 2434947. [Google Scholar] [CrossRef]
  18. Wang, C.-L.; Zhang, Y.-D.; Zhen, Z.; Tao, C.; Zhao, Q.-Y.; Zhong, W.-G.; Jie, Y.; Shu, Y.; Zhou, L.-H.; Ling, Z. Research progress on the breeding of japonica super rice varieties in Jiangsu Province, China. J. Integr. Agric. 2017, 16, 992–999. [Google Scholar] [CrossRef]
  19. Olivoto, T.; Lúcio, A.D.; da Silva, J.A.; Marchioro, V.S.; de Souza, V.Q.; Jost, E. Mean performance and stability in multi-environment trials I: Combining features of AMMI and BLUP techniques. Agron. J. 2019, 111, 2949–2960. [Google Scholar] [CrossRef]
  20. Annicchiarico, P. Additive main effects and multiplicative interaction (AMMI) analysis of genotype-location interaction in variety trials repeated over years. Theor. Appl. Genet. 1997, 94, 1072–1077. [Google Scholar] [CrossRef]
  21. Gauch, H.G.; Zobel, R.W. Predictive and postdictive success of statistical analyses of yield trials. Theor. Appl. Genet. 1988, 76, 1–10. [Google Scholar] [CrossRef]
  22. Zhang, Z.; Lu, C.; Xiang, Z. Analysis of variety stability based on AMMI model. Acta Agron. Sin. 1998, 24, 304–309. [Google Scholar]
  23. Frutos, E.; Galindo, M.P.; Leiva, V. An interactive biplot implementation in R for modeling genotype-by-environment interaction. Stoch. Environ. Res. Risk Assess. 2014, 28, 1629–1641. [Google Scholar]
  24. Gowda, K.H.; Chauhan, V.B.; Nedunchezhiyan, M.; Pradeepika, C.; Senthilkumar, K.M.; Chandra, V.; Byju, G.; Sahoo, M.R.; Pati, K.; Arutselvan, R. Genotype × Environment Interaction Analysis and Simultaneous Selection Using AMMI, BLUP, GGE Biplot and MTSI Under Drought Condition in Sweet Potato. J. Soil. Sci. Plant Nutr. 2025. [Google Scholar] [CrossRef]
  25. Barati, A.; Pour-Aboughadareh, A.; Arazmjoo, E.; Tabatabaei, S.A.; Bocianowski, J.; Jamshidi, B. Identification of High Yielding and Stable Barley Genotypes for Drought Conditions in the Moderate Climate of Iran Using AMMI Model and GGE Biplot Analysis. J. Crop Health 2025, 77, 8. [Google Scholar]
  26. Kuru, B.; Abera, N.; Mulualem, T. Genotype X environment interaction and yield stability of finger millet (Eleusine coracana L.) genotypes based on AMMI, GGE and MTSI analysis in humid lowland areas of Ethiopia. Field Crop. Res. 2025, 322, 109707. [Google Scholar]
  27. Sanadya, S.K.; Sood, V.K.; Kumar, S.; Sharma, G.; Sood, R.; Katna, G.; Enyew, M.; Sahoo, S. Stability Indices, AMMI and GGE Biplots Analysis of Forage Oat Germplasm Under Variable Growing Regimes in the Northwestern Himalayas. Agric. Res. 2025. [Google Scholar] [CrossRef]
  28. Egea-Gilabert, C.; Pagnotta, M.A.; Tripodi, P. Genotype × environment interactions in crop breeding. Agronomy 2021, 11, 1644. [Google Scholar] [CrossRef]
  29. de Leon, N.; Jannink, J.L.; Edwards, J.W.; Kaeppler, S.M. Introduction to a Special Issue on Genotype by Environment Interaction. Crop Sci. 2016, 56, 2081–2089. [Google Scholar]
  30. Alizadeh, K.; Mohammadi, R.; Shariati, A.; Eskandari, M. Comparative analysis of statistical models for evaluating genotype× environment interaction in rainfed safflower. Agric. Res. 2017, 6, 455–465. [Google Scholar]
  31. Dang, X.; Hu, X.; Ma, Y.; Li, Y.; Kan, W.; Dong, X. AMMI and GGE biplot analysis for genotype× environment interactions affecting the yield and quality characteristics of sugar beet. PeerJ 2024, 12, e16882. [Google Scholar]
  32. Kindie, Y.; Tesso, B.; Amsalu, B. AMMI and GGE biplot analysis of genotype by environment interaction and yield stability in early maturing cowpea [Vigna unguiculata (L) Walp] landraces in Ethiopia. Plant-Environ. Interact. 2022, 3, 1–9. [Google Scholar] [CrossRef] [PubMed]
  33. Haider, Z.; Akhter, M.; Mahmood, A.; Khan, R.A.R. Comparison of GGE biplot and AMMI analysis of multi-environment trial (MET) data to assess adaptability and stability of rice genotypes. Afr. J. Agric. Res. 2017, 12, 3542–3548. [Google Scholar]
  34. Daemo, B.B.; Ashango, Z. Application of AMMI and GGE biplot for genotype by environment interaction and yield stability analysis in potato genotypes grown in Dawuro zone, Ethiopia. J. Agric. Food Res. 2024, 18, 101287. [Google Scholar] [CrossRef]
  35. Ma, C.; Liu, C.; Ye, Z. Influence of Genotype× Environment Interaction on Yield Stability of Maize Hybrids with AMMI Model and GGE Biplot. Agronomy 2024, 14, 1000. [Google Scholar] [CrossRef]
  36. Gebreselassie, H.; Tesfaye, B.; Gedebo, A.; Tolessa, K. Genotype by environment interaction and stability analysis using AMMI and GGE-biplot models for yield of Arabica coffee genotypes in south Ethiopia. J. Crop Sci. Biotechnol. 2024, 27, 65–77. [Google Scholar] [CrossRef]
  37. Durai, A.A.; Amaresh; Kumar, R.A.; Hemaprabha, G. Elucidating the GXE Interaction Using AMMI, AMMI Stability Parameters and GGE for Cane Yield and Quality in Sugarcane. Trop. Plant Biol. 2025, 18, 3. [Google Scholar] [CrossRef]
  38. Hasan, M.J.; Kulsum, M.U.; Sarker, U.; Matin, M.Q.I.; Shahin, N.H.; Kabir, M.S.; Ercisli, S.; Marc, R.A. Assessment of GGE, AMMI, Regression, and Its Deviation Model to Identify Stable Rice Hybrids in Bangladesh. Plants 2022, 11, 2336. [Google Scholar] [CrossRef]
  39. Utami, D.W.; Maruapey, A.; Maulana, H.; Sinaga, P.H.; Basith, S.; Karuniawan, A. The Sustainability Index and Other Stability Analyses for Evaluating Superior Fe-Tolerant Rice (Oryza sativa L.). Sustainability 2023, 15, 12233. [Google Scholar] [CrossRef]
  40. El-Aty, M.S.A.; Abo-Youssef, M.I.; Sorour, F.A.; Salem, M.; Gomma, M.A.; Ibrahim, O.M.; Yaghoubi Khanghahi, M.; Al-Qahtani, W.H.; Abdel-Maksoud, M.A.; El-Tahan, A.M. Performance and stability for grain yield and its components of some rice cultivars under various environments. Agronomy 2024, 14, 2137. [Google Scholar] [CrossRef]
  41. Sabaghnia, N.S.S.; Dehghani, H. The use of an AMMI model and its parameters to analyse yield stability in multi-environment trials. J. Agric. Sci. 2008, 146, 571–581. [Google Scholar] [CrossRef]
  42. Jędzura, S.; Bocianowski, J.; Matysik, P. The AMMI model application to analyze the genotype–environmental interaction of spring wheat grain yield for the breeding program purposes. Cereal Res. Commun. 2023, 51, 197–205. [Google Scholar] [CrossRef]
  43. Yan, W.; Hunt, L.A.; Sheng, Q.; Szlavnics, Z. Cultivar evaluation and mega-environment investigation based on the GGE biplot. Crop Sci. 2000, 40, 597–605. [Google Scholar] [CrossRef]
  44. Yan, W.; Hunt, L. Interpretation of genotype× environment interaction for winter wheat yield in Ontario. Crop Sci. 2001, 41, 19–25. [Google Scholar] [CrossRef]
  45. Olanrewaju, O.S.; Oyatomi, O.; Babalola, O.O.; Abberton, M. GGE biplot analysis of genotype× environment interaction and yield stability in Bambara groundnut. Agronomy 2021, 11, 1839. [Google Scholar] [CrossRef]
  46. Yan, W.; Tinker, N.A. Biplot analysis of multi-environment trial data: Principles and applications. Can. J. Plant Sci. 2006, 86, 623–645. [Google Scholar] [CrossRef]
Figure 1. Map of the six regional trial sites (e1–e6) in Jiangsu province, China. The green dots at the bottom of the chart indicate the locations of these trial sites. e1, Changshu Research Institute of Agricultural Sciences; e2, Jiangsu Academy of Agricultural Sciences; e3, Suzhou Seed Administration Station; e4, Jiangsu Taihu Area Institute of Agricultural Sciences; e5, Wuxi Agricultural Technology Extension Station; e6, Wujin Rice Research Institute.
Agronomy 15 00901 g001
Figure 2. Analysis of yield potential and stability of the tested hybrid japonica rice varieties and discrimination of trial sites by AMMI biplot. (a) The biplot displays average yield on the horizontal axis and IPCA1 values on the vertical axis. (b) The biplot presents IPCA1 values on the horizontal axis and IPCA2 values on the vertical axis. (c) The biplot shows IPCA1 values on the horizontal axis and IPCA3 values on the vertical axis. (d) The biplot plots IPCA2 values on the horizontal axis and IPCA3 values on the vertical axis. g1, Yongyou75; g2, Changyou19-19; g3, Changyou20-2; g4, Zhegengyou2035; g5, Shuyou212; g6, Zhegengyou2039; g7, Tianlongyou515; g8, Tongyougeng20-1; g9, Yongyou1836; g10, Zheyou921; g11, Zhongkenyou1922; g12, Huazhongyou9413; g13, Yongyou1540. e1, Changshu Research Institute of Agricultural Sciences; e2, Jiangsu Academy of Agricultural Sciences; e3, Suzhou Seed Administration Station; e4, Jiangsu Taihu Area Institute of Agricultural Sciences; e5, Wuxi Agricultural Technology Extension Station; e6, Wujin Rice Research Institute.
Agronomy 15 00901 g002
Figure 3. The yield potential and stability analysis by “mean vs. stability” function in GGE biplot analysis. The small circle represents the “average environment”, while the straight line with a single arrow passing through the biplot origin and the average environment indicates the average environment axis. g1, Yongyou75; g2, Changyou19-19; g3, Changyou20-2; g4, Zhegengyou2035; g5, Shuyou212; g6, Zhegengyou2039; g7, Tianlongyou515; g8, Tongyougeng20-1; g9, Yongyou1836; g10, Zheyou921; g11, Zhongkenyou1922; g12, Huazhongyou9413; g13, Yongyou1540. e1, Changshu Research Institute of Agricultural Sciences; e2, Jiangsu Academy of Agricultural Sciences; e3, Suzhou Seed Administration Station; e4, Jiangsu Taihu Area Institute of Agricultural Sciences; e5, Wuxi Agricultural Technology Extension Station; e6, Wujin Rice Research Institute.
Agronomy 15 00901 g003
Figure 4. Analysis of suitable planting site for the tested rice varieties using the “which-won-where” function in GGE biplot analysis. The outermost varieties are connected by black lines through the origin to form a polygon. The target area is then divided into six distinct sectors by drawing vertical red lines from the origin to each side of the polygon. The varieties located at the vertices of the polygon represent the most suitable cultivars for planting in the trial districts that fall within their respective sectors. g1, Yongyou75; g2, Changyou19-19; g3, Changyou20-2; g4, Zhegengyou2035; g5, Shuyou212; g6, Zhegengyou2039; g7, Tianlongyou515; g8, Tongyougeng20-1; g9, Yongyou1836; g10, Zheyou921; g11, Zhongkenyou1922; g12, Huazhongyou9413; g13, Yongyou1540. e1, Changshu Research Institute of Agricultural Sciences; e2, Jiangsu Academy of Agricultural Sciences; e3, Suzhou Seed Administration Station; e4, Jiangsu Taihu Area Institute of Agricultural Sciences; e5, Wuxi Agricultural Technology Extension Station; e6, Wujin Rice Research Institute.
Agronomy 15 00901 g004
Figure 5. The discrimination and representativeness of district trial site by the GGE biplot analysis. The representativeness of each district trial site is determined by the angle between its vector and the positive average environmental axis. A smaller angle indicates stronger representativeness for the trial site. The vector modulus for each trial site reflects its discrimination, with a larger vector modulus signifying superior discrimination. g1, Yongyou75; g2, Changyou19-19; g3, Changyou20-2; g4, Zhegengyou2035; g5, Shuyou212; g6, Zhegengyou2039; g7, Tianlongyou515; g8, Tongyougeng20-1; g9, Yongyou1836; g10, Zheyou921; g11, Zhongkenyou1922; g12, Huazhongyou9413; g13, Yongyou1540. e1, Changshu Research Institute of Agricultural Sciences; e2, Jiangsu Academy of Agricultural Sciences; e3, Suzhou Seed Administration Station; e4, Jiangsu Taihu Area Institute of Agricultural Sciences; e5, Wuxi Agricultural Technology Extension Station; e6, Wujin Rice Research Institute.
Agronomy 15 00901 g005
Figure 6. Ideal variety view of the GGE biplot analysis. The straight line with a single arrow passing through the biplot origin and the average environment indicates the average environment axis. The point of the arrow on the average environmental axis serves as the center of the circle. The closer a variety is to the center, the more ideal it is considered. g1, Yongyou75; g2, Changyou19-19; g3, Changyou20-2; g4, Zhegengyou2035; g5, Shuyou212; g6, Zhegengyou2039; g7, Tianlongyou515; g8, Tongyougeng20-1; g9, Yongyou1836; g10, Zheyou921; g11, Zhongkenyou1922; g12, Huazhongyou9413; g13, Yongyou1540. e1, Changshu Research Institute of Agricultural Sciences; e2, Jiangsu Academy of Agricultural Sciences; e3, Suzhou Seed Administration Station; e4, Jiangsu Taihu Area Institute of Agricultural Sciences; e5, Wuxi Agricultural Technology Extension Station; e6, Wujin Rice Research Institute.
Agronomy 15 00901 g006
Table 1. Grain yield data from 2021 Jiangsu Province late hybrid Japonica regional trials.
Genotype IDAverage Yield of Each Trial Site (t/hm2)Average Yield (t/hm2)Standard DeviationCoefficient of Variation (%)
e1e2e3e4e5e6
g111.5111.989.8411.8910.4510.6111.050.87.21
g212.6212.3910.8711.8511.310.2511.550.837.22
g312.8212.5610.8411.8210.5511.2111.630.857.27
g412.512.2411.3211.8110.311.9511.690.726.16
g512.2411.8610.2812.211.510.8911.490.716.17
g612.1811.449.6611.8410.912.4811.420.948.19
g711.8711.2610.2311.019.2510.2410.640.857.95
g811.0210.949.7611.55119.3510.60.777.3
g912.0510.6211.2611.8610.810.5111.180.595.32
g1012.8411.5611.511.1510.412.111.590.766.53
g1112.7110.3511.7611.9611.0510.8611.450.786.85
g1211.6512.5112.5812.5410.811.94120.645.33
g131211.5110.6411.4511.0111.5311.360.433.8
Average yield
(t/hm2)
12.1511.6310.8111.7610.7211.07
Standard deviation0.530.690.830.390.540.87
Coefficient of variation (%)4.365.97.693.35.057.82
Table 2. Estimation of significant levels for grain yield of 13 hybrid japonica rice varieties by ANOVA and AMMI model analysis.
Source of VarianceDegrees of FreedomSum of SquareMean SquareF ValueProportion in the Total (%)
Total variation233358.321.53
Block1210.840.92.65 **3.03
Genotype (G)1261.595.1315.09 **17.19
Environment (E)5116.5223.368.53 **32.52
G × E60120.882.015.91 **33.74
Error14448.490.34
IPCA11642.652.677.92 **35.28
IPCA21435.72.557.57 **29.53
IPCA31223.651.975.85 **19.57
IPCA41015.441.544.59 **12.77
Residues83.440.431.28 **2.85
Note: ** p < 0.01.
Table 3. The scores and stability parameters for each variety on the significant reciprocal principal component axis.
CultivarsAverage Yield
(t/hm2)
Principal Component of InteractionStability
Parameter
Di RankYield Rank
IPCA1IPCA2IPCA3IPCA4
g111.047−0.785033−1.039089−0.45519−0.33971.421611
g211.546−1.2634350.0225601−0.692290.797731.64785
g311.6330.1503879−0.678539−0.706930.786831.26633
g411.6861.2146186−0.385194−0.486290.029861.36442
g511.493−1.211541−0.4939280.42051−0.04721.37556
g611.4180.6158609−1.7069711.56489−0.4572.439138
g710.6450.5456376−0.095126−0.75090.713191.174212
g810.602−2.0621030.26161270.07157−0.39512.1171013
g911.183−0.2515691.45431680.46155−0.10641.55710
g1011.5931.7898570.19843480.295810.539131.90394
g1111.4480.13664342.04747030.999680.311362.304117
g1212.0040.87275960.7283082−1.2849−1.55712.317121
g1311.3560.2479154−0.3138550.56248−0.27560.74319
Table 4. The scores and stability parameters for each trial site on the significant reciprocal principal component axis.
Trial
Sites
Average Yield
(t/hm2)
Principal Component of InteractionStability
Parameter
Di RankYield Rank
IPCA1IPCA2IPCA3IPCA4
e112.15438460.08161110.04176090.219310.863820.89621
e211.6330769−0.127277−0.531431−0.698290.064080.88943
e310.81045380.31068130.7517429−0.34961−0.13390.89535
e411.7630692−0.3377030.04661030.00266−0.32260.46962
e510.7159538−0.581690.07027440.43503−0.14460.74456
e611.07114230.654378−0.3789570.3909−0.32680.91214
Disclaimer/Publisher’s Note: The statements, opinions and data contained in all publications are solely those of the individual author(s) and contributor(s) and not of MDPI and/or the editor(s). MDPI and/or the editor(s) disclaim responsibility for any injury to people or property resulting from any ideas, methods, instructions or products referred to in the content.

