Abstract
The effects of the combination of the light intensity and photoperiod on the yield of virus-free potato and resource utilization are still poorly understood, especially under the same daily light integral. Here, we tested the responses of virus-free potato in terms of plant growth, photosynthesis, and the tuber yield to four light intensity and photoperiod combinations (T1, 200 μmol m−2 s−1 and 16.5 h; T2, 300 μmol m−2 s−1 and 11 h; T3, 400 μmol m−2 s−1 and 8.25 h; T4, 500 μmol m−2 s−1 and 6.6 h) under the same daily light integral. The tuber number and dry weight increased with the shortening of the photoperiod. The smaller number of tubers under the T1 treatment was due to the poor transport of photosynthates in the leaves and the uneven distribution of photosynthates in the tubers during the tuber formation stage. Changes in the light intensity and photoperiod combination did not significantly impact the distribution ratio of photosynthates between plants and tubers at the tuber growth stage; they only caused adjustments in the total amount of photosynthates. In addition, the photoinhibition under T1 was caused by the long photoperiod and that under T4 was caused by the high light intensity. However, the higher content of carotene in the T4 treatment alleviated the adverse effects of photoinhibition on the tuber yield. The results showed that the number and growth of tubers were extremely negatively correlated with shoot growth and extremely positively correlated with the accumulation rate of photosynthates in the plant and the tubers per day. In terms of energy consumption and the cost of the light source, we recommend the light intensity and photoperiod combinations of 300 μmol m−2 s−1 and 11 h or 400 μmol m−2 s−1 and 8.25 h to cultivate virus-free potato in plant factories.
1. Introduction
Potato (Solanum tuberosum L.) is one of the most important economic crops worldwide owing to the high content of starch, proteins, and other important nutrients in the tubers. Increasing potato production is an effective way to alleviate the contradiction between population growth and grain yield reduction. However, potato crops are susceptible to viral and fungal infections, resulting in yield losses and crop quality deterioration [1]. In addition, the lack of land resources, continuous cropping obstacles, soilborne diseases and pests, and climate change also limit the production of potato [2,3]. Therefore, the production of virus-free potato in controlled environments may reduce the risk of adverse conditions.
A plant factory is a closed growing system that enables farmers to achieve the constant production of crops including seed potato all year round [4]. An artificial light environment system is an essential part of plant factories [5]. The regulation and underlying mechanism of the light quality regarding potato growth and development are the current research interest [1,5,6,7,8]. Red light was beneficial in increasing the tuber yield. The tuberculation of plants under red and blue composite light treatment was advanced in the seedling stage, and the tuber biomass accumulated rapidly in the middle stage under blue light treatment [5]. The proportion of tuber fresh weight ≥2.0 g under blue and white composite light treatment was significantly higher than that under red and white composite light treatments [6]. Meanwhile, the light intensity and photoperiod are two important factors in light systems. The light intensity and/or photoperiod regulate crop photomorphogenesis, yields, and quality [9,10], as well as affecting the energy consumption and running costs of plant factories. The light intensity determines the extent of the energy supply and regulates the net photosynthetic rate (PN), Calvin cycle, and photosynthate transport of plants [11]. An appropriate photoperiod provides a guarantee for plants’ productivity [12]. Therefore, it is essential to understand plants’ responses to these two factors in plant factories. The adaptability of plants to different light intensities can be reflected by the plant morphology [13]. Under high light, plants reduce their light energy absorption by reducing the leaf area and increasing the leaf thickness to avoid light stress [14,15]. Meanwhile, plants obtain sufficient light energy to increase the yield by expanding the leaf area and extending the stems under low light [16,17]. Some studies on the effects of artificial light intensity on potato growth and development have been reported [18,19], which provide some basic data for the light management of seed potato in plant factories. The effects of the photoperiod on potato growth and development have been studied extensively [20]. Some studies have shown that shortening the photoperiod has a positive effect on flowering and tuber formation in potato, which is related to the expression of genes, such as Flowering Locus T [21]. For potato, shortening the photoperiod can promote the upregulation of the homologous gene StSP6A in Flowering Locus T (FT) and facilitate the formation of tubers. However, some studies suggest that the photoperiod has no significant effect on potato tuber formation. Some potato varieties (such as Bintje) can normally form tubers under a long photoperiod, and virus-free potato seedlings under an 8% sucrose concentration in a tissue culture environment can also form tubers under a long photoperiod [22].
The amount of light absorbed by plants in a day is related not only to the light intensity but also to the photoperiod, and the light intensity interacts with the photoperiod to regulate the biological status, such as net carbon assimilation and starch accumulation, in potato leaves [23]. The daily light integral (DLI), describing the number of photosynthetically active photons in the 400–700 nm range that are delivered to a specific area over a 24 h period, is particularly useful to describe the light environments of plants [24]. When the DLI was lower than the light requirement of the plant, increasing the DLI was beneficial for the dry matter accumulation of lettuce, purple cabbage, and bluebell [10,25,26]. In contrast, growth promotion in plants is reduced or even inhibited by an excessive DLI [27,28]. However, plants respond differently to the same DLI due to differences in the combination of the light intensity and photoperiod. Under the same DLI, the combination of a long photoperiod and low light is more suitable for potato growth in vitro than the combination of a short photoperiod and high light [29]. In addition, fluctuating light improved the photochemical efficiency and yield of lettuce compared with stable light, even under the same DLI and photoperiod conditions [30]. The above results indicate that the effect of the DLI on plant growth and development is highly correlated with alterations in the light intensity and/or photoperiod. The effect and underlying mechanism of different combinations of light intensity and photoperiod on potato growth and development was not fully understood at the same DLI condition. Although the effects of the combinations of different light intensity and photoperiod on these crops, including wheat and lettuce, were reported [26,31], the biological characteristics of potato, as a tuber crop rich in starch, differ from the crops mentioned above. We cannot casually take the research conclusions of these crops about DLI in relation to light intensity and photoperiod as the cultivation scheme of potato in plant factories, so the cultivation scheme needs to be reformulated based on the research results obtained from further studies in relation to virus-free potato.
In total, 25–30% of the production running cost in plant factories is electric energy consumption [4]. Therefore, a common demand of plant workers is an optimal combination of light intensity and photoperiod to achieve a trade-off between light supply and low energy consumption. Some studies have investigated the effects of light intensity, photoperiod, or light quality on potato growth alone [5,6,7], but few have examined the effects of the combination of light intensity and photoperiod on potato growth. To this end, we investigated growth, tuber number, and yield, as well as photosynthetic performance and energy consumption and efficiency of potatoes grown under different combinations of light intensity and photoperiod at the same DLI. The aim is to develop light regulation methods and provide a comprehensive understanding of the underlying physiological mechanisms of different combinations of light intensity and photoperiod on the formation and growth of virus-free seed potatoes and provide a reference for the efficient breeding of potato tubers in plant factories.
2. Materials and Methods
2.1. Plant Materials and Growth Conditions
Potato (‘Favorita’) samples were selected for the experiments. Stem segments (1–2 cm in length, each with one leaf) were dissected vertically from virus-free potato plantlets in vitro and then grown in vitro using MS medium supplemented with 40 g·L−1 sucrose and 8 g·L−1 agar (Hope BioTechnology Co., Qingdao, China) under white light. The photoperiod was 16/8 h (light/dark) and the photosynthetic photon flux intensity (PPFD) was 100 μmol m−2 s−1. After 30 days of in vitro subculture, the plantlets were transplanted to a cultivation basket (length × width × height: 60 × 40 × 18 cm) containing vermiculite in a growth chamber grown under white fluorescent lamps of 200 μmol m−2 s−1 for 11 h per day until they had germinated new leaves for a day; then, they were transferred and cultivated in chambers under four combinations of different light intensity and photoperiod at the same DLI until the harvest. Details of the light conditions during each stage of this study are shown in Table 1 and Figure A1. A combination of red (620 nm peak wavelength), blue (460 nm peak wavelength), and white (wavelength range of 400–700 nm) lamps equipped (Opt-run Biotechnology Co., Nanjing, China) with light-emitting diodes was used as the light source. Under each treatment, a distance of 30 cm between lamps and plant canopy needed to be maintained. Each treatment consisted of 15 uniform potato plants exposed to the following environmental conditions: light period temperature of 22 ± 1 °C, dark period temperature of 16 ± 1 °C, relative humidity of 70 ± 5%, and the same CO2 concentration as the outside. Hoagland nutrient solution with a pH value of 5.5–5.8 was used to provide nutrients for the potato plants.

Table 1.
The detail information of light intensity and photoperiod of each treatment.
2.2. Growth Traits and Energy Efficiency Determination
After 90 d of light treatment, three plants were randomly selected to measure plant height, stem diameter, and leaf number using standard methods. Leaf area was measured using the disc method at the harvest stage. Briefly, thirty 1 cm2 leaves were punched out from the leaves with a puncher to measure the dry weight as DW1, and the dry weight of the total leaves was measured as DW2. The leaf area and specific leaf area (SLA) were calculated according to the following formulas, respectively:
A DDS863 watt-hour meter (Shanghai SII Co., Ltd., Shanghai, China) was used to record electric energy consumption for each treatment. Electrical energy utilization efficiency (EUE) was calculated according to the method described by Rahman et al. [32]. Data on the energy consumption of tuber breeding in the plants are shown in Table A1.
2.3. Photosynthetic Pigments Measurement
The chlorophyll (Chl) and carotenoid (Car) contents were extracted from 0.1 g of the top third of each newly emerged leaf at the tuber growth stage. The leaves were submerged in 10 mL of 80% acetone (v/v) (Lingfeng Chemical Reagent Co., Shanghai, China) until they turned white; then, we measured the absorbance (wavelengths used to measure absorbance are 470 nm, 645 nm, and 663 nm) using a UV-1200 spectrophotometer (JinPeng Inc., Shanghai, China) and the photosynthetic pigment contents were calculated as described by Fan et al. [33].
2.4. Measurement of Photosynthetic Traits
The net photosynthetic rate (PN), stomatal conductance (GS), and intercellular CO2 concentration (Ci) of the top third of fully expanded leaves were measured during the daytime between 9:00 and 11:30 using a photosynthesis meter (LI-6400XT; LI-COR, Lincoln, NE, USA). When photosynthetic parameters were measured, the PPFD was set to be consistent with that of each treatment. We set the parameters leaf temperature, CO2 concentration (Ca), and relative humidity to 22 ± 1 °C, 390 ± 10 μmol mol−1, and 60–70%, respectively. Stomatal limitation (LS) and carboxylation efficiency (CE) were estimated using the following formulas, respectively:
2.5. Measurement of Light Response Curves (PN-PPFD)
The light response of the net photosynthetic rate under different light conditions was measured from 9:00 to 11:30 at 60 d after light treatment using a photosynthesis meter (LI-6400XT; LI-COR, Lincoln, NE, USA). The PPFDs were set by stepping down from 2000 μmol m−2 s−1 to 1600, 1400, 1200, 1000, 800, 600, 400, 200, 150, 100, 75, 50, 25, and 0 μmol m−2 s−1. At each PPFD, measurements were taken when PN had stabilized. The measurements were taken at a constant CO2 concentration of 390 ± 10 μmol mol−1, 60–70% humidity, and leaf temperature of 22 ± 1 °C. The measured data were fitted for light response curves using Ye’s methods [34], through which apparent quantum yield of photosynthesis (AQY), maximum net photosynthetic rate (PNmax), dark respiration rate (Rd), coefficient reflecting photoinhibition (βp), and coefficient reflecting light saturation (γp) were estimated with an online model developed by Ye [35].
2.6. Measurement of Chlorophyll Fluorescence Parameters
The photochemical fluorescence quenching coefficient (qP), non-photochemical fluorescence quenching coefficient (qN), practical photochemical efficiency (PhiPSII), maximal photochemistry efficiency (Fv/Fm), and electron transport rate (ETR) were also measured using an LI-6400XT photosynthesis meter. The distribution coefficient of excitation energy of PSI (α), the distribution coefficient of excitation energy of PSII (β), and the imbalance in excitation energy distribution between two photosystems (β/α–1) were calculated according to the method described by Braun [36]. The fraction of absorbed light energy used for photochemical reaction (P), the non-photochemical dissipation (EX), and the antenna thermal dissipation (D) were estimated according to the method of Demmig [37]. The excitation pressure of PSII (EP) and the photosynthetic function relative limit value (LPFD) were calculated according to previous methods [38,39]. The proportion of electron transport through photorespiration (Jo) and noncyclic photosynthetic electron transport to carbon fixation (Jc) were estimated using the following formulas, respectively [40]:
2.7. Photosynthate Measurements
The 13C content in different parts of the plant under various treatments was determined using the method of He [7] at the tuber formation stage. The tubers for measuring 13C were arranged in order of size from largest to smallest and divided into three equal parts, denoted as larger tuber, medium tuber, and small tuber.
Three potato plants under each treatment were randomly selected before and after the light period at the tuber growth stages to measure sucrose and starch contents using the methods of Fairbairn [41]. The photosynthate contents were recorded as the total of sucrose and starch contents. The photosynthate accumulation rate in plants (RPP) and photosynthate accumulation rate in tubers (RTP) were estimated using the following formulas, respectively:
where PC1 and TC1 indicate the photosynthate contents of whole plants and tubers before the light period, respectively; PC2 and TC2 represent the photosynthate contents of whole plants and tubers after the light period, respectively; and TL indicates the photoperiod of each treatment.
2.8. Statistical Analyses
The experiment was repeated three times. The combined effects of light intensity and photoperiod were compared using analysis of variance using Statistical Product and Service Solutions, version 20.0 (IBM, New York, NY, USA), followed by Tukey’s test at p < 0.05 level. The correlations between different parameters were determined using Pearson’s correlation analysis based on measured data from light treatments. Differences were considered to be statistically significant at p-values below 0.05.
3. Results
3.1. Growth Traits
The changes in light intensity and photoperiod significantly affected the morphology of the potato (Table 2). The plant height, root dry weight, and root length of the T1 treatment were significantly greater than those of the other treatments, while there was no significant difference in the stem diameter among these four treatments. The leaf area and SLA significantly decreased with an increase in light intensity or a decrease in photoperiod. There was no significant difference in the leaf number in the T1, T2, and T3 treatments; however, that of the T4 treatment was significantly greater.
Table 2.
Morphological traits of potato under different combinations of light intensity and photoperiod. The light intensity and photoperiod conditions of different treatments as follows: T1, 200 μmol m−2 s−1 and 16.5 h; T2, 300 μmol m−2 s−1 and 11 h; T3, 400 μmol m−2 s−1 and 8.25 h; T4, 500 μmol m−2 s−1 and 6.6 h. Data are mean ± standard deviation (n = 3) Different lowercase letters in the same parameter indicate statistically significant differences at p < 0.05. CV% = (standard deviation/sample mean) × 100.
The tuber number of the T1 treatment was lowest in all stages, while at the tuber formation and growth stages, there were no significant differences in the tuber numbers of the T2, T3, and T4 treatments (Figure 1B). The tuber number and dry weight of the plants increased with increasing light intensity or decreasing photoperiod (Figure 1A,B). The dry weight of the non-tuber parts of the plants was highest under the T1 treatment at the BTFS stage but was the opposite under the T4 treatment at the TGS stage. At the TFS stage, the dry weight of the non-tuber parts of the plants under the T1 and T2 treatments was similar and significantly higher than that under the T3 and T4 treatments. The dry weight of the non-tuber parts of the plants of the T1 treatment at the HS stage was significantly higher than that of the T2 and T3 treatments (Figure 1A). At the HS stage, the tuber dry weights of the T2, T3, and T4 treatments exhibited no significant differences and were greater for all three treatments compared to the T1 treatment (Figure 1A). From the TFS to HS stage, the dry matter accumulation of tubers under the T2, T3, and T4 treatments accounted for about 60% of the total dry weight of the plants, whereas it was only 26.23% under the T1 treatment (Figure 1A). The EUE of the T2, T3, and T4 treatments exhibited no significant difference and was greater for all three treatments compared to the T1 treatment (Figure 1C).
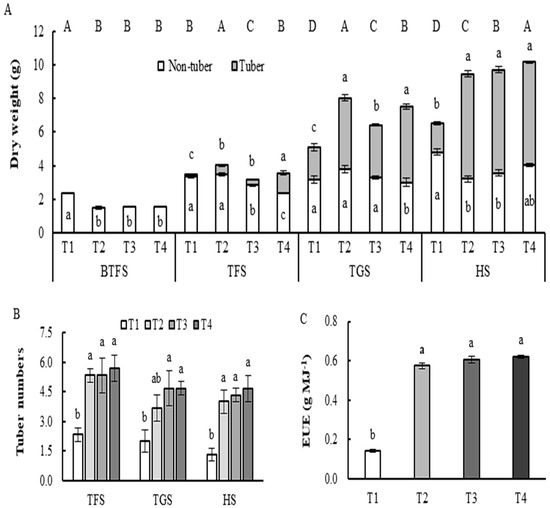
Figure 1.
Potato plant and tuber growth traits of potato under different combinations of light intensity and photoperiod. (A) Potato plant and tuber dry weight under different combinations of light intensity and photoperiod; (B) Tuber number under different combinations of light intensity and photoperiod; (C) EUE (Electrical energy use efficiency) under different combinations of light intensity and photoperiod. BTFS, Before tuber formation stage; EUE, electric energy use efficiency; HS, Harvest stage; TFS, Tuber formation stage; TGS, Tuber growth stages. Abbreviations of light treatments are as described in Figure 1. The top capitals letters in (A) indicate a significant difference at p < 0.05 levels (n = 3) in dry weight of the whole plant under each treatment. Different small case letters in the vertical bar indicate a significant difference at p < 0.05 levels (n = 3).
3.2. Photosynthate in Plants and Tubers at the Tuber Growth Stage
The photosynthate accumulation content in the plants or tubers of the T1 treatment was significantly less than that of the other treatments, and the photosynthate accumulation content exhibited no significant differences among the T2, T3, and T4 treatments (Figure 2A). The RPP and RTP increased with an increase in light intensity and a decrease in photoperiod (Figure 2B). There is no significant difference in the ratio of RTP (photosynthate accumulation rate in tubers) and RPP (photosynthate accumulation rate in plants) between the four treatments (Figure 2B). The value of sucrose/starch in the plants, tubers, and non-tubers of the T1 treatment was significantly greater than that of the other treatments (Figure 2C).
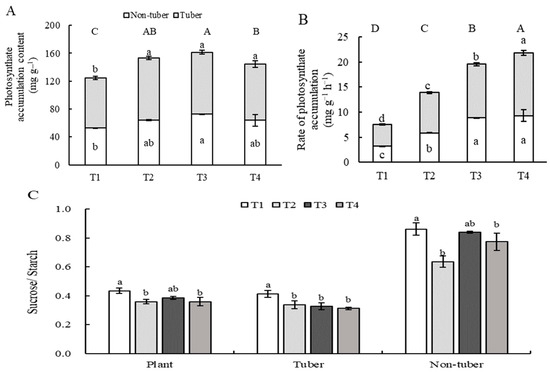
Figure 2.
Photosynthate accumulation under different combinations of light intensity and photoperiod at tuber growth stage. (A) Photosynthate accumulation content in different parts of the plant under different combinations of light intensity and photoperiod at tuber growth stage. (B) Rate of photosynthate accumulation in different parts of the plant under different combinations of light intensity and photoperiod at tuber growth stage. (C) The value of sucrose/starch in different parts of the plant under different combinations of light intensity and photoperiod at tuber growth stage. RPP, photosynthate accumulation rate in plant at tuber growth stage; RTP, photosynthate accumulation rate in tubers at tuber growth stage; The abbreviations of growth environments are the same as in Table 2. Different lowercase letters in the same parameter indicate statistically significant differences at p < 0.05. The top capitals letters in (A,B) indicate a significant difference at p < 0.05 levels (n= 3) in photosynthate accumulation content and rate of photosynthate accumulation of the whole plant under each treatment.
3.3. Distribution of 13C in Plants at the Tuber Formation Stage
The capacity for photosynthetic carbon fixation, distribution of photosynthates, and accumulation of photosynthates during the tuber formation stage affected the morphogenesis and material enrichment of tubers. As can be seen in Figure 3A, during the tuber formation stage, the photosynthates synthesized through photosynthesis in the leaves of the potato plants mainly remain in the leaves, and the proportion of photosynthesis transferred to the root system is low. The δ13C in leaves decreased with an increase in light intensity or a shortening of the photoperiod, while the δ13C in the tubers showed the opposite trend. The δ13C in the stems and roots of the potato plants under the T2 treatment was significantly higher than that under the other treatments.
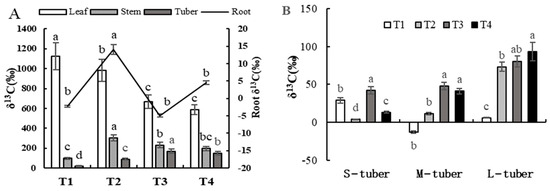
Figure 3.
The distribution of 13C among plants at tuber formation stage under different combinations −of light intensity and photoperiod. (A) The distribution of 13C in different parts of the plant at the tuber formation stage under different combinations of light intensity and photoperiod; the parameters of the root refer to the secondary vertical axis. (B) The distribution of 13C among tubers of different sizes at the tuber formation stage under different combinations of light intensity and photoperiod. S-tuber, small tuber; M-tuber, medium tuber; L-tuber, large tuber. Different letters in the vertical bar indicate significant difference at p < 0.05 levels (n = 3).
As shown in Figure 3B, 60.44% of δ13C accumulated in the tubers of the potato plants under T1 treatment was distributed in small tubers, while only 12.13% was distributed in large tubers, and δ13C accumulated in the tubers of the potato plants under the T2, T3, and T4 treatments was mainly distributed in large tubers. The δ13C accumulated in small tubers formed by the potato plants under the T2 treatment was significantly higher than that under the other treatments, while the δ13C accumulated in middle tubers formed by potato plants under the T3 and T4 treatments exhibited no significant difference and was significantly higher than that under the T1 and T2 treatments. The δ13C accumulated in large tubers showed a trend of increasing with an increase in light intensity/shortening of the photoperiod.
3.4. Photosynthetic Pigments at the Tuber Growth Stage
The Car content of the T1 and T3 treatments was significantly less than that of the T4 treatment. Figure 4A,B show that the Chl (a + b) of the T1 treatment was the greatest, and Chl a/b and Car/Chl a were the least, while those of the T2, T3, and T4 treatments exhibited no significant differences.
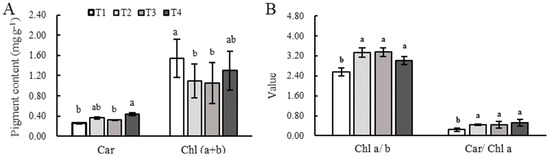
Figure 4.
Photosynthetic pigments in leaves under different combinations of light intensity and photoperiod during the tuber growth stage. (A) Photosynthetic pigments in leaves under different combinations of light intensity and photoperiod during the tuber growth stage. (B) The value of Chl a/b and Car/Chl a in leaves under different combinations of light intensity and photoperiod during the tuber growth stage. Different letters in the vertical bar indicate significant difference at p < 0.05 levels (n = 3). Abbreviations of light treatments are as described in Figure 1.
3.5. Gas Exchange Traits at Tuber Growth Stage
Gas exchange traits, including PN, GS, Ci, and Tr, of the T1 treatment were the least, while the LS and CE were the greatest, and the greatest PN and GS were observed in the T3 treatment. PN and GS exhibited no significant difference under the T2 and T4 treatments, and there was no significant difference in CE under the T2, T3, and T4 treatments. The Tr increased and LS decreased with an increase in light intensity or a decrease in photoperiod (Figure 5A–F).
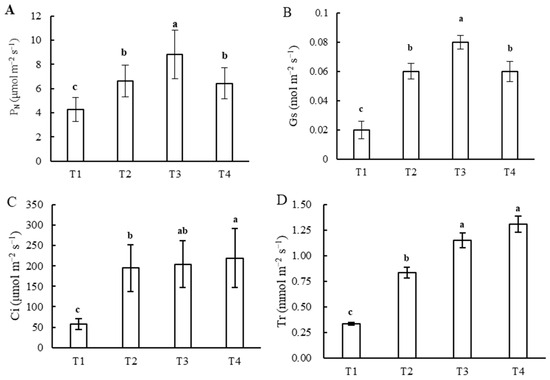
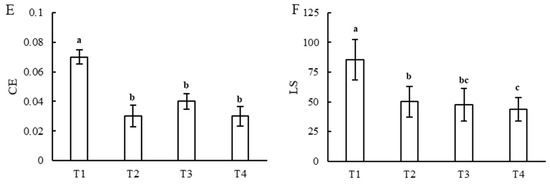
Figure 5.
Gas exchange traits in leaves under different combinations of light intensity and photoperiod during the tuber growth stage. (A) net photosynthetic rate (PN); (B) stomatal conductance (GS); (C) intercellular carbon dioxide concentration (Ci); (D) transpiration rate (Tr); (E) carboxylation efficiency (CE); (F) stomatal limitation (LS). Different letters in the vertical bar indicate significant difference at p < 0.05 levels (n = 3). Abbreviations of light treatments are as described in Figure 1.
3.6. Light Response Curve (PN-PPFD)
We measured the PN response to the change in PPFD to determine photosynthetic performance. The inflection points of the T1 and T3 treatments occurred earlier than those of the other two treatments, and the PN decreased in the T1 and T3 treatments when the light intensity was about 1200 μmol m−2 s−1 (Figure 6). Correspondingly, the βP was greater and the PNmax was lower in the T1 and T3 treatments compared with the T2 and T4 treatments. The γp and Rd values of the T1 treatment were significantly lower than those of the other treatments, while the γp values of the T3 and T4 treatments were almost the same, and both were significantly less than that of the T2 treatment. The light combinations did not affect the AQY (Table 3).
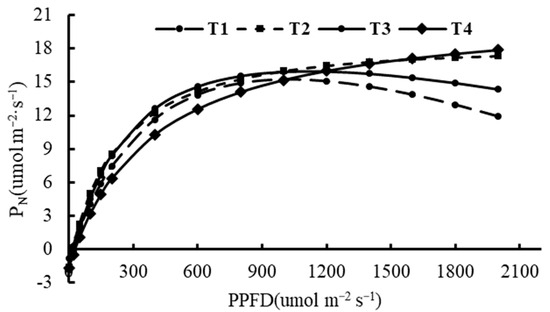
Figure 6.
Light-response curve of photosynthesis of potato plant grown under different combinations of light intensity and photoperiod. The abbreviations of growth environments are the same as in Figure 1.
Table 3.
Fitted photosynthetic parameters via light response curves under different combinations of light intensity and photoperiod. AQY, apparent quantum yield of photosynthesis; PNmax, maximum net photosynthetic rate; Rd, dark respiration rate; βp, coefficient reflecting photoinhibition; γp, coefficient reflecting light saturation. Abbreviations of light treatments are as described in Table 2. Different lowercase letters in the same parameter indicate statistically significant differences at p < 0.05.
3.7. Fluorescence Parameters and Light Energy Distribution at the Tuber Growth Stage
We measured the fluorescence parameters under various light combinations to investigate the differences in the absorption, utilization, and distribution of light energy of the potato plants. The Fv/Fm, P, and D were unaffected by light alterations. The qN, ETR, Jo, Jo/ETR, β, β/α-1, EP, LPFD, and EX of the T4 treatment were all significantly greater than those of the other treatments, but the qP, PhiPSII, and α of the T4 treatment were the least; the PhiPSII, α, β, β/α-1, LPFD, and EX of the other three treatments exhibited no significant difference. The remaining parameters, namely, qN, qP, ETR, Jc, and Jo, differed significantly among these three treatments. The qN of the T2 treatment was significantly greater than that of the T1 and T3 treatments, while the qN of the T3 treatment was also significantly greater than that of the T1 treatment. The qP of the T2 treatment was significantly lower than that of the T3 treatment but exhibited no significant difference compared to the T1 treatment. The ETR, Jc, and Jo increased with an increase in light intensity and decreased with a decrease in the photoperiod when the light intensity was less than 500 μmol m−2 s−1.
3.8. Tuber Formation Dynamics During the Tuber Formation Stage
The number of tubers formed during the tuber formation stage determines the number of tubers in the harvest stage. The tuber formation of potato plants under each treatment showed a dynamic trend of first increasing and then decreasing, and tuber formation showed an obvious decreasing trend in the late tuber formation stage (35–40 d). The number of tubers formed by potato plants in the tuber formation stage under the T1 treatment was significantly lower than that under other treatments, and there was no significant difference in the tuber formation number of potato plants under the T2, T3, and T4 treatments. However, numerically, under the same DLI conditions, the number of tubers formed in the tuber formation stage of potato plants increased with the increase in light intensity/shortening of the photoperiod.
3.9. Correlation Analysis
We analyzed the correlation between the growth and photosynthetic parameters (Table 4). The dry weight and number of tubers were both highly positively correlated with the dry weight of plants, PN, Ci, GS, Tr, Rd, ETR, Jc, Jo, RPP, RTP, 40 d TN, and L-δ13C, and the dry weight of tubers was also highly positively correlated with Chl a/b and qN. In contrast, the dry weight and number of tubers were both highly negatively correlated with PH, LA, LN, SLA, CE, and LS, and the number of tubers was also negatively correlated with Chl (a + b). Except for the parameters mentioned above, the dry weight and number of tubers were insignificantly correlated with the other parameters used in this study.
Table 4.
Correlation analysis between dry weight or number of tuber and the other parameters.
4. Discussion
4.1. Light Intensity Largely Dominates Leaf Expansion and Thickness Regardless of DLI Level
The differences in plant morphology, photosynthesis, and dry matter distribution reflect the adaptability of the crop to light environments [42]. Plants adapt to low light environments by adjusting growth and physiological parameters, such as promoting shoot growth; increasing plant height, leaf area and thickness, and Chl contents, and impeding chlorophyll degradation and photooxidation and underground growth [43,44]. The T1 treatment exhibited the typical characteristics of plants grown under low light. Increasing SLA can effectively improve light capture and carbon fixation under low light, and plants preferentially improve aboveground growth to maintain the whole life cycle [42]. Lettuce grown under long photoperiod and low light intensity conditions also showed such growth intention [26]. Compared with the other three treatments, the SLA of the T1 treatment significantly increased, which contributed to a significantly higher dry weight of plants before tuber formation (Table 2). In addition, leaf area and SLA both decreased with an increase in light intensity under different photoperiod conditions in the current study (Table 2). Under the same photoperiod conditions, the same change trends in leaf area and SLA with an increase in light intensity were reported [6]. Taken together, the current results suggest that a light intensity of 200 μmol m−2 s−1 was insufficient for potato cultivation, even though the DLI reached the same level as the other three treatments, and the plants under the T1 treatment ensured the preferential growth of aboveground before tuber formation to accommodate such adverse light conditions. Moreover, light intensity largely dominates leaf expansion and thickness regardless of the DLI level.
4.2. Reasons for the Inhibition of Photosynthetic Characteristics Vary According to a Long Photoperiod or High Light Intensity
βp and the ratio of βp/γp under the T1 treatment were significantly greater than those under the other treatments (Table 3). When γp is a certain value, a greater βp indicates that plants are more susceptible to photoinhibition [34,45], suggesting that the plants grown under the T1 treatment suffered from relative photoinhibition. This conclusion seems to contradict the inference in the previous paragraph that a light intensity of 200 μmol m−2 s−1 resulted in relatively low light stress because photoinhibition is the inhibition of photosynthesis by excessive light, resulting in reduced plant growth. We hypothesize that (1) 200 μmol m−2 s−1 light cannot meet the instantaneous light requirement of potato plants, but a long photoperiod resulted in the accumulation of excess light energy. The larger absorption cross-section for photons and the longer average life in the excited state of antenna pigment molecules of PSII imply that this plant is more vulnerable to light suppression [45]. In this situation, excess light energy is reduced through non-photochemical dissipation, while excess light energy is released mainly through heat dissipation and photochemical reactions. Nevertheless, the effect of heat dissipation is limited; thus, the plants are susceptible to photoinhibition [45]. We observed a similar result in the T1 treatment. The qN was significantly less than that of the other treatment, but the P and D exhibited no significant difference between the other light treatments (Table 5), which contributed to relative photoinhibition (higher βp) in the T1 treatment. (2) Compared with the light quantity, the photoperiod can more effectively cause light damage in leaves [46]. Although there was no symptom of “Continuous light-induced injury” in leaves under the T1 treatment, a greater ratio of βp/γp suggested that the plants under the T1 treatment might be adversely affected by continuous light. Photosynthate in plants mainly exists in the form of sucrose under continuous light [47], which is consistent with the high proportion of sucrose in all parts of plants under the T1 treatment in this study (Figure 2C). High-concentration sucrose inhibited photosynthetic characteristics and/or induced premature senescence of leaves [48]. This may be why the photosynthetic characteristics of T1 plants were inhibited under 200 μmol m−2 s−1.
Table 5.
Fluorescence parameters and light energy distribution in leaves under different combinations of light intensity and photoperiod at the tuber growth stage. Data are mean ± standard deviation (n = 3) Different lowercase letters in the same parameter indicate statistically significant differences at p < 0.05. CV% = (Standard Deviation/Sample mean) × 100.
Compared with the T2 and T3 treatments, the photosynthate content in the T4 treatment decreased by 6% and 11%, and a significantly higher LPFD was observed in the T4 treatment, suggesting that the photosynthetic function of the T4 treatment was relatively limited. Correspondingly, we also observed the greatest qN, Jo, EX, and Car content and the least qP and PhiPSII (Figure 4 and Table 5), indicating that the light intensity of 500 μmol m−2 s−1 exceeds the light requirement of potato plants, and thus, plants release excess light energy through non-photochemical dissipation and protection via decreasing photooxidative damage, controlling Car and photorespiration [38,49]. Photorespiration can improve photosynthetic performance [50], and the increase in photorespiration was greatly dependent on light intensity [51]. We obtained a similar result: the Jo increased with an increase in light intensity (Table 5). GS2, a key enzyme in photorespiration, has an improved capacity for photorespiration and an increased tolerance to high light intensity and protects plants from photoinhibition. In addition, plants can readjust the redox poise of the electron transfer chain upon strong irradiance to optimize photosynthetic electron flow to balance the excitation energy absorbed by the LHCII and LHCI antenna systems [52,53]. Previous studies have shown that the imbalance of excitation energy in PSII and PSI can limit photosynthetic performance [54]. Compared with the other treatments, more excitation energy was allocated to PSII than PSI, resulting in an imbalance between PSI and PSII and higher excitation pressure of PSII (EP) (Table 5), resulting in the relative limitation of the photosynthetic performance.
4.3. Photosynthate Metabolism Regulates Tuber Formation and Growth
As a short-day crop, tuber formation and growth of potato plants are strongly regulated by the photoperiod, and longer irradiation reduces the PN and photosynthate content and even disrupts the circadian rhythm of plants, resulting in carbon starvation of the sink organ and inhibition of tuber formation and growth [55]. The shortening of the photoperiod increases the transport rate of photosynthetic products from leaves, and the transport rates of tuber formation factors co-transported with photosynthetic products, such as StSP6A and StBEL5, also increase. The direct homologs StSP6A, StSP5G, StSP5G, and StSP3D of FT regulate tuber formation, and only StSP6A and StBEL5 can be transmitted in the plant [21]. StSP6A is co-transported with photosynthates to regulate tuber formation. Thus, in the current study, the tuber number increased with the shortening of the photoperiod or the increase in light intensity at the same DLI level. We cannot determine whether photoperiod, light intensity, or their interaction dominates tuber formation. The correlation showed that the number and growth of tubers were highly negatively correlated with the shoot growth, exhibiting a competition in growth between tubers and non-tubers (Table 4). We measured the content and distribution of 13C in plants to show the metabolism of photosynthates in plants under each treatment. Most of the photosynthates accumulated in the leaves under the T1 treatment, which inhibited the transfer of photosynthates to other parts of the plant (Figure 3), which may lead to insufficient carbon supply in other parts of the plant. A large amount of photosynthates accumulated in the leaves to promote the growth of the leaves, which was consistent with the observed phenomenon of large leaf area and SLA of potato plants under the T1 treatment. The formation and growth of tubers depended on the accumulation of photosynthates [5], and we detected that the content transported to tubers under the T1 treatment was significantly lower than that under other treatments (Figure 3A). The low content of photosynthates accumulated in tubers inhibited the formation and growth of tubers, thus reducing the number of tubers formed during the tuber formation stage (Figure 7) and the number of tubers formed in the harvest stage (Figure 1B), which was consistent with the experimental phenomenon. The distribution difference in δ13C in large tubers, medium tubers, and small tubers under the different treatments at the tuber formation stage (Figure 3B) indicated that potato plants tended to promote the formation of large tubers, while under the T1 treatment, they tended to form small tubers with the increase in light intensity/shortening of the photoperiod. This may be related to the difficulty of large tuber formation and substance accumulation due to carbon starvation in the potato sink organ under the T1 treatment. With the increase in light intensity/shortening of the photoperiod, the content and distribution ratio of sucrose in the tuber part of the potato plant gradually increased (Figure A2), which means that the tuber formation ability was increasing (Figure 7). Sucrose in tubers comes from leaves, and during the sucrose transport process, StSP6A and other substances that promote tuber formation cooperate and specialize, further promoting the formation of tubers [21]. At the same time, sucrose accumulates in the tubers, providing material security and energy supply for the formation of tubers and avoiding the phenomenon of carbon hunger in tubers [7]. A long photoperiod regulates sucrose transport in potato plants by down-regulating the expression of StSUT1, StSUT2, and StSUT4 [56]. More photosynthates remained in the leaves (Figure 3A), resulting in an insufficient supply of photosynthates in the sink organ, making it difficult to fully guarantee the formation of large tubers and material accumulation. Correlation analysis showed that the number of tubers and δ13C content in large tubers presented a very significant positive correlation (Table 4), and the δ13C content in large tubers under the T1 treatment was significantly lower than that under other treatments, thus inhibiting the formation of tubers and reducing the number of tubers in plants (Figure 8).
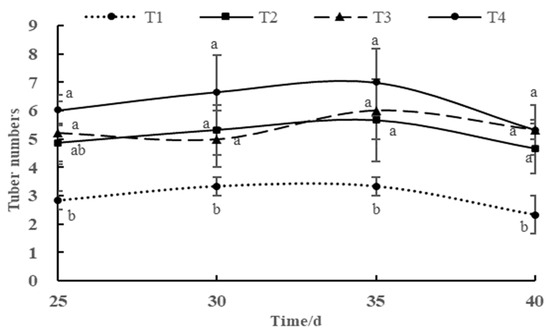
Figure 7.
Tuber formation dynamics during the tuber formation stage under different combinations of light intensity and photoperiod. Different letters in the vertical bar indicate significant difference at p < 0.05 levels (n = 3).
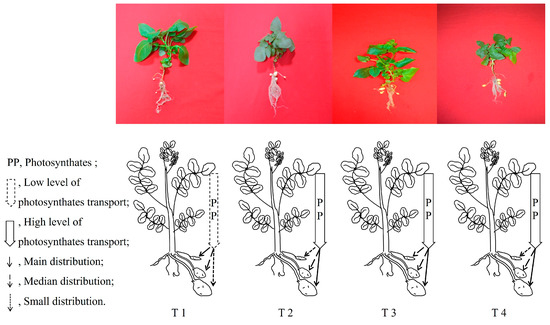
Figure 8.
The metabolism and distribution of photosynthates regulate tuber formation under different combinations of light intensity and photoperiod at tuber formation stage.
The tuber number per plant in the T2, T3, and T4 treatments slowly increased with the shortening of the photoperiod or the increase in light intensity. Nevertheless, the dry weight of tubers per plant had no significant change under the T2, T3, and T4 treatments, which seemed attributable to the same DLI, while remaining independent of the combinations of photoperiod and light intensity when the light intensity reached the 300 μmol m−2 s−1 level. Previous studies have shown that high light intensity promoted tuber growth under short-day conditions [18,57], suggesting that increasing DLI promotes tuber formation and growth. Although the biosynthetic rate of photosynthate exhibited a significant difference in the T2, T3, and T4 treatments, the photosynthate content per day in the tubers was almost the same, which should directly contribute to the same dry weight of tubers of these three treatments (Figure 1A and Figure 2). In addition, these results suggested that potato plants tried to ensure sufficient carbon supply by accelerating the synthesis rate of photosynthate to acclimate to a shorter photoperiod and higher light intensity; in contrast, plants grown under a longer photoperiod and lower light intensity reduced the synthesis rate of photosynthate to satisfy the total demand of carbon.
Photosynthates related to the PN are the material basis for tuber formation and growth [5]. At the tuber growth stage, the tuber number was highly correlated with the accumulation rate of photosynthate in plants and tubers per day (RPP and RTP, Figure 2B). The light combination did not change the ratio of photosynthate in plants to that in tubers [58,59,60]. The ratio of RTP/RPP also exhibited no significant difference between the four treatments in the current study (Figure 2B), whereas the biomass accumulation rate of non-tubers was higher than that of plants under the T1 treatment, where it was significantly greater than that of the other three treatments, suggesting that tubers for carbon demand under the T1 treatment exceeded the photosynthetic capacity of the plant (i.e., carbon starvation of sink organ), resulting in negative growth of the tuber (Figure 1A). The imbalance between the supply and demand of photosynthates leads to leaf senescence due to the transport of photosynthates from the leaves, even from the stem to the sink organ [61,62]. At the tuber formation and growth stages, although the plants grown under the T1 treatment intended preferential growth of the tubers at the expense of the growth of non-tubers, the formation and growth of the tubers were still limited due to leaf senescence and the decline in photosynthate content and its synthetic rate (Figure 2).
4.4. Energy Consumption and Potential Benefit Analysis Under Different Combinations of Light Intensity and Photoperiod
Energy consumption is the second largest operating cost of plant factories [63]; reducing energy consumption and increasing crop yields are considered key goals for plant factory development [64]. The energy consumption of the T1 treatment was significantly higher than that of the other treatments, mainly due to its long photoperiod (16.5 h). When the lamp is turned on, some of the electricity is converted into heat, which raises the temperature of the lamp and crop room. Exposing lamps to high temperatures for a long time will shorten their service life. To ensure the long-term and stable operation of the lamps, their interior needs to be equipped with a cooling system for heat dissipation. Long-term use of lamps will increase the energy consumption of the cooling system and increase their electrical energy consumption (Table A1). This also shows that under the same DLI, the T1 treatment energy consumption was higher (Table A1). Compared with the T1 treatment, the T2, T3, and T4 treatments had lower energy consumption and higher tuber yield (Figure 1, Table A1). This indicates that reducing energy consumption and increasing yield can be achieved, but there is a balance between them (there was no difference in the EUE under the T2, T3, and T4 treatments (Figure 1)) [65]. The long-term high light intensity of the lamps under the T4 treatment increases the heat output of the lamps and the risk of lamp damage. Lamp replacement increases operating costs and reduces economic benefits. More importantly, the high light intensity inhibits potato plant growth (Table 5), although its yield is higher under the T4 treatment.
5. Conclusions
The combinations of different light intensities and photoperiods affected tuber formation and growth, and the tuber number increased with the shortening of the photoperiod and increasing light intensity. By comparing our results with those of previous research results, we deduced that the tuber number might be largely controlled by the photoperiod at a certain DLI level, while the dry weight of tubers per plant was largely determined by the DLI when the light intensity reached 300 μmol m−2 s−1. Although the DLI of the light treatments remained the same, the T1 light condition restricted tuber formation and growth due to low light. The T1 and T4 light treatments both resulted in relative photoinhibition at different levels, and the photoinhibition of plants grown under the T1 treatment was caused by a long photoperiod, whereas that of plants grown under the T4 treatment was due to high light. In contrast, the T4 light condition did not affect tuber formation or growth compared with the T2 and T3 treatments. In view of energy consumption and the cost of light sources, we recommend combining light intensity and photoperiod according to the T2 and T3 treatments to cultivate virus-free potatoes in plant factories. The results of this study are suitable for early maturing varieties, such as ‘Favorita’, which has a fast plant growth rate, but may not be applicable to late-maturing varieties, as their growth period is longer and their energy consumption is significantly increased.
Author Contributions
Conceptualization, Data curation, Investigation, Methodology, Writing—original draft, S.C.; Conceptualization, Supervision, Methodology, Writing—review & editing, D.W.; Data curation, Investigation and Methodology, J.L.; Supervision and Funding acquisition, Z.X. All authors have read and agreed to the published version of the manuscript.
Funding
This research was supported by the National Key R&D Program of China, grant number 2017YFB0403903.
Data Availability Statement
The original contributions presented in this study are included in the article, further inquiries can be directed to the corresponding author.
Conflicts of Interest
Author Jiating Lin was employed by the company Guangdong Jieyang Agricultural Reclamation Group Co., Ltd. The remaining authors declare that the research was conducted in the absence of any commercial or financial relationships that could be construed as a potential conflict of interest.
Appendix A
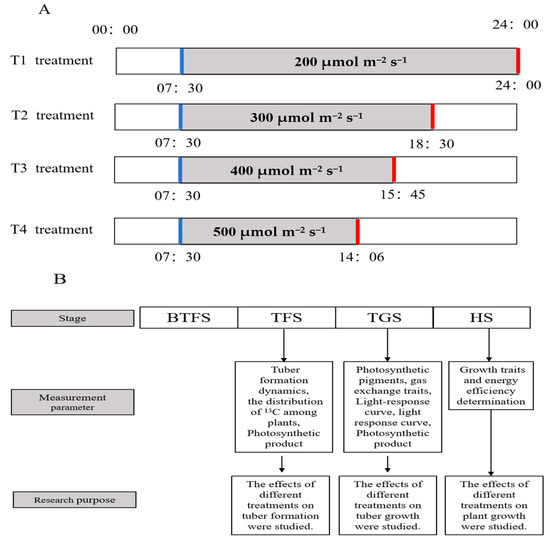
Figure A1.
The light conditions in detail (A) and details of each stage of the study (B). Red line, turn off the light; blue line, turn on the light.
Table A1.
Energy consumption for tuber breeding in plant factories. Data are mean ± standard deviation (n = 3). Different lowercase letters in the same parameter indicate statistically significant differences at p < 0.05. CV% = (standard deviation/sample mean) × 100.
Table A1.
Energy consumption for tuber breeding in plant factories. Data are mean ± standard deviation (n = 3). Different lowercase letters in the same parameter indicate statistically significant differences at p < 0.05. CV% = (standard deviation/sample mean) × 100.
| BTFS to HS | TFS to HS | |||
|---|---|---|---|---|
| Electricity Consumption°/Plant (CV%) | Electric Energy Mj/Plant (CV%) | Electricity Consumption°/Plant (CV%) | Electric Energy Mj/Plant (CV%) | |
| T1 | 4.59 ± 0.05 c (1.09) | 16.46 ± 0.29 a (1.76) | 3.38 ± 0.11 a (3.25) | 12.29 ± 0.25 a (2.03) |
| T2 | 4.17 ± 0.11 b (2.64) | 15.15 ± 0.17 b (1.12) | 3.04 ± 0.09 b (2.96) | 10.87 ± 0.54 b (4.97) |
| T3 | 3.97 ± 0.10 b (2.52) | 14.49 ± 0.41 b (2.83) | 2.89 ± 0.05 b (1.73) | 10.47 ± 0.16 b (1.53) |
| T4 | 3.76 ± 0.04 a (1.06) | 13.96 ± 0.27 c (1.93) | 2.72 ± 0.07 c (2.57) | 9.98 ± 0.17 c (1.70) |
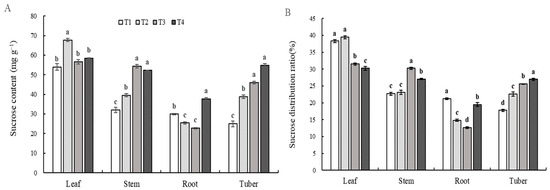
Figure A2.
Sucrose content (A) and distribution ratio (B) in plants under different combinations of light intensity and photoperiod at tuber formation stage. The abbreviations of growth environments are the same as in Table 2. Different lowercase letters in the same parameter indicate statistically significant differences at p < 0.05.
References
- Li, R.; You, J.; Miao, C.; Kong, L.; Long, J.; Yan, Y.; Xu, Z.; Liu, X. Monochromatic lights regulate the formation, growth, and dormancy of in vitro-grown Solanum tuberosum L. microtubers. Sci. Hortic. 2020, 261, 108947. [Google Scholar] [CrossRef]
- Chen, L.; Xue, X.; Yang, Y.; Chen, F.; Zhao, J.; Wang, X.; Khan, A.T.; Hu, Y. Effects of red and blue LEDs on in vitro growth and microtuberization of potato single-node cuttings. Front. Agric. Sci. Eng. 2018, 5, 197–205. [Google Scholar] [CrossRef]
- Halterman, D.; Guenthner, J.; Collinge, S.; Butler, N.; Douches, D. Biotech Potatoes in the 21st Century: 20 Years Since the First Biotech Potato. Am. J. Potato Res. 2015, 93, 1–20. [Google Scholar] [CrossRef]
- Kozai, T.; Niu, G. Role of the plant factory with artificial lighting (PFAL) in Urban Areas. In Plant factory; Academic Press: Cambridge, Ma, USA, 2016; Chapter 2; pp. 7–34. [Google Scholar] [CrossRef]
- He, W.; Pu, M.; Li, J.; Xu, Z.G.; Gan, L. Potato Tuber Growth and Yield Under Red and Blue LEDs in Plant Factories. J. Plant Growth Regul. 2021, 41, 1–12. [Google Scholar]
- He, W.; Miao, C.; You, J.; Gan, L.; Xu, Z.-G. Effects of Red and Blue Light with Supplemental White Light on Growth, Carbohydrate Metabolism, and Yield of Virus-Free Potato in Plant Factories. Am. J. Potato Res. 2020, 97, 554–564. [Google Scholar] [CrossRef]
- He, W.; Li, J.; Pu, M.; Xu, Z.G.; Gan, L. Response of photosynthate distribution in potato plants to different LED spectra. Funct. Plant Biol. 2020, 47, 1128–1137. [Google Scholar] [CrossRef]
- Li, R.; Long, J.; Yan, Y.; Luo, J.; Xu, Z.; Liu, X. Addition of White Light to Monochromatic Red and Blue Lights Alters the Formation, Growth, and Dormancy of In Vitro-grown Solanum tuberosum L. Microtubers. HortScience 2020, 55, 71–77. [Google Scholar] [CrossRef]
- Fu, Y.; Li, H.; Yu, J.; Liu, H.; Cao, Z.; Manukovsky, N.; Liu, H. Interaction effects of light intensity and nitrogen concentration on growth, photosynthetic characteristics and quality of lettuce (Lactuca sativa L. Var. youmaicai). Sci. Hortic. 2017, 214, 51–57. [Google Scholar] [CrossRef]
- Lefsrud, M.G.; Kopsell, D.A.; Augé, R.M.; Both, A.J. Biomass production and pigment accumulation in kale grown under increasing photoperiods. HortScience 2006, 41, 603–606. [Google Scholar] [CrossRef]
- Chikov, V.I.; Mikhailov, A.L.; Timofeeva, O.A.; Khamidullina, L.A. Photosynthetic carbon metabolism in potato leaves under changes in light intensity. Russ. J. Plant Physiol. 2016, 63, 70–76. [Google Scholar] [CrossRef]
- Berkovich, Y.A.; Konovalova, I.O.; Smolyanina, S.O.; Erokhin, A.N.; Avercheva, O.V.; Bassarskaya, E.M.; Kochetova, G.V.; Zhigalova, T.V.; Yakovleva, O.S.; Tarakanov, I.G. LED crop illumination inside space greenhouses. REACH–Rev. Hum. Space Explor. 2017, 6, 11–24. [Google Scholar]
- Zhang, S.; Ma, K.; Chen, L. Response of photosynthetic plasticity of Paeonia suffruticosa to changed light environments. Environ. Exp. Bot. 2003, 49, 121–133. [Google Scholar] [CrossRef]
- Matos, F.S.; Wolfgramm, R.; Gonçalves, F.V.; Cavatte, P.C.; Ventrella, M.C.; DaMatta, F.M. Phenotypic plasticity in response to light in the coffee tree. Environ. Exp. Bot. 2009, 67, 421–427. [Google Scholar] [CrossRef]
- Kromdijk, J.; Głowacka, K.; Leonelli, L.; Gabilly, S.T.; Iwai, M.; Niyogi, K.K.; Long, S.P. Improving photosynthesis and crop productivity by accelerating recovery from photoprotection. Science 2016, 354, 857–861. [Google Scholar] [CrossRef]
- Zavala, J.; Ravetta, D. Allocation of photoassimilates to biomass, resin and carbohydrates in Grindelia chiloensis as affected by light intensity. Field Crops. Res. 2001, 69, 143–149. [Google Scholar] [CrossRef]
- Steinger, T.; Roy, B.A.; Stanton, M.L. Evolution in stressful environments II: Adaptive value and costs of plasticity in response to low light in Sinapis arvensis. J. Evol. Biol. 2003, 16, 313–323. [Google Scholar] [CrossRef]
- Dobránszki, J. Effects of light on in vitro tuberization of the potato cultivar desiree and its relatives. Acta Biol. Hung. 2001, 52, 137–147. [Google Scholar] [CrossRef]
- Plantenga, F.D.; Bergonzi, S.; Bachem, C.W.; Visser, R.G.; Heuvelink, E.; Marcelis, L.F. High light accelerates potato flowering independently of the FT-like flowering signal StSP3D. Environ. Exp. Bot. 2019, 160, 35–44. [Google Scholar] [CrossRef]
- Plantenga, F.D.M.; Bergonzi, S.; Abelenda, J.A.; Bachem, C.W.B.; Visser, R.G.F.; Heuvelink, E.; Marcelis, L.F.M. The tuberization signal StSP6A represses flower bud development in potato. J. Exp. Bot. 2018, 70, 937–948. [Google Scholar] [CrossRef]
- Navarro, C.; Abelenda, J.A.; Cruz-Oró, E.; Cuéllar, C.A.; Tamaki, S.; Silva, J.; Shimamoto, K.; Prat, S. Control of flowering and storage organ formation in potato by FLOWERING LOCUS T. Nature 2011, 478, 119–122. [Google Scholar] [CrossRef]
- Firman, D.M.; O’Brien, P.J.; Allen, E.J. Leaf and flower initiation in potato (Solanum tuberosum) sprouts and stems in relation to number of nodes and tuber initiation. J. Agric. Sci. 1991, 117, 61–74. [Google Scholar] [CrossRef]
- Stutte, G.W.; Yorio, N.C.; Wheeler, R.M. Interacting effects of photoperiod and photosynthetic photon flux on net carbon assimilation and starch accumulation in potato leaves. J. Am. Soc. Hortic. Sci. 1996, 121, 264–268. [Google Scholar] [CrossRef] [PubMed]
- Faust, J.E.; Logan, J. Daily Light Integral: A Research Review and High-resolution Maps of the United States. HortScience 2018, 53, 1250–1257. [Google Scholar] [CrossRef]
- Gerovac, J.R.; Craver, J.K.; Boldt, J.K.; Lopez, R.G. Light Intensity and Quality from Sole-source Light-emitting Diodes Impact Growth, Morphology, and Nutrient Content of Brassica Microgreens. HortScience 2016, 51, 497–503. [Google Scholar] [CrossRef]
- Kelly, N.; Choe, D.; Meng, Q.; Runkle, E.S. Promotion of lettuce growth under an increasing daily light integral depends on the combination of the photosynthetic photon flux density and photoperiod. Sci. Hortic. 2020, 272, 109565. [Google Scholar] [CrossRef]
- Oh, W.; Cheon, I.H.; Kim, K.S.; Runkle, E.S. Photosynthetic Daily Light Integral Influences Flowering Time and Crop Characteristics of Cyclamen persicum. HortScience 2009, 44, 341–344. [Google Scholar] [CrossRef]
- Garland, K.F.; Burnett, S.E.; Day, M.E.; van Iersel, M.W. Influence of Substrate Water Content and Daily Light Integral on Photosynthesis, Water Use Efficiency, and Morphology of Heuchera americana. J. Am. Soc. Hortic. Sci. 2012, 137, 57–67. [Google Scholar] [CrossRef]
- Jao, R.C.; Fang, W. Growth of Potato Plantlets In Vitro Is Different When Provided Concurrent Versus Alternating Blue and Red Light Photo-periods. Hortence 2004, 39, 380–382. [Google Scholar]
- Mao, H.; Hang, T.; Zhang, X.; Lu, N. Both Multi-Segment Light Intensity and Extended Photoperiod Lighting Strategies, with the Same Daily Light Integral, Promoted Lactuca sativa L. Growth and Photosynthesis. Agronomy 2019, 9, 857. [Google Scholar] [CrossRef]
- Shen, Y.; Guo, S.; Ai, W.; Tang, Y. Effects of the Red and Blue LED Light Intensity on Lettuce Growthand Photosynthetic Ratein a Closed System. Manned Spacefl. 2014, 3, 273–278, (In Chniese, with English abstract). [Google Scholar]
- Rahman, M.; Vasiliev, M.; Alameh, K. LED Illumination Spectrum Manipulation for Increasing the Yield of Sweet Basil (Ocimum basilicum L.). Plants 2021, 10, 344. [Google Scholar] [CrossRef] [PubMed]
- Fan, X.; Zang, J.; Xu, Z.; Guo, S.; Jiao, X.; Liu, X.; Gao, Y. Effects of different light quality on growth, chlorophyll concentration and chlorophyll biosynthesis precursors of non-heading Chinese cabbage (Brassica campestris L.). Acta Physiol. Plant. 2013, 35, 2721–2726. [Google Scholar] [CrossRef]
- Ye, Z.; Suggett, D.J.; Robakowski, P.; Kang, H. A mechanistic model for the photosynthesis–light response based on the photosynthetic electron transport of photosystem II in C3 and C4 species. New Phytol. 2013, 199, 110–120. [Google Scholar] [CrossRef] [PubMed]
- Ye, Z.P. Photosynthesis Model Simulation Software. Available online: http://photosynthetic.sinaapp.com/ (accessed on 4 July 2024).
- Braun, G.; Malkin, S. Regulation of the imbalance in light excitation between Photosystem II and Photosystem I by cations and by the energized state of the thylakoid membrane. Biochim. Biophys. Acta (BBA) Bioenerg. 1990, 1017, 79–90. [Google Scholar] [CrossRef]
- Demmig-Adams, B.; Adams, W.W., III; Barker, D.H.; Logan, B.A.; Bowling, D.R.; Verhoeven, A.S. Using chlorophyll fluorescence to assess the fraction of absorbed light allocated to thermal energy dissipation of excess excitation. Physiol. Plant. 1996, 98, 254–264. [Google Scholar] [CrossRef]
- Sun, D.Z.; Han, X.R.; Peng, J.; Fan, F. The effect of exogenous salicylic acid on PS II photochemical efficiency and distribution and utilization of luminous energy in tomato seedlings. Acta. Hortic. Sinica 2016, 43, 1482–1492. [Google Scholar] [CrossRef]
- Schreiber, U.; Bilger, W.; Neubauer, C. Chlorophyll fluorescence as a nonintrusive indicator for rapid assessment of in vivo photosynthesis. In Ecophysiology of Photosynthesis; Springer: Berlin/Heidelberg, Germany, 1995; pp. 49–70. [Google Scholar] [CrossRef]
- Epron, D.; Godard, D.; Cornic, G.; Genty, B. Limitation of net CO2 assimilation rate by internal resistances to CO2 transfer in the leaves of two tree species (Fagus sylvatica L. and Castanea sativa Mill.). Plant Cell Environ. 1995, 18, 43–51. [Google Scholar] [CrossRef]
- Fairbairn, N. A modified anthrone reagent. Chem Ind 1953, 4, 86. [Google Scholar]
- Evans, J.R.; Poorter, H. Photosynthetic acclimation of plants to growth irradiance: The relative importance of specific leaf area and nitrogen partitioning in maximizing carbon gain. Plant Cell Environ. 2001, 24, 755–767. [Google Scholar] [CrossRef]
- Naramoto, M.; Katahata, S.-I.; Mukai, Y.; Kakubari, Y. Photosynthetic acclimation and photoinhibition on exposure to high light in shade-developed leaves of Fagus crenata seedlings. Flora 2005, 201, 120–126. [Google Scholar] [CrossRef]
- Cavagnaro, J.; Trione, S. Physiological, morphological and biochemical responses to shade of Trichloris crinita, a forage grass from the arid zone of Argentina. J. Arid Environ. 2006, 68, 337–347. [Google Scholar] [CrossRef]
- Ye, Z.; Kang, H. Study on the Biological Significance of Coefficients in the Modified Plant Photoresponse Model. J. Yangzhou Univ. (Agric. Life Sci. Ed.) 2012, 33, 51–57, (In Chinese, with English abstract). [Google Scholar] [CrossRef]
- Murage, E.N.; Watashiro, N.; Masuda, M. Influence of light quality, PPFD and temperature on leaf chlorosis of eggplants grown under continuous illuminetion. Sci. Hortic. 1997, 68, 73–82. [Google Scholar] [CrossRef]
- Lincoin, T.; Eduardo, Z. Plant Physiology; Science Press: Beijing, China, 2015; 163p. [Google Scholar]
- Velez-Ramirez, A.I.; van Ieperen, W.; Vreugdenhil, D.; Millenaar, F.F. Plants under continuous light. Trends Plant Sci. 2011, 16, 310–318. [Google Scholar] [CrossRef]
- Demmig-Adams, B.; Adams, W.W. Antioxidants in Photosynthesis and Human Nutrition. Science 2002, 298, 2149–2153. [Google Scholar] [CrossRef]
- Busch, F.A.; Sage, R.F.; Farquhar, G.D. Plants increase CO2 uptake by assimilating nitrogen via the photorespiratory pathway. Nat. Plants 2017, 4, 46–54. [Google Scholar] [CrossRef]
- Guilherme, E.; Carvalho, F.; Daloso, D.; Silveira, J. Increase in assimilatory nitrate reduction and photorespiration enhances CO2 assimilation under high light-induced photoinhibition in cotton. Environ. Exp. Bot. 2019, 159, 66–74. [Google Scholar] [CrossRef]
- Yokono, M.; Murakami, A.; Akimoto, S. Excitation energy transfer between photosystem II and photosystem I in red algae: Larger amounts of phycobilisome enhance spillover. Biochim. Biophys. Acta (BBA) Bioenerg. 2011, 1807, 847–853. [Google Scholar] [CrossRef]
- Rochaix, J.-D. Regulation and Dynamics of the Light-Harvesting System. Annu. Rev. Plant Biol. 2014, 65, 287–309. [Google Scholar] [CrossRef]
- Haldrup, A.; Jensen, P.E.; Lunde, C.; Scheller, H.V. Balance of power: A view of the mechanism of photosynthetic state transitions. Trends Plant Sci. 2001, 6, 301–305. [Google Scholar] [CrossRef]
- Izumi, M. Roles of the Clock in Controlling Starch Metabolism. Plant Physiol. 2019, 179, 1441–1443. [Google Scholar] [CrossRef] [PubMed]
- Chincinska, I.A.; Liesche, J.; Krügel, U.; Michalska, J.; Geigenberger, P.; Grimm, B.; Kühn, C. Sucrose transporter StSUT4 from potato affects flowering, tuberization, and shade avoidance response. Plant Physiol. 2008, 146, 515–528. [Google Scholar] [PubMed]
- Dobránzki, J.; Tábóri, K.M.; Ferenczy, A. Light and genotype effects on in vitro tuberization of potato plantlets. Potato Res. 1999, 42, 483–488. [Google Scholar] [CrossRef]
- Ballaré, C.L.; Scopel, A.L.; Sánchez, R.A. On the opportunity cost of the photosynthate invested in stem elongation reactions mediated by phytochrome. Oecologia 1991, 86, 561–567. [Google Scholar] [CrossRef]
- Sweetlove, L.J.; Hill, S.A. Source metabolism dominates the control of source to sink carbon flux in tuberizing potato plants throughout the diurnal cycle and under a range of environmental conditions. Plant Cell Environ. 2000, 23, 523–529. [Google Scholar] [CrossRef]
- Nishizawa, T.; Shishido, Y.; Murakami, H. Effect of temporary changes in light intensity on carbon transport, partitioning and respiratory loss in young tomato seedlings raised under different light intensities. Physiol. Plant. 2009, 136, 351–357. [Google Scholar] [CrossRef]
- Tollenaar, M.; Daynard, T.B. Effect of source-sink ratio on dry matter accumulation and leaf senesence of maize. Can. J. Plant Sci. 1982, 62, 855–860. [Google Scholar] [CrossRef]
- Noodén, L.D.; Guiamét, J.J.; John, I. Senescence mechanisms. Physiol. Plant. 1997, 101, 746–753. [Google Scholar] [CrossRef]
- Taki, M.; Rohani, A.; Rahmati-Joneidabad, M. Solar thermal simulation and applications in greenhouse. Inf. Process. Agric. 2018, 5, 83–113. [Google Scholar] [CrossRef]
- Vadiee, A.; Yaghoubi, M.; Sardella, M.; Farjam, P. Energy analysis of fuel cell system for commercial greenhouse application–A feasibility study. Energy Convers. Manag. 2015, 89, 925–932. [Google Scholar] [CrossRef]
- Iddio, E.; Wang, L.; Thomas, Y.; McMorrow, G.; Denzer, A. Energy efficient operation and modeling for greenhouses: A literature review. Renew. Sustain. Energy Rev. 2020, 117, 109480. [Google Scholar] [CrossRef]
Disclaimer/Publisher’s Note: The statements, opinions and data contained in all publications are solely those of the individual author(s) and contributor(s) and not of MDPI and/or the editor(s). MDPI and/or the editor(s) disclaim responsibility for any injury to people or property resulting from any ideas, methods, instructions or products referred to in the content. |
© 2025 by the authors. Licensee MDPI, Basel, Switzerland. This article is an open access article distributed under the terms and conditions of the Creative Commons Attribution (CC BY) license (https://creativecommons.org/licenses/by/4.0/).