Article

Maize Yield Suitability Mapping in Two Major Asian Mega-Deltas Using AgERA and CMIP6 Climate Projections in Crop Modeling

1
International Rice Research Institute, Los Baños 4031, Philippines
2
International Rice Research Institute, Hanoi 100000, Vietnam
*
Author to whom correspondence should be addressed.
Agronomy 2025, 15(4), 878; https://doi.org/10.3390/agronomy15040878
Submission received: 8 February 2025 / Revised: 9 March 2025 / Accepted: 11 March 2025 / Published: 31 March 2025
(This article belongs to the Special Issue Adaptations and Responses of Cropping Systems to Climate Change)

Abstract

:
Asian Mega-Deltas (AMDs) are important food baskets and contribute significantly to global food security. However, these areas are extremely susceptible to the consequences of climate change, such as rising temperatures, sea-level rise, water deficits/surpluses and saltwater intrusion. This study focused on maize crop suitability mapping and yield assessment in two major AMDs: the Ganges Delta, spanning parts of northeast India and Bangladesh, and the Mekong Delta across Vietnam and Cambodia. We investigated the historical climate reanalysis AgERA datasets and climate projections from the Coupled Model Intercomparison Phase 6 (CMIP6) for the periods 2040–2070 and 2070–2100 using PyAEZ-based modeling to estimate maize yields for periods in the near (2050s) and far future (2100s). Province-level yield estimates were validated against statistics reported by the governments of the respective countries. Model performance varied across regions, with R2 values ranging from 0.07 to 0.94, MAE from 0.67 t·ha−1 (14.2%) to 1.56 t·ha−1 (20.7%) and RMSE from 0.62 t·ha−1 (14.6%) to 1.74 t·ha−1 (23.1%) in the Ganges Delta, and R2 values from 0.23 to 0.85, MAE from 0.37 t·ha−1 (12.8%) to 2.7 t·ha−1 (27.2%) and RMSE from 0.45 t·ha−1 (15.9%) to 1.76 t·ha−1 (30.9%) in the Mekong Delta. The model performed comparatively better in the Indian region of the Ganges Delta than in the Bangladeshi region, where some yield underestimation was observed not accurately capturing the increasing upward trend in reported yields over time. Similarly, yields were underestimated in some provinces of the Mekong Delta since 2008. This may be attributed to improved management practices and the model’s inability to fully capture high-input management systems. There are also limitations related to the downscaling of CMIP6 data; the yield estimated using the downscaled CMIP6 data has small variability under rainfed and irrigated conditions. Despite these limitations, the modeling approach effectively identified vulnerable regions for maize production under future climate scenarios. Additionally, maize crop suitability zones were delineated, providing critical insights for planning and policy design to support climate adaptation in these vulnerable regions.

Graphical Abstract

1. Introduction

Addressing the challenge of global food security requires consideration of the availability and quality of land and water resources, as well as socioeconomic circumstances and institutional elements [1]. These conditions are expected to worsen with climate change and the increasing population, especially in low-income and geographically vulnerable parts of the world like Asian Mega-Deltas (AMDs) [2]. Most of the current research forecasts negative outcomes for crop yields in the future, although large uncertainties remains in using climate projections [3,4,5]. In its most recent report [6], the Intergovernmental Panel on Climate Change (IPCC) outlines a novel set of scenarios known as Shared Socioeconomic Pathways (SSPs). These SSPs are being used to investigate how societal decisions will impact greenhouse gas emissions and, consequently, how the Paris Agreement’s climate goals might be achieved. The Sixth Assessment Report from the IPCC (AR6) confirms that crop yields worldwide are expected to decline across most cultivated lands. Maize (Zea mays L.) is one of the most important annual cereal crops providing staple food and a source of income in developing countries [7]. By 2070, maize crop yield is expected to drop by 40% in the most affected regions of the world, which could lead to a crisis situation.
It is widely acknowledged that increasing expected crop yields and their suitability in agriculture is possible through the use of adaptation techniques [8,9,10,11]. The IPCC-AR6 definition of adaptation measures includes crop management techniques that are feasible to implement and yield substantial cost savings, such as crop rotation and planting date optimization [12,13]. The effects of global warming on maize crops could be effectively mitigated by breeding cultivars with longer growing seasons and optimizing planting dates [14,15]. Ref. [16] studied the climatic potential of maize under dryland farming in Lesotho, South Africa using five suitability indices; the study concluded that it is crucial to consider climatic variability when looking for management strategies that can optimize the productivity of rainfed systems for maize crops. Policymakers and other stakeholders can use maize yield predictions as crucial information to modify adaptive policies and ensure crop output at the anticipated level [17,18]. Moreover, this can assist in determining the crop’s appropriateness classes in order to optimize its agronomic potential [19]. A wide variety of methods have been developed for such applications. Many researchers have utilized geospatial tools, combined with statistical and dynamical models, to identify land and crop suitability classes [20,21,22,23]. Refs. [24,25] implemented the analytical hierarchy process (AHP) and [20,26,27] used geospatial techniques for suitability mapping. The study [28] conducted in the Yusufeli district of Artvin city in Turkey shows improved accuracy and potential for suitability mapping as compared to studies that use one of these. Several other studies have also demonstrated improved accuracy and efficiency by integrating statistical methods with GIS. For example, the combined AHP process in GIS with multi-fuzzy modeling was used to evaluate the sustainability of silage corn production in the southwest Iranian province of Fars [29]. A rural coastal region in the southern Italian province of Puglia has had its potential assessed using multi-criteria decision analysis (MCDA) integrated into GIS [30]. AHP and GIS were integrated to evaluate land suitability for maize production in Zimbabwe using multi-criteria evaluation processes [31] and in the semi-arid ecosystem of the Mysuru district of Karnataka, southern India, to assess land suitability for maize production [32]. Despite the advantages of integrating statistical methods and geospatial techniques for land suitability assessment, this approach cannot be directly used for crop yield mapping.
There have been approaches developed for crop yield estimation based on statistical, dynamical and semi-empirical modeling. Statistical approaches use statistical or machine learning models to estimate crop yield using soil and climate variables, but they do not consider the physiological components of the crop, hence leading to large biases [19,33,34,35,36,37,38,39,40,41,42,43,44,45,46,47]. On the other hand, process-based models such as APSIM [48], DSSAT [49] and AquaCrop [50,51] use equations based on bio-physical concepts to simulate crop yield. These models are generally complex and require a large number of parameters that are difficult to calibrate, limiting the use for regional level applications. Semi-empirical approaches have a comparatively less complex structure and fewer parameters compared to the process-based models such as [52,53,54], which make them better choices for large spatial-level applications.
FAO has developed, and continuously adds to or improves, the agro-ecological zoning framework over the last three decades which identifies the land use based on the suitability of climate, soil and terrain factors. Recently, a new version of global agro-ecological zoning (GAEZv4) framework has been released by FAO and its counterparts [1]. This framework contains a set of equations for simulating crop yield and suitability based on concepts of physical process modeling and integrating the approach of agro-ecological zoning into the yield modeling [1,55]. This framework has been used in [56] to assess the impacts of climate change on crop yields in Nepal. There have been limited studies for maize yield estimation in the AMD region and, to the authors’ knowledge, no study for the maize yield projections in the near and far future using climate projections. To address this challenge and to fill the gap in maize crop yield and suitability mapping, we are focusing on crop yield estimation using the GAEZ approach in two of the major AMDs: the Ganges Delta, India–Bangladesh and the Mekong Delta, Vietnam–Cambodia. Initially, to test the performance of the GAEZ modeling approach, crop yield was estimated by processing historical climate data from AgERA for both the deltas; estimated yield was compared to the available reported yield at the district/province level. Further, the crop model was applied to Coupled Model Intercomparison Phase 6 (CMIP6) climate projections for the 2050s and 2100s under two SSP scenarios, 370 and 585, for future crop yield and suitability predictions. To narrow down uncertainties in the crop yield predictions, we explored the CMIP6 downscaled dataset at a resolution of 1 km, generated a shift in crop suitability between climate change scenarios and estimated the loss relative to the period 2050 and 2100.

2. Materials and Methods
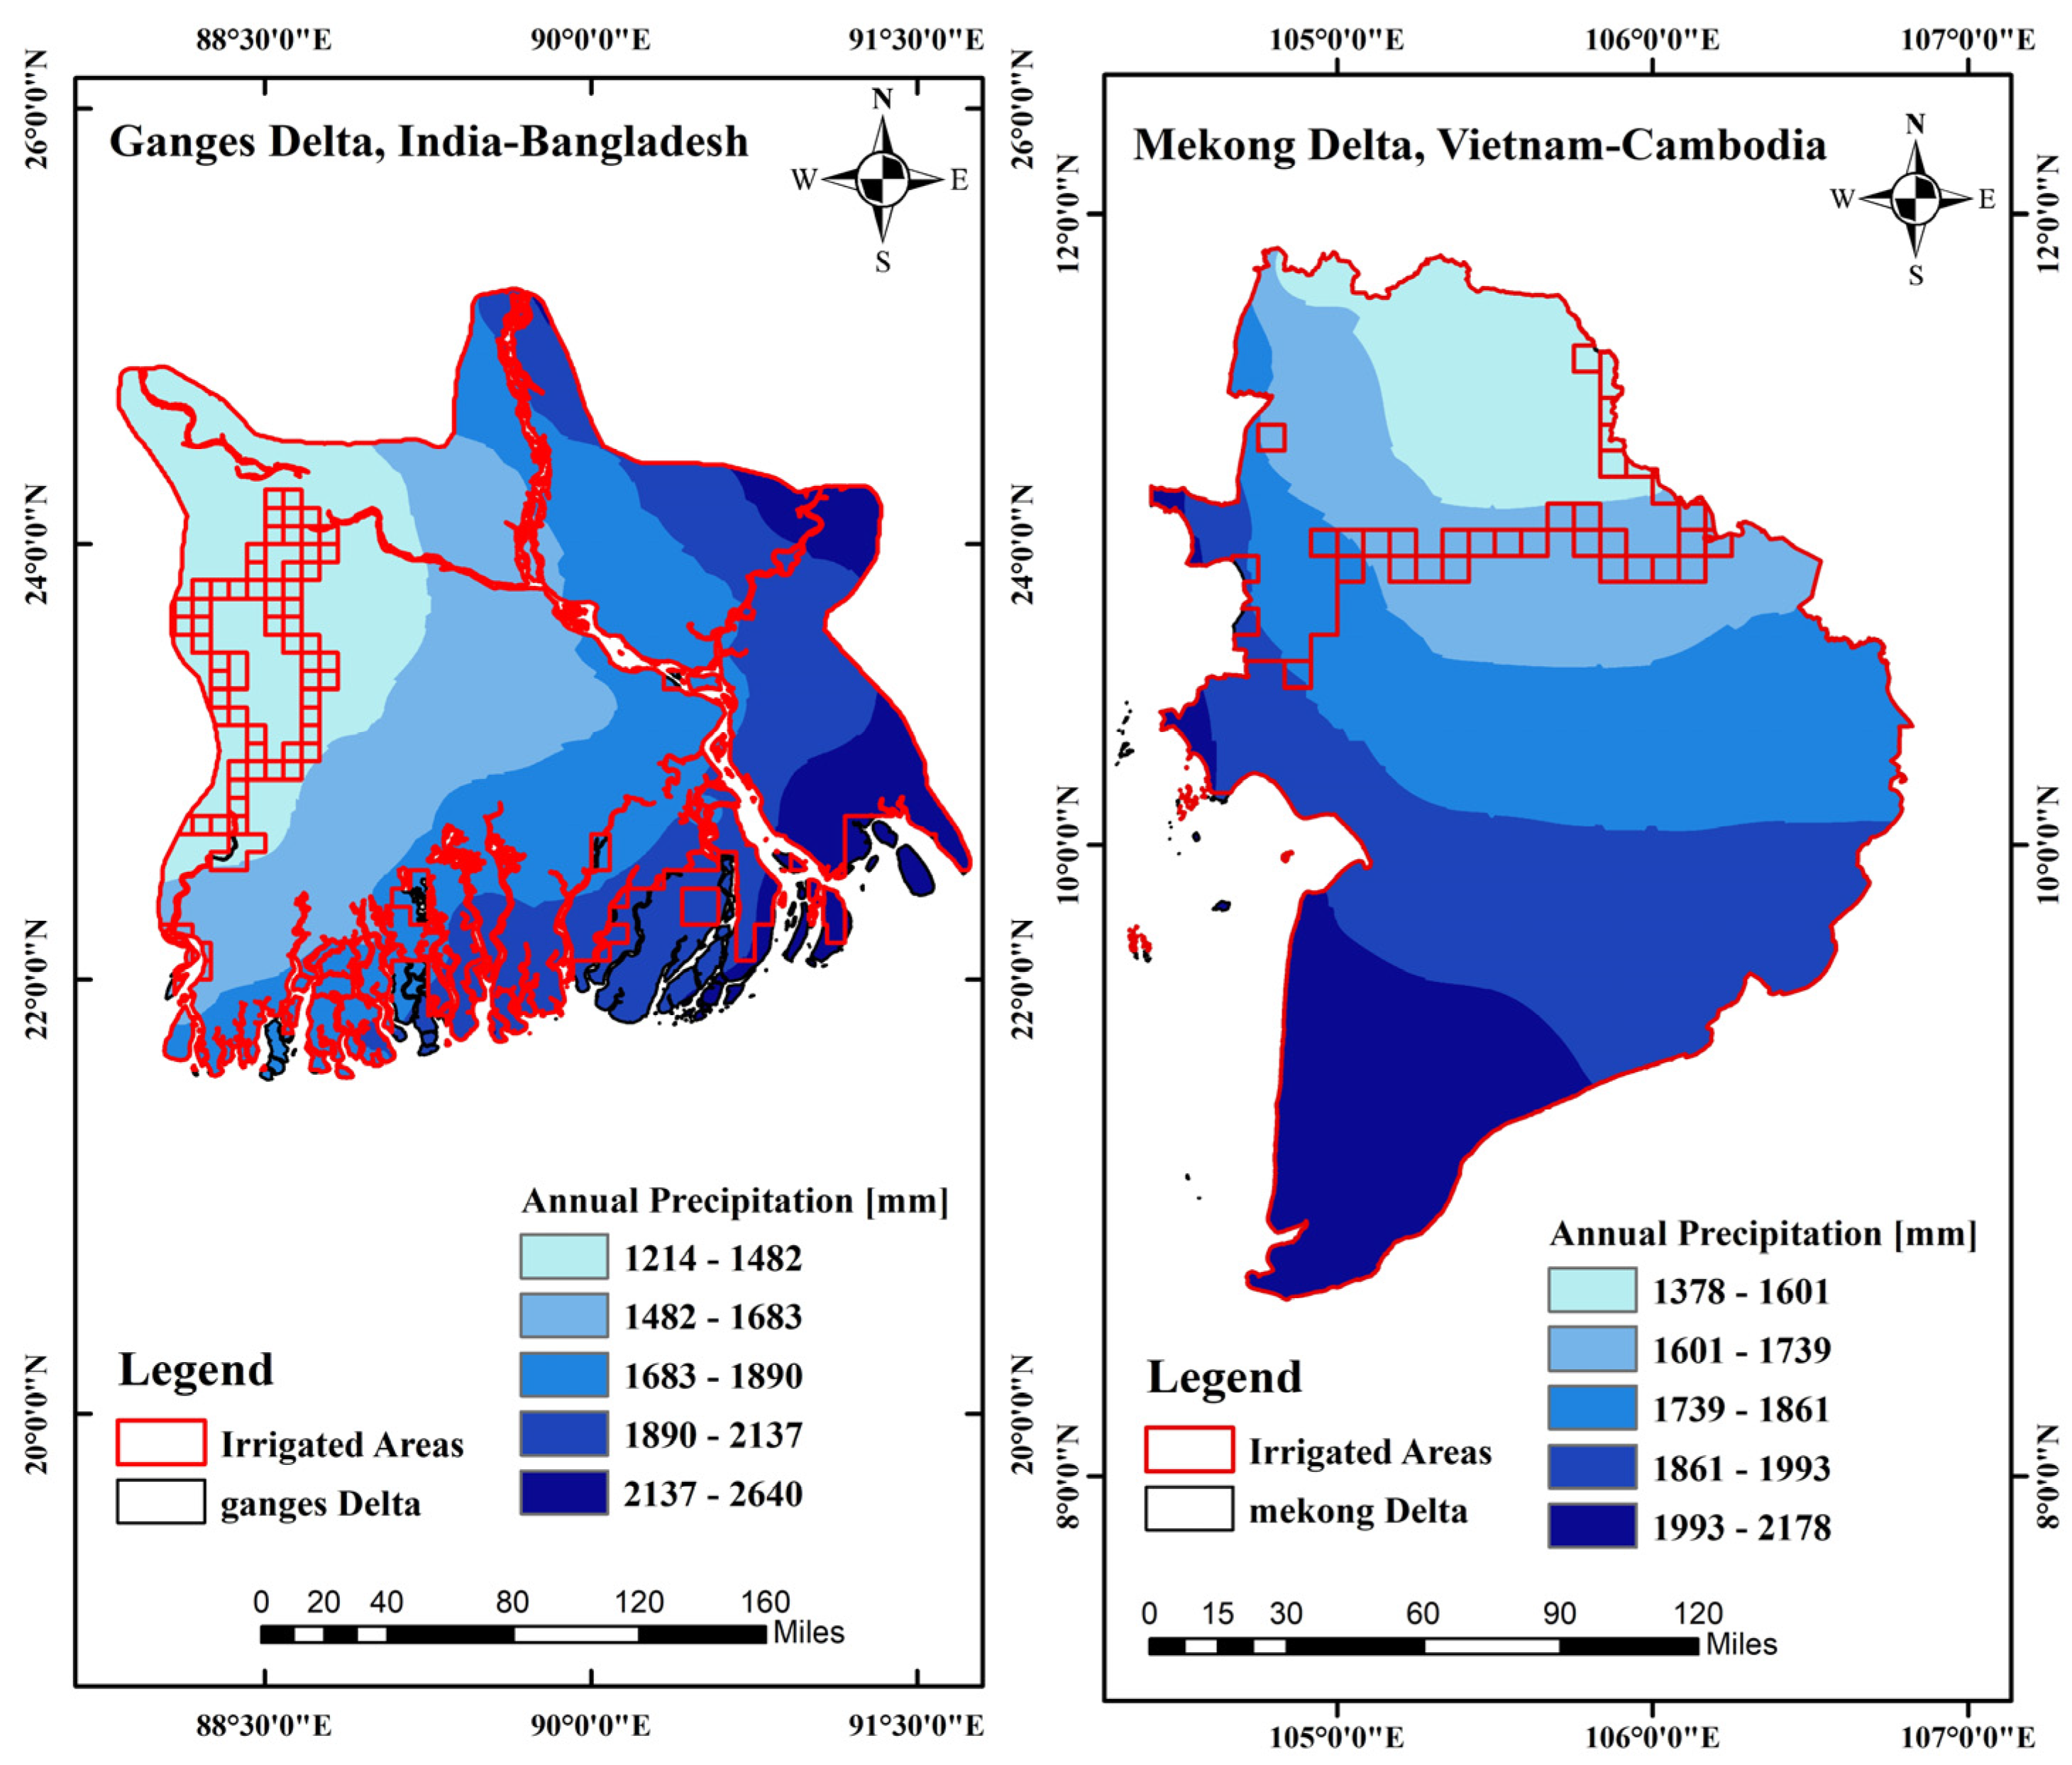
2.1. Study Sites

In this work, we implemented a GAEZv4-based modeling approach [1] on two major AMDs: the Ganges Delta, India–Bangladesh and the Mekong Delta, Vietnam–Cambodia. The study areas for both deltas are presented in Figure 1.
There is a dry season from December to late April and a rainy season from May to November in the Mekong Delta, which is influenced by the East Asian summer monsoon. Annual precipitation averages close to 2000 mm and temperatures are consistently warm (20–35 °C) [57]. The Mekong Delta includes thirteen provinces of Vietnam and five provinces of Cambodia.
The Ganges Delta is located on the eastern coast of India and in Bangladesh; it expands from 21.33° to 25.33° latitude. Annual precipitation in the delta averages around 1800 mm (Figure 1) and the average temperature ranges from 20 to 32 °C [58]. This region is characterized by heavy winds and high humidity during the summer months, while average temperatures are lower in winter. The Ganges Delta region comprises six districts from the Indian state of West Bengal—N24 Parganas, S24 Parganas, Hugli, Murshidabad, Howrah and Nadia—and five divisions of Bangladesh—Rajshahi, Khulna, Dhaka, Barisal and Chattogram.

2.2. Data

We used daily minimum and maximum temperatures [°C], global radiation [watts·m−2], precipitation [mm], wind speed [m·s−1] and relative humidity [%] for the period 1995–2022 for the Mekong Delta and 2008–2022 for the Ganges Delta from AgERA at a 0.1° resolution [59]. In addition to these historical datasets, climatic projections of these variables from CMIP6 were utilized, specifically using the MPI-ESM1-2-LR Global Circulation Model (GCM) for different realizations and ensembles covering the periods 2041–2070, commonly referred to as the 2050s, and 2071–2100, commonly referred to as the 2100s. The selection of MPI-ESM1-2-LR GCM was based on the comparative analysis of the downscaled minimum/maximum temperatures and precipitation from six different GCMs (Table 1) and the studies of [60,61]. The mean values from these GCMs were closely approximated by MPI-ESM1-2-LR (Section 2.3.1, Figure 2 and Figure 3). For reliability, 10 ensembles of the MPI-ESM1-2-LR GCM were processed and downscaled for yield and suitability modeling in the 2050s and 2100s. Shuttle Radar Topography Mission (SRTM) data at a 90 m spatial resolution were used for elevation. Soil physical/chemical property data were extracted from the Harmonized World Soil Database (HSWD) 2.0 as a soil type map at a spatial resolution of 30 arc seconds by 30 arc seconds for both deltas.
Provincial-level maize yield data were obtained from the Government of Vietnam (https://www.gso.gov.vn/en/agriculture-forestry-and-fishery/, accessed on 10 March 2025), the Department of Agriculture, Ministry of Agriculture, India (https://aps.dac.gov.in/Home.aspx?ReturnUrl=%2f, accessed on 10 March 2025) and the Bangladesh Bureau of Statistics (https://bbs.gov.bd/site/page/3e838eb6-30a2-4709-be85-40484b0c16c6/-, accessed on 10 March 2025) for the years 1995–2022 for Vietnam and 2008–2022 for India and Bangladesh. This yield data were used to validate our approach for crop yield mapping in the provinces of the Mekong Delta region in Vietnam and the districts in the state of West Bengal, India and Bangladesh that fall in the Ganges Delta region.

2.3. Method

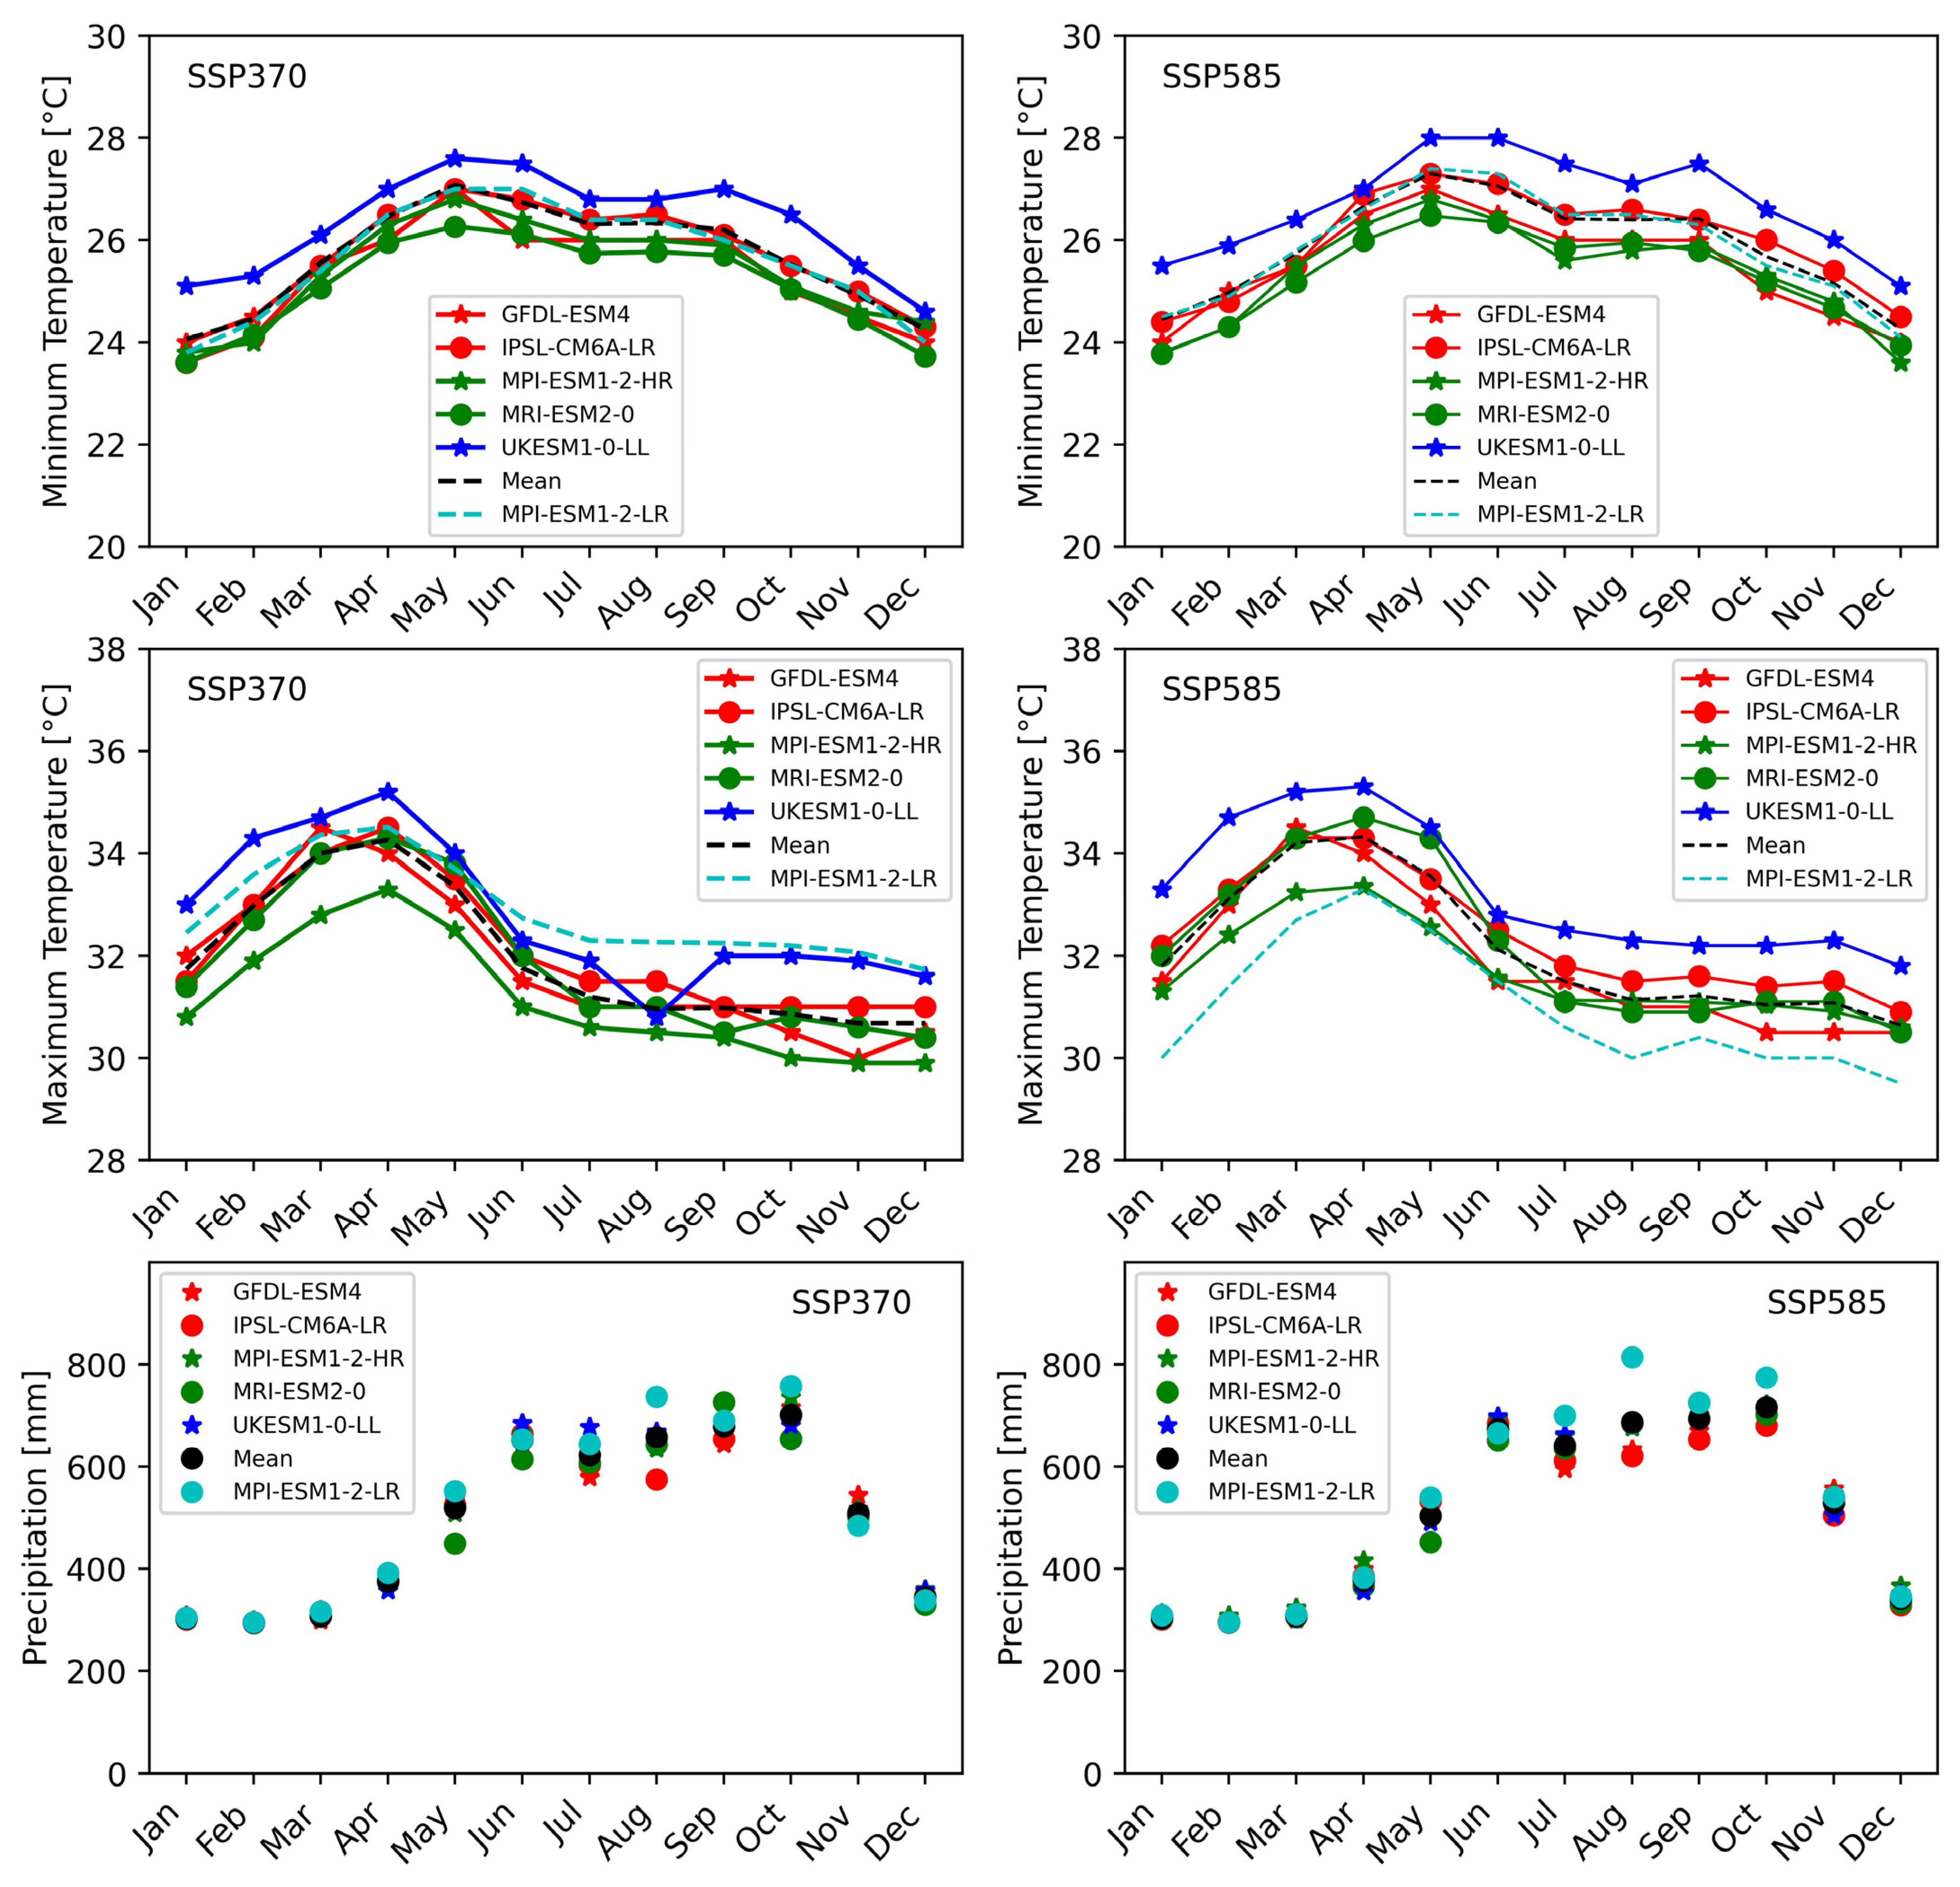
2.3.1. Downscaling CMIP6 Climate Projections Using Statistical Method

CMIP6 downscaled data from the climatologies at high resolution for the earth’s land surface area (CHELSA) project were used in this work. CMIP6 minimum and maximum temperature and precipitation data were derived based on the delta change method [62]. We used the Python package CHELSA-cmip6 v2.1 [63] to download and downscale the CMIP6 data for temperature and precipitation. In the current version (2.1) of CHELSA, only downscaled temperature and precipitation are available; therefore, this package was modified to process relative humidity, wind speed and solar radiation. The delta change function with additive anomaly was used to generate downscaled relative humidity, wind speed and solar radiation at a 1 km resolution. The method initially computes the difference between the coarse resolution CMIP6 data of the historical reference period (1980–2010) and future data; this difference is then interpolated to a 30 arc second resolution using the cubic spline algorithm. Finally, the difference is added to the high-resolution climatologies of the historical reference period, which spans from 1980 to 2010. Based on the GCM comparative studies [60,61] and multi-GCM comparisons for temperature and precipitation, we selected the Max Planck GCM with 10 ensemble realizations to generate average precipitation, maximum and minimum temperature, wind speed, relative humidity and solar radiation for the 2050s and 2100s, respectively, under SSP370 and SSP585 for the Ganges and Mekong Delta (Table 1, Figure 2 and Figure 3, and Figures S1 and S4 in Supplementary Materials). These climate data were then formatted and input into the PyAEZ modeling framework (Section 2.3.2). Global datasets from Worldclim2 [64] reported an average temperature range of 19.3–25.3 °C and annual precipitation of 1900–3000 mm for the VGTB basin in Vietnam, which corresponds to the downscaled temperature and precipitation in the present study.
CMIP6 climate projections for six different GCMs for minimum and maximum temperature and precipitation over the 2050s for SSP370 and SSP585 are presented in Figure 2 and Figure 3 for the Ganges and Mekong Deltas, respectively. The monthly average spatial and temporal distributions, along with the means and ensembles of climate data for the MPI-ESM1-2-LR GCM, are shown in Figures S1 and S2 (Supplementary Materials) for the Ganges Delta and Figures S3 and S4 (Supplementary Materials) for the Mekong Delta over the 2050s and 2100s for SSP370 and SSP585. The mean values of these ensembles for each variable were input into the PyAEZ yield modeling framework; the PyAEZ model has a pre-processing module that calculates daily weather data from monthly weather data. Crop biomass and yield are simulated on a daily time step basis using the daily weather data [55].

2.3.2. PyAEZ-Based Crop Suitability and Yield Mapping

The FAO and International Institute for Applied Systems Analysis (IIASA) developed an agro-ecological zoning (AEZ) framework for land evaluation. The framework captures the changes in agroclimatic resources over time by combining crop simulation models with land management decision analysis [65]. It estimate biomass based on an eco-physiological model developed by the FAO [66,67]. Crop biomass is mainly driven by incoming solar radiation, temperature and crop-specific characteristics. The optimal plating dates are computed automatically which leads to maximum attainable yields for both rainfed and irrigated conditions. The stepwise detail of crop yield estimation is described in Table 2. We adopted the methodology of GAEZ to model crop yield, crop suitability and optimal planting dates for both rainfed and irrigated conditions using the Python-based agro-ecological zoning package (PyAEZ) [55]. The package encapsulates all the complex functions of AEZ and was recently developed and released by the FAO and the Asian Institute of Technology in Thailand [55]. PyAEZ modules, processes, inputs and outputs for estimating yield are presented in Table 2.
According to PyAEZ [1,55], crop yield is classified into five different classes, i.e., (1) not suitable where the yield range is below 20% of the overall maximum yield obtained by Modules 2, 3, 4 and 5 in the PyAEZ model (Table 2); (2) marginally suitable where the yield is between 20% and 40%; (3) moderately suitable where the yield ranges from 40 to 60%; (4) suitable where the yield is 60–80% and (5) very suitable where the yield is greater than 80% of the overall maximum yield.

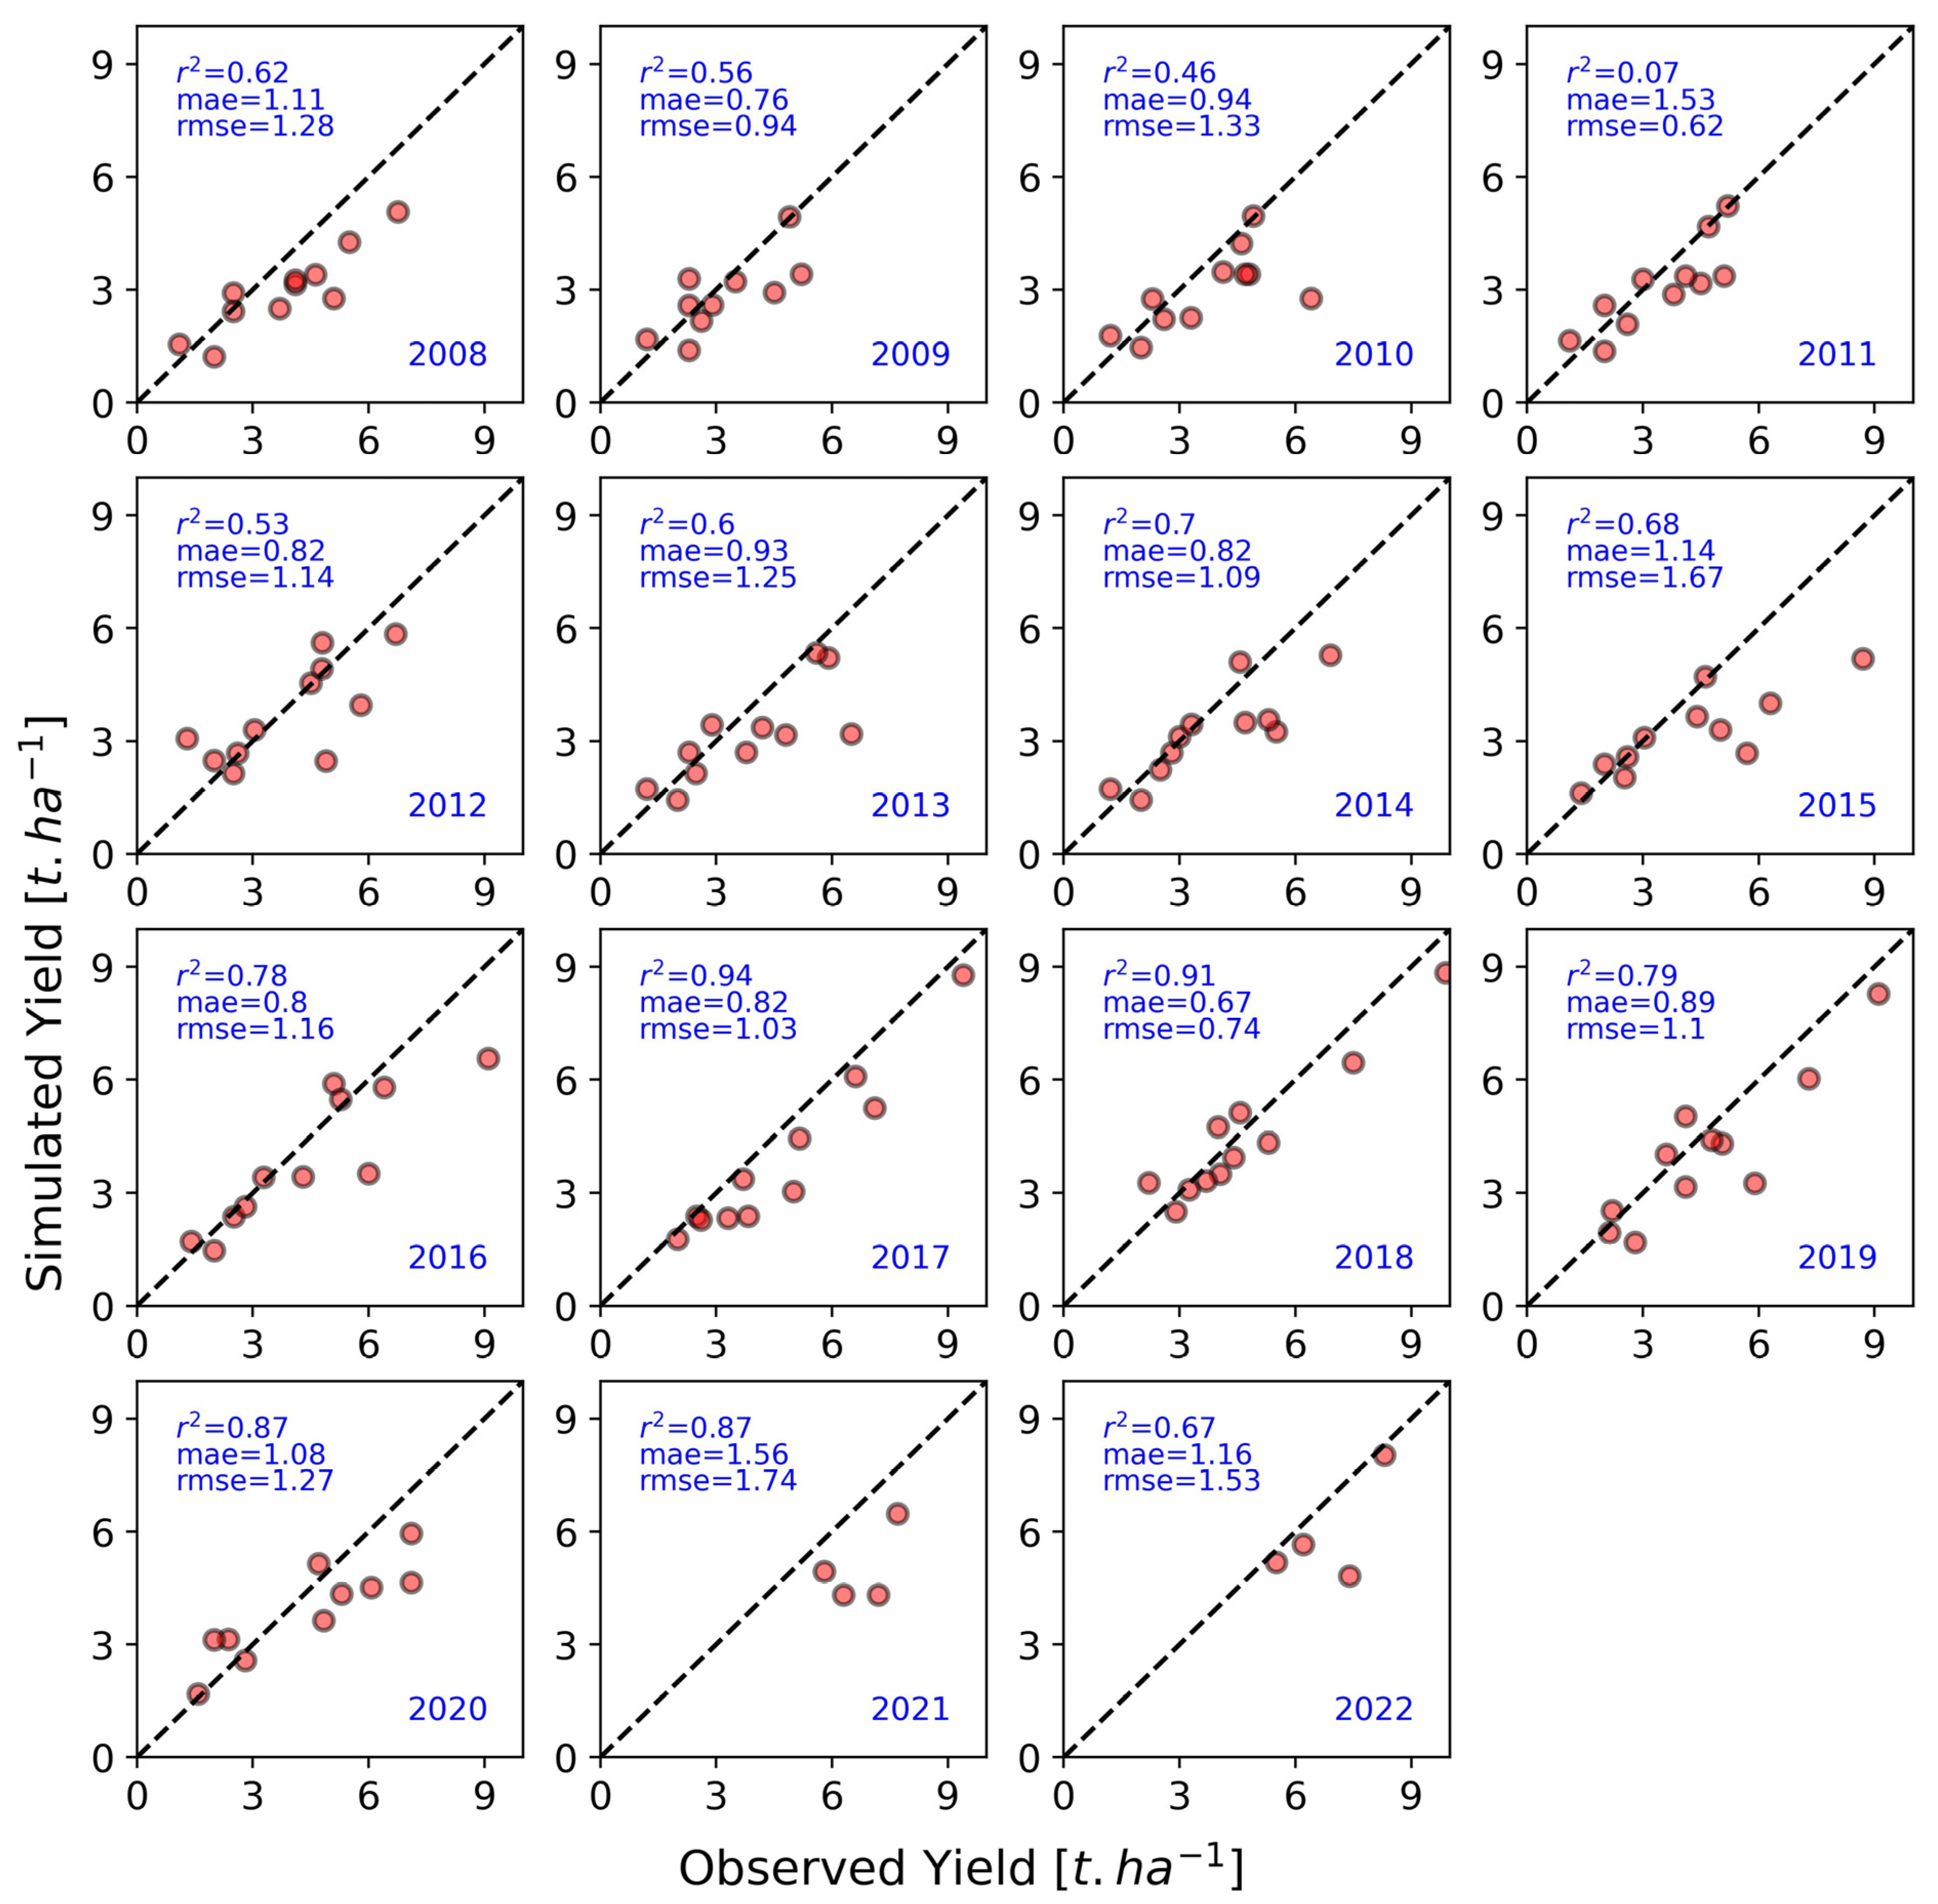
2.3.3. Yield Modeling

The input data from the various sources were downloaded and prepared in the formats and units required by the PyAEZ package. Yield modeling using downscaled CMIP6 projections at a 1 km resolution was computationally intensive. Therefore, for modeling purposes, the CMIP6 projections were resampled to 0.1° before being input into the model. Similarly, SRTM elevation data, HWSD soil data and LULC maps were also downloaded and resampled to 0.1° to meet the requirements of PyAEZ modeling. In the yield modeling process (Table 2, Section 2.3.2), each pixel/grid in the study area was simulated for every 1-day interval of sowing, resulting in 365 simulations to identify the optimal planting date based on the climate, temperature and heat requirements. The optimal planting date is defined as the date that leads to the maximum attainable yield within the cropping season for the targeted areas under rainfed and irrigated conditions. Crop yield estimates under rainfed and irrigated conditions were then generated for the identified optimum sowing date for each pixel. Once the yield map was generated for both rainfed and irrigated conditions, they were aggregated at the administrative units using a shapefile and zonal statistics for validation and representation.

2.4. Validation

We compared our modeled yield under rainfed conditions with the reported yield (available only for rainfed conditions) available at the district/province level based on the following measures: r-squared (R2) [Equation (1)]; root mean square error (RMSE) [Equation (2)]; and mean absolute error (MAE) [Equation (3)]. Provincial-level reported yield data are available from 1995 to 2022 for the Mekong Delta and from 2008 to 2022 for the Ganges Delta.
R 2 = 1 s s r s s t = 1 y i ŷ i 2 y i ȳ 2
R M S E = i = 1 n ŷ i y i 2 n
M A E = 1 n i = 1 n y i ŷ i
where ssr (sum squared regression) is the sum of the residuals (actual-predicted) squared; sst is the sum of the squares of the difference between the data and the mean; yi is the actual value; ŷi is the predicted value; ȳ is the mean value; and n is the number of observations.

3. Results

3.1. Crop Yield Modeling and Suitability Mapping–Ganges Delta

3.1.1. Using Historical Climate Data from AgERA

We modeled yield for a 15-year period using climate data from 2008 to 2022, available from AgERA. Crop yield, optimal planting dates and maize yield suitability were assessed for both rainfed and irrigated conditions. The modeled yield under rainfed conditions was validated against the crop yield statistics at the divisional level in Bangladesh and at the district level in the few districts of the Indian state of West Bengal. Crop yield statistics were available from the same years (2008–2022), allowing for a direct comparison with the modeled yields (Figure 4 and Figure 5). The RMSE of the simulated yield ranged from 0.52 t·ha−1 to 2.13 t·ha−1, which fell within the standard deviation of the observed yield, ranging from 0.27 t·ha−1 to 2.5 t·ha−1 across different years and provinces in the Ganges Delta. These values were comparatively lower in the western part of the delta in the Indian region and slightly higher in the eastern part of the delta in the region of Bangladesh.
Province-wise comparisons of modeled yield and reported yield for the Ganges Delta, India–Bangladesh are presented in Figure 4, while year-wise comparisons are shown in Figure 5. The accuracy of the models was assessed using R2, RMSE and MAE; the accuracy metrics are shown in Figure 4 and Figure 5, where the variation in agreement and error over the modeled years can also be observed. Reported yield data were not available for 2021 and 2022 in the districts of Indian state of West Bengal, resulting in a few missing data points in the 2021 and 2022 subplots of Figure 5, as noted.

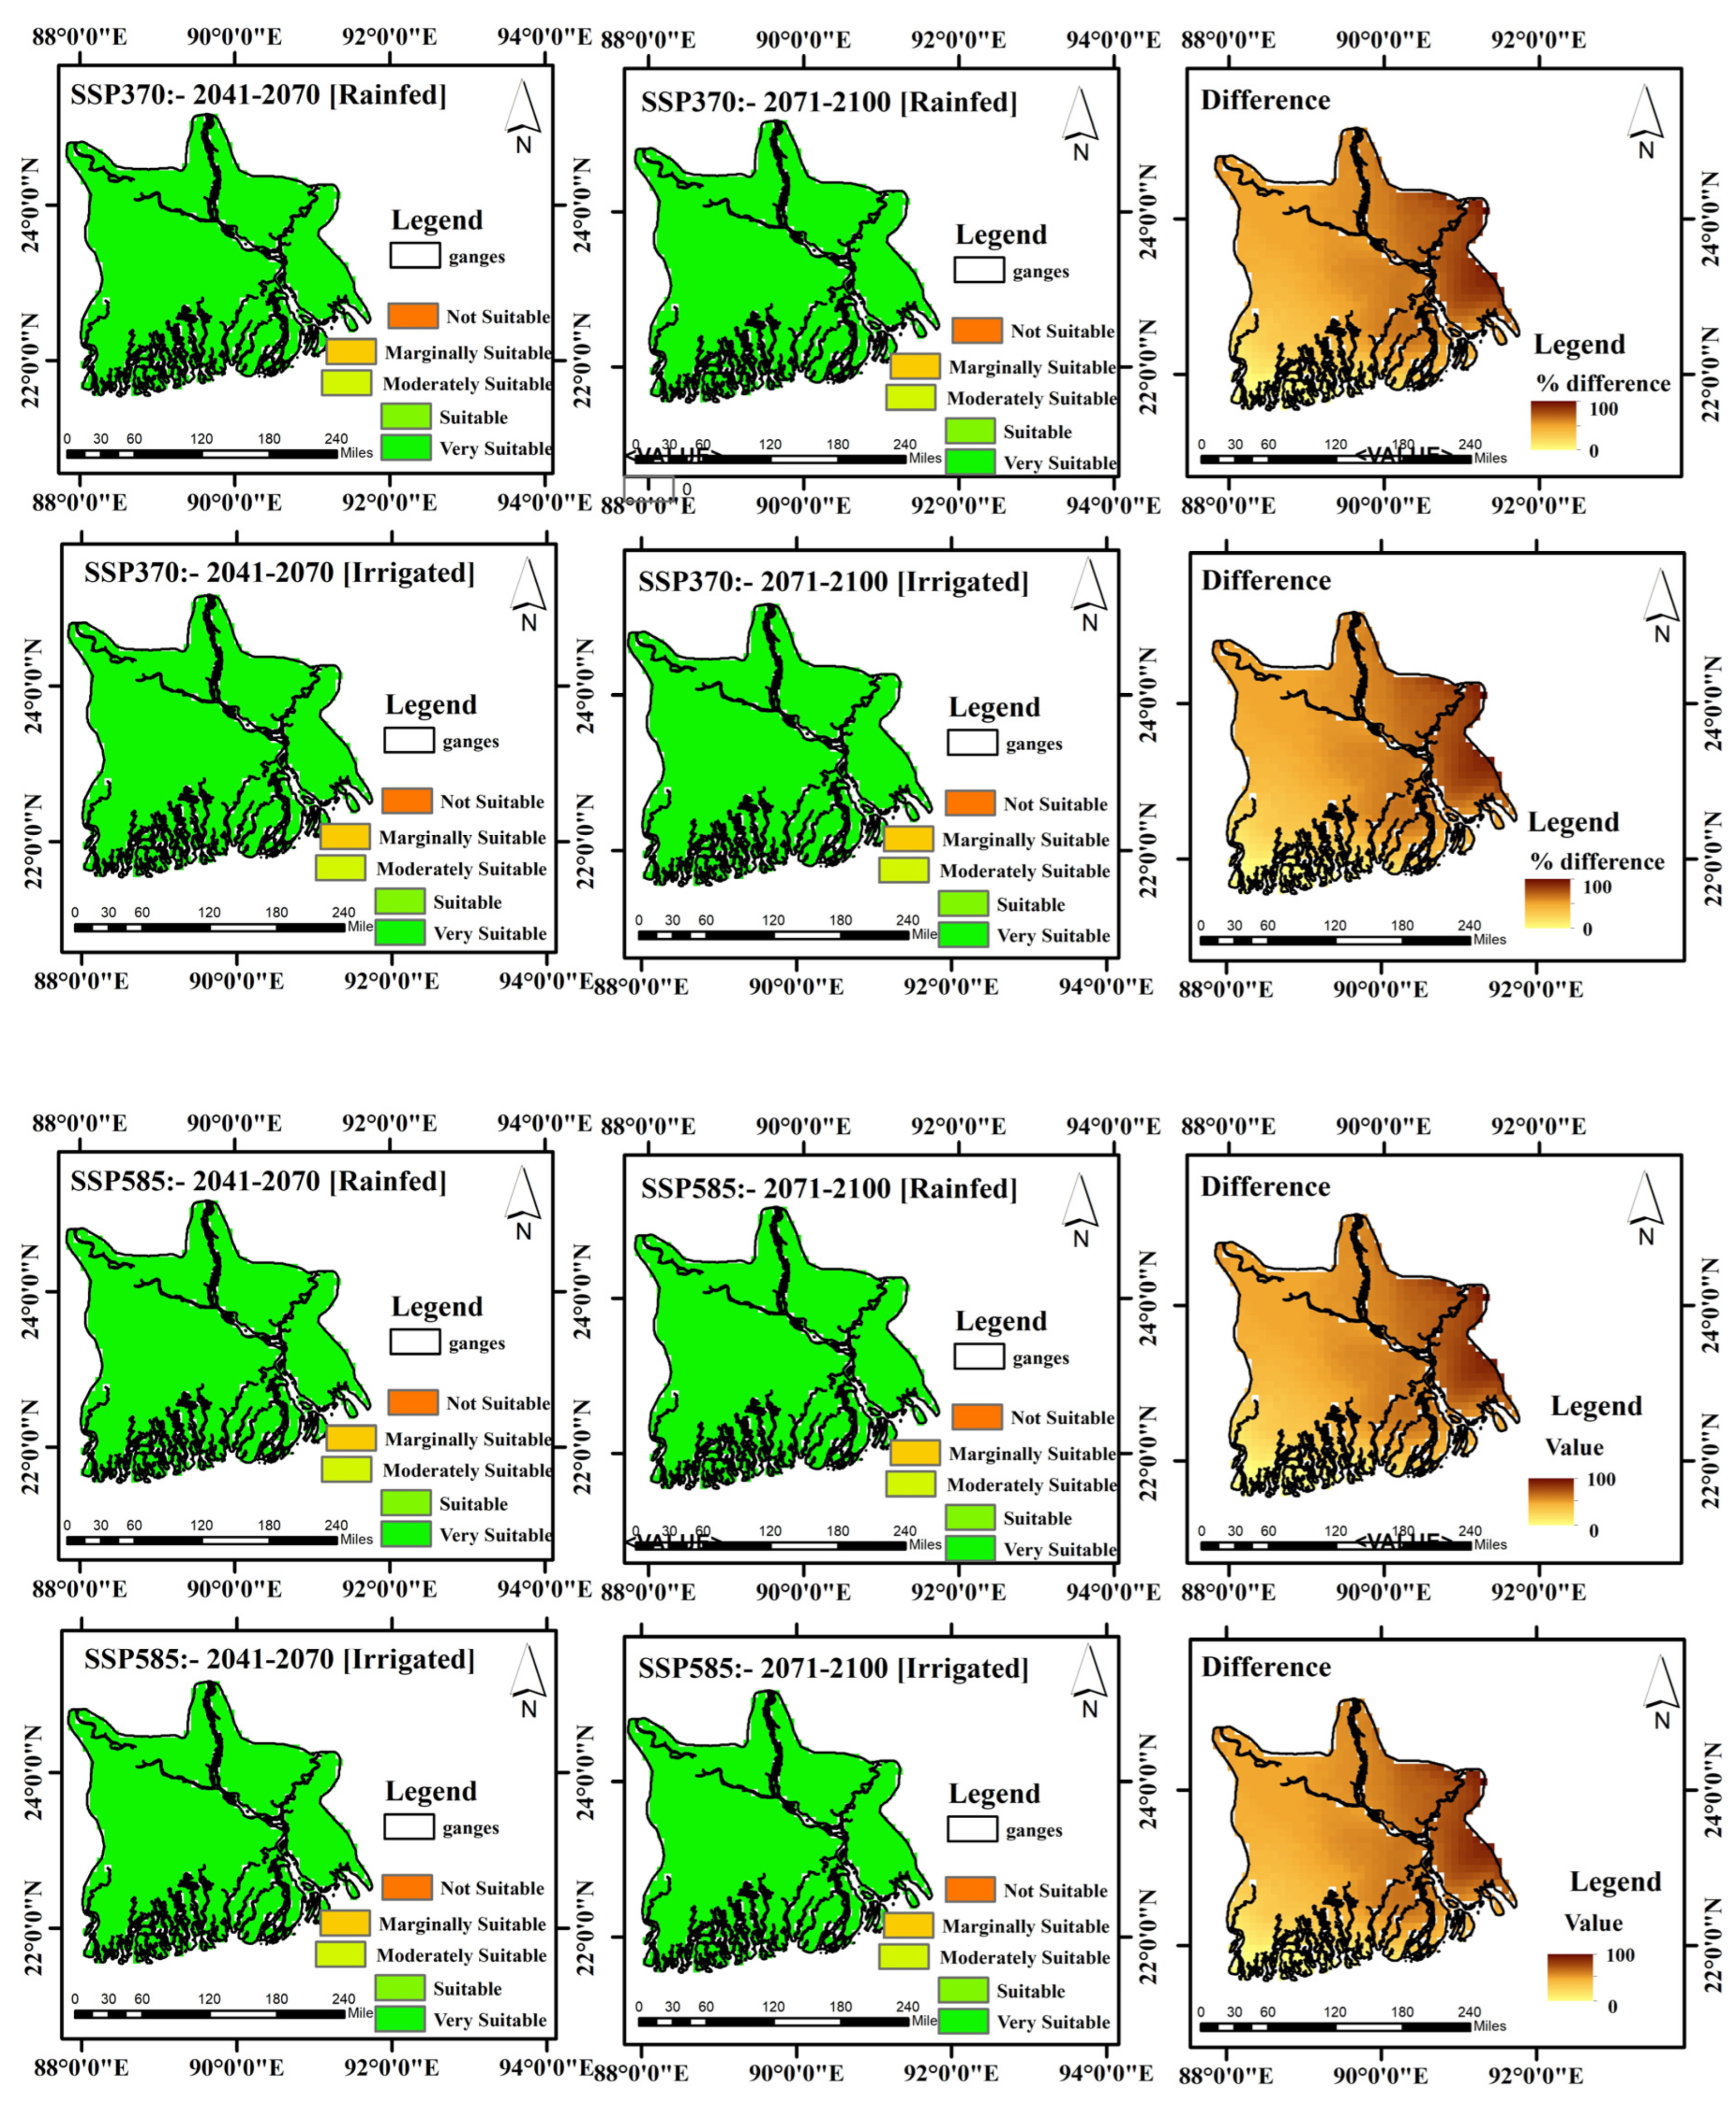
3.1.2. Using CMIP6 Climate Projections

Figure 6 shows the maize crop yield suitability zone maps for the Ganges Delta for the 2050s and 2100s under both SSP370 and SSP585 scenarios under rainfed and irrigated conditions.
From Figure 6, it can be observed that the delta is shown as a very suitable region in both scenarios SSP370 and SSP585 under both the rainfed and irrigated conditions. As mentioned in Section 2.3.2, overall yield is classified into five different categories from not suitable to very suitable depending on the % level of overall yield. The yield range in both the conditions is more than 80% of the overall yield and so lies in the very suitable category. The yield estimated in irrigated conditions is higher than in rainfed conditions and can be observed in the difference image shown as a %.

3.2. Crop Yield Modeling and Suitability Mapping—Mekong Delta

3.2.1. Using Historical Climate Data from AgERA

Maize crop yield was modeled for 28 years using the climate data from 1995 to 2022 available from AgERA. Provincial-level crop yield statistics were obtained from the Government of Vietnam for the period 1995–2022 and were compared with the simulated yield from the model as shown in Figure 7. No statistical data were available for the provinces of Cambodia; hence, validation of the results was not performed for this part of the Mekong. The year-wise agreement between the modeled and reported yields is presented in Figure 8. R2, RMSE and MAE across all the modeled years are shown in Figure 7 and Figure 8. It was observed that the simulated yields had higher accuracies in the initial years, whereas in the later years, the reported yields were mostly higher than simulated, leading to an increase in the RMSE values. The observed yield presented a standard deviation of 0.4 t·ha−1 to 2.2 t·ha−1, while the modeled yield had an RMSE ranging from 0.6 t·ha−1 to 2.2 t·ha−1. This suggests that despite the large RMSE of the projected yields, the simulated values are within the standard deviation of the observed yields, indicating the acceptable capability of the model to simulate the range of variability of maize yield across different years and provinces in the Mekong Delta.

3.2.2. Using CMIP6 Climate Projections

Maize crop yield suitability maps for the Mekong Delta for the 2050s and 2100s for both SSP370 and SSP585 under rainfed and irrigated conditions are presented in Figure 9. The yield range is more than 80% of the overall yield and so all the pixels are shown under the very suitable category in Figure 9. The percentage difference image is computed from the 2050s and 2100s period yield data.

4. Discussion

4.1. Downscaling CMIP6 Climate Projections

In the present work, six climate variables were used for yield suitability mapping.
Temperature and precipitation data were downloaded directly from Earth System Grid Federation (ESGF) services at Swiss Federal Institute for Forest, Snow and Landscape Research. This downscaling is based on the delta change method [63]. CHELSA datasets have been widely adopted for impact studies and validated against available gridded datasets and station data. The accuracy for temperature is similar to the other gridded products, while for precipitation, these products predict better patterns [62]. We have extended the CHELSA algorithm to downscale CMIP6 projections for relative humidity, wind speed and solar radiation. Ref. [68] performed statistical downscaling of precipitation using multi-GCMs over Cambodia, showing a good correlation between the downscaled products and observations for all the GCMs. The highest correlation of 0.76 was found with MPI-ESM1-2-LR, identified as the best at approximating variables in this work for the downscaling process. Similarly, [69] was a study involving 19 different GCMs for downscaling precipitation over the Mekong Delta region for SSP126, SSP245, SSP370 and SSP585. The results indicated that the climate projections of precipitation is expected to increase across the entire basin, with the lowest rate of increase in SSP126, higher rates in SSP245 and SSP370, and the highest rate in SSP585. These findings were illustrated in the spatial and temporal distribution of climate variables in Can Tho province, Vietnam (Figures S3 and S4, Supplementary Materials). A comparative study [70] evaluated 24 GCMs for four emission scenarios to assess changes in the climatic extremes over Vietnam, suggesting a potential increase in flood risk across Vietnam. Ref. [71] explored the use of CMIP6 data for studying the effects of climate change in the inland and coastal regions of the Ganges Delta and concluded that there will be a greater rise in climate extremes in the far future compared to the near future; inland areas will be more susceptible to drought, while coastal areas will be more susceptible to flooding. This is consistent with the spatial–temporal distribution of climate variables for the inland region of Dhaka simulated in this study (Figures S1 and S2 Supplementary Materials) [71].
Statistical downscaling is widely adopted over dynamical downscaling for several reasons, including initialization of parameters, computational requirements and the associated complexities with the dynamical models, operational use among others [62,63,64,72,73]. Ref. [64]’s statistical downscaling of temperature, precipitation, wind speed and relative humidity from 18 different GCMs, at a resolution of 0.25°, was reported with a correlation higher than 0.98 when compared to the reference dataset for validation. This correlation was particularly strong for relative humidity, wind speed, average temperature and minimum temperature, while a slightly lower correlation coefficient of 0.95 was observed for maximum temperature and precipitation. In addition to the high correlation, the average bias and RMSE were low for these variables, confirming that the method was capable of reproducing bias from GCMs and reproducing extreme events. CHELSA-cmip6 1.0 [73], Python-based library, was developed for downscaling the CMIP6 projections for any specific location and period for temperature, precipitation and bioclimatic variables using the delta change method. Although it may not always be feasible, the delta change method is resistant to inherent model bias and is predicted on the idea that in the future, the high-resolution patterns observed in the high-resolution reference climatologies will remain comparable [72].
In the present study, the statistical downscaling was performed at 1 km, but due to the computational constraints the downscaled weather variables were resampled to 0.1° for the yield modeling. The resampled weather data at 0.1° do not have variability in the study sites (Supplementary Materials) which are a small delta region. The yield modeling is highly sensitive to the weather data and so in the region our results do not have high variability in crop yield. The downscaling performed and implemented in the crop modeling at a higher resolution would yield improved results.

4.2. Crop Yield Modeling and Suitability Mapping, Ganges Delta, India–Bangladesh

The yield for the Ganges Delta was modeled for 15 years from 2008 to 2022 and validated against the reported yield data at the province level (Figure 4 and Figure 5). As shown in Figure 4, there is a steep increase in the reported yield in the Bangladeshi provinces of the Ganges Delta, unlike the districts in the West Bengal state of India. The increase may be attributed to the management conditions such as the adoption of improved or high-yielding varieties, some mechanization and the application of nutrients/fertilizers, chemical pest disease and weed control. The model may not accurately capture these changes, despite incorporating a management component that can be set to low, intermediate or high levels depending on the ground and management conditions. Even when the model was set to the high management option in this study, it could not accurately capture the increasing trend or the high yielding values. The management module requires thorough investigation and potential improvement. The maize yield estimates during all the years investigated show better agreement in the western part of the Ganges Delta, which lies in the Indian state of West Bengal, compared to the eastern part of the delta, which falls in Bangladesh (Figure 4 and Figure 5). The modeled yield is comparatively higher on the eastern side of the delta in the Bangladeshi region; however, the southern parts of the delta are more prone to the flooding. Bangladesh has two main seasons for maize: dry, starting from February, and wet, starting in July–August. [74] With wide variability, maize yield ranges from 6 to 7 t·ha−1 in the dry season and 4.5–6 t·ha−1 in the wet season. Considering the 50th percentile of yield distribution in Bangladesh, these ranges are in agreement to the yield estimated in our work, although in some cases much higher yield was reported. Similar findings were also reported by [75,76,77] where the impact of climate change on maize yield in eastern India was evaluated using different RCP scenarios. These studies found that under high CO2 levels, the maximum temperature has a greater impact on maize yield than the minimum temperature. The projected yield was found to decrease by 10–30% under irrigated conditions and by 10–20% under rainfed conditions. These reductions are comparatively higher than those found in the present study; although it should be noted that baseline data for yield comparison in these studies were from 1982 to 2012 [77]. Maize yield was predicted using the statistical modeling method of random forests, which reported an RMSE of 0.9 t·ha−1 in two districts of West Bengal. This is similar to the RMSE found in this work, where the RMSE ranged from 0.62 to 1.74 t·ha−1. It is noteworthy that the study was performed on a small-scale agriculture farm with comparatively fewer uncertainties in the inputs.
The yield estimated using the downscaled CMIP6 data shows a decrease of 40–70% from the average yield for the period 2008–2022 under both SSP370 and SSP585 scenarios. This decline is comparatively higher than the globally projected future crop yield reductions of about 30–40%, and in some cases, more than 60% [78]. Some factors contribute to the larger differences in the present study, including the availability of yield data at the province level for comparison, and the use of various data sources input in the model (including the latest available LULC maps, soil and elevation data) that present inherent uncertainties which spread and add to the uncertainties in the modeled yield. The mean optimum temperature for obtaining higher maize yield is between 20 and 22 °C during the growing season [79]; with increasing temperatures, maize yields could be reduced by 3–13% [80]. As indicated by the CMIP6 projections of temperature and precipitation, there is an expected increase in temperature and the frequency of precipitation, which is a potential reason for the reduction in yields. The yield for the Ganges Delta modeled using historical climate data from AgERA has a standard deviation of 0.52–2.13 t·ha−1 across different years and districts/divisions. A similar range of uncertainty can be expected in the yield suitability modeling for the 2050s and 2100s using CMIP6 climate projections, as reported in this study. The limitation of the study is that the validation of the mean value of the modeled yield at the province level was compared to the only available reported yield at the province level. Also, the modeling was performed at a coarse resolution of 0.1°. More data collection on the ground, incorporating other sources of data, using improved resolution data and integrating remote sensing satellite data would improve the yield modeling results.

4.3. Crop Yield Modeling and Suitability Mapping, Mekong Delta, Vietnam–Cambodia

The Mekong Delta encompasses regions of Vietnam and Cambodia. Model simulations were performed from 1995 to 2022 for the Mekong Delta. Yield statistics were obtained for 13 provinces in Vietnam, showing that the modeled yield is in good agreement with the reported yields in some of the provinces; however, in provinces such as An Giang, Kien Giang and Dong Thap, the increasing trend of the yield were not captured efficiently in later years. We used all three management condition scenarios—low, intermediate and high—in the model to capture the increasing trend of the reported yield. The results under high management conditions closely approximated the reported yield. The modeled yield does not exhibit a wide range (2–7 t·ha−1) compared to the reported yield [1–8 t·ha−1] (Figure 8). This limited range can be attributed to the small spatial extent of the region, which has nearly uniform climatic variables at a resolution of 0.1°, crucial for estimating crop yield. From Figure 9, it can be observed that the entire delta is classified as a very suitable region in both the 2050s and 2100s under SSP370 and SSP585. A similar pattern is observed under irrigated conditions. Although suitable zones remain relatively unchanged, there is a decrease in yield potential over the periods as observed in the difference image. [81] The EPIC model evaluated over the cropping systems in Cambodia concluded that the model successfully replicated crop yield for multiple crops, including maize, with R2 ranging from 0.6 to 0.8, which is similar to those found in this study. Multiple precipitation datasets were evaluated for maize yield estimation in Vietnam; findings reported that VnGP and CHIRPS produced good estimates of maize yield with RMSE ranging from 0.5 to 1 t·ha−1. This is somewhat higher on the upper end (0.45–1.76 t·ha−1) than what was found in this study [82]. The effect of climate change from the current period to the 2050s and 2100s suggests that although regions remain suitable for maize yield, the yield potential is decreased over time in the Mekong Delta (Figure 9). The standard deviation in yield modeling for the Mekong Delta was quantified within the range of 1–3 t·ha−1 over the different years and provinces; a similar trend can be expected in yield projections using CMIP6 data for the 2050s and 2100s. Maize crop yield and yield suitability estimates in this work are based on the GAEZ modeling approach which requires multiple inputs such as soil properties at the spatial level, land-use/land-cover maps, elevation data, and climate data from AgERA and CMIP6 climatic projections, as well as validation data available at a coarse resolution. However, challenges remain in dealing with the mentioned sources of uncertainty and the validation of results. The yield estimates of the future could be more reliable by incorporating the improved resolution of the various input data sources, thereby addressing the inherent uncertainties in the various input data sources and downscaling the CMIP6 datasets before performing yield modeling. Also, cloud-based data processing can be explored for performing regional-level yield modeling.

5. Conclusions

This work focused on maize yield suitability mapping for two major AMDs: the Ganges, India–Bangladesh and the Mekong, Vietnam–Cambodia. To test the modeling approach and framework, we initially used historical climate data from AgERA reanalysis to model yield. These modeled yields were validated against the available years of reported provincial-level yield data from the respective countries. Furthermore, the modeling approach was implemented using downscaled CMIP6 climate projections. The work demonstrates the potential of the modeling approach for identifying crop yield suitability zones within the variability range of maize yield in the study regions.

Supplementary Materials

The following supporting information can be downloaded at: https://www.mdpi.com/article/10.3390/agronomy15040878/s1, Figure S1: The spatial distribution of downscaled CMIP6 data for minimum and maximum temperature, precipitation, relative humidity, wind speed and solar radiation for SSP370 and SSP585, 2050s and 2100s in the Ganges Delta; Figure S2: The temporal distribution of downscaled CMIP6 data for minimum and maximum temperature, precipitation, relative humidity, wind speed and solar radiation for SSP370 and SSP585, 2050s and 2100s in the Ganges Delta with mean and ensembles; Figure S3: The spatial distribution of downscaled CMIP6 data for minimum and maximum temperature, precipitation, relative humidity, wind speed and solar radiation for SSP370 and SSP585, 2050s and 2100s in the Mekong Delta; and Figure S4: The temporal distribution of downscaled CMIP6 data for minimum and maximum temperature, precipitation, relative humidity, wind speed and solar radiation for SSP370 and SSP585, 2050s and 2100s in the Mekong Delta with mean and ensembles.

Author Contributions

Conceptualization, D.C.U., K.M.N., A.M.R. and A.L.; methodology, D.C.U., K.M.N., A.M.R. and A.L.; software, D.C.U.; validation, D.C.U. and K.M.N.; formal analysis, D.C.U., L.V. and J.R.; investigation, D.C.U., L.V. and J.R.; resources, D.C.U., L.V. and J.R.; data curation, D.C.U.; writing—original draft preparation, D.C.U. and A.M.R.; writing—review and editing, D.C.U., A.M.R., K.M.N., J.R. and L.V.; visualization, D.C.U.; supervision, A.M.R. and A.L.; project administration, K.M.N., A.M.R. and A.L.; funding acquisition, K.M.N. and A.L. All authors have read and agreed to the published version of the manuscript.

Funding

This research was funded by CGIAR initiatives on Asian Mega-Deltas (AMD), grant number “8R-000-15565” and the APC was funded by “8R-000-15565”.

Data Availability Statement

The crop yield data for India are publicly available from the Department of Agriculture website (https://aps.dac.gov.in/Home.aspx?ReturnUrl=%2f, accessed on 10 March 2025), for Bangladesh from the Bangladesh Bureau of Statistics (https://bbs.gov.bd/site/page/3e838eb6-30a2-4709-be85-57340484b0c16c6/-, accessed on 10 March 2025) and for Vietnam from the Government of Vietnam (https://www.gso.gov.vn/en/agriculture-forestry-and-fishery/, accessed on 10 March 2025).

Acknowledgments

We thank the FAO and AIT team for making the PyAEZ Python package available publicly for crop yield suitability modeling. We thank Dirk Karger for the public availability of the Python package CHELSA ver2.1 for statistical downscaling of CMIP6 datasets. We thank Anton Urfels at IRRI for his suggestions on CMIP6 data downscaling. We thank the Department of Agriculture and Cooperation, India; the Government of Vietnam; the RUA Cambodia and the Bangladesh Bureau of Statistics for providing the yield statistics for validation.

Conflicts of Interest

The authors declare no conflicts of interest.

Abbreviations

The following abbreviations are used in this manuscript:
AgERAEuropean Centre for Medium-Range Weather Forecast Reanalysis for Agriculture
AMDAsian Mega-Delta
AEZAgro-ecological Zones
CHELSAClimatologies at high resolution for the earth’s land and surface area
CMIP6Coupled Model Intercomparison Phase 6
ESGFEarth System Grid Federation
FAOFood and Agriculture Organization
GAEZGlobal Agro-ecological Zone
GCMGlobal Circulation Model
GISGeographic Information System
HWSDHarmonized World Soil Database
IPCCIntergovernmental Panel on Climate Change
LULCLand-use land-cover
MCDAMulti-Criteria Decision Analysis
PyAEZPython-based Agro-ecological Zoning framework
SSPSocioeconomic Pathway
SRTMShuttle Radar Topography Mission

References

  1. Fischer, G.; Nachtergaele, F.O.; Van Velthuizen, H.; Chiozza, F.; Francheschini, G.; Henry, M.; Muchoney, D.; Tramberend, S. Global Agro-Ecological Zones (Gaez v4)-Model Documentation; Food and Agriculture Organization: Rome, Italy, 2021. [Google Scholar]
  2. Schneider, P.; Asch, F. Rice Production and Food Security in Asian Mega Deltas—A Review on Characteristics, Vulnerabilities and Agricultural Adaptation Options to Cope with Climate Change. J. Agron. Crop Sci. 2020, 206, 491–503. [Google Scholar] [CrossRef]
  3. Asseng, S.; Ewert, F.; Martre, P.; Rötter, R.P.; Lobell, D.B.; Cammarano, D.; Kimball, B.A.; Ottman, M.J.; Wall, G.W.; White, J.W. Rising Temperatures Reduce Global Wheat Production. Nat. Clim. Change 2015, 5, 143–147. [Google Scholar] [CrossRef]
  4. Lesk, C.; Coffel, E.; Winter, J.; Ray, D.; Zscheischler, J.; Seneviratne, S.I.; Horton, R. Stronger Temperature–Moisture Couplings Exacerbate the Impact of Climate Warming on Global Crop Yields. Nat. Food 2021, 2, 683–691. [Google Scholar] [CrossRef] [PubMed]
  5. Ortiz-Bobea, A.; Ault, T.R.; Carrillo, C.M.; Chambers, R.G.; Lobell, D.B. Anthropogenic Climate Change Has Slowed Global Agricultural Productivity Growth. Nat. Clim. Change 2021, 11, 306–312. [Google Scholar] [CrossRef]
  6. Arias, P.; Bellouin, N.; Coppola, E.; Jones, R.; Krinner, G.; Marotzke, J.; Naik, V.; Palmer, M.; Plattner, G.-K.; Rogelj, J. Climate Change 2021: The Physical Science Basis; Contribution of Working Group I to the Sixth Assessment Report of the Intergovernmental Panel on Climate Change; Technical Summary; IPCC: Geneva, Switzerland, 2021. [Google Scholar]
  7. Jägermeyr, J.; Müller, C.; Ruane, A.C.; Elliott, J.; Balkovic, J.; Castillo, O.; Faye, B.; Foster, I.; Folberth, C.; Franke, J.A. Climate Impacts on Global Agriculture Emerge Earlier in New Generation of Climate and Crop Models. Nat. Food 2021, 2, 873–885. [Google Scholar] [CrossRef]
  8. Asseng, S.; Martre, P.; Maiorano, A.; Rötter, R.P.; O’Leary, G.J.; Fitzgerald, G.J.; Girousse, C.; Motzo, R.; Giunta, F.; Babar, M.A. Climate Change Impact and Adaptation for Wheat Protein. Glob. Change Biol. 2019, 25, 155–173. [Google Scholar] [CrossRef]
  9. Challinor, A.J.; Watson, J.; Lobell, D.B.; Howden, S.M.; Smith, D.R.; Chhetri, N. A Meta-Analysis of Crop Yield under Climate Change and Adaptation. Nat. Clim. Change 2014, 4, 287–291. [Google Scholar] [CrossRef]
  10. Lobell, D.B.; Burke, M.B.; Tebaldi, C.; Mastrandrea, M.D.; Falcon, W.P.; Naylor, R.L. Prioritizing Climate Change Adaptation Needs for Food Security in 2030. Science 2008, 319, 607–610. [Google Scholar] [CrossRef]
  11. Rising, J.; Devineni, N. Crop Switching Reduces Agricultural Losses from Climate Change in the United States by Half under RCP 8.5. Nat. Commun. 2020, 11, 4991. [Google Scholar] [CrossRef]
  12. Hammer, G.L.; McLean, G.; Chapman, S.; Zheng, B.; Doherty, A.; Harrison, M.T.; van Oosterom, E.; Jordan, D. Crop Design for Specific Adaptation in Variable Dryland Production Environments. Crop Pasture Sci. 2014, 65, 614–626. [Google Scholar] [CrossRef]
  13. Peng, B.; Guan, K.; Tang, J.; Ainsworth, E.A.; Asseng, S.; Bernacchi, C.J.; Cooper, M.; Delucia, E.H.; Elliott, J.W.; Ewert, F. Towards a Multiscale Crop Modelling Framework for Climate Change Adaptation Assessment. Nat. Plants 2020, 6, 338–348. [Google Scholar] [CrossRef]
  14. Jiang, R.; He, W.; He, L.; Yang, J.Y.; Qian, B.; Zhou, W.; He, P. Modelling Adaptation Strategies to Reduce Adverse Impacts of Climate Change on Maize Cropping System in Northeast China. Sci. Rep. 2021, 11, 810. [Google Scholar] [CrossRef] [PubMed]
  15. Zhang, Y.; Zhao, Y.; Sun, Q. Increasing Maize Yields in Northeast China Are More Closely Associated with Changes in Crop Timing than with Climate Warming. Environ. Res. Lett. 2021, 16, 054052. [Google Scholar] [CrossRef]
  16. Moeletsi, M.E.; Walker, S. Agroclimatological Suitability Mapping for Dryland Maize Production in Lesotho. Theor. Appl. Climatol. 2013, 114, 227–236. [Google Scholar] [CrossRef]
  17. Ben-Ari, T.; Adrian, J.; Klein, T.; Calanca, P.; Van der Velde, M.; Makowski, D. Identifying Indicators for Extreme Wheat and Maize Yield Losses. Agric. For. Meteorol. 2016, 220, 130–140. [Google Scholar] [CrossRef]
  18. Reidsma, P.; Ewert, F.; Oude Lansink, A.; Leemans, R. Vulnerability and Adaptation of European Farmers: A Multi-Level Analysis of Yield and Income Responses to Climate Variability. Reg. Environ. Change 2009, 9, 25. [Google Scholar] [CrossRef]
  19. Bolton, D.K.; Friedl, M.A. Forecasting Crop Yield Using Remotely Sensed Vegetation Indices and Crop Phenology Metrics. Agric. For. Meteorol. 2013, 173, 74–84. [Google Scholar] [CrossRef]
  20. Dhami, J.; Roy, S.; Nain, A.S.; Panwar, R. Suitability Analysis of Apple and Pear Using Remote Sensing and GIS in Uttarakhand. J. Agrometeorol. 2012, 14, 464–474. [Google Scholar]
  21. Mendas, A.; Delali, A. Integration of MultiCriteria Decision Analysis in GIS to Develop Land Suitability for Agriculture: Application to Durum Wheat Cultivation in the Region of Mleta in Algeria. Comput. Electron. Agric. 2012, 83, 117–126. [Google Scholar] [CrossRef]
  22. Zolekar, R.B.; Bhagat, V.S. Multi-Criteria Land Suitability Analysis for Agriculture in Hilly Zone: Remote Sensing and GIS Approach. Comput. Electron. Agric. 2015, 118, 300–321. [Google Scholar] [CrossRef]
  23. Rodcha, R.; Tripathi, N.K.; Prasad Shrestha, R. Comparison of Cash Crop Suitability Assessment Using Parametric, AHP, and FAHP Methods. Land 2019, 8, 79. [Google Scholar] [CrossRef]
  24. Jain, R.; Chand, P.; Rao, S.C.; Agarwal, P. Crop and Soil Suitability Analysis Using Multi-Criteria Decision Making in Drought-Prone Semi-Arid Tropics in India. J. Soil. Water Conserv. 2020, 19, 271–283. [Google Scholar] [CrossRef]
  25. Chavez, M.D.; Berentsen, P.B.; Lansink, A.O. Assessment of Criteria and Farming Activities for Tobacco Diversification Using the Analytical Hierarchical Process (AHP) Technique. Agric. Syst. 2012, 111, 53–62. [Google Scholar] [CrossRef]
  26. Yalew, S.G.; Van Griensven, A.; van der Zaag, P. AgriSuit: A Web-Based GIS-MCDA Framework for Agricultural Land Suitability Assessment. Comput. Electron. Agric. 2016, 128, 1–8. [Google Scholar] [CrossRef]
  27. Ranjan, R.; Nain, A.; Jha, A. Assessment of Land Suitability Potentials of Willow for Enhancing Green Cover under Wastelands of Haryana Using Geospatial Technology. J. Agrometeorol. 2018, 20, 44–48. [Google Scholar]
  28. Akıncı, H.; Özalp, A.Y.; Turgut, B. Agricultural Land Use Suitability Analysis Using GIS and AHP Technique. Comput. Electron. Agric. 2013, 97, 71–82. [Google Scholar] [CrossRef]
  29. Houshyar, E.; SheikhDavoodi, M.J.; Almassi, M.; Bahrami, H.; Azadi, H.; Omidi, M.; Sayyad, G.; Witlox, F. Silage Corn Production in Conventional and Conservation Tillage Systems. Part I: Sustainability Analysis Using Combination of GIS/AHP and Multi-Fuzzy Modeling. Ecol. Indic. 2014, 39, 102–114. [Google Scholar] [CrossRef]
  30. Romano, G.; Dal Sasso, P.; Liuzzi, G.T.; Gentile, F. Multi-Criteria Decision Analysis for Land Suitability Mapping in a Rural Area of Southern Italy. Land Use Policy 2015, 48, 131–143. [Google Scholar] [CrossRef]
  31. Chivasaa, W.; Mutanga, O.; Biradarc, C. Mapping Land Suitability for Maize (Zea mays L.) Production Using GIS and AHP Technique in Zimbabwe. S. Afr. J. Geomat. 2019, 8, 265–281. [Google Scholar] [CrossRef]
  32. Ramamurthy, V.; Reddy, G.O.; Kumar, N. Assessment of Land Suitability for Maize (Zea mays L.) in Semi-Arid Ecosystem of Southern India Using Integrated AHP and GIS Approach. Comput. Electron. Agric. 2020, 179, 105806. [Google Scholar] [CrossRef]
  33. Dorigo, W.A.; Zurita-Milla, R.; de Wit, A.J.; Brazile, J.; Singh, R.; Schaepman, M.E. A Review on Reflective Remote Sensing and Data Assimilation Techniques for Enhanced Agroecosystem Modeling. Int. J. Appl. Earth Obs. Geoinf. 2007, 9, 165–193. [Google Scholar] [CrossRef]
  34. Doraiswamy, P.C.; Moulin, S.; Cook, P.W.; Stern, A. Crop Yield Assessment from Remote Sensing. Photogramm. Eng. Remote Sens. 2003, 69, 665–674. [Google Scholar] [CrossRef]
  35. Haun, J.R. Prediction of Spring Wheat Yields from Temperature and Precipitation Data 1. Agron. J. 1974, 66, 405–409. [Google Scholar] [CrossRef]
  36. Moulin, S.; Bondeau, A.; Delecolle, R. Combining Agricultural Crop Models and Satellite Observations: From Field to Regional Scales. Int. J. Remote Sens. 1998, 19, 1021–1036. [Google Scholar] [CrossRef]
  37. Xin, Q.; Gong, P.; Yu, C.; Yu, L.; Broich, M.; Suyker, A.E.; Myneni, R.B. A Production Efficiency Model-Based Method for Satellite Estimates of Corn and Soybean Yields in the Midwestern US. Remote Sens. 2013, 5, 5926–5943. [Google Scholar] [CrossRef]
  38. Lobell, D.B.; Asner, G.P.; Ortiz-Monasterio, J.I.; Benning, T.L. Remote Sensing of Regional Crop Production in the Yaqui Valley, Mexico: Estimates and Uncertainties. Agric. Ecosyst. Environ. 2003, 94, 205–220. [Google Scholar] [CrossRef]
  39. Thorp, K.; Wang, G.; West, A.; Moran, M.; Bronson, K.; White, J.; Mon, J. Estimating Crop Biophysical Properties from Remote Sensing Data by Inverting Linked Radiative Transfer and Ecophysiological Models. Remote Sens. Environ. 2012, 124, 224–233. [Google Scholar] [CrossRef]
  40. Johnson, D.M. An Assessment of Pre-and within-Season Remotely Sensed Variables for Forecasting Corn and Soybean Yields in the United States. Remote Sens. Environ. 2014, 141, 116–128. [Google Scholar] [CrossRef]
  41. Kogan, F.; Kussul, N.; Adamenko, T.; Skakun, S.; Kravchenko, O.; Kryvobok, O.; Shelestov, A.; Kolotii, A.; Kussul, O.; Lavrenyuk, A. Winter Wheat Yield Forecasting in Ukraine Based on Earth Observation, Meteorologicaldata and Biophysical Models. Int. J. Appl. Earth Obs. Geoinf. 2013, 23, 192–203. [Google Scholar] [CrossRef]
  42. Sakamoto, T.; Gitelson, A.A.; Arkebauer, T.J. MODIS-Based Corn Grain Yield Estimation Model Incorporating Crop Phenology Information. Remote Sens. Environ. 2013, 131, 215–231. [Google Scholar] [CrossRef]
  43. Sibley, A.M.; Grassini, P.; Thomas, N.E.; Cassman, K.G. Testing Remote Sensing Approaches for Assessing Yield Variability among Maize Fields. Agron. J. 2014, 106, 24–32. [Google Scholar] [CrossRef]
  44. Franch, B.; Vermote, E.F.; Becker-Reshef, I.; Claverie, M.; Huang, J.; Zhang, J.; Justice, C.; Sobrino, J.A. Improving the Timeliness of Winter Wheat Production Forecast in the United States of America, Ukraine and China Using MODIS Data and NCAR Growing Degree Day Information. Remote Sens. Environ. 2015, 161, 131–148. [Google Scholar] [CrossRef]
  45. Azzari, G.; Jain, M.; Lobell, D.B. Towards Fine Resolution Global Maps of Crop Yields: Testing Multiple Methods and Satellites in Three Countries. Remote Sens. Environ. 2017, 202, 129–141. [Google Scholar] [CrossRef]
  46. Jin, Z.; Azzari, G.; Lobell, D.B. Improving the Accuracy of Satellite-Based High-Resolution Yield Estimation: A Test of Multiple Scalable Approaches. Agric. For. Meteorol. 2017, 247, 207–220. [Google Scholar] [CrossRef]
  47. Lobell, D.B.; Thau, D.; Seifert, C.; Engle, E.; Little, B. A Scalable Satellite-Based Crop Yield Mapper. Remote Sens. Environ. 2015, 164, 324–333. [Google Scholar] [CrossRef]
  48. Keating, B.A.; Carberry, P.S.; Hammer, G.L.; Probert, M.E.; Robertson, M.J.; Holzworth, D.; Huth, N.I.; Hargreaves, J.N.; Meinke, H.; Hochman, Z. An Overview of APSIM, a Model Designed for Farming Systems Simulation. Eur. J. Agron. 2003, 18, 267–288. [Google Scholar] [CrossRef]
  49. Jones, J.W.; Hoogenboom, G.; Porter, C.H.; Boote, K.J.; Batchelor, W.D.; Hunt, L.A.; Wilkens, P.W.; Singh, U.; Gijsman, A.J.; Ritchie, J.T. The DSSAT Cropping System Model. Eur. J. Agron. 2003, 18, 235–265. [Google Scholar] [CrossRef]
  50. Steduto, P.; Hsiao, T.C.; Raes, D.; Fereres, E. AquaCrop—The FAO Crop Model to Simulate Yield Response to Water: I. Concepts and Underlying Principles. Agron. J. 2009, 101, 426–437. [Google Scholar] [CrossRef]
  51. Raes, D.; Steduto, P.; Hsiao, T.C.; Fereres, E. AquaCrop-The FAO Crop Model to Simulate Yield Response to Water: II. Main Algorithms and Software Description. Agron. J. 2009, 101, 438–447. [Google Scholar] [CrossRef]
  52. Upreti, D.; McCarthy, T.; O’Neill, M.; Ishola, K.; Fealy, R. Application and Evaluation of a Simple Crop Modelling Framework: A Case Study for Spring Barley, Winter Wheat and Winter Oilseed Rape over Ireland. Agronomy 2022, 12, 2900. [Google Scholar] [CrossRef]
  53. Duchemin, B.; Maisongrande, P.; Boulet, G.; Benhadj, I. A Simple Algorithm for Yield Estimates: Evaluation for Semi-Arid Irrigated Winter Wheat Monitored with Green Leaf Area Index. Environ. Model. Softw. 2008, 23, 876–892. [Google Scholar] [CrossRef]
  54. Duchemin, B.; Fieuzal, R.; Rivera, M.A.; Ezzahar, J.; Jarlan, L.; Rodriguez, J.C.; Hagolle, O.; Watts, C. Impact of Sowing Date on Yield and Water Use Efficiency of Wheat Analyzed through Spatial Modeling and FORMOSAT-2 Images. Remote Sens. 2015, 7, 5951–5979. [Google Scholar] [CrossRef]
  55. Swun Wunna Htet, B.D.; Boonma, K.; Fischer, G.; Franceschini, G.; Deshapriya, N.L.; Thol, T.; Gunasekara, K.; Shrestha, R.; Nachtergaele, F.; Petri, M. PyAEZ Python Package for Agro-Ecological Zoning (AEZ). Available online: https://github.com/gicait/PyAEZ (accessed on 10 March 2025).
  56. Alvar-Beltrán, J.; Soldan, R.; Heureux, A.; Shrestha, N.; Franceschini, G.; Manzanas, R. An Fao Tool Comparison: Python Agroecological Zoning (Pyaez) and Aquacrop Tools to Assess Climate Change Impacts on Crop Yields in Nepal. Environ. Dev. 2023, 47, 100882. [Google Scholar] [CrossRef]
  57. Kontgis, C.; Schneider, A.; Ozdogan, M.; Kucharik, C.; Duc, N.H.; Schatz, J. Climate Change Impacts on Rice Productivity in the Mekong River Delta. Appl. Geogr. 2019, 102, 71–83. [Google Scholar] [CrossRef]
  58. Mukherjee, A.; Huda, A.K.S. Assessment of Climate Variability and Trend on Wheat Productivity in West Bengal, India: Crop Growth Simulation Approach. Clim. Change 2018, 147, 235–252. [Google Scholar] [CrossRef]
  59. Agrometeorological Indicators from 1979 to Present Derived from Reanalysis. Available online: https://cds.climate.copernicus.eu/datasets/sis-agrometeorological-indicators?tab=overview (accessed on 1 March 2025).
  60. Di Virgilio, G.; Ji, F.; Tam, E.; Nishant, N.; Evans, J.P.; Thomas, C.; Riley, M.L.; Beyer, K.; Grose, M.R.; Narsey, S.; et al. Selecting CMIP6 GCMs for CORDEX Dynamical Downscaling: Model Performance, Independence, and Climate Change Signals. Earth’s Future 2022, 10, e2021EF002625. [Google Scholar] [CrossRef]
  61. Huong, N.T.; Kim, Y.-T.; Kwon, H.-H. Evaluation and Selection of CMIP6 GCMs for Long-Term Hydrological Projections Based on Spatial Performance Assessment Metrics across South Korea. J. Water Clim. Change 2023, 14, 2663–2679. [Google Scholar] [CrossRef]
  62. Karger, D.N.; Conrad, O.; Böhner, J.; Kawohl, T.; Kreft, H.; Soria-Auza, R.W.; Zimmermann, N.E.; Linder, P.; Kessler, M. Climatologies at High Resolution for the Earth’s Land Surface Areas. Sci. Data 2017, 4, 170122. [Google Scholar] [CrossRef]
  63. Karger, D.N.; Schmatz, D.R.; Dettling, G.; Zimmermann, N.E. High-Resolution Monthly Precipitation and Temperature Time Series from 2006 to 2100. Sci. Data 2020, 7, 248. [Google Scholar] [CrossRef]
  64. Gebrechorkos, S.; Leyland, J.; Slater, L.; Wortmann, M.; Ashworth, P.J.; Bennett, G.L.; Boothroyd, R.; Cloke, H.; Delorme, P.; Griffith, H. A High-Resolution Daily Global Dataset of Statistically Downscaled CMIP6 Models for Climate Impact Analyses. Sci. Data 2023, 10, 611. [Google Scholar] [CrossRef]
  65. Fischer, G.; Shah, M.; Tubiello, F.N.; Van Velhuizen, H. Socio-Economic and Climate Change Impacts on Agriculture: An Integrated Assessment, 1990–2080. Philos. Trans. R. Soc. B Biol. Sci. 2005, 360, 2067–2083. [Google Scholar] [CrossRef] [PubMed]
  66. AH Kassam Net Biomass Production and Yield of Crops with Provisional Results for Tropical Africa; Management and Conservation Service, Land and Water Development Division, FAO: Rome, Italy, 1977.
  67. Kassam, A.H.; van Velthuizen, H.T.; Fischer, G.W.; Shah, M.M. Agro-Ecological Land Resources Assessment 745 for Agricultural Development Planning. A Case Study of Kenya; Land and Water Development Division Food and Agriculture Organization of the United Nations: Rome, Italy, 1991; pp. 9–31. [Google Scholar]
  68. Duong, S.; Song, L.; Chhin, R. Precipitation Projection in Cambodia Using Statistically Downscaled CMIP6 Models. Climate 2023, 11, 245. [Google Scholar] [CrossRef]
  69. Sun, Z.; Liu, Y.; Zhang, J.; Chen, H.; Jin, J.; Liu, C.; Wang, G.; Tang, L. Spatiotemporal Projections of Precipitation in the Lancang–Mekong River Basin Based on CMIP6 Models. Remote Sens. 2023, 15, 4502. [Google Scholar] [CrossRef]
  70. Do, H.X.; Le, T.H.; Le, M.-H.; Nguyen, D.L.T.; Do, N.C. Future Changes in Hydro-Climatic Extremes across Vietnam: Evidence from a Semi-Distributed Hydrological Model Forced by Downscaled CMIP6 Climate Data. Water 2024, 16, 674. [Google Scholar] [CrossRef]
  71. Das, S.; Kamruzzaman, M.; Islam, A.R.M.T.; Zhu, D.; Kumar, A. Comparison of Future Changes in Frequency of Climate Extremes between Coastal and Inland Locations of Bengal Delta Based on CMIP6 Climate Models. Atmosphere 2022, 13, 1747. [Google Scholar] [CrossRef]
  72. Christensen, J.H.; Boberg, F.; Christensen, O.B.; Lucas-Picher, P. On the Need for Bias Correction of Regional Climate Change Projections of Temperature and Precipitation. Geophys. Res. Lett. 2008, 35, L20709. [Google Scholar] [CrossRef]
  73. Karger, D.N.; Chauvier-Mendes, Y.; Zimmermann, N. Chelsa-cmip6 1.0: A Python Package to Create High Resolution Bioclimatic Variables Based on CHELSA Ver. 2.1 and CMIP6 Data. Ecography 2023, 2023, e06535. [Google Scholar] [CrossRef]
  74. Biswas, J.C.; Haque, M.M.; Hossain, M.B.; Maniruzzaman, M.; Zahan, T.; Rahman, M.M.; Sen, R.; Ishtiaque, S.; Chaki, A.K.; Ahmed, I.M. Seasonal Variations in Grain Yield, Greenhouse Gas Emissions and Carbon Sequestration for Maize Cultivation in Bangladesh. Sustainability 2022, 14, 9144. [Google Scholar] [CrossRef]
  75. Ahmed: Assessing the Impact of Climate Variability on Maize Using Simulation Modeling Under Semi-Arid Environmet of Punab. Available online: https://scholar.google.com/scholar_lookup?title=Assessing+the+impact+of+climate+variability+on+maize+using+simulation+modeling+under+semi-arid+environment+of+Punjab,+Pakistan&author=Ahmed,+I.&author=Rahman,+M.H.U.&author=Ahmed,+S.&author=Hussain,+J.&author=Ullah,+A.&author=Judge,+J.&publication_year=2018&journal=Environ.+Sci.+Pollu.+Res.&volume=25&pages=28413%E2%80%9328430&doi=10.1007/s11356-018-2884-3&pmid=30083905 (accessed on 5 August 2024).
  76. Stuch, B.; Alcamo, J.; Schaldach, R. Projected Climate Change Impacts on Mean and Year-to-Year Variability of Yield of Key Smallholder Crops in Sub-Saharan Africa. Clim. Dev. 2021, 13, 268–282. [Google Scholar] [CrossRef]
  77. Srivastava, R.K.; Panda, R.K.; Chakraborty, A. Assessment of Climate Change Impact on Maize Yield and Yield Attributes under Different Climate Change Scenarios in Eastern India. Ecol. Indic. 2021, 120, 106881. [Google Scholar] [CrossRef]
  78. Ray, D.K.; Gerber, J.S.; MacDonald, G.K.; West, P.C. Climate Variation Explains a Third of Global Crop Yield Variability. Nat. Commun. 2015, 6, 5989. [Google Scholar] [CrossRef] [PubMed]
  79. Waqas, M.A.; Wang, X.; Zafar, S.A.; Noor, M.A.; Hussain, H.A.; Azher Nawaz, M.; Farooq, M. Thermal Stresses in Maize: Effects and Management Strategies. Plants 2021, 10, 293. [Google Scholar] [CrossRef] [PubMed]
  80. Izaurralde, R.C.; Thomson, A.M.; Morgan, J.A.; Fay, P.A.; Polley, H.W.; Hatfield, J.L. Climate Impacts on Agriculture: Implications for Forage and Rangeland Production. Agron. J. 2011, 103, 371–381. [Google Scholar] [CrossRef]
  81. Le, K.N.; Jeong, J.; Reyes, M.R.; Jha, M.K.; Gassman, P.W.; Doro, L.; Hok, L.; Boulakia, S. Evaluation of the Performance of the EPIC Model for Yield and Biomass Simulation under Conservation Systems in Cambodia. Agric. Syst. 2018, 166, 90–100. [Google Scholar] [CrossRef]
  82. Gummadi, S.; Dinku, T.; Shirsath, P.B.; Kadiyala, M.D.M. Evaluation of Multiple Satellite Precipitation Products for Rainfed Maize Production Systems over Vietnam. Sci. Rep. 2022, 12, 485. [Google Scholar] [CrossRef]
Figure 1. The Ganges Delta, India–Bangladesh and Mekong Delta, Vietnam–Cambodia. Annual precipitation (mm) isohyets are for the year 2020; the high-resolution gridded precipitation data were downloaded from the Climatic Research Unit (CRU), UK. Data on irrigated areas were downloaded and extracted from the FAO global map of irrigated areas.
Agronomy 15 00878 g001
Figure 2. Comparison of different GCMs for minimum and maximum temperature and precipitation over Ganges Delta.
Agronomy 15 00878 g002
Figure 3. Comparison of different GCMs for minimum and maximum temperature and precipitation over Mekong Delta.
Agronomy 15 00878 g003
Figure 4. Province-wise PyAEZ-modeled (simulated) yield and reported (measured) yield at the province level from the Ganges Delta, India–Bangladesh. The districts of the Indian state of West Bengal are highlighted in the title by [IN] in the plots and the divisions of Bangladesh are highlighted in the title by [BD] in the plots.
Agronomy 15 00878 g004
Figure 5. Year-wise modeled and reported yields from 2008 to 2022 for the Ganges Delta. Reported yield data were not available for 2021 and 2022 for the Indian state of West Bengal and so there were a few points missing in the 2021 and 2022 subplots.
Agronomy 15 00878 g005
Figure 6. Maize yield suitability maps for the Ganges Delta in CMIP6 scenarios SSP370 and SSP585 for the 2050s and 2100s, under rainfed and irrigated conditions.
Agronomy 15 00878 g006
Figure 7. Province-wise modeled (simulated) and reported (measured) maize yields in the Mekong Delta for the years 1995–2022.
Agronomy 15 00878 g007
Figure 8. Year-wise modeled and reported yield for the period 1995–2022 for the Mekong Delta.
Agronomy 15 00878 g008
Figure 9. Maize yield suitability maps for the Mekong Delta in CMIP6 scenarios SSP370 and SSP585 for the 2050s and 2100s, under rainfed and irrigated conditions.
Agronomy 15 00878 g009
Table 1. Selected GCMs used in the present study.
GCMInstitution/CountryHorizontal Resolution
MPI-ESM1-2-LRMPI-M/Germany1.87° × 1.86°
GFDL-ESM4GFDL/USA1.00° × 1.25°
IPSL-CM6A-LRIPSL/France2.50° × 1.27°
MPI-ESM1-2-HRMPI-M/Germany0.94° × 0.94°
MRI-ESM2-0MRI/Japan1.1° × 1.1°
UKESM1-0-LLMOHC/UK1.25° × 1.875°
Table 2. PyAEZ modules, description, inputs and outputs [1,55].
No.Modules/DescriptionInputsOutputs
1Climate Regime–A computation of the agro-climatic indicators based on the climate dataMaximum temperature [°C]Thermal climate–classified
Minimum temperature [°C]Thermal zone–classified
Precipitation [mm]Thermal length of growing periods
Solar radiation [w·m2]Temperature sum
Relative humidity [%]Temperature profiles
Wind speed [m·s−1]Length of growing period
Multi-cropping zones–classified
Area of study maskFrost index
Soil LULCPermafrost–classified
STRM elevationFallow period requirements
Latitude min/maxAEZ classification
2Crop Simulation–Simulates the crop cycle based on the empirical and deterministic models utilizing the outputs from Module1Crop and crop cycle parameters [Excel file]Estimated yield–rainfed and irrigated
Temperature profile screening [Excel file]Estimated starting date–rainfed and irrigated
Thermal screening factor–rainfed and irrigated
Moisture reduction factor for rainfed
3Climate Constraints–Calculates yield reduction factors and climatic adjusted yieldLength of growing period (output of Module1)Climatic-constrained rainfed and irrigated yield
Length of growing period-equivalent (output of Module1)Reduction factors–rainfed and irrigated
LGP-10 (output of Module1)
Estimated yield–rainfed and irrigated (output of Module2)
Agroclimatic constraints–rainfed and irrigated [Excel file]
4Soil Constraints–Calculates yield reduction factors due to edaphic constraintsEstimated yield–rainfed and irrigated (output of Module3)Soil-constrained rainfed and irrigated yield
Soil parameters–rainfed/irrigated [Excel file]Reduction factors–rainfed and irrigated
Soil topsoil and subsoil characteristics–rainfed/irrigated [Excel file]
5Terrain Constraints–Calculates yield reduction factors due to terrain constraintsSlope map of the site [%]Terrain-constrained rainfed and irrigated yield
Terrain constraints–rainfed/irrigated [Excel file]Reduction factors–rainfed and irrigated
Soil-constrained rainfed and irrigated yield [output of Module4]
6Economic Suitability–The economic potential of a cropEconomic dataEconomic suitability
Market pricesNet revenue–rainfed/irrigated
Terrain-constrained rainfed and irrigated yield
Disclaimer/Publisher’s Note: The statements, opinions and data contained in all publications are solely those of the individual author(s) and contributor(s) and not of MDPI and/or the editor(s). MDPI and/or the editor(s) disclaim responsibility for any injury to people or property resulting from any ideas, methods, instructions or products referred to in the content.

