1. Introduction
Garlic is a major cash crop in China, with its planting area and output ranking first in the world. At present, China’s garlic production mechanization level is relatively low, and planting and harvesting garlic is labor-intensive, occupying a large number of laborers during the busy season, restricting the further expansion of the planting area and further increase in farmers’ income; the vast majority of garlic farmers are in urgent need of garlic production mechanization [
1]. However, mechanized garlic harvesting lags in modern agriculture due to excessive resistance and energy consumption caused by soil–tool interactions during digging. This study tackles this challenge by analyzing soil disturbance dynamics and optimizing soil–tool interactions to improve efficiency and reduce energy use.
The interaction mechanism between the soil medium and the soil-engaging components exhibits complex nonlinear dynamics, representing a critical research frontier in agricultural machinery engineering. Karmakar and Kushwaha [
2] conducted a systematic review of modeling methodologies for soil-engaging components in agricultural machinery, while evaluating the applicability of computational fluid dynamics (CFD) in addressing unresolved challenges in soil dynamics. Recent years have witnessed a substantial increase in research focusing on interaction mechanisms between specific soil-engagement tools and the soil medium [
3,
4,
5]. Zou et al. [
6] proposed a curved sub-soiling shovel with low moisture content and high compactness for active lubrication and drag reduction and soil improvement, aiming to address the challenges of high resistance and low efficiency in sub-soiling operations. Wang’s study [
7] systematically investigated the interaction between a winged sub-soiling shovel and the soil through finite element simulations and field experiments, thereby establishing the technical foundation for the design and optimization of the winged sub-soiling shovel. Subsequent to experimental findings, Hadi et al. [
8] optimized weed seed burial according to scraper design parameters, depth, and plow speed, thereby enhancing the efficiency of scraper plowing and conservation tillage in organic farming. To solve the problems of high tillage resistance and high energy consumption caused by high viscosity of tea garden soil, Zhang et al. [
9] proposed a design method for a bottom-layer deep loosening machine based on structural bionics and the discrete element method. Based on DEM-MBD technology, Xiao et al. [
5] developed a self-vibrating rotary tillage blade device that successfully reduced torsion and consumption in rotary tillage operations. While existing studies have extensively characterized soil–tool interaction mechanisms for conventional soil-engaging implements (e.g., subsoilers, rotary blades), fundamental knowledge gaps remain regarding excavation dynamics. Specifically, digging shovels exhibit distinct kinematic patterns and force transmission characteristics compared to other tillage tools. The mechanism of interaction between digging shovels and soil remains unclear.
Research on the interaction mechanisms between digging shovels and soil has been documented in several studies [
10,
11,
12]. Recently, Zhang et al. [
13] pioneered a discrete element composite soil model to analyze Panax pseudoginseng rhizome harvesting, developing a bionic digging shovel that effectively reduced excavation resistance. Emmanuel et al. [
14] employed discrete element method (DEM) coupled with response surface methodology to investigate potato harvesting efficiency, systematically evaluating the effects of operational parameters on soil reaction forces and tool wear characteristics. Wang et al. [
15] introduced a second-order shovel with circular transition surfaces, achieving greater soil shear performance for mountainous terrain operations. In addition, biomimetic engineering approaches have yielded significant innovations in shovel design. Li et al. [
16] developed a longitudinal wave shovel inspired by earthworm surface morphology, demonstrating enhanced soil kinetic energy transfer and improved soil fluidity compared to conventional designs. Jiang et al. [
17] conceptualized a four-bar mechanism as the prototypical model by integrating the functionality of the mole claw with its digging action, and the DEM results revealed that the drag reduction properties of the two bionic features could be superimposed to a certain extent, with the combined bionic feature exhibiting a more pronounced drag reduction effect. Zhou et al. [
18] developed a bioinspired drag-reducing soil-loosening implement based on the morphological characteristics of badger claw toes and employed DEM to establish a multi-component interaction model for assessing the influence of operational parameters, particularly the implement velocity and handle inclination angle, on resistance dynamics. Most of the aforementioned studies have employed the DEM to simulate the interaction process between digging shovels and soil. However, at the macroscopic level, soil is a continuous medium, and its artificial discretization into particles of specified sizes leads to discrepancies in the propagation of cracks within the soil during excavation-induced fracture. More accurate simulation of soil crack propagation still requires further exploration.
Addressing the existing issues in the study of the interaction mechanism between digging shovels and soil, this paper established a cohesive zone model for soil based on fracture damage theory. Utilizing the finite element method, the interaction mechanism between soil and digging shovels was simulated and analyzed. The effects of entry angle, shovel blade bevel angle, vibration frequency, and forward speed on the forward resistance of the shovel were explored. Through orthogonal experiments, an optimized parameter combination demonstrating minimal forward resistance was identified.
2. Materials and Methods
2.1. Damage Evolution of the Soil
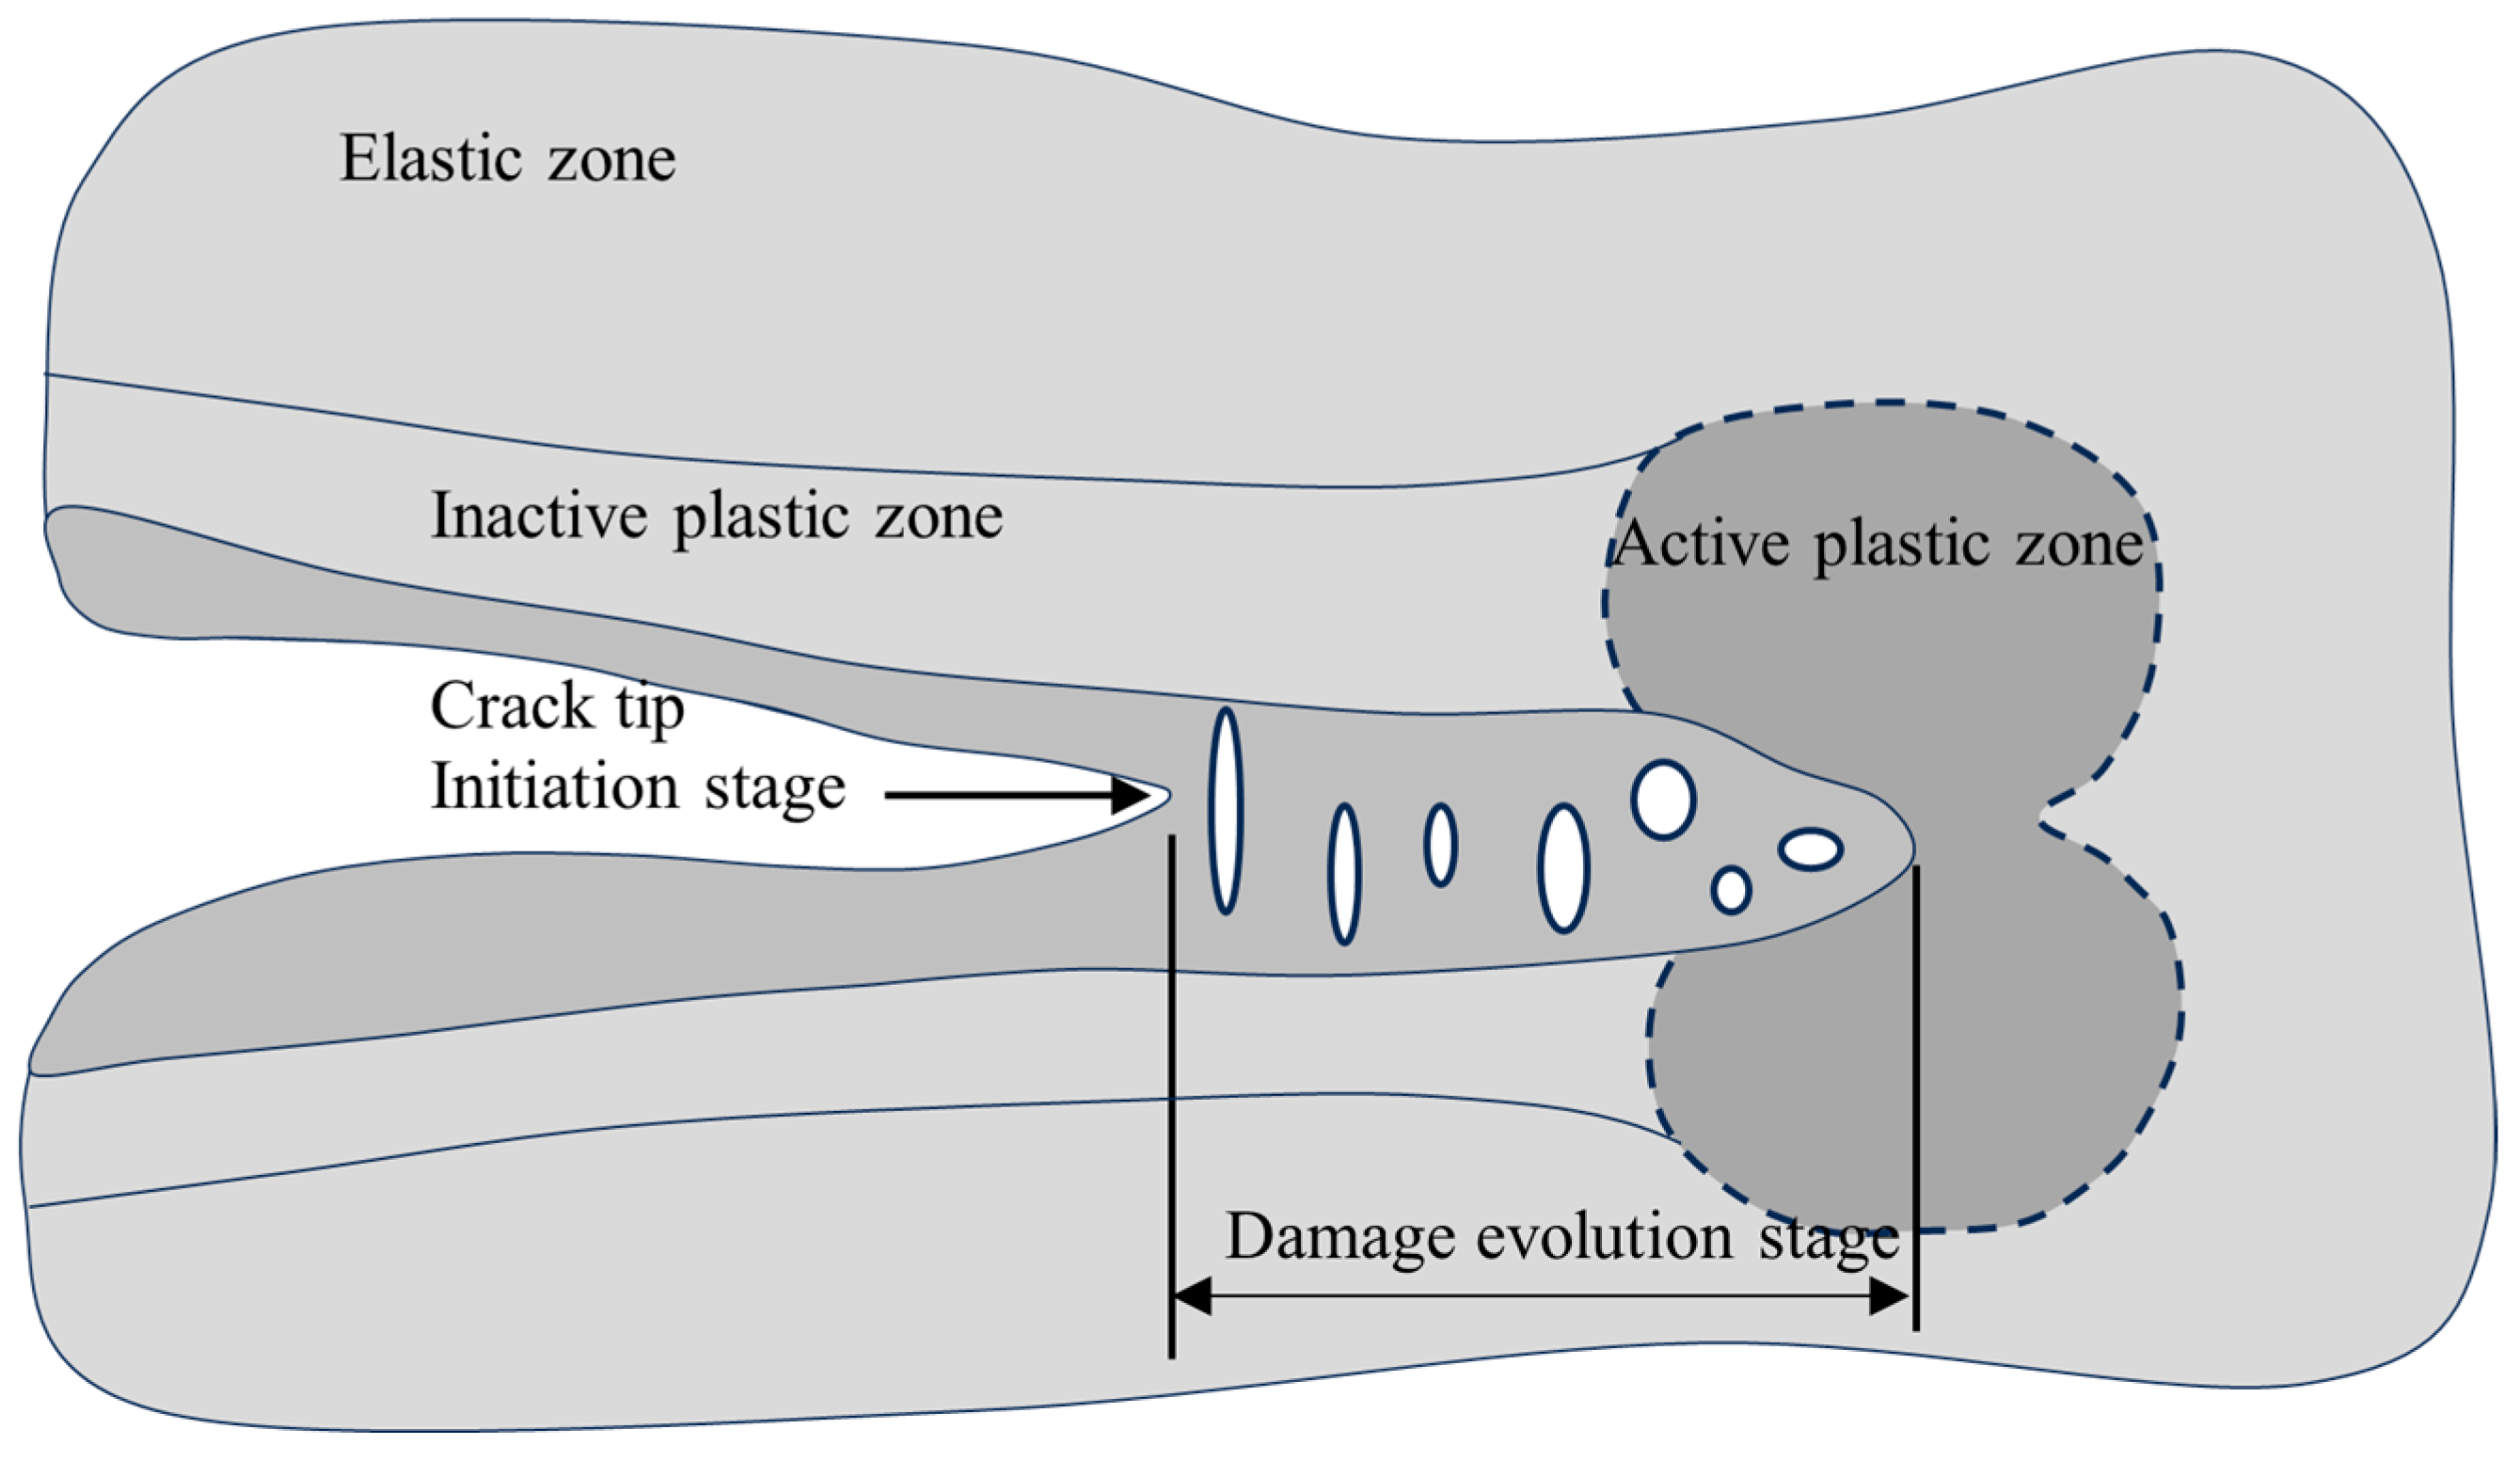
The fracture of a material is a process that can be subdivided into two stages: initiation and damage evolution. While conventional engineering analyses predominantly focus on fracture initiation for practical applications, comprehensive understanding of crack propagation necessitates explicit consideration of damage progression mechanics. This distinction becomes particularly critical when investigating soil fracture phenomena during digging shovel operations. By incorporating both fracture initiation and damage evolution into the analytical framework, it is possible to predict the excavation resistance with greater accuracy.
During digging shovel operations, soil stresses may approach the bearing capacity limit, entering the critical stage of crack initiation, as illustrated in
Figure 1. The subsequent crack propagation becomes contingent upon external energy input, with a distinct damage evolution zone developing ahead of the crack tip. This process is similar to the one described by Wang [
7]. The elliptical micro-voids illustrated in
Figure 1 represent localized damage manifestations that induce progressive reduction in effective load-bearing cross-sectional area. At this stage, the applied energy contributes to localized damage accumulation at the front of crack tip, whereas macroscopic fracture surface formation remains absent. Crack expansion necessitates successive generation of new crack surfaces. As mechanical loading increases and energy transfer persists, the micro-voids within the damage evolution zone undergo continuous growth until critical coalescence occurs, ultimately forming a new crack surface. This mechanistic sequence demonstrates the fundamental dependence of crack propagation dynamics on sustained energy infusion. The simulation fidelity in soil fracture analysis therefore becomes critically dependent on rigorous characterization of the initiation and damage evolution stages.
During the process of crack generation, the stress at any point on the crack surface increases from zero to a maximum and then decreases to zero again, as illustrated by the dotted line in
Figure 2a. This behavior mirrors the fundamental stress–strain relationship observed in conventional uniaxial tensile testing. To enable systematic investigation, the fracture damage mechanics can be effectively represented through a bilinear model, as graphically depicted by the solid line in
Figure 2a.
For the cohesive zone model, a hypothetical crack is extended along a predetermined crack path. The relationship between surface separation (
S) and corresponding traction (
T), known as the TSL (traction–separation law), can characterize the fracture behavior of the soil, as seen in
Figure 2b.
There is a linear relationship between the traction and separation, and no damage occurs until the separation reaches a critical value S0. At S > S0, damage develops as S increases, and the cohesive zone will totally fracture once the condition S = Smax is satisfied.
The cohesive zone model has emerged as a well-established analytical model for simulating crack propagation in conventional materials. The model’s effectiveness critically depends on the precise characterization of its constitutive parameters. As established in foundational studies [
21,
22], two critical parameters dominate the model’s predictive capability: the maximum traction and the cohesive energy. Conventional parameter identification methodologies typically employ experimental characterization techniques [
23] or finite element-based inverse analysis approaches [
24]. Notably, Wang et al. [
25] developed an innovative parameter identification methodology for metallic materials that circumvents the temporal and financial constraints associated with traditional experimental and computational procedures. The present investigation adapts this methodology to soil, to further explore the interaction mechanism between shovel and soil.
2.2. Determination of the Parameters
The soil utilized in the experiment was obtained from Feng Xian, China. where the predominant soil type is characterized by sandy soil. Initially, the soil was subjected to a process of purification, during which extraneous elements such as plants, gravel, and other impurities were eliminated. Subsequently, the specimens were meticulously crafted and calibrated in accordance with the preset values for water content and density. It should be noted that the soil specimens were not in their natural state, but remolded soils to exclude impurities.
During the garlic harvesting period, the soil environment is characterized by standardized physical parameters of 25% moisture content and 1.8 g/cm³ bulk density. The experimental parameters and analytical methodologies presented in this section are therefore specifically constrained to these defined soil conditions.
As demonstrated in
Figure 3, the critical parameters governing the model consist of
Tmax (peak tensile strength) and the cohesive energy quantified by the integral of the traction–separation curve. The damage initiation threshold is defined by the crack surface displacement
S0 = 2 × 10
−6 m, while the complete crack formation corresponds to the ultimate displacement
Smax, which is derived through constitutive model calculations.
2.2.1. Maximum Traction
The maximum traction represents a critical parameter in the cohesive zone model, where interfacial stresses exceeding this threshold trigger damage accumulation and subsequent crack initiation. Uniaxial compression testing was conducted on cylindrical soil specimens to characterize their mechanical response through engineering stress–strain curves, as demonstrated in
Figure 4. The peak engineering stress was experimentally determined as
σMax = 16,406.06 N/m
2.
It should be noted that conventional engineering stress–strain analysis neglects cross-sectional area variations during specimen deformation. Under the assumption of constant material volume during compression, the following equations can be derived [
26]:
where
represents the true stress of the soil, Pa;
ε represents the true strain of the soil;
e represents the engineering strain of soil;
s represents the engineering stress of soil, Pa.
Similarly to conventional engineering materials, the maximum traction (
) of soil’s CZM (Cohesive zone model) corresponds to the critical stress (
) of the material’s internal defects at fracture. This necessitates the transformation of nominal stress–strain measurements at macroscopic failure to actual stress–strain values at the microstructural level. Notably, the true stress (
) at fracture initiation deviates from the theoretical maximum strength due to the inherent porous nature of soil media. The expression for critical stress is derived from the concept of damage variables in damage theory [
15,
25]:
where
is the critical stress, which is also the maximum traction (
), Pa;
is the effective force, Pa;
is the true stress at the time of fracture;
is the critical damage variable, which is a material constant defined as the ratio of the total area of internal defects to the original area at the critical state. For soil materials, the value of
is taken as 0.3, and then the maximum traction
is 29,877.58 Pa.
2.2.2. Cohesive Energy
The cohesive energy, representing the energy dissipation per unit area during crack propagation, is conventionally equated with the critical J-integral value in fracture mechanics. This investigation employs numerical simulation techniques to determine the critical J-integral for soil fracture characterization. Through finite element analysis, the computational framework establishes the temporal evolution of J-integral values at crack tips under varying contour paths for uniaxial tensile specimens. While classical fracture mechanics studies on metallic materials [
25] identify fracture initiation at characteristic turning points in J-integral versus time profiles, this paper reveals fundamental differences in soil behavior. To address this material-specific response, a strain-based criterion for cohesive energy determination was implemented, wherein the critical J-integral corresponds to the fracture strain threshold.
Numerical results indicate peak true stress attainment at 0.25, with associated temporal analysis identifying 3.84 s as the timestep. The computed J-integral value at this step time measures 1.23 J/m
2, as graphically demonstrated in
Figure 5.
2.3. Simulation of the Digging Process
The simulation framework employed a geometrically accurate model (
Figure 6) incorporating critical contact interactions between the rigid shovel structure and deformable soil media, as well as soil-to-soil contact mechanics. Boundary conditions were systematically defined with fixed displacement constraints applied to the soil base and symmetry boundary conditions imposed on all lateral surfaces of the soil domain to reflect symmetry. Through comprehensive mesh convergence studies, the final finite element model utilized 505,901 C3D10 elements for soil representation, ensuring numerical accuracy in deformation prediction while maintaining computational efficiency. Key material properties and interaction parameters governing the soil–shovel system are summarized in
Table 1.
The numerical simulation of soil excavation dynamics was performed under predefined operational parameters: an entry angle of 20°, shovel blade bevel angle of 120° (as illustrated in
Figure 7), forward speed of 0.4 m/s, and vibration frequency of 3 Hz. Garlic should be sown at a spacing of between 170 and 200 mm, according to agronomic requirements. To ensure that the digging shovel can be flexibly adapted to different row spacing, and to ensure that the garlic root can be completely severed, the width of the digging shovel is designed to be 150 mm, and the length of the shovel is 14 cm. Computational analysis spanned a temporal domain of 1 s. The simulation process of the shovel entering the soil is depicted in
Figure 8. It is evident that the shovel entry into the soil occurs before 0.28 s, and then it reaches its maximum vertical displacement during the second cycle at 0.5 s. At this juncture, a substantial rupture emerges on the soil’s surface. During the interval from 0.5 s to 0.76 s, the shovel penetrates the soil, and the forward resistance reaches its maximum value for a single stroke. At this point, cracks begin to expand into the surrounding area. From 0.76 s to 0.84 s, the shovel begins to move back sharply, and the soil is overturned.
2.4. Single Factor Analysis
The single-factor simulation experiment was systematically designed as presented in
Table 2. Four critical factors were investigated: entry angle, shovel blade bevel angle, forward speed, and vibration frequency. Each factor was examined at five distinct levels to comprehensively assess its individual effect on system performance. The evaluation metric selected for this study was the mean forward resistance, representing the primary energy consumption indicator during operation. A total of 20 simulations were conducted under varying parameter combinations.
3. Results and Discussion
3.1. Results of Single Factor Analysis
As depicted in
Figure 9, the relationship between entry angle variation and mean forward resistance exhibits a non-monotonic pattern characterized by an initial decline followed by subsequent escalation. It is generally accepted that an increase in the angle of entry results in greater resistance. However, there is a school of thought amongst scholars [
22] that suggests that, within a certain range, an increase in the angle of entry may in fact reduce excavator operating resistance. Conversely, an insufficient angle of entry can impede the shovel’s ability to break through the soil, thereby compromising its loosening effect. Nevertheless, it should be noted that this conclusion may not be universally applicable to all soil types. Indeed, experimental findings have demonstrated that both an insufficient and excessive angle of entry can result in an increase in excavator forward resistance [
21,
27].
Quantitative analysis reveals a linear reduction in resistance as the entry angle increases from 10° to 20°. Conversely, when the entry angle increases from 20° to 25°, there is minimal change in resistance. However, when the entry angle increases from 25° to 30°, there is a pronounced increase in forward resistance. It is important to note that both overly large and overly small entry angles can result in a substantial increase in forward resistance. In the context of this study, the underlying cause of the observed phenomenon is attributed to the combined effect of the shovel and its handle. When the angle of entry is small, there is an increase in the contact between the shovel handle and the soil, which in turn leads to an increase in forward resistance. Conversely, when the angle of entry is large, the projected area of the shovel surface also increases, thus leading to an increase in forward resistance.
As illustrated in
Figure 10, the effect of varying shovel blade bevel angle on average forward resistance demonstrates a direct correlation between blade bevel angle and resistance, with an upward trend as the angle increases. This phenomenon can be attributed to the effect of increased blade bevel angle on shovel tip bluntness, leading to augmented resistance. Additionally, the increase in blade bevel angle leads to an augmentation in the shovel’s surface area, thereby increasing the contact area between the shovel and the soil during operation, and consequently, escalating the forward resistance. It is evident that, due to the monotonicity of the curve, the shovel blade bevel angle will not be utilized for subsequent optimization analysis.
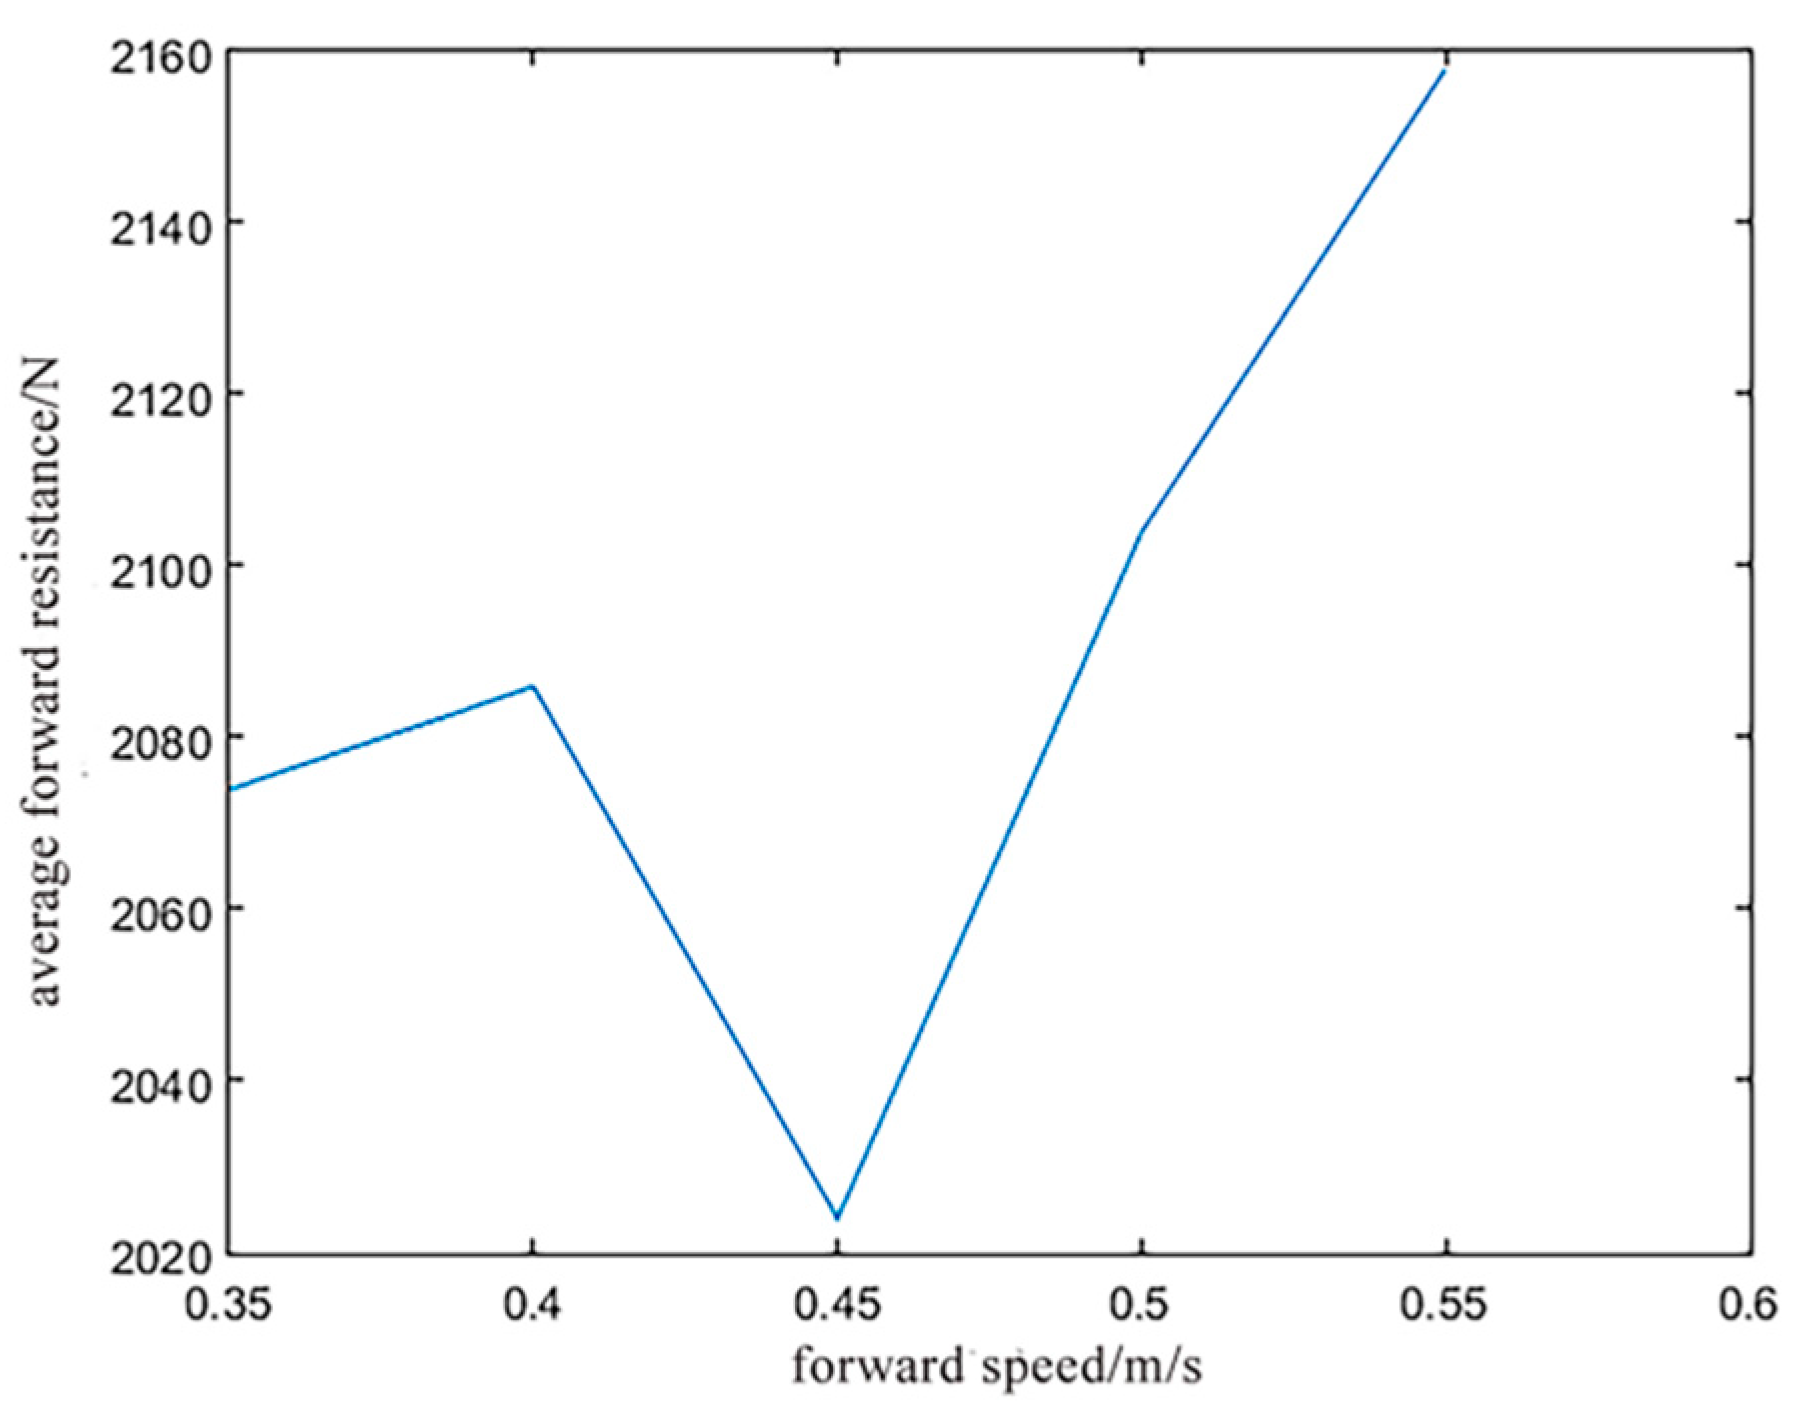
As illustrated in
Figure 11, the impact of varying forward speeds on average forward resistance is demonstrated. It is evident that resistance undergoes a slight increase as the speed rises from 0.35 m/s to 0.40 m/s, followed by a significant decrease as the speed increases from 0.40 m/s to 0.45 m/s. Notably, there is a sharp increase in resistance as the speed rises from 0.45 m/s to 0.55 m/s. At higher speeds, inertia causes the stationary soil to be unable to react quickly enough to the change in speed, resulting in a significant increase in forward resistance. At lower speeds, other factors have a relatively large influence on the resistance, resulting in an undulating curve of forward resistance.
In
Figure 12, the effect of varying vibration frequencies on the average forward resistance is demonstrated. It is evident that when the vibration frequency ranges from 1 to 2.5 Hz, there is a substantial decrease in resistance with an increase in frequency. However, when the vibration frequency is elevated from 2.5 Hz to 3 Hz, there is a concomitant increase in resistance. While an increase in frequency can lead to a significant reduction in forward resistance, it is important to note that a certain limit exists. At present, the torque that can be applied to the garlic harvester bucket is limited, so it is not possible to achieve too high a vibration frequency, and studies [
28] have shown that a high frequency will cause the whole mechanism to resonate, damaging the structure of the machine; at the same time, it will cause the pore water pressure of the soil to rise rapidly, greatly increasing the resistance to penetration.
In summary, the simulation results demonstrated a monotonic positive correlation between forward resistance and shovel blade bevel angle, with resistance values exhibiting a progressive ascending pattern as angular measurements increased. This consistent directional relationship led to the statistical determination that this parameter exerted marginal influence within the tested operational range, warranting its exclusion from subsequent multivariate optimization. Notably, single factor analysis revealed distinct extrema in the functional relationships between forward resistance and three operational variables: entry angle, forward speed, and vibration frequency. These nonlinear interactions prompted the implementation of a three-factor orthogonal experimental design to systematically investigate variable interdependencies and optimize system performance.
3.2. Orthogonal Optimization Analysis
The single-factor simulation test conducted in the previous section obtained the influence of the parameters on the forward resistance, but the optimal solution of the parameter that minimizes the resistance has not yet been obtained. Therefore, in this section, based on the previous single-factor test, an orthogonal simulation test is carried out, taking the three factors of the vibrating shovel’s entry angle, forward speed, and vibration frequency as variables, and the forward resistance as the evaluation index.
As illustrated in
Table 3, the three factors of entry angle, forward speed, and vibration frequency were designated as variables, with the average forward resistance serving as the evaluation index. The total number of simulations conducted was 17, and the results are presented in
Table 4.
3.2.1. Analysis of Variance
Following the incorporation of the quadratic term into the Design Expert 13 software, the variance analysis results can be systematized in tabular form, as illustrated in
Table 5. The F-value of this model is 23.55, signifying its significance. Additionally, the
p-value is a mere 0.02%, indicating a probability of only 0.02% that the F-value has been artificially influenced. This regression model demonstrates a high degree of reliability. The regression significance analysis reveals that among the effects on forward resistance, the entry angle has the most significant effect, followed by vibration frequency and then forward speed.
The regression equation of digging shovel on three factors is obtained as follows:
From
Table 5, the misfitting value
p > 0.05 indicates that the regression Equation (3) has a high degree of fitting.
3.2.2. Response Surface Analysis
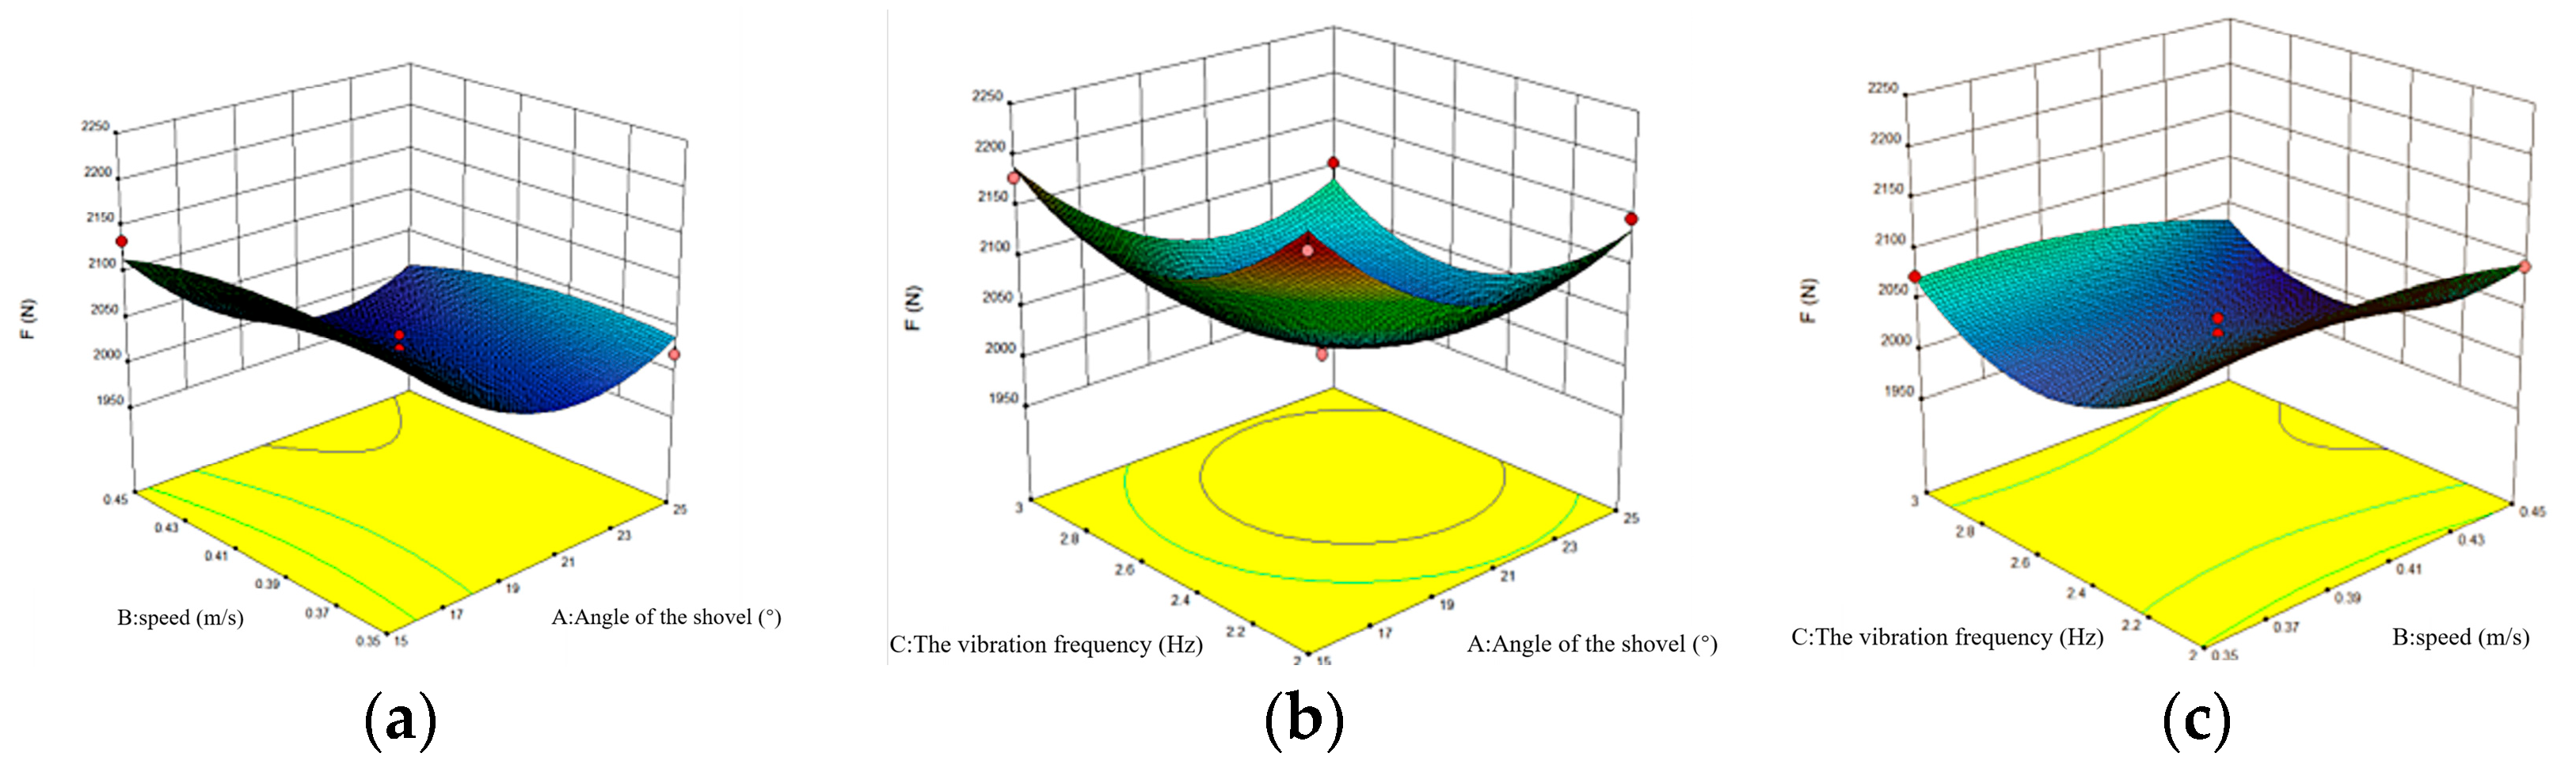
To present the interaction of these factors in a more accessible and intuitive manner, the law governing the interaction of these two factors on the forward resistance was derived using the Design Expert 13 software. This derivation is illustrated in
Figure 13.
Figure 13a illustrates the response surface analysis of the interaction between entry angle and forward speed on forward resistance under a fixed vibration frequency of 2.5 Hz. The response surface reveals a nonlinear relationship where forward resistance initially exhibits a gradual increase followed by a progressive decrease with elevation in forward speed, peaking at approximately 0.39 m/s. Concurrently, resistance demonstrates a rapid decline succeeded by a moderate rebound with increasing entry angle, reaching its minimum value around 21.5°.
Figure 13b demonstrates the combined effects of entry angle and vibration frequency on forward resistance at a constant forward speed of 0.4 m/s. The response surface indicates a concave response pattern where resistance achieves its minimum value (23° entry angle and 2.6 Hz frequency) through an initial decrease followed by subsequent increase in both parameters.
Figure 13c presents the response surface of the interaction between forward speed and vibration frequency on the forward resistance when the entry angle is set at the mid-level (20°). The forward resistance increases and then decreases with the increase in the forward speed, while it decreases and then increases with the increase in the vibration frequency.
Based on the orthogonal simulation analysis results, the optimal parameter set was determined as follows: entry angle of 22°, forward speed of 0.45 m/s, vibration frequency parameter of 2.6 Hz, and predicted mean forward resistance of 2086.43 N.
3.3. Validation
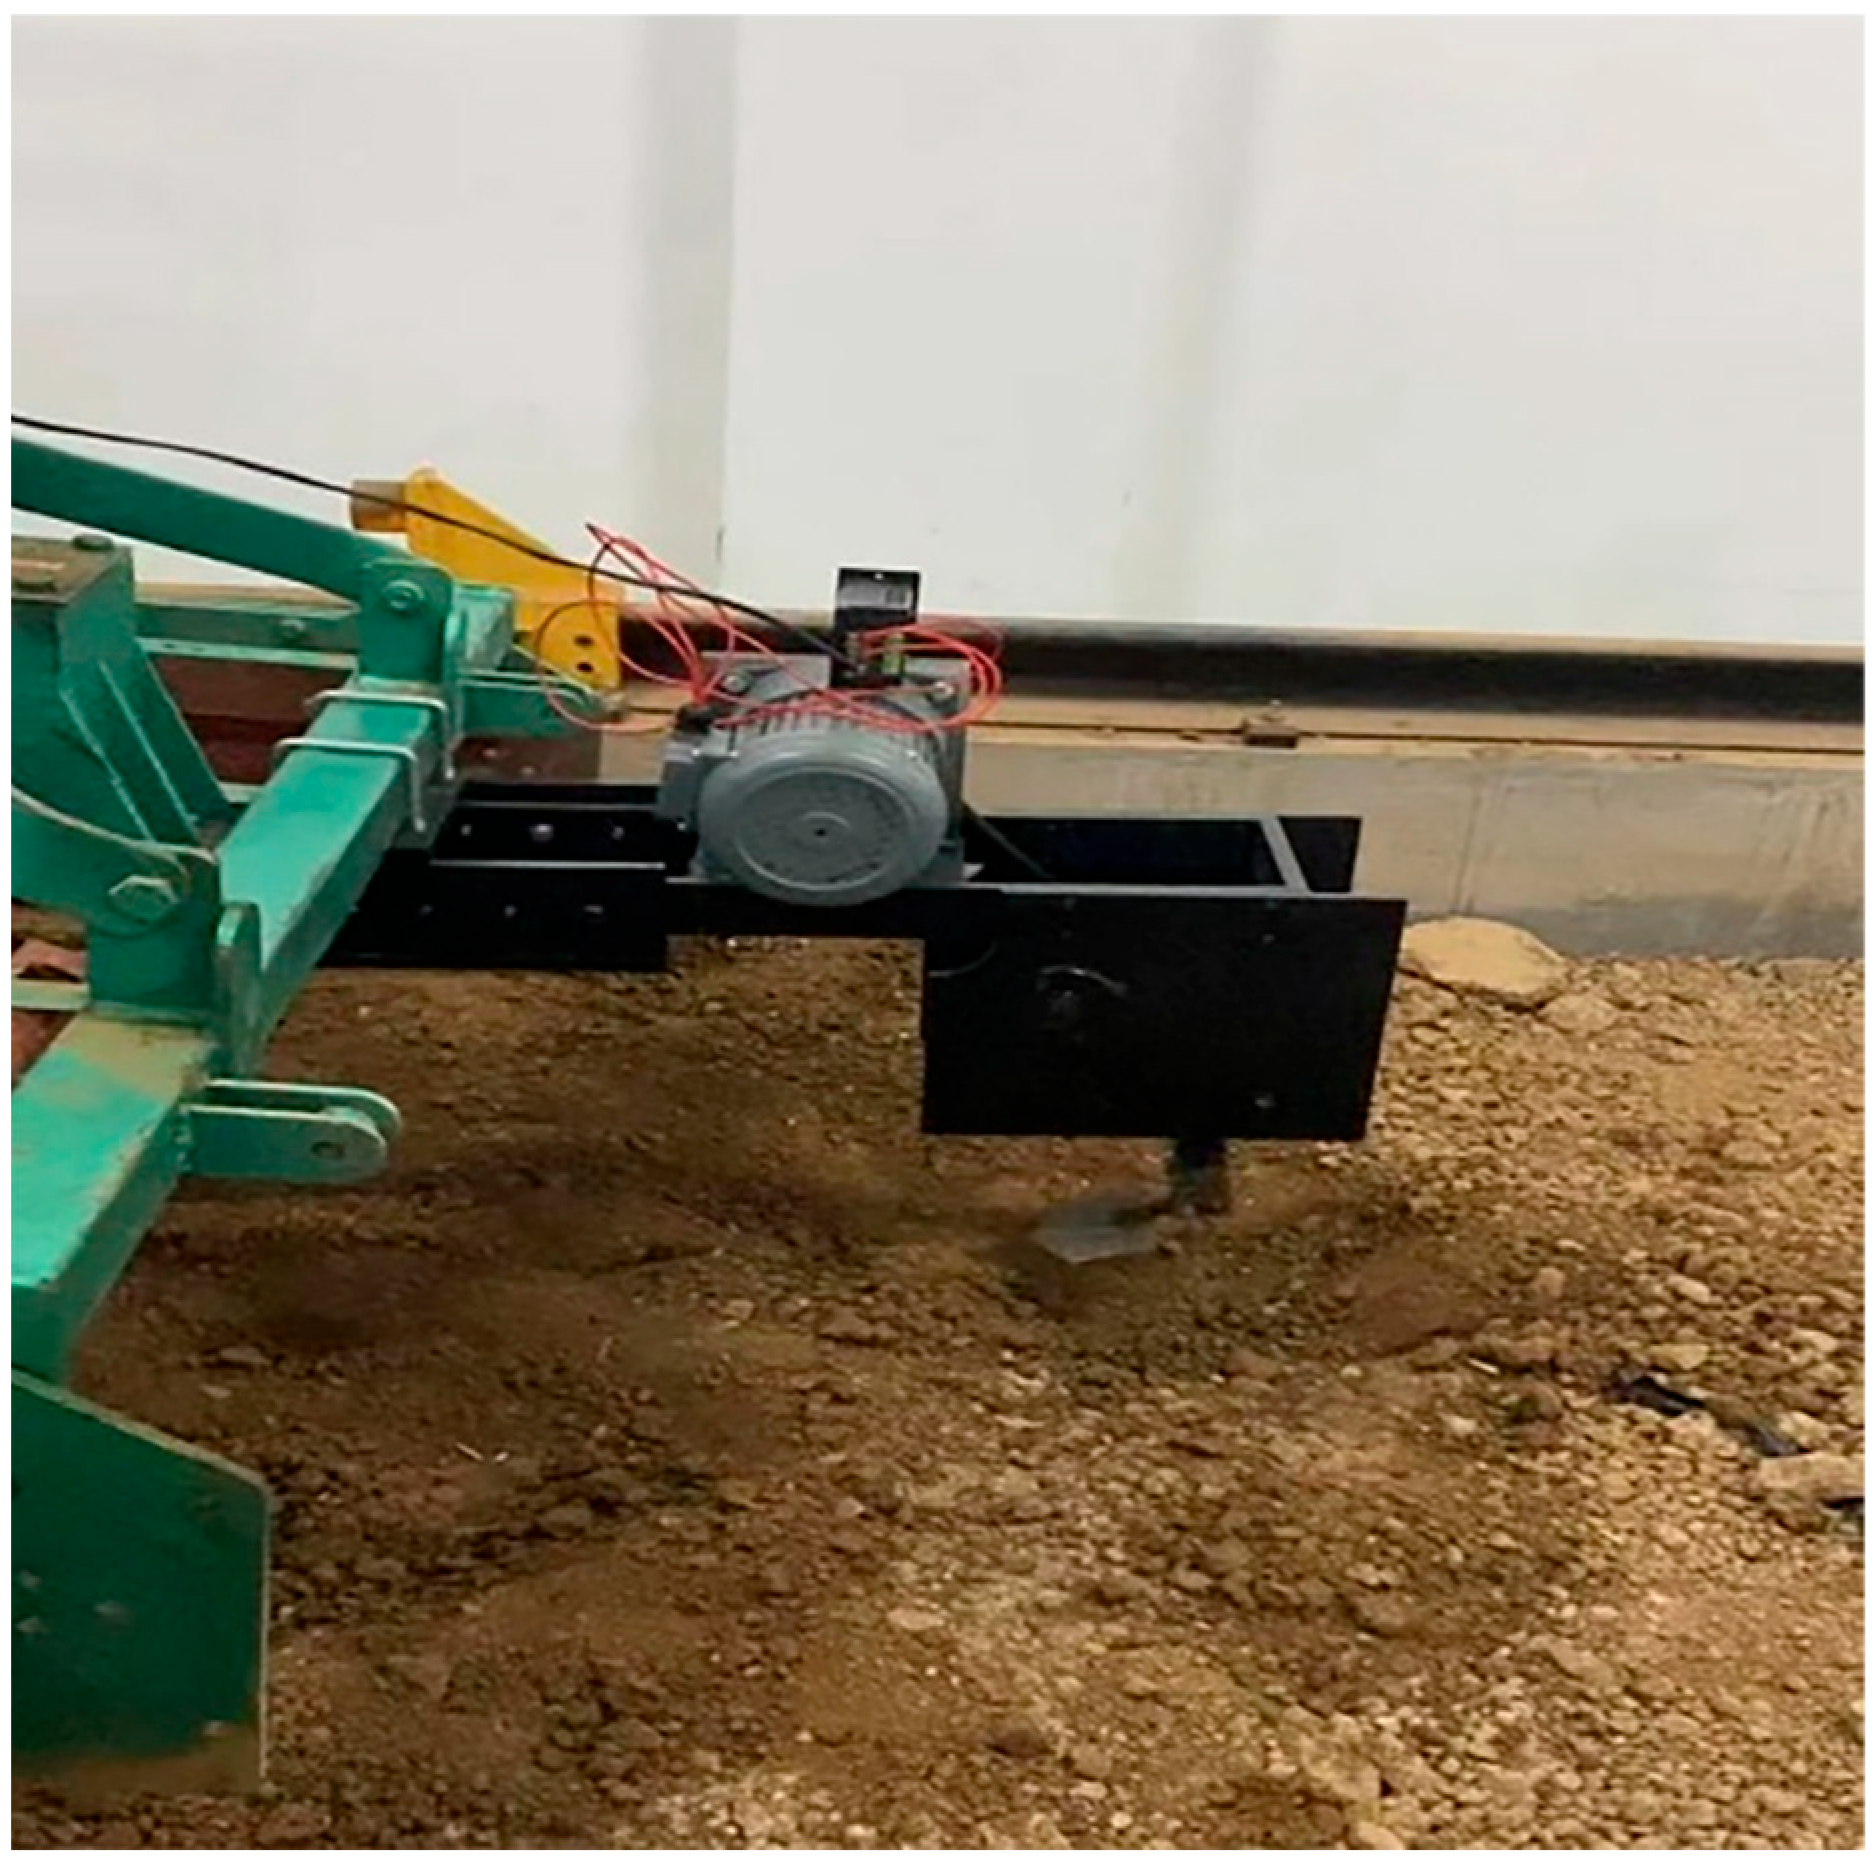
The water content of the soil is set to about 25%, the strength to 750 kPa (density is about 1.8 g/cm
3), which corresponds to the soil’s parameters used in simulations. The embedded depth is 130 mm, the forward speed is 0.45 m/s, the frequency is 2.6 Hz, and the entry angle is about 22°. The soil bin test is shown in
Figure 14.
A comparison was conducted between the experimental data and the simulated results, as illustrated in
Figure 15. While there is a little disparity in the alignment of the two curves, the overall trend demonstrates a high degree of similarity, thereby substantiating the reliability of the optimal parameter combination.
Furthermore, a stable interval of forward motion was selected, and a steady state treatment was performed using first-order differencing. The results of this analysis are shown in
Figure 16. Subsequently, Pearson/Spearman correlation analyses were carried out and compared using the F-test. The Pearson correlation coefficient of 0.52 and the Spearman correlation coefficient of 0.61, with
p-values of less than 0.05 for both, indicated a high degree of synchronization in the direction of the local fluctuations and a high degree of consistency in the short-term trend of changes in the two sets of data. The F-test with a
p-value of 0.3556, which was greater than 0.05, further corroborated these findings. This finding suggests that the observed variance differences between the two groups are not statistically significant. Furthermore, it indicates that there is no statistical difference in resistance fluctuations, and that the dynamic response of the model converges with the actual test.
Three soil bin tests were conducted, and the mean value of the resistance curve of the central stabilization section was obtained and subsequently compared with the simulation value, as illustrated in
Table 6. As evident in the table, the discrepancy between the results of the three soil bin tests is negligible, and a disparity of approximately 20.52% is observed between the simulation result and the test result.
The comparison of the simulation results and the soil bin test results reveals that the curve of the soil bin test is higher than that of the simulation result. The observed discrepancy primarily stems from the inherent complexity of soil composition combined with the limited representativeness of idealized soil mechanical parameters. Suboptimal soil conditions in the bin tests, characterized by partial soil crust, impeded efficient soil fragmentation and amplified the resistance. Additionally, during soil bin testing, mechanical vibrations from the entire apparatus contributed to measurable elevations in the curve’s peak values. Considering those constraints, the recorded deviation of approximately 20% falls within acceptable range, thereby confirming the validity of the computational modeling methodology employed, and it can provide a reference for the resistance optimization of the shovel.


