1. Introduction
Grapes, as one of the world’s most important economic crops, play a crucial role in agricultural production [
1]. They are widely used in winemaking, fresh consumption, and dried fruit production, generating substantial income for farmers and significantly contributing to local economic development [
2]. However, the development of grape cultivation faces numerous challenges, particularly the threat posed by pests and diseases [
3]. These diseases not only severely affect vineyard yield and fruit quality but also pose significant challenges to the sustainability of agriculture [
4]. Therefore, comprehensive research on grape pest and disease management and control holds great economic and social significance. Currently, the primary diseases affecting grape cultivation include downy mildew, powdery mildew, gray mold, anthracnose, and spot anthracnose [
5]. Downy mildew tends to break out in warm and humid environments, with a long incubation period and concealed early symptoms, posing challenges for accurate monitoring and early warning [
6]. Powdery mildew can occur throughout the year, and its complex environmental adaptability increases uncertainty in predicting its occurrence, making it difficult for traditional methods to fully capture its patterns [
7]. Gray mold frequently occurs during the flowering and harvest stages, which are critical periods for fruit quality. However, existing monitoring systems exhibit deficiencies in dynamic data feedback and real-time prevention, making it difficult to contain the damage in time [
8]. Anthracnose thrives in high-temperature and high-humidity environments, spreading rapidly and causing severe damage, necessitating high-efficiency dynamic prediction models, whereas existing methods often fail to promptly capture environmental changes [
9]. Spot anthracnose primarily affects stems and leaves, leading to black spots and necrotic areas. Its early symptoms are often overlooked, and the lack of integration in monitoring systems results in a decline in plant vitality [
10].
Traditional pest and disease management methods primarily rely on farmers’ experience and manual operations, which are inefficient, susceptible to subjective biases, and lack scientific prediction techniques, making timely disease control difficult [
11]. With the advancement of automation and intelligent technologies, researchers have attempted to enhance the efficiency and accuracy of pest and disease management using rule-based systems and traditional machine learning approaches [
12,
13]. However, these approaches have inherent limitations, including insufficient technological maturity, limited data processing capacity, and poor adaptability to complex environments, which restrict their effectiveness in practical applications. The rapid development of deep learning has led to significant breakthroughs in image recognition and pattern recognition, providing new research directions for grape disease management [
14]. Hyperspectral imaging has gained increasing attention in plant disease detection due to its ability to capture fine-grained spectral information across different wavelength bands, allowing for more precise differentiation of disease symptoms. Unlike traditional RGB imaging, hyperspectral data provides an extended spectral dimension, enabling models to achieve better distinction between disease-affected and healthy regions. This study integrates hyperspectral imaging with deep learning techniques by employing a Transformer-based network, incorporating a temporal enhancement module to improve disease feature modeling over time. Furthermore, a multi-source data fusion module is designed to enhance the synergistic effect of RGB, hyperspectral, and environmental sensor data, thereby improving model stability and adaptability. Experimental results demonstrate that this approach consistently outperforms conventional methods in various plant disease detection tasks, particularly in early-stage detection and low-sample scenarios, maintaining high accuracy and robustness.
Wang et al. proposed a trilinear convolutional neural network (T-CNN) model that utilizes bilinear pooling to independently classify crops and diseases, demonstrating excellent generalization and practical application value in disease detection [
15]. Zhang et al. developed a gmamba segmentation model based on state-space models and convolutional architectures, achieving superior performance in fine-grained segmentation of grape leaf diseases [
16]. Wang et al. introduced the pd-tr framework, an improved transformer-based architecture, enabling automated detection and efficient recognition of plant diseases [
17]. Wadhwa et al. designed an interpretable machine learning model that leverages environmental data to predict agricultural diseases [
18]. Despite these advancements, deep learning models still face technical bottlenecks in multispectral data processing, complex structure recognition, and environmental adaptability [
19]. These limitations hinder the comprehensive application of deep learning in grape disease management, necessitating further research and innovation to overcome existing technological barriers. Roberto Oberti et al. employed multispectral imaging and spectral index-based algorithms to enhance the detection sensitivity of grapevine powdery mildew at different viewing angles, improving detection rates from 9% at 0° to 73% at 60° [
20]. Nikolaos Giakoumoglou et al. utilized deep learning segmentation models, particularly U-Net++ combined with a MobileViT-S encoder, to achieve early detection of Botrytis cinerea in cucumber plants, attaining an overall accuracy of 90.1%, demonstrating the effectiveness of artificial intelligence in early crop disease diagnosis [
21]. Fraiwan et al. applied convolutional neural networks (CNNs) to classify three grape leaf diseases (black measles, black rot, and isariopsis leaf spot), training 11 CNN models on 3639 leaf images, achieving over 99.1% accuracy [
22]. T. Rumpf et al. used Support Vector Machines (SVMs) with nine spectral vegetation indices on 21-day hyperspectral data to classify sugar beet diseases early, achieving a maximum accuracy of 97% [
23]. Shantkumari et al. adopted an improved CNN classification model (CNNC) and K-Nearest Neighbor (IKNN) method to classify grape diseases on the Plant-Village dataset, improving classification accuracy and comparing models [
24]. Dwivedi et al. proposed a grape disease detection network (GLDDN) based on multi-task learning and attention mechanisms, utilizing dual attention for feature extraction and achieving efficient disease classification [
25].
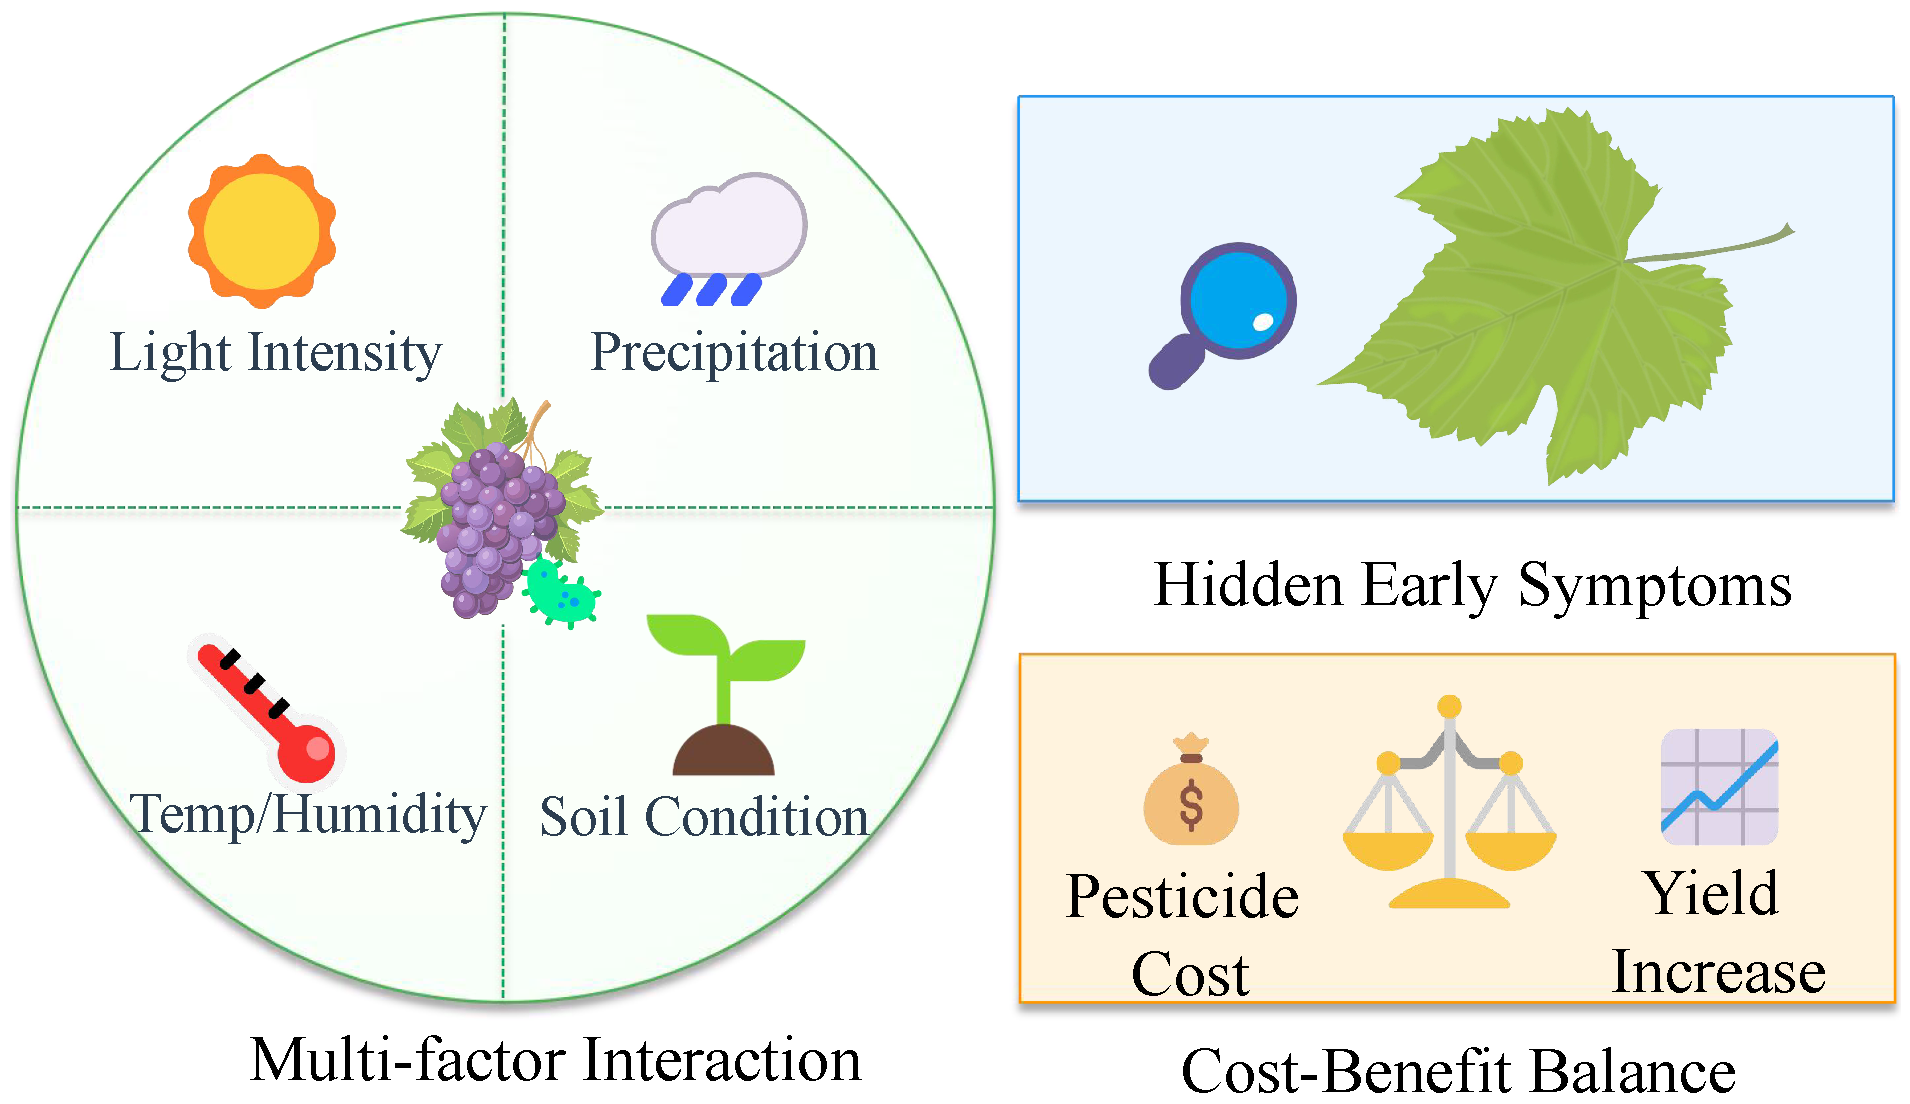
As shown in
Figure 1, the technological implementation of grape disease prediction, monitoring, and prevention encounters multiple challenges. First, disease occurrence patterns are influenced by complex and dynamic environmental factors, with varying sensitivities across different diseases. For instance, even minor fluctuations in temperature or humidity can significantly increase the risk of downy mildew outbreaks, making precise prediction extremely challenging [
26]. The adaptability of powdery mildew to diverse meteorological conditions complicates the capture of its long-term patterns. Additionally, early symptoms of grape diseases often manifest as subtle color changes or morphological features, which are highly similar among different diseases [
27]. For example, early symptoms of gray mold during the flowering stage include slight discoloration of inflorescences or faint grayish mold on the fruit surface, which can be easily confused with other diseases. Similarly, early discoloration of anthracnose-affected fruits closely resembles the symptoms of downy mildew, and existing monitoring systems struggle to differentiate these subtle variations [
28]. Furthermore, the formulation of disease control strategies must balance multiple constraints, including the precise timing of interventions, the varying requirements of different vineyard plots and grape varieties, and the trade-offs between effectiveness, cost control, and environmental impact [
29]. These factors impose higher demands on predictive models for multidimensional data fusion, monitoring systems for multimodal data analysis, and intelligent optimization strategies for disease control [
30].
To address these challenges, this study proposes a Transformer-based multimodal fusion framework, integrating RGB images, hyperspectral data, and environmental sensor readings, to enhance disease detection accuracy and robustness. The following innovative solutions are proposed:
- 1.
A temporal Transformer-based grape disease detection framework is proposed, integrating spatial and sequential feature learning to enhance disease identification accuracy and robustness.
- 2.
A memory-gated forgetting mechanism is introduced to dynamically balance historical and recent disease data, improving adaptability to evolving disease patterns.
- 3.
An image-to-text agricultural interpretation module is developed, generating expert-driven explanations for detected diseases, facilitating intelligent decision-making in precision viticulture.
- 4.
The proposed method outperforms other models for grape disease detection.
The structure of this paper is organized as follows:
Section 1 presents the research background, innovations, and contributions.
Section 2 describes dataset construction and model design.
Section 3 analyzes the experimental results. Finally,
Section 4 summarizes the findings and discusses future research directions.
2. Materials and Methods
2.1. Materials Acquisition
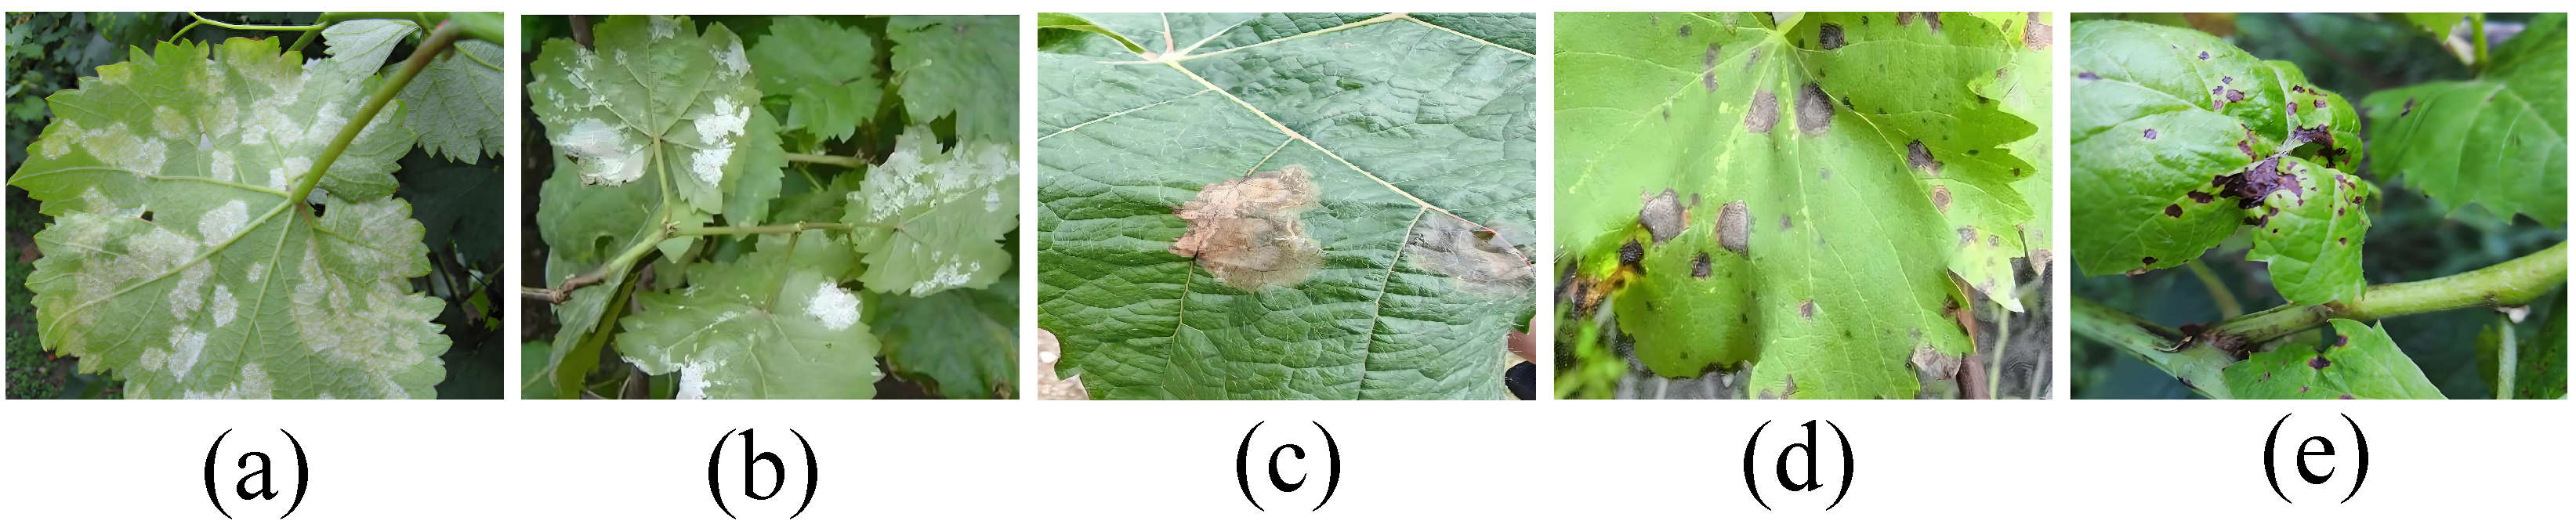
The research area for grape disease analysis is located in Linhe District, Bayannur City, Inner Mongolia, China, with data collection conducted from April to September 2024. To ensure diversity and representativeness, multiple vineyards were selected, focusing on five common grape diseases: downy mildew, powdery mildew, gray mold, anthracnose, and spot anthracnose, as shown in
Figure 2, resulting in 3676 RGB and 6297 hyperspectral data in total. For each disease, 500 to 1000 RGB images and 1000 to 1500 hyperspectral data were collected, ensuring broad coverage, as shown in
Table 1.
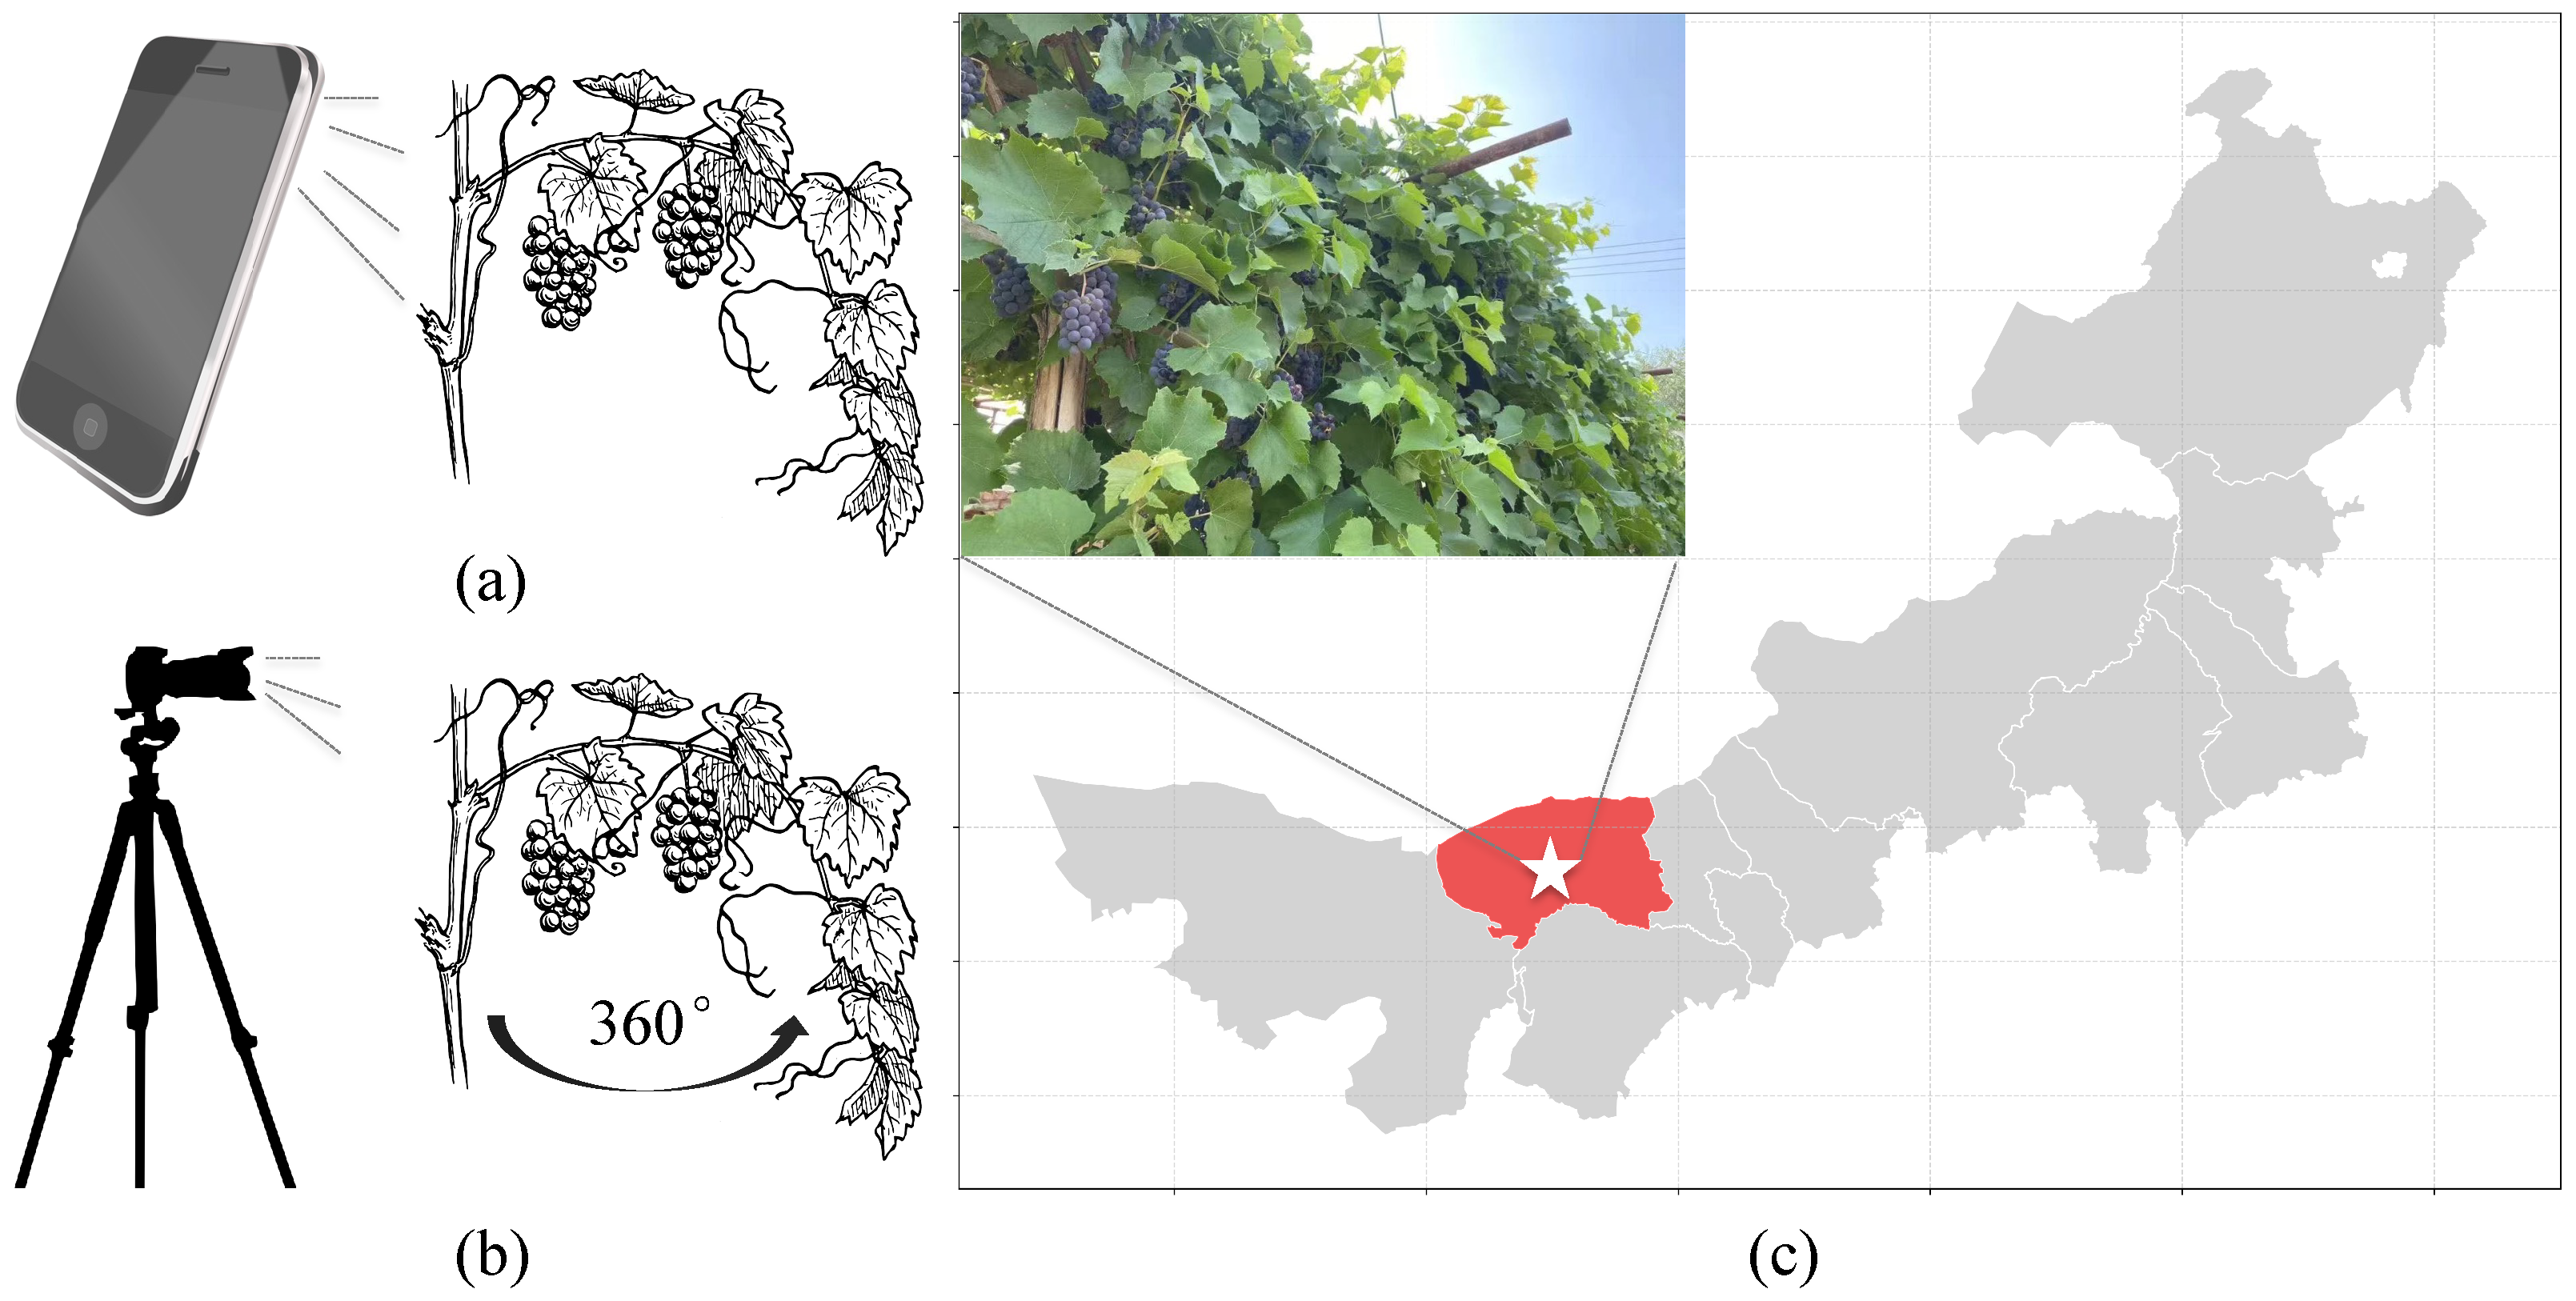
Due to the high planting density of grapevines, a combination of smartphones and high-resolution cameras was utilized for data acquisition to maintain flexibility. The primary smartphone models used were the Huawei P50 Pro (Huawei, Shenzhen, China) and iPhone 13 Pro Max (Apple Inc., Cupertino, CA, USA), both equipped with high-resolution cameras capable of capturing fine image details. Additionally, Sony Alpha 7R IV (Sony Corporation, Tokyo, Japan) and Canon EOS 5D Mark IV (Canon Inc., Tokyo, Japan) cameras were employed to ensure high-precision data acquisition. The data collection process adhered to standardized procedures. During data acquisition, both smartphones and cameras were mounted on portable tripods or handheld stabilizers to reduce motion blur and ensure stable shooting angles. The cameras were positioned at heights ranging from 50 cm to 80 cm, oriented perpendicularly to the diseased areas to capture clear feature details. For densely planted grapevines, smartphones were handheld close to the leaves and fruits to ensure full coverage of disease regions, as shown in
Figure 3. To ensure spatial consistency between RGB and hyperspectral data, all image acquisition was performed using a fixed setup, maintaining identical FOVs for both sensors and capturing images at a standardized distance of 50 cm. Additionally, a Scale-Invariant Feature Transform (SIFT) algorithm was applied for sub-pixel alignment to eliminate parallax errors caused by differences in sensor characteristics. Bilinear interpolation was performed on RGB images to match the spatial resolution of hyperspectral data, ensuring effective spatial fusion during feature extraction. Through this alignment strategy, high-precision spatial matching between RGB and hyperspectral data was achieved, providing reliable input for subsequent multimodal fusion and disease detection tasks.
Each disease target was photographed from the front, side, and under different lighting conditions, with exposure compensation adjustments to accommodate varying lighting environments and prevent overexposure or underexposure from affecting feature visibility. Additionally, close-up shots were taken for subtle symptoms that may appear in early disease stages, enhancing the model’s capability to identify different disease development stages. The characteristics of the five diseases vary significantly. Downy mildew is primarily manifested as yellow-brown lesions on the undersides of leaves, gradually expanding to form a moldy layer, and spreads rapidly under humid conditions. Powdery mildew mainly appears as white powdery fungal growth on leaves and fruits, leading to leaf deformation and reduced fruit quality. Gray mold commonly affects grape fruits and leaves, appearing as gray fungal layers, and can cause severe fruit rot. Anthracnose primarily infects fruits, forming black concave lesions that significantly reduce commercial value. Black rot manifests as black spots on leaves and branches, eventually leading to leaf desiccation and stem necrosis. To ensure data quality, all images were subjected to an initial screening process, with blurry, overexposed, or underexposed images being discarded. Standard color calibration cards were used to minimize variations caused by different devices and lighting conditions.
In this study, in addition to image and hyperspectral data, various environmental sensor data were collected to enhance the adaptability of the disease detection model to external environmental factors and improve the accuracy of modeling disease occurrence trends. Environmental sensor data were recorded using a DHT22 sensor (Aosong Electronics Co., Ltd., Guangzhou, China) (temperature and humidity monitoring), an LDR sensor (light intensity monitoring), and a CO2 sensor (gas concentration monitoring), with readings taken every 5 min. Additionally, all sensors underwent multi-point calibration to minimize systematic errors and enhance measurement reliability. Calibration procedures included normalization of hyperspectral imaging using an 80 mm diameter white reference panel, as well as white balance and black balance corrections for RGB imaging, ensuring the minimization of equipment-induced variations in data quality. The collected sensor data primarily include meteorological parameters, soil properties, and key physical variables of the plant growth environment. The purpose of this data acquisition is to comprehensively characterize the occurrence and progression of plant diseases and their dynamic relationship with environmental conditions. Meteorological data include temperature, humidity, rainfall, wind speed, and light intensity, which provide critical insights into the external conditions influencing disease outbreaks. Soil-related data encompass moisture content, pH value, electrical conductivity, and nutrient levels, facilitating the assessment of soil conditions and their impact on plant health and disease development. Additionally, plant growth state data, such as leaf temperature, transpiration rate, and carbon dioxide concentration, were monitored to analyze the effects of plant diseases on metabolic processes and photosynthetic efficiency. All data were collected synchronously using a wireless acquisition system and integrated with hyperspectral and image data to construct a multimodal disease prediction model. This integration significantly enhances the accuracy of disease detection and provides valuable data support for precision agricultural disease management.
2.2. Dataset Construction
2.2.1. Data Annotation
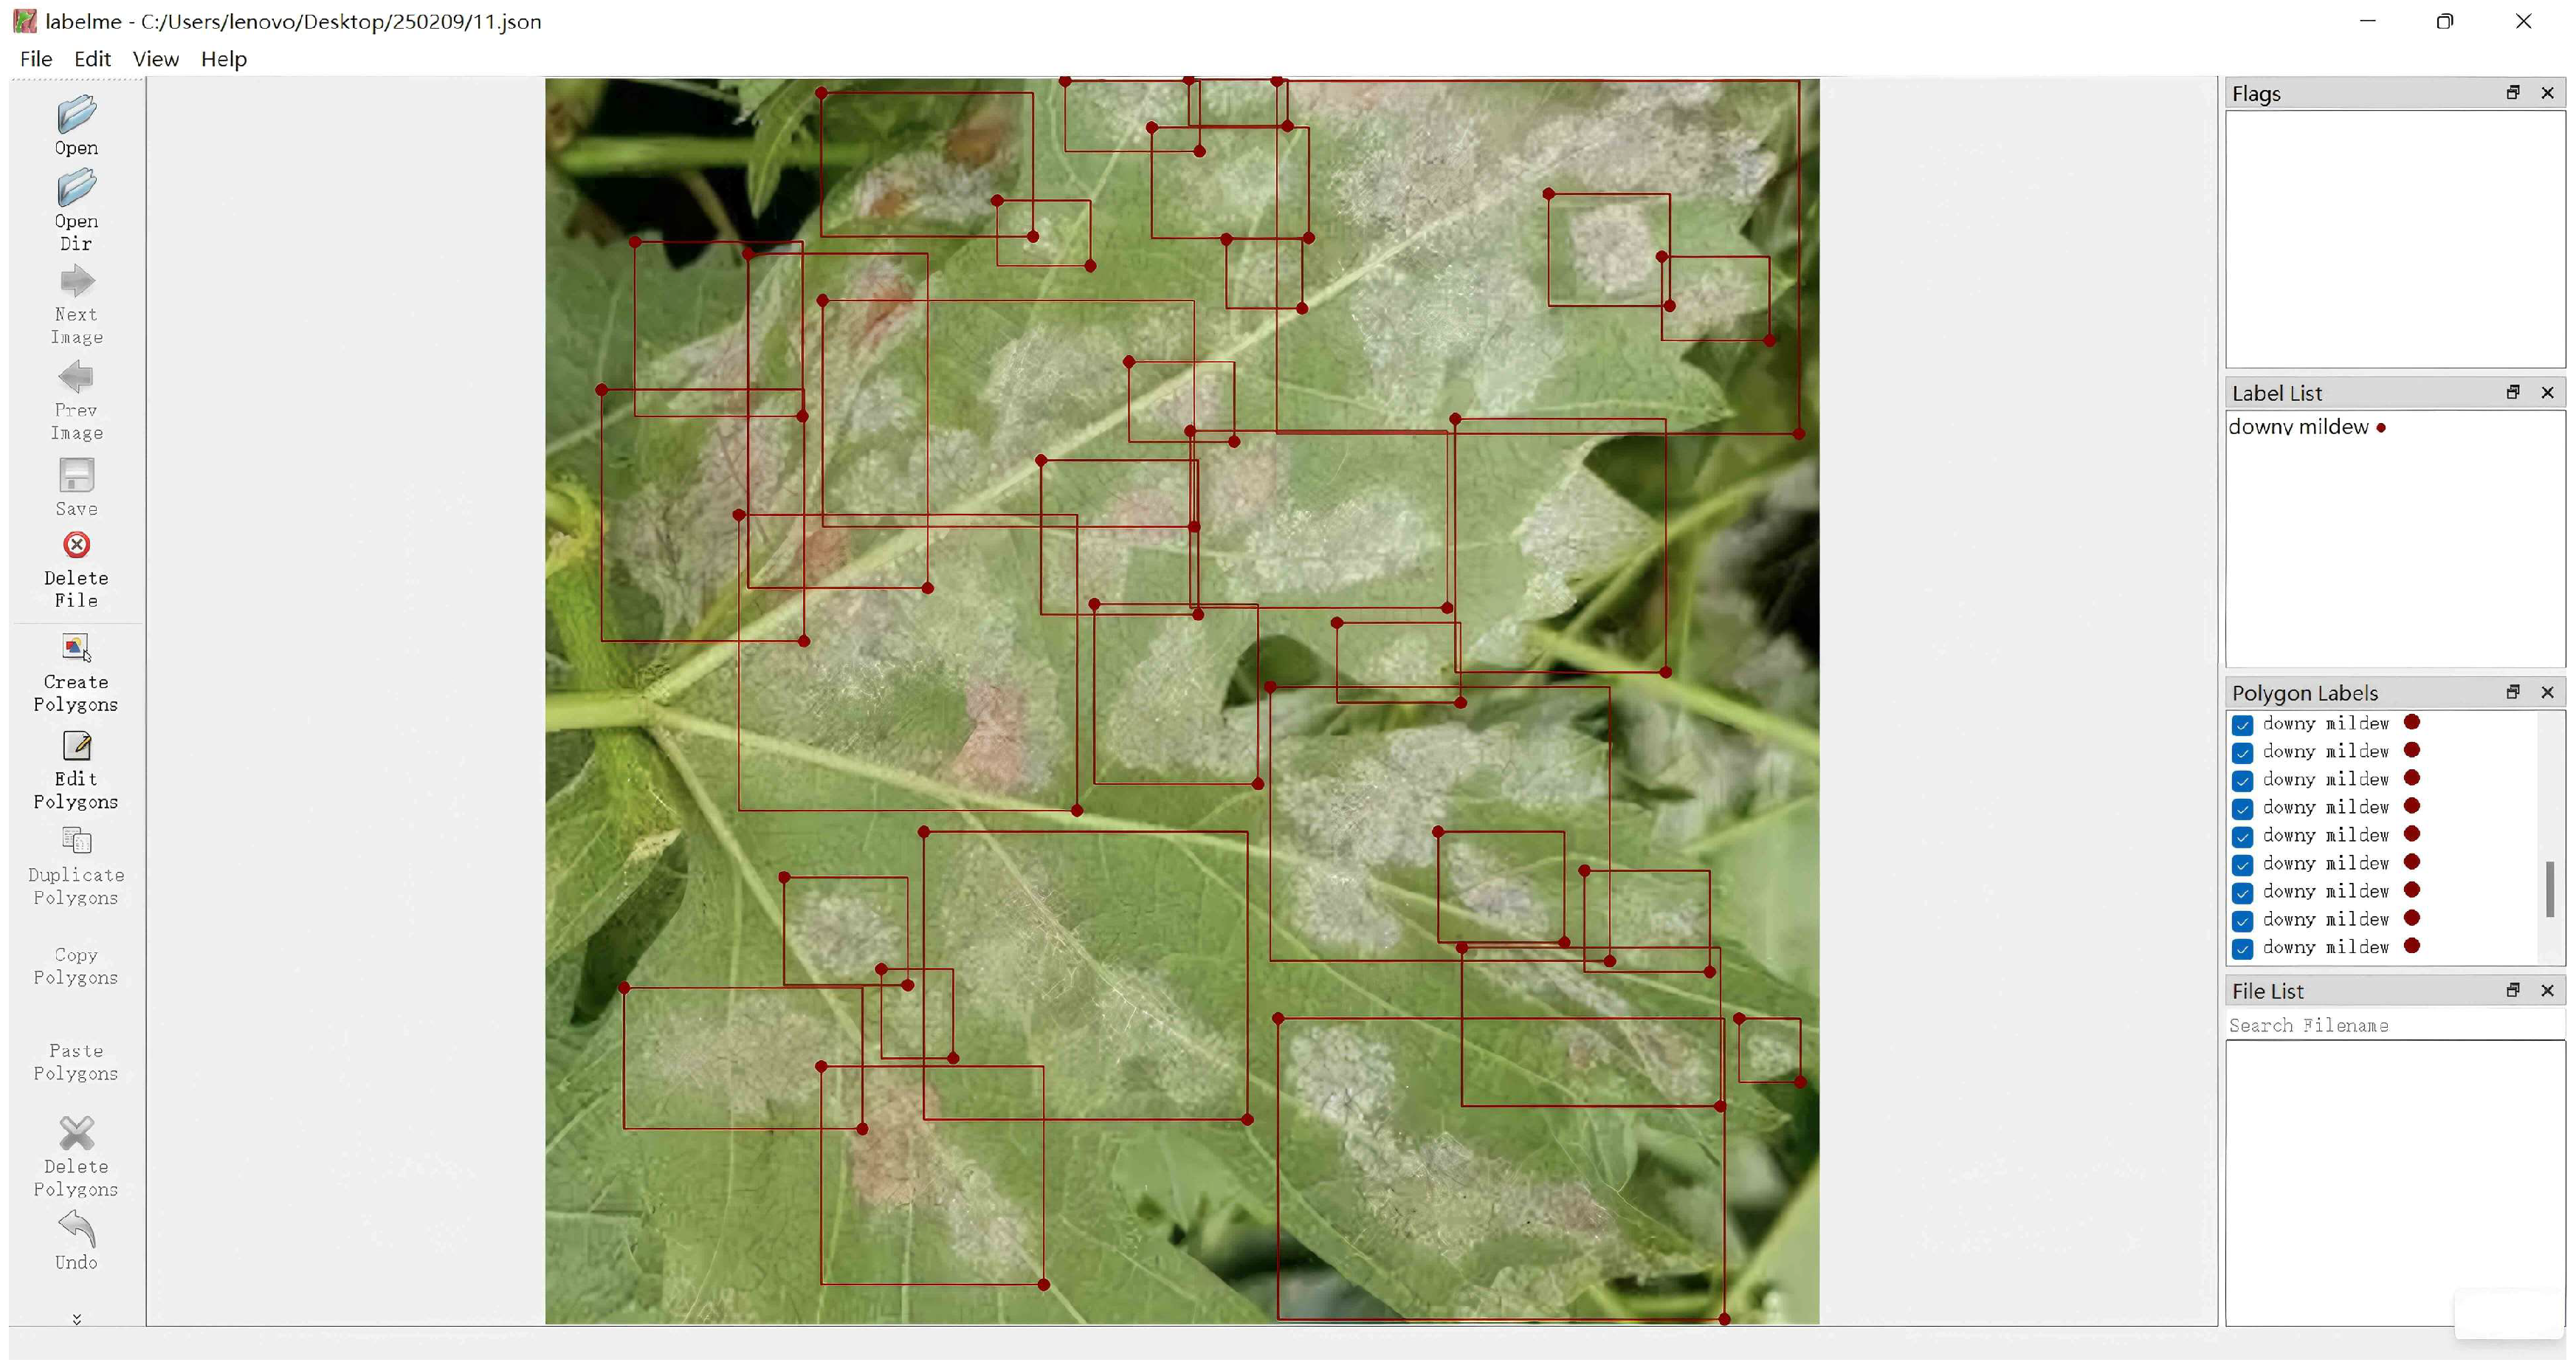
During the data annotation process, a fully manual labeling approach was adopted to ensure precise identification of disease-affected areas. All images were manually segmented using the LabelMe(4.5.7) [
31] annotation tool, adhering to a standardized annotation guideline to maintain accuracy. Plant diseases often manifest in irregular shapes and may exhibit fuzzy or gradual boundaries in early stages, making automated segmentation methods, such as threshold-based or deep-learning-based approaches, less effective. Thus, manual annotation was chosen to ensure high-quality data. LabelMe enables precise delineation of diseased areas through polygonal annotations. To maintain consistency, all annotations were performed by individuals with a background in plant pathology and were further reviewed by experts to ensure accuracy and reliability. A multi-tier annotation structure was implemented, where disease-affected areas in each image were outlined with polygonal contours and assigned specific class labels, including downy mildew, powdery mildew, gray mold, anthracnose, and black rot, as shown in
Figure 4.
To maintain annotation quality, each image underwent a multi-step verification process. The first round of annotation was conducted by initial annotators, followed by a secondary review by another group of annotators to ensure complete coverage and accurate boundary delineation. A cross-validation mechanism was employed, wherein different annotators reviewed and refined each other’s annotations to mitigate subjectivity and minimize errors. Environmental background factors were also considered in the annotation process. In dense vine canopies, where disease-affected regions were partially obscured, additional annotations under varying lighting conditions were conducted to enhance the model’s ability to recognize diseases in complex backgrounds. Furthermore, for mild or inconspicuous symptoms, detailed segmentation was performed to ensure even the slightest disease features were accurately labeled, thereby improving the model’s ability to detect early-stage diseases. All annotated data were ultimately stored in the COCO format to facilitate training across various deep learning frameworks. The data annotation process in this study was conducted by graduate students specializing in plant protection, ensuring professional knowledge in plant disease identification. Each annotated sample underwent a two-round validation process, with discrepancies resolved based on expert opinions. To maintain data consistency, a standardized annotation protocol was followed, and all annotations were performed using dedicated annotation tools.
2.2.2. Data Augmentation
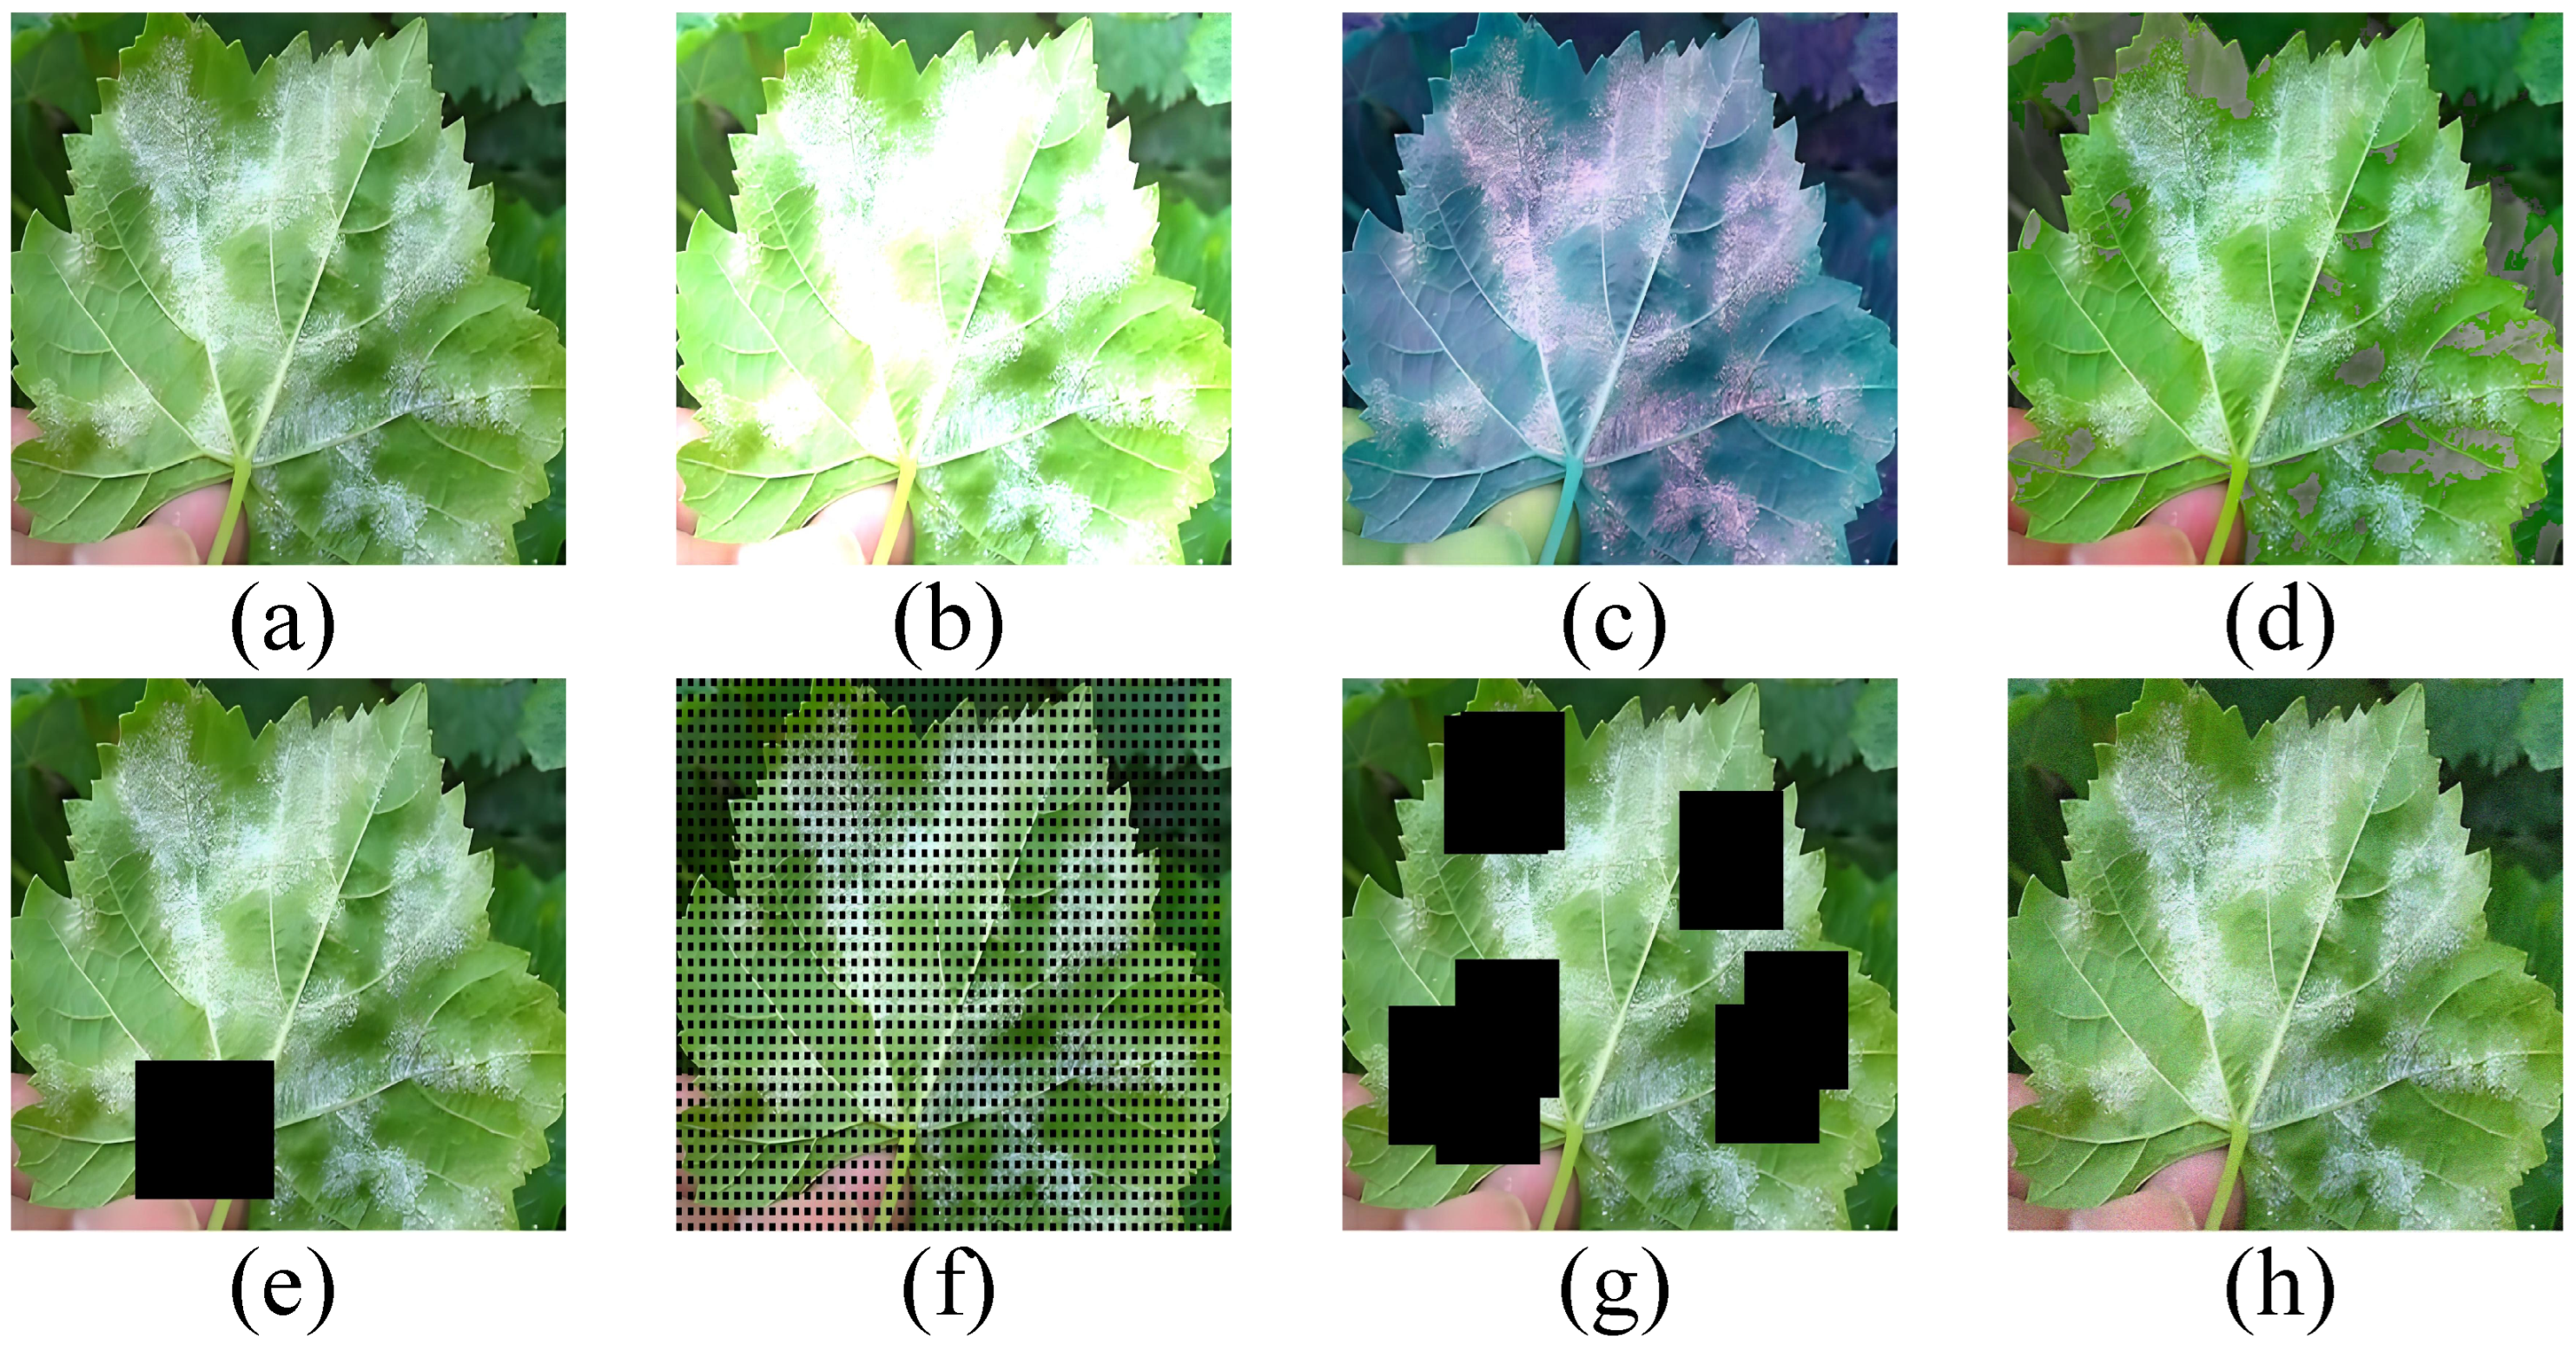
During data augmentation, multiple image enhancement techniques were applied to improve model robustness and enhance recognition capability under varying lighting conditions, occlusions, and noise disturbances, as shown in
Figure 5.
Brightness adjustment was utilized as a fundamental augmentation method, via increasing or decreasing overall image brightness to enable the model to recognize disease features under different lighting conditions. In high-intensity light environments, certain disease-affected areas may become overexposed, causing loss of detail, whereas in low-light conditions, disease symptoms may be difficult to discern. Hue adjustment was applied to simulate color deviations caused by different imaging devices or ambient lighting conditions. Since environmental light variations may alter image hue during data collection, adjusting hue appropriately improves the model’s generalization ability, ensuring robustness to different color shifts. Saturation adjustment was also employed to enhance adaptability in complex environments. By increasing or decreasing color saturation, disease-affected regions remained distinguishable under different color conditions. Random-Erase was applied to randomly remove portions of an image, compelling the model to make accurate predictions even when certain information is missing. GridMask introduced structured occlusion by overlaying a regular grid pattern on images, forcing the model to focus on various disease features rather than relying on specific image regions. Hide-and-Seek (HaS) randomly occluded small portions of an image, training the model to extract more comprehensive feature representations, thereby improving disease recognition in complex backgrounds. Additionally, Gaussian noise was incorporated to simulate distortions from different imaging devices and transmission processes. The introduction of Gaussian noise enhanced the model’s robustness against low-quality image conditions, ensuring reliable disease recognition even in noisy environments. This method was particularly useful for low-light conditions, which often introduce significant noise artifacts. By integrating these data augmentation techniques, the model’s ability to generalize across diverse environments was significantly improved, ensuring consistent performance in varying lighting, occlusion, and noise conditions. These augmentation strategies collectively enhanced the model’s stability and accuracy in grape disease detection, ultimately contributing to improved practical applicability. During model training, data augmentation strategies were applied to enhance model generalization. Specifically, the augmentation techniques used included random rotation (–), horizontal and vertical flipping, random brightness adjustment (range [0.8, 1.2]), and CutMix to increase sample diversity. These augmentations were divided into offline preprocessing and on-the-fly augmentation, where basic geometric transformations (rotation, flipping) were applied before training, while brightness adjustment and CutMix were dynamically performed during training to ensure variability in input data. Additionally, the AdamW optimizer was used with an initial learning rate of , and a cosine annealing scheduling strategy was applied to adjust the learning rate dynamically, enhancing training stability and preventing convergence to local optima. In real-world scenarios, non-disease factors such as bird droppings, dust, and water stains can introduce noise into disease detection models. To improve model robustness, images containing such artifacts were specifically collected during the data acquisition phase and included in the training dataset. Additionally, data augmentation techniques, such as random morphological transformations and color perturbations, were applied to simulate variations in these non-disease factors. The proposed method also integrates hyperspectral data to analyze the spectral reflectance characteristics of disease regions and utilizes self-attention mechanisms to model spatial patterns of disease symptoms, effectively reducing misclassification. Experimental results demonstrate that the proposed approach achieves high accuracy in distinguishing diseases from bird droppings and other non-disease artifacts.
Let the dataset
be composed of RGB images, hyperspectral data, and environmental sensor data:
where
represents the RGB image for sample
i,
denotes the corresponding hyperspectral data with
spectral channels, and
represents the environmental sensor data with
D measurement dimensions (e.g., temperature, humidity). All data are temporally aligned to ensure that samples captured at the same timestamp are used as the Transformer input. Moreover, denoting
,
, and
as the complete sets of RGB, hyperspectral, and environmental data in the dataset, the overall input structure can be expressed as:
This organization ensures the spatiotemporal consistency of multimodal data, facilitating effective cross-modal feature learning within the Transformer model.
2.3. Proposed Method
The proposed disease detection method consists of multiple modules, including a transformer-based lesion detection network, a temporal forgetting-enhancement module, a multi-source data fusion module, and a lesion-agricultural explanation generation module, as shown in
Figure 6.
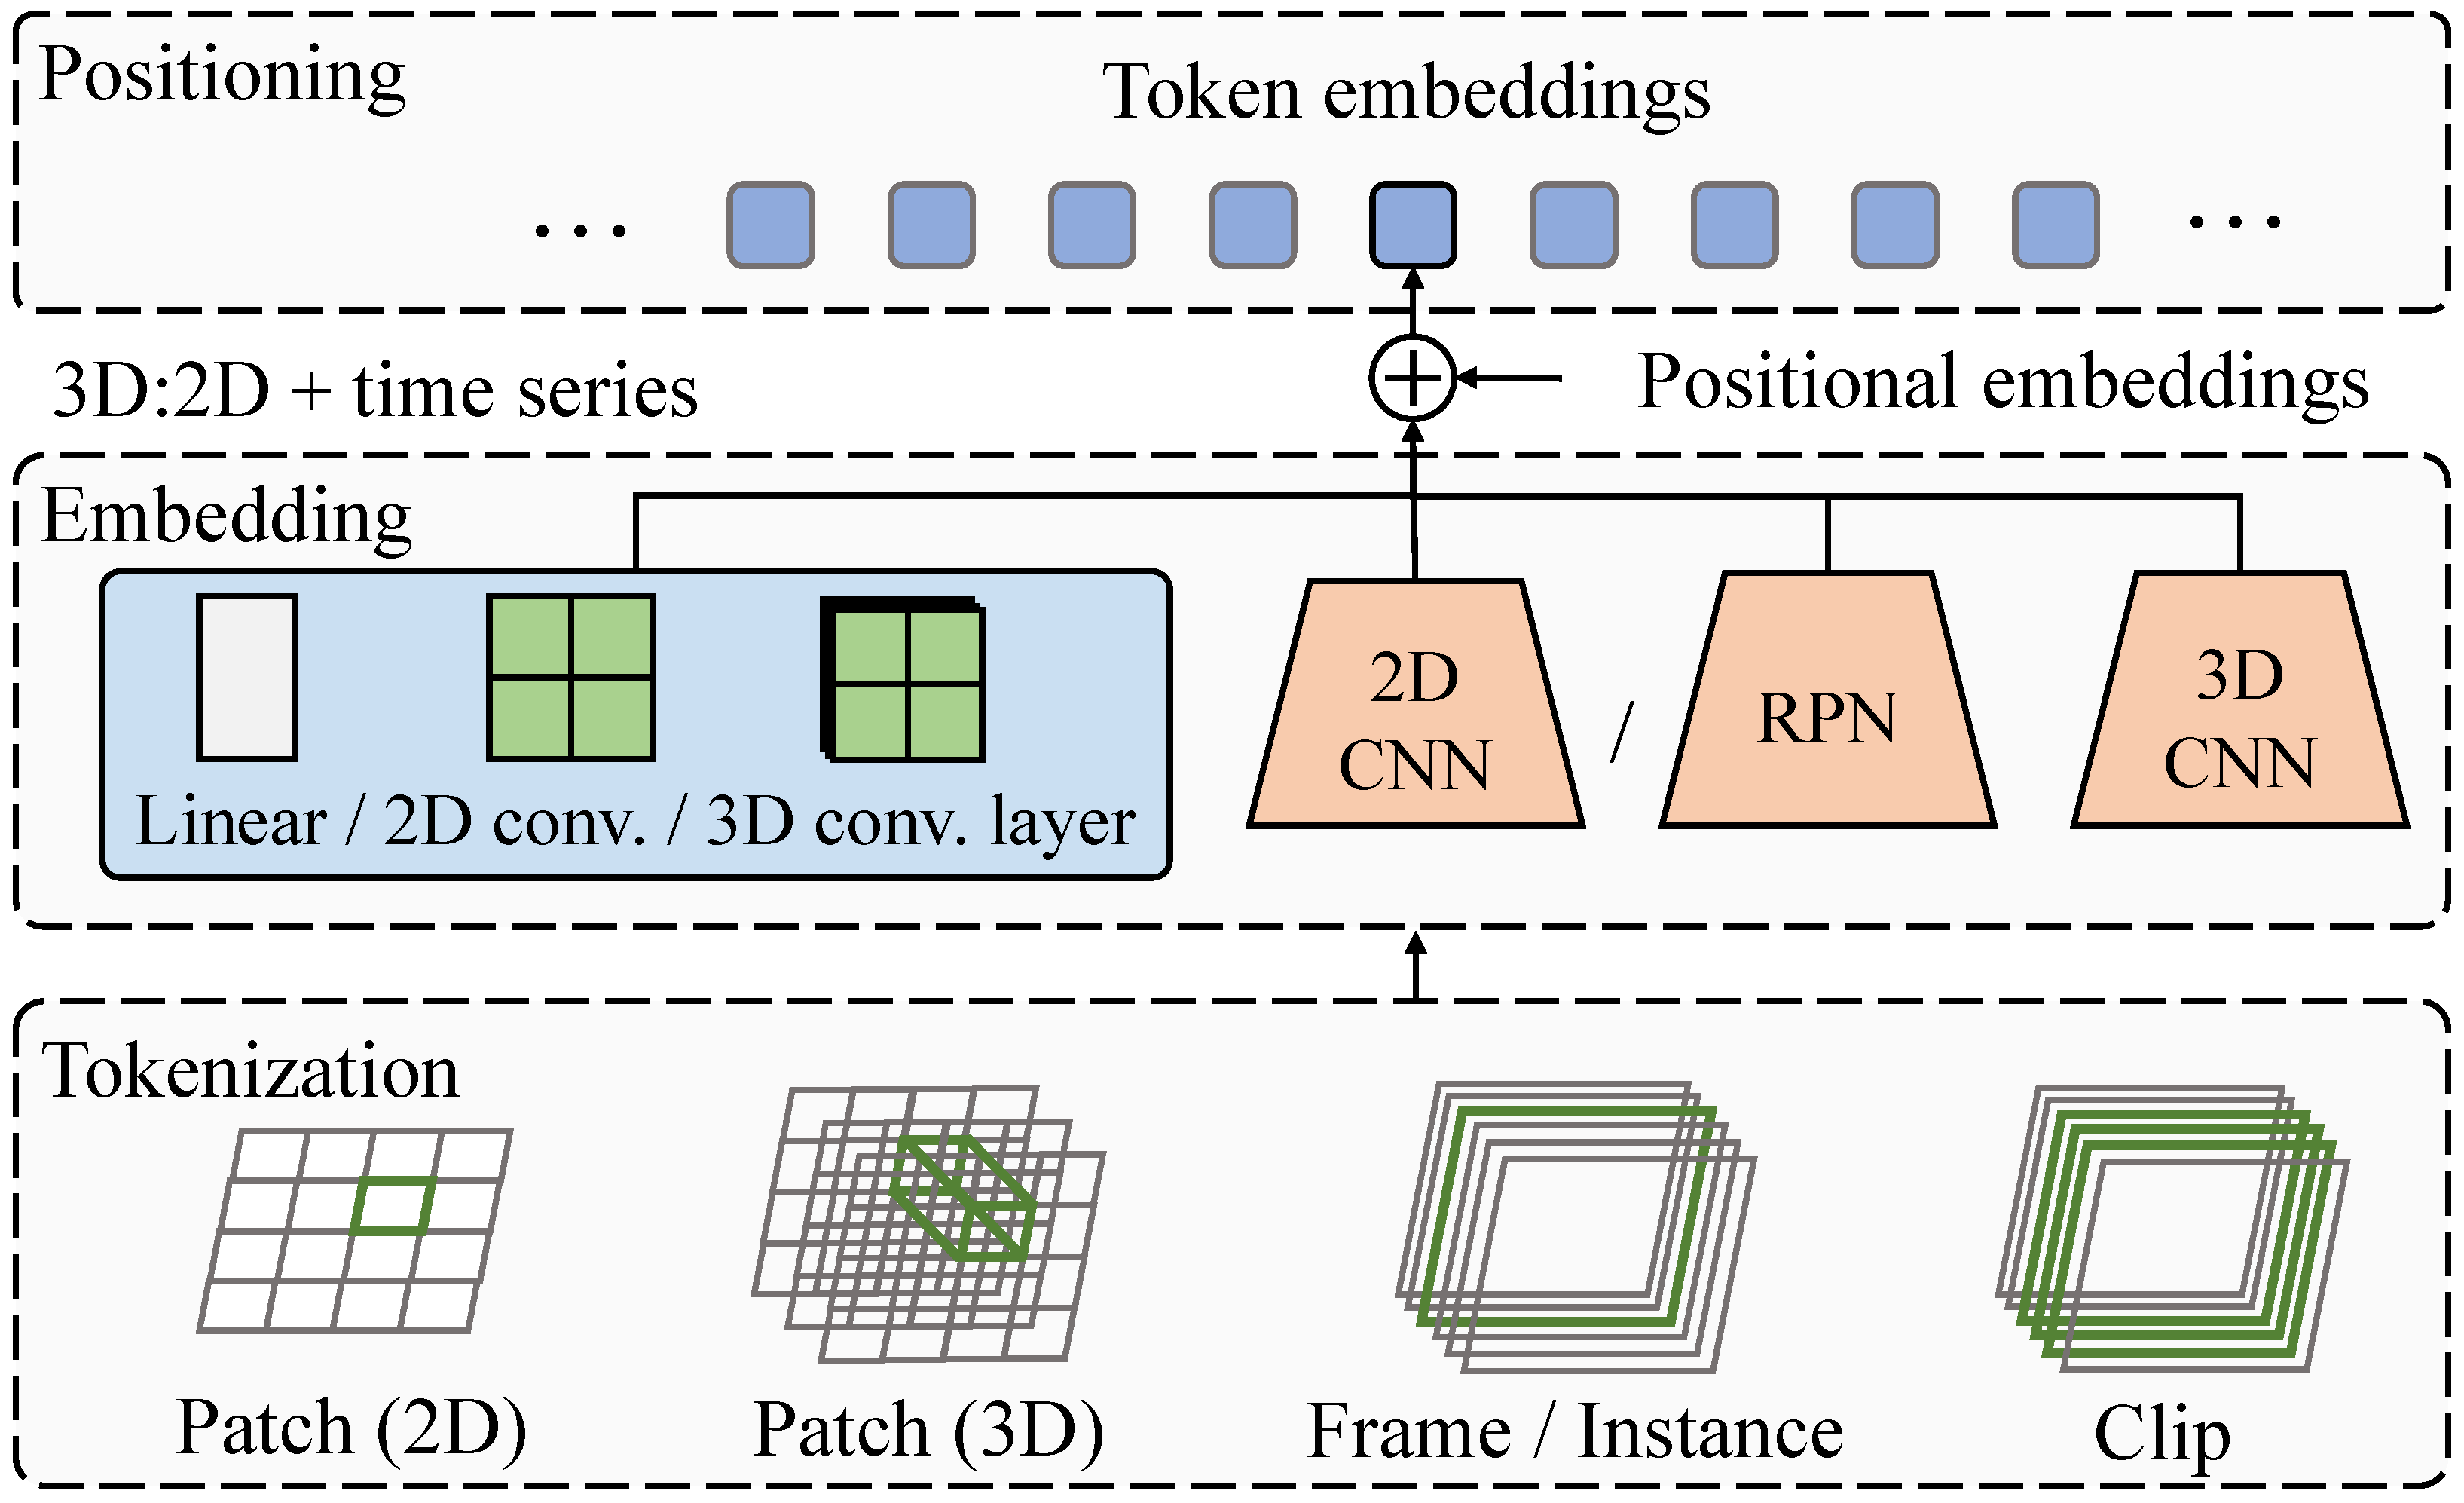
The overall processing flow of the model is as follows: first, input data undergo feature encoding and transformation, followed by deep feature extraction in the transformer network. Subsequently, the temporal forgetting-enhancement module dynamically adjusts historical data, and the multi-source data fusion module integrates hyperspectral and sensor data. Finally, the lesion-agricultural explanation generation module performs interpretability analysis and generates textual outputs. The model’s input comprises multi-source data, including RGB images, hyperspectral images, and environmental sensor data. Initially, image data are encoded using linear transformations, 2D/3D convolution, or self-attention mechanisms, converting them into high-dimensional feature representations. A 2D CNN and a 3D CNN structure are employed to extract spatial and temporal information, respectively, while the transformer structure further models global dependencies to ensure precise lesion identification. During disease detection, the transformer-based lesion detection network first performs tokenization, partitioning the input image into fixed-size patches and projecting them into a high-dimensional space through linear transformation. Positional encoding is then incorporated to retain spatial and temporal information. The transformer encoder processes the input features using multi-head self-attention (MHSA) and a feedforward network (FFN). The resulting output features are subsequently fed into a region proposal network (RPN) for lesion region prediction, optimized using IoU loss. After detection, the temporal forgetting-enhancement module applies weighted fusion to the historical data of the same plant, enhancing recent lesion features while diminishing the influence of outdated information. Finally, the lesion-agricultural explanation generation module utilizes the detected lesion regions and an image-to-text model to generate natural language descriptions. These descriptions, enriched with expert-annotated information, automate the generation of disease reports. Through this workflow, the proposed method establishes a complete pipeline from disease detection to agricultural interpretation, improving detection accuracy, adaptability, and interpretability.
2.3.1. Transformer-Based Lesion Detection Network
The proposed lesion detection network is based on a transformer architecture to enhance the accuracy and robustness of grape lesion detection in complex environments. The network employs a dual-branch structure consisting of a spatial transformer encoder and a temporal transformer encoder to adapt to spatial variations and temporal evolution of lesions. Additionally, a patch merging mechanism is introduced to achieve multi-scale feature fusion, as shown in
Figure 7.
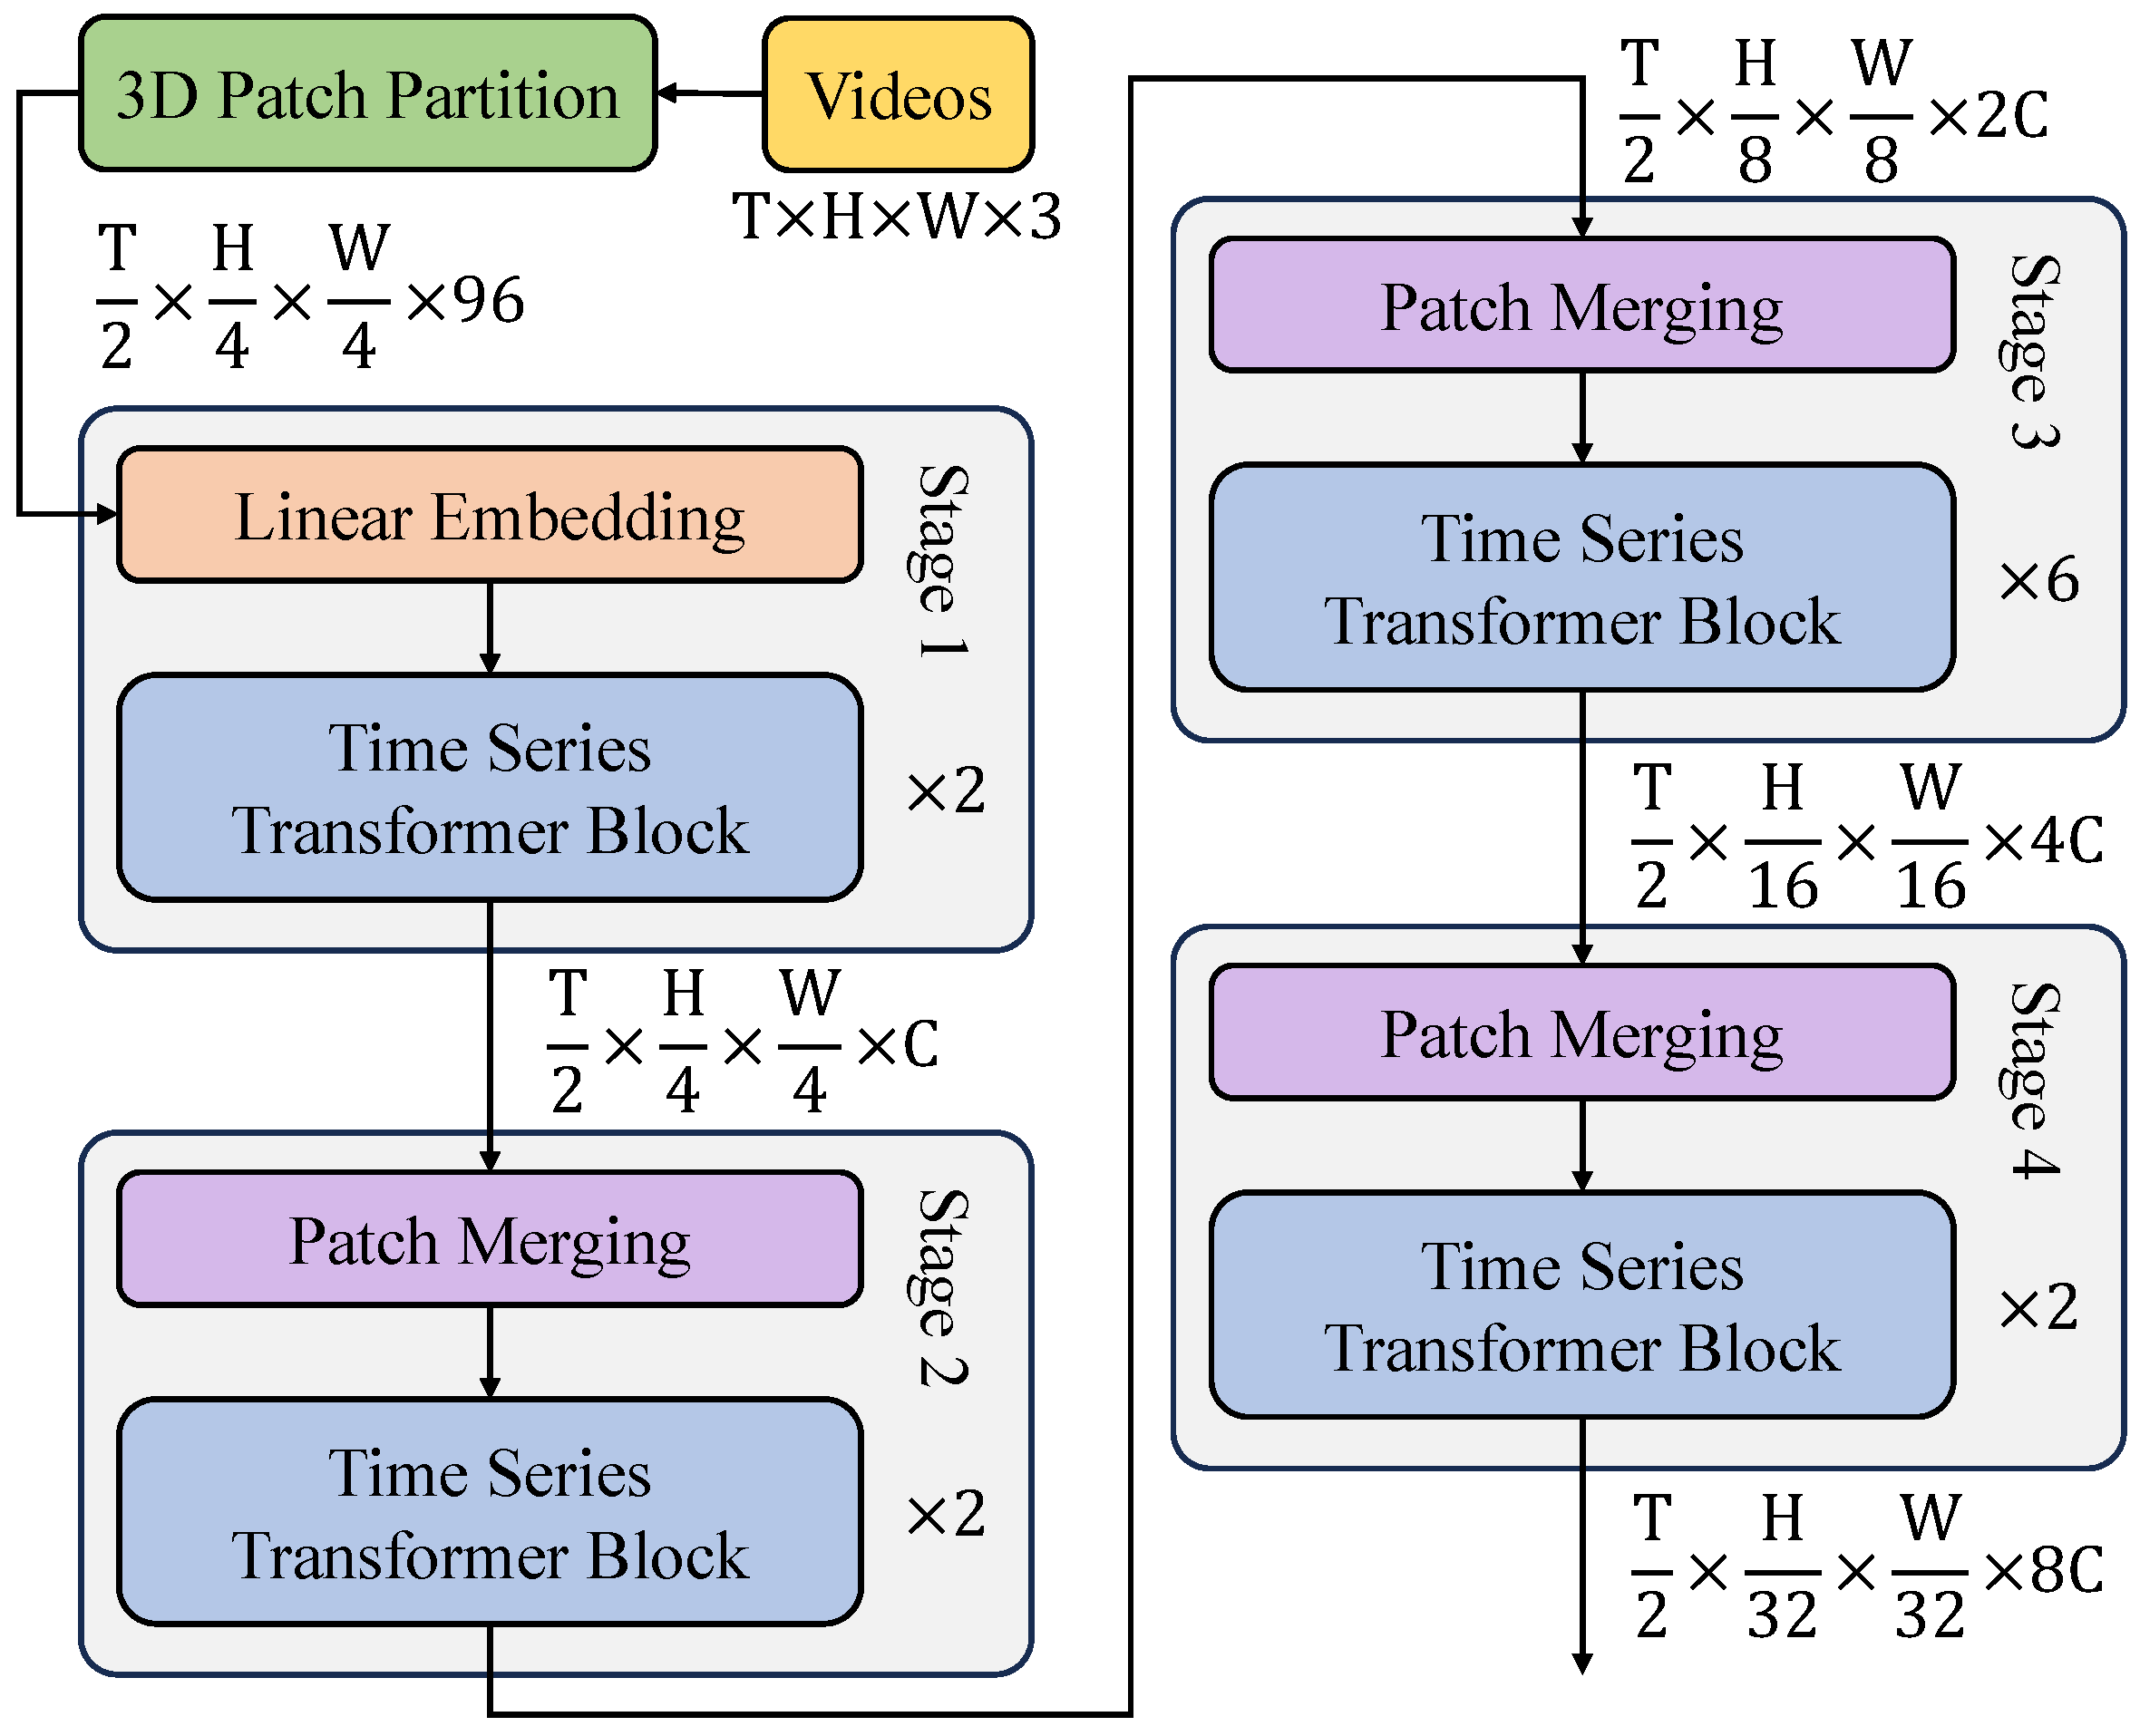
The overall architecture is designed to fully leverage the global self-attention mechanism, compensating for the limitations of traditional CNN-based feature extraction methods, thereby improving lesion detection accuracy and stability. In the data preprocessing stage, RGB images are partitioned into patches using a 3D patch partition module, where each patch undergoes linear transformation and is mapped into a high-dimensional feature space to form the initial feature representation. For an input image sequence
, it is first divided into patches of size
, where each patch is embedded into a
d-dimensional vector representation:
where
represents the linear transformation weight, and
denotes positional encoding, ensuring that the transformer can recognize local details while maintaining spatial relationships. In standard CNN networks, the receptive field is typically small, making it difficult to model global information. However, through the self-attention mechanism of the transformer, global lesion features can be effectively captured.
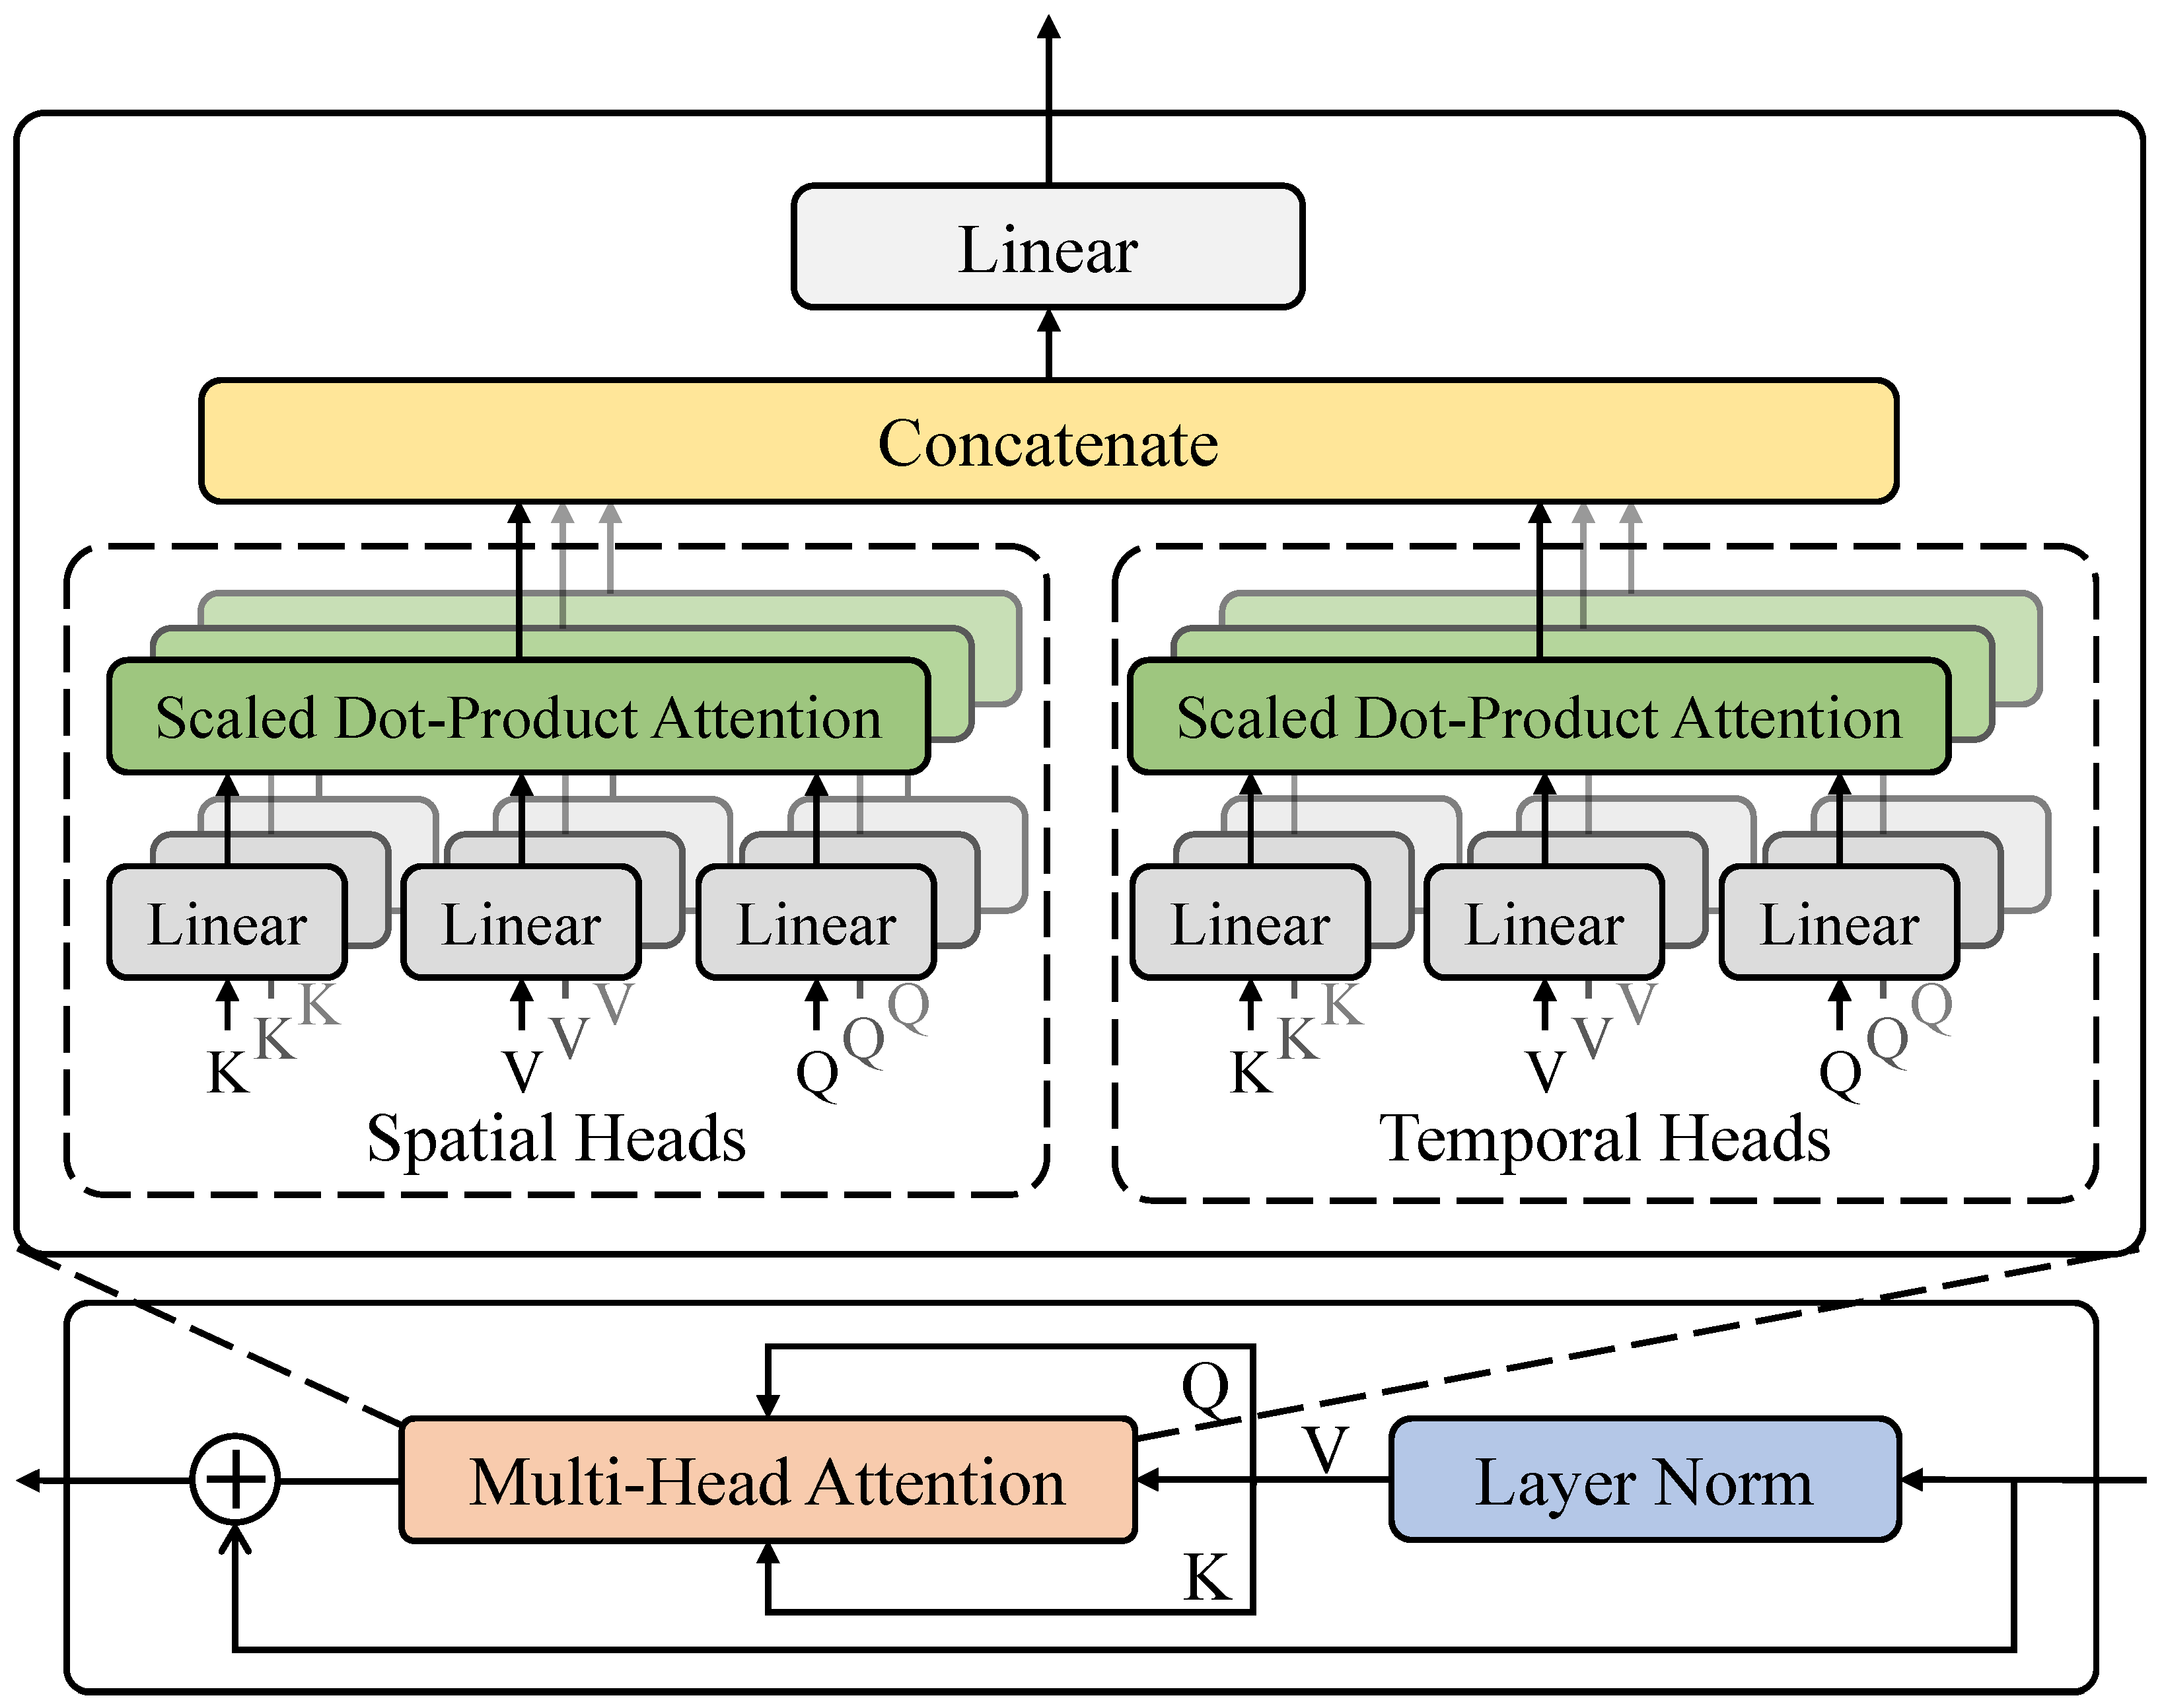
As shown in
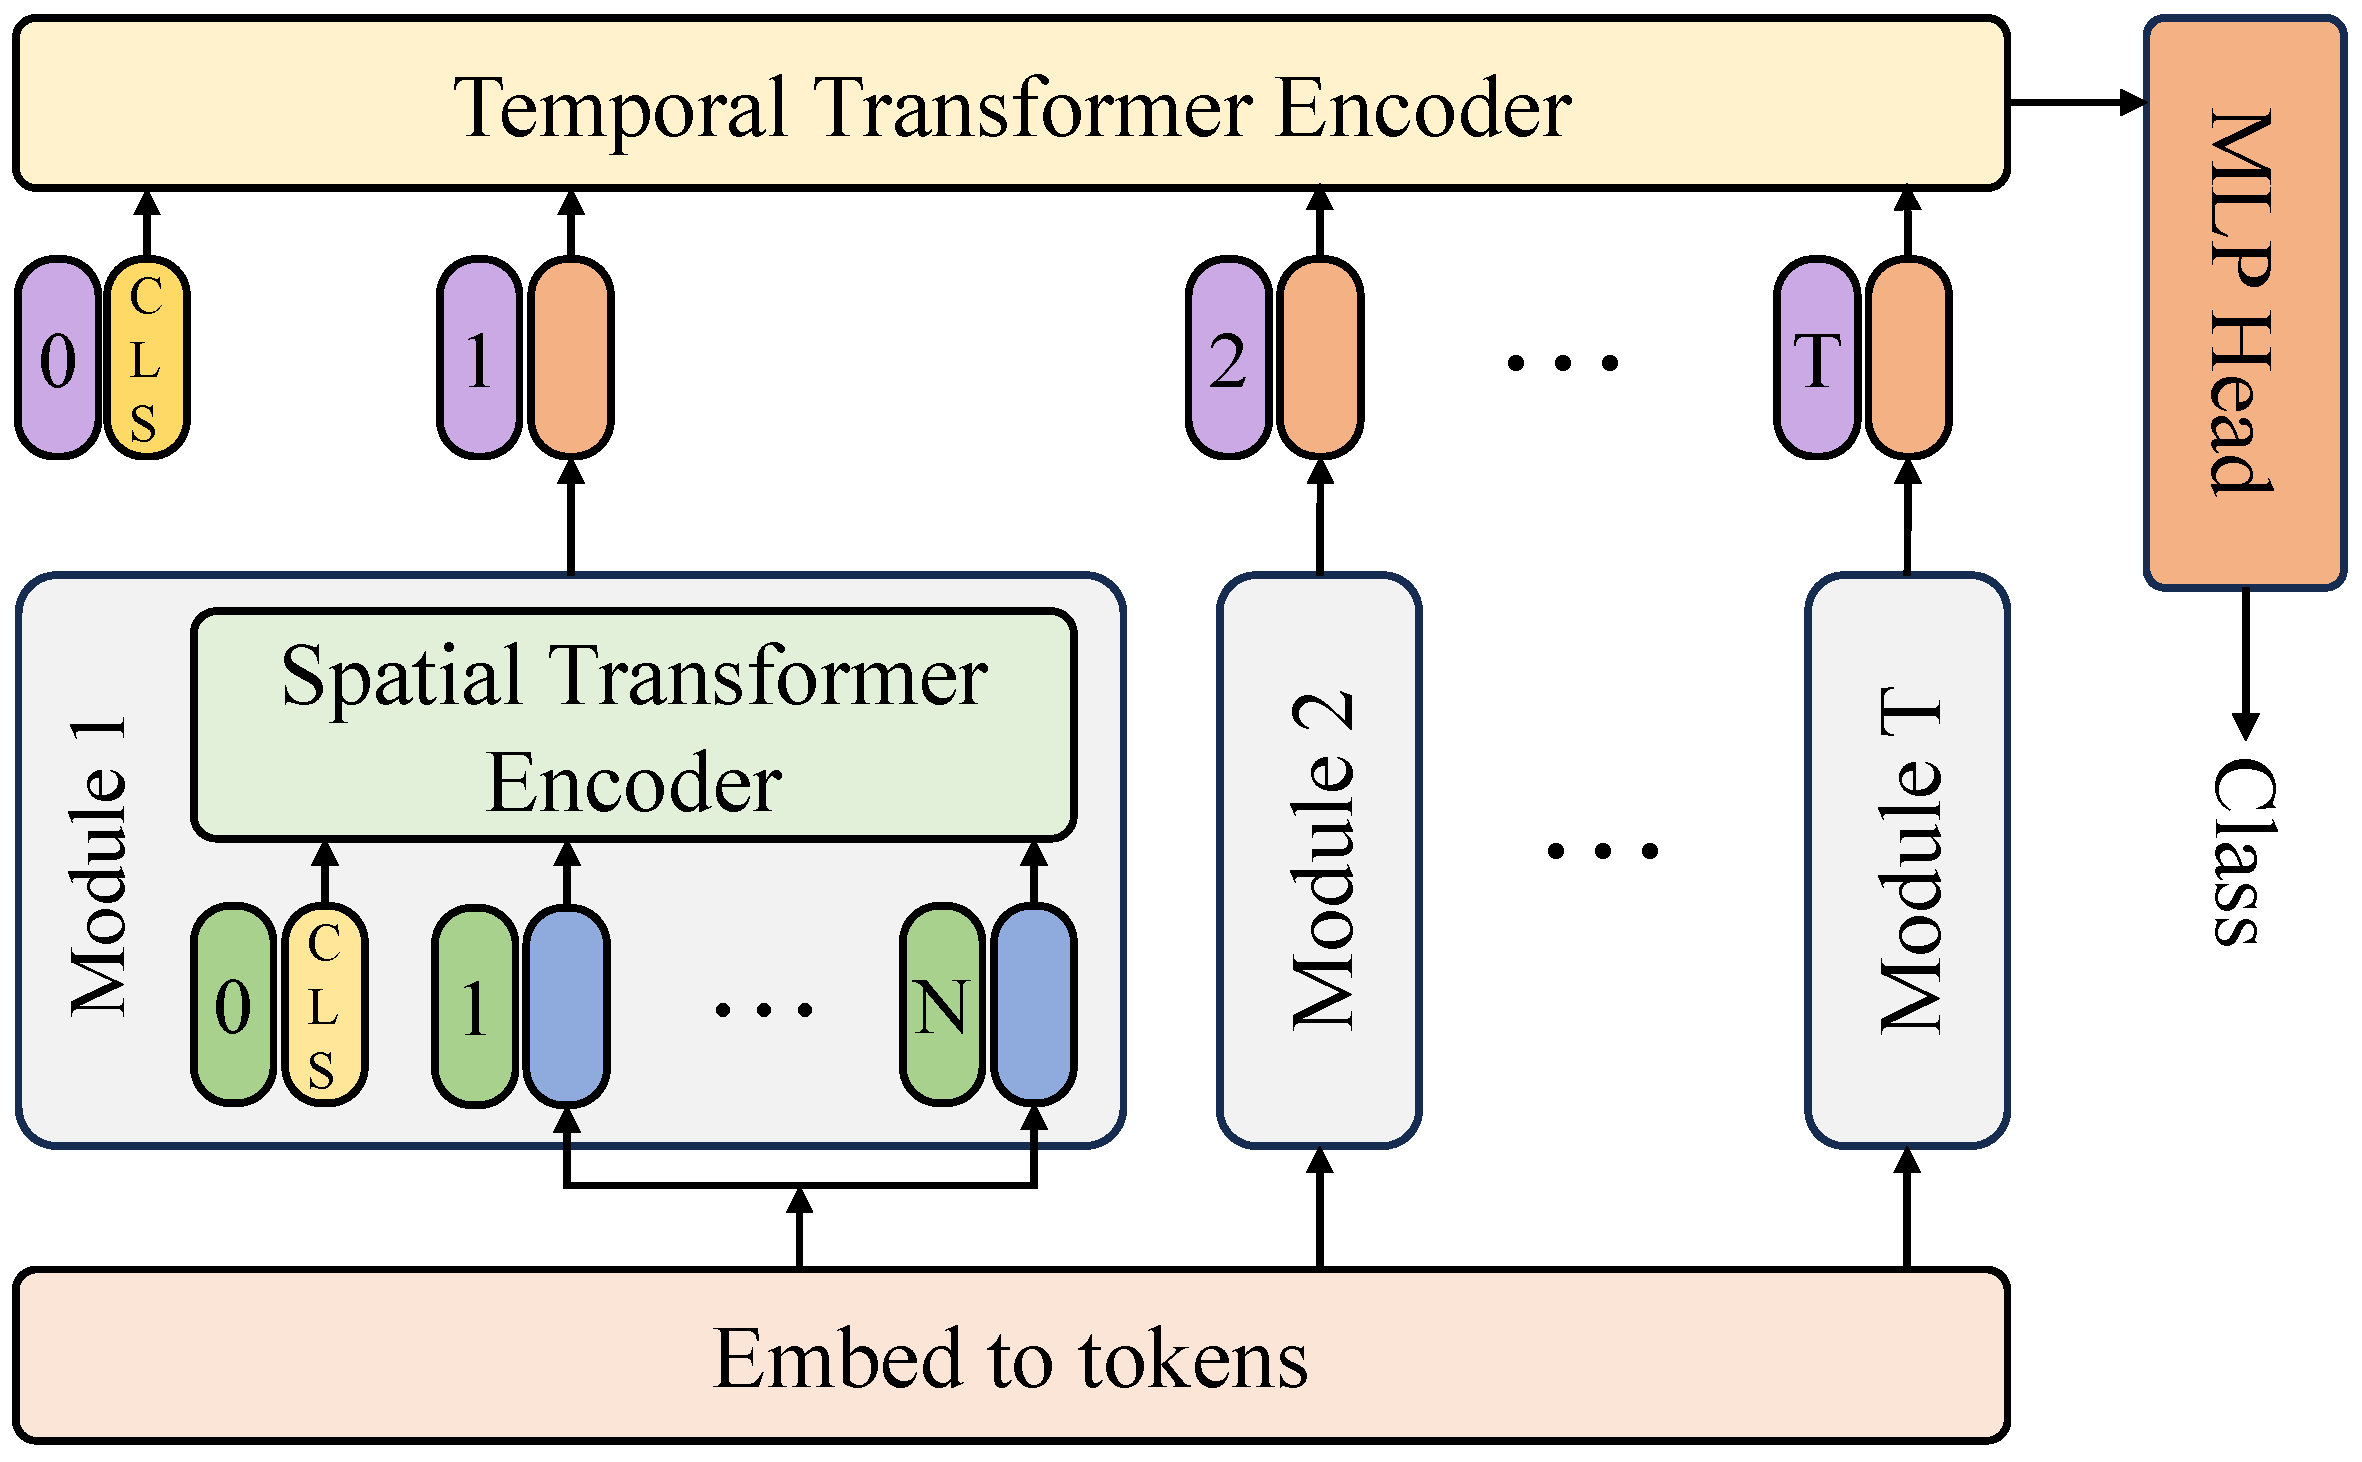
Figure 8, the spatial feature extraction module employs a spatial transformer encoder, which consists of multiple stacked transformer blocks, where each block contains MHSA, FFN, and layer normalization (LN). Within each transformer block, the self-attention of input features is first computed:
Then, deep features are further extracted through a feedforward neural network:
The MHSA mechanism calculates global dependencies among lesion regions, allowing the model to not only focus on local lesion areas but also learn lesion distribution patterns across the entire plant. Since different diseases may exhibit similar symptoms (e.g., early-stage downy mildew and anthracnose may both cause slight discoloration of leaves), traditional CNN-based models are prone to confusion due to reliance on local features. The transformer network, through global relationship modeling, achieves more stable feature representations. In the temporal feature modeling stage, a temporal transformer encoder is employed to capture disease progression trends in the same plant. This module utilizes a multi-frame input strategy, where the input data is a time series
, modeled using a temporal transformer block:
This module effectively captures the temporal evolution of lesion characteristics, improving the ability to model disease progression. For example, in multi-day disease monitoring, the temporal transformer can capture subtle changes in lesion patterns, such as the expansion of leaf spots or gradual darkening of disease areas, enabling precise differentiation of disease stages. Since disease progression is influenced by external factors such as temperature, humidity, and light intensity, the model can incorporate environmental data for multi-modal learning, enhancing detection stability. In the multi-scale feature fusion stage, a patch merging mechanism is adopted to hierarchically reduce dimensionality while preserving lesion details, enabling high-level lesion representation. Patch merging combines adjacent patches and maps them to a lower-dimensional space:
where
is the transformation weight matrix, and
denotes the feature concatenation operation. This strategy effectively reduces computational complexity while retaining fine-grained lesion information, allowing the model to maintain high accuracy with improved computational efficiency. Additionally, as lesions may exhibit different scales (e.g., early-stage diseases manifesting as small spots, while late-stage infections cover entire leaves), multi-scale feature fusion ensures that lesion features of various scales are effectively captured, thereby enhancing detection performance.
2.3.2. Temporal Forgetting-Enhancement Module
The core design principle of the temporal forgetting-enhancement module is to balance the long-term trends of historical data with the importance of recent information through a dynamic weight adjustment mechanism, thereby improving the temporal stability and accuracy of disease detection. This module introduces a temporal self-attention mechanism after the transformer-based lesion detection network, allowing the model to incorporate multi-time-step data for more comprehensive disease recognition while reducing detection bias caused by data redundancy or temporal errors, as shown in
Figure 9.
In terms of network structure, the temporal forgetting-enhancement module employs a Multi-Head Temporal Attention (MHTA) mechanism, consisting of two main components: Multi-Head Spatial-Temporal Attention (MHSTA) and a Memory-Gated Forgetting Mechanism (MGFM). The MHSTA module primarily models the short-term dynamic evolution of diseases, while the MGFM assigns lower weights to long-term historical data through a temporal decay factor, thereby enhancing the importance of recent data. The entire temporal enhancement module comprises four transformer layers, each consisting of MHA and FFN, where the input and output channel dimensions of each transformer layer are both set to 512. The input data dimensions of the model are given as
, where the temporal length is set to 10, and the input image resolution is
with a channel depth of 512. During the MHSTA computation, spatial and temporal information is processed separately through independent multi-head attention mechanisms to compute the Query, Key, and Value matrices. The spatial attention computation is given by:
Similarly, the temporal attention computation is given by:
The obtained spatial attention representation is:
and the mathematical formulation of Softmax is given as follows:
where
is the predicted value for class
i,
N represents the total number of classes, and
denotes the probability that the input sample belongs to class
i. Softmax enables comparability among predicted values and enhances classification accuracy in multi-class tasks. During model training, it is commonly used in conjunction with the cross-entropy loss function to optimize decision boundaries and improve model generalization performance. The temporal attention representation is:
Finally, spatial and temporal attention outputs are fused using a concatenation operation:
where
represents the final linear transformation matrix that effectively integrates spatial and temporal information. Within the MGFM computation, an adaptive temporal decay factor is introduced to balance long-term and short-term information contributions. Long-term information is stored in a memory unit and undergoes exponential decay based on the time step:
where
denotes the memory state at time
t,
represents the current input feature, and
is the adaptive forgetting factor, computed as:
where
denotes the Sigmoid activation function, and
and
are learnable parameters. This mechanism ensures that long-term information does not excessively influence current disease detection while preventing the loss of recent information. During the decoding phase of the disease detection network, the output of this module is fed into the decoder layer of the transformer-based lesion detection network to provide temporal feature support. The standard transformer decoder input is formulated as:
. After integrating the temporal enhancement module, the final representation becomes:
, where
represents the output of the temporal enhancement module, which is combined with the original feature representation
H before being fed into the decoder. This integration enables the decoder to incorporate temporal information, thereby enhancing the accuracy of disease detection. This module provides three major advantages in the proposed task. First, by leveraging the Multi-Head Spatial-Temporal Attention mechanism, the model effectively integrates spatial and temporal information, ensuring that the dynamic changes in disease regions are fully utilized, thereby improving the robustness of disease evolution detection. Second, the memory-gated forgetting mechanism assigns higher importance to recent information through the adaptive forgetting factor
while retaining necessary historical data, allowing the model to accurately identify disease progression stages and reduce misclassification caused by environmental variations. Finally, through deep integration with the lesion detection network, the temporal enhancement module provides a more complete information flow, improving detection precision and mitigating the errors associated with single-frame detection.
2.3.3. Multi-Source Data Fusion Module
The primary objective of the multi-source data fusion module is to integrate hyperspectral data, RGB images, and environmental sensor data to enhance the accuracy and robustness of disease detection. Hyperspectral data provides rich spectral information, RGB images capture strong spatial features, and sensor data offers temporal environmental context. Therefore, effectively merging these heterogeneous data sources is a key challenge in this study. The proposed multi-source data fusion module adopts a dual-layer fusion structure. The first layer focuses on the fusion of different-dimensional data, while the second layer aligns and merges data with different sampling rates, ensuring that the model can fully utilize the diverse information sources to improve overall disease detection performance. In the first-layer fusion process, an adaptive feature mapping mechanism is used to align hyperspectral and RGB image features. Given an RGB image
and hyperspectral data
with
spectral channels, a projection transformation is first applied to the hyperspectral data:
where
is a learnable projection matrix that maps hyperspectral data into the same channel space as RGB images. Subsequently, a fusion attention mechanism (FAM) is applied to compute the correlation between RGB and hyperspectral features:
where
d is a normalization factor for the channel dimension. The final fused feature representation is obtained as:
ensuring the complementary nature of hyperspectral and RGB data, thereby improving the ability to distinguish disease regions. In the second-layer fusion process, to address differences in sampling rates between sensor and image data, a Temporal Alignment Module (TAM) is designed. Given a sensor data sequence
with time steps
and feature dimensions
, and an image time step of
where typically
, a Lagrange interpolation method is used to align the temporal scales:
where
denotes original sensor data timestamps. After alignment, a GRU (Gated Recurrent Unit) network extracts temporal features:
, ensuring that sensor and image data contribute effectively to disease detection. Through this multi-source data fusion approach, a more comprehensive disease detection model is achieved, leveraging spectral, spatial, and temporal data while maintaining computational efficiency.
2.3.4. Lesion-Agricultural Explanation Generation Module
The primary objective of the lesion-agricultural explanation generation module is to generate reasonable textual descriptions based on the detected lesion regions and expert-annotated agricultural knowledge. This ensures that the disease detection system not only accurately identifies plant diseases but also autonomously produces interpretable agricultural insights, providing valuable references for farmers and agricultural managers. The module is designed as a transformer-based image-to-text network, which integrates lesion region features with expert-provided textual descriptions. By leveraging a cross-attention mechanism, the model learns the correspondence between disease images and textual descriptions, thereby automatically generating explanations aligned with agricultural knowledge. Regarding network architecture, the module consists of a lesion feature encoder, a cross-modal attention module, a decoder, and a text generator. The input comprises lesion region features extracted from the disease detection network, while the output consists of automatically generated textual disease descriptions. The lesion feature encoder receives input from the disease detection network, denoted as
, where
and
. To extract deep semantic features from the lesion region, the module first encodes the input features using multiple transformer encoder layers, computed as follows:
where
denotes the multi-head self-attention mechanism, and
represents the feedforward network. The primary role of this encoder is to model intra-region feature relationships while reducing redundant information, ensuring that the subsequent text generation model focuses on key disease characteristics. Within the cross-modal attention module, an image-text alignment mechanism is employed to ensure that the text generation model effectively utilizes disease detection features. The lesion features
are mapped into the textual embedding space, where the textual word embeddings are denoted as
, with
L representing the text sequence length and
as the word embedding dimension. The alignment between lesion features and text embeddings is computed using cross-attention:
where
and
are projection matrices for the lesion features and text embeddings, respectively, and
is a normalization factor. The computed
represents the weighted text representation conditioned on the lesion features, ensuring that the model captures essential disease attributes for accurate semantic expression in the generated text. During the decoding stage, a transformer decoder processes the lesion-text aligned features to generate disease descriptions. The decoder follows an autoregressive generation strategy, where each predicted token dynamically depends on previously generated tokens. The input to the decoder is formulated as:
, where
represents the decoded text features. The final word distribution is computed using a Softmax function:
where
denotes the word generated at time step
t, and
is the output weight matrix. The entire model is trained using the maximum likelihood estimation (MLE) objective, ensuring the generation of high-quality text:
This loss function optimizes the model by maximizing the probability of correctly generated text, thereby improving the quality of the generated disease descriptions. The integration between the lesion-agricultural explanation generation module and the transformer-based lesion detection network is achieved by utilizing the output of the disease detection network not only for classification but also as feature embeddings for this module. Specifically, the lesion detection network’s output features are first processed using RoI Align to extract lesion region representations: , where represents the global image features, and BBoxes denotes the predicted bounding boxes of disease regions. The extracted features are then fed into the lesion-agricultural explanation generation module, completing the automatic generation of disease descriptions. This module provides three primary advantages in disease detection tasks. First, by employing a cross-modal attention mechanism, the alignment between disease image features and agricultural text information is effectively achieved, ensuring that the model generates explanations consistent with expert agricultural knowledge. Second, the autoregressive transformer decoder dynamically adjusts the generated content, overcoming the limitations of traditional template-based approaches and enabling the generation of more natural and coherent agricultural descriptions. Finally, by leveraging the guidance of disease detection network features, the module ensures that the generated text precisely corresponds to the detected lesion region, thereby enhancing the specificity and interpretability of disease descriptions.
2.4. Experimental Setup
2.4.1. Hardware and Software Configuration
The experimental setup was based on a high-performance computing server equipped with two NVIDIA A100 80GB GPUs (NVIDIA Corporation, Santa Clara, CA, USA) to efficiently train deep learning models and provide strong parallel computing capabilities. Additionally, the server was configured with an AMD EPYC 7742 64-core processor to ensure high-efficiency data preprocessing and model training. For storage, an 8TB NVMe SSD high-speed disk was used to support large-scale data access and improve training data loading efficiency. The system operated on Ubuntu 20.04 LTS, with CUDA 11.8 and cuDNN 8.4 utilized to optimize GPU computing performance. Regarding software configuration, PyTorch 2.0 was employed as the deep learning framework, along with Torchvision 0.15 for model training and evaluation. Data preprocessing and augmentation were primarily conducted using OpenCV 4.5 and the Albumentations library, ensuring efficient data transformation. The experimental code was implemented in Python 3.9, with NumPy(1.23.5) and Pandas used for data management. To ensure reproducibility, multiple experiments were conducted under different dataset partitions to mitigate the impact of randomness. During model training, the AdamW optimizer was adopted for parameter updates, with an initial learning rate of . A cosine annealing learning rate scheduling strategy was incorporated to stabilize the training process. The batch size was set to 32 to fully utilize GPU resources while balancing training speed and memory consumption. In terms of loss functions, Focal Loss was employed to address class imbalance in disease categories, and Dice Loss was incorporated to enhance the accuracy of lesion segmentation. The model was trained for 300 epochs, and an early stopping strategy was implemented, terminating training if validation loss did not decrease for 20 consecutive epochs to prevent overfitting.
2.4.2. Dataset Configuration
The dataset was partitioned using a 7:2:2 ratio, dividing it into training, validation, and test sets. The training set was used for model parameter optimization and feature learning. The validation set was primarily employed for hyperparameter tuning and overfitting detection during training. The test set was allocated for final model performance evaluation to ensure that the detection capability on unseen data was thoroughly validated. This partitioning strategy was designed to expose the model to a sufficiently diverse range of disease samples during training while providing an independent dataset for performance evaluation, thereby ensuring its generalization ability. To further enhance the model’s generalization capability, 10-fold cross-validation () was adopted. The dataset was evenly divided into 10 subsets, where, in each iteration, 9 subsets were used as the training set, and the remaining subset was designated as the validation set. This process was repeated 10 times to ensure that each sample appeared in the validation set at least once. Additionally, stratified sampling was applied to maintain a balanced distribution of different disease categories across the training, validation, and test sets. Special attention was given to balancing low-frequency disease categories to ensure that each subset accurately represented the overall dataset distribution. Furthermore, multiple rounds of random resampling were conducted after the initial partitioning to mitigate potential biases introduced by random splits. The training results from different partitioning strategies were compared, confirming that the dataset partitioning did not significantly affect model performance, thereby ensuring the reliability of the experimental results.
2.4.3. Evaluation Metrics
To comprehensively assess the performance of the model in grape disease detection, commonly used classification and object detection metrics were selected, including precision (
P), recall (
R), accuracy (
), F1-score (
), and mean average precision (
and
). These metrics provided a multi-faceted evaluation of the model’s effectiveness, ensuring that it accurately identified disease-affected regions while minimizing false detections and missed cases.
In these formulas,
(True Positive) represents the number of correctly detected disease-affected regions,
(False Positive) denotes the number of healthy regions incorrectly classified as diseased,
(False Negative) indicates the number of actual disease-affected regions that were not detected, and
(True Negative) corresponds to the number of correctly classified healthy regions. In practice, AP is calculated using a discretized approach, summing the precision values at predefined recall points:
where
and
denote adjacent recall points, and
represents the corresponding precision value. The intersection over union (
) metric measures the overlap between the predicted bounding box and the actual disease-affected region.
2.5. Baseline
2.5.1. SOTA in Smart Agriculture
Deep learning techniques have been widely applied in smart agriculture to enhance disease detection accuracy and real-time performance. Models such as Tiny-Segformer [
32], DiffuCNN [
33], MCDCNet [
34], and Aggregation Attention [
35] have shown strong performance in this domain and are selected as baselines. Tiny-Segformer integrates Transformer-based feature modeling with efficient segmentation. DiffuCNN enhances detection accuracy for low-resolution images using a diffusion-based module. MCDCNet employs deformable convolution for multi-scale disease detection. These baselines validate the proposed method’s generalization ability and improvements in agricultural disease detection.
2.5.2. SOTA in Object Detection Tasks
Significant progress has been made in object detection, with models such as the YOLO series, SSD [
36], RetinaNet [
37], and DETR [
38] demonstrating strong performance. YOLOv5 to YOLOv9 [
39,
40,
41,
42,
43] are widely adopted for their balance of speed and accuracy. SSD employs a single-stage detection approach for real-time performance, while RetinaNet enhances small-object detection through Focal Loss. DETR utilizes Transformer-based self-attention mechanisms to model global feature relationships. These models serve as baselines for evaluating the proposed method’s effectiveness in disease detection.
3. Results and Discussion
3.1. Comparison with SOTA Methods in Smart Agriculture
The primary objective of this experiment is to evaluate the performance of different disease detection models and to analyze their effectiveness using quantitative metrics. The key goal of this experiment is to validate the effectiveness of the proposed method in disease detection tasks and compare it with state-of-the-art (SOTA) intelligent agricultural disease detection models, exploring their adaptability across various data characteristics and disease types.
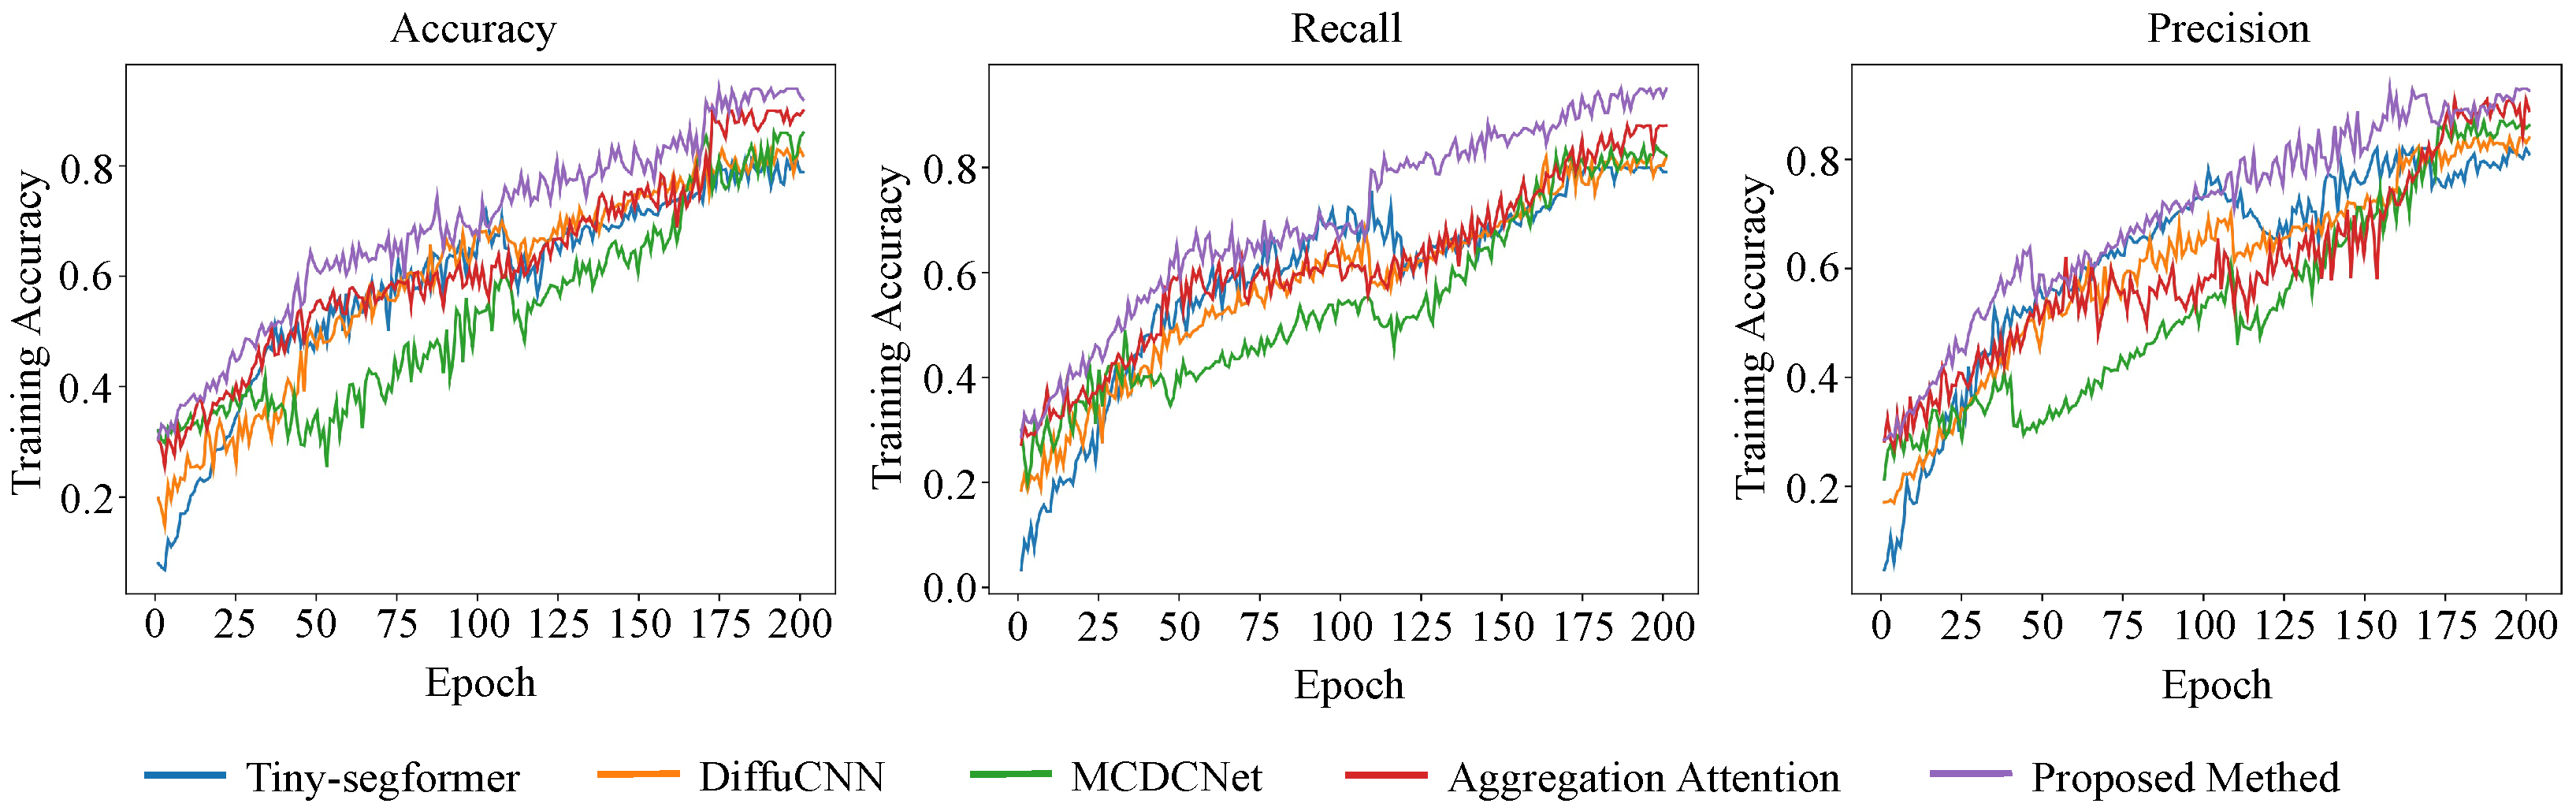
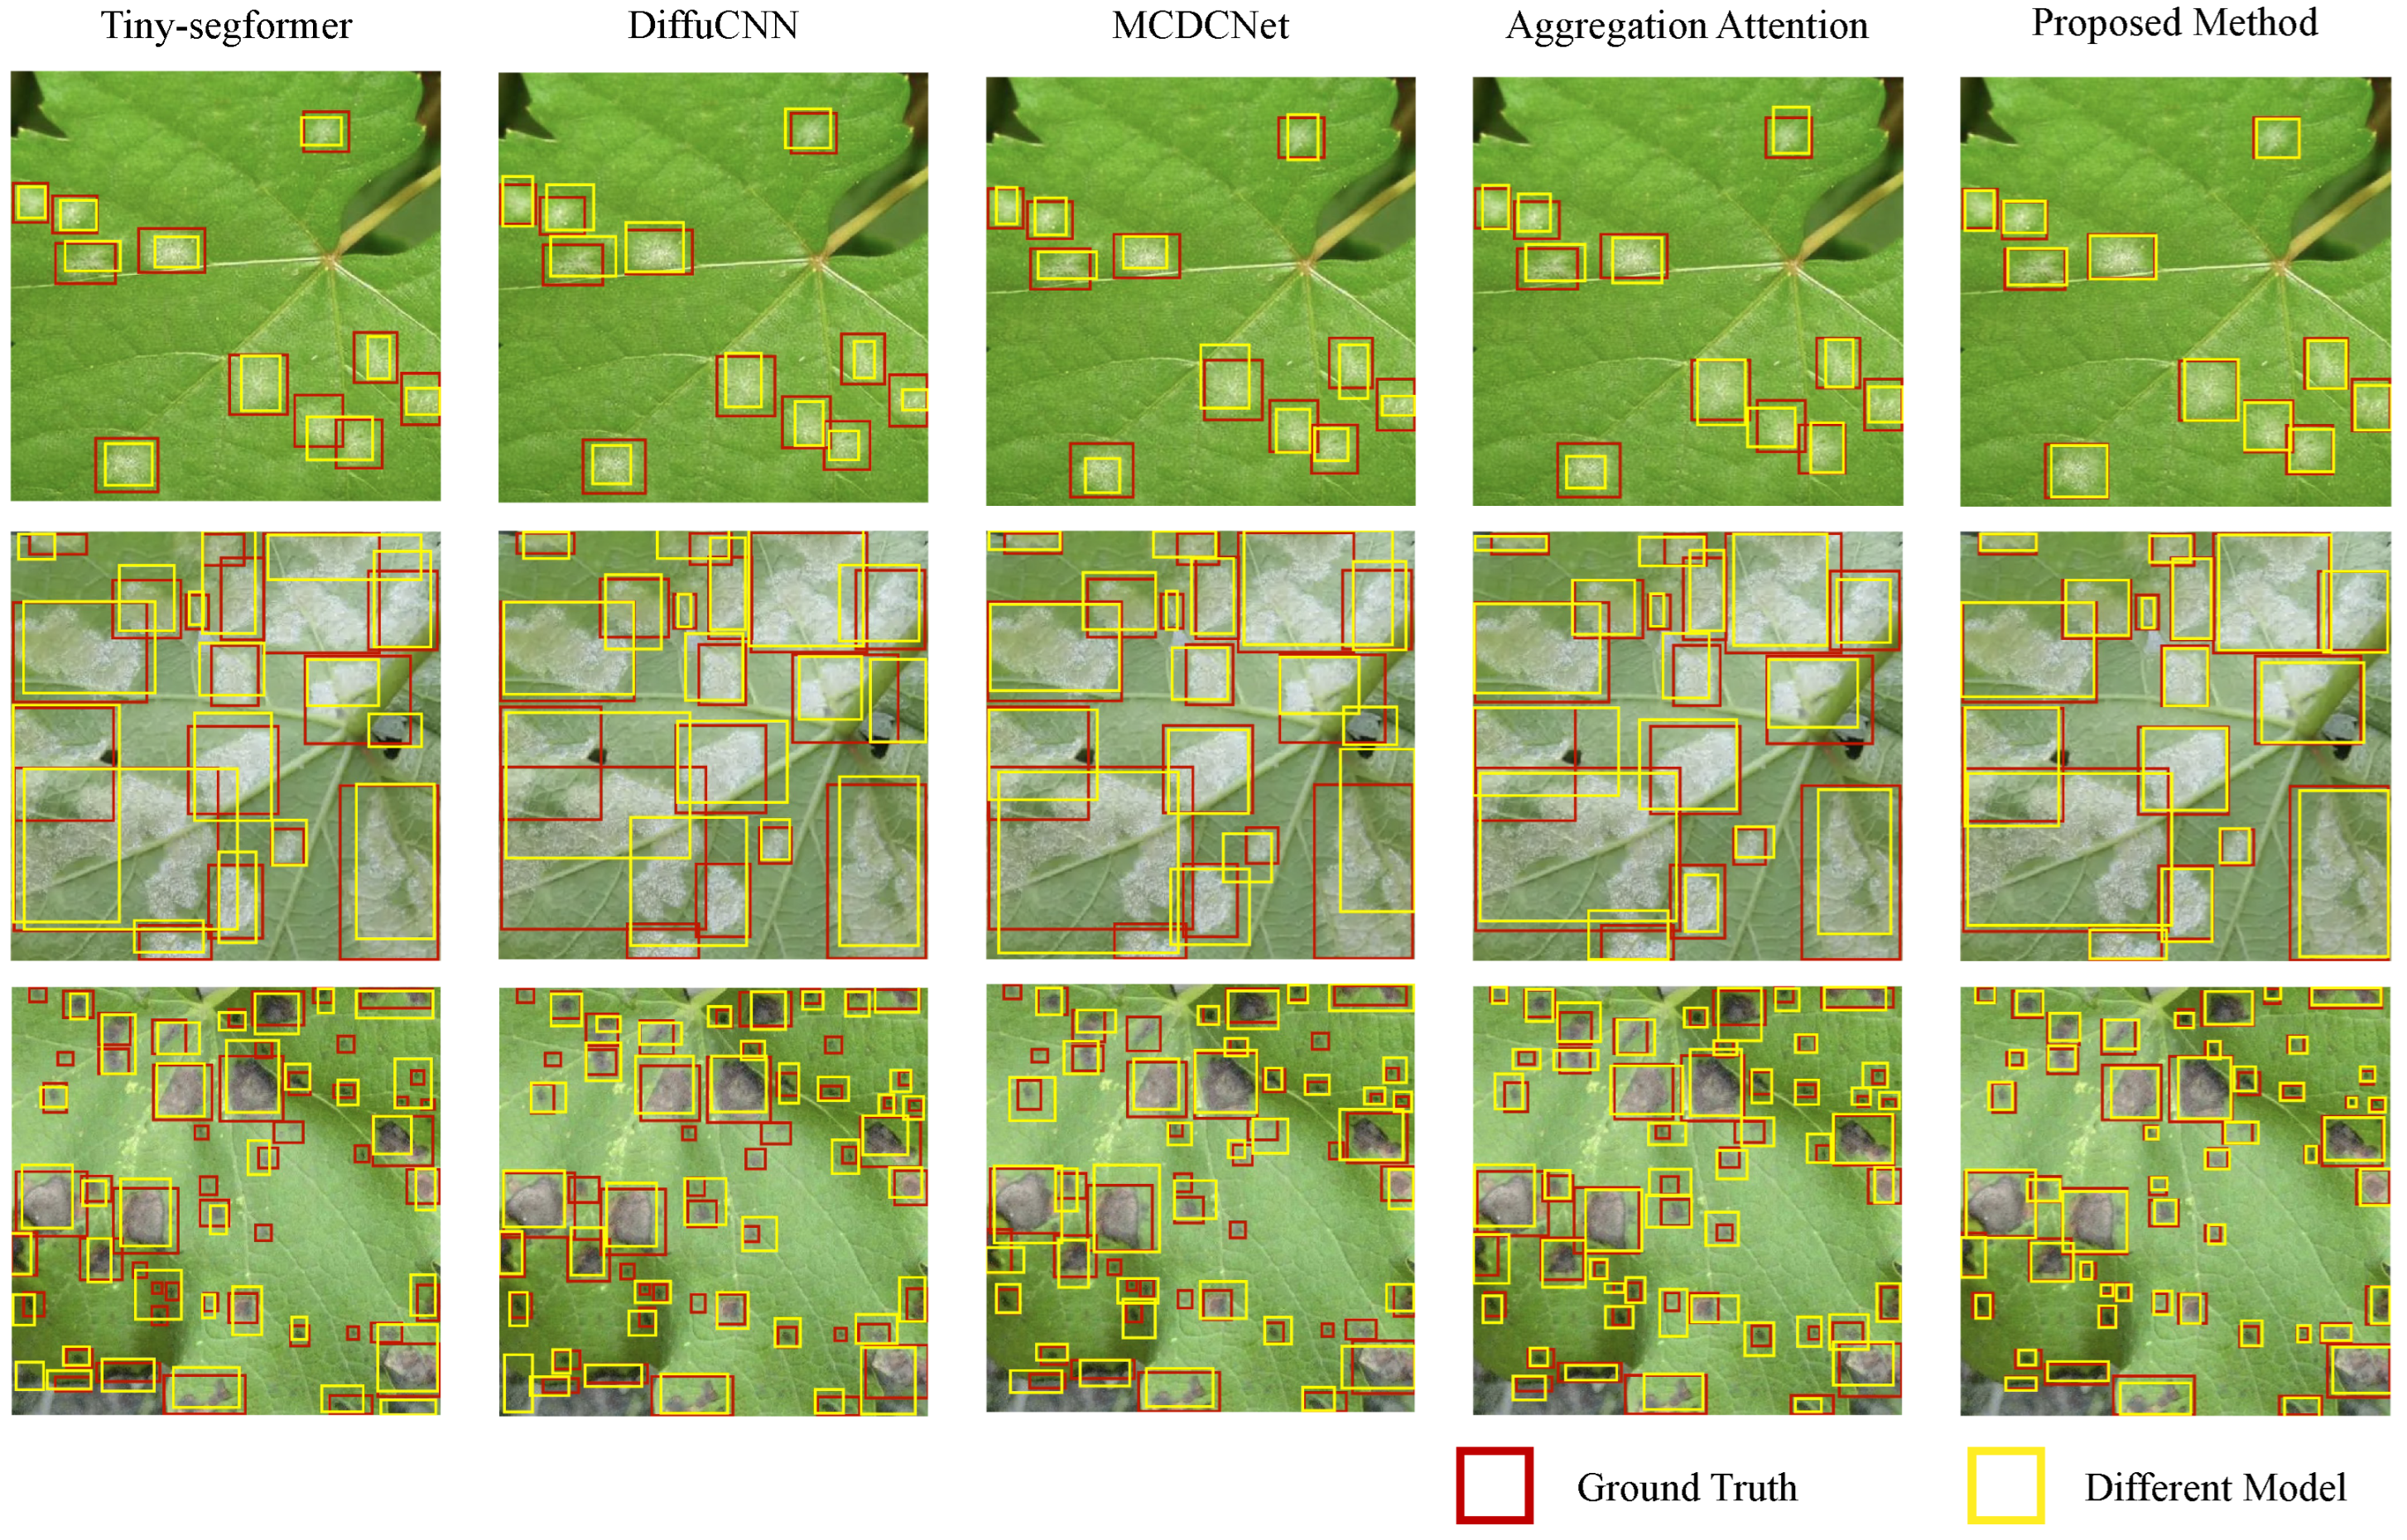
As shown in
Table 2 and
Figure 10 and
Figure 11, significant differences are observed in the performance of different models in disease detection tasks. Tiny-Segformer exhibits relatively lower performance across all metrics, with precision of 0.82, recall of 0.80, and an F1-score of 0.81, indicating its limitations in precise segmentation of disease-affected regions. DiffuCNN demonstrates improvements in detecting low-quality disease images due to its diffusion-based resolution enhancement module, which enhances overall precision, recall, and accuracy. However, its mAP@75 remains at 0.82, suggesting that its object localization performance under high-confidence thresholds still has room for optimization. MCDCNet further enhances detection performance by leveraging multi-scale constrained deformable convolutions, improving robustness in detecting diseases of varying sizes. This results in an accuracy of 0.86 and an F1-score of 0.85. The Aggregation Attention model incorporates an attention aggregation mechanism, stabilizing feature representations for disease regions and significantly improving detection capability, achieving precision, recall, and mAP@50 of 0.89 or higher. The proposed method outperforms all existing models across all evaluation metrics, achieving precision of 0.93, recall of 0.95, mAP@75 of 0.93, and mAP@50 of 0.94. These results indicate superior stability and generalization capability in various disease detection tasks. The differences in model performance can be theoretically analyzed from a mathematical modeling perspective. Tiny-Segformer employs a lightweight Transformer architecture, which reduces computational costs and improves inference speed. However, due to its limited model capacity and constrained feature representation ability, it suffers from information loss in complex disease regions, negatively impacting precision and recall. DiffuCNN enhances low-resolution disease images through a diffusion module, stabilizing performance on low-quality data. Its mathematical principle is based on a smoothing approximation through the diffusion process, which enhances image details. However, its accuracy in precisely localizing disease regions remains constrained, limiting improvements in mAP@75. MCDCNet’s mathematical advantage lies in the flexibility of its deformable convolutions, which dynamically adjust receptive fields to accommodate disease targets of different scales. This reduces the constraints of fixed convolution kernels on complex-shaped disease regions, leading to superior multi-scale disease detection performance. The Aggregation Attention model enhances performance by optimizing attention mechanisms, using multi-level attention aggregation to enable the feature extraction network to focus more effectively on key disease-related information, thereby improving detection stability. The superior performance of the proposed method across all metrics is primarily attributed to its integration of Transformer-based global feature modeling, multi-source data fusion mechanisms, and temporal enhancement modules, allowing for comprehensive spatiotemporal representation of disease features. Mathematically, the method optimizes multi-modal information fusion using an adaptive attention mechanism, enhancing detection stability. Additionally, the temporal enhancement mechanism ensures a more rational utilization of historical information, preventing information redundancy and feature degradation. These optimizations collectively contribute to achieving the best experimental results across all evaluation metrics. The proposed disease detection method integrates additional supervisory signals to achieve multimodal fusion, improving detection accuracy and generalization. Specifically, the model utilizes not only RGB images but also hyperspectral data and environmental sensor information as inputs. Hyperspectral data provide disease region characteristics across different spectral bands, enabling better differentiation of visually similar diseases, while environmental sensor data capture external factors influencing disease spread, such as temperature, humidity, and light conditions. These additional supervisory signals enable the model to maintain high detection performance across various disease types and complex environmental conditions. Experimental results indicate that compared to models relying solely on RGB images, incorporating these supervisory signals leads to improvement in mAP@50 and mAP@75, respectively, validating their effectiveness.
3.2. Comparison with SOTA Object Detection Methods
The objective of this experiment is to compare the proposed method with SOTA models in the field of object detection to validate its advantages in disease detection tasks. Since disease detection can be formulated as an object detection problem, selecting advanced models widely used in object detection as benchmarks enables a comprehensive evaluation of the proposed method’s performance in terms of precision, recall, mAP@50, mAP@75, and F1-score. Furthermore, this comparison provides insights into the adaptability and generalization capability of the proposed method in agricultural disease detection.
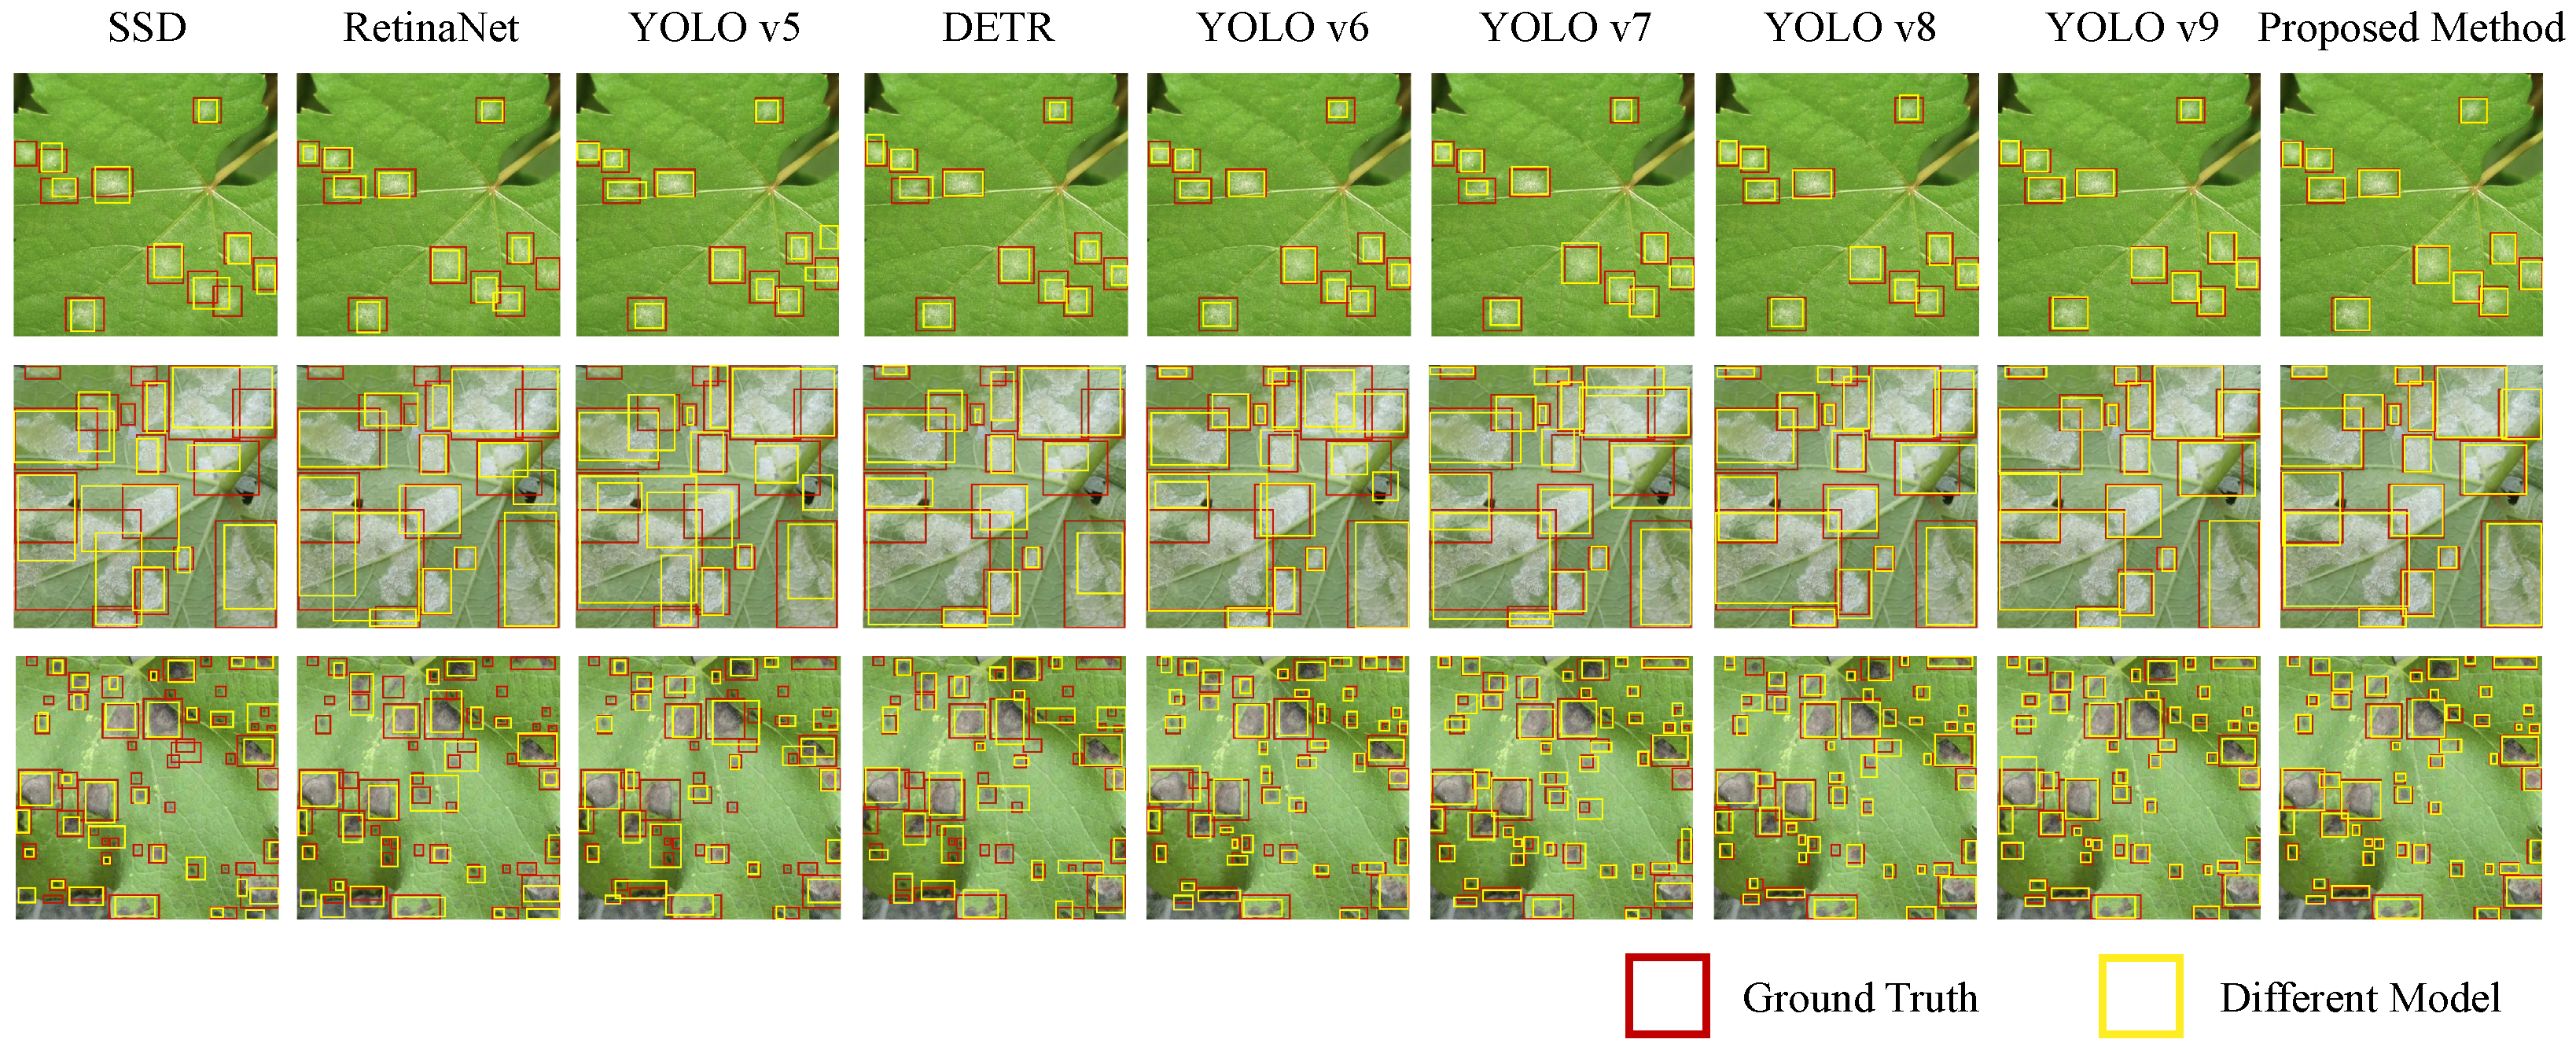
As shown in
Table 3 and
Figure 12, SSD exhibits relatively lower detection performance, with precision of 0.83, recall of 0.79, and mAP@75 of 0.81. This is primarily due to its single-stage detection structure, which has limited robustness in complex backgrounds, restricting the detection accuracy. RetinaNet demonstrates superior performance compared to SSD, as its Focal Loss effectively mitigates class imbalance issues, achieving a recall of 0.82 and an mAP@75 of 0.85, indicating a more effective capability in recognizing disease categories. YOLOv5 and YOLOv6 achieve a balanced trade-off between detection accuracy and speed, with mAP@50 reaching 0.86 in both cases. However, YOLOv6 outperforms in recall, reaching 0.88, suggesting improved optimization in reducing missed detections. DETR leverages a Transformer-based global feature modeling approach, resulting in a precision of 0.89 and an mAP@50 of 0.89. Compared to conventional convolutional detection networks, DETR is more effective in modeling long-range dependencies, which is beneficial in disease detection tasks where contextual information is crucial. YOLOv7 and YOLOv8 further improve detection performance, achieving mAP@50 values of 0.91 and 0.92, respectively, with recall exceeding 0.91, demonstrating the effectiveness of their optimized anchor-free mechanisms in disease detection. As the latest version, YOLOv9 outperforms all previous SOTA models, attaining precision of 0.92, recall of 0.94, and mAP@75 of 0.92, highlighting the advantage of its Transformer-CNN hybrid architecture in disease detection tasks. However, the proposed method surpasses all SOTA models in every metric, achieving precision of 0.93, recall of 0.95, mAP@75 of 0.93, and an F1-score of 0.94. These results indicate superior generalization ability and stability in agricultural disease detection scenarios. From a mathematical modeling perspective, the detection performance of different models can be analyzed. In complex backgrounds, optimizing this loss function poses challenges in achieving precise object localization, leading to lower mAP@75. RetinaNet introduces Focal Loss, which addresses the class imbalance issue by adjusting the contribution of easy and hard samples. YOLOv7, YOLOv8, and YOLOv9 further refine anchor-free detection mechanisms, enhancing the accuracy of bounding box regression, leading to improvements in mAP@50 and mAP@75. DETR employs the Transformer self-attention mechanism, optimizing the objective function based on matching loss. By leveraging global relationship modeling, this method enhances detection capability for long-range disease regions. The proposed method integrates multi-source data fusion, adaptive attention mechanisms, and temporal enhancement features, ensuring superior spatial and temporal feature representation in disease detection. Additionally, the Transformer-based global feature extraction mechanism enables further improvements in precision and recall, making the proposed method more robust in complex agricultural environments.
3.3. Confusion Matrix Analysis
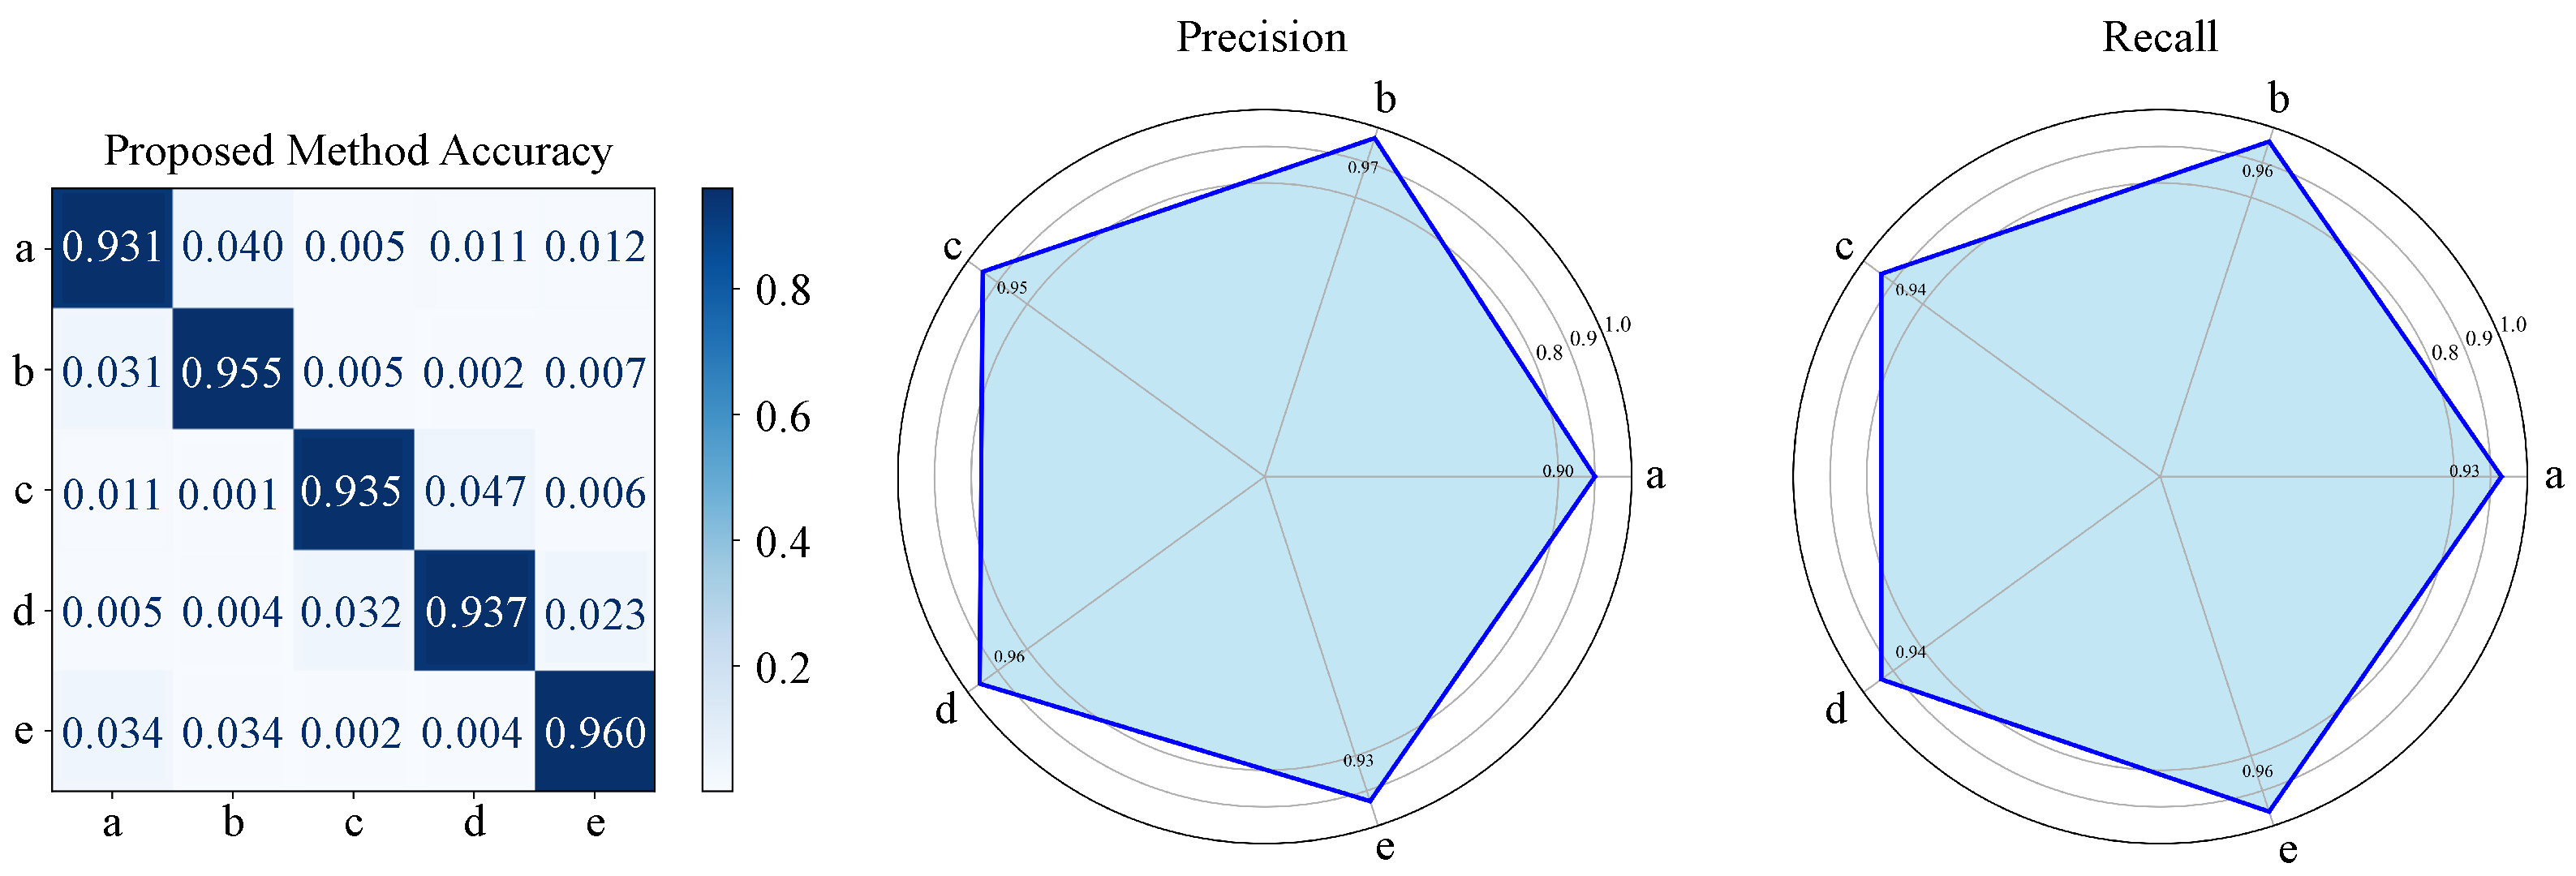
The objective of this experiment is to evaluate the detection performance of the proposed method across different types of diseases, thereby verifying its adaptability and generalization capability. Significant variations exist among different diseases in terms of morphology, color, progression patterns, and dependence on environmental conditions. Therefore, assessing model performance on multiple diseases is crucial for measuring its robustness. Multiple evaluation metrics are employed to comprehensively quantify the detection performance.
As shown in
Table 4 and
Figure 13, the model demonstrates high detection accuracy across all disease detection tasks, with mAP@50 exceeding 0.94 for all categories, indicating strong capability in both disease region localization and classification. The best performance is observed in the detection of powdery mildew, with a precision of 0.97, recall of 0.96, and mAP@75 of 0.95. This result suggests that the characteristics of powdery mildew are more distinguishable, enabling efficient detection by the model. Similarly, gray mold and anthracnose exhibit high detection performance, achieving F1-scores above 0.94. Meanwhile, downy mildew and spot anthracnose have slightly lower detection accuracy, with mAP@75 values of 0.93 and 0.94, respectively, indicating that the model is still effective in handling diverse disease detection tasks. The differences in detection results among diseases can be analyzed from a mathematical modeling perspective. The slightly lower detection accuracy for downy mildew and spot anthracnose may be attributed to their subtle early symptoms, where color variations are relatively weak, making feature extraction more challenging. Mathematically, this can be explained by the model’s limited ability to differentiate features in low-contrast regions, leading to reduced separability in high-dimensional feature space. Despite this challenge, the proposed method employs a Transformer-based global feature modeling approach, where disease-related features are effectively enhanced through self-attention mechanisms. As a result, high detection accuracy is maintained even for multi-scale disease detection tasks. On the other hand, the superior detection performance of powdery mildew and anthracnose can be attributed to their distinct lesion regions, which exhibit high contrast and pronounced morphological variations. This characteristic enables the attention mechanism to more stably capture disease regions. Additionally, the temporal enhancement mechanism of the proposed method plays a crucial role in the detection of spot anthracnose and gray mold. As these diseases exhibit temporal progression patterns, the integration of temporal features enables the model to more accurately recognize different disease stages, thereby improving recall performance. The experimental results validate that the proposed method effectively balances spatial and temporal disease feature extraction, leading to enhanced detection precision and robustness across various plant disease conditions. In the experimental results, downy mildew exhibited slightly lower precision and F1-score compared to other diseases, primarily due to its complex morphology and subtle early-stage features. In its initial development phase, the lesions of downy mildew appear faint, resembling healthy leaves or other diseases such as powdery mildew, leading to classification confusion. Additionally, the primary symptoms of downy mildew typically manifest on the underside of leaves, whereas the dataset primarily consists of RGB images captured from the upper leaf surface, potentially missing crucial diagnostic features. Although hyperspectral features enhance classification accuracy, the high-dimensional spectral space can still cause overlap between class boundaries, leading to reduced precision.
3.4. Performance Analysis of Different Forgetting Strategies
In this experiment, the impact of different forgetting strategies on disease detection tasks was analyzed to validate the optimization effects of the forgetting mechanism on model performance. Since disease detection tasks involve time-series information and disease progression exhibits a certain degree of temporal dependency, an appropriate forgetting strategy can help the model more effectively utilize historical data and improve its ability to model disease progression trends. The experiment employed linear forgetting, exponential forgetting, and the dynamically adaptive forgetting strategy proposed in this study, and their performance was compared across multiple evaluation metrics.
As shown in
Table 5, the overall performance of the linear forgetting strategy was relatively low, with a precision of 0.72, recall of 0.76, and mAP@75 of only 0.75. This indicates that the method has certain limitations in distinguishing diseased regions, possibly due to the uniform decay rate applied to all historical data, which causes long-term historical information to still exert a considerable influence on current decision-making, making it difficult for the model to quickly adapt to recent data changes. In contrast, the exponential forgetting strategy demonstrated significant improvements in precision and recall, achieving a precision of 0.84, a recall of 0.80, and an mAP@75 of 0.82. This suggests that the exponential decay method is more effective in handling temporal information, allowing recent data to have greater weight while still retaining some historical information, thereby enhancing the model’s dynamic adaptability. However, this strategy still showed deficiencies in recall, indicating that some early-stage disease characteristics might not have been fully leveraged, leading to suboptimal model performance in capturing disease evolution patterns. The proposed dynamically adaptive forgetting strategy outperformed all other strategies in every evaluation metric, achieving a precision of 0.93, a recall of 0.95, an mAP@75 of 0.93, and an F1-score of 0.94. The core principle of this strategy is based on the Memory-Gated Forgetting Mechanism (MGFM), which adaptively adjusts the weight of data across different time steps. This ensures that recent data play a dominant role in decision-making while gradually attenuating long-term data, yet still preserving crucial temporal dependencies. Although this method offers better utilization of recent information compared to linear decay, the fixed exponential decay factor can still cause critical historical information to be forgotten prematurely. This approach enables the model to dynamically adjust the forgetting rate according to data variations, allowing for more precise utilization of historical information at different time steps.
3.5. Application and Analysis of the iOS-Based Grape Disease Detection System
The Transformer-based grape disease detection method proposed in this study has demonstrated outstanding performance in experiments and has been further implemented as a mobile application on the iOS platform, enabling practical disease detection. This application allows users to input grape leaf images via the camera or local gallery and performs real-time analysis using the proposed disease detection network. As shown in
Figure 14, the system successfully identifies grape downy mildew and provides an explanation, demonstrating that the proposed method maintains stable detection capabilities even in complex backgrounds.
Several challenges were encountered during the deployment of the proposed method on mobile devices, including limited computational resources, optimization of model inference speed, and standardization of data input. To address these issues, a lightweight Transformer architecture was adopted to reduce computational overhead. Additionally, an optimized lesion-agriculture explanation generation module was integrated, enabling the application to not only provide disease identification results but also generate readable diagnostic texts based on agricultural knowledge. This enhancement offers valuable decision-making support for farmers and agricultural technicians.
3.6. Discussion on Computing Power
The proposed grape disease detection method is based on a Transformer architecture, incorporating multimodal data fusion and temporal enhancement modules, which require relatively high computational resources. During the training phase, experiments were conducted using an NVIDIA A100 GPU (80GB VRAM) and an AMD EPYC 7742 processor, with a total training time of approximately 12 h. For inference, testing on an RTX 3090 GPU (24GB VRAM) achieved an average inference time of approximately 75ms per image, demonstrating real-time capability for agricultural applications. Additionally, a CPU-only test was performed on an Intel i7-12700K, where inference time increased to approximately 650ms per image. To improve computational efficiency, model quantization and pruning techniques were applied, allowing deployment on edge devices with limited computational resources. Experimental results indicate that the proposed method is well-suited for high-performance computing platforms while remaining deployable on consumer GPUs and cloud environments, providing an efficient and scalable solution for agricultural disease detection.
3.7. Limitation and Future Work
Despite the superior performance of the proposed method in disease detection tasks, certain limitations persist. First, although an adaptive feature mapping and temporal alignment mechanism were employed to integrate hyperspectral data with RGB imagery, the process remains susceptible to variations in data acquisition devices and environmental factors. Second, some disease categories exhibit highly similar visual characteristics, which may lead to misclassification under specific conditions. While the global feature modeling approach based on Transformer and the temporal enhancement mechanism were designed to optimize the temporal dimension of disease features, detecting early-stage symptoms remains challenging due to their subtle manifestations, potentially causing a decline in detection accuracy. Future research can further refine the disease detection model in several directions. One potential avenue involves the incorporation of self-supervised or few-shot learning techniques to reduce reliance on large-scale labeled datasets and enhance model adaptability to limited-sample disease detection tasks. Conventional deep learning approaches often struggle to perform effectively in scenarios with scarce labeled data; however, self-supervised and few-shot learning can leverage cross-dataset transfer learning or self-generated labels to enhance detection capabilities under data-scarce conditions. Another possible direction is the integration of additional sensor modalities, such as thermal imaging, near-infrared imaging, or spectral polarization information, to further improve the model’s ability to capture fine-grained details in diseased regions.


