Article

Vertical Distribution of Soluble Organic Nitrogen Composition in Paddy Soils: Effects of Chinese Milk Vetch Application Rates

1
Ecological College, Lishui University, Lishui 323000, China
2
College of Resources and Environment, Fujian Agriculture and Forestry University, Fuzhou 350002, China
3
College of Forestry Science and Technology, Lishui Vocational & Technical College, Lishui 323000, China
*
Authors to whom correspondence should be addressed.
Agronomy 2025, 15(4), 833; https://doi.org/10.3390/agronomy15040833
Submission received: 3 March 2025 / Revised: 20 March 2025 / Accepted: 21 March 2025 / Published: 27 March 2025
(This article belongs to the Section Soil and Plant Nutrition)

Abstract

:
Soluble organic nitrogen (SON) plays a critical role in soil nitrogen cycling, yet the effects of Chinese milk vetch (CMV) application on the composition of SON within paddy soil profiles remains poorly understood. This study aimed to investigate the effects of varying CMV application rates on the composition and vertical distribution of SON in paddy soils, evaluating its potential implications for soil fertility and nitrogen leaching. A three-year field experiment was conducted in a subtropical rice cultivation system, employing four CMV application rates (0, 15,000, 30,000, and 45,000 kg ha−1). Soil samples were collected from three depth layers (0–20 cm, 20–40 cm, and 40–60 cm) at the rice maturity stage, and SON components, including free amino acid nitrogen (FAA-N), amide nitrogen (A-N), and soluble protein nitrogen (SP-N), were analyzed. The results demonstrated that CMV application significantly enhanced SON content, particularly in the topsoil (0–20 cm), with a 49.87% increase under the 45,000 kg ha−1 treatment. SON constituted over 50% of the total soluble nitrogen in the 0–60 cm layer, with FAA-N, A-N, and SP-N identified as the predominant components. CMV facilitated the accumulation of small-molecular SON (e.g., FAA-N and A-N) in deeper soil layers, with FAA-N content increasing by 79.13% in the 20–40 cm layer and A-N content increasing by 64.85% in the 40–60 cm layer under the 45,000 kg ha−1 treatment. In contrast, high-molecular-weight SON (e.g., SP-N) primarily accumulated in the topsoil due to stronger adsorption, while small-molecular-weight SON exhibited greater mobility, thereby elevating the risk of nitrogen leaching. These findings highlight the need for optimized CMV application rates to balance soil fertility and environmental sustainability in rice cropping systems.

1. Introduction

Nitrogen is distributed in various functional pools and plays a critical role in plant physiological and metabolic processes [1]. Previous research on soil nitrogen pools has primarily focused on the dynamics of total nitrogen and inorganic nitrogen following fertilization in agricultural systems [2]. However, there is little information regarding the evolution of soluble organic nitrogen (SON) pools. SON, defined as the organic nitrogen extractable by water, salt solutions, or electro-ultra-filtration (EUF) [3], represents a rapid turnover fraction of total organic nitrogen. Recent studies have identified SON as a significant but often overlooked pathway for nitrogen loss from agricultural systems to groundwater [4,5]. The composition of SON in agricultural ecosystems is highly complex and can be roughly divided into two pools based on the turnover rate: low-molecular-weight nitrogen-containing compounds with extremely fast turnover rates (amino acids, amino sugars, peptides, etc.) and high-molecular-weight nitrogen containing compounds with slow turnover rates (tannins, humus, polyphenols, etc.) [6]. The molecular weight, charge, solubility, and other properties of these components vary significantly, influencing SON’s transformation and mobility in the soil profile. Therefore, understanding SON’s role in nitrogen cycling requires not only quantifying its amounts and structure but also examining its spatial distribution in soils. Despite its importance, limited research has been conducted on SON pools in soil profiles, especially in response to different fertilization strategies.
In agricultural ecosystems, the application of nitrogen fertilizers not only affects the nitrogen content in the topsoil but also alters the vertical distribution of soil nitrogen due to nitrogen leaching and the influence of crop root systems [7]. Different types of fertilization, i.e., nitrogen fertilization [8], compost [9], cow manure amendments [9], etc., influence soil nitrogen composition differently. Elevated nitrogen levels have been shown to decrease amino acid nitrogen while increasing amino sugar nitrogen [10]. Notably, the addition of different types of fertilizers may alter nitrogen composition, thereby affecting the distribution of nitrogen in the soil [11]. Inappropriate nitrogen supply, such as excessive fertilization, can lead to incomplete nitrogen uptake by vegetation, causing nitrogen accumulation in the soil [12]. Soil nitrogen typically exists in an adsorption–desorption equilibrium, but when nitrogen exceeds the soil’s adsorption capacity, the excess desorbs [13]. This desorbed nitrogen, particularly SON, is highly mobile and can leach into groundwater and surface water during rainfall or irrigation [14]. This process increases groundwater nitrogen levels, causing pollution, and introduces excess nutrients into surface water, raising eutrophication risks. Chinese milk vetch (Astragalus sinicus L., CMV), a leguminous green manure crop, has been widely cultivated in Southern China for centuries [15]. With a nitrogen content of up to 28–37 g kg−1 at the full flowering stage, CMV has become one of the most extensively promoted green manures in Southern China, typically applied at rates ranging from 15,000 to 45,000 kg ha−1 [16,17,18]. The substantial incorporation of CMV into the soil, accompanied by mineralization processes, inevitably leads to significant accumulation of organic nitrogen, particularly SON [14]. Although progress has been made in understanding the role of green manures in nitrogen availability [19,20,21], the mobility of SON within the soil profile and its potential leaching risks remain poorly understood. The specific forms of SON after CMV incorporation and their distribution patterns in the soil profile have not been thoroughly investigated. Moreover, excessive nitrogen accumulation in the soil, surpassing its adsorption capacity, further increases the risk of nitrogen leaching [22]. Therefore, a comprehensive understanding of the impact of CMV application on the nitrogen composition of paddy soils, particularly the mobility and leaching risks of SON, is crucial for optimizing fertilizer management and developing strategies to mitigate environmental risks. This study aims to address this research gap by providing new insights into the behavior of SON in the soil profile.
In this study, we conducted a field experiment involving four different CMV application rates (0, 15,000 kg ha−1, 30,000 kg ha−1, and 45,000 kg ha−1) over a period of three years in a subtropical rice production system in Southern China. We hypothesize that (i) the SON composition varies under different CMV application rates and soil depth; and (ii) large-molecular-weight SON represents the predominant fraction within the SON reservoir in paddy soil, exhibiting a higher tendency for soil fixation. The objectives of this study were to (i) comprehensively evaluate the impact of CMV application on SON components in paddy soil profiles and (ii) understand the variations in the potential of soil profiles to retain nitrogen components. This study significantly enhances the understanding of the retention mechanisms and migration dynamics of SON with varying molecular weights in paddy soils. Additionally, it provides new insights into the behavior and leaching risks of SON in rice paddy soils, particularly in subtropical regions.

2. Materials and Methods

2.1. Study Site and Experimental Design

The study site was located in Minhou County, Fujian Province, China (119°04′10″ E; 26°13′31″ N), which is situated in the transition zone between the middle and south subtropical zones. The annual average temperature was 19.5 °C, the frost-free period was approximately 311 d, and the annual average precipitation was 1350 mm. The soil was composed of grey-mud field soil with loamy clay, and the main initial chemical properties were pH, 5.60; SOM, 20.45 g kg−1, total nitrogen, 1.04 g kg−1; available phosphorus, 5.19 mg kg−1; and available potassium, 31.07 mg kg−1.
In this experiment, we compared four CMV application rates: control, no CMV (CK); low, 15,000 kg ha−1 CMV (CL); medium, 30,000 kg ha−1 CMV (CM); and high, 45,000 kg ha−1 CMV (CH), set up since 2019. We implemented a contrasting design with three replicates for each treatment. No other source of fertilizer was applied during the experiment. The CMV variety Minzi No. 7 was obtained from the Fujian Academy of Agricultural Sciences. Fresh CMV was harvested at the full flowering stage (mid-April), immediately dispersed evenly in the corresponding plots (12 m2) according to the application rates of each treatment (0, 15,000, 30,000, and 45,000 kg ha−1 yr−1), and turned over into the topsoil (15 cm). The CMV had a water concentration of 90%, and its carbon, nitrogen, phosphorus, and potassium concentrations were 436.63 g kg−1, 30.94 g kg−1, 5.91 g kg−1, and 32.47 g kg−1, respectively. The acid-hydrolyzed amino acid, protein, cellulose, hemicellulose, and lignin concentrations were 82.35 mg kg−1, 193.40 g kg−1, 130.82 g kg−1, 111.76 g kg−1, and 40.81 g kg−1 (dry-weight basis), respectively. A monoculture of the rice cultivar Shanyou 63 was transplanted annually in April (10 d after CMV application) and harvested at the end of August every year from 2019 to 2022.

2.2. Soil Sampling

In 2022, soil samples from paddy fields were collected at 0 days (background soil) and 122 days after CMV application (at the rice maturity stage) using a diagonal multi-point sampling method. Stainless-steel soil samplers were used to collect paddy soil samples at different depths (0–20 cm, 20–40 cm, and 40–60 cm). Simultaneously, soil core samples from each layer of the background soil were collected. The collected soil samples were placed in polyethylene zip-lock bags and promptly transported to the laboratory. Roots, plant residues, and other intrusions were removed from the soil samples at different depths, and the samples were thoroughly mixed. The mixed fresh soil samples were divided into two splits: one split was used for analysis of soil SON and relative properties, and the other split was air-dried and sieved for determination of physical and chemical properties. The soil core samples were used to determine soil bulk density and capillary water holding capacity, from which soil porosity was calculated.

2.3. Soil Analysis

2.3.1. Analysis of Soil Basic Properties

Soil pH was measured using a pH meter (PHS-3E, INESA, Shanghai, China) with a soil-to-water ratio of 1:2.5. Soil organic matter (SOM) was determined by the potassium dichromate oxidation method as described by Lu [23]. Soil total nitrogen was analyzed using an elemental analyzer (LECO, TruMac, San Joseph, MI, USA). Available phosphorus was extracted with 0.5 M NaHCO3 and measured using the colorimetric method [23], while available potassium was extracted with 1 M NH4OAc and determined by flame photometry [23]. Soil bulk density, particle density, capillary porosity, air porosity, and total porosity were determined following the method described by Lu [23].

2.3.2. Analysis of Soil SON Composition

The hot water extraction method [24] was chosen because it efficiently extracts multiple SON components, including free amino acid nitrogen (FAA-N), amide nitrogen (A-N), and soluble protein nitrogen (SP-N) concentrations, and the properties of unknown SON components were determined, while minimizing the risk of chemical interference. In brief, the soil and distilled water were mixed at a soil/water ratio of 1:5, heated in a 70 °C water bath for 18 h, shaken for 5 min, and filtered through a 0.45 μm filter. The total SN in the filtrate was measured using a total organic carbon analyzer (TOC-L, Shimadzu, Kyoto, Japan), whereas the NH4+-N and NO3-N in the filtrate were measured using a continuous-flow analyzer (SAN++, Skalar, Breda, The Netherlands). The concentration of SON was calculated as the difference between the total nitrogen and the NH4+-N and NO3-N in the filtrate. The soil FAA-N concentration and composition were measured using the ninhydrin colorimetry–automatic amino acid analyzer method [25]. Soil A-N and SP-N concentrations were measured using the P-dimethylaminobenzaldehyde colorimetric method [26] and Coomassie brilliant blue method [27], respectively. The functional groups of the unknown components of soil SON were determined using the Fourier-transform infrared spectrometer (FTIR) method [28].

2.4. Statistical Analysis

All statistical analyses were performed using Excel 2010 and SPSS 24.0, and data plots were generated using Origin 2022. Prior to analysis, the normality of the data was assessed using the Shapiro–Wilk test, and the homogeneity of variances was verified using Levene’s test. Differences in SON concentration and composition among treatments were examined using one-way analysis of variance with Duncan’s test.

3. Results

3.1. Soil Physiochemical Properties Along Depth Gradients

The physiochemical characteristics of the soils in different layers are shown in Table 1. Overall, all the physiochemical parameters showed a change in gradient along soil depth (0–60 cm, 20 intervals). Both soil bulk density and pH increased significantly with deeper soil layers (p < 0.05). The capillary porosity, aeration porosity, and total porosity decreased in the upper layer (0–20 cm), while no significant differences were observed in the deeper layers (20–40 cm and 40–60 cm). Soil chemical properties also varied across different layers. Soil organic matter and total nitrogen content decreased significantly with increasing soil depth (p < 0.05), while available phosphorus and available potassium decreased more rapidly in the upper layer (0–20 cm), with no significant differences observed in the deeper layers (20–40 cm and 40–60 cm).

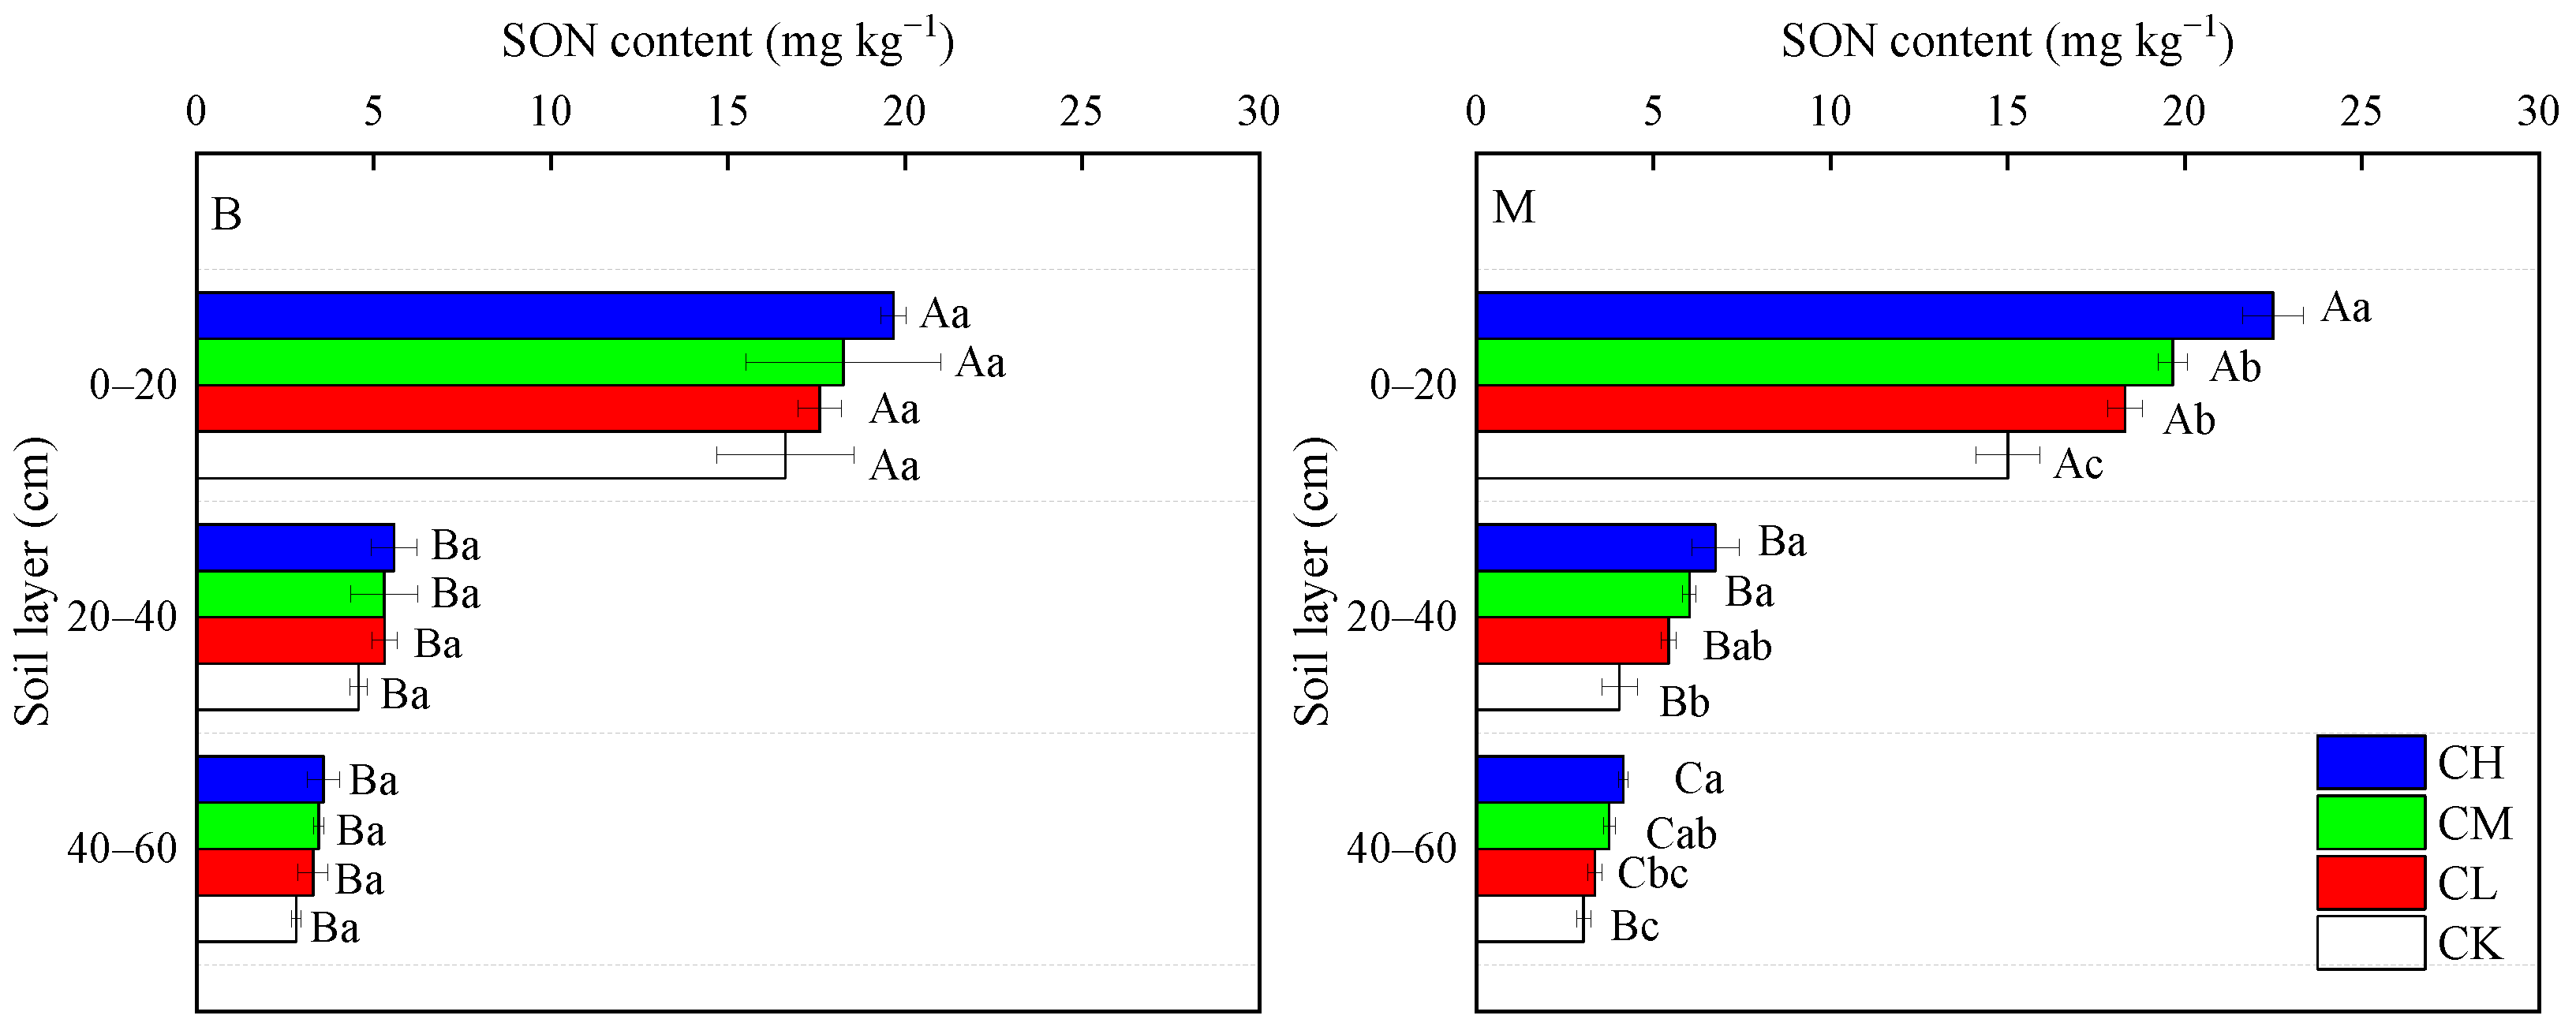
3.2. Soil SON Content Along Depth Gradients

The SON content in paddy fields varied significantly across different soil layers depending on the CMV application rates (Figure 1). At the rice maturity stage, the SON content in CK treatment followed the order of 0–20 cm > 20–40 cm ≈ 40–60 cm. In contrast, the CMV-treated soils exhibited more pronounced vertical differentiation, with the order of 0–20 cm > 20–40 cm > 40–60 cm. Significant differences in SON content were observed among fertilization treatments at the rice maturity stage. In the 0–20 cm layer, the SON content in the CL, CM, and CH treatments increased significantly by 22.06%, 30.99%, and 49.87%, respectively, compared to the CK treatment (p < 0.05). In contrast, in the deeper layers (20–40 cm and 40–60 cm), only the CM and CH treatments showed a significant increase in SON content compared to the CK treatment. These suggests that CMV application enhances SON content throughout the soil profile, with the most pronounced effects observed in the upper layer (0–20 cm). Compared to the background soil, the CM and CH treatments in the 20–40 cm soil layer showed a significant increase in SON content by 17.65% and 21.12%, respectively (p < 0.05). This suggests that SON tends to migrate to deeper soil layers.

3.3. Soil SON Composition Along Depth Gradients

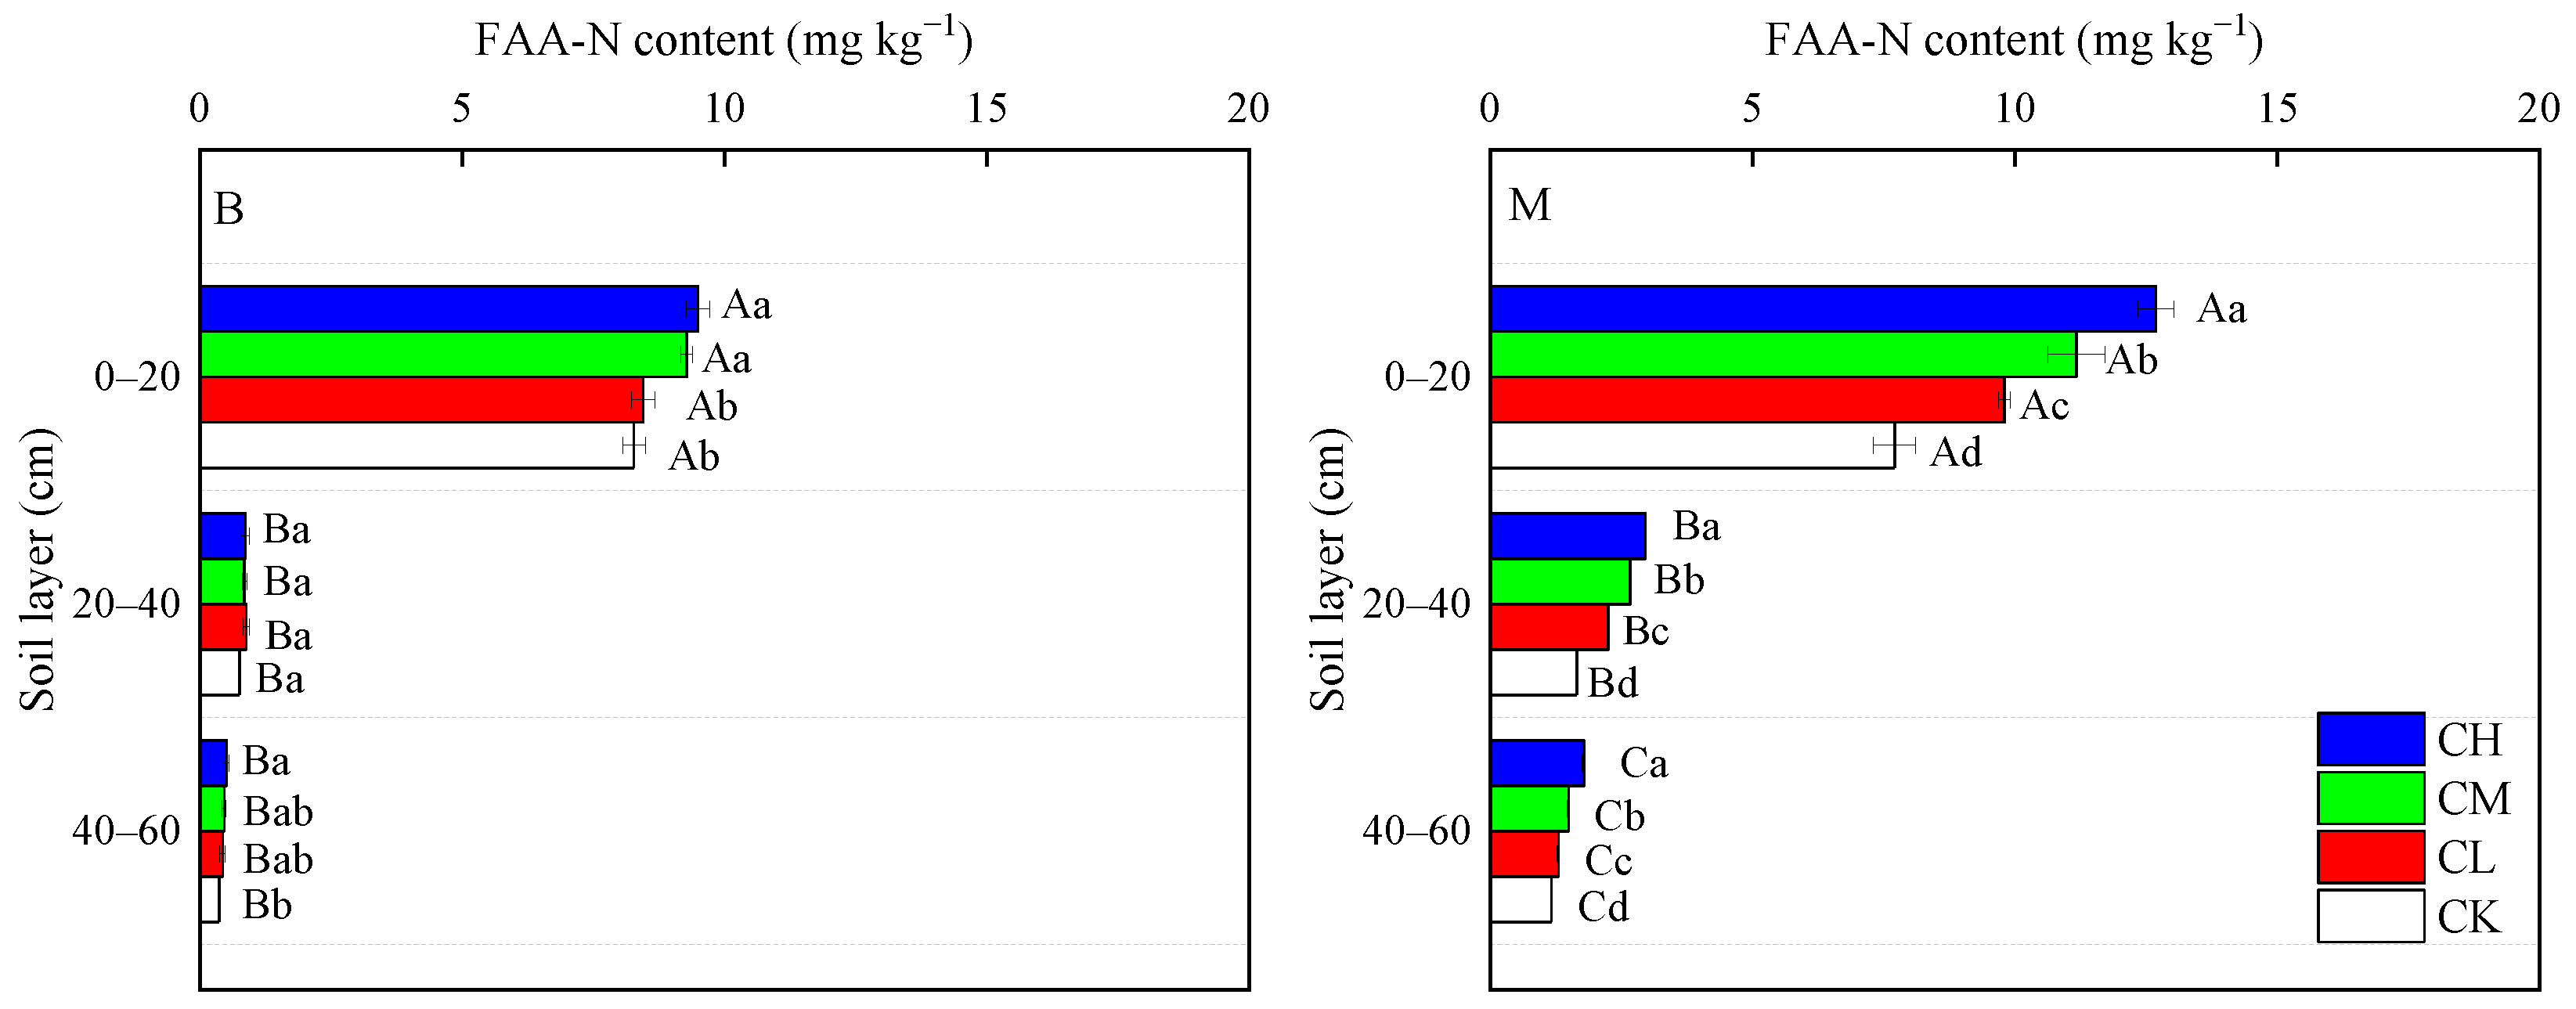
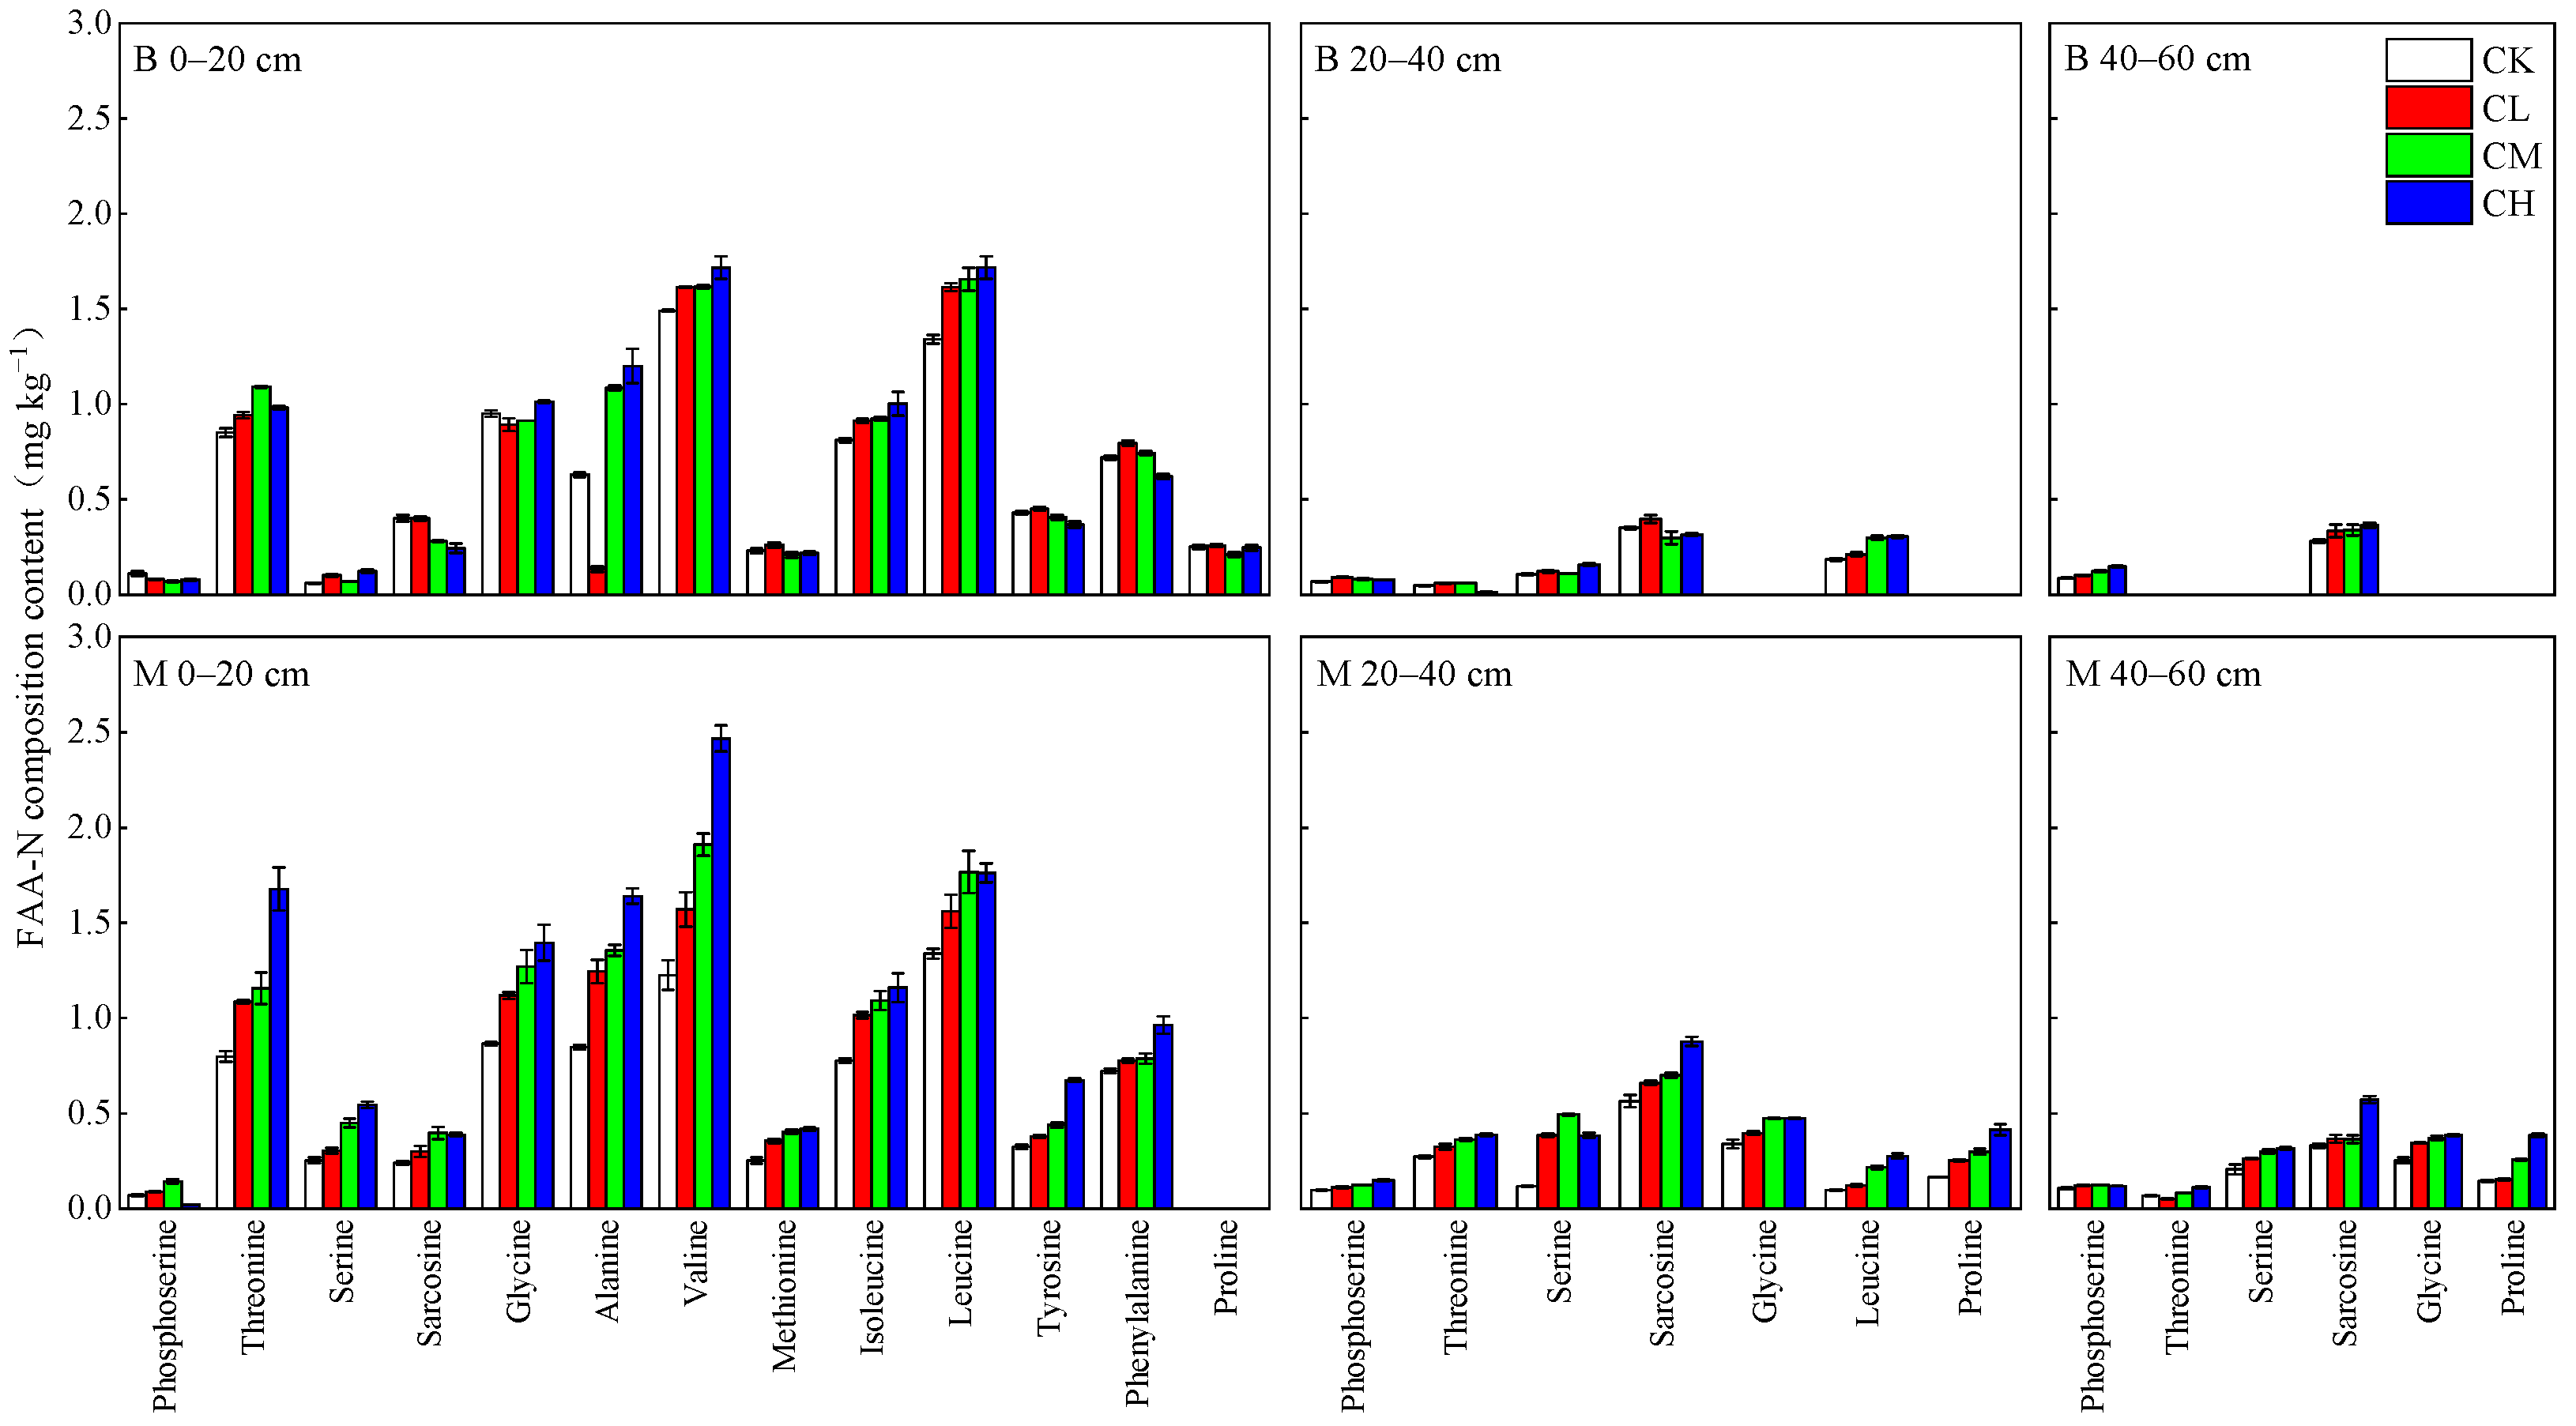
3.3.1. FAA-N Content and Composition
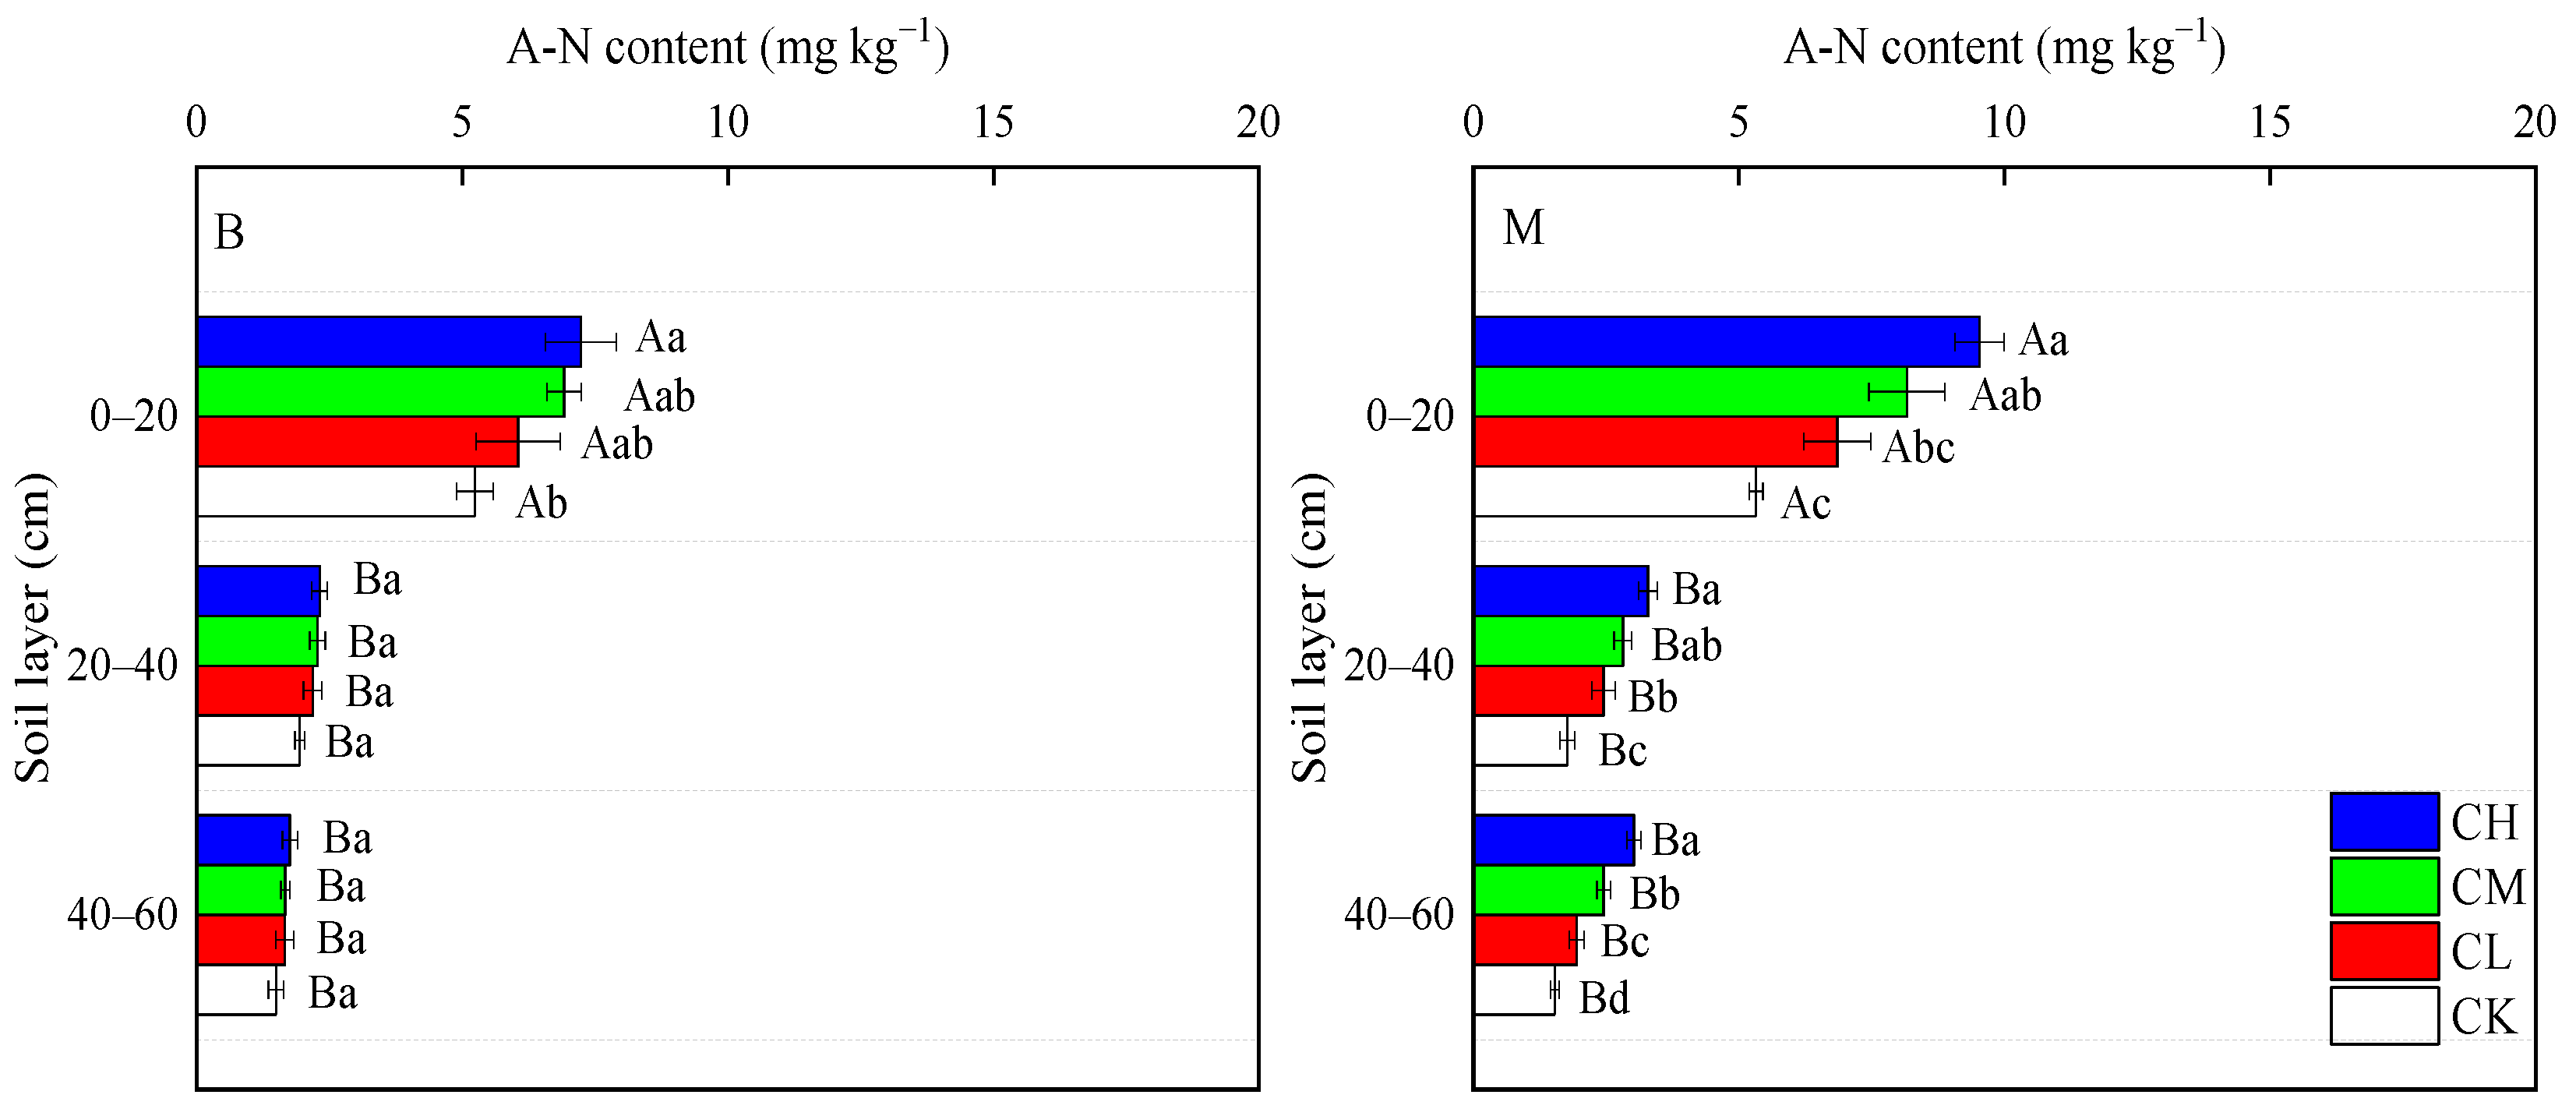
At the rice maturity stage, FAA-N content decreased gradually with soil depth across all treatments (Figure 2). The FAA-N content in the 0–20 cm soil layer was significantly higher than that in the 20–40 cm and 40–60 cm layers by 6.06–9.73 mg kg−1 and 6.54–10.90 mg kg−1, respectively (p < 0.05). Similarly, the FAA-N content in the 20–40 cm layer was significantly higher than that in the 40–60 cm layer by 0.49–1.17 mg kg−1 (p < 0.05), showing a distinct vertical differentiation in FAA-N distribution. CMV application significantly increased FAA-N accumulation across the soil profile. Compared to the CK treatment, the FAA-N content in CMV-treated soil increased significantly by 27.17–64.59%, 36.28–79.13%, and 11.30–53.05% in the 0–20 cm, 20–40 cm, and 40–60 cm layers, respectively (p < 0.05). Furthermore, compared to the background soil, FAA-N content in CMV-treated soil increased by 15.98–33.62%, 118.01–240.51%, and 197.73–248.47% in the 0–20 cm, 20–40 cm, and 40–60 cm layers, respectively (p < 0.05). The significant increase in FAA-N content in deeper soil layers (20–40 cm and 40–60 cm) suggests that CMV application promotes the migration of small-molecular SON components.
At the rice maturity stage, both the types and content of FAA-N decreased with soil depth (Figure 3). The 0–20 cm, 20–40 cm, and 40–60 cm layers contained 12, 7, and 6 types of neutral amino acids, respectively. Compared to the background soil, proline decreased in the 0–20 cm layer, while glycine and proline increased in the 20–40 cm layer. In the 40–60 cm layer, threonine, serine, glycine, and proline increased. CMV application significantly increased the content of specific FAA-N components. In the 0–20 cm layer, threonine, serine, glycine, alanine, and methionine increased by 0.06–0.70 mg kg−1, 0.20–0.42 mg kg−1, 0.23–0.38 mg kg−1, 0.27–1.11 mg kg−1, and 0.09–0.20 mg kg−1, respectively (p < 0.05). In the 20–40 cm layer, threonine, serine, sarcosine, glycine, and proline increased by 0.26–0.37 mg kg−1, 0.23–0.38 mg kg−1, 0.26–0.56 mg kg−1, 0.39–0.47 mg kg−1, and 0.25–0.41 mg kg−1, respectively (p < 0.05). In the 40–60 cm layer, threonine, serine, glycine, and proline increased by 0.05–0.11 mg kg−1, 0.26–0.32 mg kg−1, 0.34–0.38 mg kg−1, and 0.15–0.38 mg kg−1, respectively (p < 0.05). These results demonstrate that CMV application promotes the migration of neutral amino acids, particularly threonine, serine, glycine, and proline, to deeper soil layers.

3.3.2. A-N Content

At the rice maturity stage, the A-N content across soil layers followed the order of 0–20 cm > 20–40 cm ≈ 40–60 cm (Figure 4). CMV application significantly increased A-N accumulation in the soil profile. In the 0–20 cm layer, the A-N content in the CM and CH treatments increased significantly by 53.45% and 61.34%, respectively, compared to the CK treatment (p < 0.05). In the 20–40 cm layer, the A-N content in the CL, CM, and CH treatments increased significantly by 38.64%, 59.20%, and 62.08%, respectively (p < 0.05). Similarly, in the 40–60 cm layer, the A-N content in the CL, CM, and CH treatments increased significantly by 26.86%, 60.18%, and 64.85%, respectively (p < 0.05). Compared to the background soil, only the CH treatment in the 0–20 cm layer showed a significant increase in A-N content by 30.06% (p < 0.05). However, the CM and CH treatments in the 20–40 cm and 40–60 cm layers exhibited significantly higher increases than the background soil, indicating that A-N tends to migrate to deeper layers.

3.3.3. SP-N Content

The SP-N content in paddy fields varied significantly with the CMV application rates across different soil layers (Figure 5). At the rice maturity stage, the SP-N content followed the order of 0–20 cm > 20–40 cm ≈ 40–60 cm. Significant differences in SP-N content were observed among fertilization treatments at the rice maturity stage. In the 0–20 cm and 20–40 cm layers, the SP-N content in CMV-treated soil increased significantly by 61.13–153.17% and 53.80–102.54%, respectively, compared to the CK treatment (p < 0.05). In the 40–60 cm layer, the SP-N content in the CM and CH treatments increased significantly by 28.36% and 51.27%, respectively, compared to the CK treatment (p < 0.05). Compared to the background soil, only the CM and CH treatments in the 0–20 cm and 20–40 cm layers showed significant differences in SP-N content compared to the CK treatment at the rice maturity stage (p < 0.05). These results indicate that CMV application primarily enhances SP-N content in the middle and upper soil layers (0–20 cm and 20–40 cm) of paddy fields.

3.3.4. Other SON Components

The FTIR spectroscopy of SON extracts from paddy fields treated with varying CMV application rates exhibited six distinct absorption peaks across soil layers (Figure 6). At the rice maturity stage, the peak areas of peaks 1, 3, 4, and 5 followed the order of 0–20 cm > 20–40 cm > 40–60 cm in all treatments. Peak 2 showed a similar trend, 0–20 cm > 20–40 cm ≈ 40–60 cm, while peak 6 showed no significant differences across soil layers. The area of the same absorption peak varies across different soil layers. In the 0–20 cm layer, peaks 1, 2, and 3 were significantly higher in CMV-treated soils compared to the control (p < 0.05). Similarly, peaks 4, 5, and 6 were significantly higher only in the CM and CH treatments (p < 0.05). In the 20–40 cm layer, peak 1 increased by 76.40–229.21% in CMV treatments compared to CK, while peaks 2, 4, 5, and 6 were significantly higher only in CM and CH treatments (p < 0.05). Peak 3 showed no significant differences among treatments. In the 40–60 cm layer, only the CH treatment significantly increased the peak area of peak 1 by 54.55% compared to CK. Compared to the background soil, peaks 1 and 2 were significantly higher in the 0–20 cm and 20–40 cm layers, while peaks 3 and 4 were significantly higher only in the 0–20 cm layer. Peak 5 was significantly higher across all layers, whereas peak 6 showed no significant differences. These results suggest that large-molecular SON primarily accumulates in the upper layer (0–20 cm), while small-molecular SON tends to migrate to deeper layers (20–60 cm) at the rice maturity stage.

3.4. Soil SON Composition Ratios Along Depth Gradients

The SON/SN ratio in paddy soils treated with different CMV application rates ranged from 51.47% to 61.22% across soil layers and decreased with soil depth (Table 2). Among different treatments, only the SON/SN ratio in the 0–20 cm layer of the CH treatment showed a significant difference compared to CK treatment (p < 0.05). Compared to the background soil, the SON/SN ratio in the 0–20 cm layer increased by 2.49–4.19% at the rice maturity stage, while it decreased by 0.42–4.71% and 2.84–8.88% in the 20–40 cm and 40–60 cm layers, respectively. These results indicate that SON is the dominant form of SN across all soil layers, and CMV application promotes SON accumulation in the upper layer (0–20 cm).
FAA-N, A-N, and SP-N are important SON components in the 0–60 cm soil layer at rice maturity stage, accounting for 38.81–58.41%, 35.71–63.31%, and 10.46–18.06% of SON, respectively. At the rice maturity stage, the FAA-N/SON and SP-N/SON ratios were higher in the 0–20 cm layer than in the deeper layers, while the A-N/SON ratio showed the opposite trend, indicating that A-N tends to accumulate in deeper soil layers. Because of the application of CMV, the FAA-N/SON, A-N/SON, and SP-N/SON ratios in the 0–20 cm layer of the CH treatment showed significant differences compared to the CK treatment (p < 0.05). Compared to the background soil, CMV application significantly increased the FAA-N/SON, A-N/SON, and SP-N/SON ratios in the 0–60 cm soil layer during the rice maturity stage (p < 0.05), except for the SP-N/SON ratio in the deeper layer (20–40 cm and 40–60 cm). This suggested that CMV application facilitates the accumulation of high-molecular-weight SP-N in the upper layer, while promoting the migration of low-molecular-weight FAA-N and A-N to deeper soil layers.

4. Discussion

Recent studies have demonstrated that the content of SON is comparable to that of mineral nitrogen [3]. In this study, the SON/SN ratio in the 0–60 cm soil layer exceeded 50% (Table 2), further confirming that SON is a significant component of SN in the tested paddy soil. The results reveal a vertical distribution of SN content under CMV treatments, with SON content gradually decreasing as soil depth increases. This pattern is primarily attributed to the concentration of both applied CMV and rice root systems in the 0–20 cm soil layer. The CMV used in this study contains substantial nitrogenous compounds with total nitrogen, protein, and acid-hydrolyzable amino acid contents of 30.94 g kg−1, 193.4 g kg−1, and 82.35 g kg−1, respectively. When applied to the soil, CMV predominantly accumulates in the topsoil, serving as a direct source of SON and providing abundant substrates for microbial activity, thereby enhancing the mineralization rate of organic matter into small-molecular SON [25]. Additionally, rice root exudates, a significant source of SON, are predominantly distributed in the 0–20 cm soil layer [29,30]. Another contributing factor may be soil adsorption. The tested paddy soil, characterized by a clay loam texture, exhibits decreasing porosity with increasing soil depth (Table 1). Coupled with the water-retaining effect of the compact plow pan, only a portion of SON migrates to deeper layers [5,31]. Despite this, SON constitutes more than half of the SN pool in the deeper layer, and the SON/SN ratio is positively correlated with the CMV application rate (0–45,000 kg ha−1 fresh biomass). Due to its high mobility, excessive fertilization can lead to SON accumulation within the soil profile, increasing the risk of migration losses [12]. These findings provide new insights into the mechanisms of nitrogen loss in agricultural ecosystems and highlight the importance of optimizing fertilization practices to mitigate environmental risks.
The nitrogen supply capacity of SON varies significantly depending on its chemical composition [32]. In the tested paddy soils, A-N, FAA-N, and SP-N accounted for 31.96–63.31%, 13.23–58.41%, and 10.04–18.06% of SON, respectively, across different soil layers and treatments (Table 2). These results demonstrate that A-N, FAA-N, and SP-N are major components of SON, consistent with the findings of Murphy et al. [3]. The variability in their proportions highlights the dynamic nature of SON, underscoring its critical role in soil nitrogen cycling and plant nutrition. Furthermore, the vertical distribution patterns of FAA-N, A-N, and SP-N exhibited distinct variations, with the application of CMV further enhancing this differentiation. This aligns with the observed changes in SON content, thereby validating our first hypothesis. The enhanced differentiation likely results from the interplay between the intrinsic properties of SON components and the soil’s adsorption and retention capacities, as influenced by CMV application [33].
In addition to the high SON/SN ratio, we observed that the A-N/SON and FAA-N/SON in deeper soil layers were also significantly higher than those in the background soil (Table 2), indicating a tendency for downward accumulation of these nitrogen forms. This finding has some similarity to findings reported in forest soils that amino acids and amide are significant components of SON in forest soil leachates [34]. Furthermore, FTIR spectroscopy results confirmed that after CMV application, high-molecular-weight compounds (e.g., SP-N) preferentially accumulate in the upper soil layer, while small-molecular nitrogenous compounds, such as A-N, exhibited greater mobility and migrated to deeper soil layers (Figure 6). This validates our second hypothesis. The observed patterns are likely attributed to the intrinsic properties of SON components and the differential adsorption and retention capacities of the soil. Previous studies have shown that small-molecular hydrophilic SON is less readily adsorbed by soil, exhibits poor biological stability after adsorption, and is prone to desorption or replacement by hydrophobic SON, resulting in higher mobility [12,35]. In contrast, SP-N, formed through the dehydration and condensation of amino acids into polypeptide chains, has a significantly higher molecular weight and more complex structure compared to FAA-N and A-N, leading to weaker mobility in soil [36]. In addition to molecular weight, factors such as soil organic matter, soil texture, and water flow dynamics play a significant role in SON mobility. The clay loam texture of the tested paddy soil, with its high soil organic matter content (Table 1), likely enhances the adsorption of larger SON molecules (e.g., SP-N) in the topsoil, while smaller molecules (e.g., FAA-N and A-N) are more prone to leaching due to their lower affinity for soil colloids. Water flow dynamics, particularly during the rice growing season, further influence the vertical distribution of SON, with gravitational water facilitating the migration of small-molecular SON to deeper soil layers. In waterlogged paddy soils, the migration of small-molecular SON components (e.g., FAA-N and A-N) to deeper soil layers represents a significant source of nitrogen leaching—a phenomenon that has not been adequately emphasized in previous research. This leaching not only increases the risk of groundwater and surface water contamination but also promotes eutrophication and disrupts aquatic ecosystems. Therefore, optimizing CMV application rates and implementing mitigation strategies, such as controlled irrigation and the use of cover crops, are essential for reducing nitrogen losses and minimizing environmental risks.
The distribution of FAAs in the profile of paddy soils has received limited attention in previous research. As small-molecular-weight components of SON, FAAs exhibit high mobility and are prone to migration within the soil profile [37]. However, the migration capacity of different FAA species varies significantly due to their distinct chemical properties, such as polarity, molecular weight, and solubility [38]. This study demonstrates that the application of CMV significantly enhances the migration of neutral amino acids, including threonine, serine, glycine, leucine, and proline, to deeper soil layers. This phenomenon is likely attributed to alterations in the adsorption characteristics of soil for amino acids following CMV application. Specifically, neutral amino acids, such as glycine, serine, and proline, are less readily adsorbed by soil colloids, resulting in their strong mobility within the soil profile [39]. Furthermore, threonine and serine, as hydrophilic amino acids, exhibit high solubility in soil solutions and migrate to deeper layers under the influence of gravitational water [40]. Proline, one of the most water-soluble amino acids, has a solubility of up to 56.5 mg L−1 in pure water at 25 °C, rendering it highly mobile in soil and capable of reaching depths of 40–60 cm during the rice growing season [41]. Glycine, the smallest and structurally simplest amino acid in soil [42], demonstrates a strong migration capacity due to its small molecular size and hydrophilic nature, which reduce its adsorption by soil and result in poor biological stability after adsorption [32]. Following CMV application, the concentrations of threonine, serine, glycine, sarcosine, and proline in the soil increased significantly, with this effect intensifying as the CMV application rate increased, thereby further promoting the migration of these amino acids to deeper soil layers. These findings underscore the critical role of CMV application in regulating FAA dynamics in paddy soils, offering novel insights into enhancing nitrogen use efficiency and mitigating environmental risks associated with nitrogen leaching.
This study was conducted within a subtropical rice production system, and its findings may not be directly generalizable to other agricultural systems characterized by distinct soil types and climatic conditions. Additionally, the application of CMV stimulates microbial growth and metabolism, accelerating organic matter mineralization and increasing small-molecular SON [43]. Microbial activity may also decompose high-molecular-weight SON (e.g., SP-N) via extracellular enzymes, influencing SON composition and its vertical distribution [25]. However, microbial activity, a key driver of SON transformations, was not explicitly quantified in this study. Future research should explore CMV’s impact on soil microbial communities and their roles in SON preservation and migration to better understand the microbial mechanisms regulating SON dynamics.

5. Conclusions

The composition and distribution of SON in paddy soils were significantly influenced by CMV application. SON, dominated by A-N, FAA-N, and SP-N, constitutes over 50% of soil nitrogen in the 0–60 cm layer. CMV application enhanced SON content, particularly in the topsoil (0–20 cm), and promoted the migration of small-molecular SON (e.g., FAA-N and A-N) to deeper layers. High-molecular-weight SON (e.g., SP-N) accumulated predominantly in the topsoil due to stronger adsorption, while low-molecular-weight SON exhibited greater mobility, increasing the risk of nitrogen leaching. These results highlight that excessive CMV application, while improving soil nitrogen availability, may exacerbate nitrogen loss through leaching, particularly in deeper soil layers. Based on our research, we recommend optimizing CMV application to 30,000 kg ha−1, balancing soil fertility and environmental sustainability. Strategies like improved water and nutrient management, reduced early-stage drainage, and partial substitution of CMV with chemical fertilizers during mid-to-late rice growth can boost yield and reduce nitrogen loss.

Author Contributions

Conceptualization, J.Y., L.X., C.Z., H.H., B.Z., S.L., F.D. and S.X.; methodology, J.Y., F.D. and L.X.; investigation, J.Y. and L.X.; data curation, B.Z.; software, H.H.; writing—original draft preparation, J.Y.; writing—review and editing, F.D., S.L., S.X., L.X., C.Z., H.H. and B.Z.; funding acquisition, J.Y., C.Z. and S.X. All authors have read and agreed to the published version of the manuscript.

Funding

We gratefully acknowledge support for this research from the National Natural Science Foundation of China (42407407), the Science and Technology Innovation Fund Project of Fujian Agriculture and Forestry University (KFb22073XA and KFb22121XA), and the Zhejiang Provincial Natural Science Foundation of China (LTGS23D010002).

Data Availability Statement

Data are contained within the article.

Conflicts of Interest

The authors declare no conflicts of interest.

References

  1. Toselli, M.; Baldi, E.; Marcolini, G.; Malaguti, D.; Quartieri, M.; Sorrenti, G.; Marangoni, B. Response of potted grapevines to increasing soil copper concentration. Aust. J. Grape Wine Res. 2019, 25, 306–314. [Google Scholar]
  2. Fan, X.; Liu, Y.; Zhang, X.; Zhao, L.; Liu, X.; Zhang, F. Effects of long-term fertilization on soil nitrogen dynamics and crop nitrogen uptake in a wheat-maize rotation system. Soil. Tillage Res. 2018, 180, 1–9. [Google Scholar]
  3. Murphy, D.V.; Macdonald, A.J.; Stockdale, E.A.; Goulding, K.W.T.; Fortune, S.; Gaunt, J.L.; Poulton, P.R.; Wakefield, J.A.; Webster, C.P.; Wilmer, W.S. Soluble organic nitrogen in agricultural soils. Biol. Fertil. Soils 2000, 30, 374–387. [Google Scholar]
  4. Nie, S.; Zhao, L.; Lei, X.; Sarfraz, R.; Xing, S. Dissolved organic nitrogen distribution in differently fertilized paddy soil profiles: Implications for its potential loss. Agric. Ecosyst. Environ. 2018, 262, 58–64. [Google Scholar]
  5. Wang, Q.; Li, Y. Soluble organic nitrogen in agricultural soils: A review. Pedosphere 2024, 34, 1–15. [Google Scholar]
  6. Quan, Z.; Huang, B.; Lu, C.; Shi, Y.; Chen, X.; Zhang, H.; Fang, Y. Dynamics of soil organic nitrogen and its relationship with soil organic carbon in a long-term fertilization experiment. Soil. Biol. Biochem. 2015, 88, 1–9. [Google Scholar]
  7. Sun, F.; Liu, S.; Huang, C.; Zhou, Y.; Yu, G. Spectroscopic evidence of the improvement of reactive iron mineral content in red soil by long-term application of swine manure. PLoS ONE 2015, 10, e0146364. [Google Scholar]
  8. Wu, L.; Zhang, X.; Liu, X.; Zhang, F. Effects of nitrogen fertilization on soil nitrogen dynamics and crop nitrogen uptake in a wheat-maize rotation system. Soil. Tillage Res. 2019, 190, 1–9. [Google Scholar]
  9. Yücel, C.; Yücel, D.; Yücel, E. Effects of compost and cow manure amendments on soil nitrogen dynamics and crop nitrogen uptake. Soil. Tillage Res. 2020, 200, 1–10. [Google Scholar]
  10. Tian, X.; Zhang, X.; Liu, X.; Zhang, F. Effects of elevated nitrogen levels on soil nitrogen dynamics and crop nitrogen uptake. Soil. Tillage Res. 2017, 170, 1–9. [Google Scholar]
  11. Azeez, J.O.; Van Averbeke, W. Nitrogen dynamics in soils amended with different types of fertilizers. Soil. Tillage Res. 2010, 110, 1–10. [Google Scholar]
  12. Liu, G.; Sun, J.; Liu, C.; Shi, H.; Fei, Y.; Wang, C.; Zhang, G.; Wang, H. Progress and trends in research on soil nitrogen leaching: A bibliometric analysis from 2003 to 2023. Sustainability 2025, 17, 339. [Google Scholar] [CrossRef]
  13. Duan, L.; Sun, Y.; Wang, W.K. Ammonium nitrogen adsorption-desorption characteristics and its hysteresis of typical soils from Guanzhong Basin, China. Asian J. Chem. 2013, 25, 3850–3854. [Google Scholar]
  14. Yang, J.; Guo, W.; Zhao, C.; Zhou, B.; Yang, W.; Xing, S.; Ding, F. Increased soil soluble nitrogen stocks and decreased nitrogen leaching loss in rice paddy soil by replacing nitrogen fertilizer with Chinese milk vetch. Agronomy 2024, 14, 715. [Google Scholar] [CrossRef]
  15. Xie, Z.; Zhou, C.; Shah, F.; Iqbal, A.; Ni, G. The role of Chinese Milk Vetch as cover crop in complex soil nitrogen dynamics in rice rotation system of South China. Sci. Rep. 2018, 8, 5798. [Google Scholar]
  16. Lee, C.H.; Park, K.D.; Jung, K.Y.; Ali, M.A.; Lee, D.; Gutierrez, J.; Kim, P.J. Effect of Chinese milk vetch (Astragalus sinicus L.) as a green manure on rice productivity and methane emission in paddy soil. Agric. Ecosyst. Environ. 2010, 138, 343–347. [Google Scholar]
  17. Zhou, X.; Li, Z.; Xie, J.; Liao, Y.; Yang, Z.; Lu, Y.; Nie, J.; Cao, W. Effect of reducing chemical fertilizer on rice yield, output value, content of soil carbon and nitrogen after utilizing the Milk Vetch. Agric. Sci. Technol. 2015, 16, 266–271. [Google Scholar]
  18. Zhang, J.; Zheng, C.; Zhang, L.; Zhang, C.; Lv, Y.; Nie, L.; Zhang, X.; Li, B.; Cao, W.; Li, M. Effects of Chinese Milk Vetch Returning on Soil Properties, Microbial Community, and Rice Yield in Paddy Soil. Sustainability 2022, 14, 16065. [Google Scholar] [CrossRef]
  19. Shah, T.; Khan, A.A.; Aljerib, Y.M.A.; Tariq, M.; Li, D.; Geng, M.; Gao, Y.; Zhu, Q. Enhancement of fertilizer efficiency through Chinese milk vetch and rice straw incorporation. Plants 2025, 14, 246. [Google Scholar] [CrossRef]
  20. Wang, H.; Han, S.; Tang, S.; Cheng, W.; Bu, R.; Li, M.; Wu, J.; Wang, Y.; Cao, W. Continuous multi-year application of Chinese milk vetch in paddy soil and its effect on soil aggregates distribution and their carbon and nitrogen content. Acta Pedol. Sin. 2023, 60, 868–880. [Google Scholar]
  21. Yang, W.; Zhou, L.; Yao, L.; Nie, J.; Jiang, M.; Liu, Z.; Liu, H.; Zhu, B.; Wang, B. Water management alleviates greenhouse gas emissions by promoting carbon and nitrogen mineralization after Chinese milk vetch incorporation in a paddy soil. Agric. Ecosyst. Environ. 2025, 381, 109468. [Google Scholar] [CrossRef]
  22. Ju, X.; Xing, G.; Chen, X.; Zhang, S.; Zhang, L.; Liu, X.; Cui, Z.; Yin, B.; Christie, P.; Zhu, Z.; et al. Excessive nitrogen accumulation in soils: Implications for nitrogen leaching and groundwater contamination. Proc. Natl. Acad. Sci. USA 2009, 106, 3041–3046. [Google Scholar] [CrossRef]
  23. Lu, R.K. Methods of Soil Agricultural Chemical Analysis; China Agricultural Science and Technology Press: Beijing, China, 2000. (In Chinese) [Google Scholar]
  24. Xing, S.; Chen, C.; Zhou, B.; Zhang, H.; Nang, Z.; Xu, Z. Soil soluble organic nitrogen and active microbial characteristics under adjacent coniferous and broadleaf plantation forests. J. Soils Sediments 2010, 10, 748–757. [Google Scholar] [CrossRef]
  25. Yang, J.; Yang, W.; Wang, F.; Zhang, L.; Zhou, B.; Sarfraz, R.; Xing, S. Driving factors of soluble organic nitrogen dynamics in paddy soils: Structure equation modeling analysis. Pedosphere 2020, 30, 801–809. [Google Scholar] [CrossRef]
  26. Apichai, P.; Supanut, R.; Karun, T. A portable sol-gel urea colorimetric method for the determination of urea in feedstuffs. Food Chem. 2020, 319, 126545. [Google Scholar]
  27. Sattayasai, N.; Sudmoon, R.; Nuchadomrong, S. Dendrobium findleyanum agglutinin: Production, localization, anti-fungal activity and gene characterization. Plant Cell Rep. 2009, 28, 1243–1252. [Google Scholar] [CrossRef] [PubMed]
  28. Losacco, D.; Campanale, C.; Tumolo, M.; Ancona, V.; Massarelli, C.; Uricchio, V.F. Evaluating the influence of nitrogen fertilizers and biochar on brassica oleracea L var botrytis by the use of Fourier Transform Infrared (FTIR) spectroscopy. Sustainability 2022, 14, 11985. [Google Scholar] [CrossRef]
  29. Feng, Y.L.; Wang, J.; Yuan, K.; Zong, W.Z.; Guo, D. Vegetation affects pool size and composition of amino acids in Tibetan alpine meadow soils. Geoderma 2018, 310, 44–52. [Google Scholar] [CrossRef]
  30. Yang, S.; Peng, S.; Zhang, X.; Yan, D. Effects of water saving irrigation and controlled release nitrogen fertilizer managements on nitrogen losses from paddy fields. Paddy Water Environ. 2015, 1, 71–80. [Google Scholar] [CrossRef]
  31. Zhu, C.; Wang, Q.; Huang, X.; Yun, J.; Hu, Q.; Yang, G. Adsorption of amino acids at clay surfaces and implication for biochemical reactions: Role and impact of surface charges. Colloids Surf. B 2019, 183, 110458. [Google Scholar] [CrossRef]
  32. Jones, D.L.; Healey, J.R.; Willett, V.B.; Farrar, J.F.; Hodge, A. Composition and bioavailability of dissolved organic nitrogen in agricultural soils: Implications for nitrogen cycling and plant uptake. Soil. Biol. Biochem. 2022, 165, 108521. [Google Scholar]
  33. Kaiser, K.; Kalbitz, K. Interactions between soluble organic nitrogen and soil colloids: Implications for nitrogen retention and mobility in agricultural soils. Geoderma 2023, 430, 116345. [Google Scholar]
  34. Michalzik, B.; Matzner, E. Dynamics of dissolved organic nitrogen and carbon in a Central European Norway spruce ecosystem. Eur. J. Soil. Sci. 1999, 50, 579–590. [Google Scholar]
  35. Kalbitz, K.; Solinger, S.; Park, J.H.; Michalzik, B.; Matzner, E. Mobility and bioavailability of dissolved organic nitrogen in soil: The role of molecular weight and hydrophobicity. Soil. Biol. Biochem. 2020, 141, 107683. [Google Scholar]
  36. Knicker, H. Formation and turnover of soil organic matter: The role of microbial metabolites and amino acids in the stabilization of organic nitrogen. Soil. Biol. Biochem. 2011, 43, 1398–1406. [Google Scholar]
  37. Warren, C.R.; Taranto, M.T. Chemical properties and mobility of free amino acids in soil: Implications for nitrogen cycling and plant nutrition. Soil Biol. Biochem. 2021, 158, 108264. [Google Scholar]
  38. Yang, J.; Lin, Y.; Rensing, C.; Zhang, L.M.; Zhou, B.Q.; Xing, S.H.; Yang, W.H. Dynamic and migration characteristics of soil free amino acids in paddy soil applied with milk vetch. Agronomy 2022, 12, 2621. [Google Scholar] [CrossRef]
  39. Hedges, J.I.; Hare, P.E. Amino acid adsorption by clay minerals in distilled water. Geochim. Cosmochim. Acta 1987, 51, 255–259. [Google Scholar] [CrossRef]
  40. Trevino, S.R.; Scholtz, J.M.; Pace, C.N. Amino acid contribution to protein solubility: Asp, Glu, and Ser contribute more favorably than the other hydrophilic amino acids in RNase Sa. J. Mol. Biol. 2007, 366, 449–460. [Google Scholar] [CrossRef]
  41. Jensen, K.T.; Lobmann, K.; Rades, T.; Grohganz, H. Improving co-amorphous drug formulations by the addition of the highly water soluble amino acid, proline. Pharmaceutics 2014, 6, 416–435. [Google Scholar] [CrossRef]
  42. Jones, D.L.; Clode, P.L.; Hill, P.W. Glycine as a key component of soil organic nitrogen: Dynamics, transformations, and implications for soil fertility. Soil Biol. Biochem. 2020, 148, 107876. [Google Scholar]
  43. Su, M.Z.; Zhang, J.T.; Huo, S.L.; Xi, B.D.; Hua, F.; Zan, F.Y.; Qian, G.R.; Liu, J.Y. Microbial bioavailability of dissolved organic nitrogen (DON) in the sediments of Lake Shankou, Northeastern China. J. Environ. Sci. 2016, 42, 79–88. [Google Scholar] [CrossRef] [PubMed]
Figure 1. SON content in paddy soils under different CMV application rates along depth gradients. Note: B, background soil; M, maturity stage. Lowercase letters indicate the significance of differences between treatments, while uppercase letters indicate the significance of differences between soil layers.
Agronomy 15 00833 g001
Figure 2. FAA-N content in paddy soils under different CMV application rates along depth gradients. Note: B, background soil; M, maturity stage. Lowercase letters indicate the significance of differences between treatments, while uppercase letters indicate the significance of differences between soil layers.
Agronomy 15 00833 g002
Figure 3. FAA-N composition in paddy soils under different CMV application rates along depth gradients. Note: B, background soil; M, maturity stage.
Agronomy 15 00833 g003
Figure 4. A-N content in paddy soils under different CMV application rates along depth gradients. Note: B, background soil; M, maturity stage. Lowercase letters indicate the significance of differences between treatments, while uppercase letters indicate the significance of differences between soil layers.
Agronomy 15 00833 g004
Figure 5. SP-N content in paddy soils under different CMV application rates along depth gradients. Note: B, background soil; M, maturity stage. Lowercase letters indicate the significance of differences between treatments, while uppercase letters indicate the significance of differences between soil layers.
Agronomy 15 00833 g005
Figure 6. FTIR spectroscopy of SON extracts in paddy soils under different CMV application rates along depth gradients. Note: B, background soil; M, maturity stage. Note: Peak 1 (3400 cm−1): -OH stretching (carbohydrates, carboxylic acids, phenols, alcohols) and N-H stretching (amides); Peak 2 (2900 cm−1): C-H stretching (lipids); Peak 3 (1630-1650 cm−1): C=O stretching (aromatic rings in lignin and amides, amide I band); Peak 4 (1400–1460 cm−1): Lignin, aliphatics, and C-N stretching (amide III band); Peak 5 (1000–1100 cm−1): C-O stretching (carbohydrates, polysaccharides); Peak 6 (795 cm−1): Carbonate group absorption.
Agronomy 15 00833 g006
Table 1. Physicochemical properties of the tested paddy soil along depth gradients.
Soil LayersBulk Density
(g cm−3)
pHCapillary Porosity
(%)
Aeration Porosity
(%)
Total Porosity
(%)
Organic Matter
(g kg−1)
Total Nitrogen
(g kg−1)
Available Phosphorus
(mg kg−1)
Available Potassium
(mg kg−1)
0–20 cm1.32 ± 0.03 c5.53 ± 0.06 c47.67 ± 0.98 a1.64 ± 0.22 a49.30 ± 1.00 a17.57 ± 0.42 a0.96 ± 0.02 a6.52 ± 0.11 a30.20 ± 1.99 a
20–40 cm1.57 ± 0.02 b5.95 ± 0.04 b41.28 ± 0.70 b1.33 ± 0.11 ab42.61 ± 0.76 b10.37 ± 0.63 b0.52 ± 0.04 b5.24 ± 0.15 b22.70 ± 2.42 ab
40–60 cm1.66 ± 0.01 a6.31 ± 0.03 a39.21 ± 0.50 b1.14 ± 0.13 b40.35 ± 0.49 b8.17 ± 0.24 c0.35 ± 0.02 c4.38 ± 0.49 b20.68 ± 0.00 b
Note: Values in the table are presented as mean ± standard error. Lowercase letters indicate significant differences between soil layers.
Table 2. The proportion of SON components in paddy soils under different CMV application rates along the depth gradients.
PeriodLayersTreatmentsSON/SNFAA-N/SONA-N/SONSP-N/SON
Background soil0–20 cmCK56.26 ± 3.37 Aa49.69 ± 4.44 Aa31.96 ± 2.08 Ba12.34 ± 0.92 Aa
CL57.73 ± 1.64 Aa48.15 ± 0.98 Aa34.26 ± 3.32 Ba12.22 ± 0.36 Aa
CM57.42 ± 6.08 Aa49.58 ± 0.92 Aa36.95 ± 1.33 Ba12.01 ± 1.34 Aa
CH58.76 ± 1.74 Aa48.29 ± 0.64 Aa36.83 ± 4.03 Ba12.06 ± 1.27 Aa
20–40 cmCK58.21 ± 1.31 Aa16.75 ± 1.24 Ba42.83 ± 2.97 ABa10.94 ± 0.35 Aa
CL57.21 ± 1.01 Aa16.69 ± 0.70 Ba41.89 ± 2.91 ABa10.46 ± 0.51 Aa
CM57.04 ± 5.07 Aa15.53 ± 1.28 Ba42.26 ± 3.08 ABa10.36 ± 1.31 Aa
CH57.53 ± 4.04 Aa16.00 ± 1.76 Ba43.09 ± 2.37 ABa11.11 ± 2.23 Aa
40–60 cmCK54.26 ± 2.67 Aa13.23 ± 0.97 Ca52.96 ± 6.45 Aa10.92 ± 0.49 Aa
CL56.70 ± 1.14 Aa13.42 ± 1.41 Ca50.53 ± 4.02 Aa10.26 ± 0.81 Aa
CM55.69 ± 2.38 Aa13.56 ± 1.33 Ca48.70 ± 3.42 Aa10.68 ± 1.55 Aa
CH56.45 ± 2.55 Aa14.44 ± 0.54 Ca49.27 ± 0.59 Aa10.04 ± 1.16 Aa
Maturity stage0–20 cmCK57.66 ± 0.94 Ab51.67 ± 2.40 Ab35.71 ± 2.30 Bb10.78 ± 1.27 Ab
CL59.79 ± 0.33 Aab53.59 ± 0.99 Aab40.18 ± 0.57 Bab14.01 ± 0.90 Aab
CM59.05 ± 0.48 Aab56.90 ± 1.20 Aab41.43 ± 2.89 Ba16.59 ± 1.69 Aa
CH61.22 ± 1.71 Aa58.41 ± 1.29 Aa42.34 ± 0.94 Ba18.06 ± 2.17 Aa
20–40 cmCK55.47 ± 2.33 Aa41.80 ± 3.93 ABa44.61 ± 5.30 ABa12.34 ± 1.18 Aa
CL56.64 ± 1.08 Ba41.64 ± 1.45 Ba45.04 ± 2.80 Ba13.85 ± 0.23 Aa
CM56.80 ± 2.21 Ba44.83 ± 2.98 Ba47.23 ± 4.23 Ba14.52 ± 2.06 ABa
CH57.13 ± 2.56 Ba44.51 ± 3.73 Ba49.22 ± 3.87 Ba15.00 ± 2.01 ABa
40–60 cmCK51.47 ± 3.44 Aa38.90 ± 2.49 Ba50.74 ± 0.71 Aa10.46 ± 1.16 Aa
CL51.66 ± 1.72 Ba39.08 ± 1.70 Ba58.10 ± 0.55 Aa11.19 ± 1.49 Aa
CM53.58 ± 0.77 Ba38.81 ± 2.44 Ba63.31 ± 1.79 Aa10.81 ± 0.58 Ba
CH54.84 ± 1.25 Ba39.44 ± 3.02 Ba61.22 ± 1.53 Aa11.09 ± 1.96 Ba
Note: SN represents total soluble nitrogen. Values in the table are presented as mean ± standard error. Lowercase letters indicate the significance of differences between treatments, while uppercase letters indicate the significance of differences between soil layers.
Disclaimer/Publisher’s Note: The statements, opinions and data contained in all publications are solely those of the individual author(s) and contributor(s) and not of MDPI and/or the editor(s). MDPI and/or the editor(s) disclaim responsibility for any injury to people or property resulting from any ideas, methods, instructions or products referred to in the content.

