Article

Composting of Olive Mill Wastewater Sludge Using a Combination of Multiple Strategies: Assessment of Improvement in Biodegradability, GHG Emissions, and Characteristics of the End Product

by
Miguel Ángel Mira-Urios
1,
José A. Sáez
1,*,
Luciano Orden
1,
Frutos C. Marhuenda-Egea
2,
Francisco Javier Andreu-Rodríguez
1,
Ana J. Toribio
3,
Enrique Agulló
1,
Maria J. López
3 and
Raúl Moral
1
1
Centro de Investigación e Innovación Agroalimentaria y Agroambiental (CIAGRO-UMH), Universidad Miguel Hernández, Carretera de Beniel Km 3,2, Orihuela, 03312 Alicante, Spain
2
Instituto Multidisciplinar para el Estudio del Medio Ramón Margalef, San Vicent del Raspeig, 03690 Alicante, Spain
3
Unidad de Microbiología, Departamento de Biología y Geología, CITE II-B, Campus de Excelencia Internacional en Agroalimentación (CeiA3), CIAIMBITAL, Universidad de Almería, 04120 Almería, Spain
*
Author to whom correspondence should be addressed.
Agronomy 2025, 15(4), 808; https://doi.org/10.3390/agronomy15040808
Submission received: 20 February 2025 / Revised: 17 March 2025 / Accepted: 21 March 2025 / Published: 25 March 2025
(This article belongs to the Section Agricultural Biosystem and Biological Engineering)

Abstract

:
In this study, several composting strategies such as the use of semipermeable geotextile covers and biochar as an additive were investigated to improve olive mill wastewater (OMW) biodegradability and mitigate greenhouse gas (GHG) emissions during industrial-scale composting. In addition, the final characteristics of the compost obtained and its marketable value were also assessed. For this purpose, four different co-composting mixtures were prepared with OMW as the main ingredient, and two types of manure (cattle and goat manure) and bulking agents (almond pruning and vineyard pruning waste) as N and C sources. The results showed that exothermic behavior and biodegradability were more influenced by the co-composting strategy. The use of biochar as an additive showed a reduction in N losses (−14%) via GHG emissions and a significant improvement in cation exchange capacity (+35%) or the content of humic substances (+10%) in the final product. Lastly, the use of a geotextile cover was shown to be the worst cost-effective strategy, as it did not improve compost quality and showed no effect on GHG emissions.

1. Introduction

Olive oil is a key agro-industrial product in several countries in the Mediterranean area, as it accounts for nearly 90% of olive oil production worldwide [1]. As the leading olive oil producer, Spain is home to 2,768,267 ha of olive orchards [2]. Olive mill wastewater (OMW) sludge is a by-product of olive oil production in olive mills and presents significant environmental challenges. OMW is rich in organic matter (OM) and phytotoxic compounds such as phenolic compounds [3], has a strong odor, and can cause severe soil and water pollution if not properly managed. In addition, it is estimated that approximately 90% of the total olive volume processed in the three-phase system is converted into OMW [4]. Another critical environmental concern associated with OMW is the emission of greenhouse gases (GHGs) due to long-term storage in evaporation ponds and their slow decomposition. Therefore, traditional disposal methods are environmentally unsustainable, prompting the need for innovative solutions that are able to use OMW as a low-cost raw material to obtain an N and C source that can be used to restore the fertility of soils. Co-composting systems have shown potential for degradation of this recalcitrant waste and can be a suitable technique to obtain an environmentally safe product with improved agronomic characteristics for soil application [1,4]. Although composting can produce significant amounts of CH4 and N2O if not managed properly [5], composting systems, when correctly managed, have shown great potential for organic waste treatment and GHG mitigation [6]. Different approaches to the use of these techniques could be the solution to OMW environmental issues.
Thus, the application of various additives to compost has been explored as a method to optimize the degradation process and reduce GHG emissions. Recently, several research studies [7,8,9] have shown the potential of biochar for mitigating GHG emissions and improving composting treatment. Biochar has many physical and chemical properties, such as high porosity, large surface area, and abundant surface functional groups, which have attracted much attention in the last few years. It can interact with the main nutrient cycles and induce changes in microbial communities that can alter biogeochemical cycles (degradation of OM, humification, nitrification, and denitrification), helping to enhance the quality of composts and mitigate GHG emissions [10].
In recent years, membrane-covered composting has received widespread attention as a new composting technology [11,12,13]. Some studies, such as the one by Varga et al. [14], have proposed covers as an additional strategy for mitigating GHG emissions. These studies have suggested that this methodology could help control moisture levels and temperature within compost piles, creating optimal conditions for microbial activity and thus reducing the time of the treatment process and the release of GHG emissions from composting piles. Along with the integration of advanced measurement techniques, such as portable devices for measuring GHG emissions, the use of geotextile covers is proposed as a feasible alternative to this environmental concern.
Other studies, such as the one by Luo et al. [15] and Yang et al. [16], proved that different organic covers also had an impact on the GHG emissions of composting piles. In those studies, organic biomass materials, such as mature composts or cornstalks, utilized as a cover over manure, reduced the emissions of ammonia or N2O, but also increased CH4 emissions (16–43%) in some situations by increasing anaerobic zones during heap composting. Semipermeable membranes with selective permeability, used over compost piles and under forced ventilation that facilitates O2 penetration, improved compost quality and reduced methane emissions in studies carried out by Xiong et al. [17] and Li et al. [18], and Fang et al. [12] demonstrated improvements in physicochemical indicators such as temperature, pH, and germination index when this technique was used. In addition, Ma et al. [19] observed that membrane covering accelerated organic matter degradation, which was reflected in the amount of mineral components produced during the decomposition process.
Despite all the benefits of composting using membrane covers, the initial investment is high due to the characteristics and high price of these types of materials, and even prohibitive in certain scenarios. Alternative covers have been researched for GHG reduction, such as organic covers or superficial layers of mature compost [15]. Other alternatives, such as geotextile membranes, are commonly used in a wide variety of agricultural applications [20], although they have rarely been tested for this use.
In order to validate the quality of composts, the change in OM is a key factor. Moreover, several composting studies have assessed C sequestration in soils as a tool to mitigate climate change through the improvement of the carbon cycle efficiency of compost OM [21,22]. Thus, thermal analysis (TA) techniques such as Fourier transform infrared (FTIR) spectroscopy and thermogravimetry analysis (TGA) have been applied due to their high sensitivity to the chemical changes produced during the biotransformation of organic wastes, and because they are reproducible, informative, rapid, low-cost, and small-sample-consuming methods that can be used to elucidate the structural features of OM. They also provide important information about the chemical characteristics of the samples and the progressive biodegradation of the more labile organic compounds, as well as the formation of more resistant and structurally ordered compounds such as humic compounds [23,24,25]. This information, through the R1 and R2 parameters, allows for the quantitative evaluation of the stabilization of organic matter in the composting process and could be considered a reliable parameter to check the maturity level of organic matter [24,26].
The main objective of this work was to evaluate the feasibility of co-composting technology on a commercial scale to manage and recycle OMW mixed with different types of manures and bulking agents used as the N source and C source, respectively. In addition, different management strategies were tested, such as the use of additives, including biochar, and a bio-mineral supplement, or the use of geotextile covers. In order to obtain a comprehensive assessment, the study mainly focused on (i) process assessment, through the changes in key chemical parameters, the exothermic behavior of compost piles, and the biodegradability of the organic matter through FTIR and TGA techniques; (ii) the assessment of the environmental impact with respect to GHG emissions from compost piles; and (iii) the assessment of the agronomic quality and economic value of the end products obtained based on their characteristics and nutrient content.

2. Materials and Methods

2.1. Experimental Design

The composting process was carried out in the CompoLab treatment plant of the EPSO (Orihuela, Alicante, Spain) from April to July 2023 using a windrow composting system. All piles were turned 4 times, and the entire process consisted of 119 days of the bio-oxidative phase and 46 days of the maturation phase, for a total of 165 days. The optimization procedure was based on four main variables: (a) nitrogen source, (b) carbon source, (c) additives, and (d) use of semipermeable geotextile cover. The materials used for this purpose were olive mill wastewater (OMW) sludge as the main ingredient in all piles, which was then mixed with cattle manure (CM) or goat manure (GM) as the N source, and almond tree pruning waste (Alm) or vineyard pruning waste (Vn) as the C source. Biochar and a bio-mineral (BM) supplement mixture composed of biochar, almond powder, an inorganic P-rich material, and a pH regulator were used as additives. Lastly, for covering the composting piles, a semipermeable geotextile cover (TenCate Toptex®, polypropylene non-woven, 200 g·m−2) was used.
The physicochemical characteristics of each ingredient are shown in Table 1. These materials were blended in different proportions on a fresh weight basis to obtain optimal C/N ratios (20 ± 2). A total of 4 different mixtures were mechanically prepared with 3 ingredients each (Table 1). Then, each mixture was divided into 6 different trapezoidal windrows composting piles: (1) without additive and no cover as the control, (2) with a biochar additive (1% f.w.) and no cover, (3) with the BM additive (1% f.w.) and no cover, (4) without additive and with a cover, (5) with biochar and cover, and (6) with the BM additive and a cover. Therefore, a total of 24 trapezoidal windrows composting piles were made (base dimensions of 3 m × 4.5 m × 1.3 m). The biochar (pH 6.5, EC: 1.7 dS m−1, TOC: 54.1%, TN: 1.4%) used as the additive was obtained from a pyrolysis process (450 °C, 24 h) using urban pruning waste.

2.2. Physicochemical Analyses

The composting piles were sampled at 0 (start-up), 60 (thermophilic), 120 (end bio-oxidative), and 165 days (mature compost) from the start of the process. In each sampling, all piles were sampled using the same method: four subsamples were taken from the bottom to the top at four different points of the pile and were blended together as a representative sample for analysis. All collected samples were dried (60 °C), milled, and sieved to 0.5 mm prior to analysis. All analyses were performed in triplicate (n = 3). Both raw materials and compost were analyzed according to the methods described by Bustamante et al. [27]: electrical conductivity (EC) and pH were analyzed in a 1:10 (w/v) water extract. Total organic matter (TOM) was determined by loss-on-ignition at 430 °C for 24 h. Total nitrogen (TN) and total organic carbon (TOC) were measured by ignition at 1020 °C using automatic elemental microanalyzers (EuroVector elemental Analyzer, Milano, Italy). Humic (Cha) and fulvic content were measured after 1:20 alkaline (NaOH) extraction using an automatic analyzer for liquid samples (TOC-VCSN Analyzer, Shimadzu, Kyoto, Japan). Water-soluble polyphenols (PPHs) were determined using the modified Folin–Ciocalteu method in a 1:20 (w/v) water extract. After microwave acid digestion, the total elemental contents of P, K, Ca, Mg, Na, and heavy metals were analyzed using ICP-OES. To measure the germination index (GI) of the compost obtained, the germination and radicle length of garden cress (Lepidium sativum) were assessed according to the method of Zucconi et al. [28]. The cation exchange capacity (CEC) was determined using the BaCl2-triethanolamine method.

2.3. OM Modeling and Thermal and Spectroscopic Analysis

Organic matter mineralization during composting was calculated as the OM losses during the process, according to the equation
O M   l o s s   ( % ) = 100 100 X 1 ( 100 X 2 ) X 2 ( 100 X 1 )
where X1 and X2 are the initial (0 days) and specific (60, 120, and 165 days) ash content, respectively. The results were fitted to a first-order kinetic model [29]:
O M   l o s s = A ( 1 e k t )
where A is the maximum degradation of OM (%), k the degradation rate constant, and t the composting time (days). SigmaPlot 13 software was used for curve fitting.
Thermal analysis was performed with a thermobalance (Mettler Toledo TGA/SDTA851e/LF/1600) coupled with a mass spectrometer (Pfeiffer Vacuum Thermostar GSD301T). This system allows the recording of thermograms and mass spectra at the same time. All samples (5–6 mg per sample) were combusted in an Al2O3 pan with a mixed stream of oxygen/He (20/80%) at a constant gas flow of 100 mL min−1, within a temperature range of 25 to 650 °C, with an increase of 10 °C min−1 and self-controlled calibration. To evaluate the transformation of organic matter during the composting process, as well as the OM stability of the end product, the R1 and R2 indexes were used. The R1 index is obtained from thermogravimetry (TG) data and is the ratio of the weight losses associated with the second (400–580 °C) and first (250–400 °C) exothermic peaks. It has been identified as a reliable parameter for evaluating the level of stabilization of OM in compost samples [30]. And the R2 index indicates the ratio of energy needed by a compound for its combustion, corresponding to the same peaks obtained by DTA [31]. Therefore, these indicators correlate with the enrichment of aliphatic compounds (more refractory) relative to labile carbohydrates at lower temperatures. All samples taken during the different composting phases were measured in triplicate. The FT-IR spectra were obtained using a Bruker IFS 66 spectrometer. In all cases, 7–10 mg of each sample was accurately weighed and then mixed with 100 mg of KBr, dried and pressed into pellets. The wavelength resolution was set at 4 cm−1, with a range of 400–4000 cm−1. In all samples, the average value of 20 scans was recorded and corrected using ambient air as the background.

2.4. GHG Measurement During Composting

The gaseous fluxes (CO2, CH4 and N2O) from the composting piles were measured with an opaque and isolated closed chamber (3.534 dm3) using a Gasera One device photoacoustic gas analyzer (Gasera One, Gasera Ltd., Finland). The measurements of CO2, CH4, and N2O were undertaken on days 0, 6, 20, 35, 49, 62, 76, 91, 109, and 154 after the beginning of the process. The concentration of each gas (ppm) was measured in situ from the top of the composting piles and then converted into flux (mg gas m2 day−1) according to the protocol established by Sánchez-Navarro et al. [32]. Cumulative gas emissions during the experimental period were calculated by multiplying the average flux of the two consecutive measurements by the time elapsed between them. In addition, the total surface area (trapezoidal prism shape) of each pile was taken into account to calculate the total gaseous emissions from the composting piles. The total global warming potential (GWP) for each pile was expressed as CO2-eq and calculated according to the factor proposed by the IPCC 2023 [33] for each gas, where N2O and CH4 account for GWP (100-year time horizon) values of 273 and 27.2, respectively. CO2 emissions from the composting process were not included in the GWP, as they are considered to be of biogenic origin [34].

2.5. Economic Value of the Product

The economic value of the compost obtained was calculated according to its fertilizing units and humic substance content, determined using analytical methods. It was calculated based on the value of the N, P2O5, and K2O fertilizing units and humic fertilizer as mineral fertilizer urea, diammonium phosphate (DAP), and potassium chloride (KCl) [35], respectively. Each value was obtained from the average marketable values (EUR/t) of these fertilizers in 2023, provided by the World Bank. A compost moisture content of 25% was considered, as it is the average water content in commercial compost that complies with the range established by Spanish Royal Decree 999/2017 (BOE-A-2017-14332) (<40% moisture for commercial compost).

2.6. Statistical Analyses

The data analysis was performed using Infostat® (v.2020), a statistical software package linked to the R programming environment [36]. One-way analysis of variance (ANOVA) and the least significant difference (LSD) test at p < 0.05 were used to assess the statistical significance of differences between the values of each parameter (N sources and C sources) studied during composting. SigmaPlot 13 software was used to calculate the OM loss during composting, according to the first-order kinetic function. Adjusted R-squared (R2adj) and F values were used to fit the curve to the kinetic function and ensure the statistical significance of the correlation. Two-way ANOVA and LSD tests were used to assess the differences between the values of each parameter (N sources, C sources, cover, additives, and OMW) studied during composting. Daily greenhouse gas fluxes, accumulated greenhouse values, and GWP were also analyzed using one-way and two-way ANOVAs, as previously discussed. The exothermic index (EXI2) is defined as the quadratic sum of the daily difference between the temperature inside the pile and the environmental temperature during the bio-oxidative phase. Pearson’s correlation coefficients between the physicochemical parameters of the end products and the GHG flux emissions of the different compost piles were also determined.

3. Results and Discussion

3.1. Temperature Changes and Exothermic Indexes

The changes in the temperature profile (Supplementary Data) showed a quick increase in the temperature values for all co-composting piles independently of the strategies used. Thermophilic values (>40 °C) were quickly reached and lasted at least until the first turning event (day 20), except for Mixture 3, without additive and no cover. All the piles maintained thermophilic temperatures, which were reactivated after the turning events for 80 days after the beginning of the process. After the turning event carried out on day 90, the temperatures progressively fell, reaching ambient values, indicating the end of the bio-oxidative phase of composting. As shown in Table 2, the maximum temperature reached showed a statistical difference when the different mixtures tested were compared. In addition, the exothermic behavior also showed statistical differences when comparing mixtures, supported by the number of days each mixture was found to be over 50, 60, and 70 °C. In this sense, Mixture 1 and Mixture 3 did not reach 70 °C in the piles, while Mixture 2, and especially Mixture 4, showed temperatures over 70 °C for 1 and 11 days, respectively. This could be explained by better conditions of oxygen diffusion in these mixtures, as the temperature increase is caused by the microbial exothermic activity during aerobic organic matter decomposition [37].
Regarding the different variables tested, the highest average temperature was found in mixtures in which Vn was used as the C source. Vn mixtures reached higher temperatures (+10 °C as the maximum and +6.1 °C on average), so their exothermic index (EXI) was also remarkably higher. The exothermic activity was not affected by the N source, and no major differences were found in the thermal behavior of the composting piles depending on the use of CM or GM. The type of composting system used in this study (commercial scale with periodic turning) did not produce significant differences between the piles with a geotextile cover and those without. In this sense, research studies such as Sun et al. [38] or Xiong et al. [39] have reported an effect on temperature in composting systems with the use of semipermeable-membrane covers. But in both cases, these studies were conducted in composting systems with intermittent forced aeration. Finally, as can be observed in Table 2, the additives (biochar and BM) in the proportion tested (1% f.w.) did not produce significant differences. Czekala et al. [40], when co-composting poultry manure amended with biochar, reported an increase in temperature effect, and Sebahire et al. [9], in a laboratory-scale composting experiment with cow manure, indicated a higher increase in temperature with the use of biochar in a mixture. In both studies, the biochar amendment added was 5%.

3.2. OM Dynamics and Thermal Analysis

The initial concentration of TOM was higher in Mixture 1 (76.9%), prepared with CM and Alm. Mixture 2 and Mixture 3 presented close initial values of TOM, at 72.2% and 72.1%, respectively. The mixture prepared with the combination of GM, Vn, and OMW obtained the lowest initial value of TOM (68.7%). In all the piles studied, the decrease in the OM content was the greatest during the early stage of the bio-oxidative phase (Figure 1), but with a different intensity depending on the raw material or management strategies used. Regarding N source ingredients, during the thermophilic phase, the piles prepared with CM reached an OM loss of 34.7%, while the piles prepared with GM reached 30.7% of OM loss (Table 3).
In this sense, in a study about anaerobic digestion treatment, Nleya et al. [41] reported a lower biodegradability of goat manure (26% biodegradability) compared to cow manure (81% biodegradability), attributed to slower hydrolysis rates and the more recalcitrant composition of the mineral part of goat manure. A similar effect was observed in the piles prepared with Vn (35% OM Loss) during the thermophilic phase compared with the piles that contained Alm (29.7%) as the bulking agent. Hachicha et al. [42] reported that the nature of the bulking agent plays an important role in the composting of OMW sludge, finding that the use of maize straw results in a lower OM loss, with the thermophilic phase being very short compared with cotton gin waste as the bulking agent. The use of a geotextile cover resulted in a lower OM mineralization rate than the piles without a cover, with OM degradation values during the thermophilic phase of 30.4 and 34.9%, respectively, and an average value at the end of the composting process of 47.8% in covered piles, and 49.3% in no-cover piles (Figure 1). This behavior contrasts with the findings by Xiong et al. [17] in a composting study of dairy cattle manure and wheat straw, where a semipermeable functional membrane cover was incorporated, resulting in greater OM degradation. This discordant result observed between the semipermeable membrane cover used by Xiong et al. [17] and the geotextile membrane cover used in our study can be attributed to two factors. One factor may be the characteristics of the manufacturing material, which provide the two types of covers with different properties, such as pore size distribution, air permeabilities, or water vapor transmission rate. Another factor could be the type of composting system used. Xiong et al. [39] used a forced aeration system with a device at the bottom of the pile, which created a slightly positive-pressure environment under the membrane, enhancing the flow of oxygen into the pile [17]. Finally, the additives used showed slower OM degradation during the thermophilic phase, reaching 31.4% for the biochar treatment, 30.3% for the BM treatment, and 36.5% when no additives were added. Many studies have shown that the addition of exogenous additives, such as wood vinegar [43], superphosphate [44], and biochar [45], can accelerate the decomposition of organic matter and shorten composting time. Biochar has been shown to accelerate the mineralization of organic matter, mainly because the physical and chemical characteristics of this material can enhance the aeration of compost heap [46], stimulate microorganisms and their enzyme activity levels [10], and promote the degradation of organic matter [47]. In our study, the results obtained did not show this organic matter degradation-enhancing effect, although the final value of A was slightly higher in BM and B piles compared with SN piles (Table 3).
The initial R1 and R2 presented similar values in all composting piles, as expected, since the main ingredient in all cases was the OMW sourced from the same storage pond. In addition, the proportions of N source and C source ingredients in the mixtures were calculated in order to obtain close initial CN ratio values. As the composting process progressed, an increase in both R1 and R2 values was observed in all cases, and slight significant differences were found in behavior during the thermophilic phase. The increases in the R1 and R2 values in Mixture 1 and Mixture 2 prepared with CM were higher than those prepared with GM. This increase in R1 and R2 values during compositing indicates an increase in the relative amount of the most thermally stable fraction of the OM with respect to the least stable one [48].
As shown in Table 4, the values of R1 and R2 became stable in the maturation stages of the composting process in all piles. However, when comparing the values of R1 and R2 between samples taken at the end of the maturation phase and the samples taken at the end of the bio-oxidative phase, insignificant increases were observed. This suggests that at the end of the bio-oxidative phase, the organic compounds reached good stability in the composting piles [24], with only minimal changes occurring during the maturation phase. With regard to FTIR, Table 4 shows the value of an intense absorption band in the region related to carbohydrates (1096 and 1037 cm−1) [49]. With respect to the raw materials, the OMW reached the highest value (0.283), with large differences compared with the other raw materials (0.081 GM, 0.067 CM, 0.065 Alm, 0.061 Vn, and 0.03 biochar). At the beginning of the composting process, all the mixtures presented the highest relative absorbance values, with Mixture 3 having the highest absorbance. During the thermophilic phase, the band corresponding to carbohydrates sharply decreased in all the mixtures, after which the values remained stable until the end of composting. This indicates that carbohydrates, including easily biodegradable organic compounds, such as simple carbohydrates, were the most metabolized fraction by the composting microflora at the beginning of the process [42].
The statistical analysis showed that the greater difference in thermostability index (R1) (Table 5) values can be explained by the variable N source. Especially during the thermophilic and bio-oxidative phases, the use of CM as an ingredient in the composting piles leads to higher values of both R1 and R2. When the temperature at which the weight loss occurs is higher, the organic fraction that degrades is consequently more resistant and structurally ordered [24].
The use of coverage also showed significant differences, but with nearly identical values of R1, especially after the end of the bio-oxidative phase and during the maturation phase. Therefore, in view of the data, the amount of OM burned in the two temperature regions was not influenced by the main variables considered, namely the use of different C sources or additives such as biochar or BM.

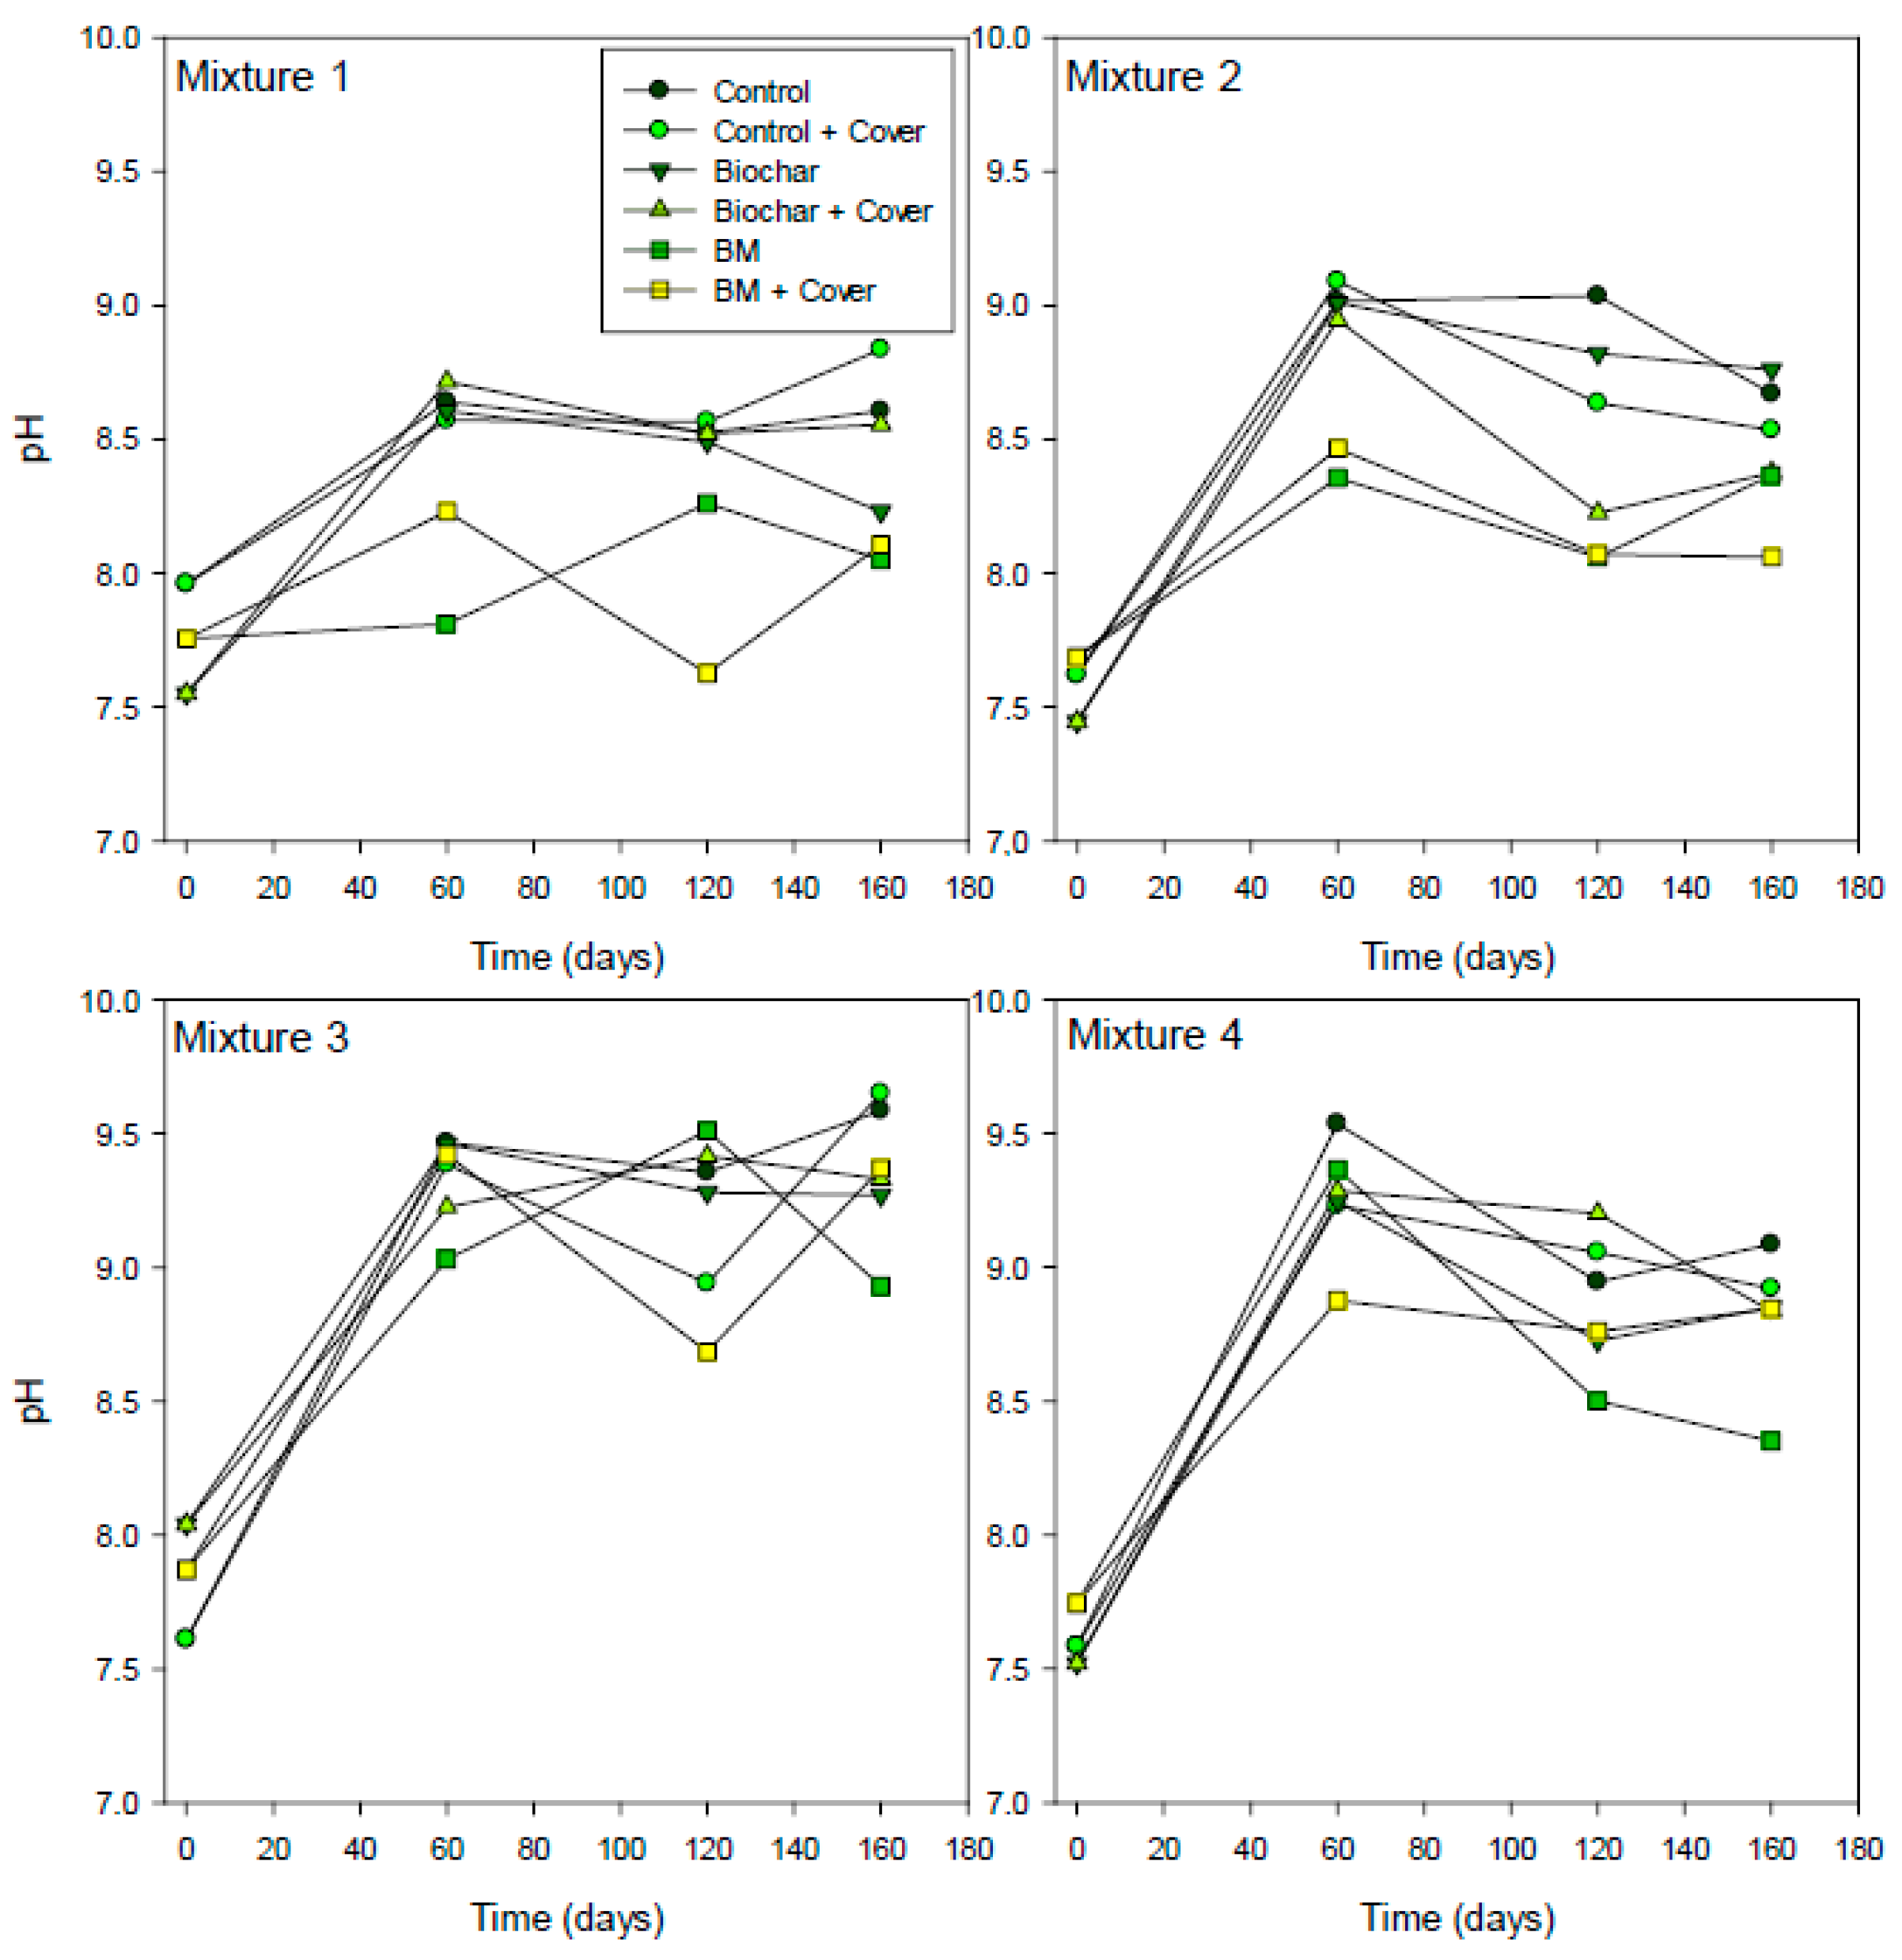
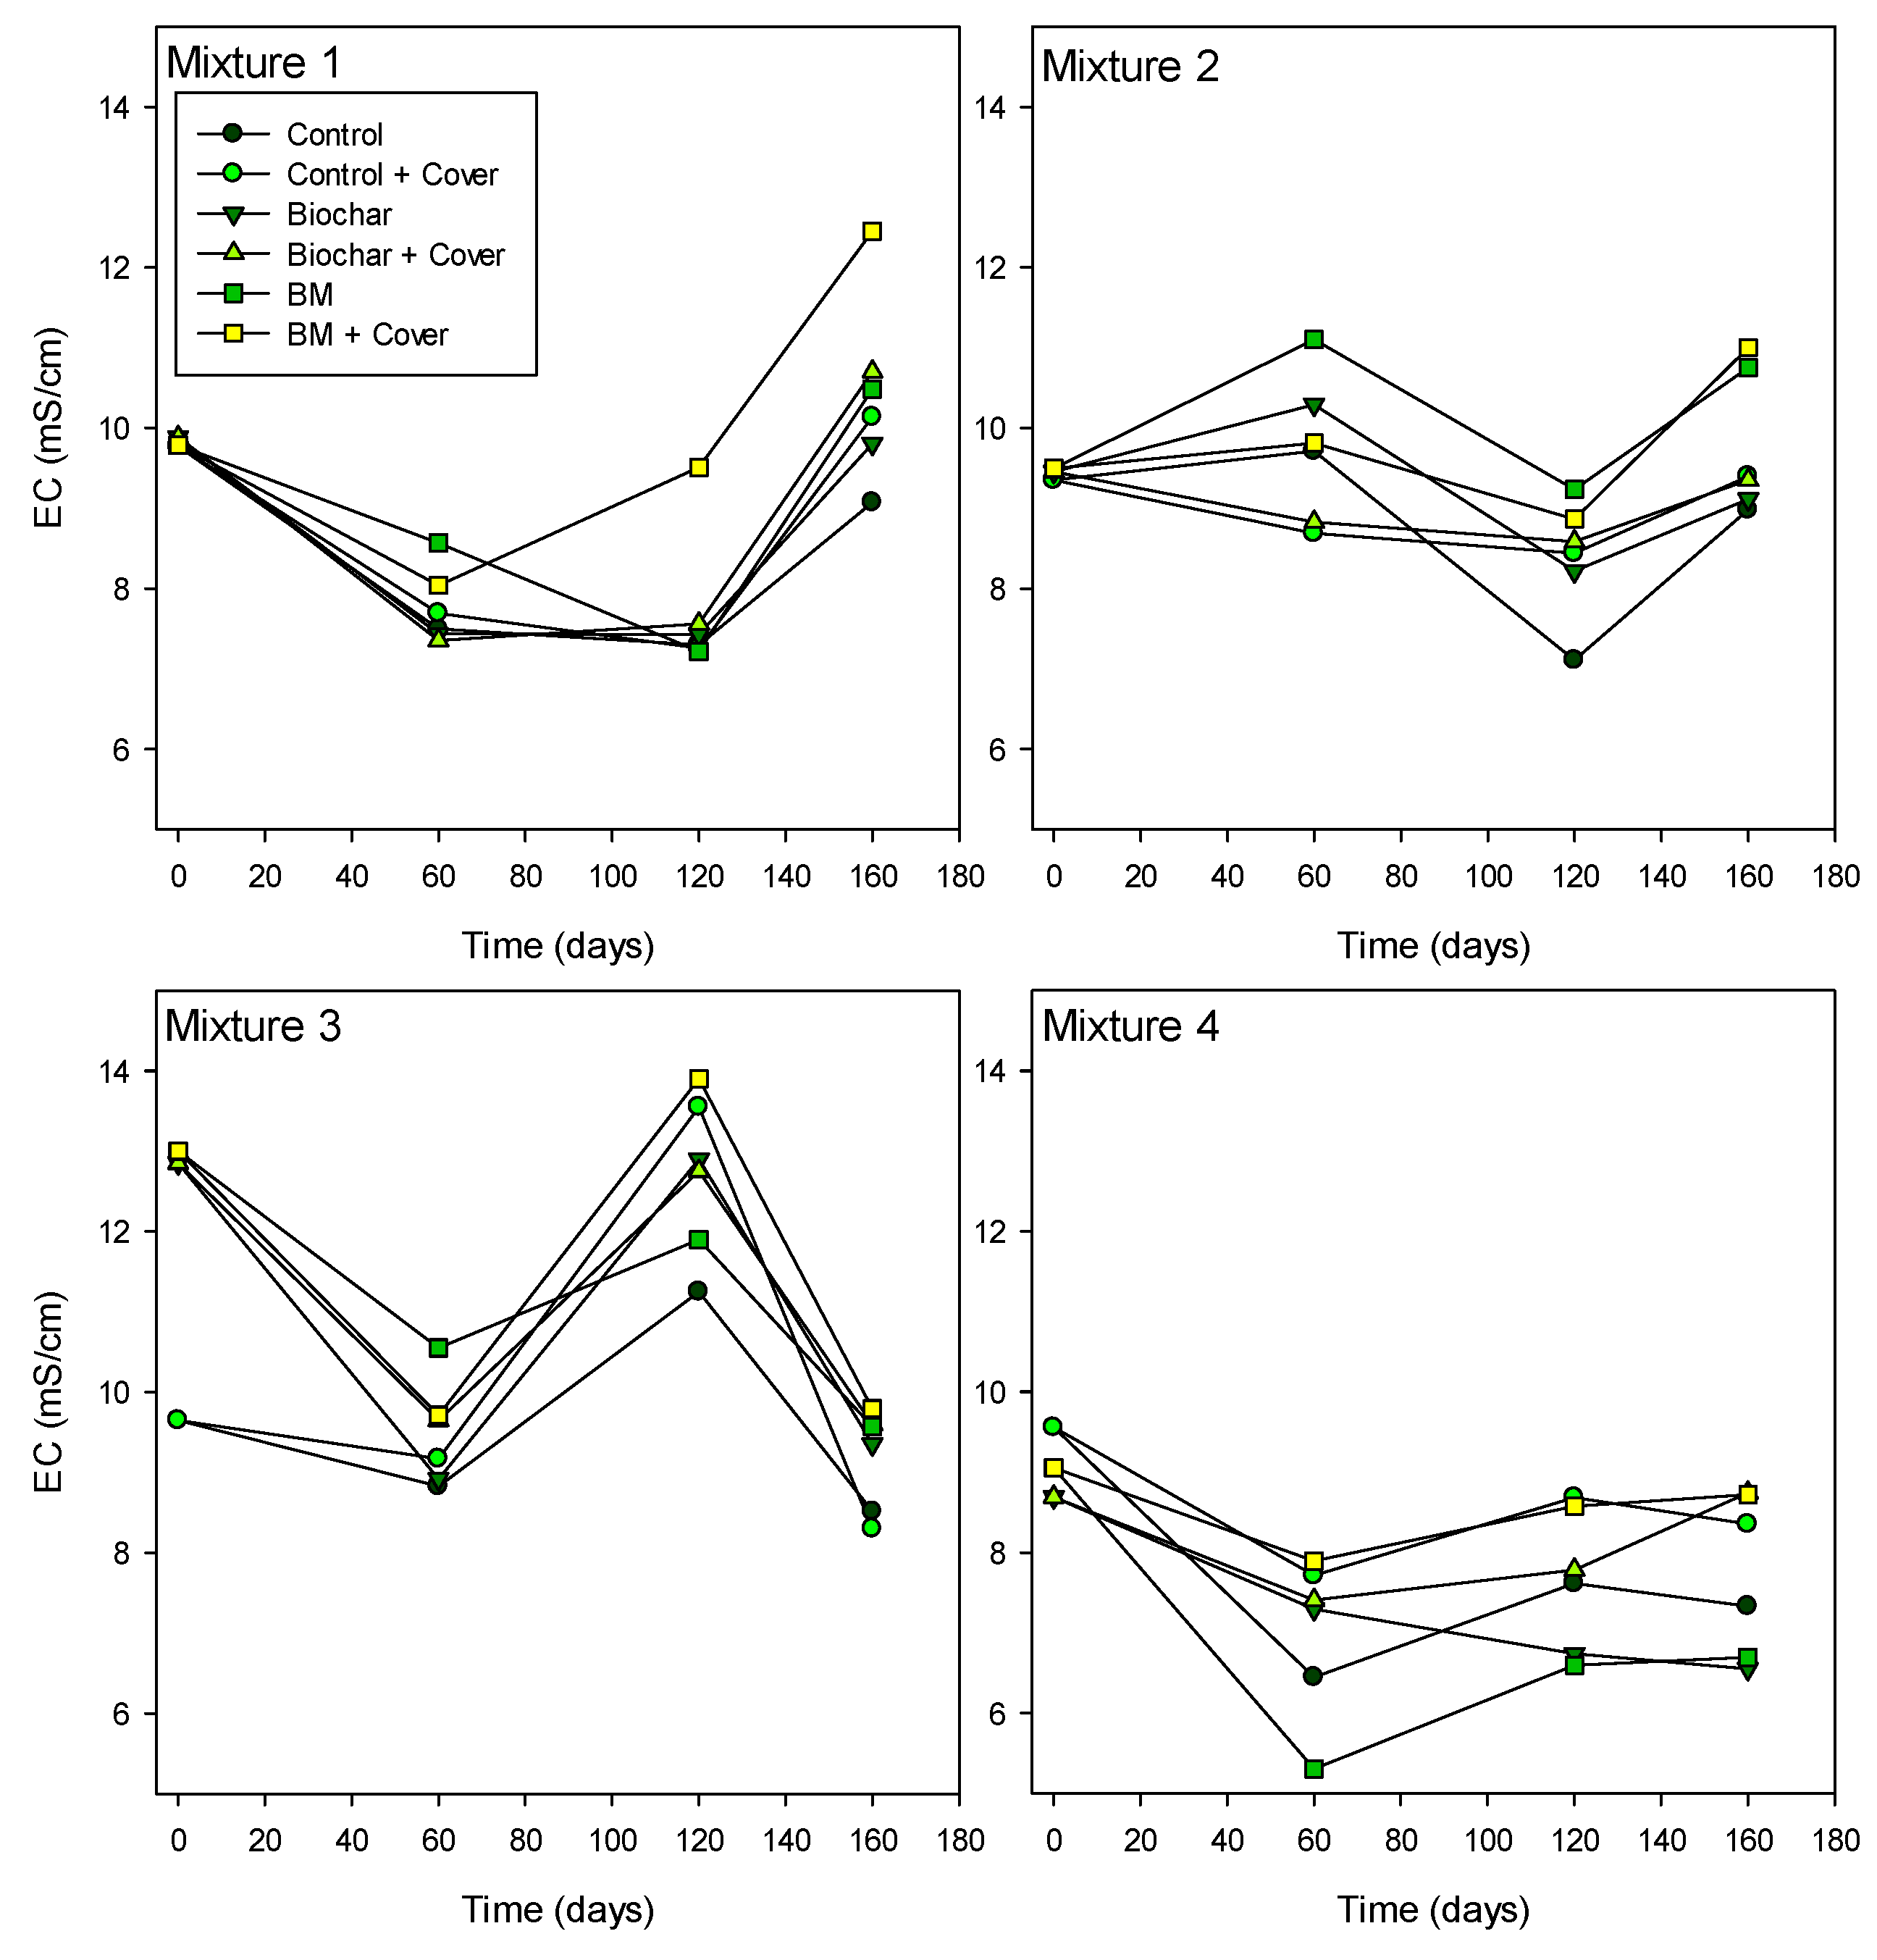
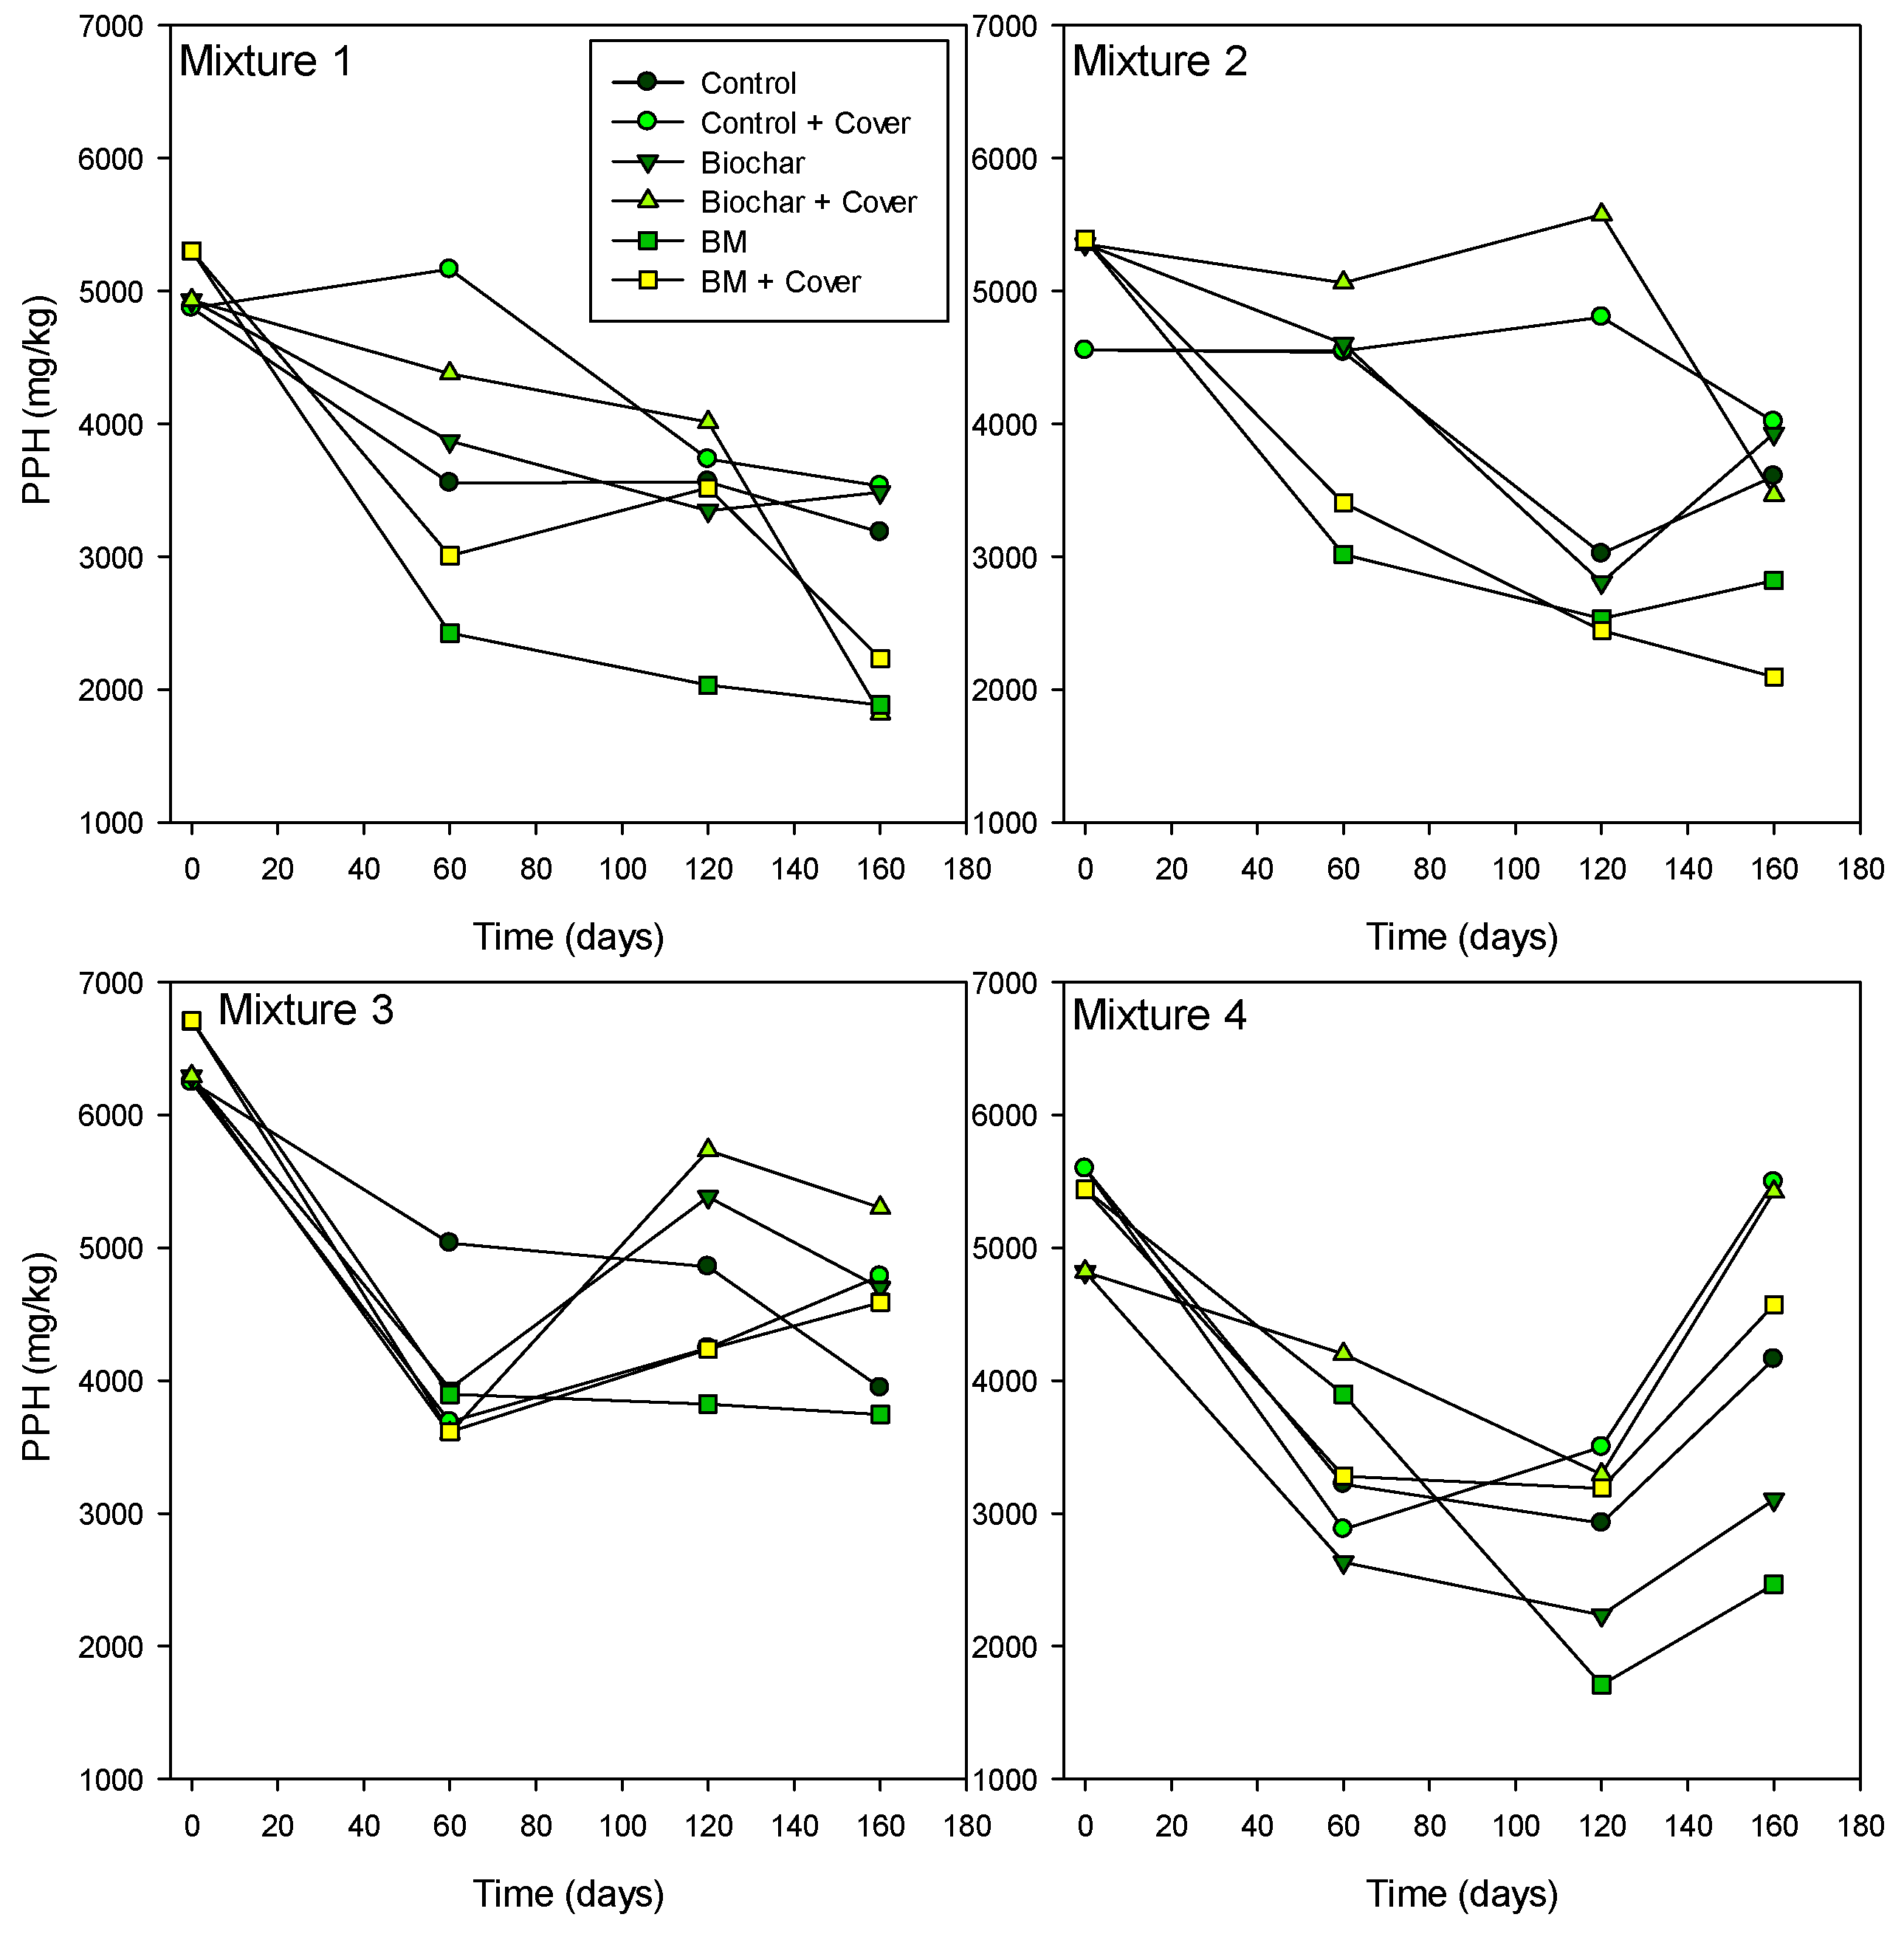
3.3. Changes in Physicochemical Parameters During the Composting Process

Regarding pH (Figure 2), the lowest values were found at the beginning of the treatment process for all strategies tested. All the mixtures started with a pH close to neutrality (7.7 average value) and finished the process with average values of 8.3 in M2, 8.5 in M1, 8.8 in M4, and 9.3 in M3, becoming more alkaline. Wichuk et al. [50] affirmed that the release of ammonium is responsible for the increase in pH during the process, and its volatilization causes a pH reduction as the compost matures. However, Cayuela et al. [51] found that OMW compost kept its pH near 9.5, which correlated well with other indicators of stability and maturity. In the Pearson correlation test, pH showed a negative correlation (r = −0.611 at p < 0.001) with TN content in the piles, supporting the proposal by Wichuk et al. [50] about the increase in pH with nitrogen losses.
The EC (Figure 3) is closely related to salinity content in the bibliography; however, the Pearson correlation showed a strong positive relation between TN and EC (r = 0.696 at p < 0.001), and a lower positive significant correlation was found with Na content (r = 0.243 at p < 0.05). Both Mixture 1 and Mixture 4 exhibited similar behavior in their EC changes. During the thermophilic phase (60 days), EC decreased in Mixture 1 and Mixture 4, but then gradually increased, eventually exceeding the initial levels when BM or a cover were used. Mixture 3 showed a different development, with a marked increase in EC values for all the variables tested at the end of the bio-oxidative phase.
In general, the EC values of the mature composts obtained were found to be in the upper range of values previously reported for compost made from OMW (2.46 dS m−1–7.31 dS m−1) [52,53]. The high EC of the end products could be related to OMW as an ingredient, depending on the sources of OMW, as it can cause a high EC [42], but have no impact greater than N or C sources [54]. As the initial EC of OMW was not as high as the one found in our N sources (Table 1), a high EC of the final compost found in every pile seems to be not caused by it.
OMW is well known for its high concentration of phenolic compounds. These aromatic compounds have a phytotoxic effect and can act as growth inhibitors against some microorganisms present in composting piles [55].
The OMW in our study showed (Table 1) a high concentration of phenolic compounds (29,840 mg kg⁻1), which is higher compared to those reported in other studies that used OMW extracted from storage ponds: 19,996 mg kg⁻1 [52] and 13,400 mg kg⁻1 [56]. This value decreased in the initial mixtures due to the dilution effect when OMW was mixed with the different ingredients used (Figure 4), resulting in a range of 4554–6708 mg kg⁻1. In all the composting piles, a sharp decrease in phenolic compounds was observed during the first two months, with a behavior similar to that described by Hachicha et al. [42] and Sáez et al. [52]. These initial biodegradation processes of the phenolic fraction were more pronounced when BM was used in the process for Mixture 1 and Mixture 2. At the end of the composting process, an average reduction in phenolic compounds was found according to the variables tested: BM 47%, biochar 27%, SN 23%, cover 28%, and no cover 37%. The composts with BM showed a lower PPH content at the end of the maturation phase. Cayuela et al. [57] found a reduction in PPH between 34% and 44% during a windrow OMW composting process, but also found a behavior of increases and decreases in OMW that was attributed to lignin degradation. This could explain the sudden increase in PPH found after the end of the bio-oxidative phase in Mixture 3 and Mixture 4. Hachicha et al. [42] reported a phenol degradation of 72% after 7 months of processing.

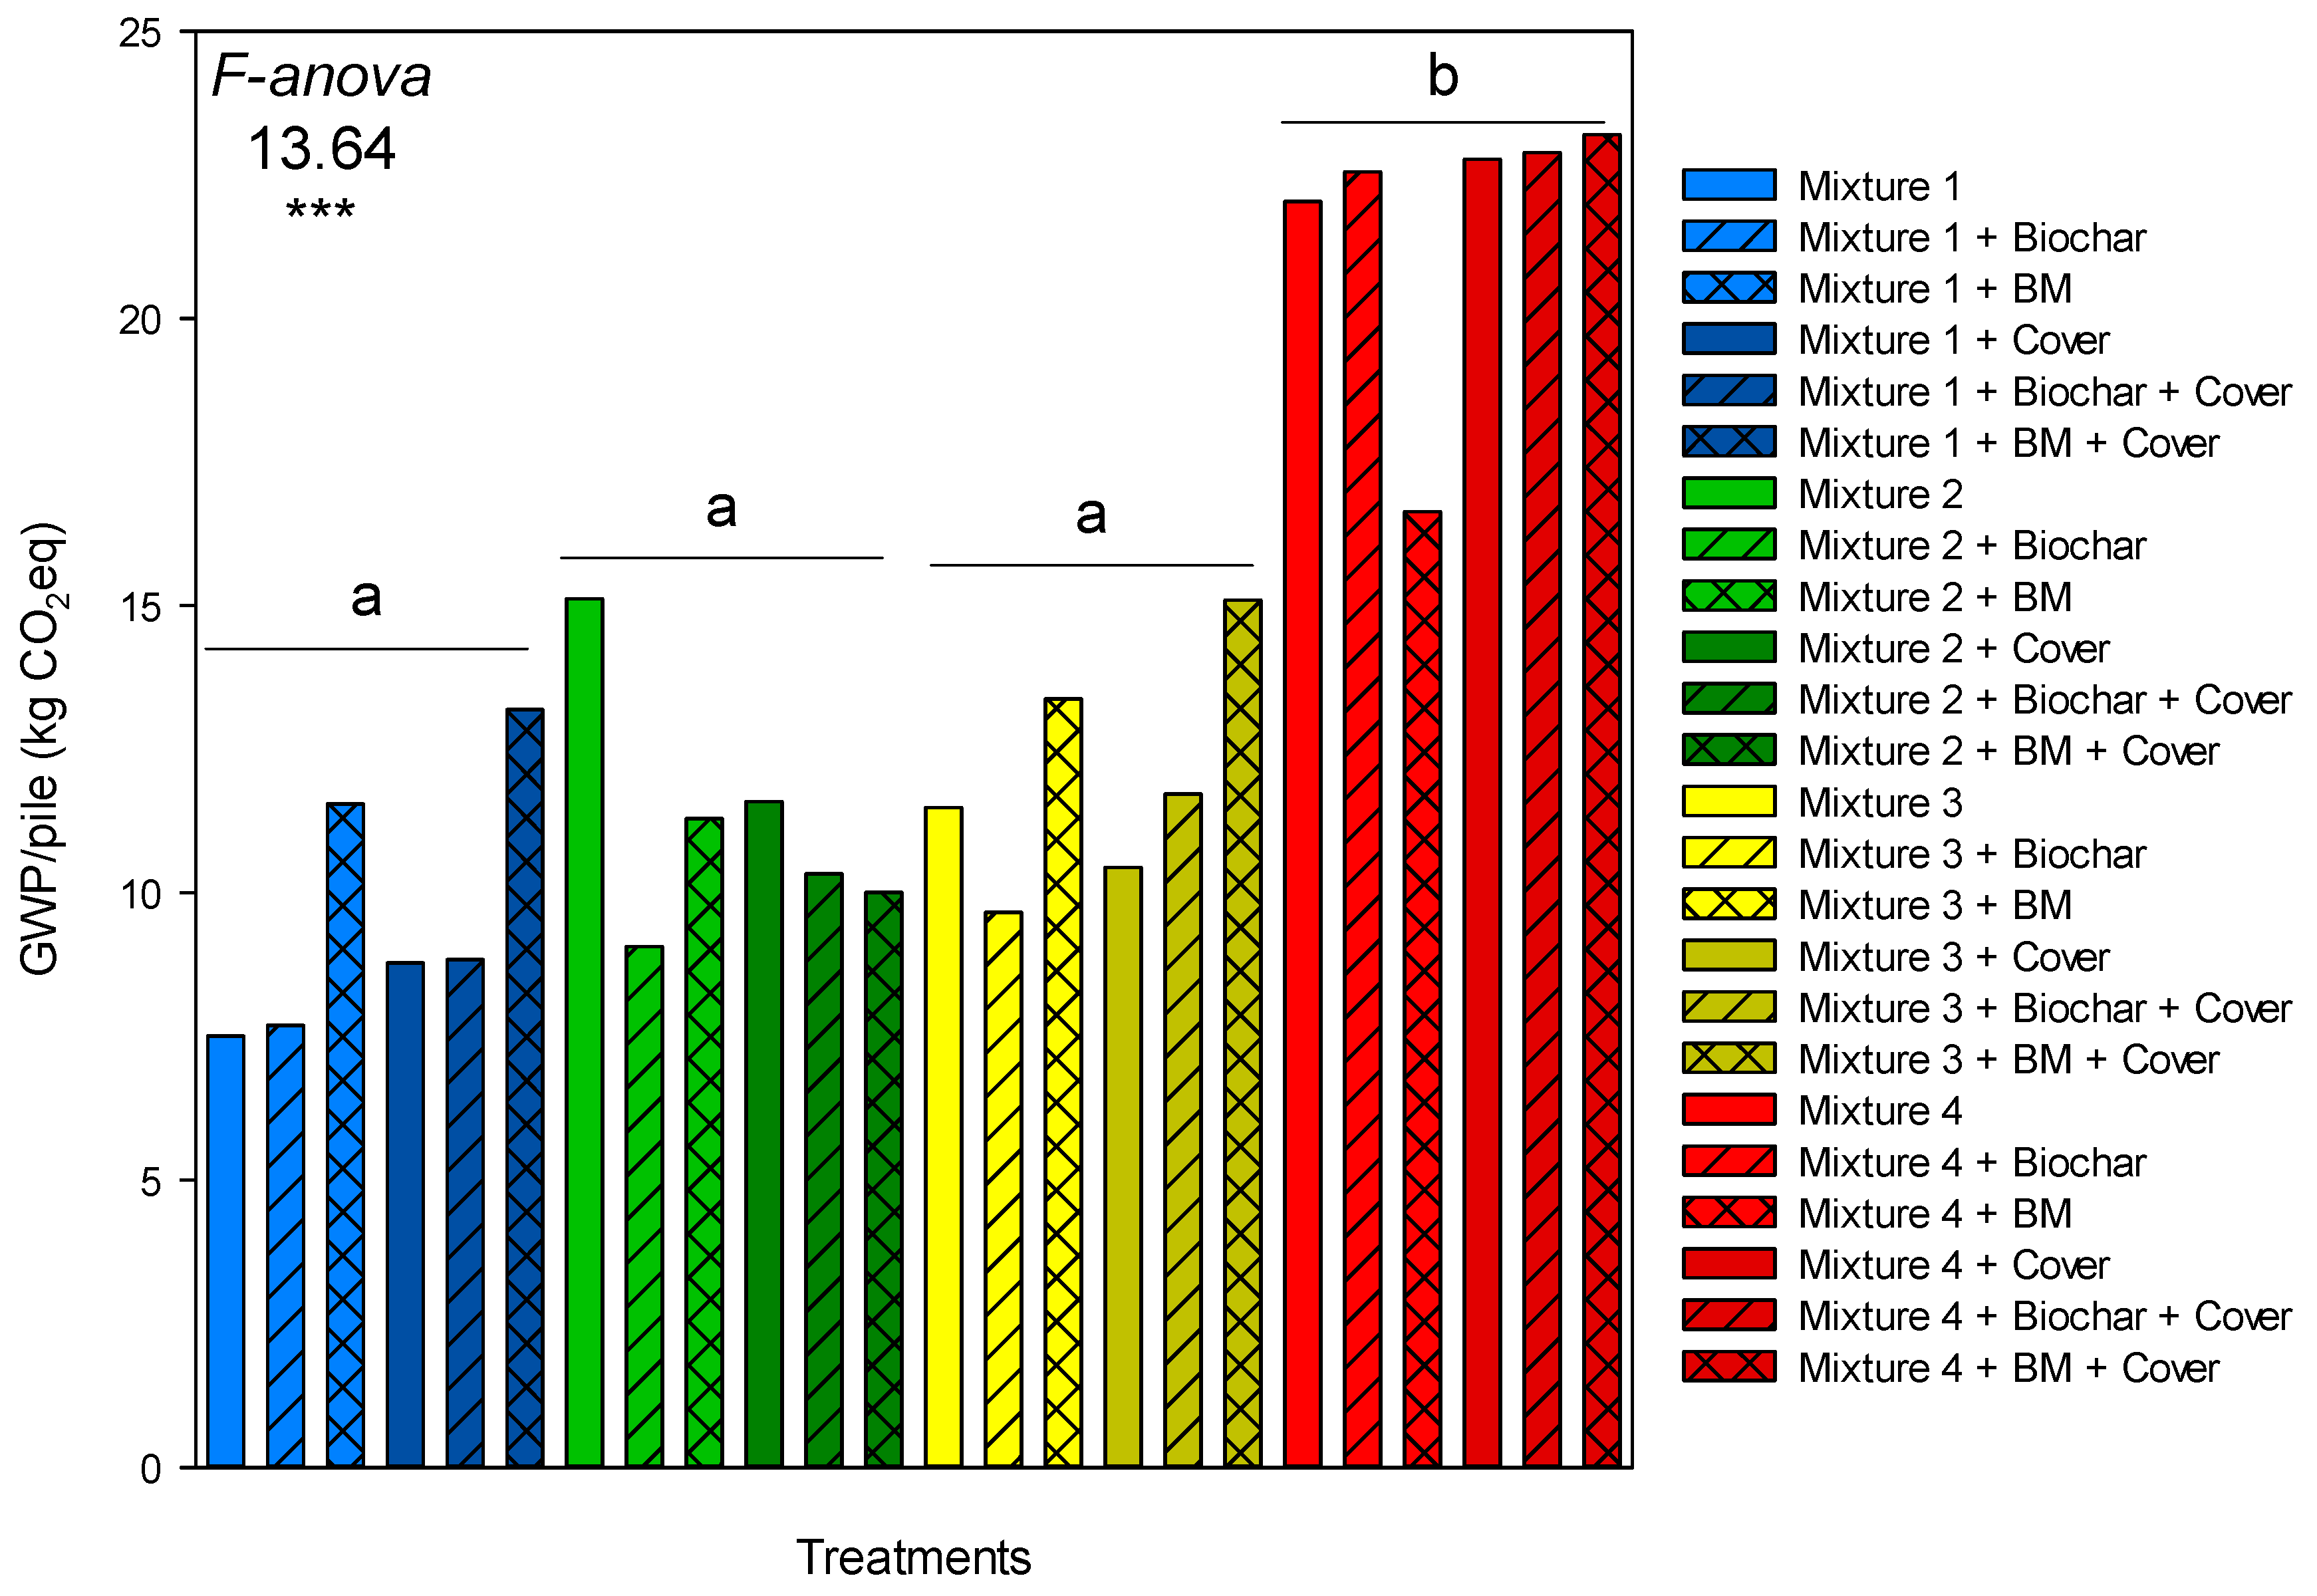
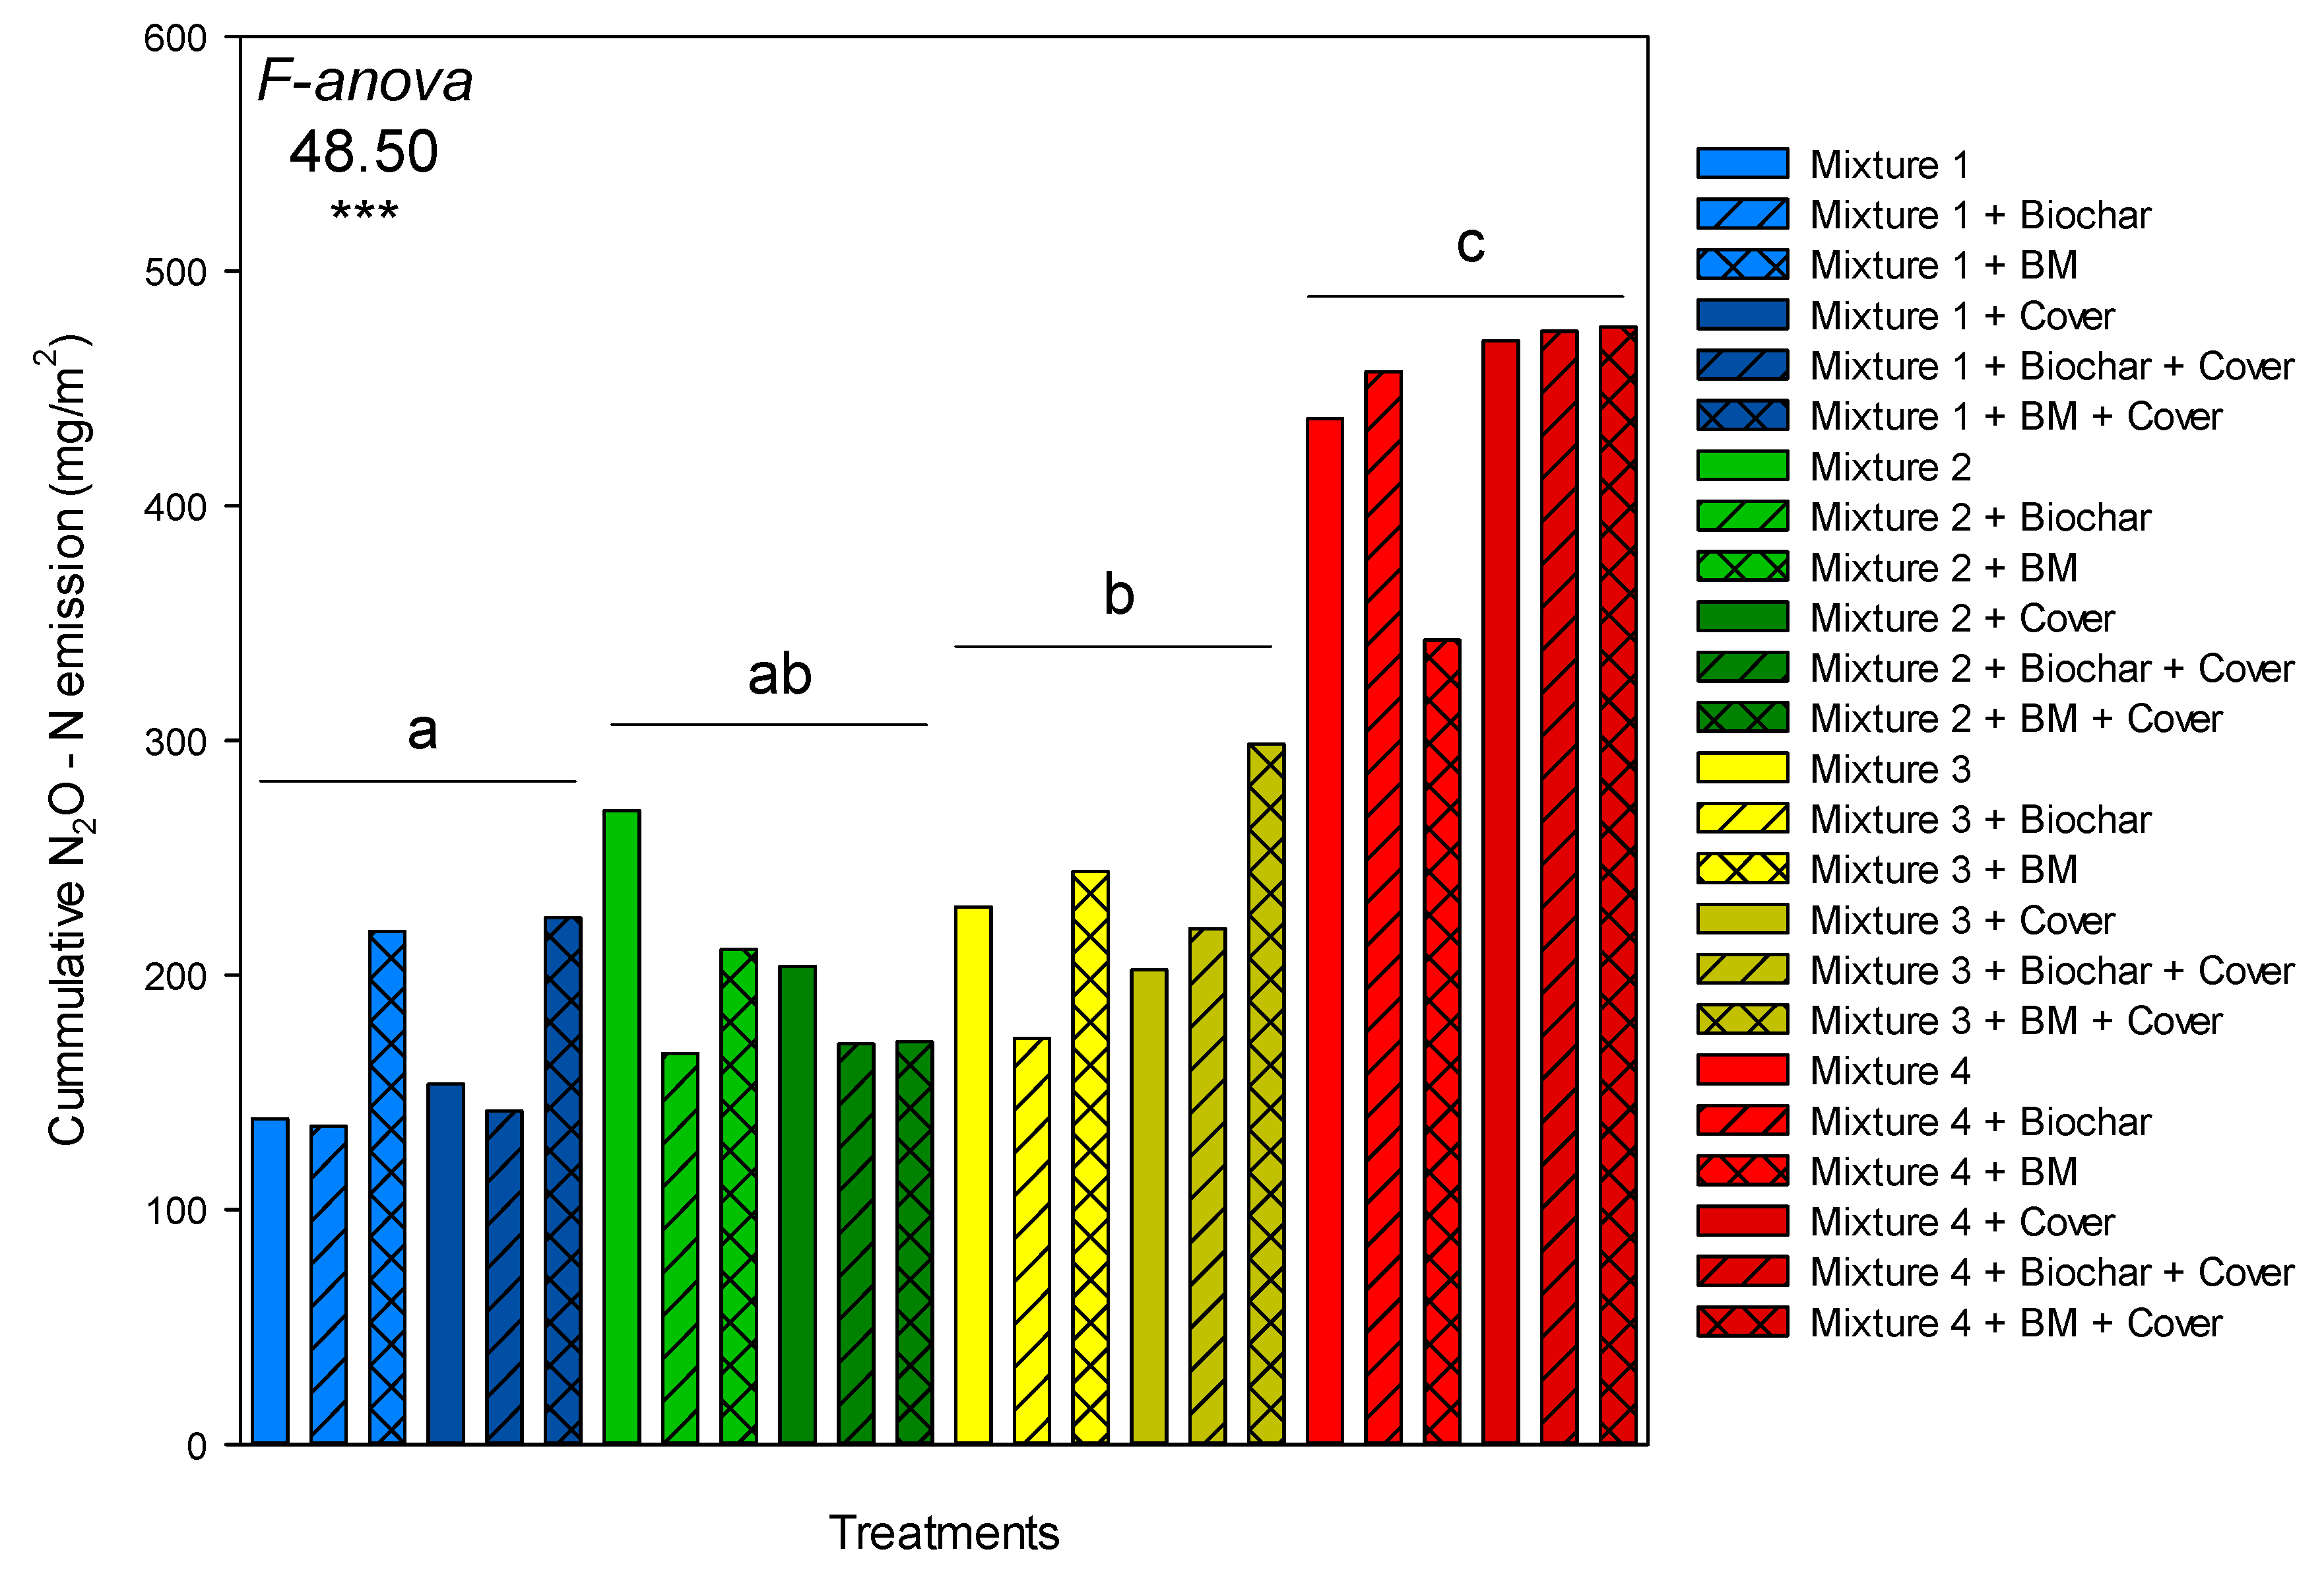
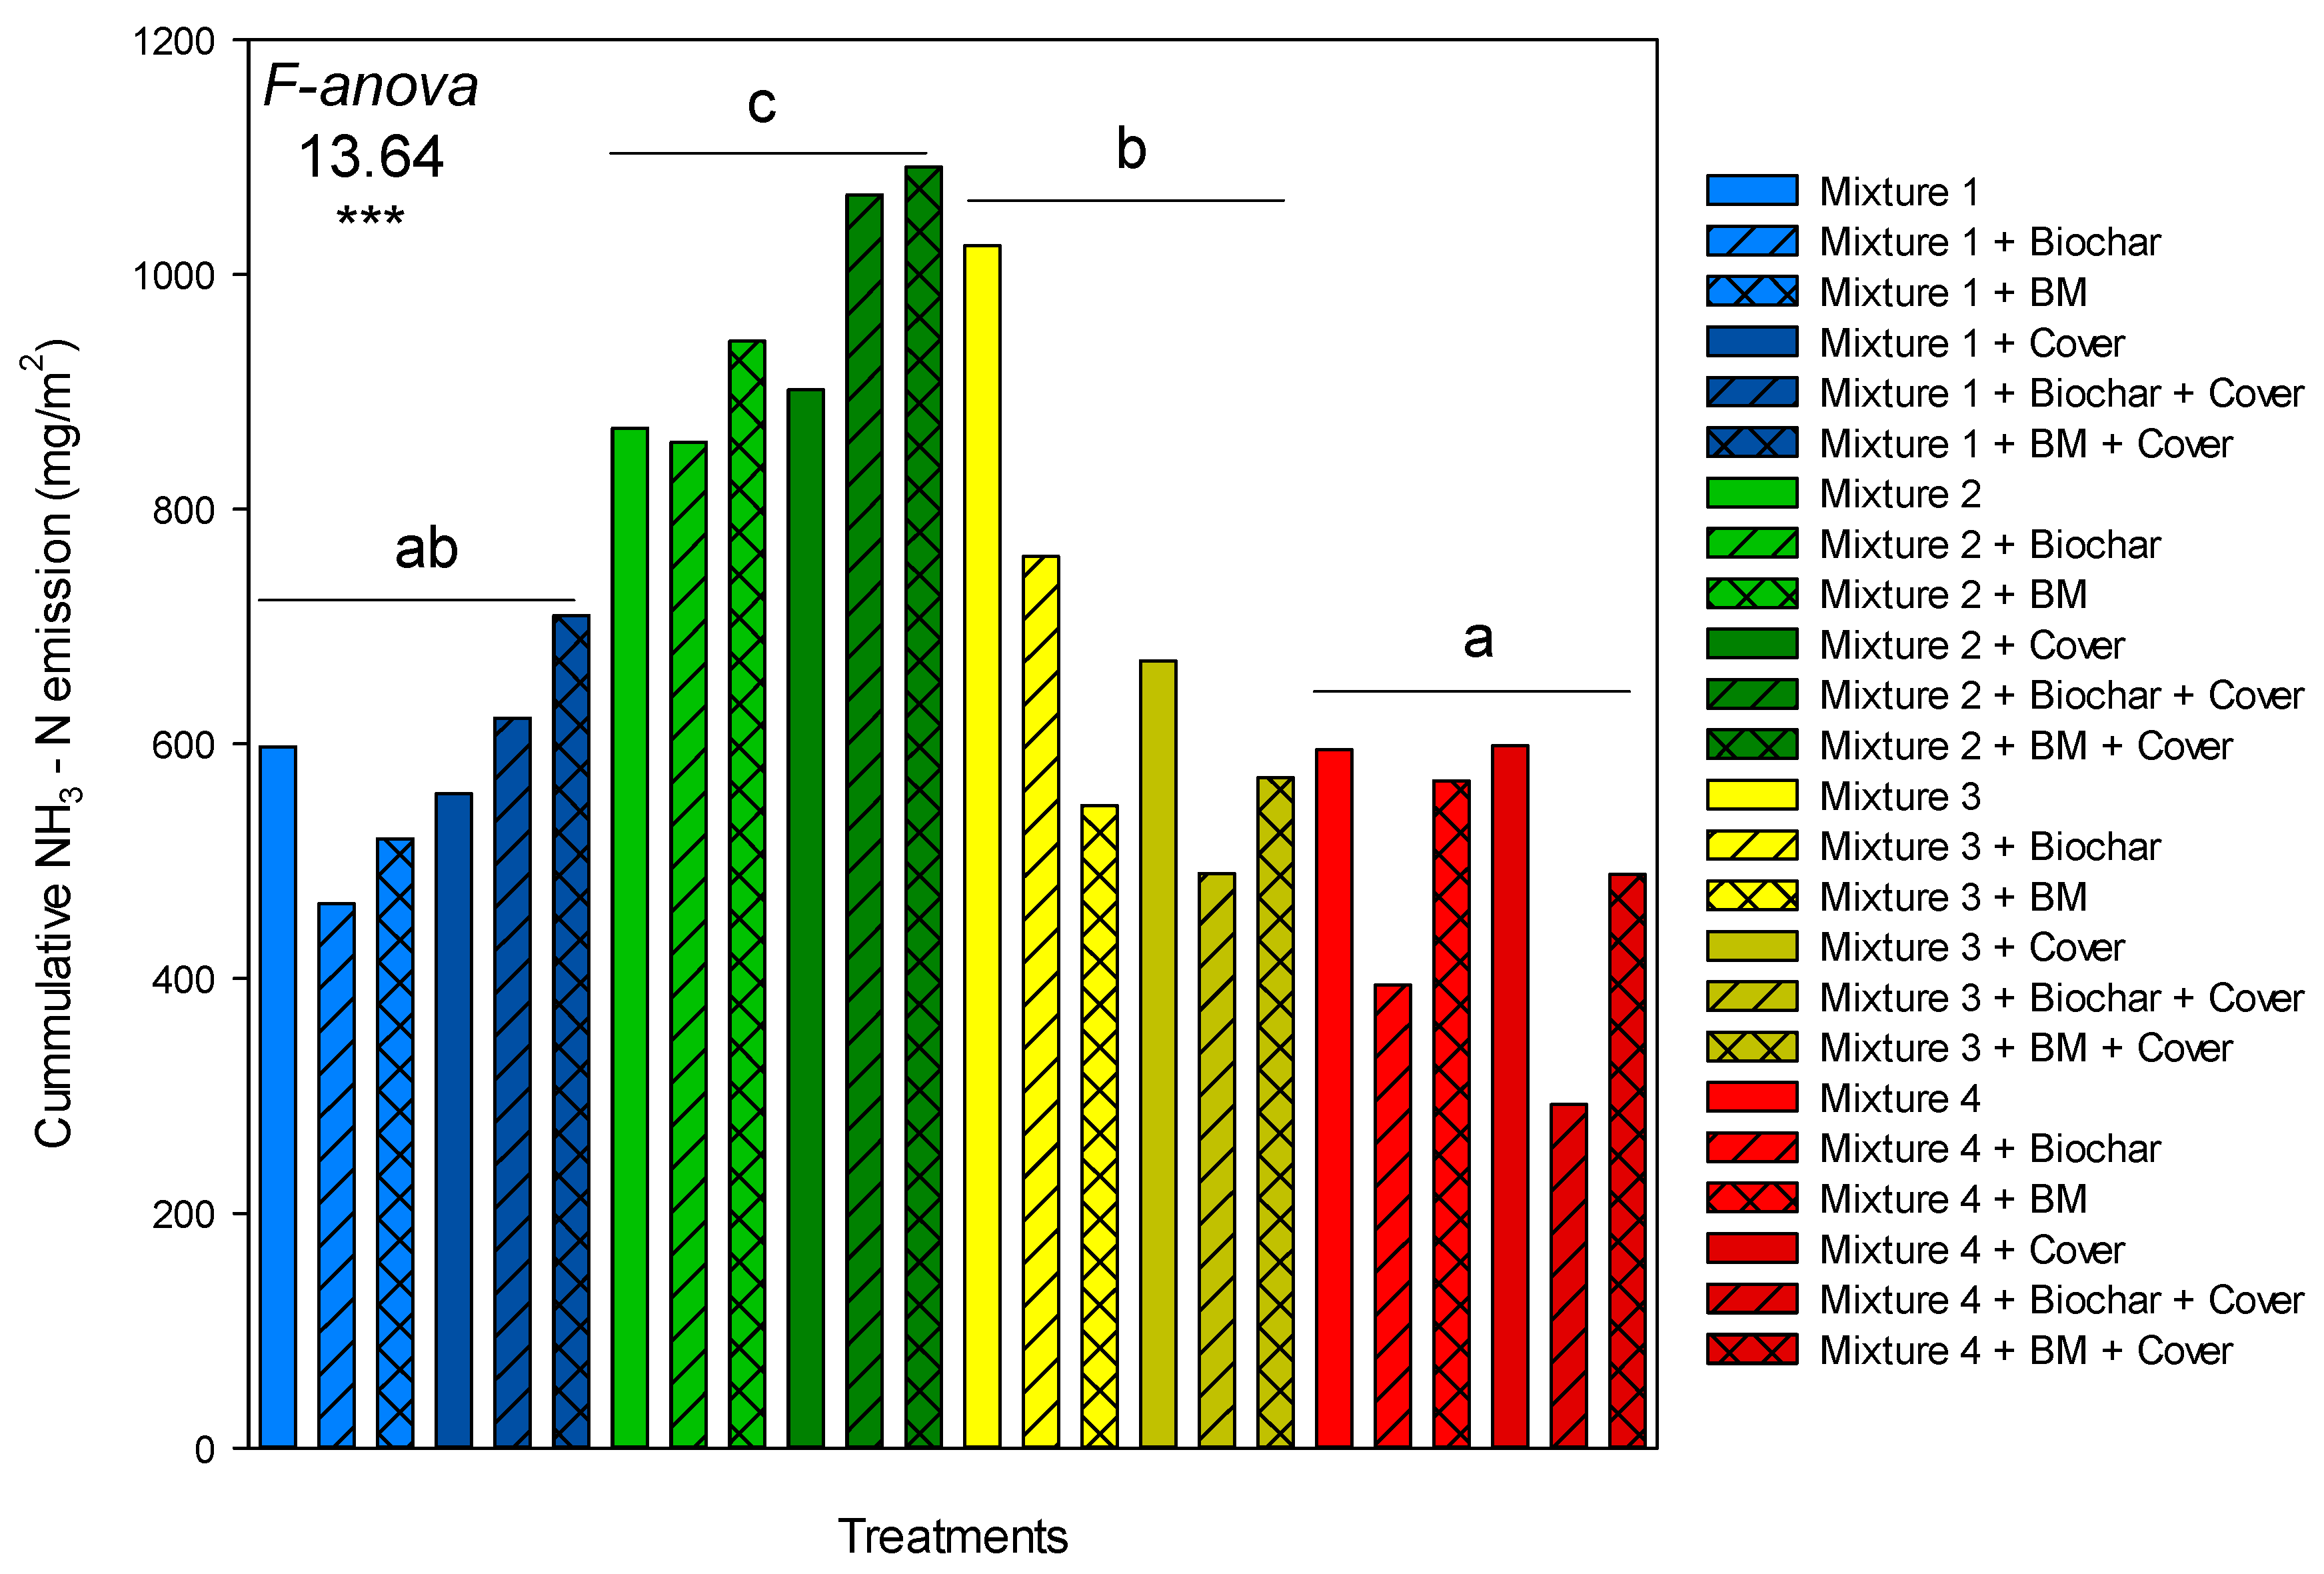
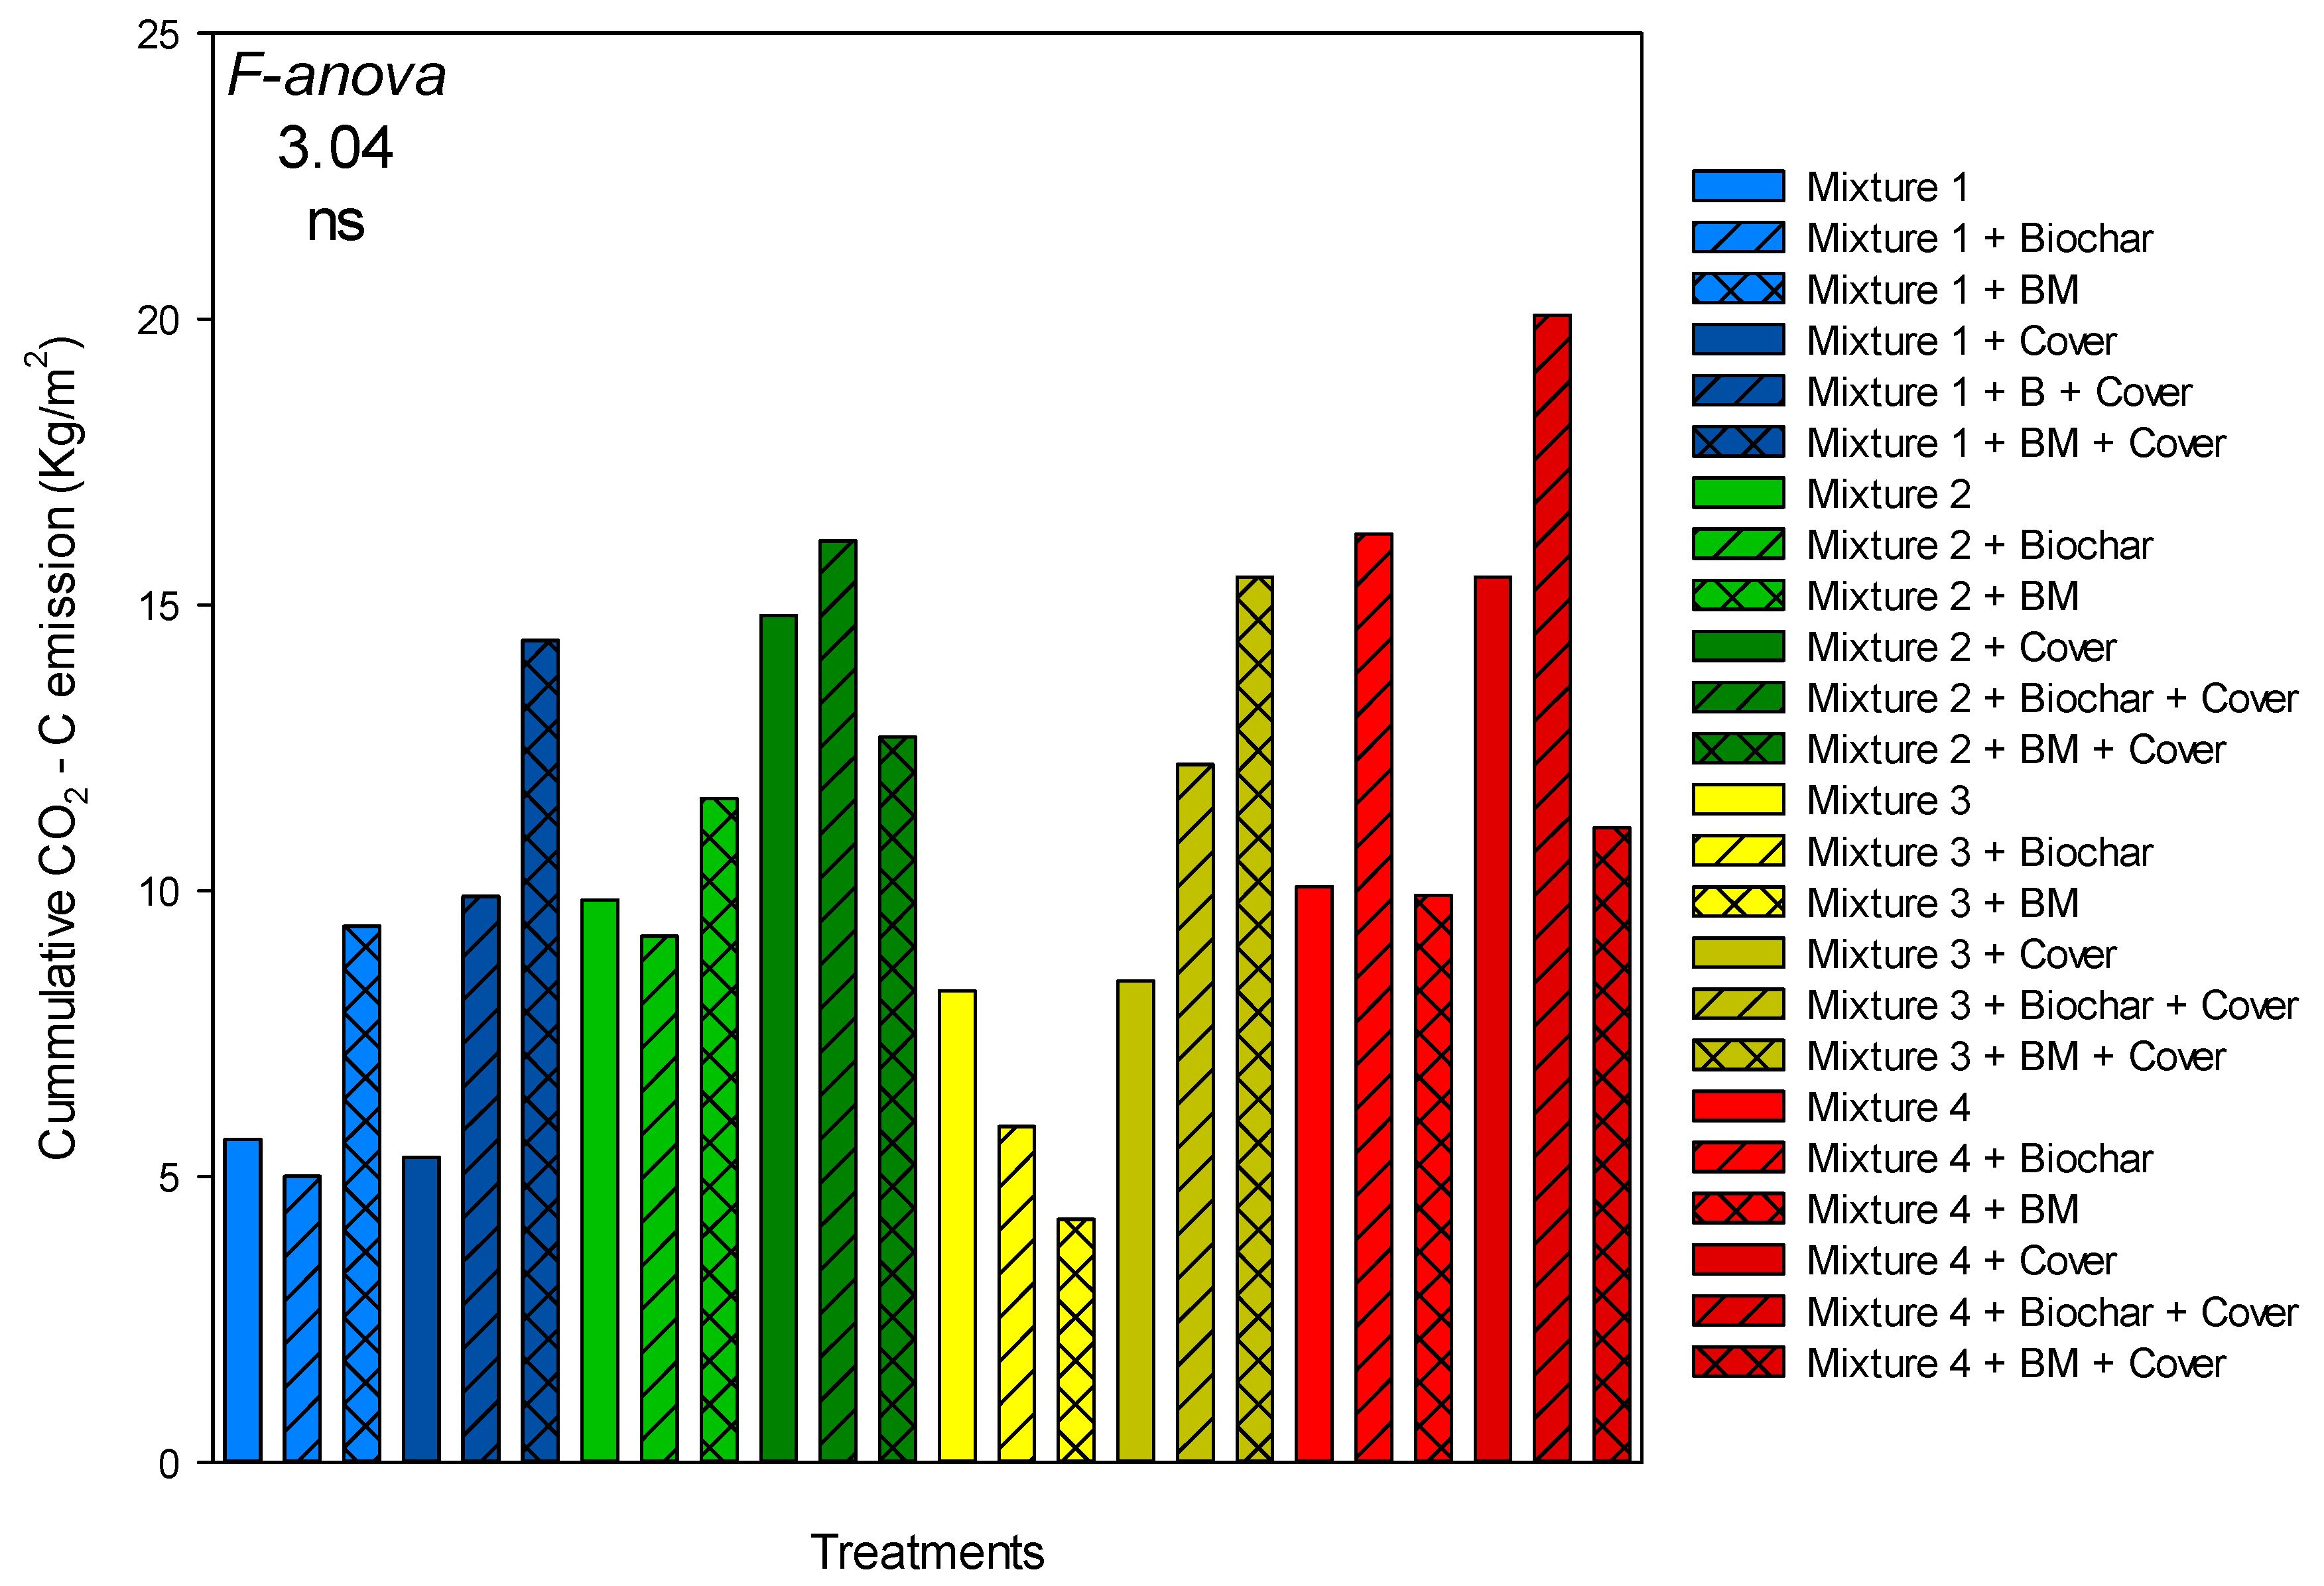
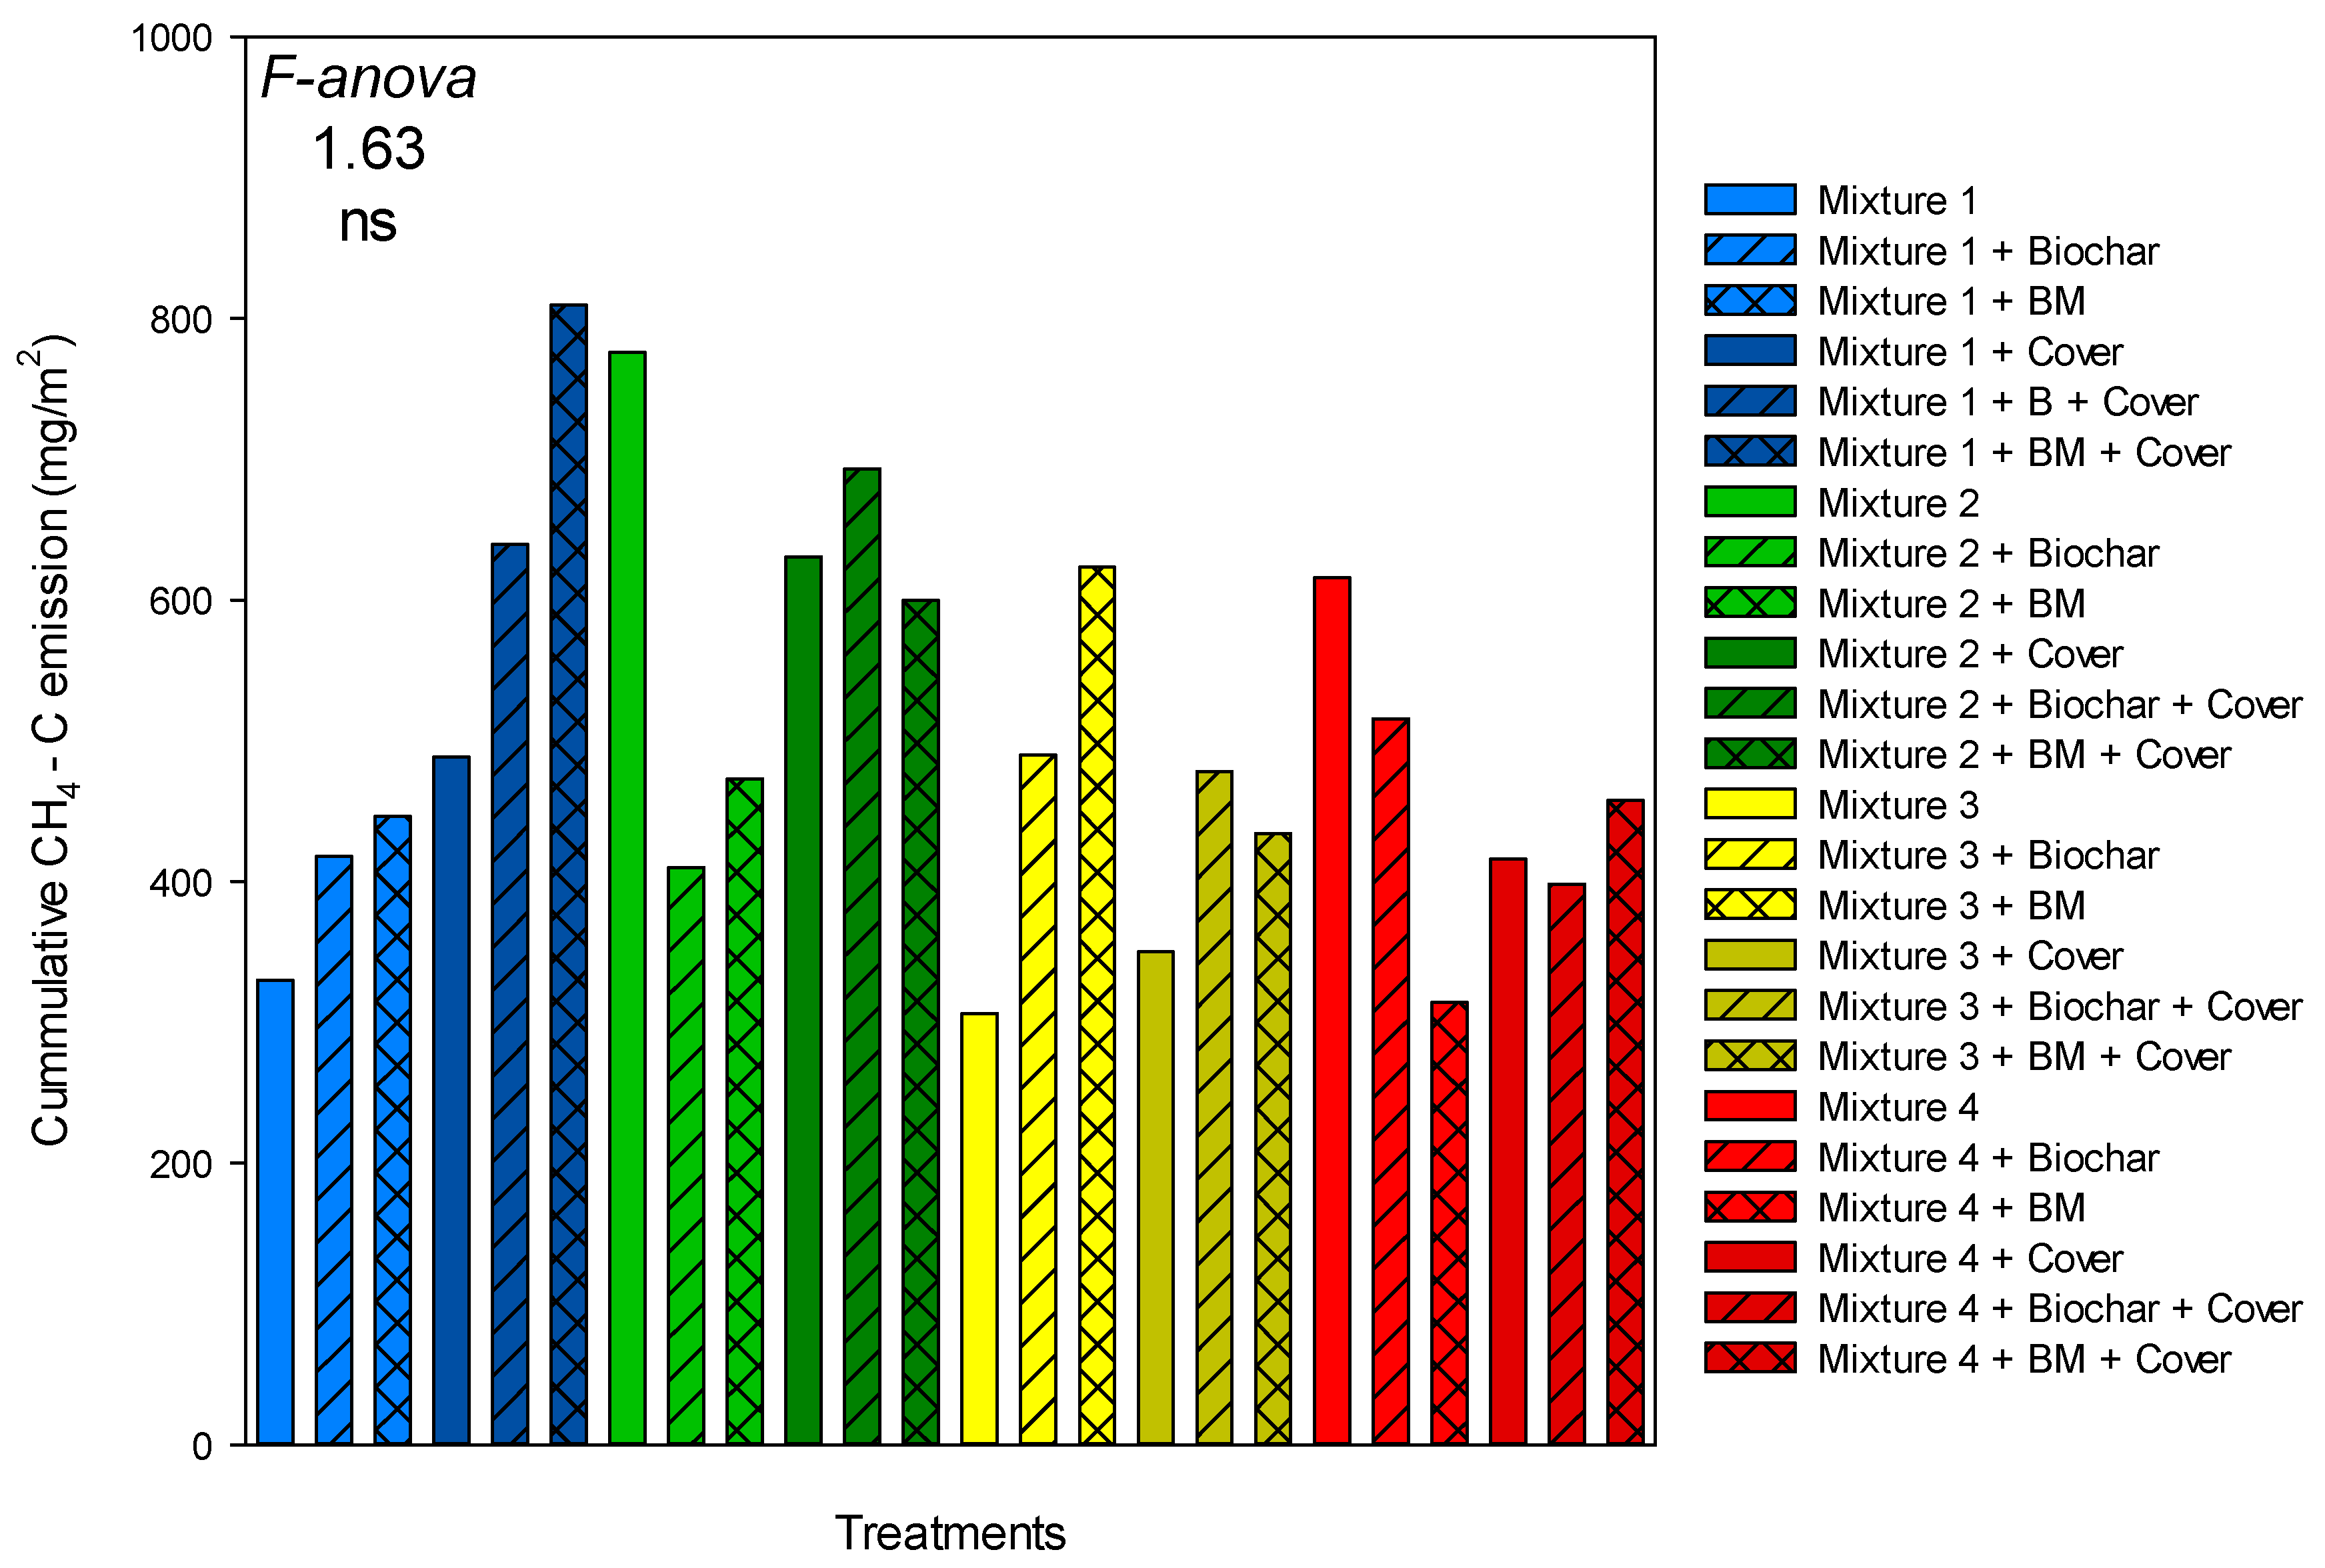
3.4. Greenhouse Gas Emissions During Composting and GWP Assessment

The highest GWP was observed in Mixture 4 (Figure 5), while the other mixtures exhibited no discernible differences. This is attributable to Mixture 4, showing the highest accumulated emission of N2O (Figure 6) (with an increase in emissions of 61%, 55%, and 48% for Mixture 1, Mixture 2, and Mixture 3, respectively). However, the statistical results revealed that the greatest nitrogen losses were observed in Mixture 2 due to NH3 emissions (Figure 7). No differences were found in CO2 (Figure 8) or CH4 (Figure 9) emissions for the different mixtures tested. With respect to the N source, GM was responsible for the highest N2O emissions, although CM expressed higher emissions of NH3. Overall, the GWP index was higher in GM composts.
Ba et al. [58] found that N2O emissions were positively correlated with the TN content of composting material, as they are produced during incomplete nitrifying/denitrifying processes under aerobic or anaerobic conditions. However, GM had a lower TN content (1.87%) than CM (2.15%), and subsequently, the initial mixtures prepared with GM also had a lower average nitrogen content (1.85%) than those prepared with CM (2.05%). Another explanation can be the one provided by Pardo et al. [59], who in a meta-analysis about the effect of different composting systems on gaseous emissions, suggested that management practices have an even greater influence than the composition of raw solid waste. The use of Vn (Table 6) as the carbon source caused an increase in N2O and CO2 emissions compared to Alm. The behavior of CO2 emissions was similar to that shown by geotextile-covered piles, suggesting that the C source and the presence of a cover were the main causes of variability in CO2 emissions. The additives used were not statistically significant for different GHG flux emissions or did not have an effect on the GWP index.
Other studies have tested biochar as an additive in composting processes and found a reduction in N losses ranging from 6% to 86%, depending on the application rate of biochar, from 3% to 25%, with a decrease proportional to the rate of biochar added [60]. Higher application doses have also been successfully applied, with a mitigating effect on GHG emissions, from 20% [61] to 50% [62]. However, doses higher than 20% are discouraged due to the potential negative effect on microbial activity, which can slow down the process [63]. As this study applied biochar at 1%, this percentage could be insufficient to represent a statistically significant impact on N2O, NH3, or CH4 emissions.
Piles covered with a semipermeable geotextile material increased their CO2 (Figure 8) emissions by 67.5% compared to the regular pile management, which was in contrast to the observations in other studies. The authors of [14] found a significant decrease in NH3, CO2, CH4, and N2O emissions when a semipermeable membrane was used. In addition, Xiong et al. [39], when using a composting system with a functional membrane cover, reported a decrease of 23% in CH4 emissions, which they attributed to the highest temperatures reached in the covered pile. They observed that in the covered piles, the methane emission rate gradually decreased as methanogenic bacteria became inhibited by the high temperatures reached during the thermophilic period [64]. However, as noted above, under our experimental conditions, we found no differences in the exothermic behavior between cover and no-cover piles.

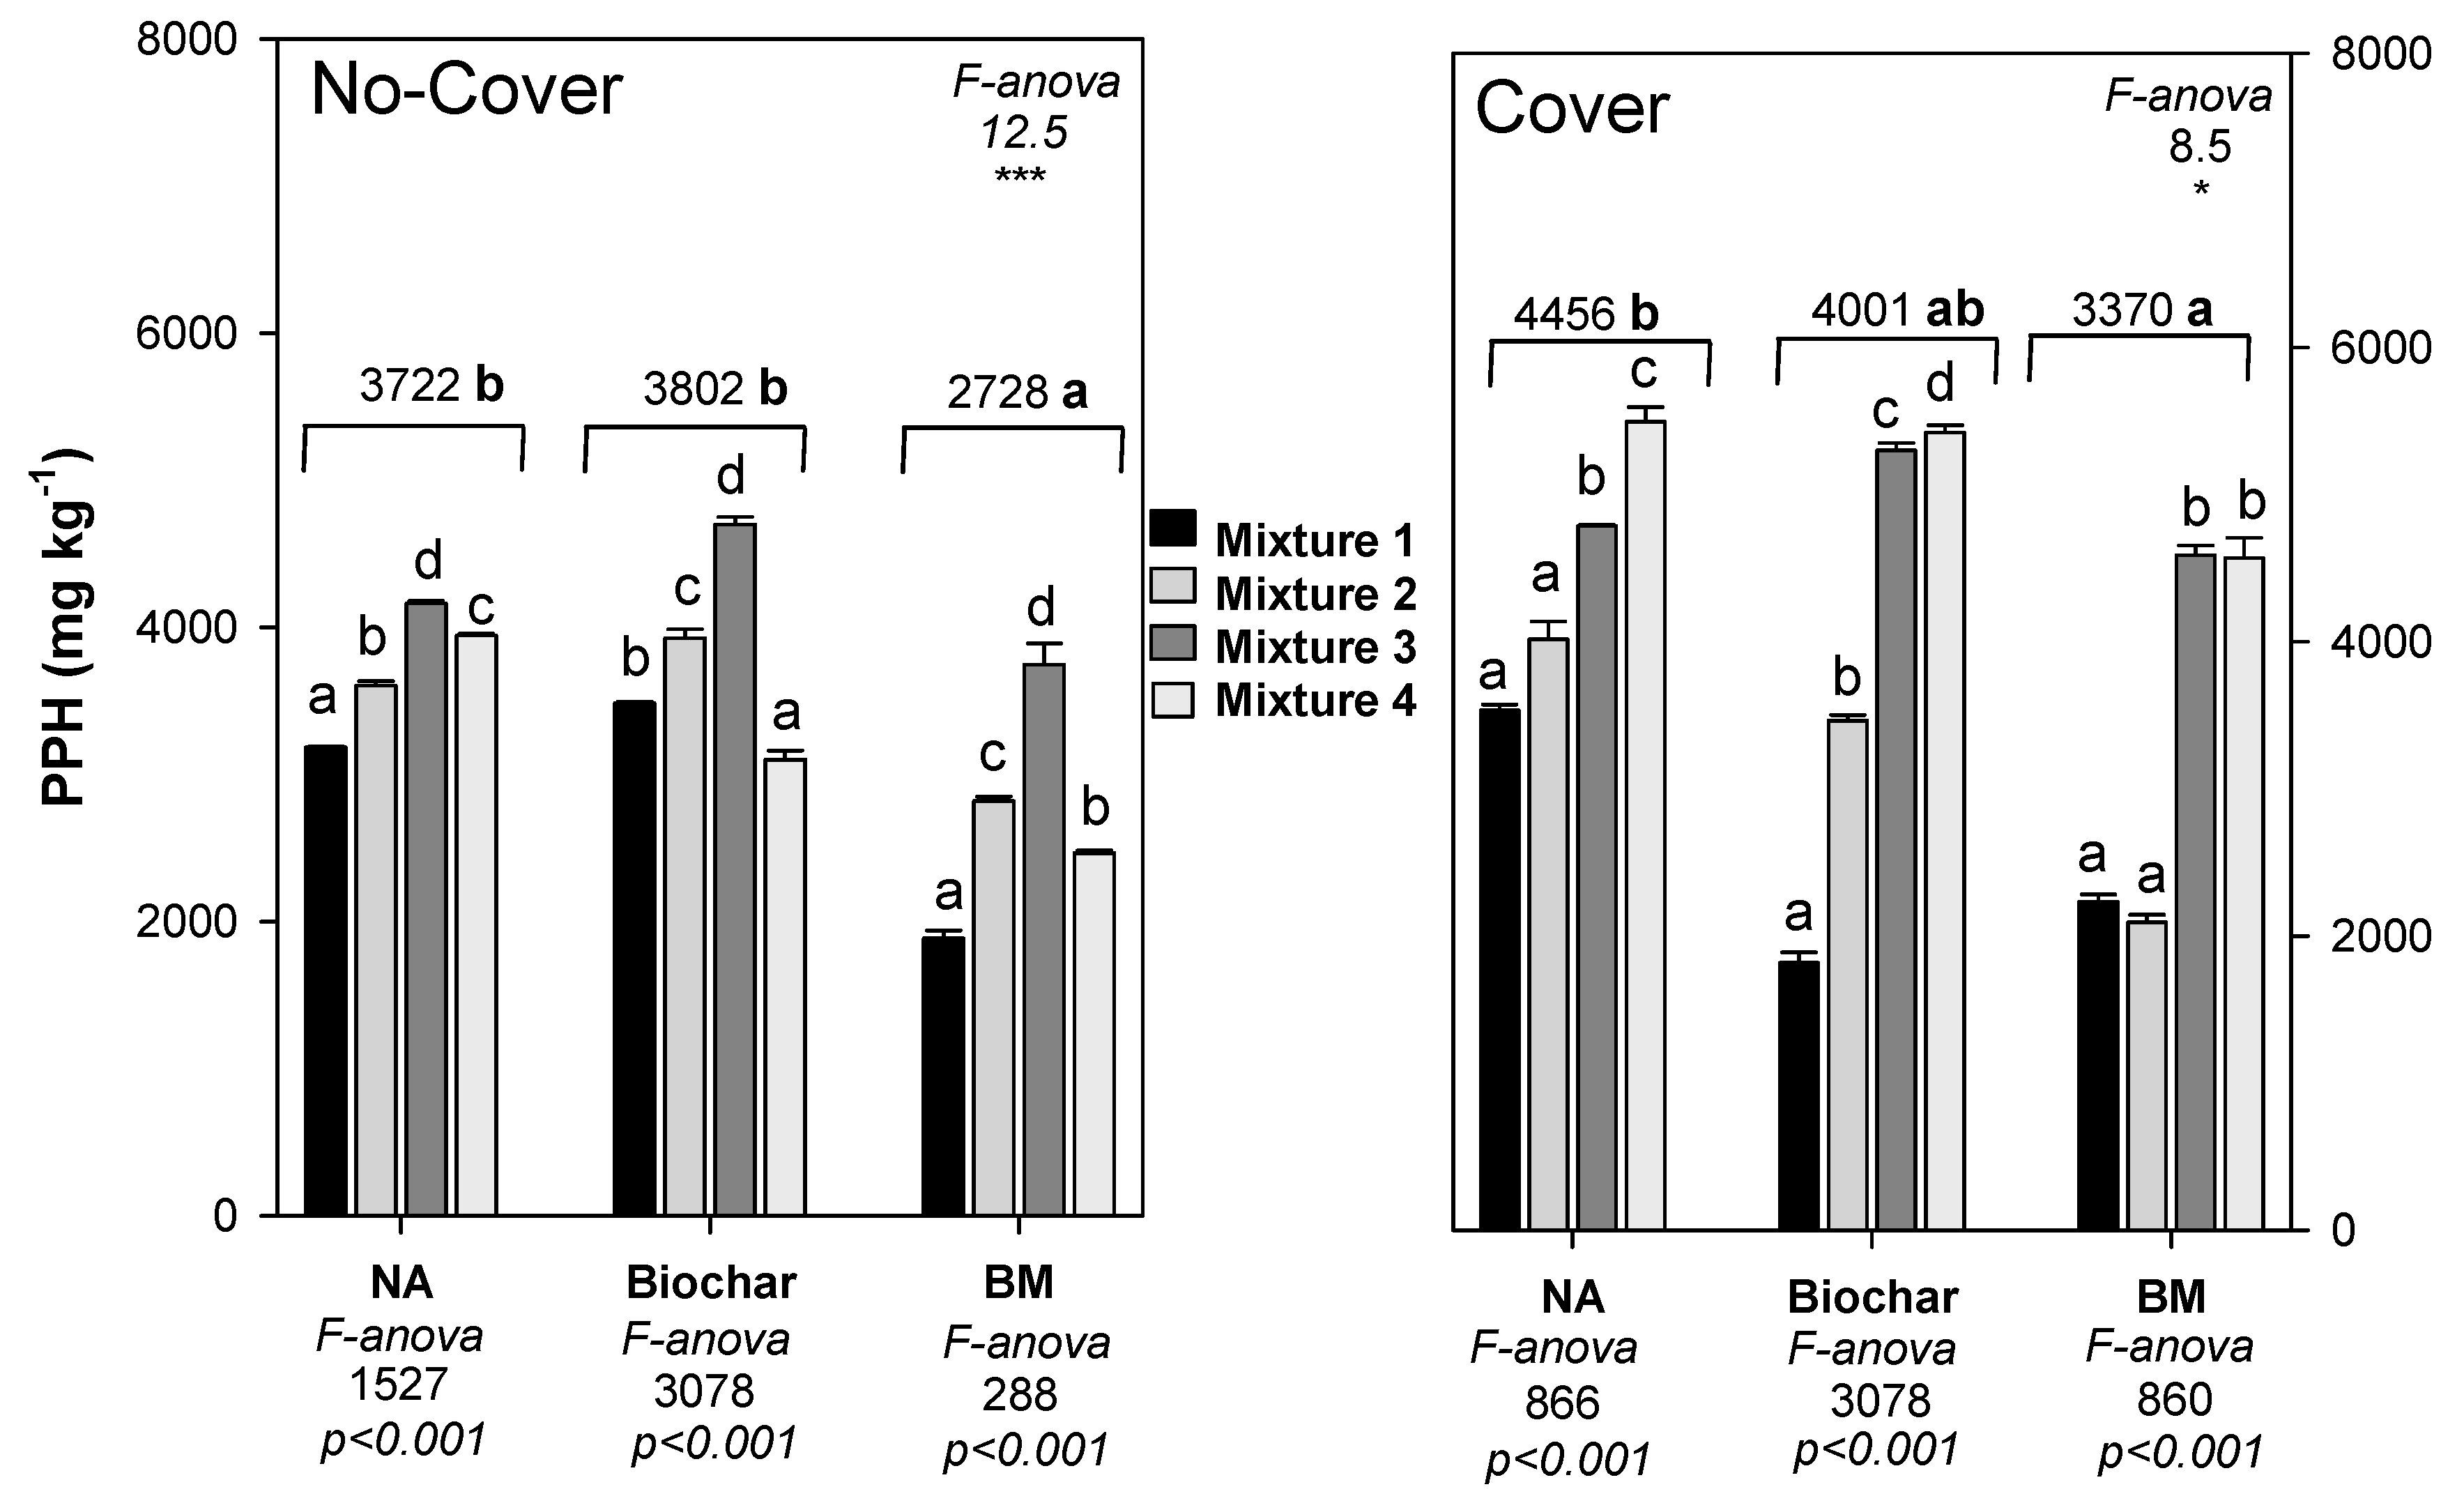
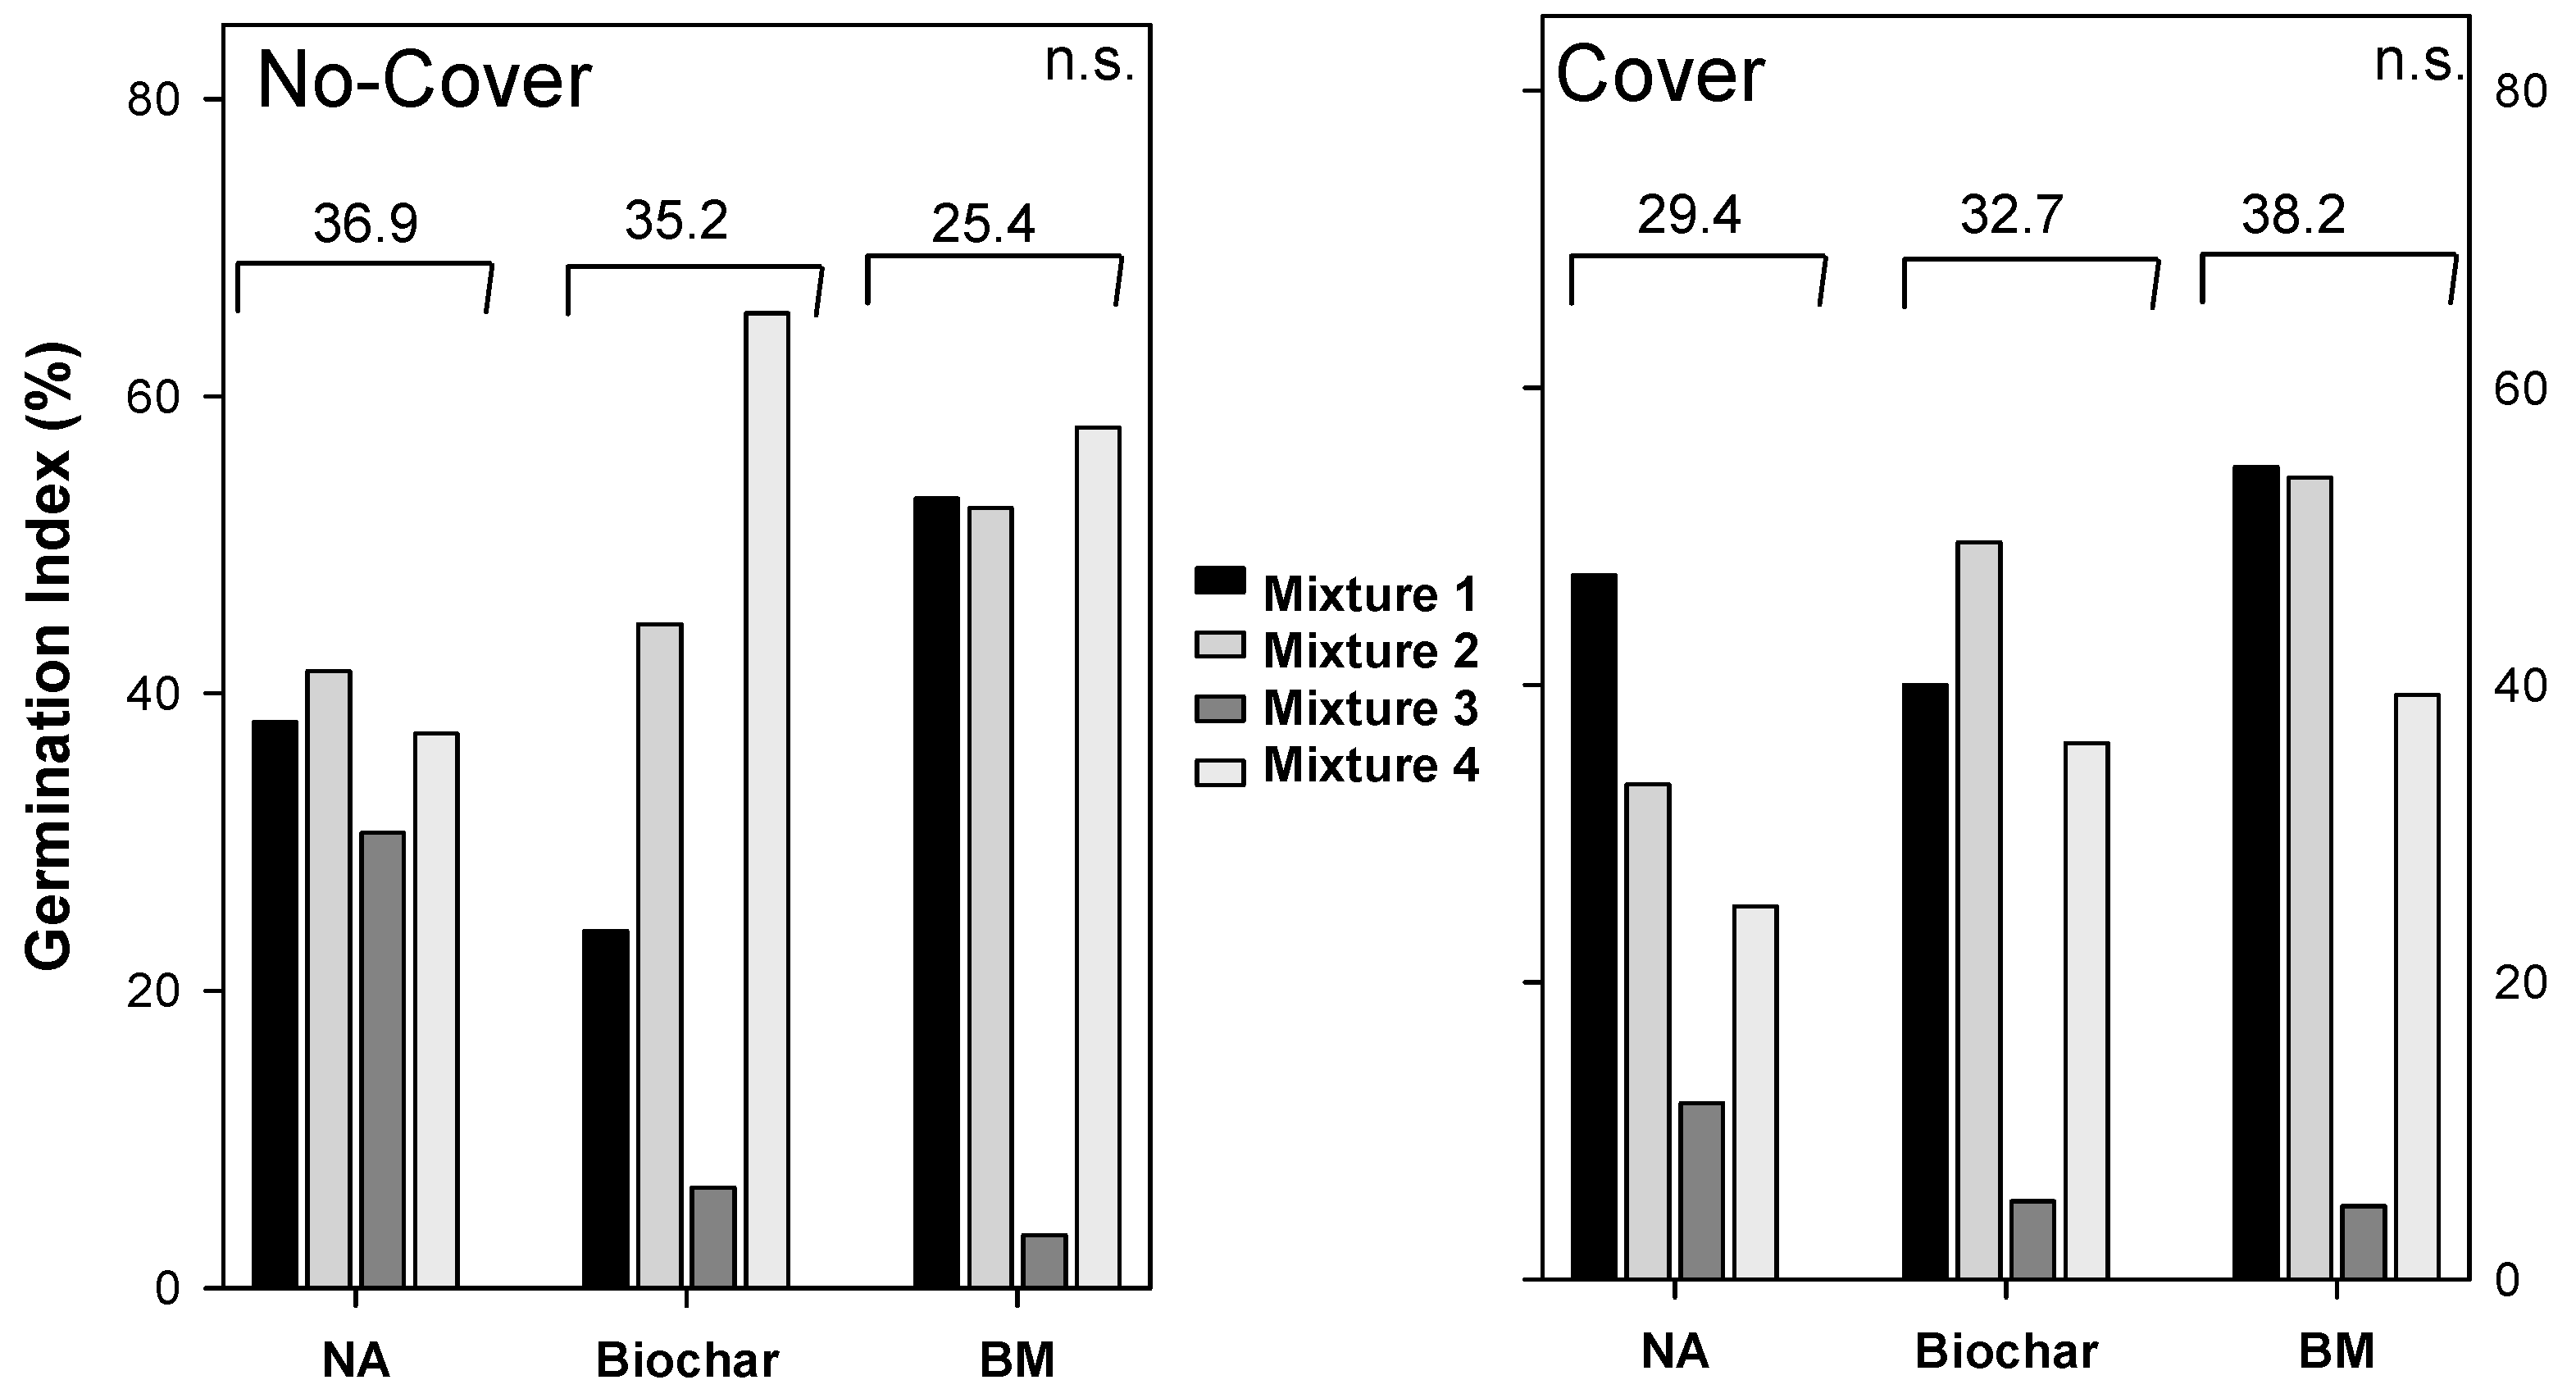
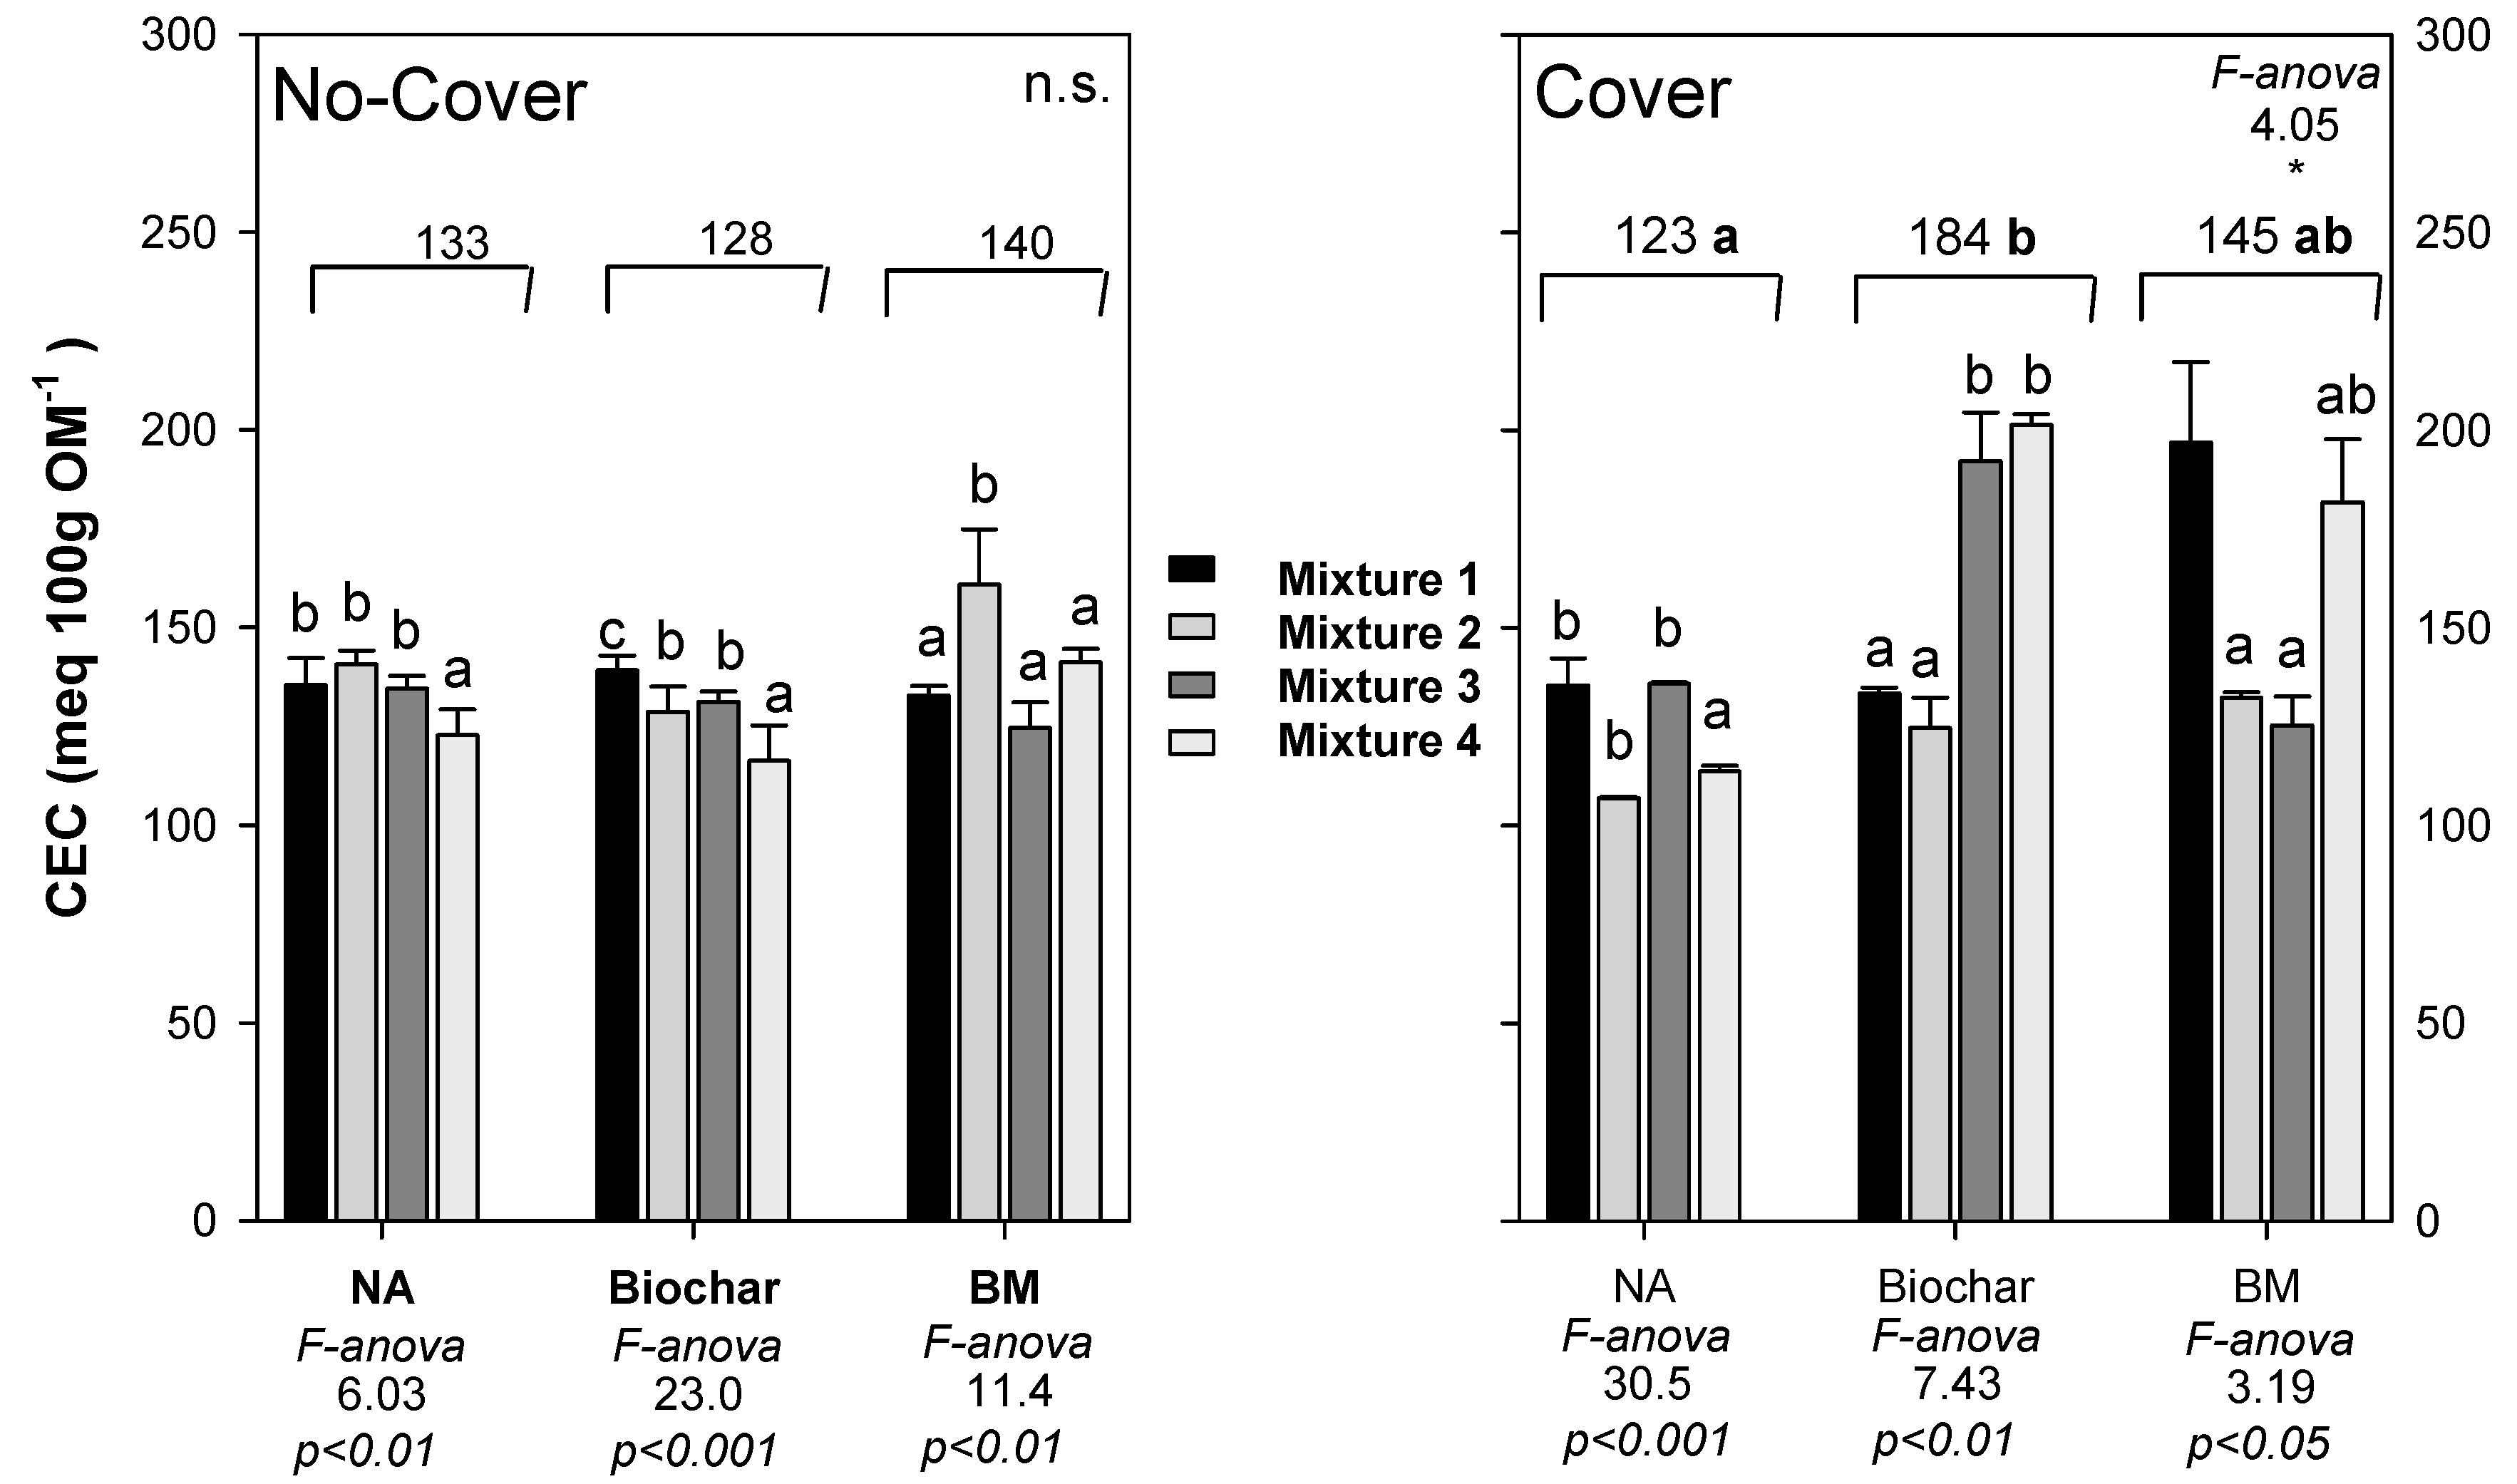
3.5. Characteristics of the Final Compost

Although the same OMW proportion was used to prepare all the mixtures, Mixture 1 showed a lower overall PPH content in the final product (Figure 10). The use of BM and B additives did not show a clear tendency. However, in general, covered piles showed a lower reduction in phenolic compound content. This fact was especially noticeable in Mixture 4. If the no-cover piles group is analyzed, it is observed that Mixture 3 presented the highest content value in all scenarios tested. The PPH content presented a positive Pearson correlation with pH value (r = 0.718 at p < 0.001). Phenolic compounds are considered weak acids and are expected to become neutralized in alkaline media (high pH), forming phenolate salts that are less available for biodegradation [65]. This may have occurred in Mixture 3, which had the highest pH values during the composting process. All the piles reached values (<8000 mg kg−1) below the limit established in the Spanish regulations (RD 506/2013) for the marketing of compost derived from OMW.
The humic-like content (Figure 11) was also not significantly affected by the use of additives, although the treatment group with biochar application showed an 8% and 9% increase in the formation of humic substances for no-cover piles and cover piles, respectively. This agrees with the findings of other authors [63,66], who proposed several mechanisms to explain the effect caused by biochar: (1) the release of soluble organic compounds and aromatic moieties from biochar that can be incorporated into the humic substance, and (2) the adsorption of these compounds onto its active surface.
In addition, the different treatments showed the same behavior in covered and uncovered piles, which seems to indicate that the management strategies were not the cause, and that the differences found for this parameter were mainly due to the different composition of each mixture.
Low initial GI values were recorded in the four mixtures tested, with 6.7%, 2.1%, 2.2%, and 5.3%, respectively, for M1, M2, M3, and M4, suggesting severe phytotoxicity in the OMW substrate in the early composting stage. Afterwards, this parameter increased during the composting process to reach > 50% in the final product, except for Mixture 3 (Figure 12). According to the GI values, Mixture 3 showed high phytotoxic characteristics in all scenarios evaluated. The additives did not present the same behavior in all the mixtures, and therefore, the statistical study did not show a clear effect. However, in general, the GI in piles with BM was slightly higher, and this may be linked to the previous low PPH concentration found with this additive. A Pearson correlation supports this, with a moderate negative correlation (r = −0.500 at p < 0.001) between PPH and GI.
The final CEC (Figure 13) of the final composts was affected by the presence of a cover. Without a cover, no differences between additives were found, but its presence showed a slight CEC increase in biochar piles and BM compared with the control group. Notably, Mixture 1 and Mixture 4 increased their CEC when both BM and cover were applied. Biochar piles also performed better under the cover, as observed in Mixture 3 and Mixture 4. This highest average CEC found in the biochar-covered group piles is in concordance with that found by other authors. Agyarko et al. [67] reported that both aging and dissolved organic matter adsorption led to the formation of organically bonded oxygen containing functional groups on the surface of biochar. And the first and most important consequence of such modification of the biochar surface is an increase in CEC and its ability to retain nutrients [60].

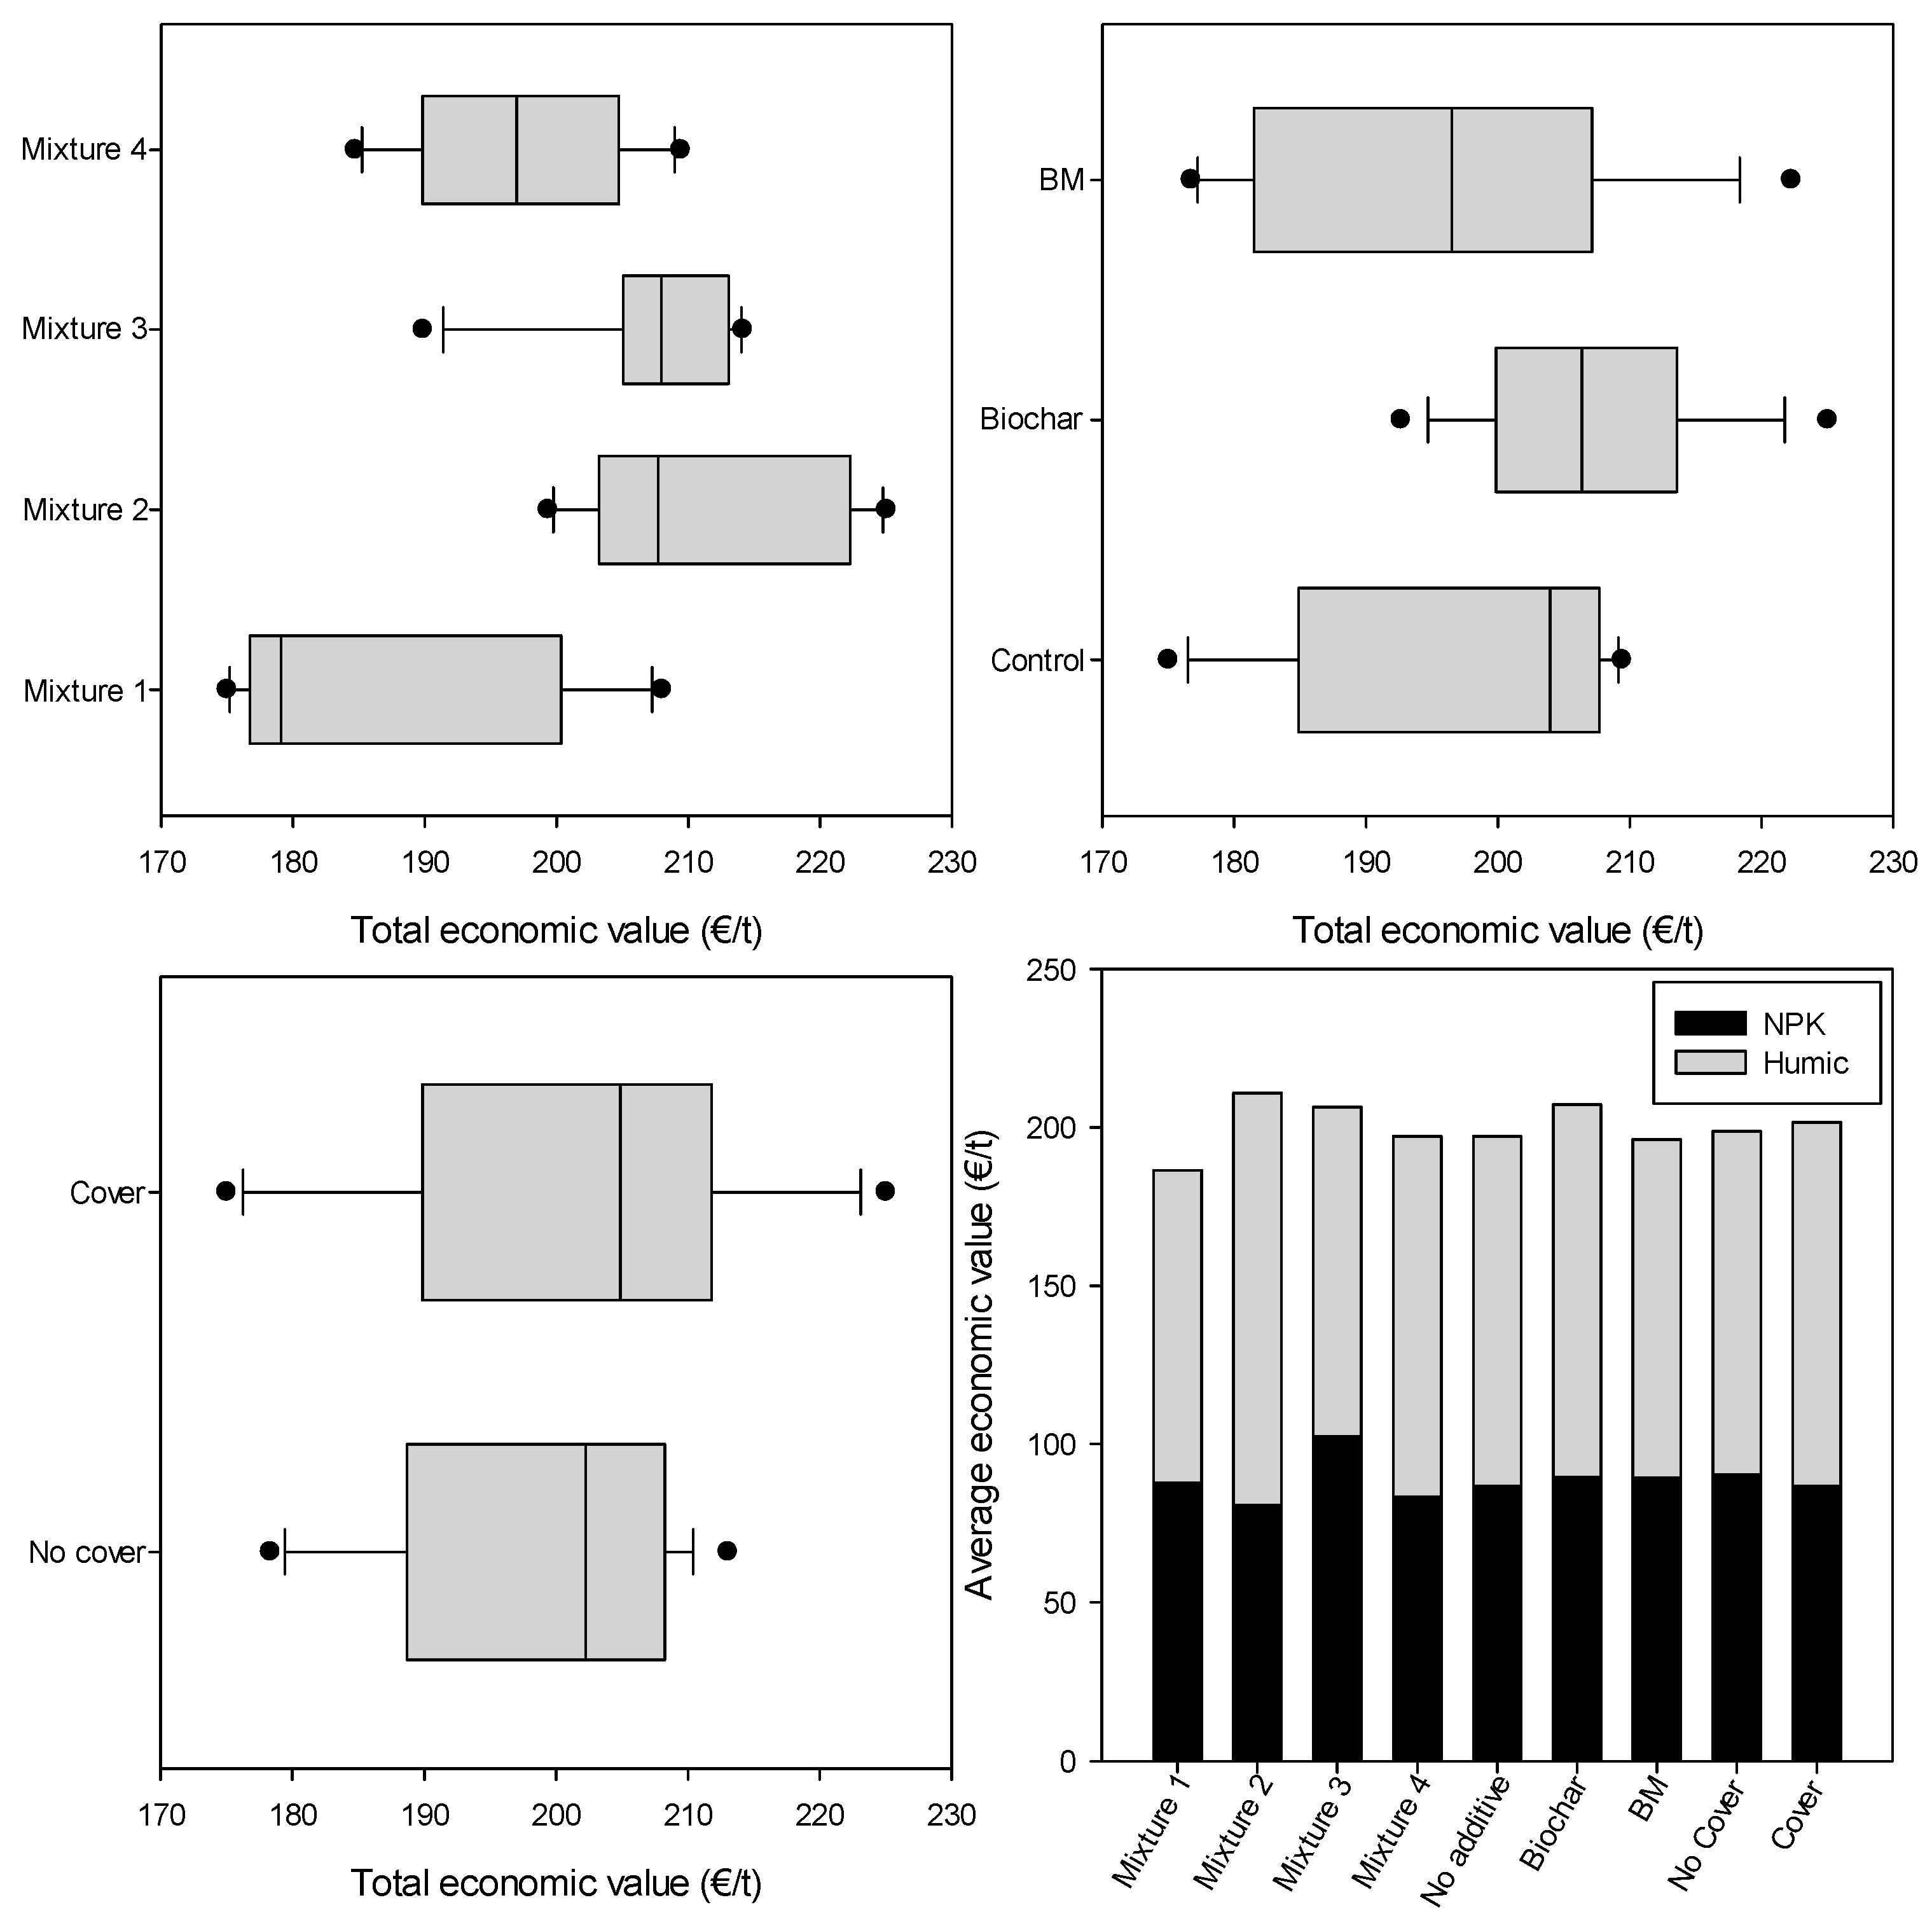
4. Nutrient Content and Economic Marketable Value

According to their fertilizer unit and humic substance content (Figure 14), Mixture 2 and Mixture 3 seemed to produce a more valuable product. However, the Mixture 2 range of value is higher (199–225 EUR/t) than the Mixture 3 range (190–214 EUR/t), suggesting that Mixture 2 is the best alternative. The value of Mixture 2 is also more related to its humic–fulvic substance content (61.7% of the total value) than to its NPK content (38.3% of the total value). Regarding the additives used, biochar appeared to have some impact on economic value. The value of piles with biochar addition ranged from 199 EUR/t to 214 EUR/t, apparently higher than the control (182–208 EUR/t) or BM piles (179–208 EUR/t). Nguyen et al. [68] found that the application of biochar at 2.5 to 10% in various composting processes involving cow manure increased TN by around 45%. In our study, the highest increase in TN, TP, and especially in TK was observed when BM and B were used. But the increase in price was mainly justified by the increase in humic substance content described above. Finally, the use of a geotextile cover showed no impact on the total economic value of the final compost compared with no-cover piles.

5. Conclusions

In view of the results obtained, we can conclude that the use of the tested strategies does not result in a global improvement in composting performance for all the parameters evaluated. However, the use of some strategies or the combination of more than one can improve some aspects of the process or the final quality of the product.
Regarding exothermic behavior and biodegradability, the co-composting strategy showed the greatest influence due to the conditioning of the OMW characteristics. The use of a cover or additives did not show any statistically significant effect on temperature, or changes in thermal indexes. Nevertheless, all the compost piles reached the correct stability and maturity after 4 months of composting.
The use of biochar as an additive showed a reduction in GHG emissions and nitrogen losses via NH3 and N2O release, although no statistical significance was found in the proportion tested (1% f.w.). Furthermore, due to characteristics such as large active surface, biochar improved the quality of the final product in parameters such as a higher CEC or humic substance content. Regarding the degradation of phenolic compounds and the reduction in phytotoxicity of OMW, the combination of using a cover and biochar, and especially a cover and BM, was shown to be the most efficient strategy. In addition, the use of both B and BM additives showed an increase in the economic value. However, it would be necessary to carry out field experiments to evaluate the bioavailability of nutrients (NPK) in the end products obtained for crops under different environmental conditions, soil textures, or moisture content.
Finally, under the composting conditions tested (piles with periodic turning at a commercial scale), the worst cost-effective strategy was the use of a geotextile membrane cover, because there was no difference in thermic behavior caused by the presence of the cover; it did not improve the quality of the final composts. Although the use of a cover did not have a statistically significant effect on the GWP, an increase in CO2 emissions from covered piles was observed.

Supplementary Materials

The following supporting information can be downloaded at https://www.mdpi.com/article/10.3390/agronomy15040808/s1, Table S1: Pearson correlation analyses in end-product obtained.

Author Contributions

Conceptualization, R.M. and J.A.S.; methodology, R.M. and E.A.; software, J.A.S. and M.Á.M.-U.; validation, F.J.A.-R. and L.O.; formal analysis, M.Á.M.-U. and E.A.; investigation, L.O. and A.J.T.; resources, R.M. and F.C.M.-E.; data curation, J.A.S. and L.O.; writing—original draft preparation, M.Á.M.-U.; writing—review and editing, J.A.S.; visualization, R.M. and F.C.M.-E.; supervision, F.J.A.-R. and E.A.; project administration, R.M. and M.J.L.; funding acquisition, R.M. and M.J.L. All authors have read and agreed to the published version of the manuscript.

Funding

This research is supported by the project TED2021-129481B, involving the projects TED2021-129481B-C31, TED2021-129481B-C32, and TED2021-129481B-C33, co-funded by MCIN/AEI/10.13039/501100011033 and by the European Union “NextGenerationEU”/PRTR.

Data Availability Statement

The raw data supporting the conclusions of this article will be made available by the authors on request.

Conflicts of Interest

The authors declare no conflict of interest.

References

  1. Galliou, F.; Markakis, N.; Fountoulakis, M.S.; Nikolaidis, N.; Manios, T. Production of Organic Fertilizer from Olive Mill Wastewater by Combining Solar Greenhouse Drying and Composting. Waste Manag. 2018, 75, 305–311. [Google Scholar] [CrossRef] [PubMed]
  2. ESYRCE Encuesta Sobre Superficies y Rendimientos Cultivos, Encuesta de Marco de Áreas de España. Available online: https://www.mapa.gob.es/es/estadistica/temas/estadisticas-agrarias/agricultura/esyrce/ (accessed on 1 February 2025).
  3. Babić, S.; Malev, O.; Pflieger, M.; Lebedev, A.T.; Mazur, D.M.; Kužić, A.; Čož-Rakovac, R.; Trebše, P. Toxicity Evaluation of Olive Oil Mill Wastewater and Its Polar Fraction Using Multiple Whole-Organism Bioassays. Sci. Total Environ. 2019, 686, 903–914. [Google Scholar] [CrossRef] [PubMed]
  4. Enaime, G.; Baçaoui, A.; Yaacoubi, A.; Belaqziz, M.; Wichern, M.; Lübken, M. Phytotoxicity Assessment of Olive Mill Wastewater Treated by Different Technologies: Effect on Seed Germination of Maize and Tomato. Environ. Sci. Pollut. Res. 2020, 27, 8034–8045. [Google Scholar] [CrossRef]
  5. Chadwick, D.; Sommer, S.; Thorman, R.; Fangueiro, D.; Cardenas, L.; Amon, B.; Misselbrook, T. Manure Management: Implications for Greenhouse Gas Emissions. Anim. Feed. Sci. Technol. 2011, 166–167, 514–531. [Google Scholar] [CrossRef]
  6. Calvin, K.; Dasgupta, D.; Krinner, G.; Mukherji, A.; Thorne, P.W.; Trisos, C.; Romero, J.; Aldunce, P.; Barrett, K.; Blanco, G.; et al. Climate Change 2023: Synthesis Report; Contribution of Working Groups I, II and III to the Sixth Assessment Report of the Intergovernmental Panel on Climate Change; Core Writing Team, Lee, H., Romero, J., Eds.; IPCC: Geneva, Switzerland, 2023. [Google Scholar]
  7. Chiappero, M.; Norouzi, O.; Hu, M.; Demichelis, F.; Berruti, F.; Di Maria, F.; Mašek, O.; Fiore, S. Review of Biochar Role as Additive in Anaerobic Digestion Processes. Renew. Sustain. Energy Rev. 2020, 131, 110037. [Google Scholar] [CrossRef]
  8. García-Prats, M.; González, D.; Sánchez, A. Characterization of Biochars of Different Origin and Application to the Anaerobic Digestion of Source-Selected Organic Fraction of Municipal Solid Waste under Batch Conditions and at Different Dosages. Front. Chem. Eng. 2024, 6, 1384495. [Google Scholar] [CrossRef]
  9. Sebahire, F.; Faridullah, F.; Irshad, M.; Bacha, A.U.R.; Hafeez, F.; Nduwamungu, J. Effect of Biochar on Composting of Cow Manure and Kitchen Waste. Land 2024, 13, 1545. [Google Scholar] [CrossRef]
  10. Yin, Y.; Yang, C.; Tang, J.; Gu, J.; Li, H.; Duan, M.; Wang, X.; Chen, R. Bamboo Charcoal Enhances Cellulase and Urease Activities during Chicken Manure Composting: Roles of the Bacterial Community and Metabolic Functions. J. Environ. Sci. 2021, 108, 84–95. [Google Scholar] [CrossRef]
  11. Sun, X.; Ma, S.; Han, L.; Li, R.; Schlick, U.; Chen, P.; Huang, G. The Effect of a Semi-Permeable Membrane-Covered Composting System on Greenhouse Gas and Ammonia Emissions in the Tibetan Plateau. J. Clean. Prod. 2018, 204, 778–787. [Google Scholar] [CrossRef]
  12. Fang, C.; Su, Y.; He, X.; Han, L.; Qu, H.; Zhou, L.; Huang, G. Membrane-Covered Composting Significantly Decreases Methane Emissions and Microbial Pathogens: Insight into the Succession of Bacterial and Fungal Communities. Sci. Total Environ. 2022, 845, 157343. [Google Scholar] [CrossRef]
  13. Yang, Y.; Chen, W.; Liu, G.; Cui, B.; Zhang, L.; Wuyun, D.; Wang, Q.; Wang, G.; Li, G.; Yuan, J. Effect of a Semi-Permeable Membrane Covered Composting on Greenhouse Gas Emissions and Bacterial Community Succession: A Comparative Study with Biomass Materials Covering. J. Clean. Prod. 2024, 434, 140146. [Google Scholar] [CrossRef]
  14. Varga, Z.I.; Shahzad, S.; Ramay, M.W.; Damak, M.; Gulyás, M.; Béres, A.; Gyuricza, C.; Székács, A.; Aleksza, L. Ammonia and Greenhouse Gas Emissions from Organic Manure Composting: The Effect of Membrane Cover. Agronomy 2024, 14, 1471. [Google Scholar] [CrossRef]
  15. Luo, W.H.; Yuan, J.; Luo, Y.M.; Li, G.X.; Nghiem, L.D.; Price, W.E. Effects of Mixing and Covering with Mature Compost on Gaseous Emissions during Composting. Chemosphere 2014, 117, 14–19. [Google Scholar] [CrossRef] [PubMed]
  16. Yang, Y.; Chen, W.; Liu, G.; Kong, Y.; Wang, G.; Yin, Z.; Li, G.; Yuan, J. Effects of Cornstalk and Sawdust Coverings on Greenhouse Gas Emissions during Sheep Manure Storage. Waste Manag. 2023, 166, 104–114. [Google Scholar] [CrossRef] [PubMed]
  17. Xiong, J.; Ma, S.; He, X.; Han, L.; Huang, G. Nitrogen Transformation and Dynamic Changes in Related Functional Genes during Functional-Membrane Covered Aerobic Composting. Bioresour. Technol. 2021, 332, 125087. [Google Scholar] [CrossRef]
  18. Li, Y.; Liu, Y.; Yong, X.; Wu, X.; Jia, H.; Wong, J.W.C.; Wu, H.; Zhou, J. Odor Emission and Microbial Community Succession during Biogas Residue Composting Covered with a Molecular Membrane. Bioresour. Technol. 2020, 297, 122518. [Google Scholar] [CrossRef]
  19. Ma, S.; Sun, X.; Fang, C.; He, X.; Han, L.; Huang, G. Exploring the Mechanisms of Decreased Methane during Pig Manure and Wheat Straw Aerobic Composting Covered with a Semi-Permeable Membrane. Waste Manag. 2018, 78, 393–400. [Google Scholar] [CrossRef]
  20. Hsieh, C.W. Geotextiles in Agriculture and Aquaculture. In Geotextiles; Elsevier: Amsterdam, The Netherlands, 2016; pp. 511–530. [Google Scholar]
  21. Farina, R.; Testani, E.; Campanelli, G.; Leteo, F.; Napoli, R.; Canali, S.; Tittarelli, F. Potential Carbon Sequestration in a Mediterranean Organic Vegetable Cropping System. A Model Approach for Evaluating the Effects of Compost and Agro-Ecological Service Crops (ASCs). Agric. Syst. 2018, 162, 239–248. [Google Scholar] [CrossRef]
  22. Dijkstra, F.A.; Keitel, C. Maximising Carbon Sequestration through Mixing Compost in Moist Soil. Soil. Biol. Biochem. 2024, 191, 109330. [Google Scholar] [CrossRef]
  23. Pelegrín, M.; Sáez-Tovar, J.A.; Andreu-Rodríguez, J.; Pérez-Murcia, M.D.; Martínez-Sabater, E.; Marhuenda-Egea, F.C.; Pérez-Espinosa, A.; Bustamante, M.A.; Agulló, E.; Vico, A.; et al. Composting of the Invasive Species Arundo Donax with Sewage and Agri-Food Sludge: Agronomic, Economic and Environmental Aspects. Waste Manag. 2018, 78, 730–740. [Google Scholar] [CrossRef]
  24. Díaz, M.J.; Ruiz-Montoya, M.; Palma, A.; de-Paz, M.-V. Thermogravimetry Applicability in Compost and Composting Research: A Review. Appl. Sci. 2021, 11, 1692. [Google Scholar] [CrossRef]
  25. Grube, M.; Lin, J.G.; Lee, P.H.; Kokorevicha, S. Evaluation of Sewage Sludge-Based Compost by FT-IR Spectroscopy. Geoderma 2006, 130, 324–333. [Google Scholar] [CrossRef]
  26. Soobhany, N.; Gunasee, S.; Rago, Y.P.; Joyram, H.; Raghoo, P.; Mohee, R.; Garg, V.K. Spectroscopic, Thermogravimetric and Structural Characterization Analyses for Comparing Municipal Solid Waste Composts and Vermicomposts Stability and Maturity. Bioresour. Technol. 2017, 236, 11–19. [Google Scholar] [CrossRef] [PubMed]
  27. Bustamante, M.A.; Moral, R.; Paredes, C.; Vargas-García, M.C.; Suárez-Estrella, F.; Moreno, J. Evolution of the Pathogen Content during Co-Composting of Winery and Distillery Wastes. Bioresour. Technol. 2008, 99, 7299–7306. [Google Scholar] [CrossRef]
  28. Zucconi, F.; Pera, A.; Forte, M.; de Bertoldi, M. Evaluating Toxicity of Immature Compost. Biocycle 1981, 2, 54–57. [Google Scholar]
  29. Paredes, C.; Roig, A.; Bernal, M.P.; Sánchez-Monedero, M.A.; Cegarra, J. Evolution of Organic Matter and Nitrogen during Co-Composting of Olive Mill Wastewater with Solid Organic Wastes. Biol. Fertil. Soils 2000, 32, 222–227. [Google Scholar] [CrossRef]
  30. Marhuenda-Egea, F.C.; Martínez-Sabater, E.; Jordá, J.; Sánchez-Sánchez, A.; Moral, R.; Bustamante, M.A.; Paredes, C.; Pérez-Murcia, M.D. Evaluation of the Aerobic Composting Process of Winery and Distillery Residues by Thermal Methods. Thermochim. Acta 2007, 454, 135–143. [Google Scholar] [CrossRef]
  31. Torres-Climent, A.; Gomis, P.; Martín-Mata, J.; Bustamante, M.A.; Marhuenda-Egea, F.C.; Pérez-Murcia, M.D.; Pérez-Espinosa, A.; Paredes, C.; Moral, R. Chemical, Thermal and Spectroscopic Methods to Assess Biodegradation of Winery-Distillery Wastes during Composting. PLoS ONE 2015, 10, e0138925. [Google Scholar] [CrossRef]
  32. Sánchez-Navarro, V.; Shahrokh, V.; Martínez-Martínez, S.; Acosta, J.A.; Almagro, M.; Martínez-Mena, M.; Boix-Fayos, C.; Díaz-Pereira, E.; Zornoza, R. Perennial Alley Cropping Contributes to Decrease Soil CO2 and N2O Emissions and Increase Soil Carbon Sequestration in a Mediterranean Almond Orchard. Sci. Total Environ. 2022, 845, 157225. [Google Scholar] [CrossRef]
  33. Intergovernmental Panel on Climate Change (IPCC). The Earth’s Energy Budget, Climate Feedbacks and Climate Sensitivity. In Climate Change 2021—The Physical Science Basis; Cambridge University Press: Cambridge, UK, 2023; pp. 923–1054. [Google Scholar]
  34. Christensen, T.H.; Gentil, E.; Boldrin, A.; Larsen, A.W.; Weidema, B.P.; Hauschild, M. C Balance, Carbon Dioxide Emissions and Global Warming Potentials in LCA-Modelling of Waste Management Systems. Waste Manag. Res. J. A Sustain. Circ. Econ. 2009, 27, 707–715. [Google Scholar] [CrossRef]
  35. Jara-Samaniego, J.; Pérez-Murcia, M.D.; Bustamante, M.A.; Paredes, C.; Pérez-Espinosa, A.; Gavilanes-Terán, I.; López, M.; Marhuenda-Egea, F.C.; Brito, H.; Moral, R. Development of Organic Fertilizers from Food Market Waste and Urban Gardening by Composting in Ecuador. PLoS ONE 2017, 12, e0181621. [Google Scholar] [CrossRef] [PubMed]
  36. Di Rienzo, J.; Casanoves, F.; Balzarini, M.; Gonzalez, L.; Tablada, M.; Robledo, C. InfoStat Versión 2020. Centro de Transferencia InfoStat, FCA, Universidad Nacional de Córdoba, Argentina. Available online: https://www.infostat.com.ar/ (accessed on 20 March 2025).
  37. Nelson, M.I.; Marchant, T.R.; Wake, G.C.; Balakrishnan, E.; Chen, X.D. Self-Heating in Compost Piles Due to Biological Effects. Chem. Eng. Sci. 2007, 62, 4612–4619. [Google Scholar] [CrossRef]
  38. Sun, X.; Huang, G.; Huang, Y.; Fang, C.; He, X.; Zheng, Y. Large Semi-Membrane Covered Composting System Improves the Spatial Homogeneity and Efficiency of Fermentation. Int. J. Environ. Res. Public. Health 2022, 19, 15503. [Google Scholar] [CrossRef] [PubMed]
  39. Xiong, J.; Su, Y.; He, X.; Han, L.; Huang, G. Effects of Functional Membrane Coverings on Carbon and Nitrogen Evolution during Aerobic Composting: Insight into the Succession of Bacterial and Fungal Communities. Bioresour. Technol. 2023, 369, 128463. [Google Scholar] [CrossRef]
  40. Czekała, W.; Malińska, K.; Cáceres, R.; Janczak, D.; Dach, J.; Lewicki, A. Co-Composting of Poultry Manure Mixtures Amended with Biochar—The Effect of Biochar on Temperature and C-CO2 Emission. Bioresour. Technol. 2016, 200, 921–927. [Google Scholar] [CrossRef]
  41. Nleya, Y.; Young, B.; Nooraee, E.; Baroutian, S. Anaerobic Digestion of Dairy Cow and Goat Manure: Comparative Assessment of Biodegradability and Greenhouse Gas Mitigation. Fuel 2025, 381, 133458. [Google Scholar] [CrossRef]
  42. Hachicha, S.; Cegarra, J.; Sellami, F.; Hachicha, R.; Drira, N.; Medhioub, K.; Ammar, E. Elimination of Polyphenols Toxicity from Olive Mill Wastewater Sludge by Its Co-Composting with Sesame Bark. J. Hazard. Mater. 2009, 161, 1131–1139. [Google Scholar] [CrossRef]
  43. Guo, H.; Gu, J.; Wang, X.; Song, Z.; Yu, J.; Lei, L. Microbial Mechanisms Related to the Effects of Bamboo Charcoal and Bamboo Vinegar on the Degradation of Organic Matter and Methane Emissions during Composting. Environ. Pollut. 2021, 272, 116013. [Google Scholar] [CrossRef]
  44. Zhang, D.; Luo, W.; Yuan, J.; Li, G.; Luo, Y. Effects of Woody Peat and Superphosphate on Compost Maturity and Gaseous Emissions during Pig Manure Composting. Waste Manag. 2017, 68, 56–63. [Google Scholar] [CrossRef]
  45. Akdeniz, N. A Systematic Review of Biochar Use in Animal Waste Composting. Waste Manag. 2019, 88, 291–300. [Google Scholar] [CrossRef]
  46. Godlewska, P.; Schmidt, H.P.; Ok, Y.S.; Oleszczuk, P. Biochar for Composting Improvement and Contaminants Reduction. A Review. Bioresour. Technol. 2017, 246, 193–202. [Google Scholar] [CrossRef]
  47. Khan, N.; Clark, I.; Sánchez-Monedero, M.A.; Shea, S.; Meier, S.; Qi, F.; Kookana, R.S.; Bolan, N. Physical and Chemical Properties of Biochars Co-Composted with Biowastes and Incubated with a Chicken Litter Compost. Chemosphere 2016, 142, 14–23. [Google Scholar] [CrossRef]
  48. Martín-Mata, J.; Lahoz-Ramos, C.; Bustamante, M.A.; Marhuenda-Egea, F.C.; Moral, R.; Santos, A.; Sáez, J.A.; Bernal, M.P. Thermal and Spectroscopic Analysis of Organic Matter Degradation and Humification during Composting of Pig Slurry in Different Scenarios. Environ. Sci. Pollut. Res. Int. 2016, 23, 17357–17369. [Google Scholar] [CrossRef] [PubMed]
  49. Martínez-Sabater, E.; Bustamante, M.A.; Marhuenda-Egea, F.C.; El-Khattabi, M.; Moral, R.; Lorenzo, E.; Paredes, C.; Gálvez, L.N.; Jordá, J.D. Study of the Evolution of Organic Matter during Composting of Winery and Distillery Residues by Classical and Chemometric Analysis. J. Agric. Food Chem. 2009, 57, 9613–9623. [Google Scholar] [CrossRef]
  50. Wichuk, K.M.; McCartney, D. Compost Stability and Maturity Evaluation—A Literature ReviewA Paper Submitted to the Journal of Environmental Engineering and Science. Can. J. Civ. Eng. 2010, 37, 1505–1523. [Google Scholar] [CrossRef]
  51. Cayuela, M.L.; Mondini, C.; Sánchez-Monedero, M.A.; Roig, A. Chemical Properties and Hydrolytic Enzyme Activities for the Characterisation of Two-Phase Olive Mill Wastes Composting. Bioresour. Technol. 2008, 99, 4255–4262. [Google Scholar] [CrossRef] [PubMed]
  52. Sáez, J.A.; Pérez-Murcia, M.D.; Vico, A.; Martínez-Gallardo, M.R.; Andreu-Rodríguez, F.J.; López, M.J.; Bustamante, M.A.; Sanchez-Hernandez, J.C.; Moreno, J.; Moral, R. Olive Mill Wastewater-Evaporation Ponds Long Term Stored: Integrated Assessment of in Situ Bioremediation Strategies Based on Composting and Vermicomposting. J. Hazard. Mater. 2021, 402, 123481. [Google Scholar] [CrossRef]
  53. Cayuela, M.L.; Sánchez-Monedero, M.A.; Roig, A. Two-Phase Olive Mill Waste Composting: Enhancement of the Composting Rate and Compost Quality by Grape Stalks Addition. Biodegradation 2010, 21, 465–473. [Google Scholar] [CrossRef]
  54. Abid, N.; Sayadi, S. Detrimental Effects of Olive Mill Wastewater on the Composting Process of Agricultural Wastes. Waste Manag. 2006, 26, 1099–1107. [Google Scholar] [CrossRef]
  55. Azzam, M.O.J.; Hazaimeh, S.A. Olive Mill Wastewater Treatment and Valorization by Extraction/Concentration of Hydroxytyrosol and Other Natural Phenols. Process Saf. Environ. Prot. 2021, 148, 495–523. [Google Scholar] [CrossRef]
  56. Kavvadias, V.; Elaiopoulos, K.; Theocharopoulos, S.; Soupios, P. Fate of Potential Contaminants Due to Disposal of Olive Mill Wastewaters in Unprotected Evaporation Ponds. Bull. Environ. Contam. Toxicol. 2017, 98, 323–330. [Google Scholar] [CrossRef] [PubMed]
  57. Cayuela, M.L.; Sánchez-Monedero, M.A.; Roig, A. Evaluation of Two Different Aeration Systems for Composting Two-Phase Olive Mill Wastes. Process Biochem. 2006, 41, 616–623. [Google Scholar] [CrossRef]
  58. Ba, S.; Qu, Q.; Zhang, K.; Groot, J.C.J. Meta-Analysis of Greenhouse Gas and Ammonia Emissions from Dairy Manure Composting. Biosyst. Eng. 2020, 193, 126–137. [Google Scholar] [CrossRef]
  59. Pardo, G.; Moral, R.; Aguilera, E.; del Prado, A. Gaseous Emissions from Management of Solid Waste: A Systematic Review. Glob. Change Biol. 2015, 21, 1313–1327. [Google Scholar] [CrossRef]
  60. Sanchez-Monedero, M.A.; Cayuela, M.L.; Roig, A.; Jindo, K.; Mondini, C.; Bolan, N. Role of Biochar as an Additive in Organic Waste Composting. Bioresour. Technol. 2018, 247, 1155–1164. [Google Scholar] [CrossRef]
  61. Steiner, C.; Das, K.C.; Melear, N.; Lakly, D. Reducing Nitrogen Loss during Poultry Litter Composting Using Biochar. J. Environ. Qual. 2010, 39, 1236–1242. [Google Scholar] [CrossRef] [PubMed]
  62. Dias, B.O.; Silva, C.A.; Higashikawa, F.S.; Roig, A.; Sánchez-Monedero, M.A. Use of Biochar as Bulking Agent for the Composting of Poultry Manure: Effect on Organic Matter Degradation and Humification. Bioresour. Technol. 2010, 101, 1239–1246. [Google Scholar] [CrossRef]
  63. Li, M.; Zhang, A.; Wu, H.; Liu, H.; Lv, J. Predicting Potential Release of Dissolved Organic Matter from Biochars Derived from Agricultural Residues Using Fluorescence and Ultraviolet Absorbance. J. Hazard. Mater. 2017, 334, 86–92. [Google Scholar] [CrossRef]
  64. Ma, S.; Xiong, J.; Cui, R.; Sun, X.; Han, L.; Xu, Y.; Kan, Z.; Gong, X.; Huang, G. Effects of Intermittent Aeration on Greenhouse Gas Emissions and Bacterial Community Succession during Large-Scale Membrane-Covered Aerobic Composting. J. Clean. Prod. 2020, 266, 121551. [Google Scholar] [CrossRef]
  65. Wang, S.; Shi, D.; Yang, R.; Xu, Y.; Guo, H.; Yang, X. Solvent Extraction of Phenol from Aqueous Solution with Benzyl 2-ethylhexyl Sulfoxide as a Novel Extractant. Can. J. Chem. Eng. 2015, 93, 1787–1792. [Google Scholar] [CrossRef]
  66. Jindo, K.; Sonoki, T.; Matsumoto, K.; Canellas, L.; Roig, A.; Sanchez-Monedero, M.A. Influence of Biochar Addition on the Humic Substances of Composting Manures. Waste Manag. 2016, 49, 545–552. [Google Scholar] [CrossRef] [PubMed]
  67. Agyarko-Mintah, E.; Cowie, A.; Van Zwieten, L.; Singh, B.P.; Smillie, R.; Harden, S.; Fornasier, F. Biochar Lowers Ammonia Emission and Improves Nitrogen Retention in Poultry Litter Composting. Waste Manag. 2017, 61, 129–137. [Google Scholar] [CrossRef] [PubMed]
  68. Nguyen, M.K.; Lin, C.; Hoang, H.G.; Sanderson, P.; Dang, B.T.; Bui, X.T.; Nguyen, N.S.H.; Vo, D.V.N.; Tran, H.T. Evaluate the Role of Biochar during the Organic Waste Composting Process: A Critical Review. Chemosphere 2022, 299, 134488. [Google Scholar] [CrossRef] [PubMed]
Figure 1. OM loss (%) behavior in the composting pile studied. Lines represent kinetic curve fitting. OM: organic matter.
Agronomy 15 00808 g001
Figure 2. pH changes in each mixture.
Agronomy 15 00808 g002
Figure 3. Changes in the electrical conductivity of each mixture.
Agronomy 15 00808 g003
Figure 4. Changes in the water-soluble polyphenols of each mixture.
Agronomy 15 00808 g004
Figure 5. Global warming potential (GWP) of each pile. Different letters on the bar graph or bracket indicate significant differences between treatments (p < 0.05). ***: Significant at p < 0.001.
Agronomy 15 00808 g005
Figure 6. Cumulative N2O emissions of each treatment. Different letters on the bar graph or bracket indicate significant differences between treatments (p < 0.05). ***: Significant at p < 0.001.
Agronomy 15 00808 g006
Figure 7. Cumulative NH3 emissions of each treatment. Different letters on the bar graph or bracket indicate significant differences between treatments (p < 0.05). ***: Significant at p < 0.001.
Agronomy 15 00808 g007
Figure 8. Cumulative CO2 emissions of each treatment, ns: not significant.
Agronomy 15 00808 g008
Figure 9. Cumulative CH4 emissions of each treatment. ns: not significant.
Agronomy 15 00808 g009
Figure 10. Water-soluble phenolic content of the final compost depending on the treatment. Different letters on the bar graph or bracket indicate significant differences between treatments (p < 0.05). The number on the bracket indicates the average value of this treatment group. *, ***: significant difference between treatments at p < 0.05, and p < 0.001.
Agronomy 15 00808 g010
Figure 11. Carbon humic compound of the final compost depending on the treatment. Different letters on the bar graph or bracket indicate significant differences between treatments (p < 0.05). The number on the bracket indicates the average value of this treatment group, ns: not significant.
Agronomy 15 00808 g011
Figure 12. Germination index of the final compost depending on the treatment. The number on the bracket indicates the average value of this treatment group, ns: not significant.
Agronomy 15 00808 g012
Figure 13. Cation exchange capacity of the final compost depending on the treatment. Different letters on the bar graph or bracket indicate significant differences between treatments (p < 0.05). The number on the bracket indicates the average value of this treatment group. *: significant difference between treatments at p < 0.05, ns: not significance.
Agronomy 15 00808 g013
Figure 14. Economic value of the final compost depending on the mixture, treatment, and cover-use, and proportion of total economic value associated with NPK content and humic substances.
Agronomy 15 00808 g014
Table 1. Physicochemical properties of the raw materials used in the composting piles.
MixtureOMWCMGMAlmVn
Mixture 1 (% f.w.)5040-10-
Mixture 25040--10
Mixture 350-4010-
Mixture 450-40-10
Moisture (%)71.255.447.910.27.1
pH6.068.118.796.767.65
EC (dS m−1)1.489.469.311.111.23
TOC (%)51.136.836.645.335.4
TN (%)1.722.151.870.441.02
TOC/TN29.517.119.610434.7
PPH (mg kg−1)29,804196334803928960
Total elements
P (g kg−1)2.617.167.430.411.22
K (g kg−1)33.223.225.32.16.4
Ca (g kg−1)0.802.633.170.504.81
Cd (mg kg−1)0.040.200.160.010.15
Cr (mg kg−1)4.7915.112.95.4330.7
Cu (mg kg−1)43.246.943.43.0235.9
Ni (mg kg−1)4.406.865.122.086.22
Pb (mg kg−1)3.125.012.840.928.91
Zn (mg kg−1)53.31893196.7642.8
CM: cattle manure; GM: goat manure; Alm: almond tree pruning; Vn: grapevine pruning; OMW: three-phase olive mill wastewater.
Table 2. Temperature values sorted by variable and mixture.
Tmax (°C)Tave (°C)Days > 50 °CDays > 60 °CDays > 70 °CEXI2 (x1000)
Mixture 1 64.0 a36.8 a11.0 a4.0 a0.0 a38.1 a
Mixture 2 67.4 b41.7 b27.0 bc9.0 a1.0 a63.9 b
Mixture 3 62.7 a38.9 ab19.0 ab10 a0.0 a44.1 a
Mixture 4 79.7 c46.0 c34.0 c22 b11 b86.6 c
F-anova 22.7 ***8.71 ***11.0 ***9.98 ***71.0 ***21.8 ***
N sourceCM65.739.118.66.0 a0.051.0
GM71.242.526.516 b5.0 b65.3
F-anova nsnsns9.95 **8.47 **ns
C sourceAlm63.6 a37.7 a15.0 a7.0 a0.0 a41.1 a
Vn73.6 b43.8 b30.0 b15 b6.0 b75.2 b
F-anova 17.6 ***16.3 ***21.1 ***7.27 *12.2 **35.8 ***
AdditiveNo additive66.438.820.07.82.553.5
Biochar68.639.920.6113.153.6
BM70.443.527.0132.867.2
F-anova nsnsnsnsnsns
CoverNo cover67.541.823.89.52.058.9
Cover69.439.725.912.53.057.3
F-anova nsnsnsnsnsns
CM: cattle manure; GM: goat manure; Alm: almond tree pruning; Vn: grapevine pruning; BM: bio-mineral additive. Tmax: average maximum temperatures; Tave: average temperature; days > 50 °C: average temperature of days over 50 °C; days > 60 °C: average temperature of days over 60 °C; days > 70 °C: average temperature of days over 70 °C; EXI2 (×1000): quadratic exothermic index. *, **, ***: significant difference between treatments at p < 0.05, p < 0.01 and p < 0.001, respectively; ns = not significant. Different letters within a column indicate significant differences between treatments (p < 0.05).
Table 3. Estimated kinetic model parameters for OM loss during composting according to the variables used and mixtures.
Ak Ak
N sourceCM49.20.0199CoverNo Cover49.30.021
GM48.10.0218 Cover47.80.021
F-anovansns F-anovansns
C sourceAlm46.2 b0.0176AdditiveSN48.30.021
Vn51.1 a0.0245 B49.00.027
BM49.60.014
F-anova1.25 *ns F-anovansns
MixturesAkR2RMSF-value
Mixture 1 46.30.01910.990.816,467
Mixture 252.10.02080.997.219,298
Mixture 346.10.01620.984.13457
Mixture 450.10.02730.995.5933
F-anovansns
A: maximum potential mineralization of OM (%); k: rate constant (d−1); RMS: residual mean square. *: significant difference between treatments at p < 0.05; ns = not significant. Different letters within a column indicate significant differences between treatments (p < 0.05).
Table 4. Evolution of the OM mineralization and R1 and R2 indexes of TGA during composting.
Start-Up (Day 0)Thermophilic (Day 60)End Bio-Oxidative (Day 120)Matured (Day 165)
R1R2R1R2R1R2R1R2
N sourceCM0.691.771.03 a2.81 a1.15 a3.29 b1.153.20 b
GM0.701.710.98 b2.36 b1.11 b2.58 a1.112.55 a
F-anova nsns8.52 **15.3 ***4.45 *25.4 ***ns31.9 ***
C SourceAlm0.711.831.002.591.133.051.153.04
Vn0.681.641.012.571.132.821.112.71
F-anova nsnsnsnsnsnsnsns
CoverNo Cover0.701.740.96 a2.601.17 b3.141.163.00
Cover0.701.741.02 b2.571.08 a2.731.102.84
F-anova nsns4.45 *ns27.9 **6.86 *8.70 **ns
*, **, ***: Significant at p < 0.05, 0.01, 0.001, respectively; ns: not significant. Average values in a column followed by the same letter are not significantly different at p < 0.05 (LSD test). Mixture 1: OMW + CM + Alm (50:40:10%) f.w.; Mixture 2: OMW + CM + Vn (50:40:10%) f.w.; Mixture 3: OMW + GM + Alm (50:40:10%) f.w.; Mixture 4: OMW + GM + Vn (50:40:10%) f.w.
Table 5. Indexes R1 and R2 according to the variables tested.
Start-Up (Day 0)Thermophilic (Day 60)End Bio-Oxidative (Day 120)Matured (Day 165)
R1R2R1R2R1R2R1R2
N sourceCM0.691.771.03 a2.81 a1.15 a3.29 b1.153.20 b
GM0.701.710.98 b2.36 b1.11 b2.58 a1.112.55 a
F-anova nsns8.52 **15.3 ***4.45 *25.4 ***ns31.9 ***
C SourceAlm0.711.831.002.591.133.051.153.04
Vn0.681.641.012.571.132.821.112.71
F-anova nsnsnsnsnsnsnsns
CoverNo Cover0.701.740.96 a2.601.17 b3.141.163.00
Cover0.701.741.02 b2.571.08 a2.731.102.84
F-anova nsns4.45 *ns27.9 **6.86 *8.70 **ns
*, **, ***: Significant at p < 0.05, 0.01, 0.001, respectively; ns: not significant. Average values in a column followed by the same letter are not significantly different at p < 0.05 (LSD test).
Table 6. Accumulated GHG emissions of composting piles depending on the mixture, N source, C source, cover use, and additive used.
Mixtureg NH3/pileg N2O/pileg CH4/pilekg CO2/pileGWP
(kg CO2-eq/pile)
N source
CM98 b30 a79 39710.4 a
GM75 a55 b6344016.8 b
F-anova4.88 *16.77 ***nsns13.90 **
C source
Alm8033 a68 333 a10.8 a
Vn9253 b73503 b16.5 b
F-anova1.09 ns8.84 **ns9.12 **9.60 **
Cover
No Covered87 4267337 a13.2
Covered864475500 b14.1
F-anovansnsns8.06 **ns
Additive
Control93446937413.7
Biochar79407145512.8
BM87457342714.3
F-anovansnsnsnsns
CO2 equivalent from N2O and CH4 flux emissions were calculated according to their GWP (IPCC, 2023). *, **, ***: significant difference between treatments at p < 0.05, p < 0.01 and p < 0.001, respectively; ns: not significant. Different letters within a column indicate significant differences between treatments (LSD test, p < 0.05).
Disclaimer/Publisher’s Note: The statements, opinions and data contained in all publications are solely those of the individual author(s) and contributor(s) and not of MDPI and/or the editor(s). MDPI and/or the editor(s) disclaim responsibility for any injury to people or property resulting from any ideas, methods, instructions or products referred to in the content.

