Article

Pig Slurry Fertilization Changes the Pyrolytic Signature of Humic Substances in Calcareous Soil

by
Àngela D. Bosch-Serra
1,*,
Diana E. Jiménez-de-Santiago
1,2,
José A. González-Pérez
3 and
Gonzalo Almendros
4,5
1
Department of Chemistry, Physics, Environmental Sciences and Soil, University of Lleida, Rovira Roure Av. 191, 25198 Lleida, Spain
2
BETA Technological Centre (UVic-UCC) Futurlab, Can Baumann Ctra de Roda 70, E-08500 Vic, Barcelona, Spain
3
Instituto de Recursos Naturales y Agrobiología de Sevilla (IRNAS-CSIC), Av. Reina Mercedes 10, 41012 Seville, Spain
4
National Museum of Natural History (MNCN, CSIC), Serrano 115 B, 28006 Madrid, Spain
5
Department of Geology and Geochemistry, Faculty of Science, Autonomous University of Madrid, 28049 Madrid, Spain
*
Author to whom correspondence should be addressed.
Agronomy 2025, 15(3), 725; https://doi.org/10.3390/agronomy15030725
Submission received: 7 February 2025 / Revised: 8 March 2025 / Accepted: 14 March 2025 / Published: 17 March 2025

Abstract

:
The aim of this study was to determine the effect of progressive pig slurry (PS) rates, applied over a 12-year period, on the molecular composition of soil organic matter in a calcareous soil. Annual organic matter rates of PS ranged from 1.0 to 4.8 Mg ha−1. Humic acids (HAs) were extracted from field plots treated with PS, including a control (no PS applied). These HAs were analysed using pyrolysis–gas chromatography–mass spectrometry. The proportions of the 122 major compounds released from the soil HAs indicated that PS stimulated humification processes, with the degree of enhancement depending on the application rate. The applied PS contained a high proportion of aliphatic compounds, but only steroids and triterpenes accumulated in the HA soil fraction, and this was only observed at low PS rates. These results suggest that the application of PS leads to a dose-dependent increase in alkyl compounds, mainly alkanes and olefins. Aromatic compounds also showed a dose-dependent increase, but not in terms of the demethoxylated compounds typical of mature humic substances found in the original soil. Instead, the increase in aromatics was observed in the form of methoxyphenols, suggesting a recent incorporation of lignin derivatives from crop residues into the HA.

1. Introduction

The conservation of soil organic matter is a key objective to ensure optimal agricultural and environmental conditions of soils in the European Union (EU). In the Mediterranean basin, crop yields are projected to decline in the coming decades in most current production areas and for the majority of crops [1]. To address these productive and environmental challenges, the conservation of soil organic matter has been included in the strategic plans that EU Member States are required to implement under the Common Agricultural Policy [2]. This includes a published regulation [3] aimed at developing a voluntary EU certification framework to achieve permanent carbon removal, carbon farming, and carbon storage in products. The aim is to facilitate and encourage the uptake of high-quality carbon removal from soils, as well as emission reduction, while fully respecting the EU’s biodiversity and zero-pollution objectives.
The importance of organic matter incorporation in agricultural systems is linked to its ability to improve various aspects of soil quality [4], including porosity [5], aggregation [6], bulk density [7], and cation exchange capacity [8], all of which contribute to better bioavailability and the retention of essential macro- and micro-elements required for plant growth [9]. These benefits help to mitigate desertification, combat soil sealing, reduce soil pollution, and prevent erosion. In summary, they improve soil health in line with the objectives of the EU Soil Mission [10]. Furthermore, increased soil organic carbon storage and carbon sequestration in soil are recognised as relevant mitigation strategies in relation to climate change [11].
The remarkable properties of organic matter in soils are largely due to humic acids (HAs), which are the organic matter fraction most resistant to biodegradation and have a highly complex and variable molecular composition depending on the soil [12,13]. The use of livestock wastes, such as pig slurry (PS), can modify these properties by incorporating and stabilising some of the less readily biodegradable organic components. These are incorporated and stabilised together with those of the soil’s HA fraction [14].
The addition of organic C can also alter the soil organic matter turnover [15]. However, a significant acceleration of mineralisation requires an excess of fresh organic matter [16]. Some authors [17] suggest that the amount of C added in relation to microbial C is a driving factor in the decomposition of recalcitrant soil organic matter.
As a result, there has been a surge in research aimed at determining both the quality and the total amount of soil organic matter following the application of organic amendments, particularly in tropical soils [18,19,20,21], but also in dryland Mediterranean conditions [22,23]. This is particularly important with respect to the resistance of soil organic matter to biodegradation, which can determine whether the added material will become a persistent source of carbon in the soil due to its structural similarity to humic substances, or whether it will be rapidly biodegraded without any significant effect on the accumulation of stable forms of carbon in the soil. This issue is of critical importance within the EU’s Climate Resilient Europe policy, which emphasises nature-based solutions for adaptation to climate change [3]. In fact, in agricultural tillage systems, the hydrothermal regime influences the ratio of aromatic to aliphatic carbon, increasing it under dry conditions, indicating a higher degree of soil organic matter alteration [24]. However, there is still limited information on the redistribution of soil humic matter following PS application in Mediterranean rainfed agricultural systems where water availability is a limiting factor. Moreover, in calcareous soils, some authors point out the conservation mechanism of HAs, which is not only based on the resistance of the molecular structure, but also on the formation of complexes with calcium and/or physical enclosing by hypergenetic CaCO3 precipitation [25].
One of the limitations of studies on changes in the quality and quantity of HAs is the need for long-term experiments, which should include a wide range of slurry application rates in order to obtain robust results, as has been demonstrated when working on the fate of organic constituents [26].
The analytical pyrolysis technique has proven to be a valuable method for the study of a wide range of complex organic materials due to its ability to release a wide range of compounds. This methodological approach facilitates the identification and semi-quantitative determination of specific compounds or families of compounds that act as indicators of both the origin and the extent of the transformation of organic matter [27,28]. In a semi-arid area, the analytical pyrolysis technique was used in a long-term field experiment [29] to study the composition of organic matter in soils following the incorporation of crop residues with or without mineral N and/or farmyard cattle manure. The results of this experiment indicated the biogeochemical constraints of semi-arid conditions for the formation of highly mature HAs, leading to an increase in a humic organic fraction based on lignin-derived methoxyphenols. The manures added alkyl compounds, suggesting that recalcitrant wax-derived lipids were incorporated into the HAs. Analytical pyrolysis techniques have also been used in PS [30] and in PS digestate analysis [31]. In pig slurry, fatty acids were the major constituents, while lignins and N-containing compounds dominated in the slurry fraction < 63 µm, and sterols were important in the remaining fractions [30]. However, information on pyrolytic descriptors sensitive to the long-term evolution of soil HAs with PS fertilization is still lacking.
The van Krevelen diagram [32] is particularly useful [27] for visualising changes in the proportions of different components derived from pyrolysis results. In fact, this technique facilitates the interpretation of complex mixtures of compounds identified through different analytical methods [33,34,35].
In this research, it was hypothesised that the application of PS to calcareous soils would result in changes to the molecular composition of soil humic matter. These changes can be identified using the analytical pyrolysis technique, which also provides insight into the significance of such changes in relation to PS application rates. In addition, the use of the van Krevelen diagram is expected to facilitate the rapid identification of the changes. The present study was conducted on a calcareous soil with the aim of assessing the effect of PS application at different rates over twelve cereal cropping seasons on the molecular composition of HAs.
In the context of soil C sequestration, it is imperative to determine to what extent slurry is incorporated as humic-type organic matter or, alternatively, if slurry acts as an accelerator of the decomposition of crop residues and native soil organic matter without significantly improving humification quality. In other words, this study also assesses whether the novel composition of organic matter in slurry-treated soils is due to the accumulation of pre-existing products in the slurry, or whether it is due to the influence of the slurry on the microbial processes that transform plant residues.

2. Materials and Methods

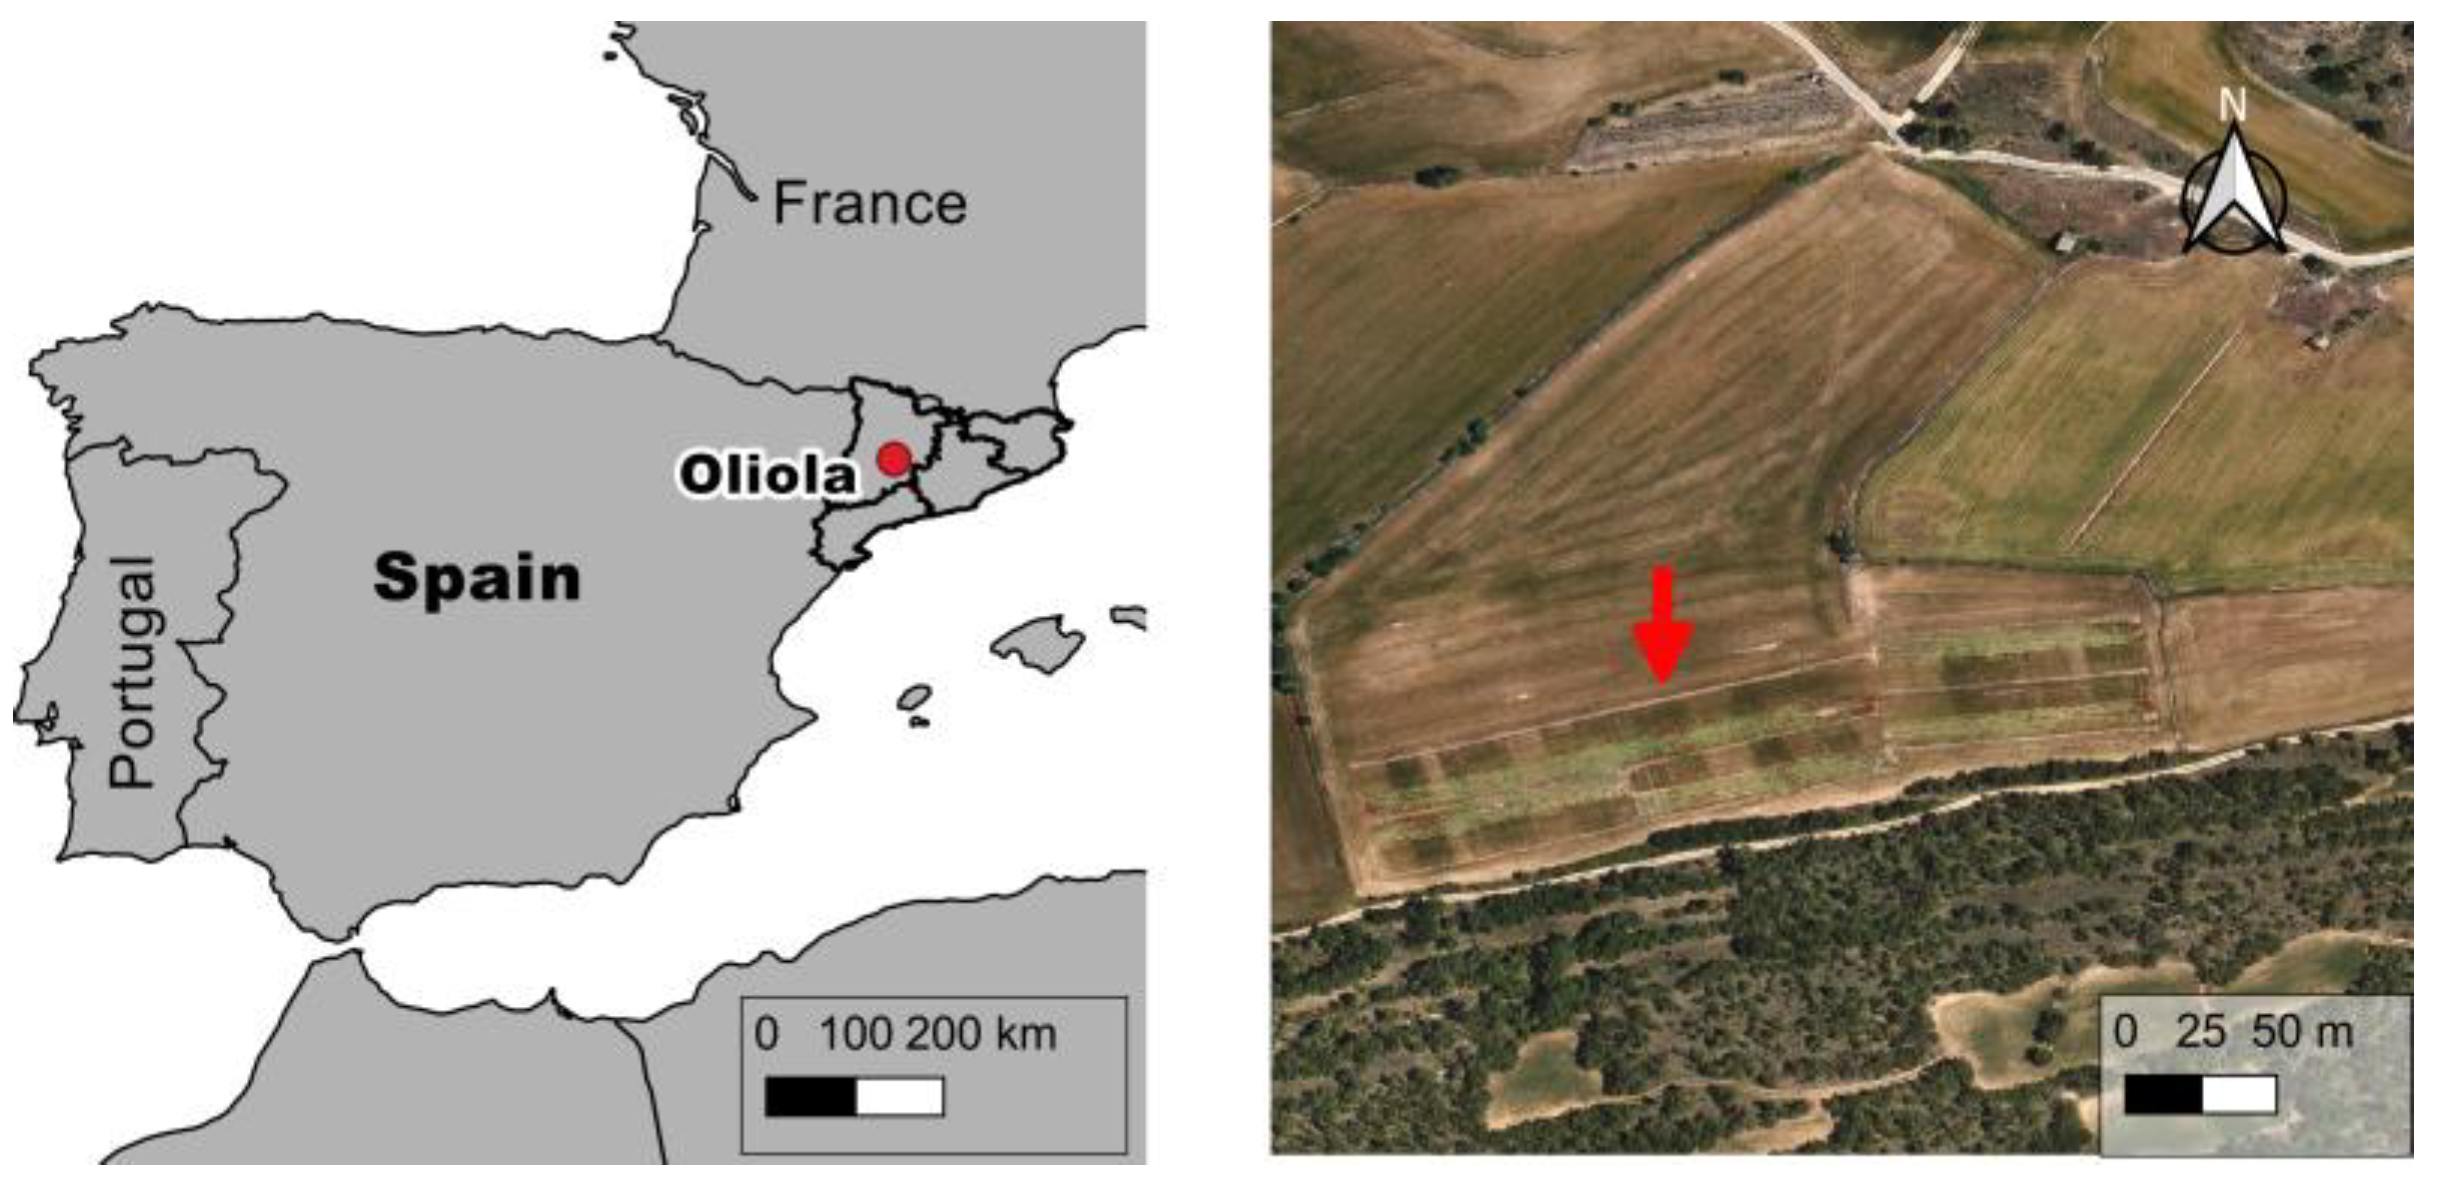
2.1. Experimental Location and Design

A long-term field experiment involving nitrogen fertilisation was initiated in 2002 in Oliola (Figure 1), Lleida province, NE Spain (41°52′29″ N, 1°09′13″ E, 440 m a.s.l.).
The region’s climate is classified as semi-arid Mediterranean, with an average annual rainfall of 450 mm. Evapotranspiration exceeds precipitation for most of the year, especially during the summer months when high average temperatures (>20 °C) are recorded. The annual reference evapotranspiration (ET0, as defined by the FAO Penman–Monteith equation) averages 1100 mm.
The soil was classified as Typic Xerofluvent [37], non-saline, and calcareous. Illite and chlorite were identified as the dominant minerals. The upper layer (0–0.30 m) had a silty loam texture (USDA classification) without stones or coarse elements. Sand, silt, and clay contents were 131 g kg−1, 609 g kg−1, and 260 g kg−1, respectively. The pH of the upper layer was 8.2 (1:2.5; soil–distilled water), its bulk density was 1650 kg m−3 (ring method), and its calcium carbonate content (Bernard’s calcimeter method) was 300 g kg−1. The cation exchange capacity was 11.1 cmolc kg−1 (extraction with 1N ammonium acetate, pH = 7).
The experiment consisted of a rainfed winter cereal rotation with barley (Hordeum vulgare L.) and wheat (Triticum aestivum L.), except for one fallow season (2007–2008). Tillage was carried out annually before sowing with a disc harrower. Nitrogen was supplied by PS at varying rates. Mineral fertilisation was also applied. Slurry samples were analysed for total organic matter and N content prior to the annual soil applications. Slurries always came from the same nearby farm.
In the 2015–2016 cropping season (September 2016), three treatments were selected for the present study, in addition to a control (Table 1). The selection was based on the averages of annual rates of organic matter applied with PS (959, 1611, and 4802 kg ha−1) plus a control (based on mineral fertilisation, no slurry applied). The rates of slurry applied were also based on N fertilisation rates. Rates started at around 65% of the maximum allowed N rate from organic origin (190 kg N ha−1) in rainfed, non-nitrate-vulnerable areas [38], followed by the maximum allowed N rate, and increased up to three times. The mineral N fertilised plot (PS-00) received ammonium nitrate (120 kg N ha−1 yr−1), P (40 kg P ha−1 yr−1), and K (56 kg K ha−1 yr−1). This mineral treatment was used as a control.
Each year, the PS-16 rate was applied just before cereal sowing (in October), the PS-10 rate was applied at cereal tillering (early February), and the PS-48 rate was split between sowing (30 Mg ha−1) and cereal tillering (60 Mg ha−1). Pig slurry application was facilitated by a splash plate. At sowing, slurry and stubble (c. 25% of straw yield biomass) were buried to a depth of about 0.15 m after slurry application. Conversely, at cereal tillering, slurry was not buried but left on the soil surface.
The PS-16 rate is associated with the maximum allowed rate of N from organic sources (190 kg N ha−1) in rainfed systems of semi-arid areas, and in non-nitrate-vulnerable zones [31].

2.2. Soil and Slurry Sampling

A pig slurry sample was obtained in February 2015 prior to soil application. The dry matter of PS was determined by gravimetry at 105 °C, while its organic matter was determined by ignition at 550 °C. Organic and ammonium N were determined according to the 4500-NH3B–C method of [39]. Organic N was obtained as the difference between total and ammonium N. In addition, PS was separated by centrifugation, then freeze-dried, ground with an agate mortar, and suspended in water for 24 h (1:20, ground slurry–distilled water). The resulting sample was then subjected to centrifugation, 0.45-micron filtration, and freeze-drying.
A composite soil sample (1 kg) for each treatment was collected in September 2016, at the end of the 2015–2016 cropping season. This composite sample consisted of a mixture of five subsamples taken from a soil depth of 0–0.1 m. Samples were dried at room temperature and passed through a 2 mm sieve.

2.3. Isolation and Quantification of Soil Organic Matter Fractions

Organic carbon in soil samples was quantified by dichromate oxidation, followed by titration with ferrous ammonium sulphate [40,41]. The soil samples were then subjected to a series of 10 sequential extractions according to a standard procedure [42]. The samples were treated twice with 0.1 M Na4P2O7 (150 mL each time) and eight times with 0.1 M NaOH (150 mL each time). Upon completion of the extractions, the volume of the recovered solution was determined for the further analysis of total humic extract and HAs using 25 mL and 50 mL aliquots of each extract, respectively. The preparative isolation and purification of the HAs from the remaining extract was carried out by precipitating the total humic extract at pH = 1 with 6 M HCl for 24 h to promote HA precipitation, then decanting the suspension. The HA precipitate was then redissolved in 0.5 M NaOH and centrifuged at 3622× g for 5 min. The purpose of this step was to sediment clay minerals, which were then discarded. The sodium humate solution was then reprecipitated with
6 M HCl until the pH was adjusted to 1. The solution was then centrifuged at 3622× g for 5 min, after which the liquid was decanted. The purified HA in the gel state was then recovered with distilled water and transferred to cellophane dialysis bags (Visking® dialysis tubing, molecular weight cut-off of 18,000 Da, corresponding to a pore diameter of approximately 25 Å) for a period of 3–4 days to remove soluble mineral salts. The distilled water was replaced daily until no further reaction of chloride with silver nitrate was observed. Finally, the resulting HA suspension was transferred to Petri dishes and dried at 40 °C. The isolated HAs were stored in glass vials for later analysis.

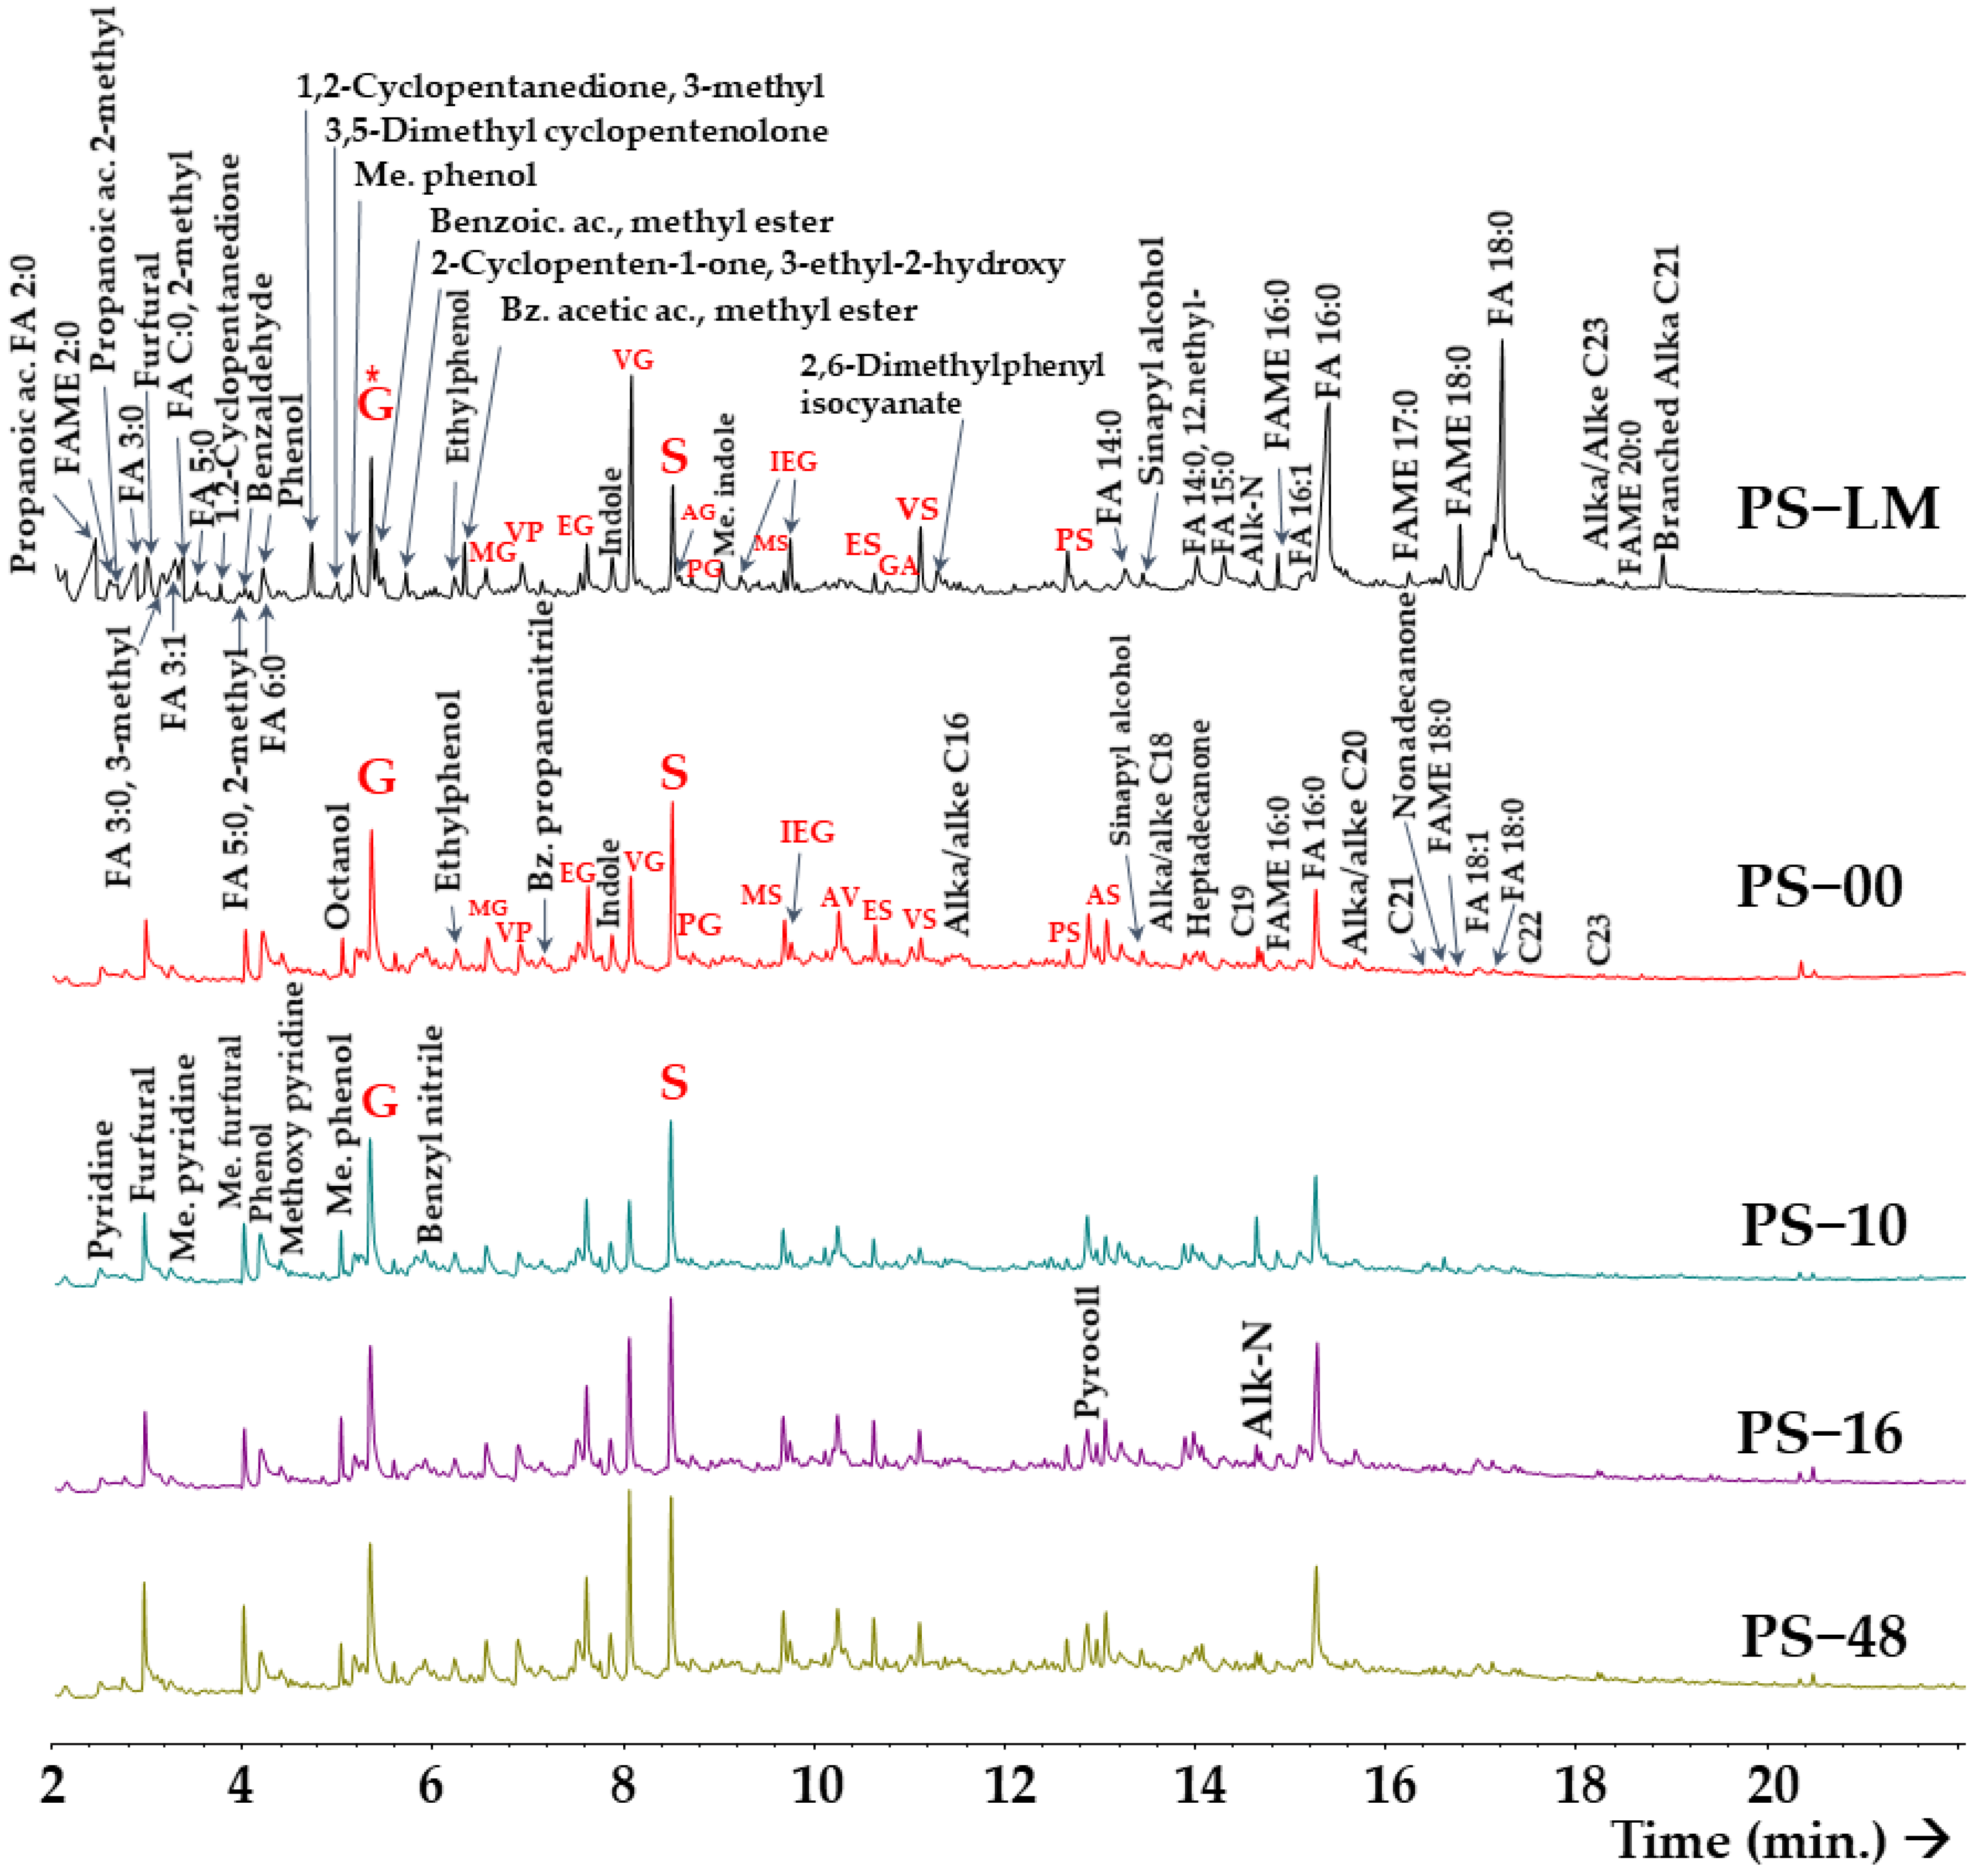
2.4. Pyrolysis–Gas Chromatography–Mass Spectrometry

The molecular composition of the HAs was analysed by Py-GC/MS. The HA samples (1–2 mg) were subjected to pyrolysis at 500 °C for 1 min. The instrument used consisted of a micro-furnace-type multi-shot pyrolyzer (Frontier Laboratories Ltd., Fukushima, Japan, Mod. PY-2020iD) coupled to a gas chromatograph (Agilent Technologies Inc., Wilmington, Delaware, USA, Mod. Agilent 6890N GC). This was equipped with a low-polar fused-silica (5% phenylmethylpolysiloxane) capillary column (Agilent J&W HP–5 ms Ultra Inert, with a length of 30 m, a diameter of 250 μm, and a layer thickness of 0.25 μm). The temperature of the GC oven was initially set at 50 °C for 1 min, then increased to 100 °C at a rate of 30 °C min−1, increased from 100 to 300 °C at a rate of 10 °C min−1, and subsequently isothermally maintained at 300 °C for 10 min. The total analysis time was 32 min, and the carrier gas used was helium at a flow rate of 1 mL min−1. Mass spectra (MS) were acquired using a quadrupole mass spectrometer (Agilent Technologies Inc., Wilmington, Delaware, USA, Mod. Agilent 5973N MSD) at +70 eV ionisation energy.
The assignment and relative quantitation of the pyrolysis compounds were performed using two methods: (i) selecting ion traces in reconstructed ion chromatograms for the major expected compounds (i.e., the known, frequent common pyrolysis products of soil organic matter), and (ii) comparison with our own laboratory databases of chromatographic data (i.e., MS, retention times (RTs), response factors, literature references, etc.) on pyrolysis compounds based on previous injections of either commercial standards or purified preparations of plant and microbial biomacromolecules (e.g., lignins, suberins, polysaccharides, etc.) to confirm the RTs of the peaks for the main series of homologues. Secondly, the electron impact mass spectra (70 eV) were examined. The NIST and Wiley spectral libraries were used for automatic library searching, while “ad hoc” self-developed computer programs were used for manual heuristic searching (mainly using reverse fitting) in the above-mentioned specific databases of soil organic matter pyrolysis compounds.
The peak areas (as total area counts) of the different chromatographic peaks were integrated and calculated as total abundances (sum = 100). In order to facilitate the identification of significant differences between the abundances of different compounds in the pyrograms corresponding to different spatial replicates, an analysis of variance (ANOVA) was performed, followed by the least significant difference (LSD) test (Table S1) using the Statgraphics statistical package [43].

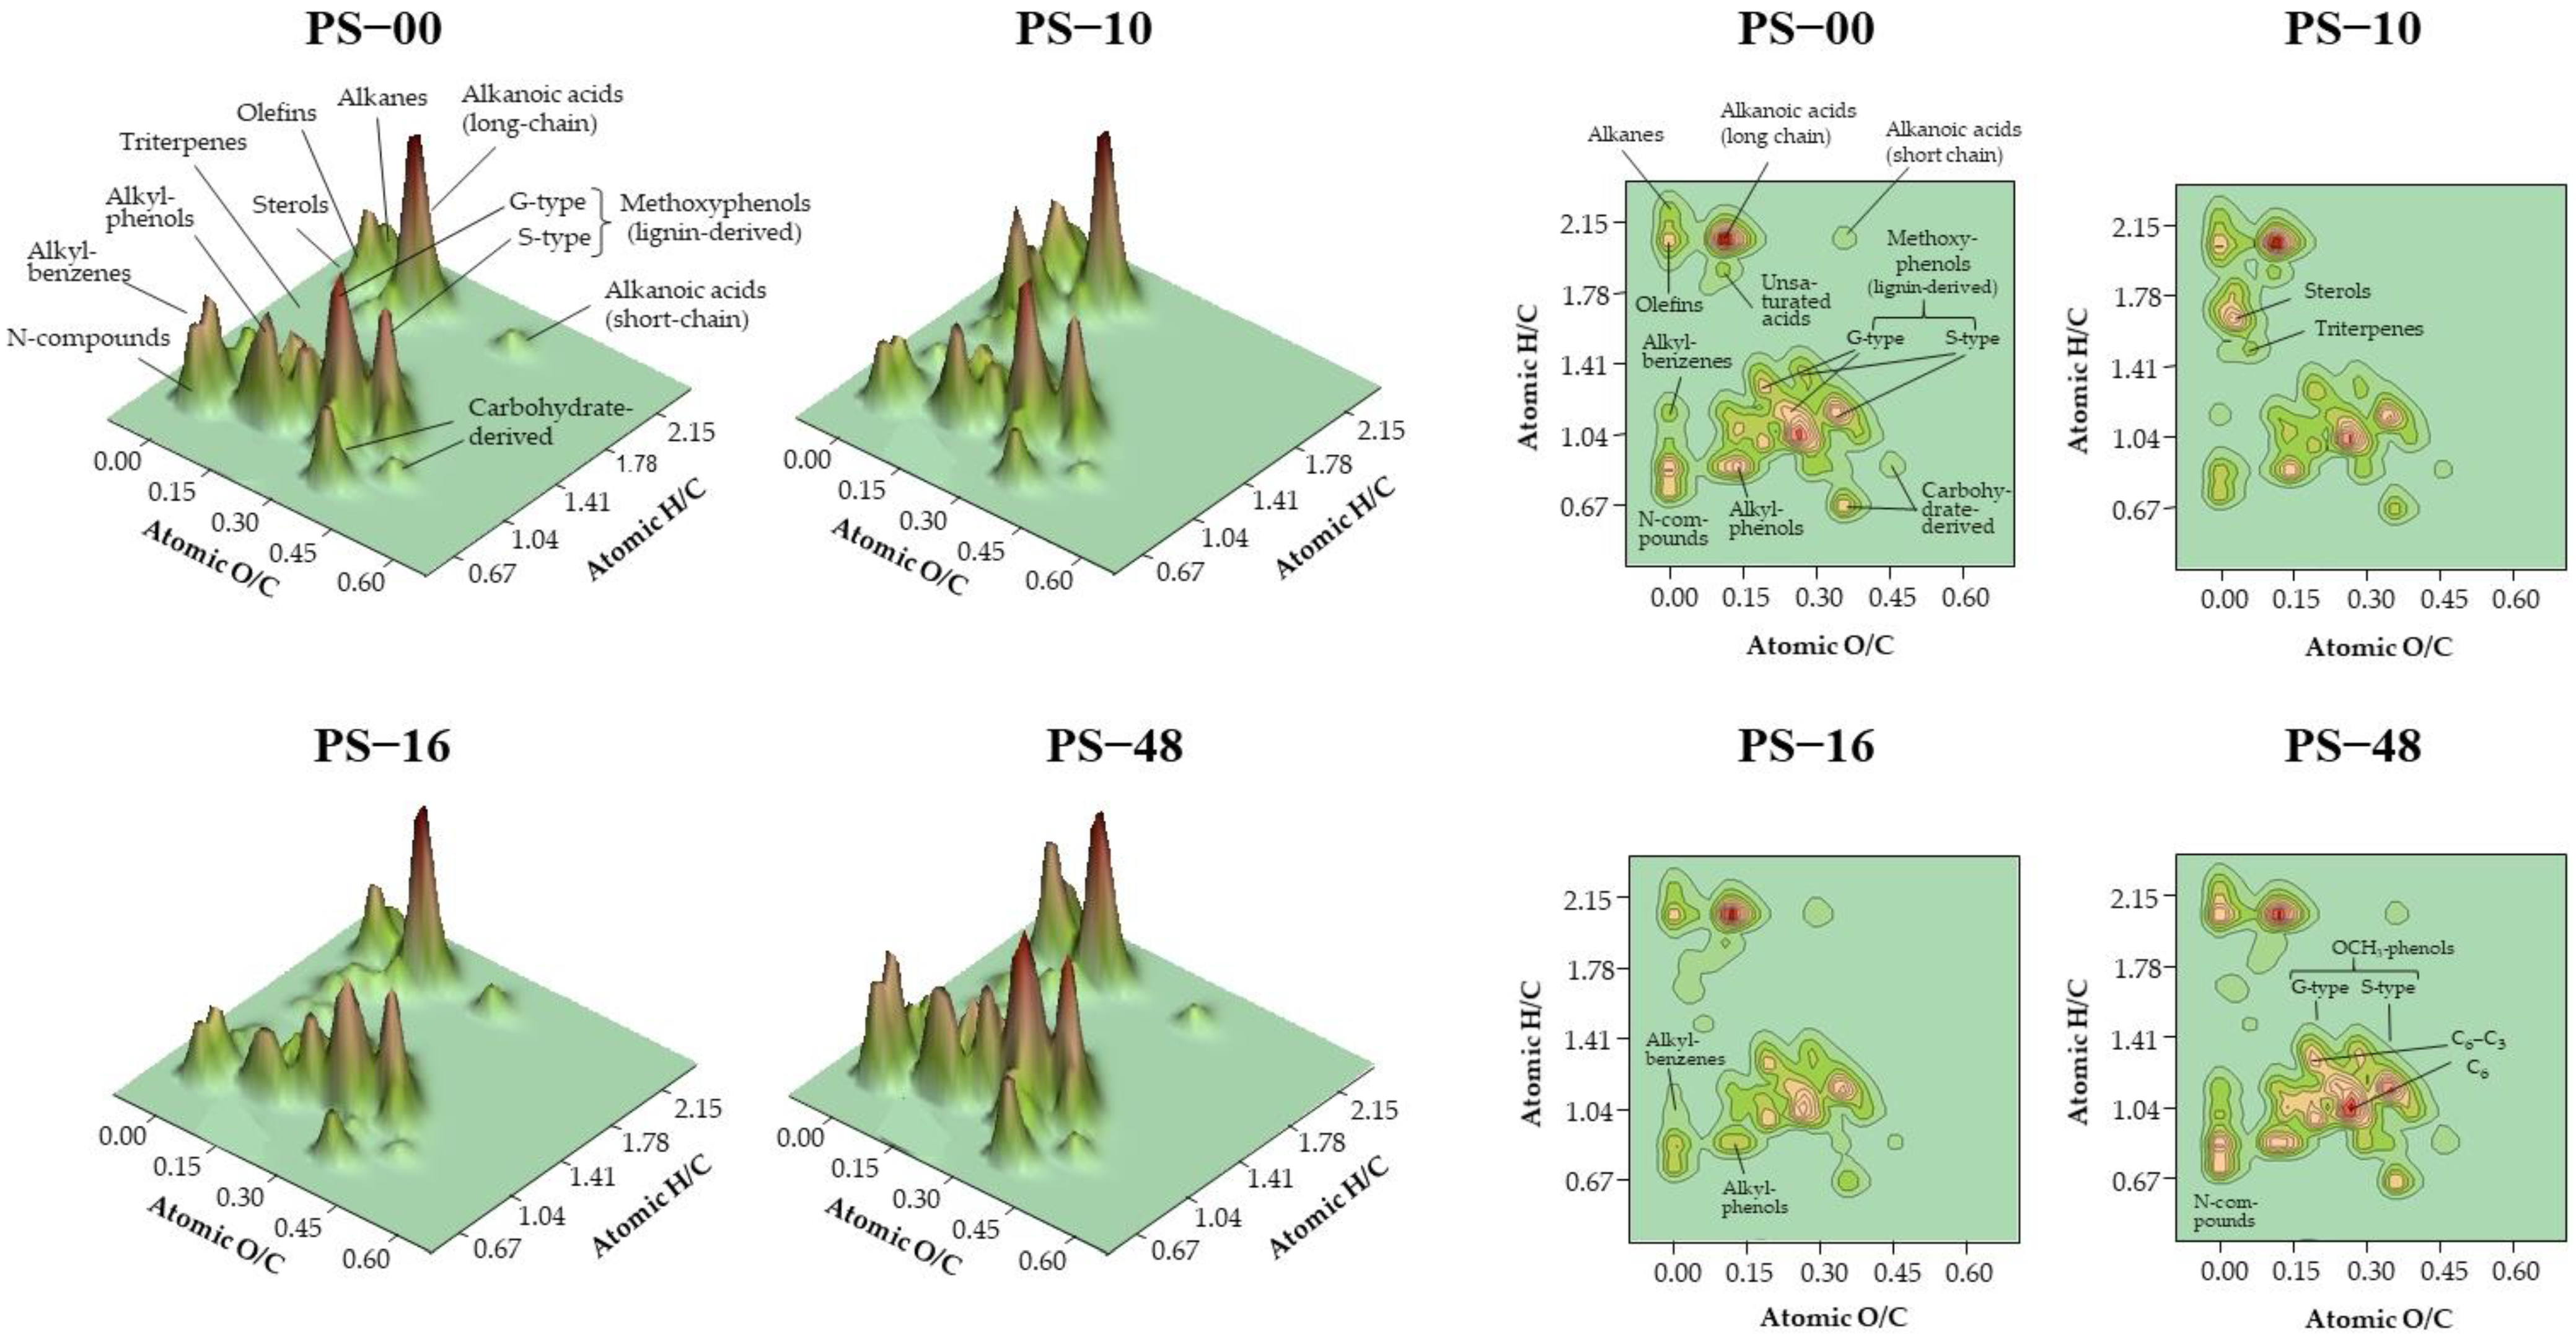
2.5. Van Krevelen Surface Density Plots

The quantitative data of the different molecules were presented using a graphical statistical approach based on the classic van Krevelen diagram [32]. The enhanced approach used involved the construction of “surface density plots” derived from the abundances of individual compounds represented in the space defined by their H/C and O/C atomic ratios [27]. The values for the H/C and O/C atomic ratios of the molecules are plotted in the basal plane (x, y axes), and the vertical dimension (z axis) represents the normalised abundances (sum = 100) of the quantitative data of individual compounds (Table S1). The resulting plot shows a series of 3D peaks, or compound clusters, whose sizes are proportional to the collective abundances of compounds with similar elemental composition.

3. Results

The PS applied in the cropping season exhibited an organic matter content (over dry weight) of 769 g kg−1. The total N content was 75.4 g N kg−1, and the organic N content was 23.3 g N kg−1 (over dry weight). The slurry dry matter content was found to be 84.4 g kg−1, a value which is within the common range of values for this type of slurry in the centre and east of Spain [44].
The soil organic carbon content was found to be 9.9, 11.3, 12.9, and 13.0 g C kg−1, while the HA content was found to be 1.4, 1.3, 1.2, and 3.5 g C kg−1 for the PS-00, PS-10, PS-16, and PS-48 treatments, respectively. From previous work [7], it can be deduced that microbial biomass C represented about 2% of the soil organic C content.

3.1. Quantitative Changes in the Abundances of the Main Families of Pyrolysis Compounds

In the PS, the fatty acid content was found to be considerably higher than in the humic fractions of the soil (Figure 2, Table 2). On the other hand, compounds that were less abundant in the slurry, such as alkanes, exhibited a tendency to increase in relation to the application rates.
The presence of different types of aromatic compounds in the slurry was significantly lower than in the HA fraction of the soil (Table 2 and Table S1). An increase in concentration was observed as a function of the dose applied, but this phenomenon was not observed at the lowest dose.
In the case of nitrogen compounds, their behaviour was analogous to that of aromatic compounds (Table 2 and Table S1), as both are constituents of organic matter that are progressively incorporated into stable forms within HAs during the humification or maturation process.
In the case of typical aliphatic products, such as carbohydrate derivatives and steroids, progressive accumulation was observed with increasing slurry doses (Table 2 and Table S1), although some increases were observed at lower doses.

3.2. Surface Density Plots

The surface density plots were obtained from the relative abundances of the different compounds, represented in the space defined by their atomic ratios of H/C and O/C (Figure 3).
With regard to the van Krevelen plots (originally designed to study coal maturity [32]), there is a traditional geochemical view that this representation facilitates the recognition of the maturity or degree of transformation of organic matter. The increase in compounds with low H/C and O/C ratios, i.e., in the direction of the main diagonal, is used to identify maturity, thereby associating the progressive evolution of organic matter with the selective degradation of aliphatic constituents (e.g., lipids and carbohydrates) and the increase in progressively more condensed and methoxyl-lacking aromatic compounds (i.e., demethoxylation of lignin).
The information presented on the density surfaces, which represent the abundances of compounds in the van Krevelen diagram (Figure 2), is similar in all graphs, although some graphs are displayed in three dimensions, and others are in two dimensions. Two-dimensional graphs (contour maps) are more suitable for quickly identifying the position of different groups of compounds with similar elemental composition. Conversely, three-dimensional graphs may provide a more intuitive way of distinguishing the different abundances of groups of compounds, which in this case are shown as proportional to the volume or height of the peaks, rather than as contour lines of increasing density.
The graphs show a progressive change in the molecular composition of the corresponding HAs (Figure 3). This observation is in line with the above-mentioned trends concerning the accumulation of lipids (mainly alkanes) and the selective degradation of aromatic and alicyclic components, which show a reduced resistance to biodegradation. It is noteworthy that the HAs from the soil treated with the highest dose of slurry showed a more pronounced accumulation of lignin from crop residues.

4. Discussion

4.1. Abundances of the Main Families of Pyrolysis Compounds

The content of alkyl compounds was found to be significantly higher in the PS than in the HA fractions of the soils. However, this was only the case for fatty acids, as the slurry contained low levels of alkanes and methylated fatty acids (Table 2). The importance of fatty acids in pig slurries coincides with [30].
In the soil, the content of the afore-mentioned alkyl compounds, especially alkanes, remained constant or showed a tendency to increase with the application rate (Table 2 and Table S1). This finding indicates that the concentration of alkyl compounds cannot be exclusively attributed to the accumulation of pre-existing products in the slurry. Microbial metabolism may contribute to the synthesis or accumulation of specific compounds [45], particularly alkanes.
Regarding the aromatic compounds, the data presented in Table S1 show that these compounds were found in relatively low proportions in the slurry compared to those found in the HA soil fraction.
While slurry application initially resulted in a decrease in the relative abundance of all aromatic compounds in the HAs, there was a noticeable tendency for these compounds to increase in proportion to the application dose. This may indicate the incorporation of precursors present in the lignified biomass into the HAs as a result of the increased stubble yield (Table 1). Therefore, it can be concluded that slurry application had a positive effect on the formation of HAs. However, this benefit comes at the cost of the incorporation of biodegradation-resistant components of crop residues, mainly lignins. This is consistent with the slight tendency of non-linear increases with dose observed in the LG/LS ratio of lignin pyrolysis products (Table 2).
In the case of nitrogen compounds, a similar trend to that of aromatic compounds was observed. Pig slurry was not particularly rich in these compounds compared to soil HAs, where N was presumably present in forms more resistant to biodegradation. As a result, the application of slurry had a dilution effect, reducing the proportion of nitrogen compounds in the HA fraction. However, this effect was offset by an increase in the applied dose, indicating that slurry had a positive effect on the accumulation of stable forms of nitrogen in the HAs. This is characteristic of the humification or maturation process.
In the case of other aliphatic compounds, such as steroids and carbohydrate derivatives, a non-linear trend was observed. These compounds tended to decrease with higher slurry application rates. This finding is consistent with previous observations in this work, which suggest that increasing the slurry rate dosage stimulates humification processes, leading to the breakdown of easily biodegradable substances during the humification process.

4.2. Surface Density Plots for HAs from Soils Treated with Progressive Doses of Pig Slurry

From the density surfaces illustrating the abundances of compounds, as shown in the van Krevelen diagrams, it can be concluded that the progressive application of slurry doses did not result in a selective accumulation of raw organic matter, a pattern typically observed when other types of organic waste are introduced into the soil [46]. In contrast to soil humic substances, the majority of organic wastes employed as soil amendments, particularly those subjected to composting or microbial fermentation processes, are characterised by a comparatively high content of long-chain aliphatic products. This phenomenon is also observed in slurry (see Table 2). However, while the application of organic waste is usually accompanied by an increase in the aliphaticity of the organic matter in the soil [46], this was not observed, except to a low extent, in the case of PS. Instead, the graphs show some simplification in the molecular composition of the HAs. While some aliphatic products, such as alkanes and fatty acids, were preserved, there was an accumulation of aromatic constituents. This result is consistent with previous results [6,14] suggesting that the addition of PS stimulates biological activity that promotes the lignin humification process.
The graphs also showed changes in the relative proportions of various chemical compounds. For instance, in the context of aliphatic compounds, it was evident that increasing slurry doses resulted in an enrichment of alkyl compounds (alkanes and olefins), accompanied by a decrease in the relative proportion of fatty acids. On the other hand, the abundance of alicyclic compounds, such as steroids and triterpenes, decreased and approached the levels observed in the HAs of the control soil before the start of the slurry application.
In terms of aromatic constituents, there were no significant structural changes to the HAs at low PS rates. However, with increasing slurry rates and the associated increase in stubble yield from straw biomass (Table 1), a higher proportion of lignin-derived phenols was observed. Even at the highest rate, the proportion of non-methoxylated aromatic compounds, which are characteristic of more advanced stages of maturity, tended to increase. This may be a consequence of the microbial processes stimulated by specific slurry doses. In Figure 3, it is evident how, from the second dose (PS-16), progressive changes occur in the HAs, suggesting a greater maturity or degree of humification. This is particularly evident in methoxyphenols, which, at the highest dose (PS-48), exhibit the highest proportion of short-chain compounds (C6-type units) and the lowest of longer-chain ones (phenylpropanoids, type C6–C3), suggesting a greater degree of alteration in lignin units, which begins with the cleavage of C-3 side chains. In more advanced stages, in parallel with the dose, the demethoxylation of lignin leads to the formation of alkylphenols and, subsequently, of alkylbenzenes, whose proportions also increase from dose PS-16. This progressive humification is associated with the incorporation of stable forms of nitrogen (higher yields of indoles, nitriles, and pyridines), which, with the highest dose, again present abundances similar to those of HAs in soil without treatment with slurry.
Finally, the correlation identified between slurry application rates and HA structure may be of interest in terms of the soil climate resilience expected after an organic amendment. This is because the amendment is both stimulatory to soil biological activity and selective in its accumulation of slowly biodegradable organic matter. It can be hypothesized that, at the lowest dose, the effect of slurry on the composition of HAs is fundamentally direct (accumulation of inherited, slurry-derived, and microbial products), as is the case with triterpenes and steroids. Conversely, at higher doses, the effect appears to be predominantly indirect, i.e., resulting in the incorporation of recalcitrant constituents, such as lignin, derived from the residual lignocellulosic biomass.
In conclusion, our findings highlight the need to integrate PS fertilization with complementary strategies to enhance soil carbon stocks. Such strategies could include the incorporation of plant residues rich in aromatic structures that will favour the C retention of organic matter inputs, according to previous experiments [47].
Models related to the role of exoenzyme activities in total C flux and how this relates to N availability might be of interest [48]. In fact, the set of results presented provides evidence-based data that are useful for adjustments of models and regulations to the Mediterranean context, as has been emphasized in earlier research [45,49]. Besides, a holistic approach to soil organic C dynamics and C sequestration is needed to avoid negative impacts on soil quality and external systems (e.g. water) due to excessive slurry fertilization [50,51]. These findings underscore the need for further research into the long-term effects of organic amendments on soil quality, microbial communities, and the humification process, particularly in Mediterranean agricultural systems [52], where waste management practices could play a crucial role in improving soil fertility and sustainability.
Future studies should focus on how waste management practices influence the balance between the quality and the quantity of organic matter, considering factors such as soil type, microbial biomass C, microbial community structure, biomass yields, and slurry application rates. Additionally, investigating the role of PS application in combination with other organic amendments (e.g., compost, biochar) could provide insights into optimizing soil health and carbon storage in Mediterranean soils.

Supplementary Materials

The following supporting information can be downloaded at: https://www.mdpi.com/article/10.3390/agronomy15030725/s1, Table S1: Main pyrolysis products from whole samples of pig slurry (PS) and from humic acids from soils treated with annual progressive doses of organic matter (OM) from PS. The retention times (RT) of the different chromatographic peaks and the abundances (as a percentage) of the main diagnostic ions of the corresponding mass spectra are given. Least significant differences (LSD, p < 0.05) obtained from the pyrograms of humic acids extracted from up to three spatial replicates corresponding to different plots are also included.

Author Contributions

Conceptualization, À.D.B.-S. and G.A.; methodology, D.E.J.-d.-S. and J.A.G.-P.; data curation, J.A.G.-P.; writing—original draft preparation, G.A. and À.D.B.-S.; writing—review and editing, À.D.B.-S., G.A., J.A.G.-P. and D.E.J.-d.-S.; funding acquisition, G.A., À.D.B.-S. and J.A.G.-P. All authors have read and agreed to the published version of the manuscript.

Funding

This research was funded by the Spanish Ministry of Science, Innovation and Universities and the Spanish National Institute for Agronomic Research (MICINN-INIA) through the project RTA2017-88-C3-3.

Data Availability Statement

Data for this work are available upon reasonable request.

Acknowledgments

The authors would like to acknowledge the field assistance from the Department of Agriculture, Livestock, Fisheries and Food, Generalitat de Catalunya (Spain).

Conflicts of Interest

The authors declare no conflicts of interest.

Abbreviations

  • The following abbreviations are used in this manuscript:
HAHumic acid
PSPig slurry

References

  1. MedECC (Mediterranean Experts on Climate and Environmental Change). Summary for policemakers. In Climate and Environmental Change in the Mediterranean Basin—Current Situation and Risks for the Future. First Mediterranean Assessment Report; Cramer, W., Marini, K., Guiot, J., Eds.; Union for the Mediterranean, Plan Bleu, UNEP/MAP: Marseille, France, 2020; pp. 11–40. [Google Scholar] [CrossRef]
  2. European Parliament. Regulation (EU) 2021/2115 of the European Parliament and of the Council of 2 December 2021 Establishing Rules on Support for Strategic Plans to be Drawn up by Member States Under the Common Agricultural Policy (CAP Strategic Plans) and Financed by the European Agricultural Guarantee Fund (EAGF) and by the European Agricultural Fund for Rural Development (EAFRD) and repealing Regulations (EU) No 1305/2013 and (EU) No 1307/2013. Available online: https://eur-lex.europa.eu/legal-content/EN/TXT/?uri=CELEX%3A32021R2115 (accessed on 23 January 2025).
  3. European Commission. Forging a Climate-Resilient Europe—The New EU Strategy on Adaptation to Climate Change. Available online: https://eur-lex.europa.eu/legal-content/EN/TXT/PDF/?uri=CELEX:52021DC0082. (accessed on 23 January 2025).
  4. Pegoraro, V.; Bachmeier, O.; Lorenzon, C.; Conde, B.; Ortiz, J.; Barbosa, A.; Zubillaga, M. Cambios en los atributos del suelo por aplicación continua de efluente porcino. Cienc. Suelo 2023, 41, 218–224. [Google Scholar]
  5. Pagliai, M.; Antisari, V. Influence of waste organic matter on soil micro and macro structure. Bioresour. Technol. 1993, 43, 205–213. [Google Scholar] [CrossRef]
  6. Santos, C.; Loss, A.; Piccolo, M.C.; Girotto, E.; Ludwig, M.P.; Decarli, J.; Rodrigues Torres, J.L.; Brunetto, G. Aggregation index and carbon and nitrogen contents in aggregates of pasture soils under successive applications of pig slurry in Southern Brazil. Agronomy 2022, 12, 320. [Google Scholar] [CrossRef]
  7. Yost, J.L.; Schmidt, A.M.; Koelsch, R.; Schott, L.R. Effect of swine manure on soil health properties: A systematic review. Soil Sci. Soc. Am. J. 2022, 86, 450–486. [Google Scholar] [CrossRef]
  8. Maffia, A.; Marra, F.; Canino, F.; Battaglia, S.; Mallamaci, C.; Oliva, M.; Muscolo, A. Humic substances from waste-based fertilizers for improved soil fertility. Agronomy 2024, 14, 2657. [Google Scholar] [CrossRef]
  9. Oldfield, E.E.; Wood, S.A.; Bradford, M.A. Direct effects of soil organic matter on productivity mirror those observed with organic amendments. Plant Soil 2018, 423, 363–373. [Google Scholar] [CrossRef]
  10. European Commission: Directorate-General for Research and Innovation. EU Mission, Soil Deal for Europe; Publications Office of the European Union: Luxembourg, 2022. [Google Scholar] [CrossRef]
  11. Mrabet, R.; Savé, R.; Toreti, A.; Caiola, N.; Chentouf, M.; Llasat, M.C.; Mohamed, A.A.A.; Santeramo, F.G.; Sanz-Cobena, A.; Tsikliras, A. Food. In Climate and Environmental Change in the Mediterranean Basin—Current Situation and Risks for the Future. First Mediterranean Assessment Report; Cramer, W., Guiot, J., Marini, K., Eds.; Union for the Mediterranean, Plan Bleu, UNEP/MAP: Marseille, France, 2020; pp. 237–264. [Google Scholar] [CrossRef]
  12. Kögel-Knabner, I. The macromolecular organic composition of plant and microbial residues as inputs to soil organic matter. Soil Biol. Biochem. 2002, 34, 139–162. [Google Scholar] [CrossRef]
  13. Senesi, N.; Plaza, C.; Brunetti, G.; Polo, A. A comparative survey of recent results on humic-like fractions in organic amendments and effects on native soil humic substances. Soil Biol. Biochem. 2007, 39, 1244–1262. [Google Scholar] [CrossRef]
  14. Jiménez-de-Santiago, D.E.; Almendros, G.; Bosch-Serra, À.D. Structural changes in humic substances after long-term fertilisation of a calcareous soil with pig slurries. Soil Use Manag. 2023, 39, 1351–1363. [Google Scholar] [CrossRef]
  15. Kuzyakov, Y.; Friedel, J.K.; Stahr, K. Review of mechanisms and quantification of priming effects. Soil Biol. Biochem. 2000, 32, 1485–1498. [Google Scholar] [CrossRef]
  16. Jenkinson, D.S.; Fox, R.H.; Rayner, J.H. Interactions between fertilizer nitrogen and soil nitrogen—The so-called ‘priming’ effect. J. Soil Sci. 1985, 36, 425–444. [Google Scholar] [CrossRef]
  17. Blagodatskaya, E.; Kuzyakov, Y. Mechanisms of real and apparent priming effects and their dependence on soil microbial biomass and community structure: Critical review. Biol. Fertil. Soils 2008, 45, 115–131. [Google Scholar] [CrossRef]
  18. Benedet, L.; Dick, D.P.; Brunetto, G.; dos Santos Júnior, E.; Ferreira, G.W.; Lourenzi, C.R.; Comin, J.J. Copper and Zn distribution in humic substances of soil after 10 years of pig manure application in south of Santa Catarina, Brazil. Environ. Geochem. Health 2020, 42, 3281–3301. [Google Scholar] [CrossRef] [PubMed]
  19. Furtado e Silva, J.A.M.; Do Amaral Sobrinho, N.M.B.; Lima, E.S.A.; García, A.C. Modifications of soil organic matter structure by long-term pig slurry amendment of tropical soil. Arch. Agron. Soil Sci. 2022, 68, 61–75. [Google Scholar] [CrossRef]
  20. Furtado e Silva, J.A.M.; García, A.C.; Lima, E.S.A.; Souza, C.C.B.M.; Amaral Sobrinho, N.M.B. Effect of short-term pig slurry amendment of soil on humified organic matter and its relationship with the dynamics of heavy metals and metals uptake by plants. J. Environ. Sci. Health—Part A 2022, 57, 958–969. [Google Scholar] [CrossRef]
  21. Sacomori, W.; Cassol, P.C.; Mafra, M.S.H.; Erdemann, L.F.; de Almeida, J.A. Accumulation of humic substances in an oxisol fertilized with pig slurry for 15 years. Rev. Bras. Eng. Agric. Ambient. 2021, 25, 109–115. [Google Scholar] [CrossRef]
  22. Dorado, J.; Zancada, M.C.; Almendros, G.; López-Fando, C. Changes in soil properties and humic substances after long-term amendments with manure and crop residues in dryland farming systems. J. Plant Nutr. Soil Sci. 2003, 166, 31–38. [Google Scholar] [CrossRef]
  23. García-Gil, J.C.; Plaza, C.; Senesi, N.; Brunetti, G.; Polo, A. Effects of sewage sludge amendment on humic acids and microbiological properties of a semiarid Mediterranean soil. Biol. Fertil. Soil. 2004, 39, 320–328. [Google Scholar] [CrossRef]
  24. Vishnyakova, O.; Ubugunov, L. Changes in molecular structure of humic substances in Cambisols under agricultural use. Agronomy 2023, 13, 2299. [Google Scholar] [CrossRef]
  25. Ma, L.; Xiao, B. Characteristic of molecular weight-fractions of soil organic matter from calcareous soil and yellow soil. Sustainability 2023, 15, 1537. [Google Scholar] [CrossRef]
  26. Jenkinson, D.S. The Rothamsted long-term experiments: Are they still of use? Agron. J. 1991, 83, 2–10. [Google Scholar] [CrossRef]
  27. Almendros, G.; Hernández, Z.; Sanz, J.; Rodríguez-Sánchez, S.; Jiménez-González, M.A.; González-Pérez, J.A. Graphical statistical approach to soil organic matter resilience using analytical pyrolysis data. J. Chromatogr. A 2018, 1533, 164–173. [Google Scholar] [CrossRef] [PubMed]
  28. Jiménez-González, M.A.; Álvarez, A.M.; Carral, P.; González-Pérez, J.A.; Almendros, G. Climate variability in Mediterranean ecosystems is reflected by soil organic matter pyrolytic fingerprint. Geoderma 2020, 374, 114443. [Google Scholar] [CrossRef]
  29. Dorado, J.; González-Vila, F.J.; Zancada, M.C.; Almendros, G.; López-Fando, C. Pyrolytic descriptors responsive to changes in humic acid characteristics after long-term sustainable management of dryland farming systems in Central Spain. J. Anal. Appl. Pyrolysis 2003, 68–69, 299–314. [Google Scholar] [CrossRef]
  30. Aust, M.O.; Thiele-Bruhn, S.; Eckhardt, K.U.; Leinweber, P. Composition of organic matter in particle size fractionated pig slurry. Bioresour. Technol. 2009, 100, 5736–5743. [Google Scholar] [CrossRef]
  31. Cavallo, O.; de la Rosa, J.M.; González-Pérez, J.A.; Knicker, H.; Pezzolla, D.; Gigliotti, G.; Provenzano, M.R. Molecular characterization of digestates from solid-state anaerobic digestion of pig slurry and straw using analytical pyrolysis. J. Anal. Appl. Pyrolysis 2018, 134, 73–182. [Google Scholar] [CrossRef]
  32. Van Krevelen, D.W. Graphical-statistical method for the study of structure and reaction processes of coal. Fuel 1950, 29, 269–284. [Google Scholar]
  33. Ikeya, K.; Sleighter, R.L.; Hatcher, P.G.; Watanabe, A. Characterization of the chemical composition of soil humic acids using Fourier transform ion cyclotron resonance mass spectrometry. Geochim. Cosmochim. Acta 2015, 153, 169–182. [Google Scholar] [CrossRef]
  34. Jiménez-Morillo, N.T.; de la Rosa, J.M.; Waggoner, D.; Almendros, G.; González-Vila, F.J.; González-Pérez, J.A. Fire effects in the molecular structure of soil organic matter fractions under Quercus suber cover. Catena 2016, 1445, 266–273. [Google Scholar] [CrossRef]
  35. Ohno, T.; Parr, T.B.; Gruselle, M.-C.I.; Fernandez, I.J.; Sleighter, R.L.; Hatcher, P.G. Molecular composition and biodegradability of soil organic matter: A case study comparing two New England forest types. Environ. Sci. Technol. 2014, 48, 7229–7236. [Google Scholar] [CrossRef]
  36. QGIS.org. QGIS Geographic Information System. Open Source Geospatial Foundation Project. Available online: http://qgis.org. (accessed on 14 March 2025).
  37. Soil Survey Staff. Keys to Soil Taxonomy, 12th ed.; USDA-Natural Resources Conservation Service: Washington, DC, USA, 2014. [Google Scholar]
  38. Alemañ, C.J.D. Decreto 153/2019, de 3 de julio, de gestión de la fertilización del suelo y de las deyecciones ganaderas y de aprobación del programa de actuación en las zonas vulnerables en relación con la contaminación por nitratos procedentes de fuentes agrarias. Actual. Jurídica Ambient. 2019, 62–64. [Google Scholar]
  39. APHA. Standard Methods. Nitrogen (ammonia): 4500-NH3B, preliminary distillation step and 4500-NH3C, titrimetric method. In Standard Methods for the Examination of Water and Wastewater, 2nd ed.; Rice, E.W., Bridgewater, L., Eds.; APHA, AWWA and WEF: Washington, DC, USA, 2012; pp. 110–111. [Google Scholar]
  40. Walkley, A.; Black, I.A. An examination of the Degtjareff method for determining soil organic matter and a proposed modification of the chromic acid titration method. Soil Sci. 1934, 37, 29–38. [Google Scholar] [CrossRef]
  41. Yeomans, J.C.; Bremner, J.M. A rapid and precise method for routine determination of organic carbon in soil. Commun. Soil Sci. Plant Anal. 1988, 19, 1467–1476. [Google Scholar] [CrossRef]
  42. Dabin, B. Étude d’une méthode de fractionnement des matières humiques du sol. Sci. Sol. 1971, 18, 47–63. [Google Scholar]
  43. Statgraphics® Centurion XIX. Available online: https://www.statgraphics.com/ (accessed on 1 March 2025).
  44. Antezana, W.; De Blas, C.; García-Rebollar, P.; Rodríguez, C.; Beccaccia, A.; Ferrer, P.; Cerisuelo, A.; Moset, V.; Estellés, F.; Cambra-López, M.; et al. Composition, potential emissions and agricultural value of pig slurry from Spanish commercial farms. Nutr. Cycl. Agroecosyst. 2016, 104, 159–173. [Google Scholar] [CrossRef]
  45. Ibrahim, H.; Gaieb, S.; Brahim, N.; Blavet, D.; Van den Meersche, K.; Pansu, M. Modelling the organic evolution of a Mediterranean limestone soil under usual cropping of durum wheat and faba bean. Agronomy 2021, 11, 1688. [Google Scholar] [CrossRef]
  46. González-Vila, F.J.; Almendros, G.; Madrid, F. Molecular alterations of organic fractions from urban waste in the course of composting and their further transformation in amended soil. Sci. Total Environ. 1999, 236, 215–299. [Google Scholar] [CrossRef]
  47. Koishi, A.; Bragazza, L.; Maltas, A.; Guillaume, T.; Sokrat, S. Long-term effects of organic amendments on soil organic matter quantity and quality in conventional cropping systems in Switzerland. Agronomy 2020, 10, 1977. [Google Scholar] [CrossRef]
  48. Schimel, J.P.; Weintraub, M.N. The implications of exoenzyme activity on microbial carbon and nitrogen limitation in soil: A theoretical model. Soil Biol. Biochem. 2003, 35, 549–563. [Google Scholar] [CrossRef]
  49. Farina, R.; Coleman, K.; Whitmore, A.P. Modification of the RothC model for simulations of soil organic C dynamics in dryland regions. Geoderma 2013, 200–201, 18–30. [Google Scholar] [CrossRef]
  50. Valdez-Ibañez, A.S.; Bosch-Serra, À.D.; Yagüe-Carrasco, M.R. Fertilization with pig slurry: Impacts on earthworms in rainfed agriculture. Investig. Agrar. 2019, 21, 1–10. [Google Scholar] [CrossRef]
  51. Dall’Orsoletta, D.J.; Gatiboni, L.C.; Mumbach, G.L.; Schmitt, D.E.; Boitt, G.; Smyth, T.J. Soil slope and texture as factors of phosphorus exportation from pasture areas receiving pig slurry. Sci. Total Environ. 2021, 761, 144004. [Google Scholar] [CrossRef] [PubMed]
  52. Chenu, C.; Angers, D.A.; Barré, P.; Derrien, D.; Arrouays, D.; Balesdent, J. Increasing organic stocks in agricultural soils: Knowledge gaps and potential innovations. Soil Tillage Res. 2019, 188, 41–52. [Google Scholar] [CrossRef]
Figure 1. Location map of the experimental site in Oliola (Lleida, Catalonia, Spain) generated from QGIS v3.28 software [36]. Experimental plot area is highlighted with an arrow in the image on the right.
Agronomy 15 00725 g001
Figure 2. Chromatographic traces of pyrolysis products from a total sample of pig slurry or pig liquid manure (PS-LM) and of humic acids extracted from soils treated annually for 12 years with mineral fertiliser (PS-00) or with pig slurry at different organic matter (OM) rates: PS-10 (960 kg OM ha−1), PS-16 (1610 kg OM ha−1), and PS-48 (4800 kg OM ha−1). The main compounds are indicated by the peaks according to the retention times. Alkane/alkene doublets are indicated by their C number (C#). FA = fatty acid; FAME = FA methyl ester. Methoxyphenols are labelled as follows: guaiacol (G), methylguaiacol (MG), ethylguaiacol (EG), vinylguaiacol (VG), propenylguaiacol (PG), eugenol (AG), syringol (S), methylsyringol (MS), isoeugenol (IEG), ethylsyringol (ES), vinylsyringol (VS), propenylsyringol (PS) and acetylsyringol (AS). (*) Normalised pyrograms at the level (height) of guaiacol (G).
Agronomy 15 00725 g002
Figure 3. Surface density plots of pyrolysis products from humic acids extracted from soils where progressive rates of organic matter from pig slurry (0, 960, 1610, and 4800 kg ha−1) were applied (PS-00, PS-10, PS-16, and PS-48, respectively). The 2D contour diagrams show the different groups of pyrolysis compounds represented in the space defined by their H/C and O/C atomic ratios in the form of van Krevelen diagrams. The vertical dimension (z axis) represents the normalised abundances (sum = 100) of the quantitative data of individual compounds. Sizes of 3D peaks or compound clusters are proportional to the collective abundances of the compounds with similar elemental composition.
Agronomy 15 00725 g003
Table 1. Annual means 1 of organic matter, total N, organic N, and ammonium N (NH4+-N) applied with the different pig slurry (PS) treatments (±standard deviation) over a period of 12 cropping seasons 1. Means (±standard deviation) of grain yield biomass (GYB) and straw yield biomass (SYB) for the same period are included.
SamplePS
(Mg ha−1)
Organic matter
(kg ha−1)
Total-N
(kg ha−1)
Organic-N
(kg ha−1)
NH4+-N
(kg ha−1)
GYB
(Mg ha−1)
SYB
(Mg ha−1)
PS-0000 (±0)120 (±0)0 (±0)60 (±0)3.75 (±1.50)5.52 (±2.42)
PS-1020959 (±355)124 (±33)43 (±22)81 (±19)3.69 (±0.89) 4.64 (±2.30)
PS-16301611 (±530)185 (±40)60 (±13)126 (±34)3.95 (±1.27)6.07 (±3.31)
PS-48904802 (±1249)586 (±116)192 (±61)393 (±76)4.06 (±1.64)7.92 (±3.46)
1 Fertilization was applied with slurry from fattening pigs, except for the PS-00 treatment, where mineral fertiliser was applied.
Table 2. Accumulated values (as total abundances) of the main families of pyrolysis compounds from pig slurry (PS) and from humic acids of soils treated with annual progressive doses of organic matter (OM) from PS. The main ratios between the families of compounds are also shown.
Compound Families and Main RatiosPSTreatments (kg OM ha−1)
096016104800
Total alkanes and alkenes3.887.046.977.648.62
Total steroids3.010.0015.244.241.84
Fatty acids47.3713.3512.8416.2210.38
Fatty acid methyl esters3.281.161.270.710.82
Guaiacyl lignin phenols (LG)13.3427.5022.6229.0528.45
p-hydroxybenzyl lignin phenols (LH)1.222.331.662.352.71
Syringyl lignin phenols (LS)6.8113.4611.1716.5015.29
Non-methoxylated aromatics (ARO)7.4610.309.446.959.69
Nitrogen compounds5.5416.0012.5912.3814.98
Polysaccharide-derived8.098.585.943.707.10
LG/LS1.962.042.031.761.86
(LG + LS + LH)/ARO2.864.203.756.894.79
Total aliphatic (ALI)65.6230.1342.2532.5128.76
Total aromatic28.8353.6044.8954.8556.14
Aromatic/aliphatic0.441.781.061.691.95
Disclaimer/Publisher’s Note: The statements, opinions and data contained in all publications are solely those of the individual author(s) and contributor(s) and not of MDPI and/or the editor(s). MDPI and/or the editor(s) disclaim responsibility for any injury to people or property resulting from any ideas, methods, instructions or products referred to in the content.

