Article

Citrus Greening Disease Infection Reduces the Energy Flow Through Soil Nematode Food Webs

1
Key Laboratory of Agro-Ecological Processes in Subtropical Region, Institute of Subtropical Agriculture, Chinese Academy of Sciences, Changsha 410125, China
2
National Engineering Laboratory for Applied Technology in Forestry & Ecology in South China, College of Life and Environmental Science, Central South University of Forestry and Technology, Changsha 410004, China
3
Huanjiang Agriculture Ecosystem Observation and Research Station of Guangxi, Guangxi Key Laboratory of Karst Ecological Processes and Services, Huanjiang Observation and Research Station for Karst Ecosystems, Chinese Academy of Sciences, Huanjiang 547100, China
*
Author to whom correspondence should be addressed.
Agronomy 2025, 15(3), 635; https://doi.org/10.3390/agronomy15030635
Submission received: 1 February 2025 / Revised: 28 February 2025 / Accepted: 1 March 2025 / Published: 2 March 2025
(This article belongs to the Section Pest and Disease Management)

Abstract

:
Citrus greening disease (CGD), also known as Huanglongbing in China, is caused by the endophytic bacterium ‘Candidatus Liberibacter asiaticus’ and poses a severe threat to the global citrus industry. The disease affects microbial communities in leaves, stems, roots, and soil. Soil nematodes, which occupy multiple trophic levels, play crucial roles in nutrient cycling, pest regulation, and plant-soil interactions. However, the impact of CGD on soil nematode community structure and energy flow remains unclear. This study examined the effects of different levels of CGD infection on soil nematode communities and energy dynamics. Three infection levels were selected: control (healthy plants with no yellowing symptoms), mild infection (≤50% leaf yellowing), and severe infection (entire canopy affected). The results showed that increasing CGD severity significantly reduced the nematode abundance, community structure index, and total energy flux by 94.2%, 86.7%, and 93.5%, respectively, in the severely infected group. Both mild and severe infections resulted in a higher proportion of bacterivorous nematodes compared to the control. Moreover, herbivorous energy flux was significantly reduced by 99.2% in the severe infection group, suggesting that herbivorous endophytic nematodes are particularly sensitive to CGD. The total energy flux through nematode food web, the energy flux through fungal or herbivorous channels, and the energy flow uniformity were positively correlated with the nematode structure index but negatively correlated with the nematode richness and evenness indices. Furthermore, the reduction in soil resource input (especially total nitrogen and total carbon) caused by CGD was the primary driver of the changes in nematode communities and energy flows. These findings highlight the destructive effects of CGD on soil ecosystems through bottom-up control. The CGD-induced obstruction of photosynthate transport primarily impacts phytophagous organisms and could also influence other trophic levels. To mitigate these effects and ensure healthy citrus production, future research should focus on early detection and effective CGD management strategies.

1. Introduction

Citrus greening disease (CGD), also known as Huanglongbing or yellow shoot disease, is a devastating bacterial infection that threatens citrus production worldwide. It has reduced the global annual citrus yields by up to 30% and caused financial damages exceeding USD10 billion [1,2,3]. The disease is primarily caused by ‘Candidatus Liberibacter asiaticus’ (CLas) and is transmitted through psyllid vectors and grafting [4]. After invading the citrus plant, the CLas colonizes in the phloem anddisrupts photosynthate transport, which ultimately causing fruit yield decline and death [5]. Currently, there is no cure for CGD, and chemical treatments only provide temporary symptom relief. Infected trees often need to be removed to prevent disease spread [6].
Beyond affecting the plants, CGD could also affect soil microbial communities. For an example, a previous study reported that bacterial and fungal diversity in the rhizosphere of CGD-infected trees is higher than those in healthy plant [7]. However, little is known about how CGD influences higher trophic-level organisms, such as soil nematodes, which play essential roles in soil food web dynamics. Soil nematodes are a diverse and abundant group of organisms found in various ecosystems [8]. They contribute to nutrient cycling, regulate microbial populations, and serve as indicators of soil health [9,10,11]. Due to their rapid reproductive cycles and sensitivity to environmental changes, nematodes are frequently used to assess ecosystem responses to disturbances [12,13,14,15,16]. Their feeding habits and trophic interactions make them particularly useful for analyzing soil food web structure and energy flow patterns [17]. Despite their ecological significance, soil nematode food webs have rarely been studied in the context of plant disease management.
One effective approach for analyzing ecosystem changes is the energy food web framework, which quantifies energy flow across different trophic levels [17,18,19]. Nematodes are ideal for this analysis due to their broad ecological niche, diverse feeding strategies, and pivotal role in soil food webs [20]. Integrating energy flow models with traditional nematode community indices could offer valuable insights into the ecological consequences of plant diseases [21]. However, the specific effects of CGD on nematode food web structures and energy dynamics remain largely unexplored.
This study investigates how different levels of CGD infection affect soil nematode community composition and energy fluxes in citrus orchards. Three levels of CGD infection were designated: (1) Control—healthy trees with no visible leaf yellowing symptoms, (2) mild infection—trees with ≤50% leaf yellowing, and (3) severe infection—trees with full-canopy leaf yellowing. Soil nematode communities beneath these trees were analyzed. We hypothesized that (1) CGD disrupts photosynthate transport, leading to a decrease in total energy flow and herbivorous energy flux within nematode communities, and (2) root decay from CGD infection increases fungal biomass, leading to higher energy flux through fungivorous nematode channels. By testing these hypotheses, this study aims to deepen our understanding of the impact of plant diseases on belowground food webs and inform future disease management strategies for citrus orchards.

2. Materials and Methods

2.1. Study Sites and Experimental Design

This study was conducted in Linchuan County, Guilin City, Guangxi Zhuang Autonomous Region, China (110°33′ E, 25°42′ N). The region has a subtropical monsoon climate with distinct seasons, hot summers, and mild winters. The average annual temperature is 18.9 °C, precipitation is 1887.6 mm, and relative humidity is 76%. According to the Köppen climate classification, this area falls under the Cwa category, which is typical for humid subtropical regions conducive to citrus growth but also favorable for the spread of CGD.
The study was conducted in an 8-year-old commercial citrus orchard (“Shuangyan Sister”) covering 40.47 hectares in Xuejia Village, Tanxia Town, Lingchuan County. The predominant soil types were yellow soil and yellow-brown soil, which correspond to Ultisols and Oxisols in the USDA Soil Taxonomy. The dominant citrus variety was Citrus sinensis (L.) Osbeck. All the fruit trees were planted at the same time, with each tree spaced 4 meters apart. All trees were under the same management measures. Particularly, weeds were controlled with a weeding machine every two to three months. Every tree was flood-irrigated three times per year. Every year, 30 kg of farmyard manure was applied to each tree. The composition of the manure was analyzed and found to contain approximately 0.5% nitrogen (N), 0.3% phosphorus (P) as P2O5, and 0.4% potassium (K) as K2O. This type of manure is commonly used in the region due to its balanced nutrient content and ability to improve soil fertility over time. Only a small amount of insecticide is used each year to minimize the spread of the CGD insect vector (i.e., Asian citrus woodlouse). During the experiment, no other fertilizers, pesticides, or herbicides were used.
The experiment was arranged in a randomized block design. The orchard was divided into four separate experimental blocks, each representing an independent replicate of the experiment. Three levels of CGD infection trees were chosen, namely control (health plant with no leaf yellowing symptom), mild infection (≤50% leaf yellowing symptom), and severe infection (entire canopy leaf yellowing symptom). For each infection level, four trees were randomly selected from each block, resulting in a total of 12 trees per block (4 trees × 3 infection levels). This design ensured that each infection level had 16 trees across all four blocks (4 trees/block × 4 blocks). Therefore, a total of 48 trees were chosen for this study. The extent of leaf yellowing was initially assessed by visual examination, followed by qRT-PCR analysis in the laboratory to determine differing extents of CGD infection. Within a 2 m radius of each tree, 4 locations were randomly selected to collect soil cores at a depth of 0–10 cm (with a diameter of 2.5 cm). The soil cores collected from 12 locations under the four trees of the same CGD infection level in each block were then merged to form a composite sample. Each soil sample was divided into two subsamples. One subsample was stored at 4 °C for nematode extraction and the determination of soil water content (SWC) and soil NH4+-N and NO3-N concentrations, while another subsample was air-dried to determine the soil pH, total nitrogen (TN), total carbon (TC), total phosphorus (TP), available potassium (AK), available phosphorus (AP), soil exchangeable calcium (Ca), and magnesium (Mg).
Soil water content (SWC) was determined by the gravimetric method, involving oven-drying samples at 105 °C for 48 h. Soil pH was measured using a PHS-3C pH meter (INESA instruments Inc., Shanghai, China) after incubating a 1:2.5 soil-to-water suspension (w/v) for 30 min. Soil TC and TN concentrations were measured with an elemental analyzer (Vario EL Cube, Elementar Japan Ltd., Yokohama, Japan). Soil available phosphorus (AP) was measured using the ammonium fluoride hydrochloride-molybdenum antimony colorimetric method [22]. Soil total phosphorus (TP) content was determined using the alkali fusion method combined with molybdenum-antimony spectrophotometry [23]. Ammonium nitrogen (NH4+-N) and nitrate nitrogen (NO3-N) were extracted using 0.5 mol L−1 K2SO4 at a ratio of 1:4 (w/v). Their concentrations were determined with a continuous-flow injection analyzer (FIAstar 5000, Foss Corporation, Hillerod, Denmark). Available potassium (AK) was determined using the flame photometry method after soil samples were digested in HClO4–H2SO4 (1:10, v/v) and extracted in NH4OAc (1.0 mol L−1). Soil exchangeable calcium (Ca) and magnesium (Mg) were extracted with 1 M ammonium acetate of pH 7.0 and then determined by ICP-OES (Agilent, Santa Clara, CA, USA). Soil physico-chemical properties are presented in Table S1.

2.2. Nematode Extraction and Identification

Soil nematodes were extracted from 100 g of fresh soil using a modified Baermann funnel technique. The extracted nematodes were subsequently preserved in a 4% formalin solution [24,25]. The total number of nematodes was counted with an inverted microscope (Eclipse Ts100, Nikon, sourced from Tokyo, Japan). The first 200 individuals encountered were identified to genus using a differential interference contrast (DIC) microscope (ECLIPSE 80i, Nikon). When there were fewer than 200 soil nematodes, each individual was identified. The identified nematode genera were allocated to five trophic groups according to Yeates et al. (1993) and were allocated to c-p groups according to Bongers and Bongers (1998) [26]. The five trophic groups include bacterivore (Ba), fungivore (Fu), herbivore (He), omnivore (Om), and predator (Pr).

2.3. Data Analysis

The nematode data served as the basis for calculating the following indices: nematode channel ratio (NCR), microbivore–herbivore ratio (MHR), maturity index (MI), structure index (SI), Shannon–Wiener index (H’), Simpson index (λ), richness index (SR), and Pielou’s evenness (J).
NCR = Ba/(Ba + Fu)
MHR = (Ba + Fu)/He
In this context, “Ba”, “Fu”, and “He” denote the abundance of bacterivores, fungivores, and herbivores, respectively. Meanwhile, the nematode channel ratio reflects the shift in the significance of energy channels driven by bacteria or fungi, as referenced in previous studies [27,28]. The magnitude of the microbivore–herbivore ratio can help in assessing how nematode communities influence plant productivity [29,30].
MI = i = 1 n v ( i ) × f ( i ) .
SI = 100 × (s/(s + b))
Here, v(i) represents the c-p value of the ith taxonomic unit, while f(i) indicates its proportion within free-living nematodes. The value “b” is calculated as the sum of Ba2 and Fu2, and “s” denotes the structural component, encompassing Ba3–Ba5, Fu3–Fu5, Om3–Om5, and Pr2–Pr5. A higher MI or SI value indicates a stable and complex food web [31,32].
H = i = 1 s P i × l n P i
λ = P i 2
J = H’/InS
SR = S − 1/InN
Pi represents the proportion of individuals within the ith taxonomic unit, while S refers to the total number of nematode genera. N denotes the overall number of nematodes in the community. The Shannon–Wiener index and the Simpson index are both employed to evaluate the diversity of the soil nematode community. The Shannon–Wiener index places greater emphasis on less common taxa, while the Simpson index prioritizes the more abundant ones [33,34].
The nematode energy flow through nematode communities were assessed by the metabolic rate (M) of the nematodes. The metabolic rates of nematodes were calculated by adding the daily carbon consumption for both growth and respiration.
M = N i × 0.1 W i 12 c p i + 0.0159 W i 0.75
The total metabolic rate (M), the number of individuals (Ni), and body weight (Wi) are denoted as M, Ni, and Wi, respectively [35].
F = (M + L)/ea
When calculating energy fluxes for each trophic group in the food web, the parameters F, M, L, and ea correspond to the total energy flux of the trophic group, the individual metabolic rate, predation-induced energy loss, and assimilation efficiency, respectively. The assimilation efficiencies are specified as 0.6 for bacterivorous nematodes, 0.38 for fungivorous nematodes, 0.25 for herbivorous nematodes, and 0.5 for omnivorous-predatory nematodes. For omnivorous-predatory nematodes in the food web, energy flux calculations assume no energy loss [36]. Furthermore, it is presumed that these omnivorous-predatory nematodes exhibit uniform feeding preferences, with their feeding behaviors on other trophic groups being influenced by the abundance of the community [20]. Energy flow types of nematodes are presented in Table S2.

2.4. Statistical Analyses

One-way ANOVA was used to assess the variations in soil physico-chemical properties, nematode abundance, relative abundance, diversity, community indices, and energy fluxes across different treatments. Principal Coordinates Analysis (PCoA) was conducted to examine differences in nematode genus compositions among treatments. Redundancy analysis (RDA) was used to evaluate the relationship between the soil nematode ecological indices, total energy flux and soil physico-chemical properties. Random forest model was used to estimate the relative contribution of nematode genera to the total carbon flux using the randomForest function in the randomForest package. The ANOVA was conducted using SPSS 23.0 software (SPSS Inc., Chicago, IL, USA). When necessary, data were transformed using the natural logarithm to enhance normality and variance homogeneity. Differences between stand types were assessed with LSD, while Tamhane’s T2 was applied when variances differed in the transformed data. Statistical significance was set at p < 0.05. Column charts were created using GraphPad Prism 7. Principal Coordinates Analysis (PCoA) and Redundancy Analysis (RDA) were performed with Canoco 5. The energetic structure of nematode food webs was depicted using a 5-node model [37] and visualized with Adobe Illustrator 2020 (Adobe Systems Inc., San Jose, CA, USA).

3. Results

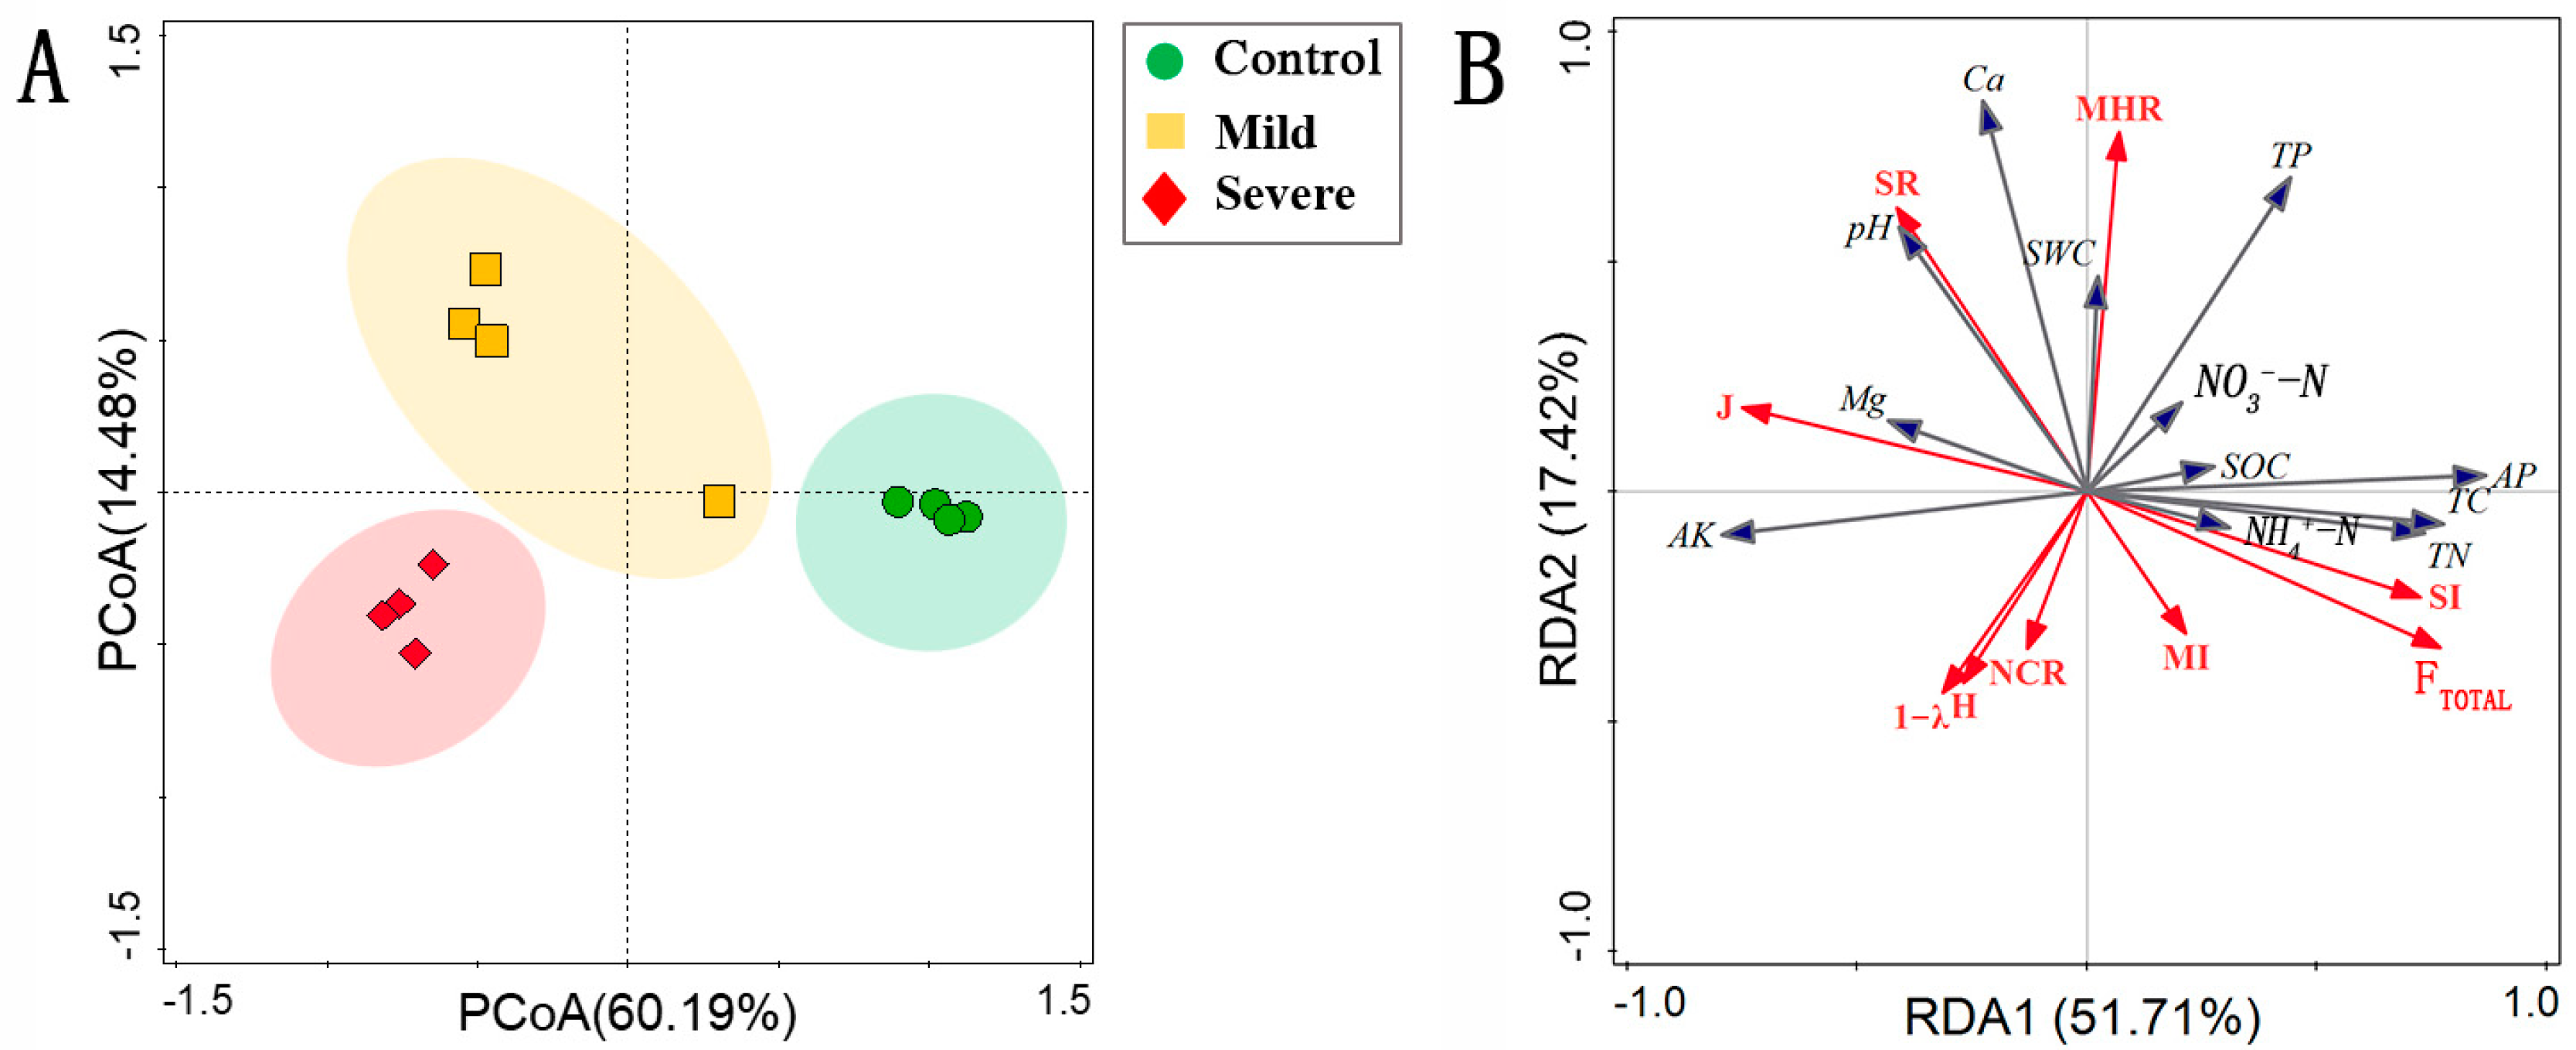
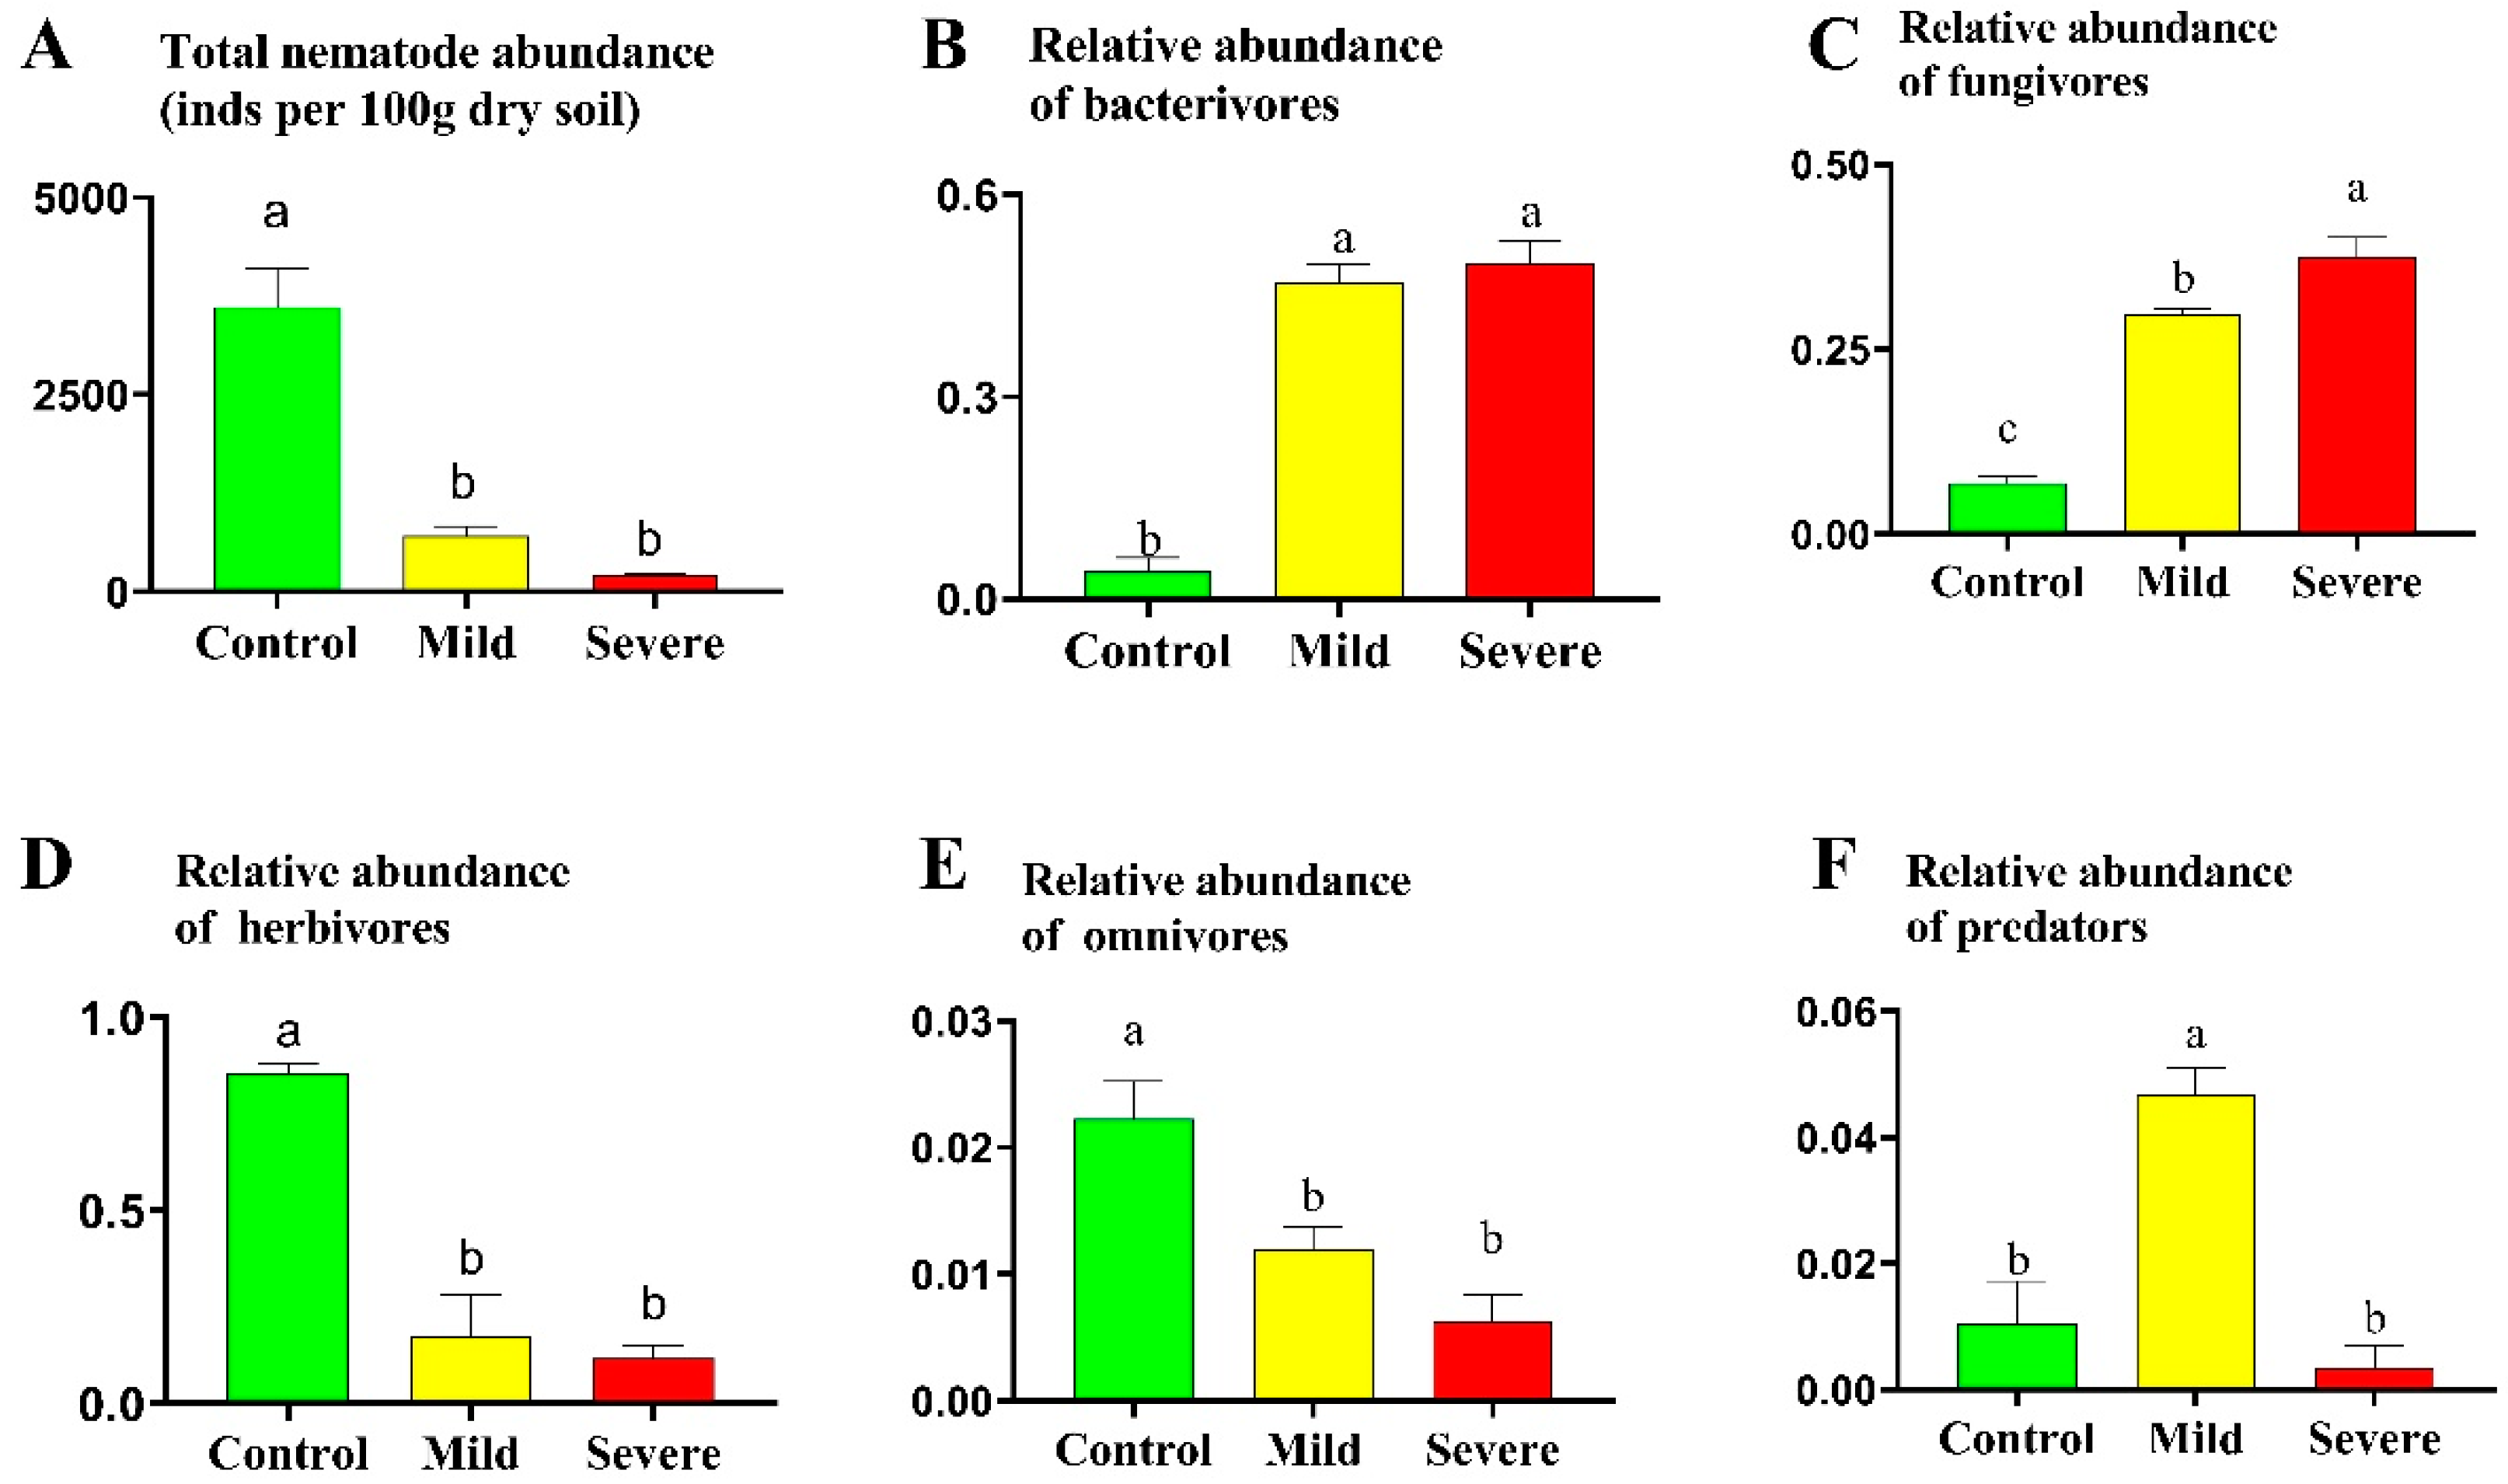
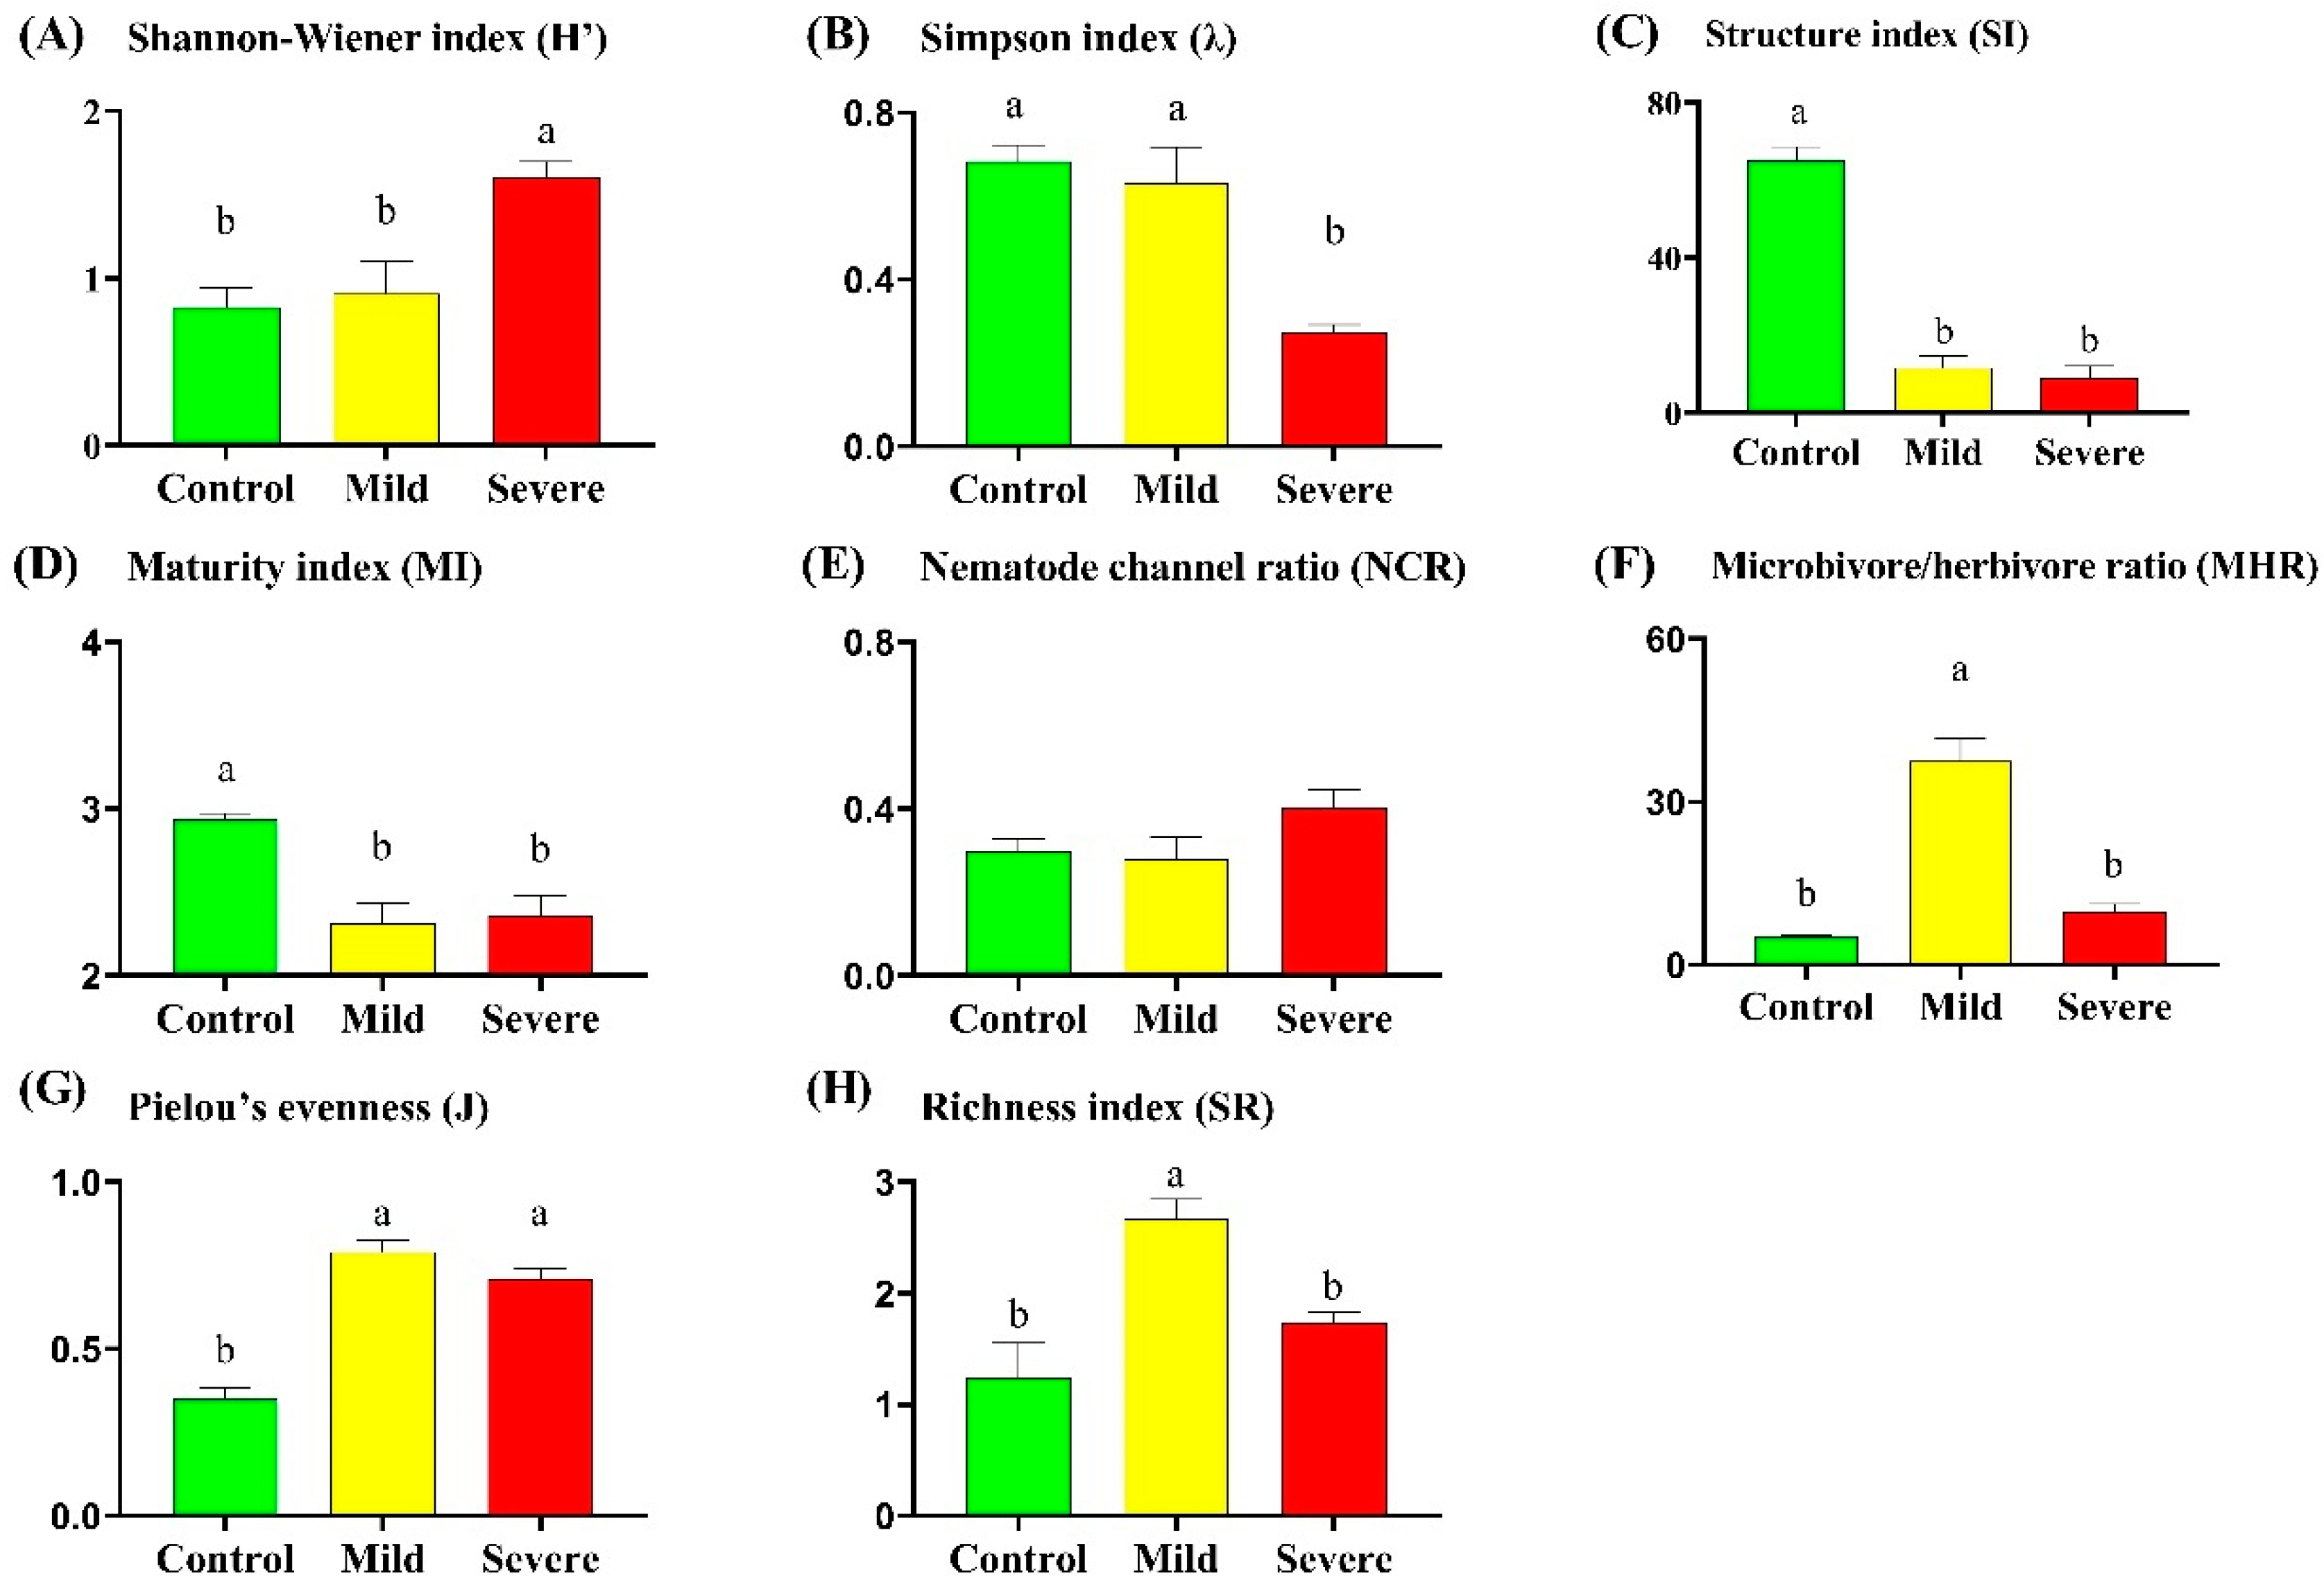
3.1. Soil Nematode Communities

In this study, a total of 30 nematode genera were collected. The dominant genera included Acrobeloides, Filenchus, and Meloidogyne. PCoA analyses revealed that the compositions of soil nematode communities were different among treatments (Figure 1A). The total abundance of nematodes in soils under mildly and severely CGD-infected groups was lower than that under control groups (p < 0.05) (Figure 2A). The relative abundances of herbivorous nematodes and omnivorous nematodes in the control group were higher than those in mildly and severely CGD-infected groups (Figure 2D,E). The relative abundances of bacterivorous nematodes and fungivorous nematodes in the severely CGD-infected group were higher than those in the control and mildly CGD-infected groups (p < 0.05) (Figure 2B,C). The relative abundance of predatory nematodes in mildly CGD-infected groups was greater than those in the control and severely CGD-infected groups (p < 0.05) (Figure 2F).
The H’ and 1/λ in the control groups were lower than those in the severely CGD-infected groups (p < 0.05) (Figure 3A,B). The structure index and maturity index of control groups were greater than those of CGD-infected groups (p < 0.05) (Figure 3C,D). The microbivore–herbivore ratio and richness index in the mildly CGD-infected groups were greater than in the control and severely CGD-infected groups (p < 0.05) (Figure 3F,H). The Pielou’s evenness of the control group was lower than that of CGD-infected groups (p < 0.05) (Figure 3G). Maturity index and structure index were positively correlated with TN, TP, TC, and AP (p < 0.05) (Figure 1B).

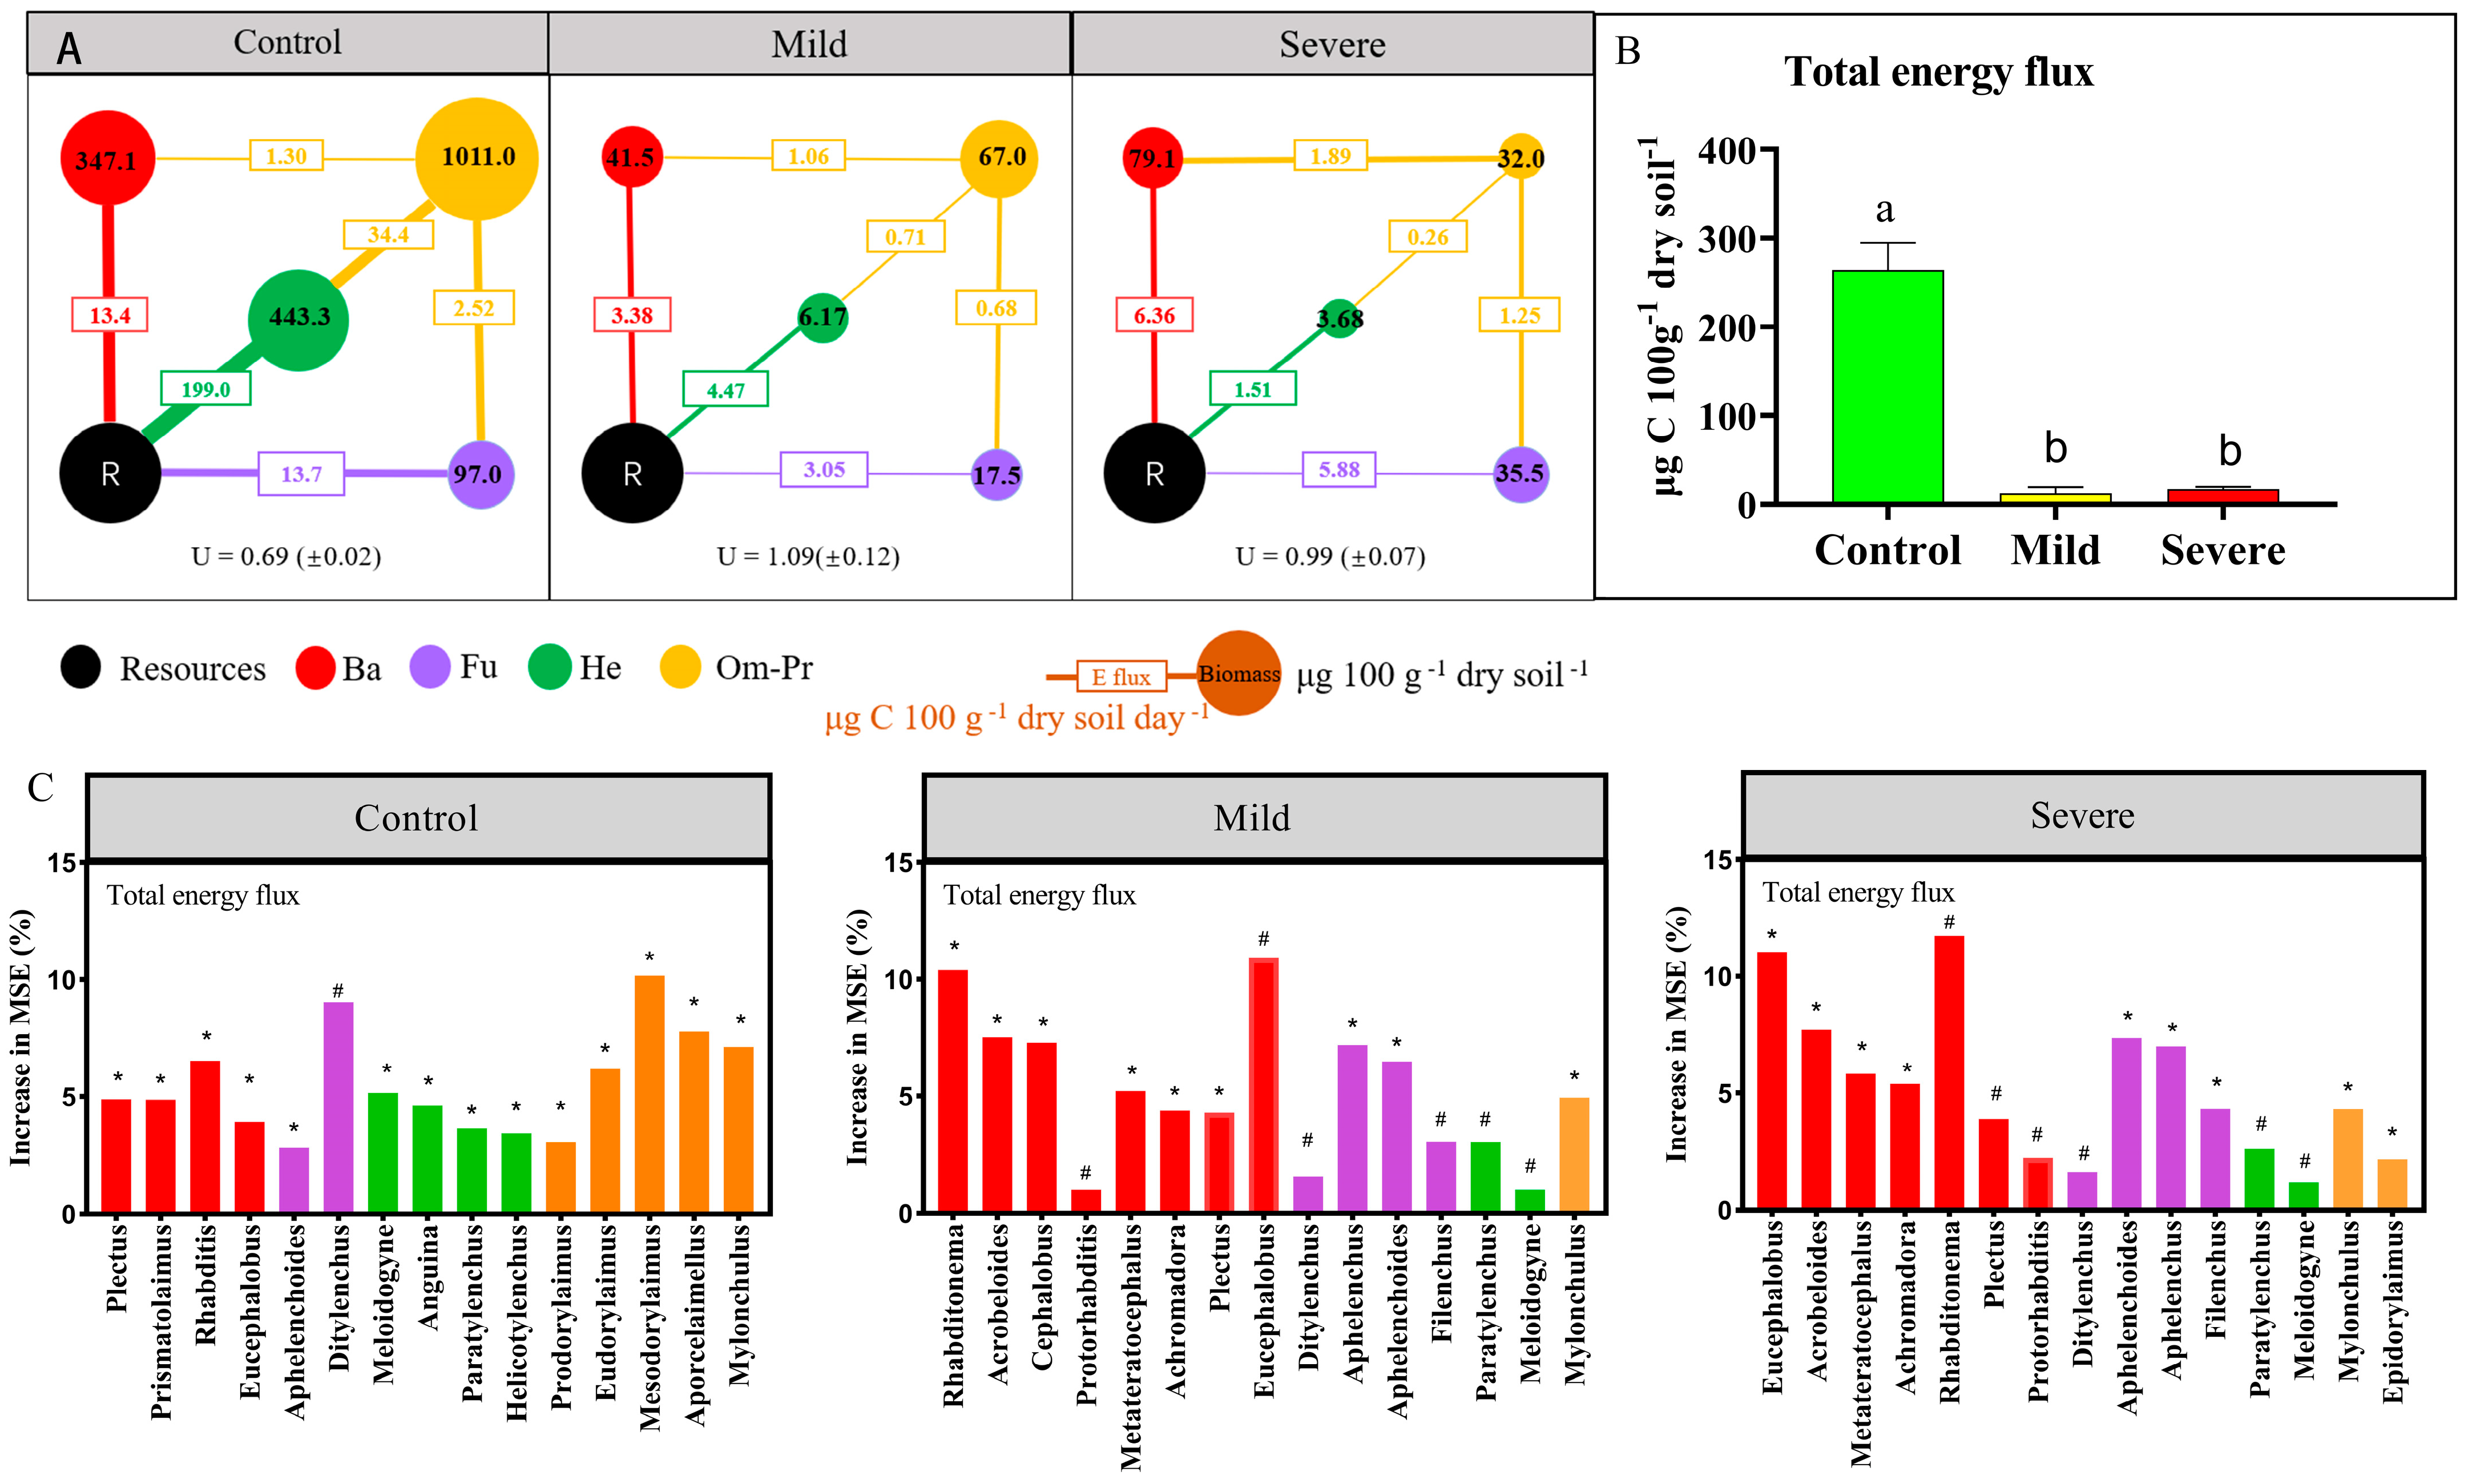
3.2. Energy Fluxed of Nematode Food Webs

The total energy flux of nematode food webs was significantly reduced by CGD infections (i.e. the mild and severe infections) (p < 0.05) (Figure 4B). The energy flux from bacterivore to omnivore-predator in the severely CGD-infected groups was greater than that in the control groups (p < 0.05) (Figure 4A). The energy flux associated with fungivores (i.e., the energy flux from resources to fungivores and from fungivores to omnivore-predators) was greater in the control group compared to the two CGD-infected groups. The energy flux associated with herbivores (i.e., the energy flux from resources to herbivores and from herbivores to omnivore-predators) was lower in the CGD-infected groups than the control group. Random forest analysis showed that bacterivores and fungivores played a key role in driving carbon flux through the whole nematode food web in CGD-infected groups, whereas herbivores and omnivore-predators promoted carbon flux through the whole nematode food web in the control group (Figure 4B). TN and TC were positively correlated with the total carbon flux through the nematode food web, carbon flux through bacterial or fungal channels, and energy flow uniformity (p < 0.05) (Table 1). The total energy flux through the nematode food web, the energy fluxes through the fungal or herbivorous channel, and the energy flow uniformity were positively correlated with the nematode structure index (p < 0.05) (Table 1). The richness index and Pielou’s evenness were negatively correlated with the total energy flux through the nematode food web, the energy fluxes through the fungal or herbivorous channel, and the energy flow uniformity (Table 1).

4. Discussion

In this study, CGD infections reduced the total energy flow of soil food webs, particularly through the herbivorous energy channel. The results are consistent with hypothesis I. Herbivorous nematodes feed on plant roots and directly interacting with plants [38]. Plant diseases disrupt plant root growth and cause root rot [27], which could reduce the access of herbivorous nematodes to resources. Therefore, this is the main cause of the CGD-induced dramatic reduction in energy flow from resources to herbivorous nematodes in this study. CGD blocks the downward transport of photosynthetic products, thereby leading to a reduction in soil food sources and exerting a bottom-up effect on nematode communities [39]. This is consistent with our results that CGD decreased the resource availability for soil food webs, as evidenced by the decline in the soil total carbon concentration. Another likely reason for the declines in energy fluxes of soil food webs is that CGD changed the soil environmental conditions or soil habitat for soil biota. It has been well documented that soil properties such as soil moisture, soil pH, and soil nutrient contents are important factors influencing nematode communities [15,40]. Our redundancy analysis (RDA) revealed positive correlations between nematode community structure index and soil total nitrogen or soil available phosphorus. Weather conditions, such as the average annual temperature and precipitation, also indirectly affect soil moisture, nutrient availability, and microbial activity, which in turn influence the dynamics of soil food webs. In our study area (a subtropical monsoon climate zone), the temperature range and environmental conditions are optimal for the growth of the CGD pathogen (Candidatus Liberibacter asiaticus) and the Asian citrus psyllid (Diaphorina citri Kuwayama) [41,42]. These climatic factors may cause fluctuations in resource availability, exacerbate the impact of CGD, and further reduce energy flow through the nematode food web.
The energy flow through the fungivorous energy channel was decreased during the course of CGD infection. This finding is inconsistent with our hypothesis II. Although citrus leaves are the initial site of infection, Candidatus Liberibacter asiaticus are known to migrate to and colonize the root system, ultimately causing root rot [43]. Theoretically, root rot can increase the richness of fungal biomass in the rhizosphere soil, thereby increasing the abundance of fungivorous nematodes [44,45]. However, several studies reported that CGD decreased certain genera of fungi (e.g., Exophiala) and total fungal biomass [8,46]. Those reports may indicate that the decrease in fungal biomass caused by CGD may exceed the increase in saprophytic fungal biomass caused by root decay. CGD infection has detrimental effects on the soil fungal energy channel, which may be attributable to bottom-up control as well.
In this study, a great abundance of Meloidogyne (an herbivorous endophytic nematode) in the soils of healthy citrus plants was recorded. Even at low infection levels, CGD infection significantly decreased the abundance of plant-parasitic nematodes (especially Meloidogyne). The CGD induced decline in Meloidogyne could be attributed not only to the resources reduction (i.e. bottom-up control) but also to the plant’s immune response [47]. Pathogenic infestation of citrus plants stimulates systemic and chronic immune responses in the bast of citrus trees, including callus deposition, production of reactive oxygen species (e.g., H2O2), and induced expression of immune-related genes [48]. The immune response may lead to a decline in endosymbiotic nematode populations, as they may not be able to survive in this strong immune environment [49,50]. Reduced resource inputs coupled with plant immune responses suggest that CGD may have primarily impacted herbivorous endophytic nematodes before free-living nematodes. The decrease in the dominant species of herbivorous nematodes indicates a more homogeneous proportion of nematode genera, which is the main reason for the increase in Pielou’s evenness (J) and the microbivore–herbivore ratio (MHR) of soil nematode communities. In addition, CGD reduced total energy flux and nematode food web structure. The energy flux in the soil nematode food web was found to be positively associated with its structural composition. Mature and complex soil communities support higher soil food web carbon fluxes, and our research findings are consistent with previous studies [51,52]. In theory, a more intricate food web leads to a greater number of individual pathways [51]. As a result, a more complex food web holds more energy and facilitates a higher flow of energy.

5. Conclusions

In summary, soil nematode abundances, community structure, and energy fluxes declined progressively with increasing levels of CGD infection. These trends underscore how soil organisms respond to deteriorating plant health, particularly through disruptions in energy transfer. Notably, energy flux through herbivore channels was markedly reduced by CGD infection, highlighting its cascading effects on soil food webs. Our findings demonstrate that CGD disrupts soil communities via bottom-up control mechanisms, wherein impaired downward translocation of photosynthetic products most severely impacts phytophagous organisms. This constraint propagates through the trophic network, ultimately altering the structure and function of other feeding groups. These findings offer critical insights into the interactions between soil biota and vegetation under plant disease stress, emphasizing the vulnerability of belowground ecosystems to pathogen-induced shifts in plant resource allocation.

Supplementary Materials

The following supporting information can be downloaded at: https://www.mdpi.com/article/10.3390/agronomy15030635/s1, Table S1: Soil physico-chemical properties; Table S2 Energy flow types of nematodes.

Author Contributions

Methodology, Z.L.; Software, M.W.; Formal analysis, Z.L.; Resources, J.Z.; Data curation, J.Z.; Writing—original draft, M.W.; Writing—review & editing, J.Z.; Supervision, J.Z.; Funding acquisition, J.Z. All authors have read and agreed to the published version of the manuscript.

Funding

This study was supported by the Joint Funds of the National Natural Science Foundation of China (U21A20189); the National Natural Science Foundation of China (42377284); the Science and Technology Innovation Program of Hunan Province (2023RC1076); and the Guangxi Bagui Young Scholars Special Fund given to Jie Zhao.

Data Availability Statement

The data that support the findings of this study are available from the corresponding author, Jie Zhao, upon reasonable request.

Acknowledgments

We thank the Institutional Center for Shared Technologies and Facilities of Institute of Subtropical Agriculture, CAS Public Service Technology Center, Institute of Subtropical Agriculture, Chinese Academy of Sciences for their help in soil sample analysis.

Conflicts of Interest

The authors declare no conflict of interest.

References

  1. Jagoueix, S.; Bove, J.M.; Garnier, M. The phloemlimited bacterium of greening disease of citrus is a member of the a subdivision of the Proteobacteria. Int. J. Syst. Bacteriol. 1994, 44, 379–386. [Google Scholar] [CrossRef] [PubMed]
  2. Bové, J.M. Huanglongbing: A destructive, newly-emerging, century-old disease of citrus. J. Plant Pathol. 2006, 88, 7–37. [Google Scholar]
  3. Teixeira, D.d.C.; Saillard, C.; Eveillard, S.; Danet, J.L.; Costa, P.I.d.; Ayres, A.J.; Bove, J. ‘Candidatus Liberibacter americanus’, associated with citrus huanglongbing (greening disease) in São Paulo State, Brazil. Int. J. Syst. Evol. Microbiol. 2005, 55, 1857–1862. [Google Scholar] [CrossRef] [PubMed]
  4. Blaustein, R.A.; Lorca, G.L.; Teplitski, M. Challenges for managing Candidatus Liberibacter spp.(Huanglongbing disease pathogen): Current control measures and future directions. Phytopathology 2018, 108, 424–435. [Google Scholar] [CrossRef]
  5. Kim, J.S.; Sagaram, U.S.; Burns, J.K.; Li, J.L.; Wang, N. Response of sweet orange (Citrus sinensis) to ‘Candidatus Liberibacter asiaticus’ infection: Microscopy and microarray analyses. Phytopathology 2009, 99, 50–57. [Google Scholar] [CrossRef]
  6. Shin, K.; Ascunce, M.S.; Narouei-Khandan, H.A.; Sun, X.; Jones, D.; Kolawole, O.O.; Goss, E.M.; van Bruggen, A.H.C. Effects and side effects of penicillin injection in huanglongbing affected grapefruit trees. Crop Prot. 2016, 90, 106–116. [Google Scholar] [CrossRef]
  7. Pérez-Zarate, L.A.; Osorio-Acosta, F.; Ortega-Arenas, L.D.; Martínez-Hernández, A.; Villanueva-Jiménez, J.A. Huanglongbing (HLB) de los Cítricos: Impacto Económico y Variabilidad genética del patógeno en México. Agro-Divulg. 2024, 4. [Google Scholar] [CrossRef]
  8. Trivedi, P.; He, Z.; Van Nostrand, J.D.; Albrigo, G.; Zhou, J.; Wang, N. Huanglongbing alters the structure and functional diversity of microbial communities associated with citrus rhizosphere. ISME J. 2012, 6, 363–383. [Google Scholar] [CrossRef]
  9. Ritz, K.; Trudgill, D.L. Utility of nematode community analysis as an integrated measure of the functional state of soils: Perspectives and challenges. Plant Soil 1999, 212, 1–11. [Google Scholar] [CrossRef]
  10. Bongers, T.; Bongers, M. Functional diversity of nematodes. Appl. Soil Ecol. 1998, 10, 239–251. [Google Scholar] [CrossRef]
  11. Yeates, G.W.; Wardle, D.A.; Watson, R.N. Responses of soil nematode populations, community structure, diversity and temporal variability to agricultural intensification over a seven-year period. Soil Biol. Biochem. 1999, 31, 1721–1733. [Google Scholar] [CrossRef]
  12. Neher, D.A. Role of nematodes in soil health and their use as indicators. J. Nematol. 2001, 33, 161. [Google Scholar]
  13. Sánchez-Moreno, S.; Nicola, N.L.; Ferris, H.; Zalom, F.G. Effects of agricultural management on nematode-mite assemblages: Soil food web indices as predictors of mite community composition. Appl. Soil Ecol. 2009, 41, 15. [Google Scholar] [CrossRef]
  14. Bongers, T.; Ferris, H. Nematode community structure as a bioindicator in environmental monitoring. Trends Ecol. Evol. 1999, 14, 12. [Google Scholar] [CrossRef] [PubMed]
  15. Zhao, J.; Neher, D.A. Soil nematode genera that predict specific types of disturbance. Appl. Soil Ecol. 2013, 64, 135–141. [Google Scholar] [CrossRef]
  16. Gao, D.; Liu, S.; Gao, F.; Ning, C.; Wu, X.; Yan, W.; Smith, A. Response of soil micro-food web to nutrient limitation along a subtropical forest restoration. Sci. Total Environ. 2024, 909, 168349. [Google Scholar] [CrossRef] [PubMed]
  17. Wang, M.; Gao, D.; Liu, S.; Yan, W.; Zhao, J. Forest restoration increases energy flow through the fungal channel and decreases energy flow through the herbivorous channel in soil micro-food webs. Soil Biol. Biochem. 2024, 198, 109561. [Google Scholar] [CrossRef]
  18. Gao, D.; Wang, F.; Li, J.; Yu, S.; Li, Z.; Zhao, J. Soil nematode communities as indicators of soil health in different land use types in tropical area. Nematology 2020, 22, 595–610. [Google Scholar] [CrossRef]
  19. Liu, T.; Chen, X.; Hu, F.; Ran, W.; Shen, Q.; Li, H.; Whalen, J.K. Carbon-rich organic fertilizers to increase soil biodiversity: Evidence from a meta-analysis of nematode communities. Agric. Ecosyst. Environ. 2016, 232, 199–207. [Google Scholar] [CrossRef]
  20. Barnes, A.D.; Jochum, M.; Lefcheck, J.S.; Eisenhauer, N.; Scherber, C.; O’Connor, M.I.; de Ruiter, P.; Brose, U. Energy flux: The link between multitrophic biodiversity and ecosystem functioning. Trends Ecol. Evol. 2018, 33, 186–197. [Google Scholar] [CrossRef]
  21. Majdi, N.; Traunspurger, W. Free-living nematodes in the freshwater food web: A review. J. Nematol. 2015, 47, 28. [Google Scholar] [PubMed]
  22. Tighe, M.; Edwards, M.M.; Cluley, G.; Lisle, L.; Wilson, S.C. Colorimetrically determining total antimony in contaminated waters and screening for antimony speciation. J. Hydrol. 2018, 563, 84–91. [Google Scholar] [CrossRef]
  23. Kowalenko, C.G.; Babuin, D. Interference Problems with Phosphoantimonylmolybdenum Colorimetric Measurement of Phosphorus in Soil and Plant Materials. Commun. Soil Sci. Plant Anal. 2007, 38, 12. [Google Scholar] [CrossRef]
  24. Viglierchio, D.R.; Schmitt, R.V. On the methodology of nematode extraction from field samples: Baermann funnel modifications. J. Nematol. 1983, 15, 438. [Google Scholar] [PubMed]
  25. Zhao, J.; Wang, K. Methods for cleaning turbid nematode suspensions collected from different land-use types and soil types. Soil Ecol. Lett. 2021, 4, 429–434. [Google Scholar] [CrossRef]
  26. Yeates, G.W.; Bongers, T.; de Goede, R.G.M.; Freckman, D.W.; Georgieva, S.S. Feeding habits in soil nematode families and genera: An outline for soil ecologists. Nematology 1993, 25, 315. [Google Scholar]
  27. Wasilewska, L. The role of namatodes in agroecosystems. Zesz. Probl. Postępów Nauk Rol. 1989, 358. [Google Scholar]
  28. Yeates, G.W. Nematodes as soil indicators: Functional and biodiversity aspects. Biol. Fertil. Soils 2003, 37, 199–210. [Google Scholar] [CrossRef]
  29. Eisenhauer, N.; Migunova, V.D.; Ackermann, M.; Ruess, L.; Scheu, S. Changes in plant species richness induce functional shifts in soil nematode communities in experimental grassland. PLoS ONE 2018, 6, e24087. [Google Scholar] [CrossRef]
  30. Thakur, M.P.; Reich, P.B.; Fisichelli, N.A.; Stefanski, A.; Cesarz, S.; Dobies, T.; Rich, R.L.; Hobbie, S.E.; Eisenhauer, N. Nematode community shifts in response to experimental warming and canopy conditions are associated with plant community changes in the temperate-boreal forest ecotone. Oecologia 2014, 175, 713–723. [Google Scholar] [CrossRef]
  31. Bongers, T. The maturity index: An ecological measure of environmental disturbance based on nematode species composition. Oecologia 1990, 83, 14–19. [Google Scholar] [CrossRef]
  32. Ferris, H.; Bongers, T.; Goede, R.G.M.d. A framework for soil food web diagnostics: Extension of the nematode faunal analysis concept. Appl. Soil Ecol. 2001, 18, 13–29. [Google Scholar] [CrossRef]
  33. Neher, D.A.; Lee, C.C. Nematode communities and microbial biomass in soils with annual and perennial crops. Appl. Soil Ecol. 1994, 1, 17–28. [Google Scholar] [CrossRef]
  34. Gao, D.; Moreira-Grez, B.; Wang, K.; Zhang, W.; Xiao, S.; Wang, W.; Chen, H.; Zhao, J. Effects of ecosystem disturbance on nematode communities in calcareous and red soils: Comparison of taxonomic methods. Soil Biol. Biochem. 2021, 155, 108162. [Google Scholar] [CrossRef]
  35. Ferris, H. Form and function: Metabolic footprints of nematodes in the soil food web. Eur. J. Soil Biol. 2010, 46, 97–104. [Google Scholar] [CrossRef]
  36. Schwarz, B.; Barnes, A.D.; Thakur, M.P.; Brose, U.; Ciobanu, M.; Reich, P.B.; Rich, R.L.; Rosenbaum, B.; Stefanski, A.; Eisenhauer, N. Warming alters energetic structure and function but not resilience of soil food webs. Nat. Clim. Change 2017, 7, 895–900. [Google Scholar] [CrossRef]
  37. Wan, B.; Liu, T.; Gong, X.; Zhang, Y.; Li, C.; Chen, X.; Hu, F.; Griffiths, B.S.; Liu, M. Energy flux across multitrophic levels drives ecosystem multifunctionality: Evidence from nematode food webs. Soil Biol. Biochem. 2022, 169, 108656. [Google Scholar] [CrossRef]
  38. Topalović, O.; Geisen, S. Nematodes as suppressors and facilitators of plant performance. New Phytol. 2023, 238, 2305–2312. [Google Scholar] [CrossRef]
  39. Zhao, J.; Wang, X.; Shao, Y.; Xu, G.; Fu, S. Effects of vegetation removal on soil properties and decomposer organisms. Soil Biol. Biochem. 2011, 43, 954–960. [Google Scholar] [CrossRef]
  40. Bai, X.; Wu, J.; Zhang, B.; Zhao, H.; Tian, F.; Wang, B. Metagenomics reveals functional profiles of soil nitrogen and phosphorus cycling under different amendments in saline-alkali soil. Environ. Res. 2025, 267, 120686. [Google Scholar] [CrossRef]
  41. Hussain, M.; Bano, S.; Qasim, M.; Gao, J.; Arthurs, S.P.; Wang, L.; Qiu, D.; Mao, R. Association between temperature and reproductive fitness of Diaphorina citri infected with Candidatus Liberibacter asiaticus. Agronomy 2022, 12, 815. [Google Scholar] [CrossRef]
  42. da Graça, J.V.; Douhan, G.W.; Halbert, S.E.; Keremane, M.L.; Lee, R.F.; Vidalakis, G.; Zhao, H. Huanglongbing: An overview of a complex pathosystem ravaging the world’s citrus. J. Integr. Plant Biol. 2016, 58, 373–387. [Google Scholar] [CrossRef] [PubMed]
  43. Padhi, E.M.; Maharaj, N.; Lin, S.-Y.; Mishchuk, D.O.; Chin, E.; Godfrey, K.; Foster, E.; Polek, M.; Leveau, J.H.; Slupsky, C.M. Metabolome and microbiome signatures in the roots of citrus affected by huanglongbing. Phytopathology 2019, 109, 2022–2032. [Google Scholar] [CrossRef] [PubMed]
  44. Reiter, B.; Pfeifer, U.; Schwab, H.; Sessitsch, A. Response of endophytic bacterial communities in potato plants to infection with Erwinia carotovora subsp. atroseptica. Appl. Environ. Microbiol. 2002, 68, 2261–2268. [Google Scholar] [CrossRef]
  45. Ahmed, A.; Liu, Y.; He, P.; He, P.; Wu, Y.; Munir, S.; He, Y. Bacillus quorum quenching shapes the citrus mycobiome through interkingdom signaling. Sci. Total Environ. 2024, 956, 177074. [Google Scholar] [CrossRef]
  46. Ma, W.; Pang, Z.; Huang, X.; Xu, J.; Pandey, S.S.; Li, J.; Achor, D.S.; Vasconcelos, F.N.; Hendrich, C.; Huang, Y. Citrus Huanglongbing is a pathogen-triggered immune disease that can be mitigated with antioxidants and gibberellin. Nat. Commun. 2022, 13, 529. [Google Scholar] [CrossRef]
  47. Mohan, S.; Kiran Kumar, K.; Sutar, V.; Saha, S.; Rowe, J.; Davies, K.G. Plant root-exudates recruit hyperparasitic bacteria of phytonematodes by altered cuticle aging: Implications for biological control strategies. Front. Plant Sci. 2020, 11, 763. [Google Scholar] [CrossRef]
  48. Li, G.; Liu, T.; Whalen, J.K.; Wei, Z. Nematodes: An overlooked tiny engineer of plant health. Trends Plant Sci. 2024, 29, 52–63. [Google Scholar] [CrossRef]
  49. Jones, J.T.; Haegeman, A.; Danchin, E.G.; Gaur, H.S.; Helder, J.; Jones, M.G.; Kikuchi, T.; Manzanilla-López, R.; Palomares-Rius, J.E.; Wesemael, W.M. Top 10 plant-parasitic nematodes in molecular plant pathology. Mol. Plant Pathol. 2013, 14, 946–961. [Google Scholar] [CrossRef]
  50. Jones, J.D.; Dangl, J.L. The plant immune system. Nature 2006, 444, 323–329. [Google Scholar] [CrossRef]
  51. Limburg, K.E. Increasing complexity and energy flow in models of food webs. Ecol. Model. 1985, 29, 5–25. [Google Scholar] [CrossRef]
  52. Weitere, M.; Erken, M.; Majdi, N.; Arndt, H.; Norf, H.; Reinshagen, M.; Traunspurger, W.; Walterscheid, A.; Wey, J.K. The food web perspective on aquatic biofilms. Ecol. Monogr. 2018, 88, 543–559. [Google Scholar] [CrossRef]
Figure 1. Results of principal coordinate analysis (PCoA) analysis of nematode genuse compositions (A) and redundancy analysis (RDA) based on soil physico-chemical properties, soil nematode ecological indices, and total energy flux (B) under three infestation levelsof citrus greening disease.
Agronomy 15 00635 g001
Figure 2. The total nematode abundances and relative abundances of five trophic groups under three infestation levels of citrus greening desease. Control: healthy plant with no leaf yellowing symptom; Mild: ≤50% leaf yellowing symptom; Severe: entire canopy leaf yellowing symptom. Bars indicate standard errors of means. Different letters represent significant differences between treatments at the p < 0.05 level.
Agronomy 15 00635 g002
Figure 3. Soil nematode ecological indices of health plant with no leaf yellowing symptom (Control), of plant with ≤50% leaf yellowing symptom (Mild), and of plant with entire canopy leaf yellowing symptom (Severe). Bars indicate standard errors of means. Different letters represent significant differences between treatments at the p < 0.05 level.
Agronomy 15 00635 g003
Figure 4. The five-node food web shows the energetic structure of the soil nematode community (A), total energy flux under three infestation levels of citrus greening disease (B) and the relative contributions of key genera on total carbon flux based on a random forest model (C). Bacterivores, fungivores, and herbivores obtain energy from basic resources (R), while omnivores and predators derive their energy from bacterivores, fungivores, and herbivores. The biomass size is indicated by the node size. Carbon flux values are shown in the boxes along the lines, with the thickness of the lines reflecting the magnitude of the fluxes. The uniformity (U) of the energy structure in soil nematodes (unitless, standard error) is calculated by dividing the mean of the total carbon flux through each energy channel by the standard deviation of these means. Only genera that are marginally and significantly associated with total carbon flux are presented in the figure and marked by symbols (# 0.05 ≤ p ≤ 0.10; * p < 0.05). Different letters represent significant differences between treatments at the p < 0.05 level.
Agronomy 15 00635 g004
Table 1. Pearson correlation results between food web carbon fluxes and soil physico-chemical properties or nematode ecological indices. The food web carbon flux included the total carbon flux (FTotal), carbon fluxes between resources and bacterivores, fungivores, or herbivores (i.e., FBa, FFu, or FHe, respectively), and carbon fluxes between bacterivores, fungivores, or herbivores and omnivore-predators (i.e., FBa-OP, FFu-OP, or FHe-OP, respectively). U is the uniformity of energy flow.
Index CategoryFood Wed Carbon Flux
FTotalUFba-opFfu-opFhe-opFbaFfuFhe
rprprprprprprprp
Soil physico-chemical propertiesSWC0.1500.641−0.1380.6680.0010.998−0.1790.577−0.1670.6050.1070.742−0.1460.652−0.1970.540
pH−0.1500.6410.3520.262−0.2800.378−0.5470.065−0.4340.159−0.3560.256−0.5060.093−0.4540.138
SOC0.2440.445−0.2840.371−0.2420.449−0.0670.836−0.0170.958−0.1250.699−0.0090.978−0.0200.950
AK−0.5610.0580.580<0.05−0.3400.279−0.632<0.05−0.5770.050−0.4240.170−0.631<0.05−0.589<0.05
AP0.4180.176−0.669<0.050.3260.3020.4930.1030.608<0.050.656<0.050.4620.1310.599<0.05
NH4+-N0.4130.182−0.3560.256−0.2490.4360.3310.2930.4280.1650.2580.4180.3340.2890.3830.219
NO3+-N−0.2770.384−0.0220.946−0.0870.788−0.3360.286−0.1230.704−0.0650.841−0.3520.261−0.1250.699
TN0.858<0.001−0.672<0.05−0.0740.8200.701<0.050.817<0.0010.5260.0790.754<0.050.805<0.05
TC0.866<0.001−0.691<0.05−0.1710.5960.609<0.050.838<0.0010.3900.2110.670<0.050.837<0.001
TP0.2470.440−0.4450.1470.1800.5750.0540.8670.2140.5040.1940.5460.0430.8940.2100.513
Ca−0.2050.5220.1350.6760.0170.959−0.5170.085−0.4550.137−0.2160.500−0.5030.096−0.4660.127
Mg−0.4410.1510.1150.7220.3230.307−0.2080.518−0.4880.108−0.0030.992−0.2650.406−0.5010.097
Nematode
Ecological
indices
H−0.3240.3050.2020.5290.0580.857−0.2710.393−0.4170.177−0.1770.581−0.2620.411−0.4130.182
λ0.3830.219−0.2390.454−0.0530.8690.2740.3890.4440.1480.2080.5170.2720.3920.4390.152
SI0.892<0.001−0.763<0.05−0.1470.6480.880<0.0010.886<0.0010.3820.2200.916<0.0010.876<0.001
NCR−0.2020.5290.2960.3510.2380.456−0.3240.305−0.1810.5740.2860.367−0.2960.350−0.1740.589
MHR−0.3580.2530.0230.9440.3490.266−0.3220.307−0.3390.281−0.0730.822−0.3830.219−0.3370.284
MI0.717<0.05−0.3450.273−0.2720.3930.616<0.050.701<0.050.2700.3950.668<0.050.696<0.05
J−0.891<0.0010.816<0.05−0.0660.838−0.870<0.001−0.896<0.001−0.5640.056−0.897<0.001−0.887<0.001
SR−0.632<0.050.617<0.050.0250.938−0.863<0.001−0.761<0.05−0.3530.260−0.870<0.001−0.762<0.05
Disclaimer/Publisher’s Note: The statements, opinions and data contained in all publications are solely those of the individual author(s) and contributor(s) and not of MDPI and/or the editor(s). MDPI and/or the editor(s) disclaim responsibility for any injury to people or property resulting from any ideas, methods, instructions or products referred to in the content.

