Article

An Exploration of the Chemical Signals and Neural Pathways Driving the Attraction of Meloidogyne incognita and Caenorhabditis elegans to Favorable Bacteria

1
State Key Laboratory for Conservation and Utilization of Bio-Resources in Yunnan, Yunnan University, Kunming 650091, China
2
Clinical Biobank Center, Laboratory Animal Center, General Hospital of Western Theater Command, Chengdu 610083, China
*
Authors to whom correspondence should be addressed.
These authors have contributed equally to this work.
Agronomy 2025, 15(3), 590; https://doi.org/10.3390/agronomy15030590
Submission received: 18 December 2024 / Revised: 25 January 2025 / Accepted: 6 February 2025 / Published: 27 February 2025

Abstract

:
Root-knot nematodes (RKNs: Meloidogyne sp.) are among the most devastating plant pathogens. Their chemotaxis-driven host-seeking activity is critical for RKNs’ infection success. Using attractants derived from bacterial volatile organic compounds (BVOCs) to interrupt the host-seeking is promising for the management of RKNs. However, little is known about how BVOCs contribute to the attractiveness of RKNs. Here, we provide a first evaluation of the attractive potential of taxonomically diverse bacteria from different environments and assemble a previously unidentified repertoire of bi-attractive bacteria to M. incognita and Caenorhabditis elegans. We found that the attraction strength of the preferred bacteria to the nematodes was positively correlated with the abundance and amounts of ketones in the BVOC profiles. This suggested that ketones are key for BVOC-mediated attraction. In our behavioral experiments using ketone compounds, we provide evidence that the attractiveness of the nematodes to the preferred bacteria arises specifically from ketone odor cues, a phenomenon not reported previously. This study demonstrates for the first time that a specific ketone blend naturally occurring within the BVOC profiles from the preferred bacteria serves as a key odorant regulating their enhanced attraction toward the nematodes. We used genetic methods to show that the AWCON neurons are important for worms to sense the ketones derived from the preferred bacteria and drive attraction to these bacteria. Our study may serve as a platform for a better understanding of the chemical and neuronal basis for ketone-mediated bacteria–nematode interactions and the development of new BVOCs as attractants in RKNs’ management.

1. Introduction

Meloidogyne incognita is considered to be the most agriculturally damaging root-knot nematodes (RKNs) species, accounting for 5% of global crop losses [1]. The second-stage juveniles (J2s), hatching from eggs, are the only infective and migratory stage of RKNs. This represents a key target stage for the control of RKNs in crop plants [2,3]. The chemotaxis involved in the J2 host-seeking process is a key determinant of the high levels of RKN populations in the infected host roots [4]. Therefore, utilizing methods based on the disruption of J2 host-seeking is promising for the semiochemical management of the RKNs population. However, the chemosensory mechanisms that mediate the host-seeking activity are complicated and currently not well understood.
Bacteria are ubiquitous in the natural environment of nematodes. There is mounting evidence to show that the volatile organic compounds emitted by bacteria (BVOCs) can impact the chemotactic behaviors of nematodes [5,6]. Recent studies showed that Caenorhabditis elegans is attracted to a broad range of BVOCs which might act as cues for the bacterial food for C. elegans. Worms [7,8,9,10] (Compared with the BVOCs repertoire of C. elegans attractants, the BVOC-derived attractants for both the free-living nematode C. elegans and the parasite nematode RKNs have not been systemically explored. Furthermore, the molecular mechanisms underlying RKNs’ host-seeking behaviors have been largely unexplored due to the long-standing genetic intractability of RKNs. Considering the high similarity of the neural anatomy and functionality among RKNs and the amenability of the genetic manipulation of C. elegans [11,12,13], C. elegans is therefore an ideal experimental tool to investigate the highly conserved biological processes of the interested targets in RKNs [14,15]. Therefore, insight into the cellular and molecular mechanism underlying the BVOC-derived chemotaxis in C. elegans can indirectly inform studies of BVOCs attractants in RKNs.
Currently, research on the impact of BVOCs on the RKNs chemotaxis is in progress. However, no BVOCs have been unambiguously identified as universal RKNs and C. elegans attractants. Searching BVOCs-derived chemoattractants for RKNs has been an ongoing endeavor, which is very likely not only to help the dissecting of the chemotaxis signaling pathways in RKNs but also for the development of better targeted control strategies for RKNs’ infection.
In this study, we focused on identifying the types of BVOCs that contribute to the attraction of the preferred natural bacteria by both C. elegans and RKNs and also on how the chemosensory neurons sense and regulate chemotaxis behavior in response to the preferred bacteria and their derived olfactory cues. Here, we first collected the natural bacterial population from diverse environments. Then, the attractiveness of the single-isolate cultures to both C. elegans and M. incognita was evaluated in chemotaxis assays. Subsequently, we defined the attractive BVOC profiles that are specifically associated with the attractive preferred isolates by the nematodes. This study is the first to present evidence that the higher attractive activity of the bacterial isolates displayed, the more ketones that are released. Accordingly, we selected twelve ketone compounds present preferentially in the BVOC profiles of the preferred isolates. Next, we tested these ketones both individually and in blends as well for their effects on the nematode olfactory responses. Then, adaptation experiments confirmed that a blend of ketone odors specially contributes to the enhanced attractiveness and preference of the preferred bacterial isolates to C. elegans. Finally, we used a reverse genetic screen to determine the chemosensory neurons involved in the detection of the preferred bacteria and their released ketone BVOCs. Our data strongly suggested that the AWCON neurons are important for worms to sense both the ketones derived from the preferred bacteria and the bacteria attracted.
In conclusion, our study expands on the repertoire of the potential RKN attractants in natural environments. This research may also serve as a platform for a better understanding of the chemical and neuronal basis of ketone-mediated bacteria-nematode interactions. This useful information will contribute to the development of new BVOCs as RKN attractants to subsequently help with our intervention into the host-seeking strategies used to control RKNs. To summarize, our study has provided new insights into the role of bacteria-derived ketones as important attractant targets for BVOC-based strategies in RKNs’ management.

2. Materials and Methods

2.1. Bacterial Isolates and Culture Conditions

A collection of 231 bacterial isolates was used in this study; further details of the isolation source are given in Supplementary Table S1. All isolates were stored in NB (nutrient broth) (Oxoid) containing 25% glycerol at −80 °C until further use. Unless otherwise specified, NA (nutrient agar), NB, and ISP2 medium (International Streptomyces Project—2 Medium) were used as media for the routine growth of the bacterial isolates. Escherichia coli OP50 was also assayed for comparison and was grown in Luria-Bertani (LB) broth at 37 °C.

2.2. C. elegans Strains

All C. elegans strains were obtained from the Caenorhabditis elegans Genetics Center (CGC), University of Minnesota, USA. The C. elegans mutant strains used in this study for screening the sensory neurons were AU3 (nsy-1(ag3), CX6161(inx-19(ky364, previously nsy-5), CX2065 (odr-1(n1936), CX2205 (odr-3(n2150), and CX4 (odr-7(ky4)).

2.3. Collection of Meloidogyne Incognita Eggs and Second-Stage Juveniles (J2s)

M. incognita was propagated on greenhouse-grown susceptible tomato plants in the state key laboratory for the conservation and utilization of Bio-Resources in Yunnan, Yunnan University, Kunming, Yunnan province, China (24°52′59.33″ N, 102°49′53.27″ E), for two months after inoculation at 25–30 °C and 60–70% RH. Egg masses were manually picked from galled tomato roots and then sterilized with 0.1% sodium hypochlorite for 1 min and washed five times with sterile water. Juveniles (J2s) were collected by hatching eggs on a 50-micron mesh screen in distilled water at 25–30 °C. A suspension of freshly hatched J2 juveniles was prepared in distilled water and used in the behavioral assays.

2.4. C. elegans Maintenance and Synchronization

The C. elegans N2 and mutants were grown and maintained on standard solid NGM (nematode growth medium) plates seeded with E. coli OP50 as a food source at 20–22 °C using standard protocols (http://www.wormbook.org/toc_wormmethods.html (accessed on 29 June 2024)) unless otherwise noted. More information on the maintenance and synchronization of C. elegans is available in Porta-de-la-Riva et al.’s paper [16], and additional information on the synchronization procedure is available in Supplementary File S1: Supplementary Methods. L4-stage worms were washed with M9 buffer three times to eliminate bacterial residues and then diluted to the desired concentration used in all of the assays.

2.5. Reagents

The volatile compounds used in this study include 2-Tetradecanone (2345-27-9), Cyclopentadecanone (502-72-7), 2-Pentadecanone (2345-28-0), 2-Decanone (693-54-9), 6-methyl-2-Heptanone (928-68-7), 6,10-dimethyl-2-Undecanone (1604-34-8), 5-methyl-2-Hexanone (110-12-3), 2-Octanone (111-13-7), 2-Tridecanone (593-08-8), 2-Heptanone (110-43-0), Cyclododecanone (830-13-7), 2-Dodecanone (6175-49-1), Isoamyl alcohol (123-51-3), and Dimethyl disulfide (624-92-0), as well as 2-Nonanone (821-55-6). Chemical compounds were purchased from Sangon Biotech (Shanghai, China). Each compound was tested at 3 concentrations (50, 500, and 5000 mgL−1) in behavior experiments (see Supplementary File S1: Supplemental Methods for more details).

2.6. Preparation of Bacterial Suspension and Fermentation Broth of Bacteria

The preparation of the culture and fermentation medium was performed according to the protocol of a previous study [17] following sterilization via autoclave for 25 min and the adjustment of the pH to 7.2. The bacterial suspension used in the behavior assays was prepared by culturing the bacteria in NB/ISP2 liquid medium and incubated in a thermostatic shaker at 37 °C and 200 rpm for 2 days according to the method used by Worthy et al. [7] For details of the preparation of the bacterial suspension, see Supplementary File S1: Supplemental Methods.

2.7. Phylogenetic Analysis

The bacterial isolates were grown on NA plates at 37 °C for 48 h, and their genomic DNA was extracted using the DNA extraction kit (QIAamp DNA Mini Kit, Qiagen, Hilden, Germany) according to the manufacturer’s instructions. The integrity and yield of the extracted DNA were assessed using a NanoDrop Micro Photometer (NanoDrop Technologies, Wilmington, DE, USA) and 1% agarose gel electrophoresis, respectively. For details of phylogenetically characterized isolates by 16S rRNA gene sequencing, see Supplementary Table S1.

2.8. Nematode Behavioral Assays

Chemotaxis assays.
Nematodes (C. elegans and M. incognita)-bacterial isolates chemotaxis assays.
Chemotaxis assays were performed following an established protocol [18,19] with some modifications. Full details of the nematodes-bacterial isolates chemotaxis assays are given in Supplementary File S1: Supplemental Methods.
The modified bacterial odor chemotaxis assay based on three-division Petri dishes.
The bacterial odor chemotaxis assay is a modified version of the chemotaxis assay using three-division Petri dishes and measures olfactory chemotaxis for nematodes based only on volatile chemical cues released by the bacteria (adapted from Hsueh et al. [20]. For details of the modified bacterial odor chemotaxis assay procedure, see Supplementary File S1: Supplemental Methods.
Nematodes (C. elegans and M. incognita)-odor chemotaxis assays.
Nematodes-odor chemotaxis assays were conducted based on the nematodes-bacterial chemotaxis assays. Worms were raised and prepared identically to those used in the C. elegans-bacterial chemotaxis assays. Full details of the nematodes-odor chemotaxis assays are given in Supplementary File S1: Supplemental Methods.
Bacteria two-choice preference assays.
Full details of the bacterial binary choice assay are available in Zhang et al.’s [21] and Glater et al.’s [19] papers, and additional information on the preference assay procedure is available in Supplementary File S1: Supplemental Methods.
A modified conditioning adaptation assay and bacterial preference assay.
A conditioning adaptation assay was modified from previous protocol [22]. For details of the modified conditioning adaptation assay procedure, see Supplementary File S1: Supplemental Methods.

2.9. Analysis of Bacterial BVOCs by HS-SPME-GC-MS

The composition of BVOCs emitted by bacterial isolates with attractive activity to nematodes was analyzed by HS-SPME-GC-MS, following the procedure described previously [8,23]. Detailed information on the analytical procedure is available in Supplementary File S1: Supplemental Methods.

2.10. Multivariate Data Analysis

Relative amounts of each compound were used to build the data matrices and conduct multivariate analyses. Detailed information is available in Supplementary File S1: Supplemental Methods.

2.11. Statistical Analysis

All statistical analyses were performed using SPSS version 22.0 (SPSS Inc., Chicago, IL, USA). Graphs were generated using GraphPad Prism 7. Statistical significances across treatments were evaluated by one-way ANOVA, two-way ANOVA, Student’s t-test, and the log-rank test. The outcomes of the statistical analyses are represented in each figure legend. Diagrams of behavior assays were created using the online program biorender (https://app.biorender.com/ (accessed on 29 June 2024)).

3. Results

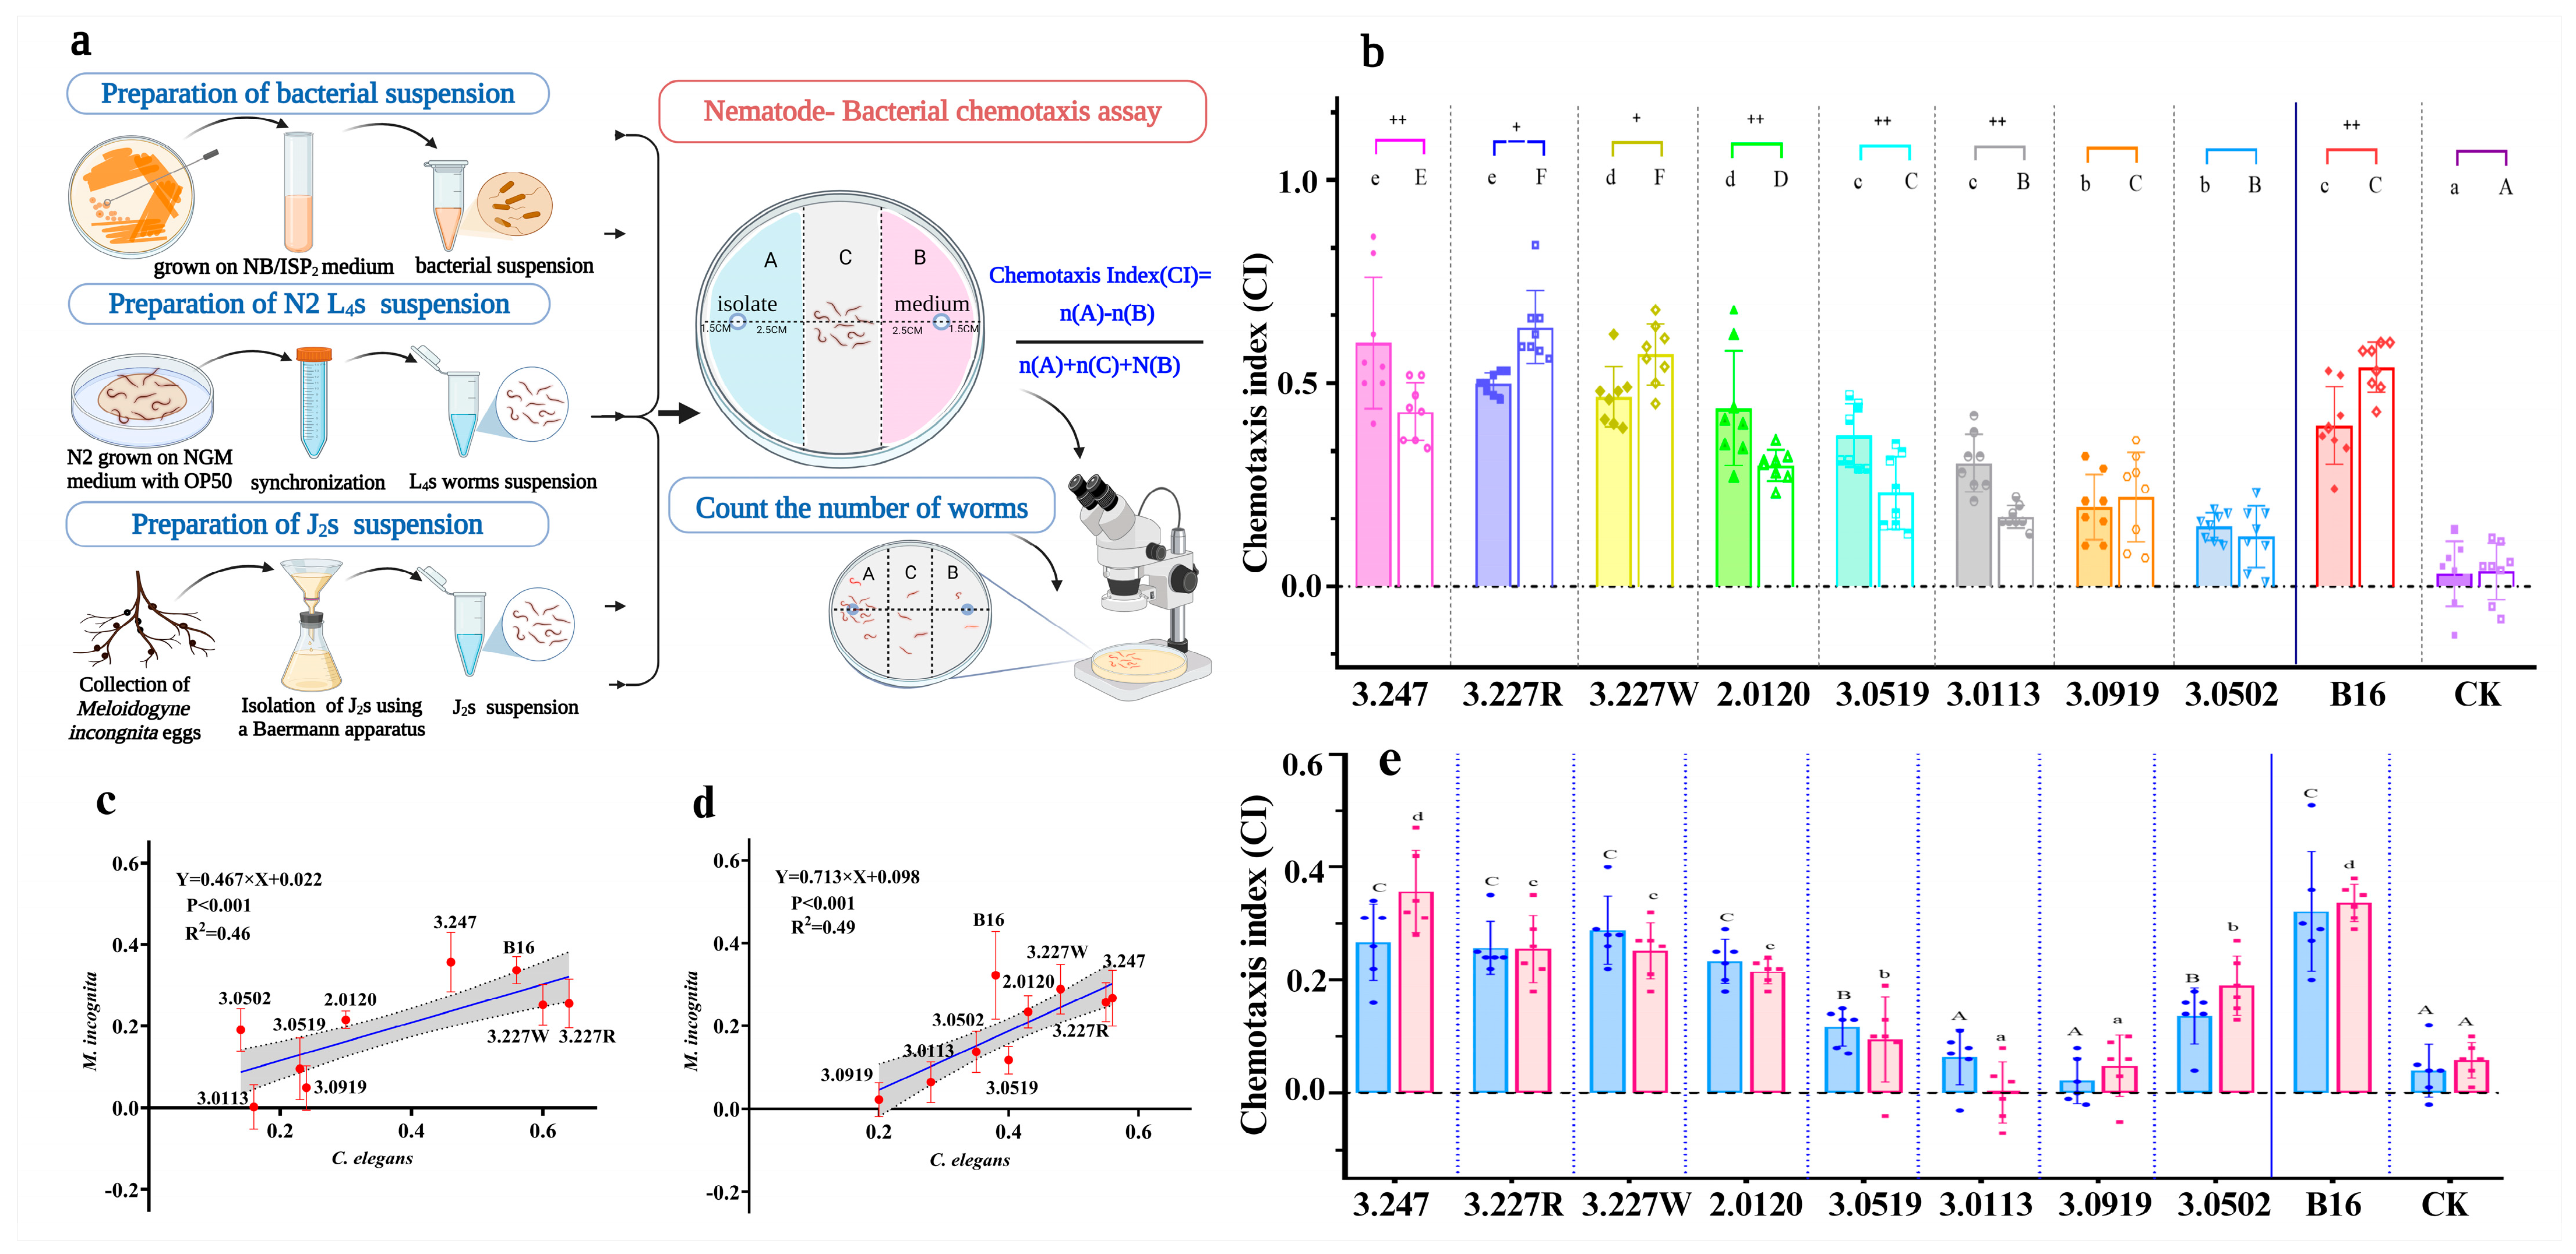
3.1. Screening of Bi-Attractive Bacteria Toward Both C. elegans and M. incognita from Natural Environment

This part of the experiment was conducted to investigate whether the attraction of bacteria to parasitic nematode M. incognita is a common behavior across parasites and free-living nematode species. Consequently, C. elegans was used as a model organism to explore in-depth the mechanism underlying its attractive behavior. A diverse set of 231 natural bacterial isolates (see Supplementary Table S1) was assembled based on our lab culture collection previously isolated from different environments. We first evaluated the attractive chemotaxis of every individual isolate from the collection to C. elegans. A total of 141 out of the 231 isolates (see Supplementary Table S1) were found to have triggered the attractive activity (CI > 0.1) from C. elegans in the chemotaxis assay (Figure 1a). Then, 91 isolates with a CI of more than 0.2 were subjected to a M. incognita−based secondary screening (see Supplementary Table S2). According to the primary and secondary screening, 46 bacterial isolates were found to show bi-attractive activity to both C. elegans and M. incognita (Supplementary Table S3). Within the bi−attractive bacteria, the most prevalent bacterial phyla were found to be Proteobacteria, Firmicutes, and Actinobacteria (Supplementary File S1: Figure S1). Therefore, we decided to focus on these bacteria for their bi-attractive activity to nematodes and decipher the mechanism of their attractiveness. In these experiments, eight bacterial isolates were selected for further study from the bi-attractive bacterial community, and the results displayed a different degree of attractiveness to C. elegans and M. incognita from high (isolates 3.227 R, 3.227 W, 2.0120, and 3.247), medium (isolates 3.0113, 3.0519), to weak (isolates 3.0502, 3.0919; all in Figure 1b,e). Data were normalized against the highly attractive isolate B. nematicide B16 previously reported [24]. Additionally, correlation analyses were performed to assess the associations between the chemotaxis of C. elegans and M. incognita for bacteria, as measured by CI values (Figure 1c,d). This analysis showed a significant positive correlation between the chemotaxis of both nematode species for bacteria grown on either the ISP2 medium (r = 0.46, p < 0.0001) or the NB medium (r = 0.49, p < 0.0001).
We also used a bacterial binary choice assay [19,21] in which worms can migrate to one of two patches of bacteria on the opposite sides of an agar plate to test the nematode preference (Figure 2a). In this assay, the worms showed a varied preference for selected bacterial isolates compared with their attractive activity over E. coli OP50, which served as standard lab food for C. elegans. In brief, C. elegans exhibited a significant preference for four highly bi-attractive bacterial isolates over the OP50 standard (relative preference index varied from 0.23 to 0.69) regardless of the bacteria culture media (Figure 2b) This was comparable to its preference for the positive control isolate B16 over OP50. Particularly, there was no significant preference difference between OP50 vs. LB medium, 3.227 R vs. OP50, and 3.227 W vs. OP50 (Figure 2b).
To mimic more similarly the bacterial choice of C. elegans in the natural environment, we next examined the preference of bacterial choices between the preferred natural bacterial isolates. In a series of choices between the isolate 3.227 R and each of the other three preferred isolates and between the isolate 3.227 W and each of the other three preferred isolates, C. elegans showed a strong preference for both isolates 3.227 R and 3.227 W over each of the other three preferred isolates (Figure 2c). Similarly, there was a preference as well for both isolates 3.227 R and 3.227 W over each of the other three preferred isolates for M. incognita (Figure 2d,e).

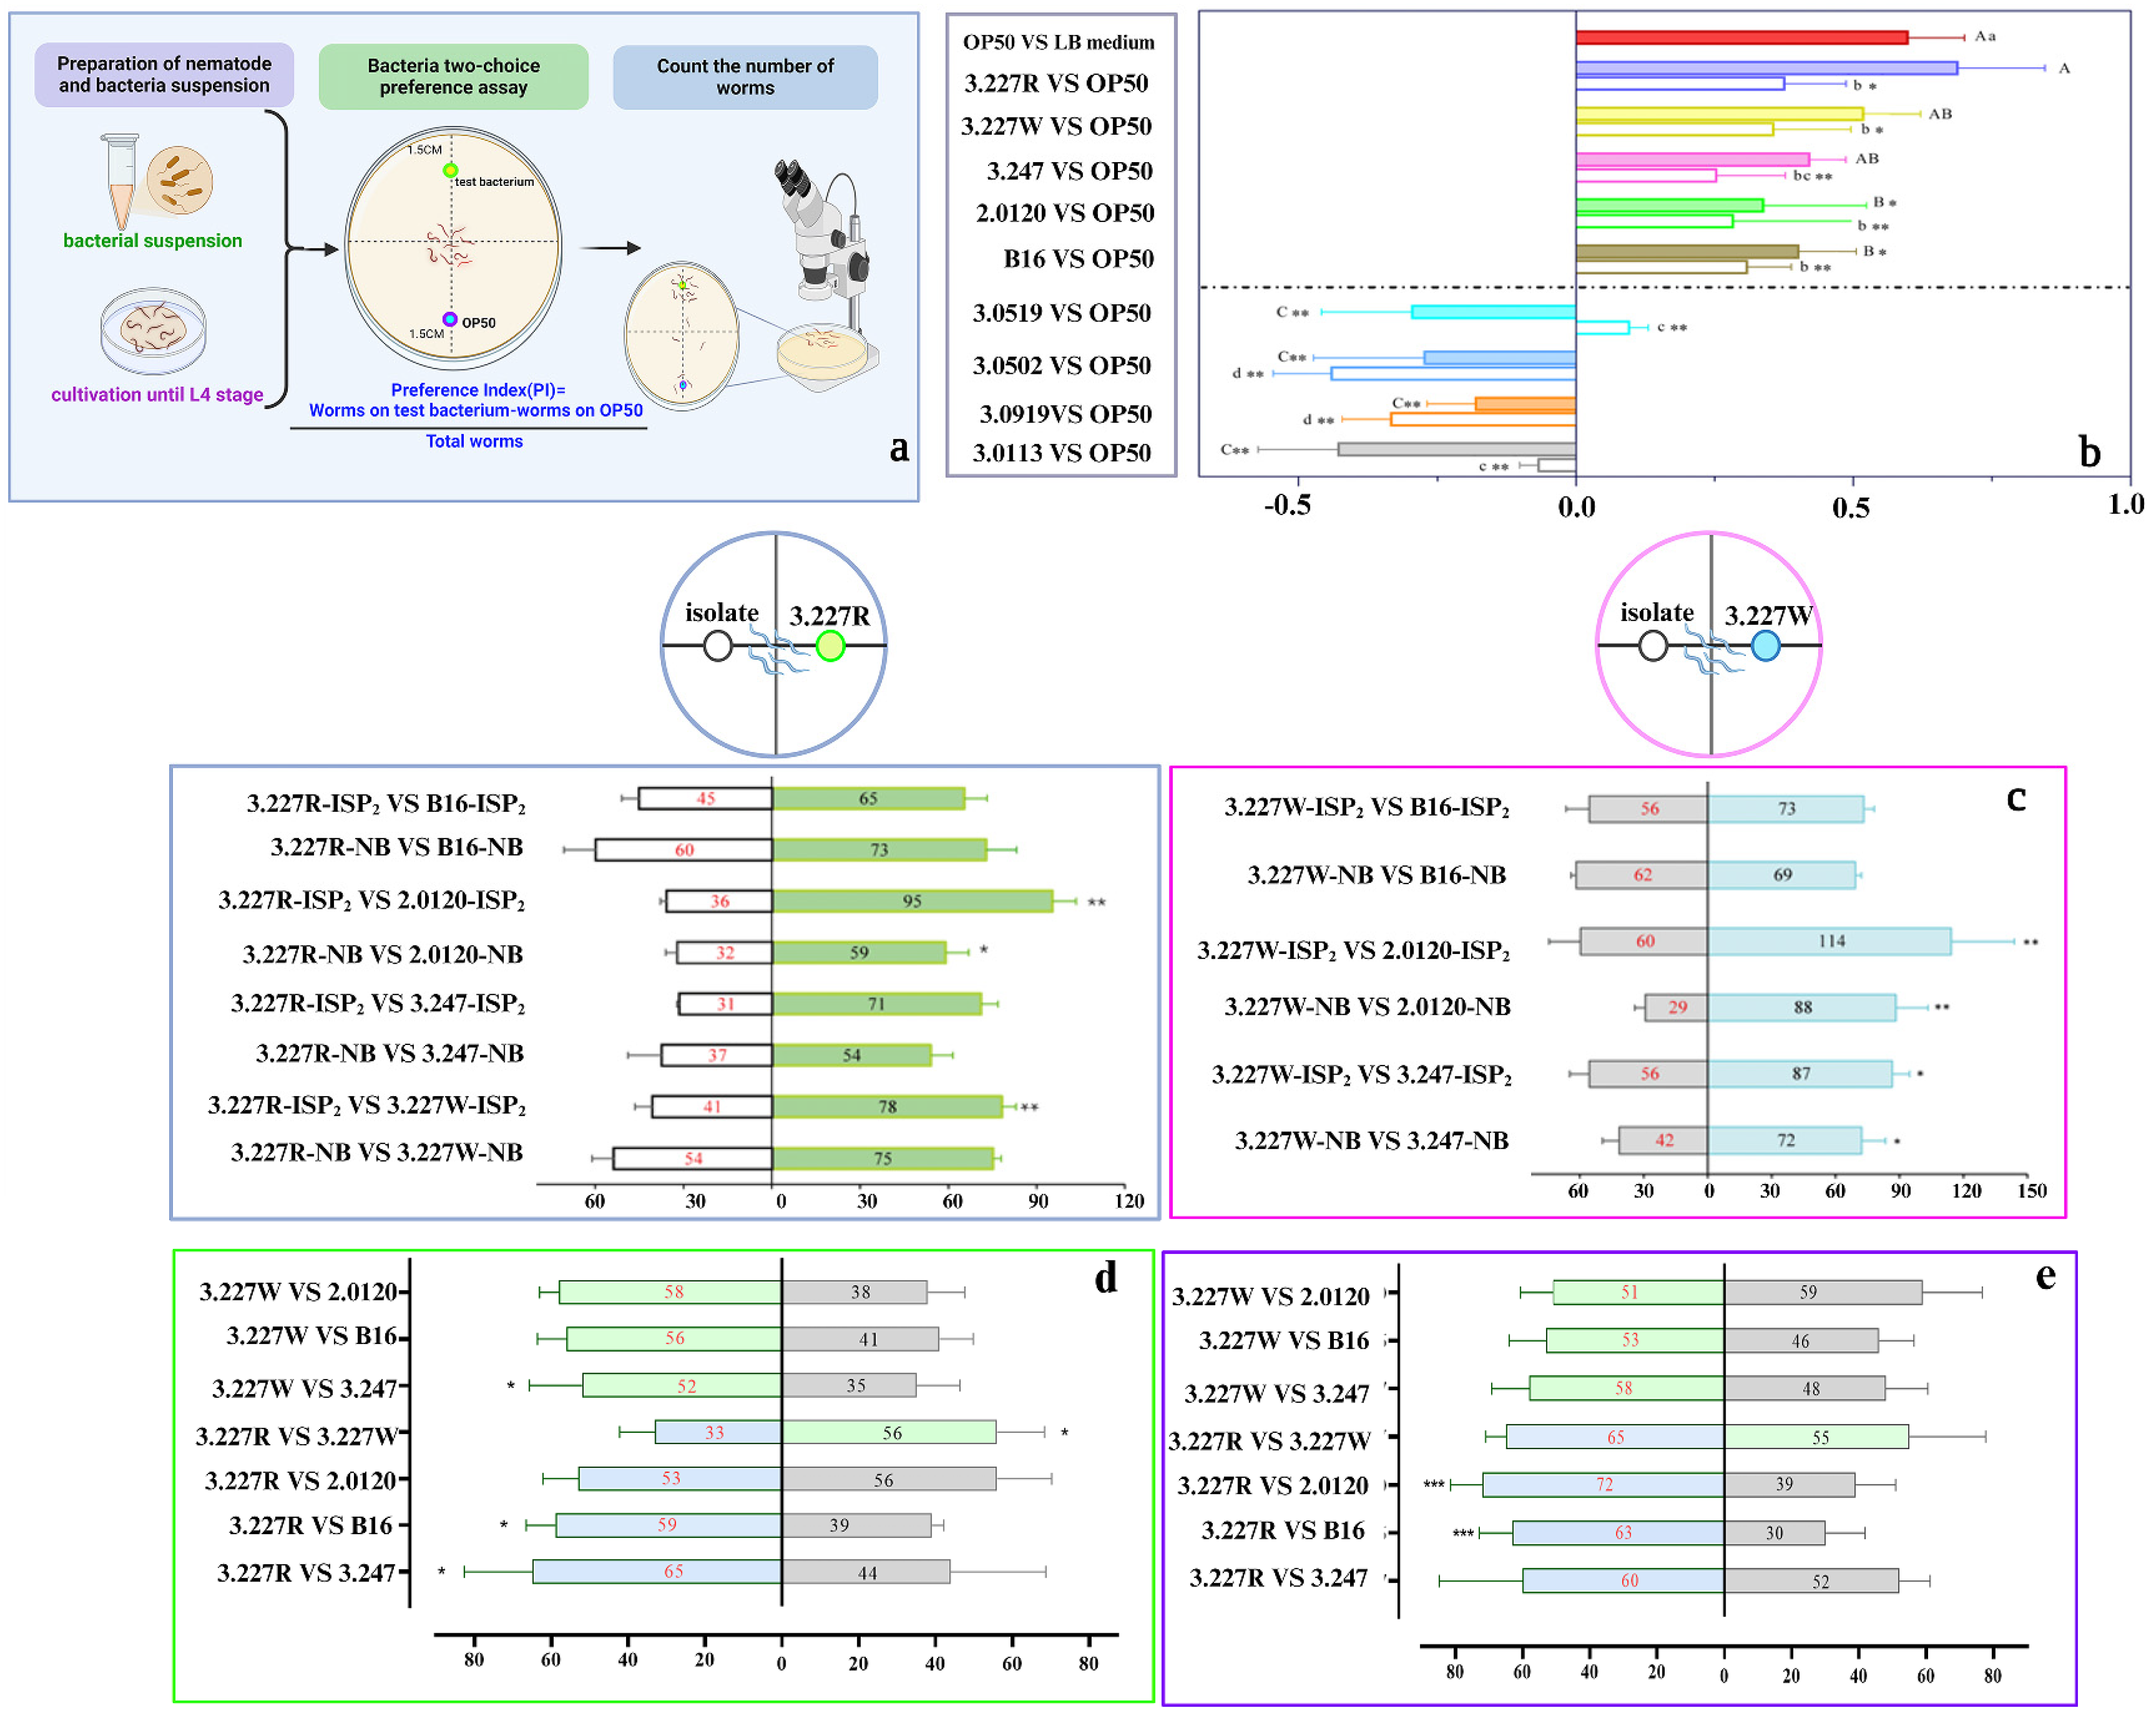
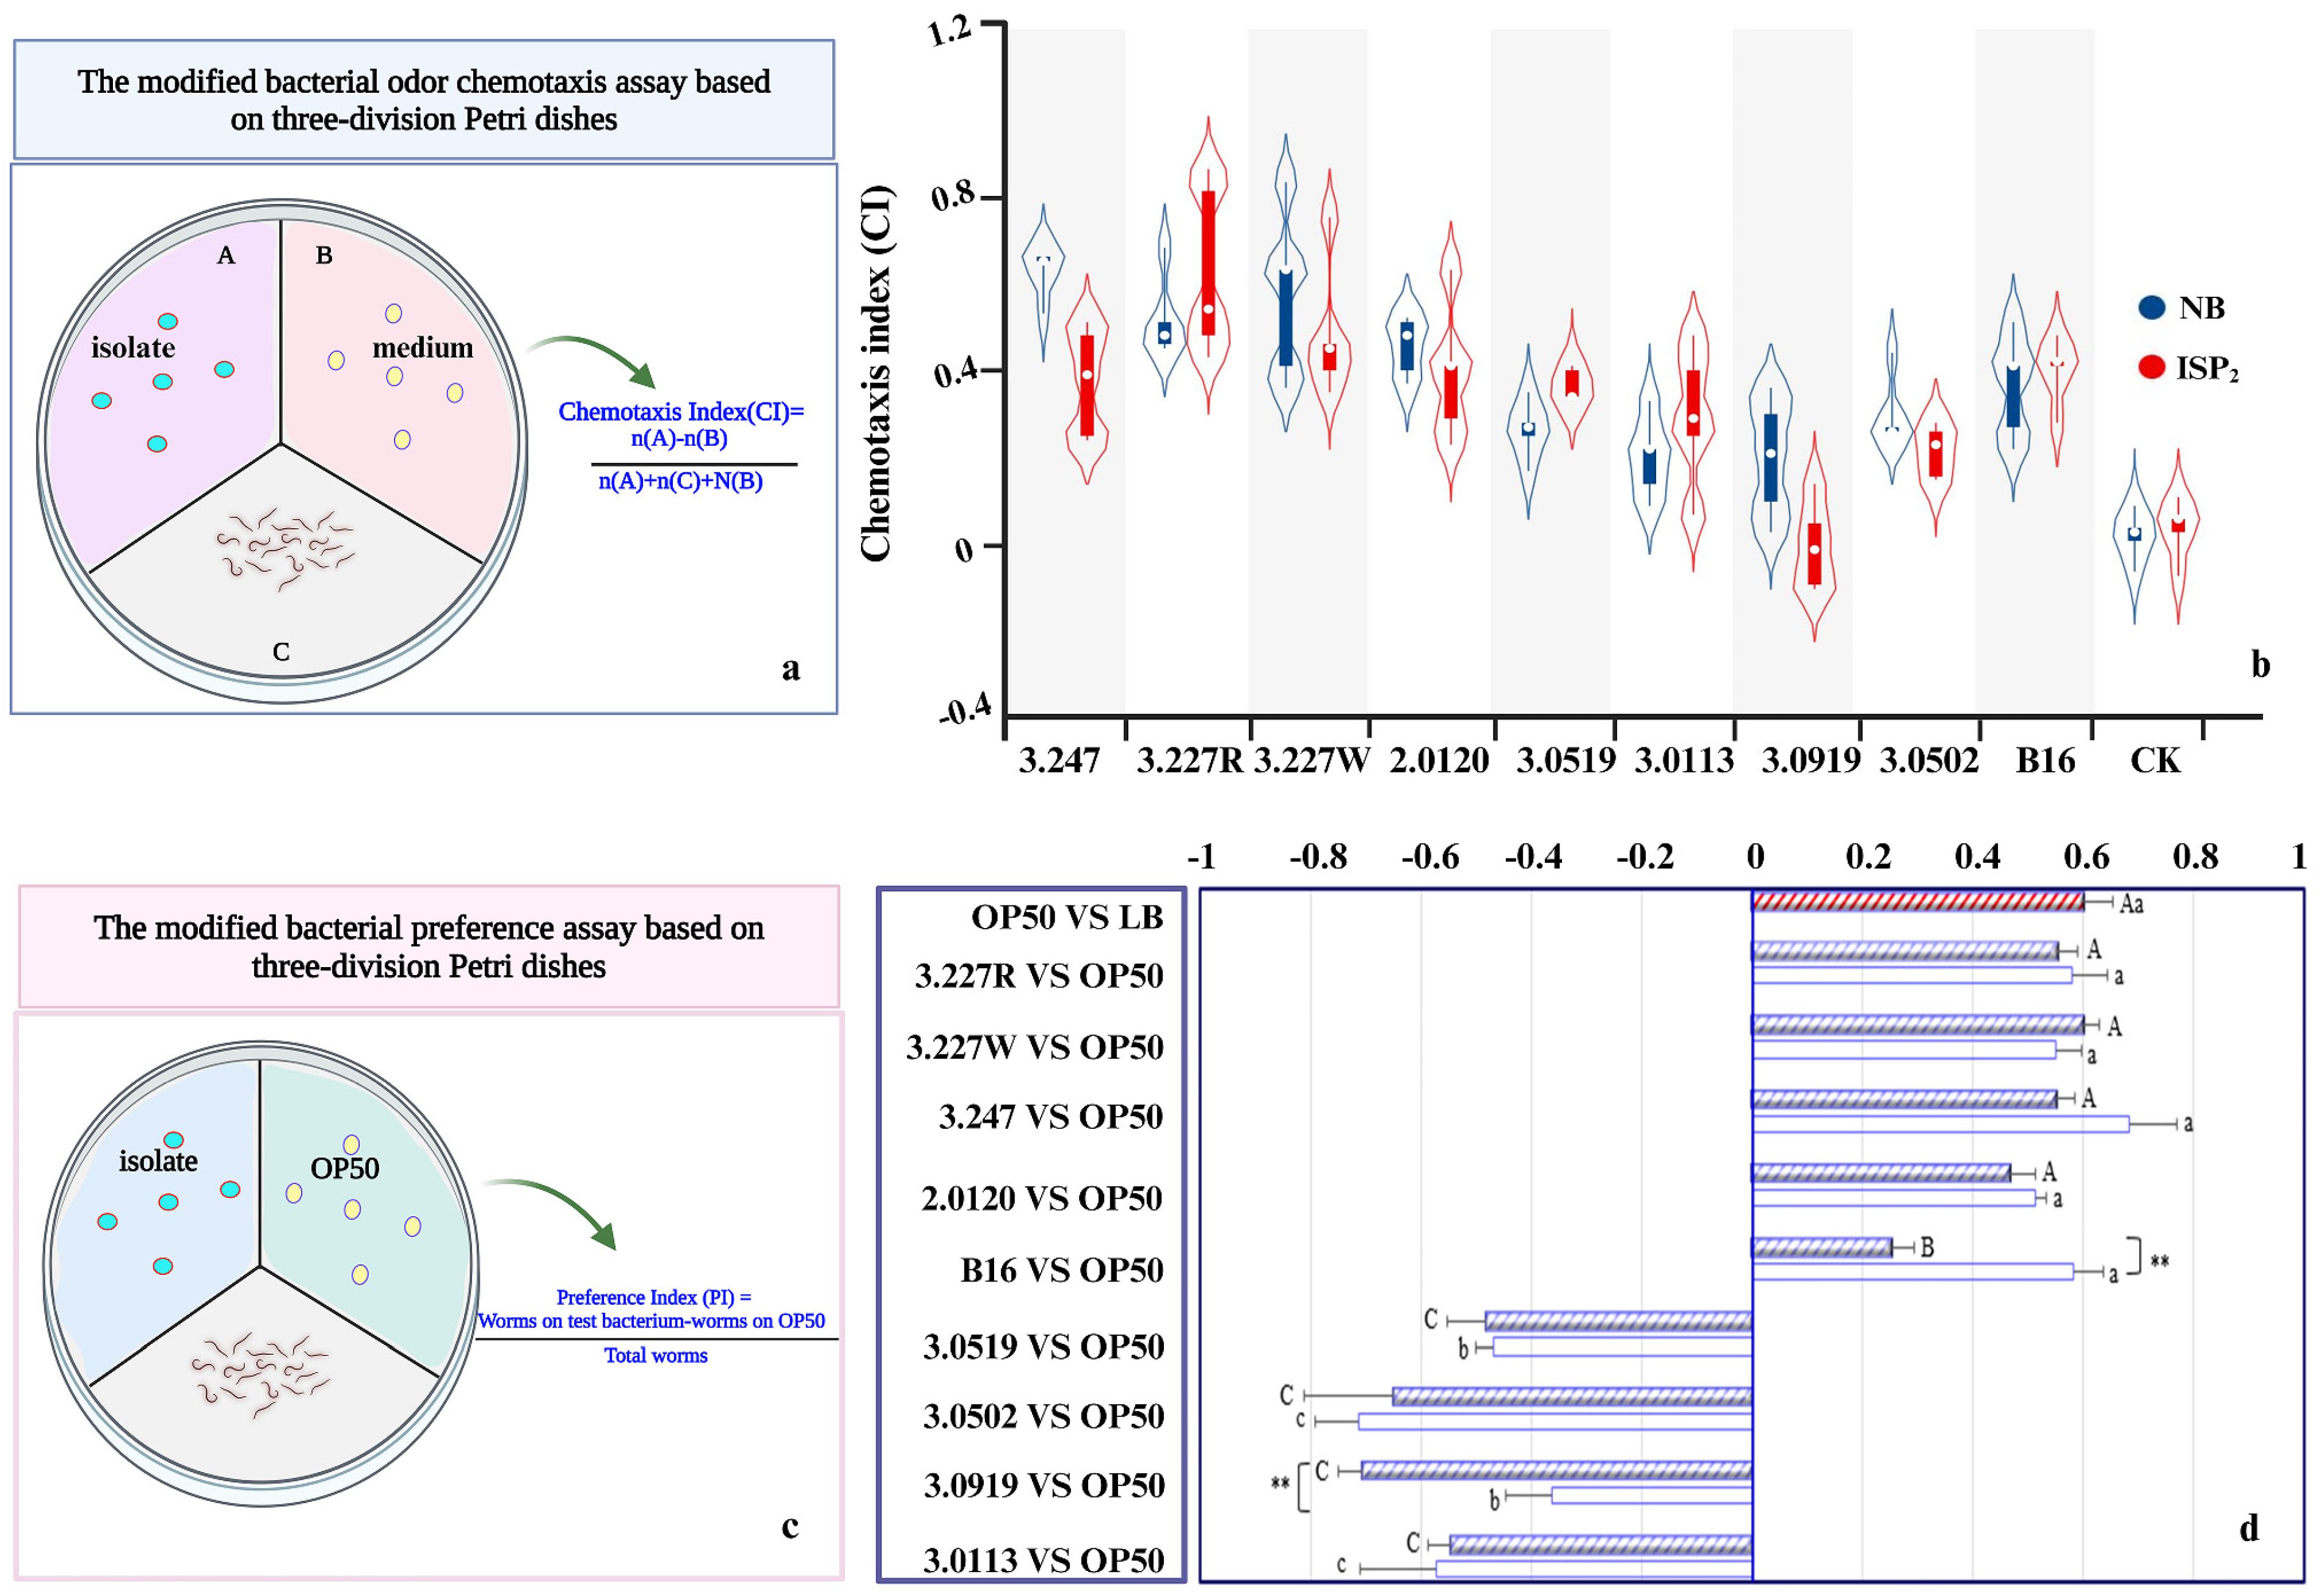
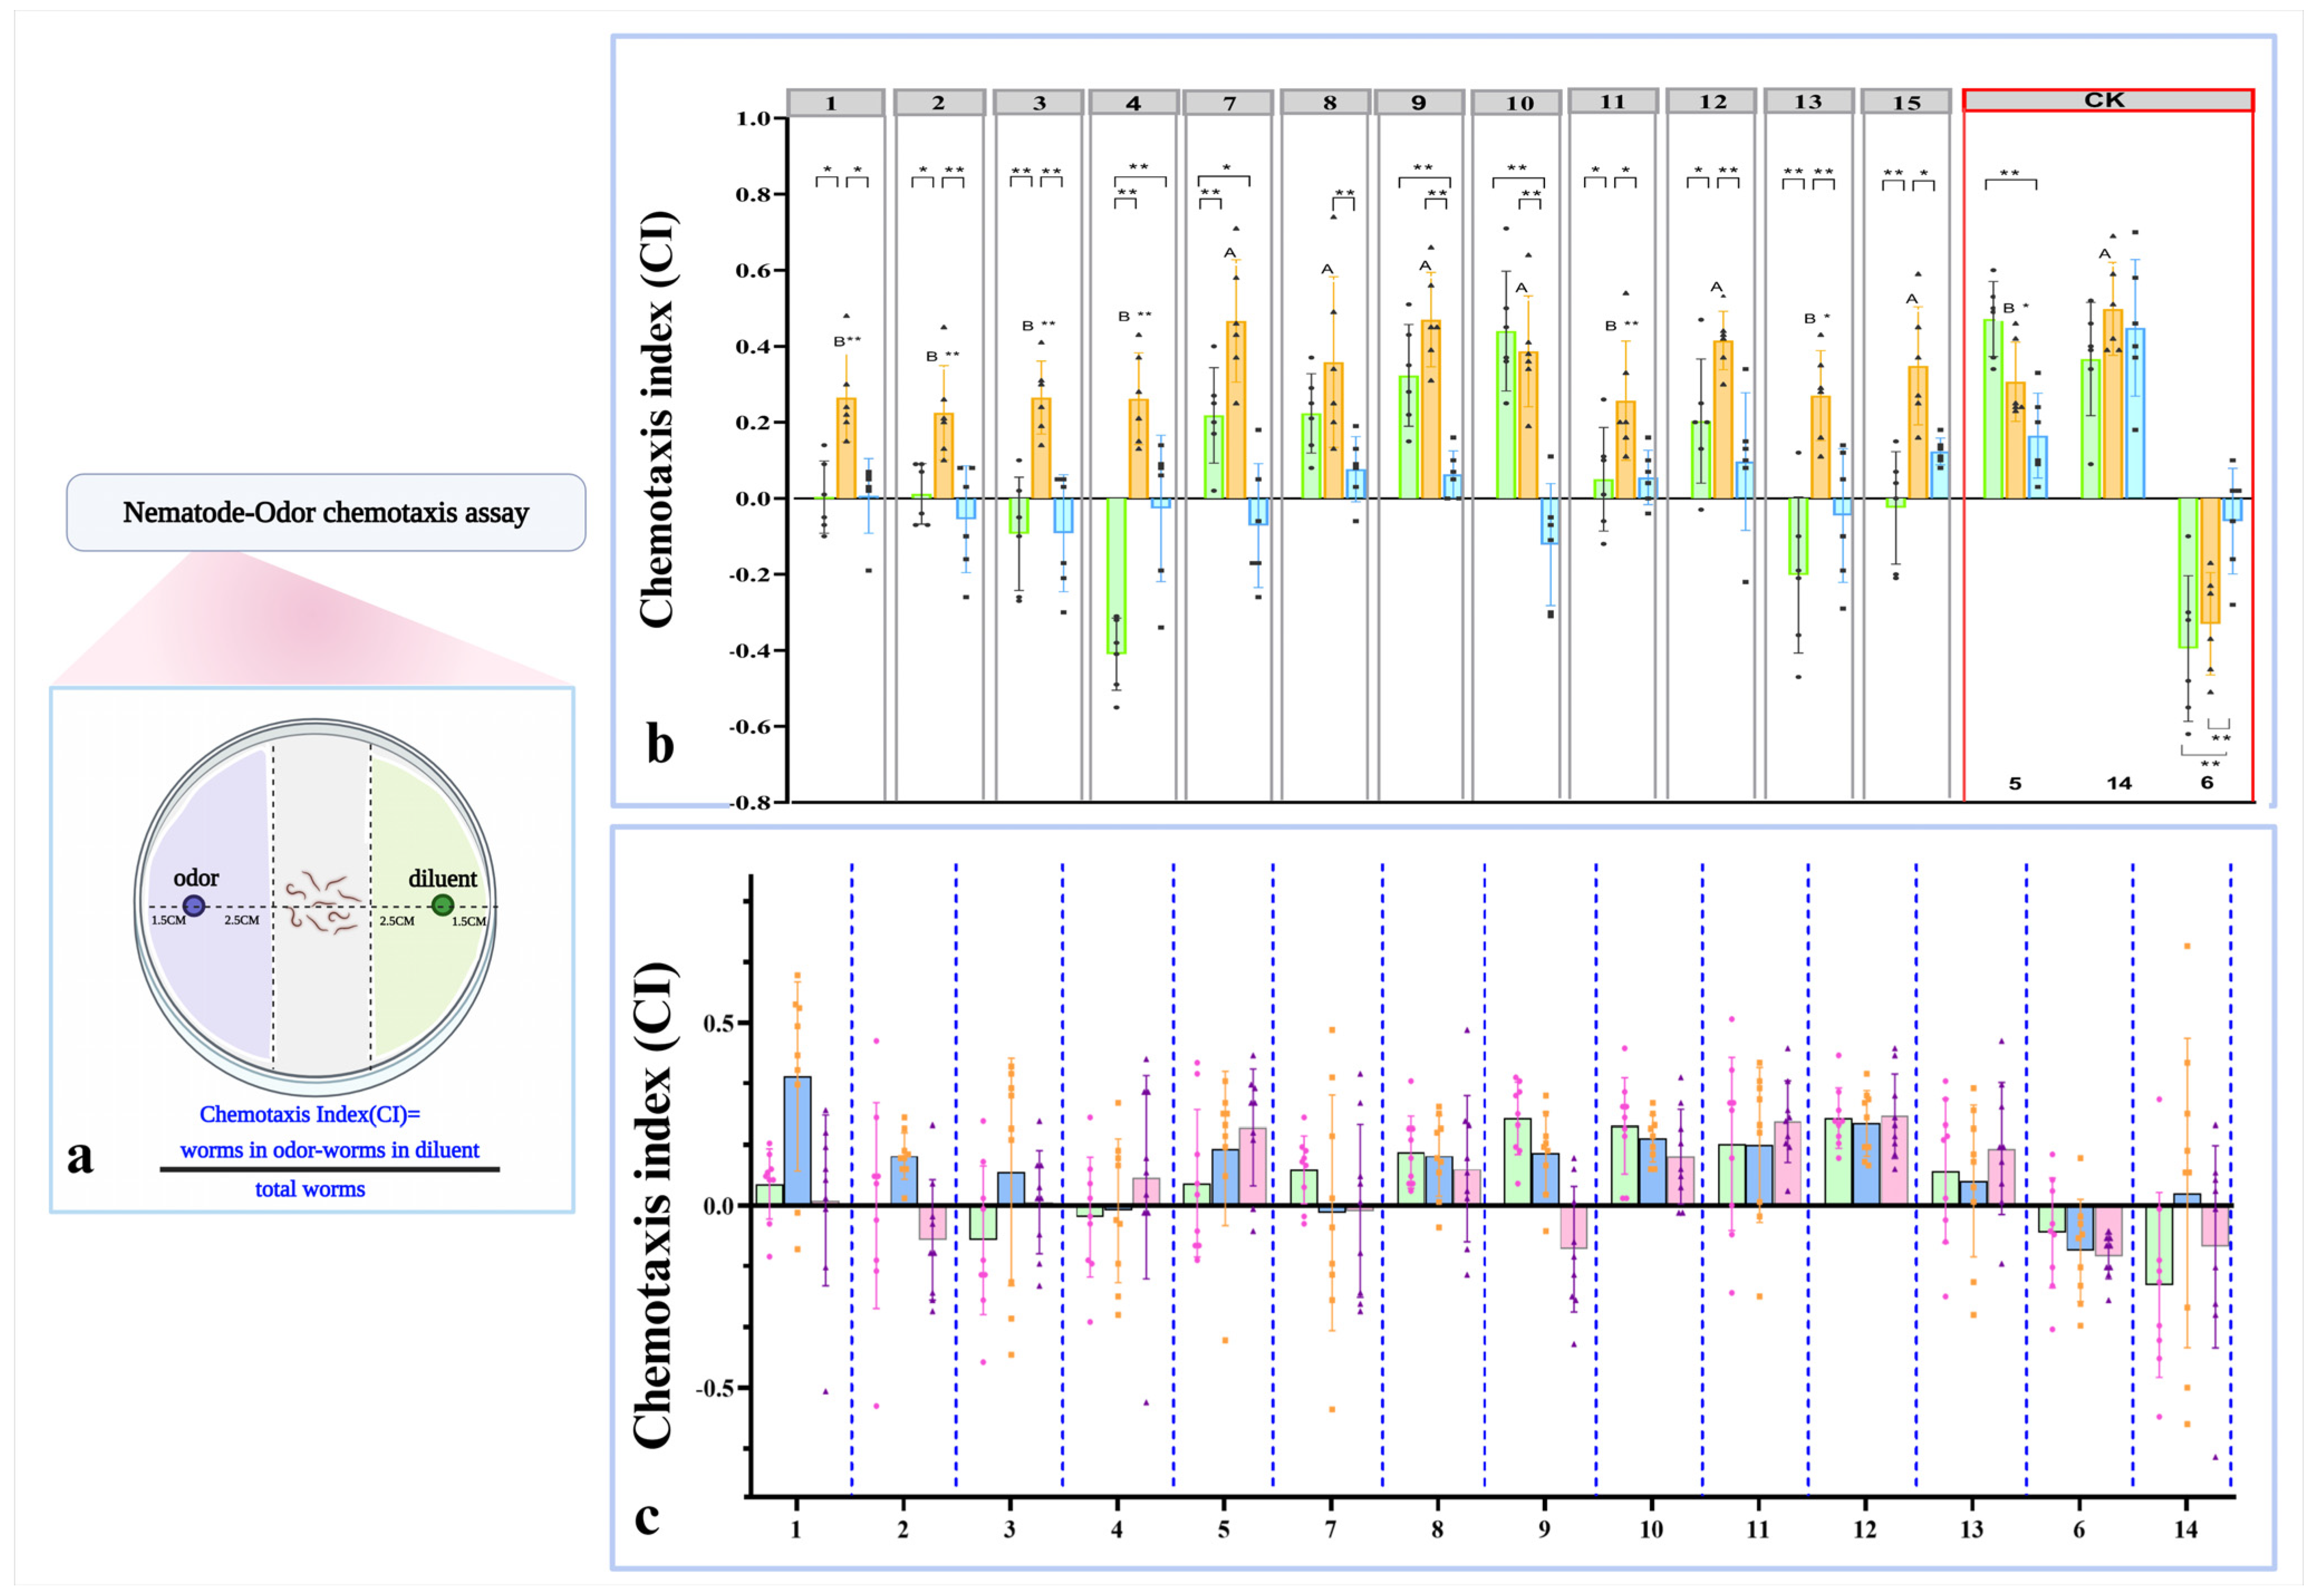
3.2. Volatile-Mediated Attraction of Nematodes by Preferred Bacteria

Here, we hypothesized that the bacterial isolates attracted nematodes by producing diffusible compounds which are attractive to the worms. We hence evaluated the chemotaxis of C. elegans using a modified chemotaxis assay based on three−division Petri dishes. In this version of the chemotaxis assay (Figure 3a), a bacterial isolate was grown in one of the three sectors of the dish, and C. elegans was added in a separate sector, where the worms were not in direct contact with the bacterial isolates; in this way, the added C. elegans could only sense the volatile odors and not the soluble ones produced by the bacterial isolates. Under these conditions, significant attraction of C. elegans toward the attractive bacterial isolates was still observed (Figure 3b). These data suggested that the volatile compounds released by the bacterial isolates are the possible sources attractive to C. elegans. Additionally, similar nematode preferences were also found for most of the preferred bacterial isolates in the bacterial odor two-choice preference assay (Figure 3c), as well as in the bacterial choice assay (Figure 3b). In both assays, C. elegans showed a preference for all of the tested isolates over E. coli OP50 (Figure 3d). Thus, the olfactory preference behavior of C. elegans for the preferred natural bacteria is likely based only on the volatile chemical cues. In summary, these results confirmed what we hypothesized in the first place that C. elegans are attracted to their preferred attractive bacterial isolates based on the volatile organic molecules that are produced by the bacterial metabolites.

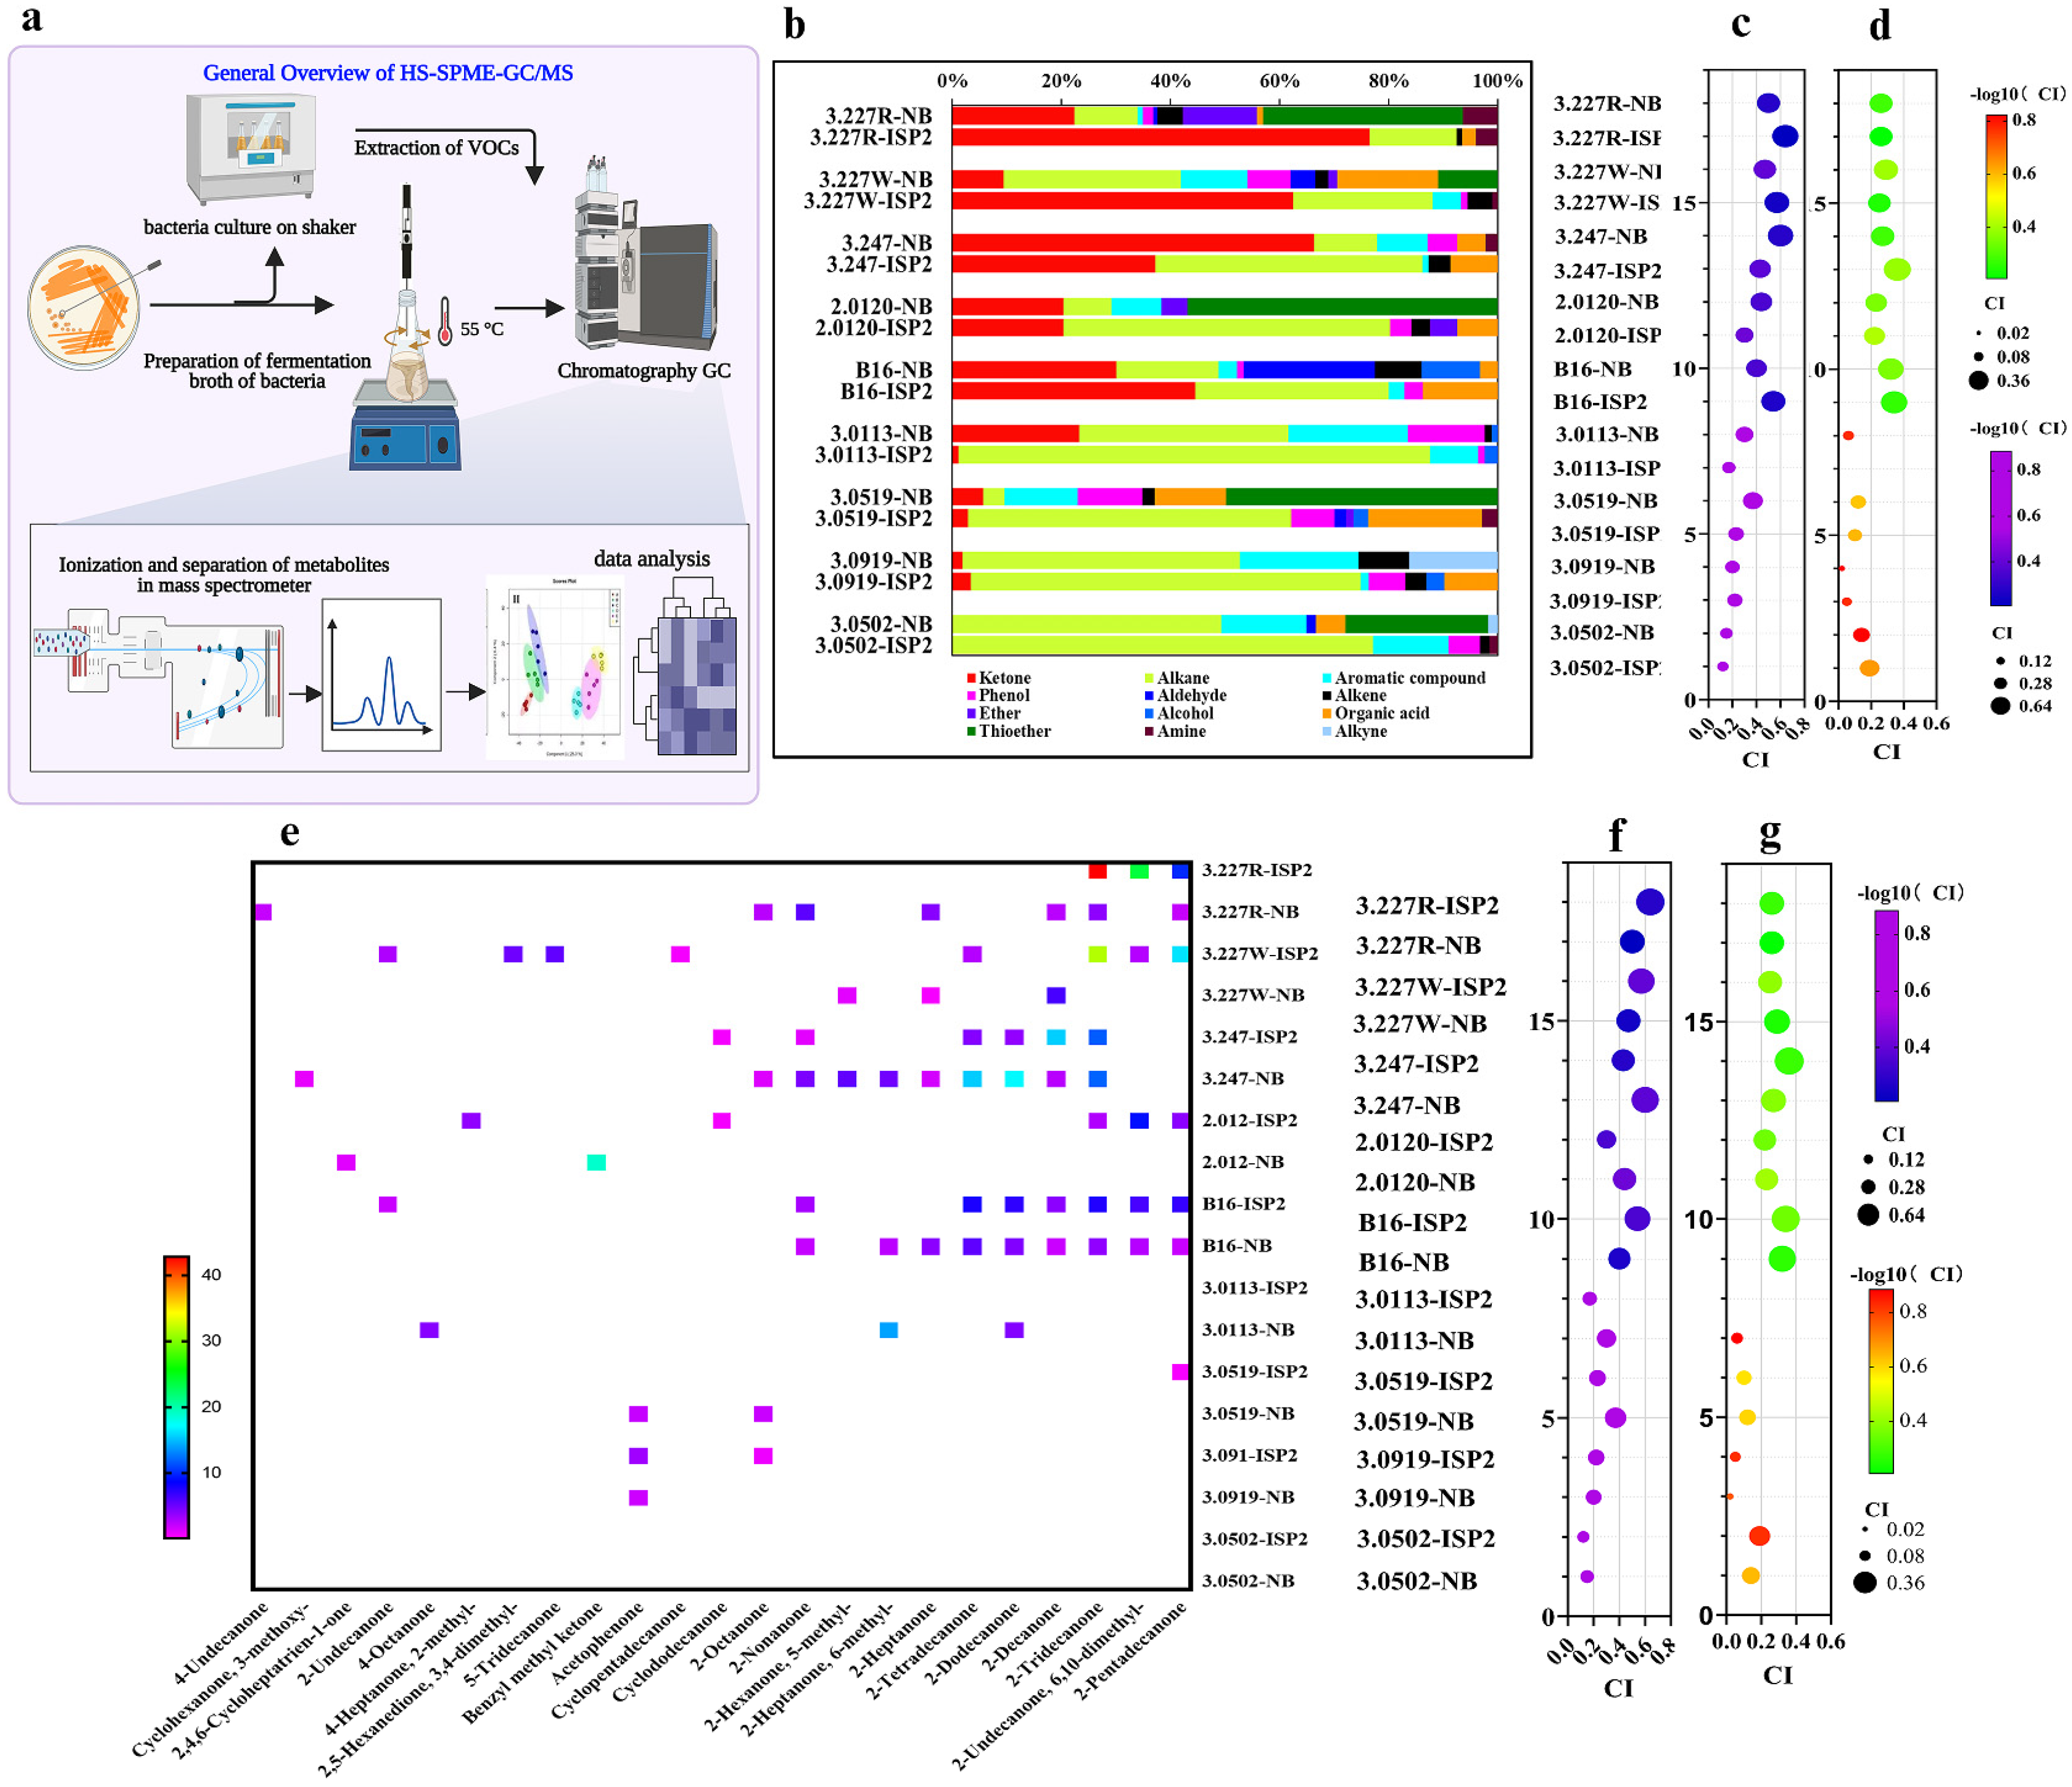
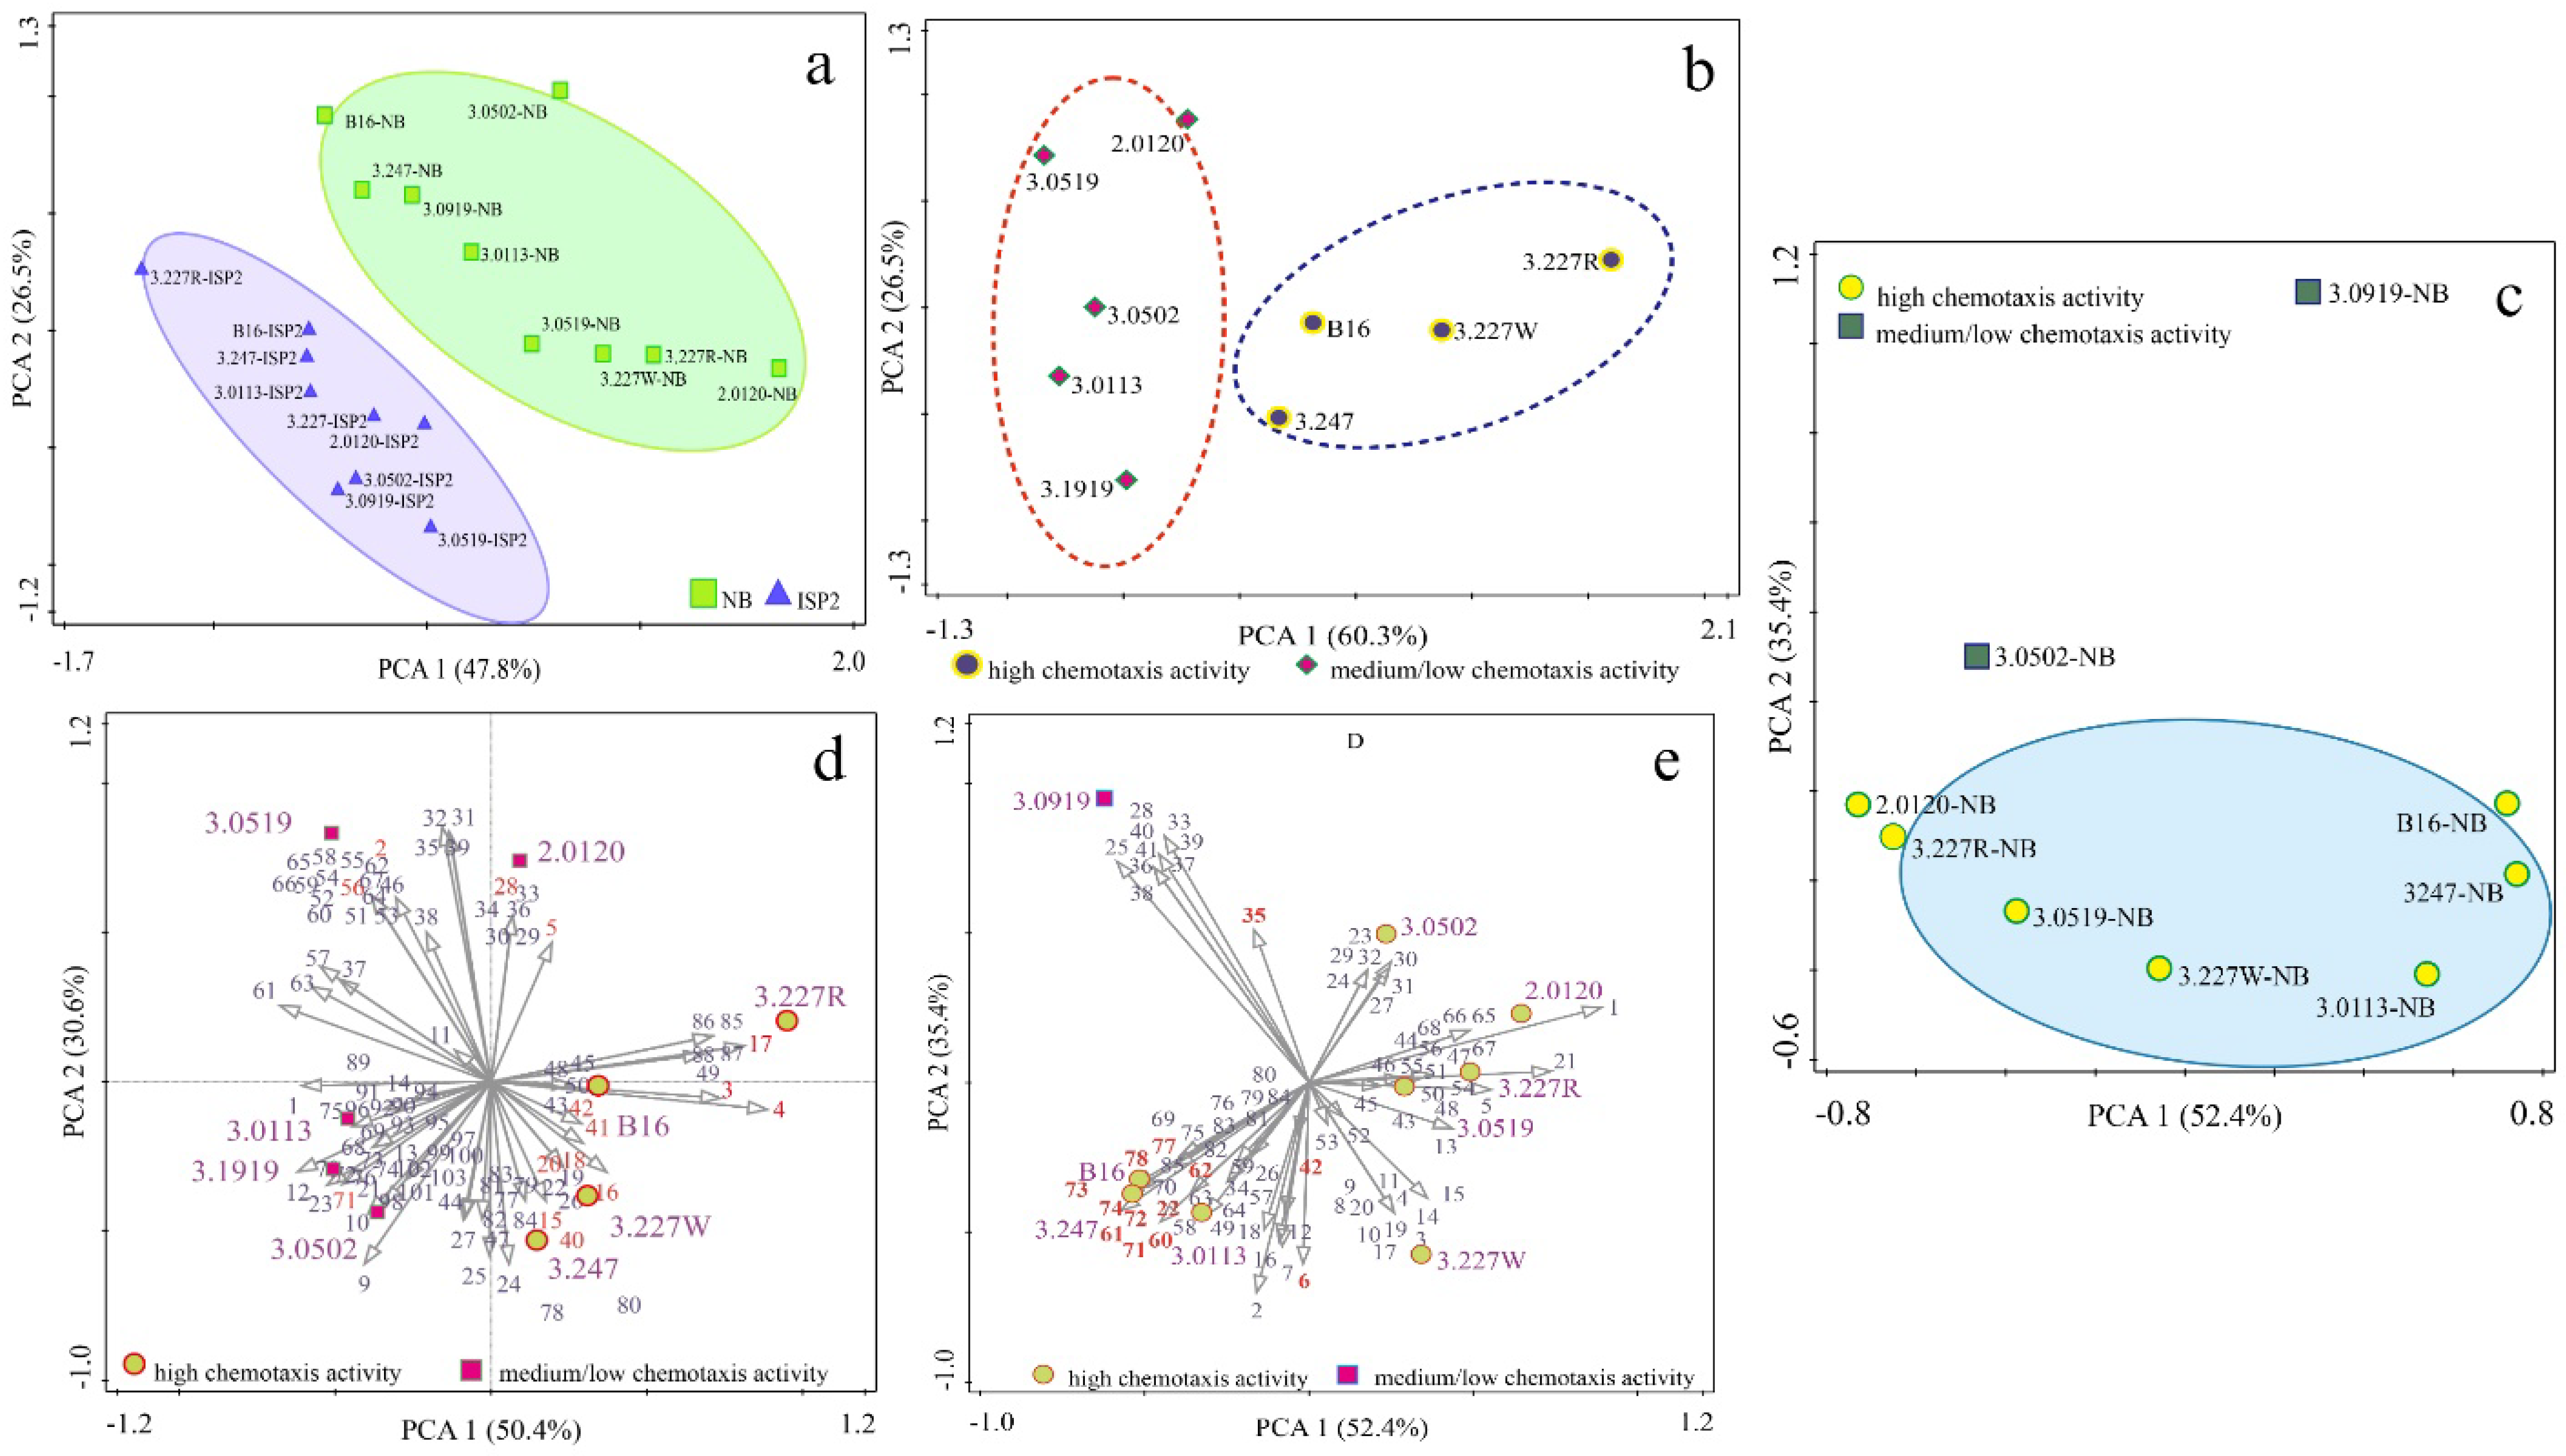
3.3. Identification of Volatile Profiles Released by Attractive Bacteria via HS-SPME-GC-MS

To understand the mechanism that the bacteria attract nematodes based on odorant cues, the identification of the bacteria-derived odorants was explored. In this part of the experiments, HS-SPME (Figure 4a) was used to sample the volatile compounds present in the headspace of the four strong attractive bacterial isolates, the four medium/weak attractive bacterial isolates, one positive control bacterial isolate B16, and the control vials-only medium. The total ion chromatograms (TICs) of the BVOC metabolites from the tested bacterial isolates are presented in Supplementary File S1: Figure S2.
As the result, a total of 191 distinct BVOCs were detected, representing more than 1% of total emissions across all the samples, with 88 compounds detected on the NB media and 103 compounds detected on the ISP2 media, consisting of aldehydes, alkane, alkene, ketones, acids, alcohols, aromatic hydrocarbons, esters, and phenol (Supplementary Tables S9–S11). The qualitative and quantitative composition of the BVOC profiles of bacterial isolates grown on the NB media and the ISP2 media was dramatically different (Figure 4b). These observations suggested that the difference in the BVOC profiles might be related to the difference in the media−triggered attraction of the tested bacterial isolates to the nematodes. We next compared the BVOC profiles released by the bacterial isolates grown on two different media and their strength of attraction toward nematodes. Interestingly enough, the diversity and amount of the bacteria−emitted ketone volatiles are seemingly positively correlated with the strength of the attractiveness of C. elegans and M. incognita (Figure 4b–d). It is worth noting that ketones were notably the most abundant element in the BVOC profiles detected in the strong attractive bacterial isolates 3.227 R (amounting to 76.48%), 3.227 W (amounting to 60.86%), and B16 (amounting to 44.14%) grown in the ISP2 media and isolate 3.247 (64.16%, 36.09%) grown in the NB and the ISP2 media (Supplementary Table S11). Additionally, the ketone volatiles comprised an appreciable amount of the elements in the BVOC profiles of the medium attractive bacteria, amounting to 22.29% of the total identified volatiles in isolate 3.0113 cultured in the NB media and 19.98% and 19.55% of the total identified volatiles in isolate 2.0120 cultured in both the NB and the ISP2 media, respectively. In comparison, the headspace of the weak attractive isolates (3.0519 and 3.0919) contained a low abundance of ketone BVOCs, and they were absent in the weaker attractive isolate 3.0502 (Supplementary Table S12).
In summary, that the abundance of ketones significantly increased in the headspace of the samples was related to the highly attractive bacterial isolates, while the abundance of ketones being absent was found in the weak attractive bacterial isolates, meaning that there was a specific correlation between the composition of BVOC profiles and the strength of attractiveness of the tested bacterial isolates to C. elegans and M. incognita (Figure 4b–d).

3.4. Potent Correlation Between the Strength of Attractive Activity of Bacteria and the Composition of BVOC Profiles

In order to identify the volatile compounds that contribute to the strength of attraction of the tested bacterial isolates to nematodes, the 191 identified BVOCs were included in the principal component analysis (PCA) using the relative peak area of the individual metabolites. A preliminary experiment has been made to visualize the differences in the BVOCs’ composition of the isolates grown on a different medium through the PCA. It is shown that the first principal component (PC1) contributes to 47.8% and the second principal component (PC2) contributes to 26.5% of the total variance in the bacterial volatile peak area data (Figure 5a). The scatter plot obtained from the PCA (Figure 5a) showed a clear separation among all the studied bacterial isolates into two groups, one composed of bacterial isolates cultured on the NB media and the other cultured on the ISP2 media. This separation suggested that the BVOC profiles emitted by the bacterial isolates depend strongly on the culture medium.
To better visualize the difference in the BVOC profiles that are related to the strength of attraction of bacterial isolates to C. elegans, BVOCs profiling of bacterial isolates was further analyzed by assessments on different culture conditions (ISP2 and NB). As a result, for bacterial isolates grown on the ISP2 media, two clusters of the isolates were statistically distinguishable by attractiveness (high and medium/weak) based on the BVOCs’ composition (Figure 5b), confirming that the distinct difference in the bacterial isolate BVOC profiles is related with the different levels of attractiveness. The variability expressed by the first two components is mostly associated with a reduced ketone array. Specifically, cluster 1 (blue circle) was composed of bacterial isolates with a high abundance of ketone, while cluster 2 (red circle) belonged to the medium/weak attractive group. For instance, 3.0502 and 3.0919 had less intense ketone BVOC profiles (Supplementary Table S12). Regarding the bacterial isolates grown on the NB media, differences in the BVOC profiles were also found (Figure 5c). This confirmed that there were differences between the different levels of attractiveness of the bacterial isolates as they were clustered into different groups according to their strength of attractiveness. Interestingly, the results from the PCA score plots (Figure 5a) demonstrated that all the groups were clearly separated.
The BVOCs identified in a given area of the loading plot characterize the isolates found in the same position in the corresponding score plot (Figure 5b,c). To further explore the potential differential compounds contributing to the discrimination of the BVOC profiles among the isolate groups and leading to the different attractiveness of C. elegans, the corresponding loadings were plotted (Figure 5d,e). Clearly, the compounds of the ketone classes highlighted in red bold, namely, 2-Pentadecanone, 2-Tridecanone, 6,10-dimethyl-2-Undecanone, 3,4-dimethyl-2,5-Hexanedione, 2-Tetradecanone, 2-Undecanone, 5-Tridecanone, 2-methyl-4-Heptanone, 2-Decanone, 2-Dodecanone, 2-Nonanone, 1-cyclododecyl-Ethanone, and Acetophenone (Figure 5d: 3, 4, 5, 15, 16, 17, 20, 28, 40, 41, 42, 56, 71), were inferred to be major contributors to the discrimination of the different attractiveness levels of the isolates cultivated on the ISP2 media. Similarly, 2-Decanone, 5-methyl-2-Hexanone, Acetophenone, 2-Octanone, 6-methyl-2-Heptanone, 2-Dodecanone, 4-Octanone, 2-Tetradecanone, 2-Tridecanone, 2-Nonanone, 2-Heptanone, 2-Undecanone, and 2-Pentadecanone (Figure 5e: 6, 22, 35, 42, 60, 61, 62, 71, 72, 73, 74, 77, 78) were inferred to be major contributors to the discrimination of the different attractiveness levels of the bacterial isolates cultivated on the NB media. According to the loading plots, the discrimination was mostly explainable by a higher amount of BVOCs related to ketone. The visual analysis of the loading plot (Figure 5d) suggested that the bacterial isolates cultivated on the ISP2 media with high attractiveness are richer in ketones. The loading plots, which corresponded well with the score plots, demonstrated that ketones greatly contributed to the different attractiveness levels of the tested bacterial isolates to C. elegans.

3.5. Heatmap Visualization for Contribution of Ketone Volatiles to the Attraction of Investigated Bacteria to Studied Nematodes

To further evaluate the contribution of the ketone volatiles to the attraction of bacterial isolates to the nematodes, heatmap analyses were further conducted to compare the differences in the amounts of ketones in the BVOC profiles that were identified from the tested bacteria (listed in detail in Supplementary Table S12). Heatmap visualization (Figure 4e) depicted the obvious association between the amounts of ketone compounds and the strength of attraction of bacteria to C. elegans (Figure 4f) and M. incognita (Figure 4g). For the highly attractive bacterial isolates (3.227 R, 3.227 W, 3.247, B16) grown on the ISP2 media, the relative amount of ketone exhibited the most pronounced increase in the heatmap dendrogram as compared with those in the weak attractive bacterial isolates (3.0502, 3.0919), ranging from 0 to 76.48. Similarly, significant increases in the amount of the discriminating ketone BVOC profiles were also observed for the highly attractive bacterial isolates (3.247, B16, 3.227 R) grown on the NB media. Consequently, heatmap visualization unveiled that the bacterial isolates with high attractiveness have distinct BVOC profiles characterized by the abundance and high amount of ketone volatiles compared with the weak/zero attractive bacterial isolates. Meanwhile, the ketones were inferred to be a major contributor to the attractiveness of bacteria to nematodes.

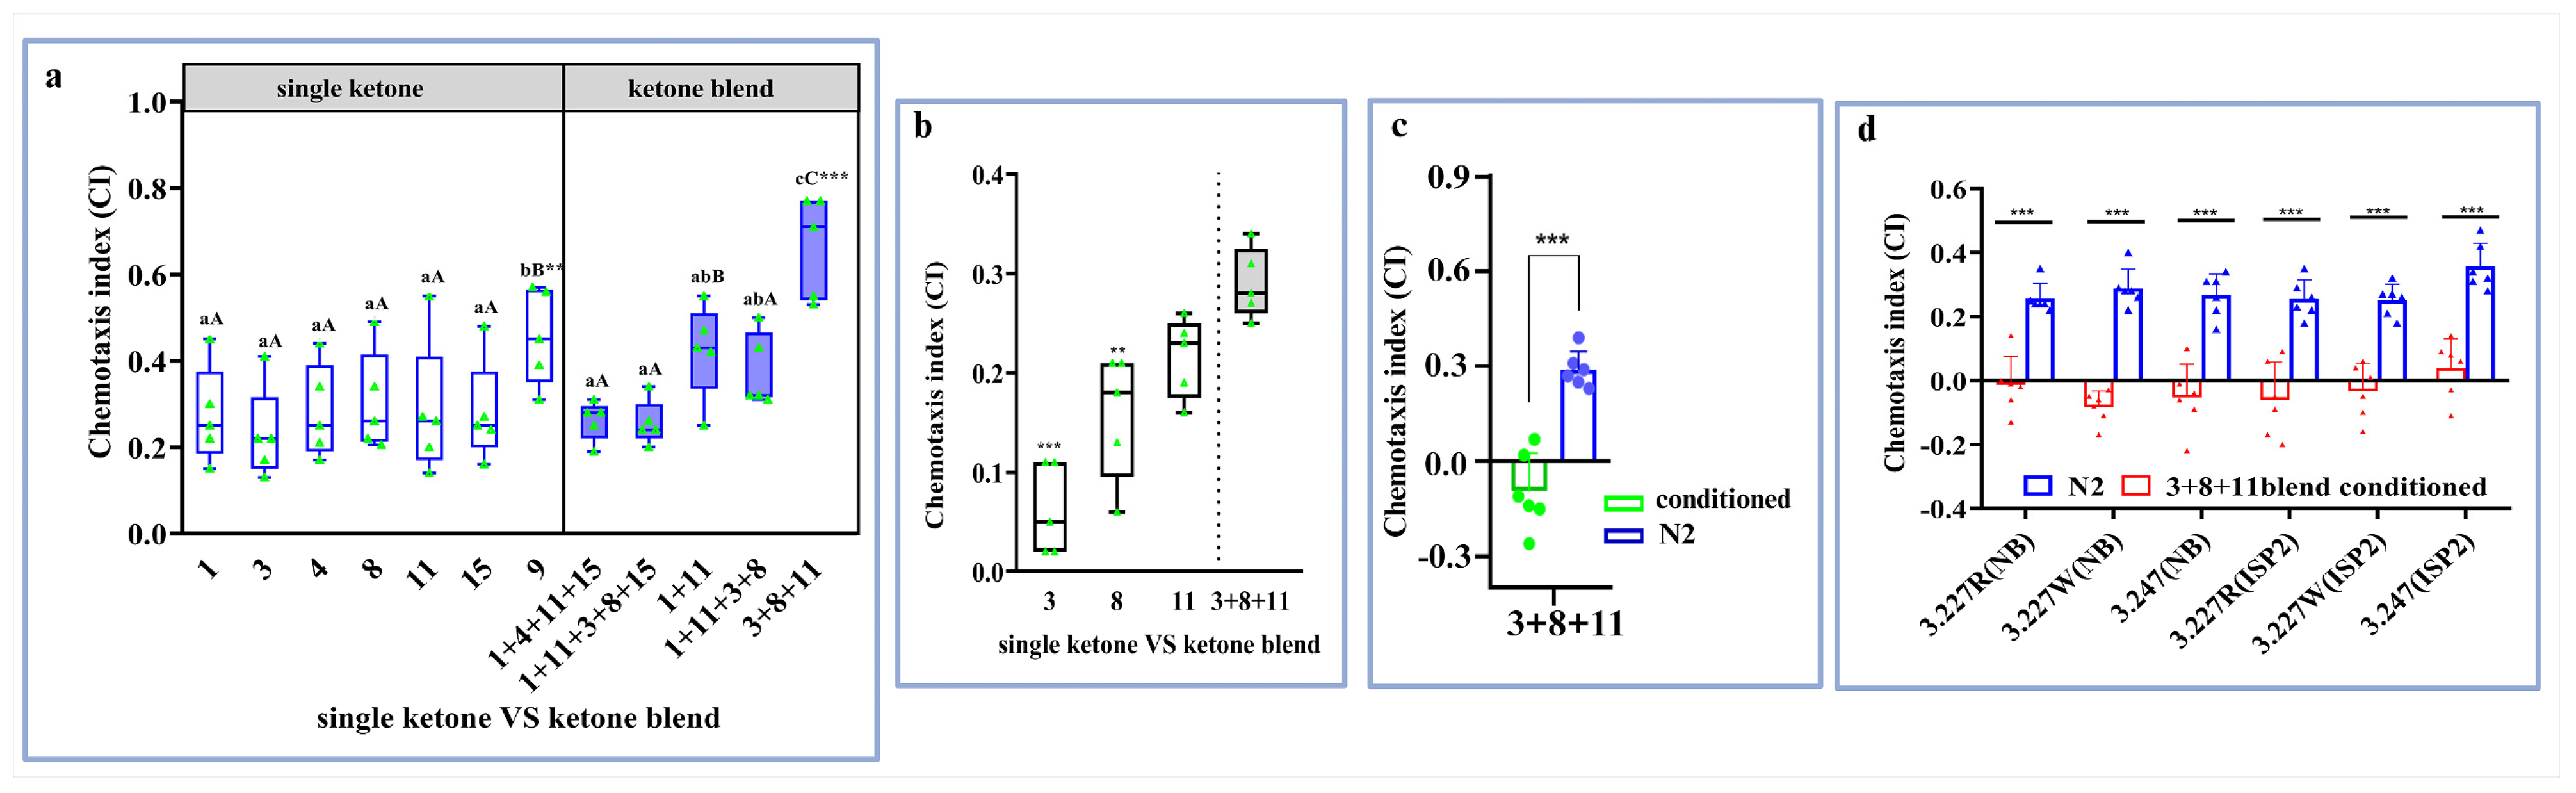
3.6. Ketone Volatile Blend Contributes to Attractiveness of C. elegans and M. incognita to the Preferred Bacteria

In this part of this study, we firstly tested the attractive behavior of C. elegans to each of the 12 candidate ketone compounds in the BVOC profiles released by the preferred bacteria using odor chemotaxis assays (Figure 6a). As a starting point, we picked IAA (Isoamyl alcohol) and DD (Dimethyl disulfide), two known attractants, as the positive control and 2-nonanone, a known repellent, as the negative control [25,26,27]. In this experiment, worms showed strong attraction to the concentration of 500 mgL−1 of IAA and DD, as well as strong repellence to the concentration of 500 mgL−1 of 2-nonanone, as previously reported [8,28]. The chemotactic response of C. elegans was statistically significant for different ketone compounds and among different concentrations of each compound (Figure 6b). In general, C. elegans responded with attractive behaviors to a serial concentrations of ketone compounds in a concentration-dependent manner (Figure 6b). The maximum attraction to almost all of the tested ketone compounds and the greater attraction toward positive control compounds peaked at the concentration of 500 mgL−1. Particularly, the high level of attractive response evoked by some ketone compounds appeared to be analogous to the well-known attractiveness of C. elegans to DD, a positive control in chemotaxis assays (Figure 6b).
To evaluate if M. incognita also responds to the ketone odors emitted by preferred bacteria, we tested the chemotaxis behavior of M. incognita. In this study, we observed that M. incognita displayed a certain extent of concentration-dependent attraction toward the tested ketone BVOCs (Figure 6c). M. incognita showed its highest average attraction to the ketone compounds at the concentrations of 5000 mgL−1 (in Figure 6c: compound 7, 9, 10) and 500 mgL−1 of the ketone compounds (in Figure 6c: compound 1, 3, 5, 8) compared to the concentrations of 50 mgL−1. Thus, M. incognita responded to the odors similarly as C. elegans, suggesting that this attraction behavior to the derived ketones by the preferred bacteria may be shared between the two nematode species.
Next, we looked into different blends of shared ketone compounds by the preferred attractive isolates to worms at the approximate concentrations (500 mgL−1) detected in odor chemotaxis assays (Figure 6a). Interestingly, the attraction of worms to blend 3 + 8 + 11 (3 = 2-Pentadecanone; 8 = 6, 10-dimethyl-2-Undecanone; 11 = 2-Tridecanone) was significantly higher than each of the individual constituent compounds, even the maximum attractiveness of 5-methyl-2-Hexanone (the number 9 denotes this ketone in Figure 7a). In all the blend cases, only the blend 3 + 8 + 11, which contains all the three ketones detected in most of the preferred isolates (3.227 R, 3.227 W, 2.0120, B16), significantly increased the attractiveness of worms, whereas the other blends shared by the two isolates were not found to significantly increase the attractiveness of the nematodes in comparison with the single ketone compounds alone (Figure 7a).
The strongest attraction responses were similarly observed in M. incognita J2 to the ketone blend 3 + 8 + 11 (Figure 7b). To summarize, the three ketone components are very likely to be responsible for making the preferred bacteria more attractive to the nematodes.

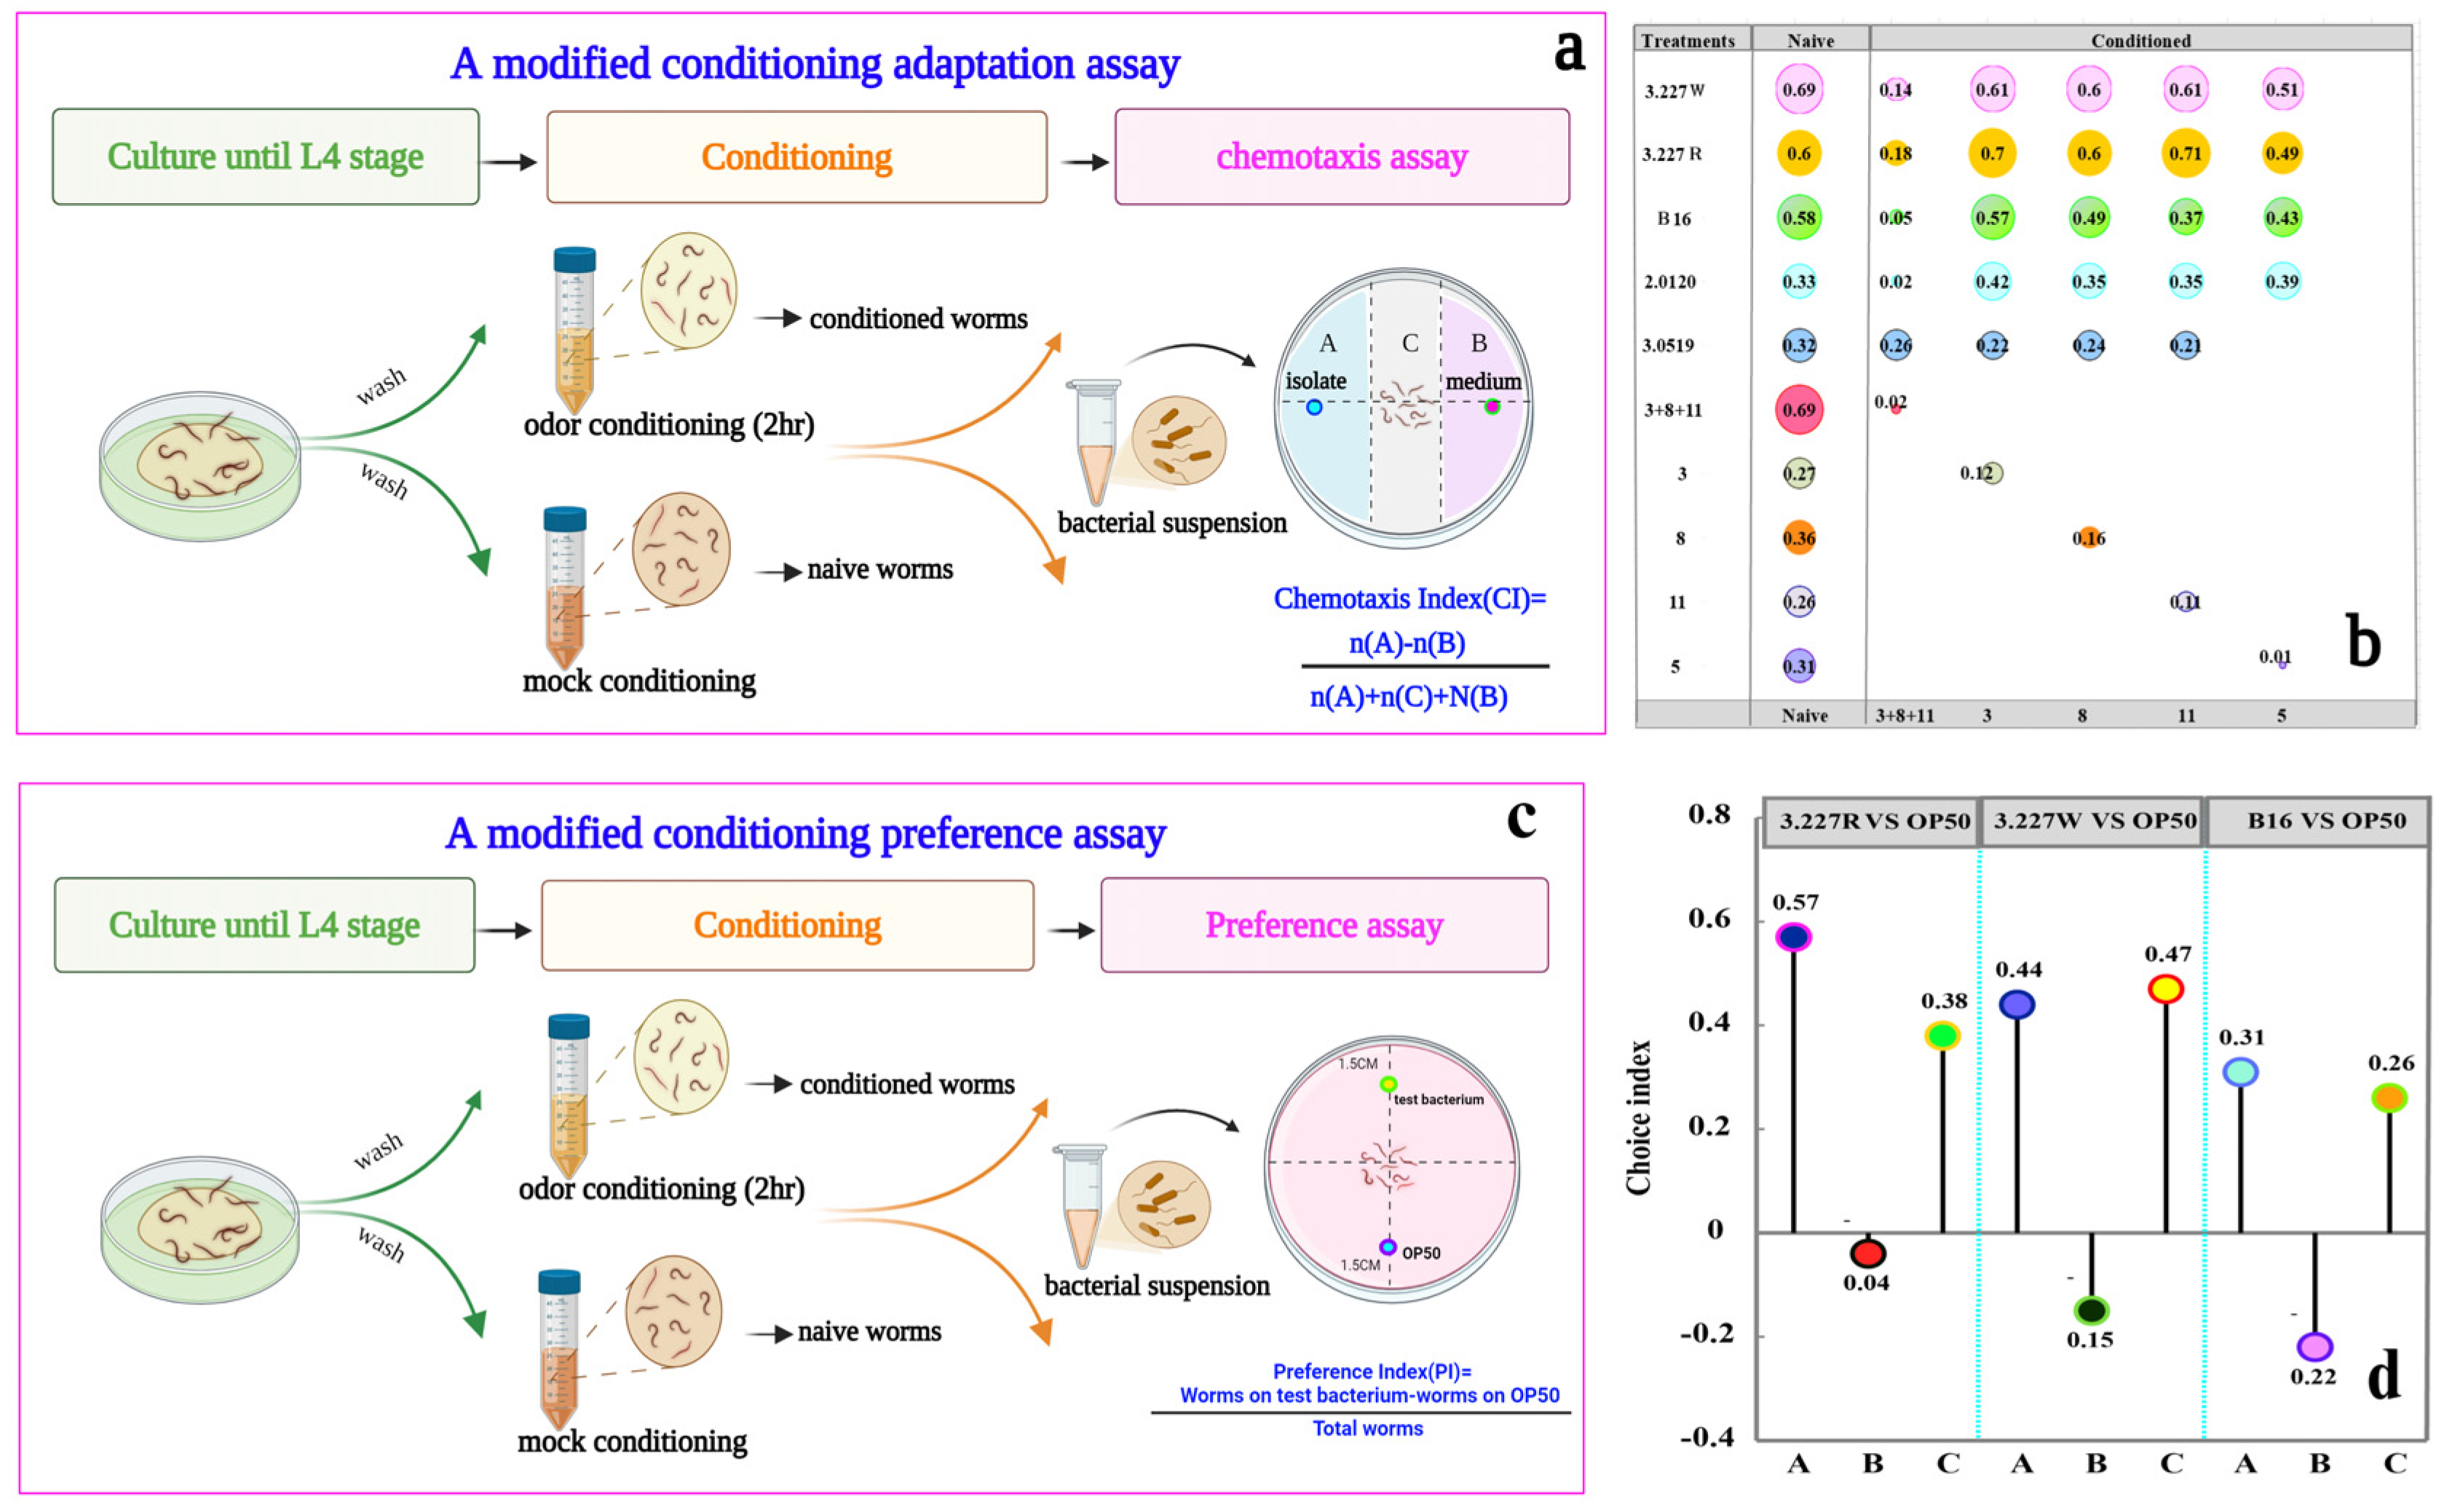
3.7. Ketone Odor Blend Adaptation Contributes to Bacterial Adaptation in C. elegans

This part of the experiment aimed to examine that ketone is indeed a genuine molecule naturally produced by attractive bacteria toward nematodes. The possibility of ketone being an inherently attractive odor in the BVOC profiles released by the bacteria was also investigated in this part of the experiment. Thus, a modified version of a conditioning adaptation assay was conducted. In brief, C. elegans L4 was conditioned for 2 h in scenarios corresponding to the combinations of food deprivation with exposure to the ketone blend or a single component in the ketone blend. After conditioning, the ketone-adapted worms were assayed for chemotaxis behavior to the attractive bacteria grown on the ISP2 media by calculating the chemotaxis index (Figure 8a).
Before conditioning, WT worms were strongly attracted toward the bacterial isolates and showed a highly positive CI (Figure 8b). As expected, after pairing food deprivation with exposure to ketone blend 3 + 8 + 11, the attraction of worms toward isolates was attenuated dramatically, resulting in a significantly decreased CI. In contrast, the attractive behavior of worms to the tested bacteria was not altered when food deprivation was combined with each individual component (3, 8, and 11) in the ketone blend compared to the behavior of WT worms that were starved in the absence of the odorant (Figure 8b). Remarkably, the effects of pre-exposing C. elegans to ketone odor blend 3 + 8 + 11 were much more pronounced than each individual component (3, 8, and 11) in the ketone blend. Not only was the attractive behavior of worms lost but the pre−exposed C. elegans exhibited an avoidance behavior to the preferred bacteria.
However, each individual component (3, 8, and 11) in the ketone blend 3 + 8 + 11-exposed worms exhibited a similar CI to the preferred bacteria compared with WT worms. Similarly, the attractive behavior of M. incognita to ketone blend 3 + 8 + 11 (Figure 7c) and the tested bacteria (Figure 7d) was also altered when conditioned with ketone odor blend 3 + 8 + 11. We next set out to explore whether the attenuation of attraction to bacteria grown on the ISP2 media was specific for the ketone odor blend 3 + 8 + 11 adaptation. The possibility that IAA could affect bacterial attraction to C. elegans was also tested. In this experiment, IAA, a known odor attractive to C. elegans [29], was not detected in the BVOC profiles of the tested bacteria grown on the ISP2 media. The IAA pre-exposure had no effect on the attraction of C. elegans to the bacteria grown on the ISP2 media (as shown in Figure 8b: number 5 represents IAA compound). Thus, the adaptation response of C. elegans to the tested bacteria was specific to the ketone odor blend 3 + 8 + 11 conditioning.
This observation prompted the possibility that the behavioral adaptation to the ketone odor blend may also evoke an altered preference of the tested bacteria vs. OP50 in C. elegans. Therefore, the worms were conditioned by the ketone odor blend 3 + 8 + 11 with food deprivation for 2 h, and then the preference of the worms to bacteria over OP50 was quantified with bacterial two-choice preference assays (Figure 8c). Wild−type worms preferred the tested bacteria in comparison with OP50. It was noticed that the preference for tested bacteria was lost when worms were conditioned in ketone odor blend 3 + 8 + 11 with food deprivation (Figure 8d). In contrast, the preference for isolates was retained when worms were conditioned with IAA and in the absence of food (Figure 8d: letter C at the bottom represents IAA compound). In conclusion, ketone odor blend 3 + 8 + 11 adaptation also contributed to the attenuation of preference on the isolates vs. OP50 in C. elegans.

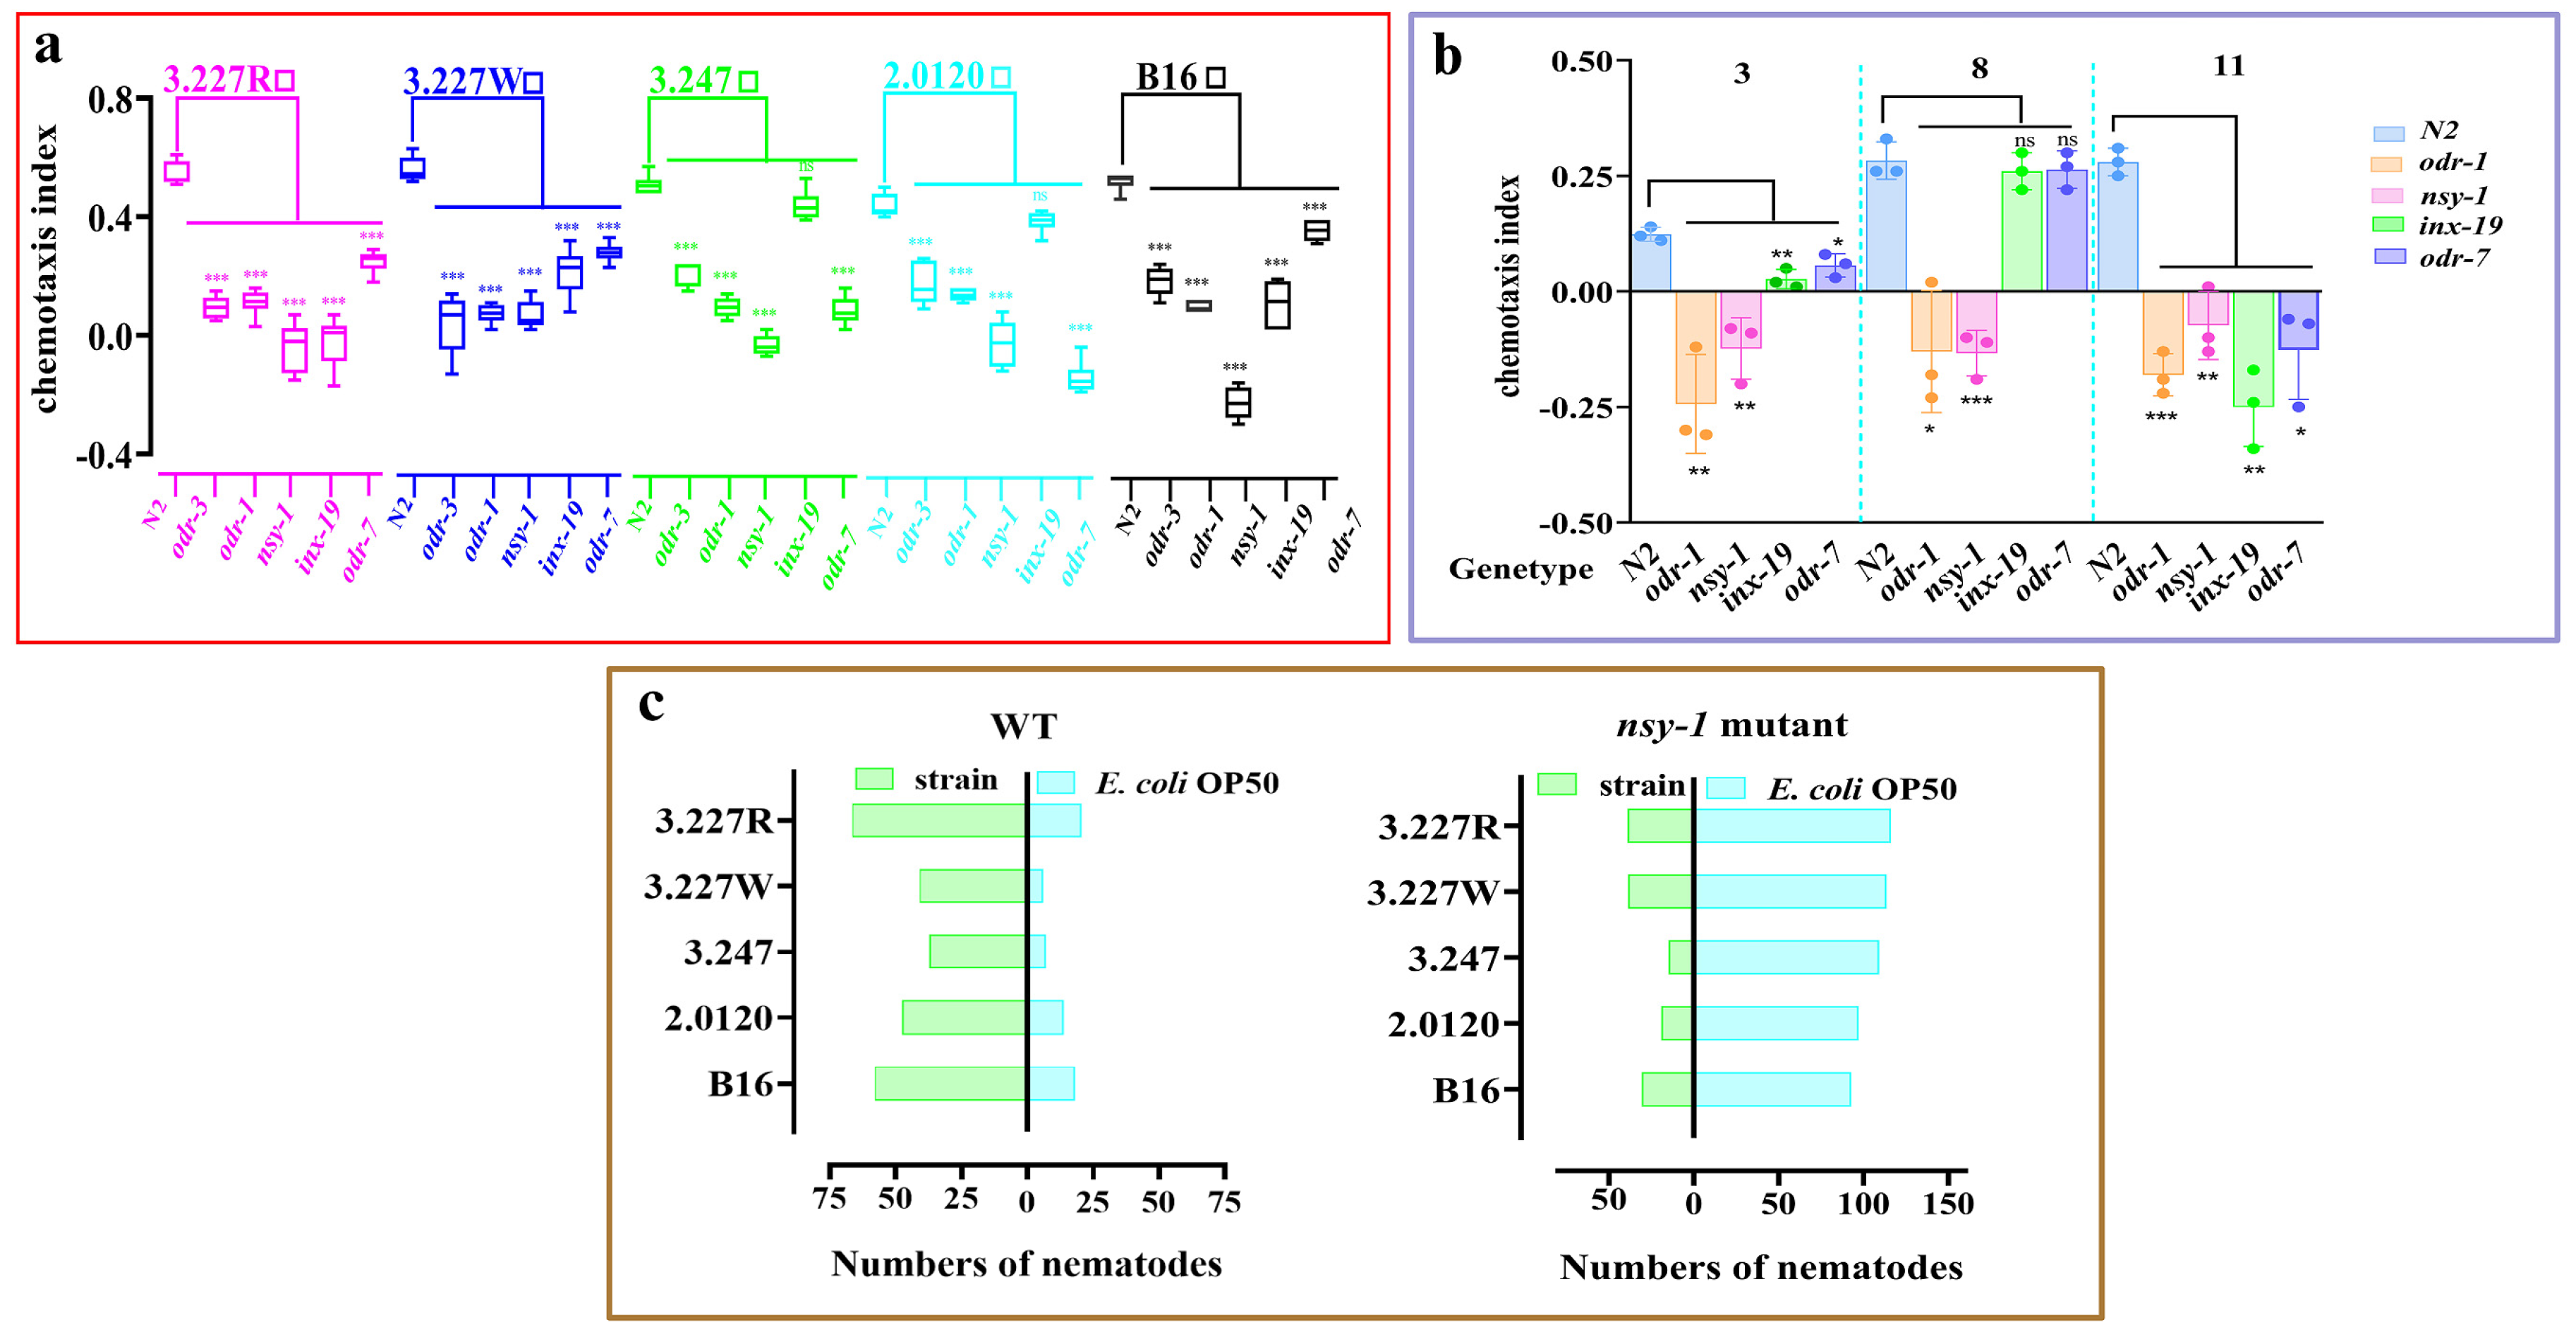
3.8. Identification of Sensory Neurons Involved in Detection of the Preferred Bacteria and Their Released Ketone Volatiles

We next sought to determine the C. elegans olfactory neurons responsible for sensing the ketones emanating from the preferred bacterial isolates and for mediating the attraction of C. elegans to these bacterial isolates. There are 12 pairs of amphid chemosensory neurons in C. elegans [5]. Among these chemosensory neurons, we focused on the AWC and the AWA classes of olfactory neurons in chemotaxis of the preferred isolates (3.227 R, 3.227 W, 3.247, 2.0120, B16) and their derived ketone odorants. This is because these two pairs of neurons are responsible for detecting many volatile attractants in C. elegans [12]. It is documented that the transmembrane guanylyl cyclases ODR-1 and ODR-3 encode a protein that mediates the function of sensory neurons [30]. These sensory neurons are essential for the normal responses to all AWC-sensed odorants [31]. ODR-7, a nuclear hormone receptor, is required for the AWA neurons to express olfactory signaling molecules [32]. The AWC neuron pair consists of 2 cells, AWCON (NSY-1) and AWCOFF (INX-19), which can express different chemoreceptor genes and sense partly overlapping sets of odorants [33,34,35]. Hence, the chemotaxis indexes of odr-1, odr-3, odr-7, nsy-1, and inx-19 mutants for the preferred bacteria and the ketone odors were tested. The results showed that none of the odr-1, odr-3, nsy-1, or odr-7 mutants were attracted to the tested bacteria (Figure 9a), indicating that a defect in olfactory neurons of either the AWC or the AWA impedes the sensing of the preferred isolates. Importantly, it is noted that AWCON is inhibited by every preferred bacterial isolate (Figure 9a). Most chemosensory neurons exhibited ON-type responses to most odorants [36]. We confirmed this result and in addition found that the nsy-1 mutants affecting the AWCON neuron function failed to generate attractive response for all of the tested isolates (Figure 9a), suggesting that AWC produced ON-type responses to all of the preferred isolates. Since nematodes can generate a ketone-dependent attractive response to the preferred isolates, we hypothesized that the ketone-responsive receptor is expressed in the olfactory neurons of either AWA or AWC. We then examined the effect of AWA/AWC mutants on the chemotaxis of shared ketone odors (2-Pentadecanone; 6, 10-dimethyl-2-Undecanone; 2-Tridecanone) by the preferred isolates. The mutation of AWCON caused a significant defect in the attraction of all of the tested ketones (Figure 9b). On the other hand, the AWCON mutation also altered the preference of the tested bacteria to OP50 (Figure 9c). This suggested an important role for the sensory neuron AWCON in detecting ketone odors. In conclusion, the AWCON neurons are important for worms to respond to the preferred bacteria and their derived ketone BVOCs.

4. Discussion

In this study, we provided a first evaluation of the chemotactic response of both C. elegans and M. incoginta to phylogenetically diverse bacteria isolated from different environments (Supplementary File S1: Tables S1 and S2). We also described a previously unknown repertoire of bi-attractive bacterial population to the nematodes. Our study suggests that the studied nematodes appear to share attraction behaviors to the related bacteria across different nematode species (Supplementary File S1: Figure S1 and Supplementary Table S3). Then, we demonstrated that the overproduction of ketones in the BVOC profiles is associated with the increased attractiveness of the nematodes to the preferred attractive bacteria from a range of natural environments. Further, we have provided evidence that the attractiveness of nematodes to their preferred bacteria arises specifically from a ketone odor signaling mechanism, a phenomenon not reported previously. This is highlighted by the identification of a ketone blend responsible for the attraction of the preferred bacteria to nematodes. We have also shown that there is an involvement of the AWCON neurons in the sensing of the preferred bacteria and bacteria−derived ketone volatiles. This, to the best of our knowledge, is the first time that a bouquet of ketone cues from the natural bacteria was reported to affect both C. elegans and M. incognita (Figure 6). Additionally, we observed significant attraction toward the preferred bacteria in other nematode species (Panagrellus redivivus) (Supplementary File S1: Figure S3). This result illustrated that the attraction toward the bacteria might be a shared behavior across different nematode species based on some similar sensory mechanisms. RKNs share the conserved positional sensory function and neuroanatomy with C. elegans [11,12,13]. Thus, C. elegans is uniquely suited for mechanistic studies of sensory-driven behavior in RKNs. We subsequently focused on bi-attractive bacteria to both C. elegans and M. incognita in our collection of attractive bacteria. We used C. elegans as a model organism in all subsequent experiments in order to dissect the molecular basis underlying the attractiveness of nematodes to the bacterial isolates.
Interestingly, our study has demonstrated that there was a difference in the attraction of the preferred bacteria to nematodes when the isolates were grown on different medium types, like on the NB type and ISP2 type (Figure 1). Then, we surveyed the BVOCs produced by the bacterial isolates grown on two different media using an HS-SPME-GC/MS method (Figure 4a). Our analysis revealed that the increases in the production of the ketone volatiles were associated with the strength of attractive or non-attractive individuals (Figure 4b–d). A marked difference between the levels of high, medium, and low attractive individuals was that the ketones were present in the highly attractive bacterial isolates but less or less absent in the lower or the non-attractive bacterial isolates (Figure 4). We consequently tested 12 ketones at various concentrations in a series of behavioral assays with C. elegans and M. incognita because of their positive correlations with the strength of the attraction of the preferred bacteria to the nematodes. This is the first description of a shared attractiveness, for both C. elegans and M. incognita, to a panel of the ketones released by bacteria, most of which are unknown RKN attractants.
In parallel, we observed that the ketone-dependent attractiveness displayed a concentration-dependent manner (Figure 6), which is in agreement with the general characteristic of the behavioral response for single odors in flies, mosquitos, and nematodes [37,38,39]. In C. elegans, it was documented that the same odor could invoke different responses depending on the concentrations. That is to say that low concentrations of the odor are attractive, but high concentrations of the same odor become less attractive or even aversive [6,40] (Choi et al., 2016; Taniguchi et al., 2014). Therefore, investigations of ketone odor-mediated attractive behavior require knowledge of specific chemical components of complex bacterial odors that act as powerful attractants and of their appropriate concentrations. Nevertheless, this marks the first instance of a bouquet of ketone-based attractants being secreted from diverse bacteria to nematodes. Interestingly, the structural features of the ketone moieties might be important for the attractiveness of nematodes to a panel of ketones. Previous research has shown that the structure feature of odors is very important for affecting chemotaxis behavior in C. elegans, since key chemical moieties along with sensory neurons are required for cross-kingdom interactions between C. elegans and Vibrio cholerae [41]. It is possible that the specific moiety in the ketone odors may be the key feature driving the ketone-mediated attractiveness to both C. elegans and RKNs. It would be very interesting to decipher the ketone chemical structure for the optimal attraction to better understand the perception mechanisms and its cognate RKNs chemoreceptor.
As described above, the bacterial-released ketone volatiles were shown to be attractive to the nematodes. However, it is unknown whether the ketone-mediated attractiveness of the nematodes to the preferred bacteria is based on some key component blends or a single unique component. Therefore, the effect of blends of ketones on the attractiveness of the nematodes was investigated in order to clarify the chemosensory basis underpinning the attraction of the preferred bacteria in the nematodes. We then documented that the synergistic of the ketone components 3 + 8 + 11 (3 = 2-Pentadecanone; 8 = 6,10-dimethyl-2-Undecanone; 11 = 2-Tridecanone) could be responsible for making the preferred isolates more attractive to the nematodes (Figure 7 and Figure 8). This indicated that the ketone-modulated synthetic effect on the attractive behavior of the nematodes depends on an odor blend emitted by bacteria in the right context. Interestingly, all the attractive ketone compounds in blend 3 + 8 + 11 were detected in the highly attractive preferred bacterial isolates to the nematodes (Figure 4). Considering the role of chemosensation in the successful parasitism of RKNs, the perturbation of nematode sensory perception has become an innovative route for RKNs’ control. Nematode chemotaxis is tightly associated with microorganisms that colonize the rhizosphere and soil. Many chemicals from microorganisms that play a role in chemotaxis are being revealed [42]. These attractants found in this study have potentials for use in RKNs’ control and may serve as nematode trap constituents combined with chemical or biological nematicides, or as compounds applied to the soil to disrupt nematodes’ host location.
Signaling by AWC olfactory neurons is necessary for the attractive response of C. elegans to 2-heptanone, an odor associated with a nematicidal bacterium Bacillus nematocida B16 [24]. Consistent with previous reports, we also observed that AWCON responded to all the preferred bacterial isolates, which strongly supports that the AWCON neurons are essential for sensing bacteria−derived ketone odors and thus driving the attraction of the nematodes to their preferred bacterial isolates (Figure 9). Consequently, we assumed that the AWCON neurons may be essential for special recognition and response to the key moieties in the ketone-type volatiles released by bacteria. So, detailed genetic and chemical analyses of the sensing circuits in other ketone odors are needed in order to determine whether the AWCON neurons are broadly conserved functional neurons to the chemoattractive ketone odors. Meanwhile, we observed the involvement of the AWCON neurons in the ketone-dependent attraction of the preferred bacteria to the nematodes, reconfirming that, indeed, ketone blend is the key contributor to this attraction. Currently, the sensory neurons that mediate the ketone-driven chemotaxis behavior of RKNs remain to be identified. Similarities between C. elegans and plant-parasitic nematodes have been found in neuronal biology [43] (Coke et al., 2024). Furthermore, C. elegans can be used as a heterologous system to functionally characterize chemosensory genes in RKNs. Demonstrating that information is encoded at the olfactory neurons sets the stage for future experiments to decipher how the AWCON neurons mediate the ketone-driven bacterial attraction to the nematodes. For the olfactory genes identified in this study, which sense the bacterial-derived ketones, a better understanding of the molecular mechanisms underlying the RKN behaviors would be valuable. These results indicate that these olfactory genes are potential targets for the development of new RKN control strategies that interfere with chemotaxis. New RNAi-based nematicides could be directed to interfere with these genes and disrupt chemotaxis in RKNs.
Further studies on the molecular and functional characterization of ketone receptors will help to develop potential targets to interfere with the host-seeking behavior of RKNs. This should open up avenues for molecular approaches that promise to establish the roles of ketones in integrated nematode management.

Supplementary Materials

The following supporting information can be downloaded at: https://www.mdpi.com/article/10.3390/agronomy15030590/s1, Supplementary File S1: Supplementary Methods. Supplementary Figure legends. Figure S1–S3. Supplementary Table legends. Supplementary References. Supplementary Table S1. List of a collection of 231 bacterial isolates with the chemotaxis index to C. elegans when bacteria grow on the NB medium. Supplementary Table S2. List of 91 bacterial isolates with the chemotaxis index above 0.2 to C. elegans when bacteria grow on the NB medium. Supplementary Table S3. List of 46 bacterial isolates with bi-attractive activity to C. elegans and M. incognita. Supplementary Table S4. Chemotaxis responses of C. elegans toward the culture suspensions of bacteria grown on different media. Supplementary Table S5. Chemotaxis responses of M. incognita toward the culture suspensions of bacteria grown on different media. Supplementary Table S6. C. elegans prefers the representative bacterial isolates over E. coli OP50. Supplementary Table S7. C. elegans prefers the bacterial isolates 3.227 R and 3.227 W over other tested bacterial isolates. Supplementary Table S8. M. incognita prefers the bacterial isolates 3.227 R and 3.227 W over other tested bacterial isolates. Supplementary Table S9. BVOC profiles from the bacterial isolates grown on the ISP2 media by HS-SPME-GC-MS analysis. Supplementary Table S10. BVOC profiles from the bacterial isolates grown on the NB media by HS-SPME-GC-MS analysis. Supplementary Table S11. Summary of metabolite types of the BVOC profiles from bacterial isolates by HS-SPME-GC-MS analysis. Supplementary Table S12. Summary of ketone BVOC profiles from bacterial isolates by HS-SPME-GC-MS analysis. Supplementary Table S13. Chemotaxis of C. elegans to various concentrations of ketone odorants identified in the BVOC profiles detected in the headspace of bacteria. Supplementary Table S14. Chemotaxis of M. incognita to various concentrations of ketone odorants. Supplementary Table S15. Chemotaxis of C. elegans to various single ketone vs. blends of ketone odorants present in the highly attractive bacterial isolates. Supplementary Table S16. Chemotaxis of M. incognita to the single ketone vs. blends of ketone odorants present in the highly attractive bacterial isolates. Supplementary Table S17. Conditioning with a ketone odor blend reduces the attractiveness of C. elegans to the bacterial isolates. Supplementary Table S18. Conditioning with a ketone odor blend 3 + 8 + 11 reduces the attractiveness of M. incognita to the bacterial isolates. Supplementary Table S19. Conditioning with a ketone odor blend 3 + 8 + 11 alters the bacterial preference of C. elegans. Supplementary Table S20. Chemotaxis in response to the preferred bacterial isolates in the wild-type C. elegans with the sensory neuron-specific mutants. Supplementary Table S21. Chemotaxis in response to the ketone odors in the wild-type C. elegans with the sensory neuron-specific mutants. Supplementary Table S22. AWCON mutation altered the preference of the tested bacterial isolates to E. coli OP50. Supplementary Table S23. Chemotaxis responses of Panagrellus redivevus toward the culture suspensions of the preferred bacteria.

Author Contributions

Conceptualization: L.M. and M.M.; data curation: H.C., L.D., C.W. and D.T.; Formal analysis: X.Q. and W.W.; Funding acquisition: L.M. and M.M.; Investigation: X.Q. and W.W.; Methodology: X.Q. and W.W.; Project administration: L.M. and M.M.; Resources: H.C., L.D., C.W. and D.T.; Supervision: L.M. and M.M.; Visualization: X.Q. and W.W.; Writing—original draft: L.M.; Writing—review and editing: X.Q., W.W., H.C., L.D., M.M. and L.M. All authors have read and agreed to the published version of the manuscript.

Funding

This work was supported by the National Natural Science Foundation Program of China (32170131, 31660544), Department of Science and Technology of Yunnan Province (202401AS070123), and Graduate Student Practical Innovation Program of Yunnan University (ZC-23236633). The funders had no role in the study design, data collection and analysis, decision to publish, or preparation of this manuscript.

Data Availability Statement

The 16S rRNA gene sequences of bacteria used in this study are available from the NCBI GenBank (accession numbers listed in Supplementary Table S1). The original contributions presented in this study are included in the article/Supplementary Materials; further inquiries can be directed to the corresponding author. All C. elegans strains used are available from the C. elegans Genetics Center (CGC, University of Minnesota, Twin Cities, MN, USA).

Acknowledgments

We would like to acknowledge the State Key Laboratory for Conservation and Utilization of Bio-Resources for supplying the experimental platform.

Conflicts of Interest

The authors declare that this research was conducted in the absence of any commercial or financial relationships that could be construed as potential conflicts of interest.

Abbreviations

The following list describes the abbreviations used throughout this paper.
BVOCsbacterial volatile organic compounds
CGCCaenorhabditis elegans Genetics Center
CIchemotaxis index
DDDimethyl disulfide
HS-SPME-GC-MSheadspace solid-phase microextraction coupled with gas chromatography mass spectrometry
IAAIsoamyl alcohol
ISP2 mediumInternational Streptomyces Project-2 Medium
J2ssecond-stage juveniles
NA mediumnutrient agar medium
NB mediumnutrient broth medium
NMDSnonmetric multidimensional scaling
OP50Escherichia coli OP50
PCAprincipal component analysis
PIpreference index
RKNsroot-knot nematodes

References

  1. Jones, J.T.; Haegeman, A.; Danchin, E.G.J.; Gaur, H.S.; Helder, J.; Jones, M.G.K.; Kikuchi, T.; Manzanilla-López, R.; Pal-omares-Rius, J.E.; Wesemael, W.M.L.; et al. Top 10 plant parasitic nematodes in molecular plant pathology. Mol. Plant Pathol. 2013, 14, 946–961. [Google Scholar] [CrossRef] [PubMed]
  2. Dubreuil, G.; Magliano, M.; Deleury, E.; Abad, P.; Rosso, M.N. Transcriptome analysis of root knot nematode functions induced in the early stages of parasitism. New. Phytol. 2007, 176, 426–436. [Google Scholar] [CrossRef] [PubMed]
  3. Kirwa, H.K.; Murungi, L.K.; Beck, J.J.; Torto, B. Elicitation of differential responses in the root-knot nematode Meloidogyne incognita to tomato root exudate cytokinin, flavonoids, and alkaloids. J. Agric. Food Chem. 2018, 66, 11291–11300. [Google Scholar] [CrossRef] [PubMed]
  4. Shivakumara, T.N.; Dutta, T.K.; Chaudhary, S.; von Reuss, S.H.; Williamson, V.M.; Rao, U. Homologs of Caenorhabditis elegans chemosensory genes have roles in behavior and chemotaxis in the root-knot nematode Meloidogyne incognita. Mol. Plant Microbe Interact. 2019, 32, 876–887. [Google Scholar] [CrossRef]
  5. Bargmann, C.I. Chemosensation in C. elegans. In WormBook, the Online Review of C. elegans Biology; Community TCeR, Ed.; WormBook: Pasadena, CA, USA, 2007. [Google Scholar]
  6. Choi, J.I.; Yoon, K.-H.; Kalichamy, S.S.; Yoon, S.-S.; Lee, J.I. A natural odor attraction between lactic acid bacteria and the nematode Caenorhabditis elegans. ISME J. 2016, 10, 558–567. [Google Scholar] [CrossRef]
  7. Worthy, S.E.; Haynes, L.; Chambers, M.; Bethune, D.; Kan, E.; Chung, K.; Ota, R.; Taylor, C.J.; Glater, E.E. Identification of attractive odorants released by preferred bacterial food found in the natural habitats of C. elegans. PLoS ONE 2008, 13, e0201158. [Google Scholar] [CrossRef]
  8. Worthy, S.E.; Rojas, G.L.; Taylor, C.J.; Glater, E.E. Identification of odor blend used by Caenorhabditis elegans for pathogen recognition. Chem. Senses 2018, 43, 169–180. [Google Scholar] [CrossRef]
  9. Kim, D.H.; Flavell, S.W. Host-microbe interactions and the behavior of Caenorhabditis elegans. J. Neurogenet. 2020, 34, 500–509. [Google Scholar] [CrossRef]
  10. Diyapoglu, A.; Oner, M.; Meng, M. Application potential of bacterial volatile organic compounds in the control of root-knot nematodes. Molecules 2022, 27, 4355. [Google Scholar] [CrossRef]
  11. Chaisson, K.E.; Hallem, E.A. Chemosensory behaviors of parasites. Trends Parasitol. 2012, 28, 427–436. [Google Scholar] [CrossRef]
  12. Ferkey, D.M.; Sengupta, P.; L’Etoile, N.D. Chemosensory signal transduction in Caenorhabditis elegans. Genetics 2021, 217, iyab004. [Google Scholar] [CrossRef] [PubMed]
  13. Nunn, L.R.; Juang, T.D.; Beebe, D.J.; Wheeler, N.J.; Zamanian, M. A high-throughput sensory assay for parasitic and free-living nematodes. Integr. Biol. 2023, 15, zyad010. [Google Scholar] [CrossRef] [PubMed]
  14. Kwon, H.C.; Bae, Y.; Lee, S.J. The role of mRNA quality control in the aging of Caenorhabditis elegans. Mol. Cells 2023, 46, 664–671. [Google Scholar] [CrossRef]
  15. Kim, D.Y.; Moon, K.M.; Heo, W.; Du, E.J.; Park, C.G.; Cho, J.; Hahm, J.H.; Suh, B.C.; Kang, K.; Kim, K. A FMRFamide-like neuropeptide FLP-12 signaling regulates head locomotive behaviors in Caenorhabditis elegans. Mol. Cells 2024, 47, 100124. [Google Scholar] [CrossRef]
  16. Porta-de-la-Riva, M.; Fontrodona, L.; Villanueva, A.; Cerón, J. Basic Caenorhabditis elegans methods: Synchronization and observation. J. Vis. Exp. 2012, 10, e4019. [Google Scholar] [CrossRef]
  17. Zhai, Y.; Shao, Z.; Cai, M.; Zheng, L.; Li, G.; Huang, D.; Cheng, W.; Thomashow, L.S.; Weller, D.M.; Yu, Z.; et al. Multiple modes of nematode control by volatiles of Pseudomonas putida 1A00316 from Antarctic soil against Meloidogyne incognita. Front. Microbio 2018, 9, 253. [Google Scholar] [CrossRef]
  18. Yoshida, K.; Hirotsu, T.; Tagawa, T.; Oda, S.; Wakabayashi, T.; Iino, Y.; Ishihara, T. Odour concentration-dependent ol-factory preference change in C. elegans. Nat. Commun. 2012, 3, 739. [Google Scholar] [CrossRef]
  19. Glater, E.E.; Rockman, M.V.; Bargmann, C.I. Multigenic, Natural Variation Underlies Caenorhabditis elegans Olfactory Preference for the Bacterial Pathogen Serratia marcescens. G3 Genes Genomes Genet. 2014, 4, 265–276. [Google Scholar] [CrossRef]
  20. Hsueh, Y.-P.; Gronquist, M.R.; Schwarz, E.M.; Nath, R.D.; Lee, C.-H.; Gharib, S.; Schroeder, F.C.; Sternberg, P.W. Nematophagous fungus Arthrobotrys oligospora mimics olfactory cues of sex and food to lure its nematode prey. eLife 2017, 6, e20023. [Google Scholar] [CrossRef]
  21. Zhang, Y.; Lu, H.; Bargmann, C.I. Pathogenic bacteria induce aversive olfactory learning in Caenorhabditis elegans. Nature 2005, 438, 179–184. [Google Scholar] [CrossRef]
  22. Yamada, K.; Hirotsu, T.; Matsuki, M.; Butcher, R.A.; Tomioka, M.; Ishihara, T.; Clardy, J.; Kunitomo, H.; Iino, Y. Olfactory plasticity is regulated by pheromonal signaling in Caenorhabditis elegans. Science 2010, 329, 1647–1650. [Google Scholar] [CrossRef] [PubMed]
  23. Cheng, W.; Chen, Z.; Zeng, L.; Yang, X.; Huang, D.; Zhai, Y.; Cai, M.; Zheng, L.; Thomashow, L.S.; Weller, D.M.; et al. Control of Meloidogyne incognita in three- dimensional model systems and pot experiments by the attract-and-kill effect of furfural acetone. Plant Dis. 2021, 105, 2169–2176. [Google Scholar] [CrossRef] [PubMed]
  24. Niu, Q.; Huang, X.; Zhang, L.; Xu, J.; Yang, D.; Wei, K.; Niu, X.; An, Z.; Bennett, J.W.; Zou, C.; et al. A trojan horse mechanism of bacterial pathogenesis against nematodes. Proc. Natl. Acad. Sci. USA 2010, 107, 16631–16636. [Google Scholar] [CrossRef] [PubMed]
  25. Bargmann, C.I. Neurobiology of the Caenorhabditis elegans genome. Science 1998, 11, 2028–2033. [Google Scholar] [CrossRef]
  26. Choi, W.; Ryu, S.E.; Cheon, Y.; Park, Y.J.; Kim, S.; Kim, E.; Koo, J.; Choi, H.; Moon, C.; Kim, K. A single chemosensory GPCR is required for a concentration-dependent behavioral switching in C. elegans. Curr. Biol. 2022, 32, 398–411. [Google Scholar] [CrossRef]
  27. Yang, W.; Wu, T.; Tu, S.; Qin, Y.; Shen, C.; Li, J.; Choi, M.K.; Duan, F.; Zhang, Y. Redundant neural circuits regulate olfactory integration. PLoS Genet. 2022, 18, e1010029. [Google Scholar] [CrossRef]
  28. Rengarajan, S.; Hallem, E.A. Olfactory circuits and behaviors of nematodes. Curr. Opin. Neurobiol. 2016, 41, 136–148. [Google Scholar] [CrossRef]
  29. Bargmann, C.I.; Hartwieg, E.; Horvitz, H.R. Odorant-selective genes and neurons mediate olfaction in C. elegans. Cell 1993, 74, 515–527. [Google Scholar] [CrossRef]
  30. Roayaie, K.; Crump, J.G.; Sagasti, A.; Bargmann, C.I. The Gα protein ODR-3 mediates olfactory and nociceptive function and controls cilium morphogenesis in C. elegans olfactory neurons. Neuron 1998, 20, 55–67. [Google Scholar] [CrossRef]
  31. Noelle, D.L.; Bargmann, C.I. Olfaction and odor discrimination are mediated by the C. elegans guanylyl cyclase ODR-1. Neuron 2000, 25, 575–586. [Google Scholar] [CrossRef]
  32. Sengupta, P.; Colbert, H.A.; Bargmann, C.I. The C. elegans gene odr-7 encodes an olfactory-specific member of the nuclear receptor superfamily. Cell 1994, 79, 971–980. [Google Scholar] [CrossRef] [PubMed]
  33. Troemel, E.R. Chemosensory signaling in C. elegans. Bioessays 1999, 21, 1011–1020. [Google Scholar] [CrossRef]
  34. Wes, P.D.; Bargmann, C.I. C. elegans odour discrimination requires asymmetric diversity in olfactory neurons. Nature 2001, 410, 698–701. [Google Scholar] [CrossRef] [PubMed]
  35. Chalasani, S.H.; Chronis, N.; Tsunozaki, M.; Gray, J.M.; Ramot, D.; Goodman, M.B.; Bargmann, C.I. Dissecting a circuit for olfactory behaviour in Caenorhabditis elegans. Nature 2007, 450, 63–70. [Google Scholar] [CrossRef]
  36. Lin, A. Functional imaging and quantification of multineuronal olfactory responses in C. elegans. Sci. Adv. 2023, 9, eade1249. [Google Scholar] [CrossRef]
  37. Dong, L.; Li, X.; Huang, L.; Gao, Y.; Zhong, L.; Zheng, Y.; Zuo, Y. Lauric acid in crown daisy root exudate potently regulates root-knot nematode chemotaxis and disrupts Mi-flp-18 expression to block infection. J. Exp. Bot. 2014, 65, 131–141. [Google Scholar] [CrossRef]
  38. Giang, T.; He, J.; Belaidi, S.; Scholz, H. Key odorants regulate food attraction in Drosophila melanogaster. Front. Behav. Neurosci. 2017, 11, 160. [Google Scholar] [CrossRef]
  39. Wooding, M.; Naudé, Y.; Rohwer, E.; Bouwer, M. Controlling mosquitoes with semiochemicals: A review. Parasites Vectors 2020, 13, 80. [Google Scholar] [CrossRef]
  40. Taniguchi, G.; Uozumi, T.; Kiriyama, K.; Kamizaki, T.; Hirotsu, T. Screening of odor-receptor pairs in Caenorhabditis elegans reveals different receptors for high and low odor concentrations. Sci. Signal. 2014, 7, ra39. [Google Scholar] [CrossRef]
  41. Werner, K.M.; Perez, L.J.; Ghosh, R.; Semmelhack, M.F.; Bassler, B.L. Caenorhabditis elegans recognizes a bacterial quorum-sensing signal molecule through the AWCON neuron. J. Biol. Chem. 2014, 289, 26566–26573. [Google Scholar] [CrossRef]
  42. Terra, W.C.; Lopes de Paula, L.; de Brum, D.; Campos, V.P.; de Oliveira, D.F.; De Souza, J.T. Chemotaxis in Root-Knot Nematodes. In Root-Galling Disease of Vegetable Plants; Springer Nature: Singapore, 2023; pp. 85–115. [Google Scholar] [CrossRef]
  43. Coke, M.C.; Bell, C.A.; Urwin, P.E. The Use of Caenorhabditis elegans as a Model for Plant-Parasitic Nematodes: What Have We Learned? Annu. Rev. Phytopathol. 2024, 62, 157–172. [Google Scholar] [CrossRef]
Figure 1. Chemotaxis responses of Caenorhabditis elegans and Meloidogyne incognita toward the culture suspensions of representative bacterial isolates. (a) Chemotaxis assays and definition of chemotaxis index (CI); (b,e) chemotaxis bioassays show attraction (positive CI) or repulsion (negative CI) values. (c,d) Scatter plots depicting positive correlations between the CIs of both C. elegans and M. incognita for bacteria grown on the ISP2 and the NB medium, respectively. Data are expressed as mean ± SE. Statistical analysis performed using one-way ANOVA followed by Tukey’s HSD (p values: + p < 0.05; ++ p < 0.01) tests compared with the medium as the control. Dots with different shapes and colors represent individual raw data of different isolates grown on the NB medium (filled bars and dots in (b); filled blue bars in (e)) and the ISP2 medium (empty bars and dots; filled pink bars in (e)) in a single chemotaxis plate with 150–200 L4s from 8 biological replicates. Error bars indicate standard error. The bars with the same letter are not significantly different (p > 0.05). The capital and small letters indicate statistically significant differences among the different isolates grown on the NB and the ISP2 media, respectively. See details in Supplementary Tables S3–S5.
Agronomy 15 00590 g001
Figure 2. Caenorhabditis elegans and Meloidogyne incognita showed a strong preference for both bacterial isolate 3.227 R and isolate 3.227 W over the other three preferred bacterial isolates grown on different media. (a) Bacterial two-choice preference assay (top) and quantification (bottom) of preference index (PI) for C. elegans choosing between OP50 and tested bacterial isolates. (b) The PI of the C. elegans for the tested bacteria over E. coil OP50. Filled and empty bars represent the results from the tested isolates grown on the NB and the ISP2 media, respectively. (c) C. elegans had a strong preference for both isolate 3.227 R and isolate 3.227 W over the other three preferred bacterial isolates. (d,e) M. incognita had a strong preference for both isolate 3.227 R and isolate 3.227 W over the other three preferred bacterial isolates grown on the NB medium (d) and the ISP2 medium (e). p values obtained by one-way ANOVA with Fisher’s LSD post hoc test. *** p < 0.001, ** p < 0.01, * p < 0.05. Data are expressed as mean ± SE; * indicates a difference between the number of nematodes on one of the sectors in the binary choice. The capital and small letters indicate a statistically significant difference between OP50 vs. LB medium and tested isolates grown on the NB and the ISP2 media, respectively, vs. OP50 grown on the LB medium. See details in Supplementary Tables S6–S8.
Agronomy 15 00590 g002
Figure 3. Caenorhabditis elegans displays attractive chemotaxis behavior to representative bacterial isolates based on modified three−division Petri dishes. (a) Chemotaxis assays and definition of the chemotaxis index (CI) based on modified three−division Petri dishes. (b) Chemotaxis bioassays show attraction (positive CI) or repulsion (negative CI) values. (c) Modified preference assay and quantification of preference index (PI) for C. elegans choosing between OP50 and tested bacterial isolates. (d) The PI of C. elegans to the tested isolates grown on the NB (filled bars) and ISP2 (empty bars) media. Data presented as means ± SE (n = 3), significant difference to a PI of OP50 versus LB medium, ** p < 0.01. The capital and small letters indicate statistically significant differences between OP50 vs. LB medium and the tested isolates grown on the NB and the ISP2 media, respectively, vs. OP50.
Agronomy 15 00590 g003
Figure 4. Identification of putative BVOCs and heatmap illustrating abundance of ketone volatiles correlated with the attractiveness of the tested bacterial isolates toward C. elegans and M. incognita. (a) HS-SPME-GC-MS workflow on the BVOC profiles released from the tested bacterial isolates. Composition of the BVOC profiles (b) in the headspace of the representative bacterial isolates is dramatically different depending on their attractiveness to C. elegans (c) and M. incognita (d). Interestingly, the higher attractiveness of the bacterial isolates (shown by the heatmap depicting chemotaxis index (CI) data) on the right, the more abundant the ketone BVOCs are in the detected profiles on the left (BVOCs class is color-coded). The percentages of BVOCs were expressed as peak area percentages of the total area, and the proportions of the chemical group within each isolate were calculated by dividing the contents of BVOCs belonging to the same chemical group by the total contents of BVOCs. (e) Heatmap of the abundance of the ketone BVOC profiles from the tested bacterial isolates by HS-SPME-GC-MS analysis. Rows correspond to each of the 9 tested bacterial isolates grown on different media, while columns correspond to the relative amount of each discriminant ketone volatile metabolite. Ketone volatiles abundance (color-coded) ranging from red (high abundance) to rose red (low abundance). The emission values were normalized by log10 transformation. The CI of C. elegans (f) and M. incognita (g) to the tested bacterial isolates was shown by color ranging from red (high attractiveness) to rose red (low attractiveness). See details in Supplementary Tables S11 and S12.
Agronomy 15 00590 g004
Figure 5. Multivariate analysis of the bacterial BVOC profiles assessed by HS-SPME-GC-MS. (a) Principal component analysis (PCA) and nonmetric multidimensional scaling (NMDS) analysis revealed a clear separated clustering of the BVOC profiles of bacteria grown on different media (ISP2 (b) and NB (c)). Distinct attractiveness of bacterial cluster separation was observed among the isolates in the PCA score plots, which further demonstrated the difference in the BVOC profiles among the high, medium, and low attractiveness of the bacterial groups. (d,e) PCA loading plots indicated the representative ketone volatile compounds responsible for the attractiveness of bacterial cluster separation. The numbers that correspond to the compound names in the PCA loading plots are explained in Supplementary Tables S9 and S10.
Agronomy 15 00590 g005
Figure 6. Chemotaxis of C. elegans and M. incognita to ketone odors derived from the representative bacterial isolates. (a) Diagram of C. elegans—odor chemotaxis assay plate and definition of odor chemotaxis index (CI). (b) C. elegans showed the highest average attraction to 500 mgL−1 ketone compounds compared to the concentrations of 50 and 5000 mgL−1. Green, orange, and blue bars indicate the CI values tested with 5000 mgL−1, 500 mgL−1, and 50 mgL−1 ketone compounds, respectively. Numbers in top gray blocks: the tested ketone odorants and control odorants. Control odorants: 2-nonanone as negative control; IAA and DD as positive controls, as denoted by numbers 6, 5, and 14, respectively (in CK block). Details of the tested ketone odorants are explained in Supplementary Table S13. Capital letters: statistically significant differences from a positive control odorant IAA at 500 mgL−1. Each dot with different shapes and colors represents the results of a single assay with 150–200 L4s. (c) Chemotaxis of M. incognita to ketone odors derived from the representative bacterial isolates. Green, blue, and pink bars: CI values tested with 5000 mgL−1, 500 mgL−1, and 50 mgL−1 ketone compounds, respectively. Numbers at the bottom: compound names indicated as in Supplementary Table S14. A comparison of the statistics among different concentrations of odors was performed. For statistics (b,c): one-way ANOVA followed by Tukey’s HSD (p values: * p < 0.05; ** p < 0.01) tests comparing different concentrations of odors. Error bars indicate a standard error of at least seven independent experiments performed on the separate day on separate plates. Statistical analysis performed using one-way ANOVA followed by Tukey’s HSD (p values: * p < 0.05; ** p < 0.01) tests.
Agronomy 15 00590 g006
Figure 7. Comparison of chemotaxis of C. elegans (a) and M. incognita (b) to single vs. blends of ketone odorants, and conditioning with a ketone odorant blend alters the attractiveness of M. incognita (c,d). As illustrated in (a,b), both C. elegans and M. incognita showed the strongest attraction to a blend of ketone odorant (3 + 8 + 11: 2-Pentadecanone + 2-Undecanone + 2-Tridecanone) compared to the other blends or single odorants. Two gray bars on the top indicate single ketone odorants and different ketone odor blends, as labeled at the bottom, used in this assay, respectively. The numbers correspond to the compound names indicated in Supplementary Tables S15 and S16. (c,d) Conditioning with a ketone odorant blend alters the attractiveness of M. incognita to this blend and the tested preferred bacteria, respectively. See details in Supplementary Table S18. Error bars indicate standard error of at least four independent experiments performed on the separate day on separate plates. Statistical analysis performed using one-way ANOVA followed by Tukey’s HSD ** p < 0.01, *** p < 0.001) tests. The small letters indicate statistically significant differences among the tested single odorants and among blends. The capital letters indicate statistically significant differences between the tested single odorants and blends.
Agronomy 15 00590 g007
Figure 8. Conditioning with a ketone odor blend reduces attractiveness of C. elegans to the representative bacterial isolates and alters the bacterial preference of C. elegans to the highly attractive bacterial isolates over E. coli OP50. (a) Adaptation assay with single/blend ketone odorants followed by bacterial chemotaxis assays. (c) Bacterial two-choice preference assays. For details, see Supplementary File S1: Supplementary Methods. (b) Attraction of C. elegans to the tested bacterial isolates was reversed by conditioned worms with a ketone odor blend (3 + 8 + 11) in the absence of food during the 2 h training period. Conditioning scenarios and bacterial isolates were indicated in the block left and below, respectively. Numbers corresponding to the compound names: 3 = 2-Pentadecanone; 8 = 6, 10-dimethyl-2-Undecanone; 11 = 2-Tridecanone; 5 = Isoamyl alcohol (IAA). Numbers inside the colored circles: the mean of the chemotaxis index (CI) from 6 biological replicates. For raw data, see Supplementary Tables S17 and S19. (d) Preference index (PI) of wild-type worms and conditioned worms to the tested bacterial isolates over OP50. Number above the colored circles: mean of the PI from 6 biological replicates. Letters at the bottom represents different treatments: A: WT worms; B: blend of ketone odor (3 + 8 + 11)-adapted worms; C: odor 5-adapted worms. Two-way ANOVA with subsequent comparisons to the naïve and conditioned worms was performed. Conditioned worms showed reduced preference to the tested bacterial isolates.
Agronomy 15 00590 g008
Figure 9. Neurons of C. elegans involved in response to the preferred bacterial isolates and their derived ketone odorants. (a) Chemotaxis in response to the preferred bacterial isolates in WT animals with sensory neuron-specific mutants; (b) chemotaxis in response to the concentration 500 mgL−1 of ketone odors in WT animals with sensory neuron−specific mutants; (c) AWCON mutation altered the preference of the tested bacterial isolates to OP50. For all graphs, the mean is shown, and error bars represent standard deviations. Statistical significance of difference was analyzed for statistical comparisons of the WT to the mutants by one-way ANOVA. Statistical significance was indicated as follows: ns = not significant, * p < 0.05, ** p < 0.01, *** p < 0.0001. In (a,b), the box plot data are derived from six independent experiments, respectively, with 200–250 animals per assay; box plots use the values of the median, the first and the third quartile, and the minimal and maximal. In c, the nsy-1 mutants eliminated the preference on the preferred bacteria. The preference index was defined in the Materials and Methods for bacterial choice assays. The genotypes of mutant or transgenic animals are as follows: WT: N2; AWC: odr-1, odr-3; AWA: odr-7; AWCON−: nsy-1; AWCOFF−: inx-19. See details in Supplementary Tables S20–S22.
Agronomy 15 00590 g009
Disclaimer/Publisher’s Note: The statements, opinions and data contained in all publications are solely those of the individual author(s) and contributor(s) and not of MDPI and/or the editor(s). MDPI and/or the editor(s) disclaim responsibility for any injury to people or property resulting from any ideas, methods, instructions or products referred to in the content.

