Article

Wheat Nitrogen Use and Grain Protein Characteristics Under No-Tillage: A Greater Response to Drip Fertigation Compared to Intensive Tillage

1
College of Agriculture, Shanxi Agricultural University, Jinzhong 030801, China
2
International School of Bioresource Application, College of Life Science, Linyi University, Linyi 276000, China
*
Author to whom correspondence should be addressed.
Agronomy 2025, 15(3), 588; https://doi.org/10.3390/agronomy15030588
Submission received: 23 January 2025 / Revised: 23 February 2025 / Accepted: 26 February 2025 / Published: 27 February 2025

Abstract

:
No-tillage (NT) has been widely recognized for significantly enhancing crop yield and nitrogen (N) use efficiency in dryland agricultural systems globally. However, in irrigated fields, NT has demonstrated adverse effects on wheat yield, and limited information is available regarding its impact on N uptake and use efficiencies, and grain protein characteristics. Previous studies concluded that drip fertigation (DF) achieved superior yield gain over the conventional N fertilizer broadcasting with flood irrigation (BF) under NT compared to rotary tillage (RT) and intensive tillage (PRT; first plowing followed by rotary tillage). This study measured tissue N concentration, grain protein content and composition, dough processing quality traits, and the activities of N metabolism enzymes in flag leaves and developing grains. The objectives were to (1) evaluate the response of N use traits and grain quality to DF, and (2) elucidate the relationship between gains in yield and N uptake across varying tillage methods. Results revealed that DF significantly increased N uptake by 35.4–38.0%, 22.1–22.2%, and 16.0–16.6% over BF under NT, RT, and PRT, respectively. This boosted N uptake predominantly contributed to enhanced N use efficiency (grain production per unit of total soil mineral and fertilizer N input). Regression analysis indicated that increased N pre-anthesis uptake was the primary driver of yield improvement by DF (r2 > 0.99, P < 0.01). Furthermore, NT demonstrated superior improvements by DF in N nutrition index, grain protein content, gliadin content, wet gluten content, and water absorption rate compared to RT and PRT. In conclusion, wheat N use and grain protein under NT responded greater to DF than intensive tillage. Therefore, our findings emphasize that transitioning from conventional water and N management to DF is an effective and practical strategy for enhancing N uptake, achieving high yield, improving N use efficiency, and enriching grain protein content, particularly under NT conditions.

1. Introduction

Wheat (Triticum aestivum L.) is among the most cultivated and consumed cereal grains globally, providing vital calories and protein sources for billions of people. Enhancing the nitrogen (N) uptake and utilization of wheat crops has been recognized as an effective and practical approach for boosting wheat yield and quality [1,2,3,4,5]. Soil tillage, irrigation practice, and N management had huge effects on N uptake, utilization, and use efficiencies of wheat crops [6].
No-tillage (NT) has been promoted as a promising conservation agriculture practice, especially in dryland farming systems, where precipitation is limited or unevenly distributed [7]. This practice has been linked to multiple benefits, including improved water infiltration, enhanced soil moisture retention, increased soil biological activity, and better N uptake by plants [8,9,10]. Adil et al. reported that long-term NT benefited dryland crop yield and N use efficiency in both the USA and China [11]. Newly released research reported that long-term NT increased soil water storage and raised surface soil nitrate N levels, thereby increasing N uptake by more than 21% and yield by 19–28% [12]. Yang et al. found that NT had significant and positive effects on dryland wheat yield, N uptake, utilization and use efficiencies (NUPE, NUTE and NUE), and the effect degree was greater in dry than humid climates [13]. Zhao et al. also reported that NT increased wheat yield in the Western Henan province (dryland or rainfed fields) but decreased yield in Southern Henan (with sufficient irrigation). Unfortunately, information about N uptake was unavailable from Zhao et al. [14]. Our previous report also confirmed that significantly inferior yields were recorded under NT than conventional or intensive tillage in irrigated fields [15]. Based on the central role of N nutrition in crop yield formation, we could easily deduce that NT would reduce N absorption from the soil, thereby reducing NUPE and NUE in irrigated fields. Considering this situation, mitigating the adverse effects of NT on N uptake through improving agricultural management practices is crucial for the successful implementation of conservation tillage in irrigated farmland to enhance soil health and ensure sustainable food production.
It is widely approved that drip fertigation (DF) increases the yield and NUE of field crops, such as cotton, potato, maize, and wheat, by effectively utilizing the coupling effect of water and nitrogen [16,17,18,19]. DF enables precise delivery of water and nutrients directly to the crop root zone, promoting efficient uptake of water and nutrients by plants. This approach supports achieving higher yields while significantly reducing water and fertilizer inputs [20,21,22]. Compared to conventional irrigation and fertilization methods (N fertilizer broadcasting with flood irrigation, BF), DF can decrease water use by 14–35% and fertilizer application by 20–30%, while boosting crop yields by 10–22% [23,24,25]. A meta-analysis conducted by Li et al. [26] reviewed 1033 studies and highlighted that DF enhanced crop yield and NUE by approximately 12% and 34%, respectively. Notably, our previous research demonstrated that replacing BF with DF significantly enhanced wheat yield, particularly under NT. The yield increase under NT (26.3–28.5%) was over 2.5 times that observed under intensive tillage practices (11.0–11.9%). This shift also narrowed the yield gap between NT and intensive tillage, from 20.9% to just 9.1% [15]. These findings push us to put forward a hypothesis that the response in yield to DF is driven by the response in N uptake. N uptake plays a pivotal role in determining grain protein content and composition, which are critical quality indicators for wheat. Enhanced N uptake under DF, particularly with NT, is expected to positively influence these traits. However, there remains limited understanding of the effects of DF on grain protein contents, and dough processing traits across varying tillage methods.
In this study, N concentrations of wheat’s aboveground plant tissues at anthesis and maturity were measured to calculate N uptake, utilization and use efficiencies, and N nutrition index (NNI) at anthesis. Grain protein content and composition, dough processing quality-related traits, as well as activities of N metabolism enzymes in flag leaf and developing grain were investigated. The specific objectives of this study are to: (1) quantify the effects of aboveground DF on N uptake and grain protein contents under different tillage methods, and (2) evaluate the relationship between increases in N uptake and yield improvements caused by DF across varying tillage systems. These findings aim to provide insights into optimizing water-nitrogen management and tillage practice for sustainable wheat production in irrigated fields. This study is a follow-up based on our previous report [15].

2. Materials and Methods

2.1. Site Description

Field trials were conducted in Quanyuan Town (34°42′ N, 118°25′ E), Tancheng County, Shandong Province, over two consecutive winter wheat growing seasons (2022–2023 and 2023–2024). The study site is situated in a temperate monsoon climate zone (Köppen classification) with a primary cropping system of winter wheat rotated with summer maize. The experiments were carried out in two neighboring fields for the respective growing seasons. The preceding crop in both seasons was summer maize, managed under standard practices typical of local farming. Before the application of basal fertilizers in 2022 and 2023, nine soil samples were randomly collected from the 0–20 cm layer to analyze baseline soil properties. The soil, classified as silty clay loam based on USDA Soil Taxonomy, exhibited pH of 8.14–8.20, organic matter content of 16.77–17.26 g kg−1, total nitrogen content of 0.84–0.91 g kg−1, alkaline nitrogen content of 44.36–46.23 mg kg−1, Olsen phosphorus content of 17.87–18.69 mg kg−1, and available potassium content of 141.36–150.85 mg kg−1 in the top 20 cm layer.
Climate data, including daily minimum and maximum temperatures, solar radiation, and precipitation, were monitored throughout the wheat growing period, from sowing to maturity, during both seasons. These measurements were obtained from a weather station (AWS 800, Campbell Scientific, Inc., Logan, UT, USA) situated approximately 150 m from the experimental plots. The phenological development stages of wheat were documented following the Zadoks scale. The seasonal averages for daily mean temperature, total precipitation, and solar radiation during the 2022–2023 and 2023–2024 growing seasons were recorded as 10.93 °C and 10.74 °C, 407.9 mm and 221.9 mm, and 2850 MJ m−2 and 2942 MJ m−2, respectively (Figure S1).

2.2. Experimental Design and Crop Management

The experimental treatments were implemented using a split-plot design with four replicates. The primary plots were assigned to different soil tillage practices, while the subplots addressed water–nitrogen management (WN). Each subplot measured 25.0 m in length and 2.25 m in width. The tillage methods included no-tillage (NT), rotary tillage to a depth of 15 cm (RT), and the conventional practice widely used by local farmers, which involved plowing to a depth of 30 cm followed by rotary tillage (PRT). The WN included conventional management (N fertilizer broadcasting with flood irrigation, BF) and drip fertigation (DF). The wheat cultivar Jimai22, known for its wide adaptability, was used. Sowing was conducted using a no-tillage planter (model 2BMF-11; Minle County Kaiyuan Machinery Manufacturing Co., Ltd., Zhangye, Gansu, China). The machine was equipped with 11 sowing ports; however, one port was removed, leaving 10 rows per plot with a 20 cm row spacing. The seeding rate was set at 450 seeds m−2.
The preceding maize crop was harvested on 11 October 2022, and 8 October 2023. During harvest, maize straw was shredded into fragments no longer than 5 cm and evenly distributed over the soil surface. Wheat was sown on 17 October 2022, and 14 October 2023.
Before sowing, 150 kg P2O5 ha−1 of phosphate (calcium superphosphate, 16% P2O5, Qinhuangdao Tianfu Agricultural Development Co., Ltd., Qinhuangdao, China) and 90 kg K2O ha−1 of potassium (potassium chloride, 52% K2O, Sino-AGR, Beijing, China) were applied. Nitrogen was supplied as urea (46% N, Henan Xinlianxin Chemical Industry Group Co., Ltd., Xinxiang, China) at a total application rate of 250 kg N ha−1 for all treatments. In the BF treatment, nitrogen fertilizer was broadcast before applying 60 mm of flood irrigation at the jointing stage (Zadoks code 32). Additional flood irrigations of 60 mm were provided pre-winter, at the heading stage (Zadoks code 50), and during early grain filling (Zadoks code 73, applicable only in 2024). For DF, the drip irrigation system was installed at the four-leaf stage (Zadoks code 14). Irrigation was delivered exclusively through the drip system, with drip tapes (16 mm diameter) spaced 40 cm apart, serving two rows of wheat. The drippers, spaced 30 cm apart, discharged 2.4 L h−1 under a pressure of 0.10–0.15 MPa. Flow meters were installed in each plot to monitor water usage. At the regreening, jointing, booting, and heading stages, pre-measured urea was dissolved in fertilizer tanks and introduced into the irrigation system using a Venturi injector, delivering it directly to the crop root zone via the drip tapes. Equal volumes of water were added to fertilizer tanks in each plot. Irrigation and nitrogen management followed the specifications provided in Table S1. Throughout the experiment, the fields were managed to remain free of weeds, pests, and diseases.

2.3. Sampling and Measurements

2.3.1. Soil N Content Before Sowing

Prior to the application of basal fertilizers, soil samples were obtained from the experimental field at depths of 0–20, 20–40, 40–60, 60–80, and 80–100 cm. Sampling was conducted using a five-spot method with five replicates for each depth. The fresh soil samples were analyzed for total mineral nitrogen content, including nitrate-N (NO3-N) and ammonium-N (NH4-N). This analysis was performed using a continuous flow analyzer (AutoAnalyzer 3, Bran + Luebbe, Norderstedt, Germany), following the procedures outlined by Wagner [27] and Benesch and Mangelsdorf [28].

2.3.2. N Uptake, Utilization, and Use Efficiencies

At the anthesis and maturity stages, wheat plants were sampled from a representative row within the central area of each plot, covering a 0.5 m length (equivalent to 0.10 m2). At anthesis, plant samples were divided into leaf blades, stems (including sheaths), and ears. At maturity, samples were separated into straw (comprising leaf blades, sheaths, and stems) and ears. Ears were manually threshed and further divided into grains, rachides, and glumes, with rachides and glumes combined with the straw fraction. All plant components were oven-dried at 80 °C until a constant weight was reached and subsequently ground for analysis.
The N concentration (N content per unit dry weight, mg g−1) of each tissue was determined using an elemental analyzer (Rapid N Exceed, Elementar, Langenselbold, Germany). N uptake or aboveground N accumulation (AGN) and grain N accumulation (GNA) were calculated by multiplying the N concentration by the dry weight of the respective tissue.
The post-anthesis N uptake was calculated using the formula:
P o s t - a n t h e s i s   N   u p t a k e k g   h a 1 = A G N   m a t u r i t y A G N   a t   a n t h e s i s
The N translocation (NTrans) of accumulated aboveground N uptake before anthesis into developing grains was calculated using the formula:
N   t r a n s l o c a t i o n k g   h a 1 = G N A P o s t - a n t h e s i s   N   u p t a k e
The following equations were used to calculate N uptake, utilization, and use efficiencies according to Moll et al. [29].
N use efficiency (NUE) was calculated using the formula:
N U E   k g   k g 1 = G r a i n   y i e l d N f + N s
N uptake efficiency (NUPE) was calculated using the formula:
N U P E   % = A G N   a t   m a t u r i t y N f + N s × 100
where Nf is the N fertilizer applied into the soil and Ns represents the total mineral N content (NO3-N and NH4+-N) in the soil at a depth of 0–100 cm. The Ns values were 203.1 and 211.8 kg ha−1 before sowing in 2022 and 2023, respectively. AGN was N uptake or aboveground N accumulation at maturity.
N utilization efficiency (NUTE) was calculated using the formula:
N U T E   k g   k g 1 = G r a i n   y i e l d A G N   a t   m a t u r i t y

2.3.3. Nitrogen Nutrition Index

The N nutrition index (NNI) was estimated according to the ratio of the actual aboveground crop percent N (Nt) and the critical percent N (Nct) at anthesis. The NNI was calculated using the formula:
N N I = N t N c t
where the critical N concentration (Nct) was estimated according to the “critical dilution curve” developed for wheat, as described by Justes et al. [30]:
N c t = 5.35 × D M 0.442
The Nt was calculated using the formula:
N t = A G N   a t   a n t h e s i s T o t a l   d r y   m a t t e r   a t   a n t h e i s

2.3.4. Grain Protein and Processing Quality

The sequential fractionation of wheat protein components followed Yao et al. [31]. A sample of wheat flour (0.5 g) was first subjected to aqueous extraction using pure water to isolate the albumin fraction. The mixture was agitated on an orbital shaker at 180 rpm at room temperature for a 30-min period. The extract was separated by centrifugation at 4000 rpm for 30 min, and the supernatant containing albumins was collected. For globulin extraction, the remaining pellet underwent a similar process using a 2% sodium chloride solution. After mixing and centrifugation under identical conditions, the globulin-containing supernatant was harvested. The gliadin fraction was subsequently extracted from the residue using 75% ethanol, with a combined heat treatment (80 °C, 5 min) and room temperature incubation (15 min). The glutenin fraction was obtained in the final step by treating the remaining material with diluted sodium hydroxide (0.2%) at ambient temperature. Each extraction stage was performed in triplicate to ensure complete protein recovery. The protein content in all fractions, including the residual material, was quantified using the Kjeldahl method. Grain protein concentration was calculated using the conventional wheat conversion factor of 5.7 [32].
To assess grain processing quality, one and a half kilograms of grains were randomly selected from each grain sample. These samples were stored for three months before being milled using a Brabender Quadromat Junior Mill (Brabender, Duisburg, Germany). Prior to milling, the grains were conditioned to achieve a moisture content of 14.0%. The area of stretch (AS), and maximum tensile resistance (MTR) were measured using an Extensograph-E (Brabender, Duisburg, Germany) in accordance with AACC method 54–10 [33]. Additionally, water absorption rate (WAR), and dough developing and stability time (DDT and DST) were determined using a FarinoGraph-E (Brabender, Duisburg, Germany) equipped with a 300 g mixing bowl, following the AACC method 54–21 [33]. Wet gluten content (WGC) was analyzed using the Glutomatic 2200 (Perten, Stockholm, Sweden), following the procedures outlined in AACC 38–12.02 [34].

2.3.5. Nitrate Reductase (NR) and Glutamine Synthetase (GS) Activities

The NR and GS activities were determined according to Cui et al. [5]. A 0.5 g fresh sample was placed in a 5 mL centrifuge tube, followed by the addition of 4 mL of buffer solution. The mixture was vortexed and mixed for 1 min, then centrifuged at 4000 rpm and 4 °C for 15 min. The supernatant (1 mL) was transferred to a 10 mL centrifuge tube, and 3.5 mL of 0.1 M potassium nitrate phosphoric acid solution and 0.2 mL of 2 mg mL−1 nicotinamide adenine dinucleotide (NADH) solution were added. After mixing, the sample was incubated at 25 °C in a water bath for 30 min. Upon completion of the incubation, 1 mL of 1% sulfonamide solution was added to stop the enzymatic reaction, followed by 1 mL of 0.02% naphthyl vinyl amine solution. After 15 min of coloring, the mixture was centrifuged at 4000 rpm for 5 min. The supernatant was collected, and its absorbance was measured at 540 nm.
A 1.0 g sample was frozen using liquid nitrogen and placed in a mortar, then 3 mL of buffer solution (0.05 M Tris-HCl, 2 mM Mg2+, 2 mM dithiothreitol (DTT), and 0.4 M sucrose) was added. The mixture was ground and homogenized in an ice bath, then transferred to a 5 mL centrifuge tube and centrifuged at 15,000× g for 20 min at 4 °C. To the resulting supernatant (0.7 mL), 1.6 mL of 80 mM hydroxylamine hydrochloride buffer (containing 80 mM Mg2+, 20 mM sodium glutamate, 20 mM cysteine, and 2 mM ethylene glycol-bis(β-aminoethyl ether)-N,N,N′,N′-tetra acetic acid (EGTA)) and 0.7 mL of 40 mM adenosine triphosphate (ATP) solution were added. The mixture was shaken and incubated at 37 °C for 30 min. After incubation, 1 mL of chromogenic reagent (composed of 0.2 M trichloroacetic acid (TCA), 0.37 M FeCl3, and 0.6 M HCl) was added, shaken, and mixed. The mixture was briefly left to stand before being centrifuged at 5000× g for 10 min. The supernatant was collected, and its absorbance at 540 nm was measured.

2.4. Data Analysis

Statistical analyses were performed with Statistix 9.0 (Analytical Software, Tallahassee, FL, USA). Analysis of variance was conducted separately each year. Multiple comparisons were detected using the least significant difference test (α = 0.05). Pearson correlation analysis was conducted to determine the linear correlation coefficient (r) and P-value. All graphical representations of data were conducted produced using SigmaPlot 12.5 (Systat Software Inc., Point Richmond, CA, USA).

3. Results

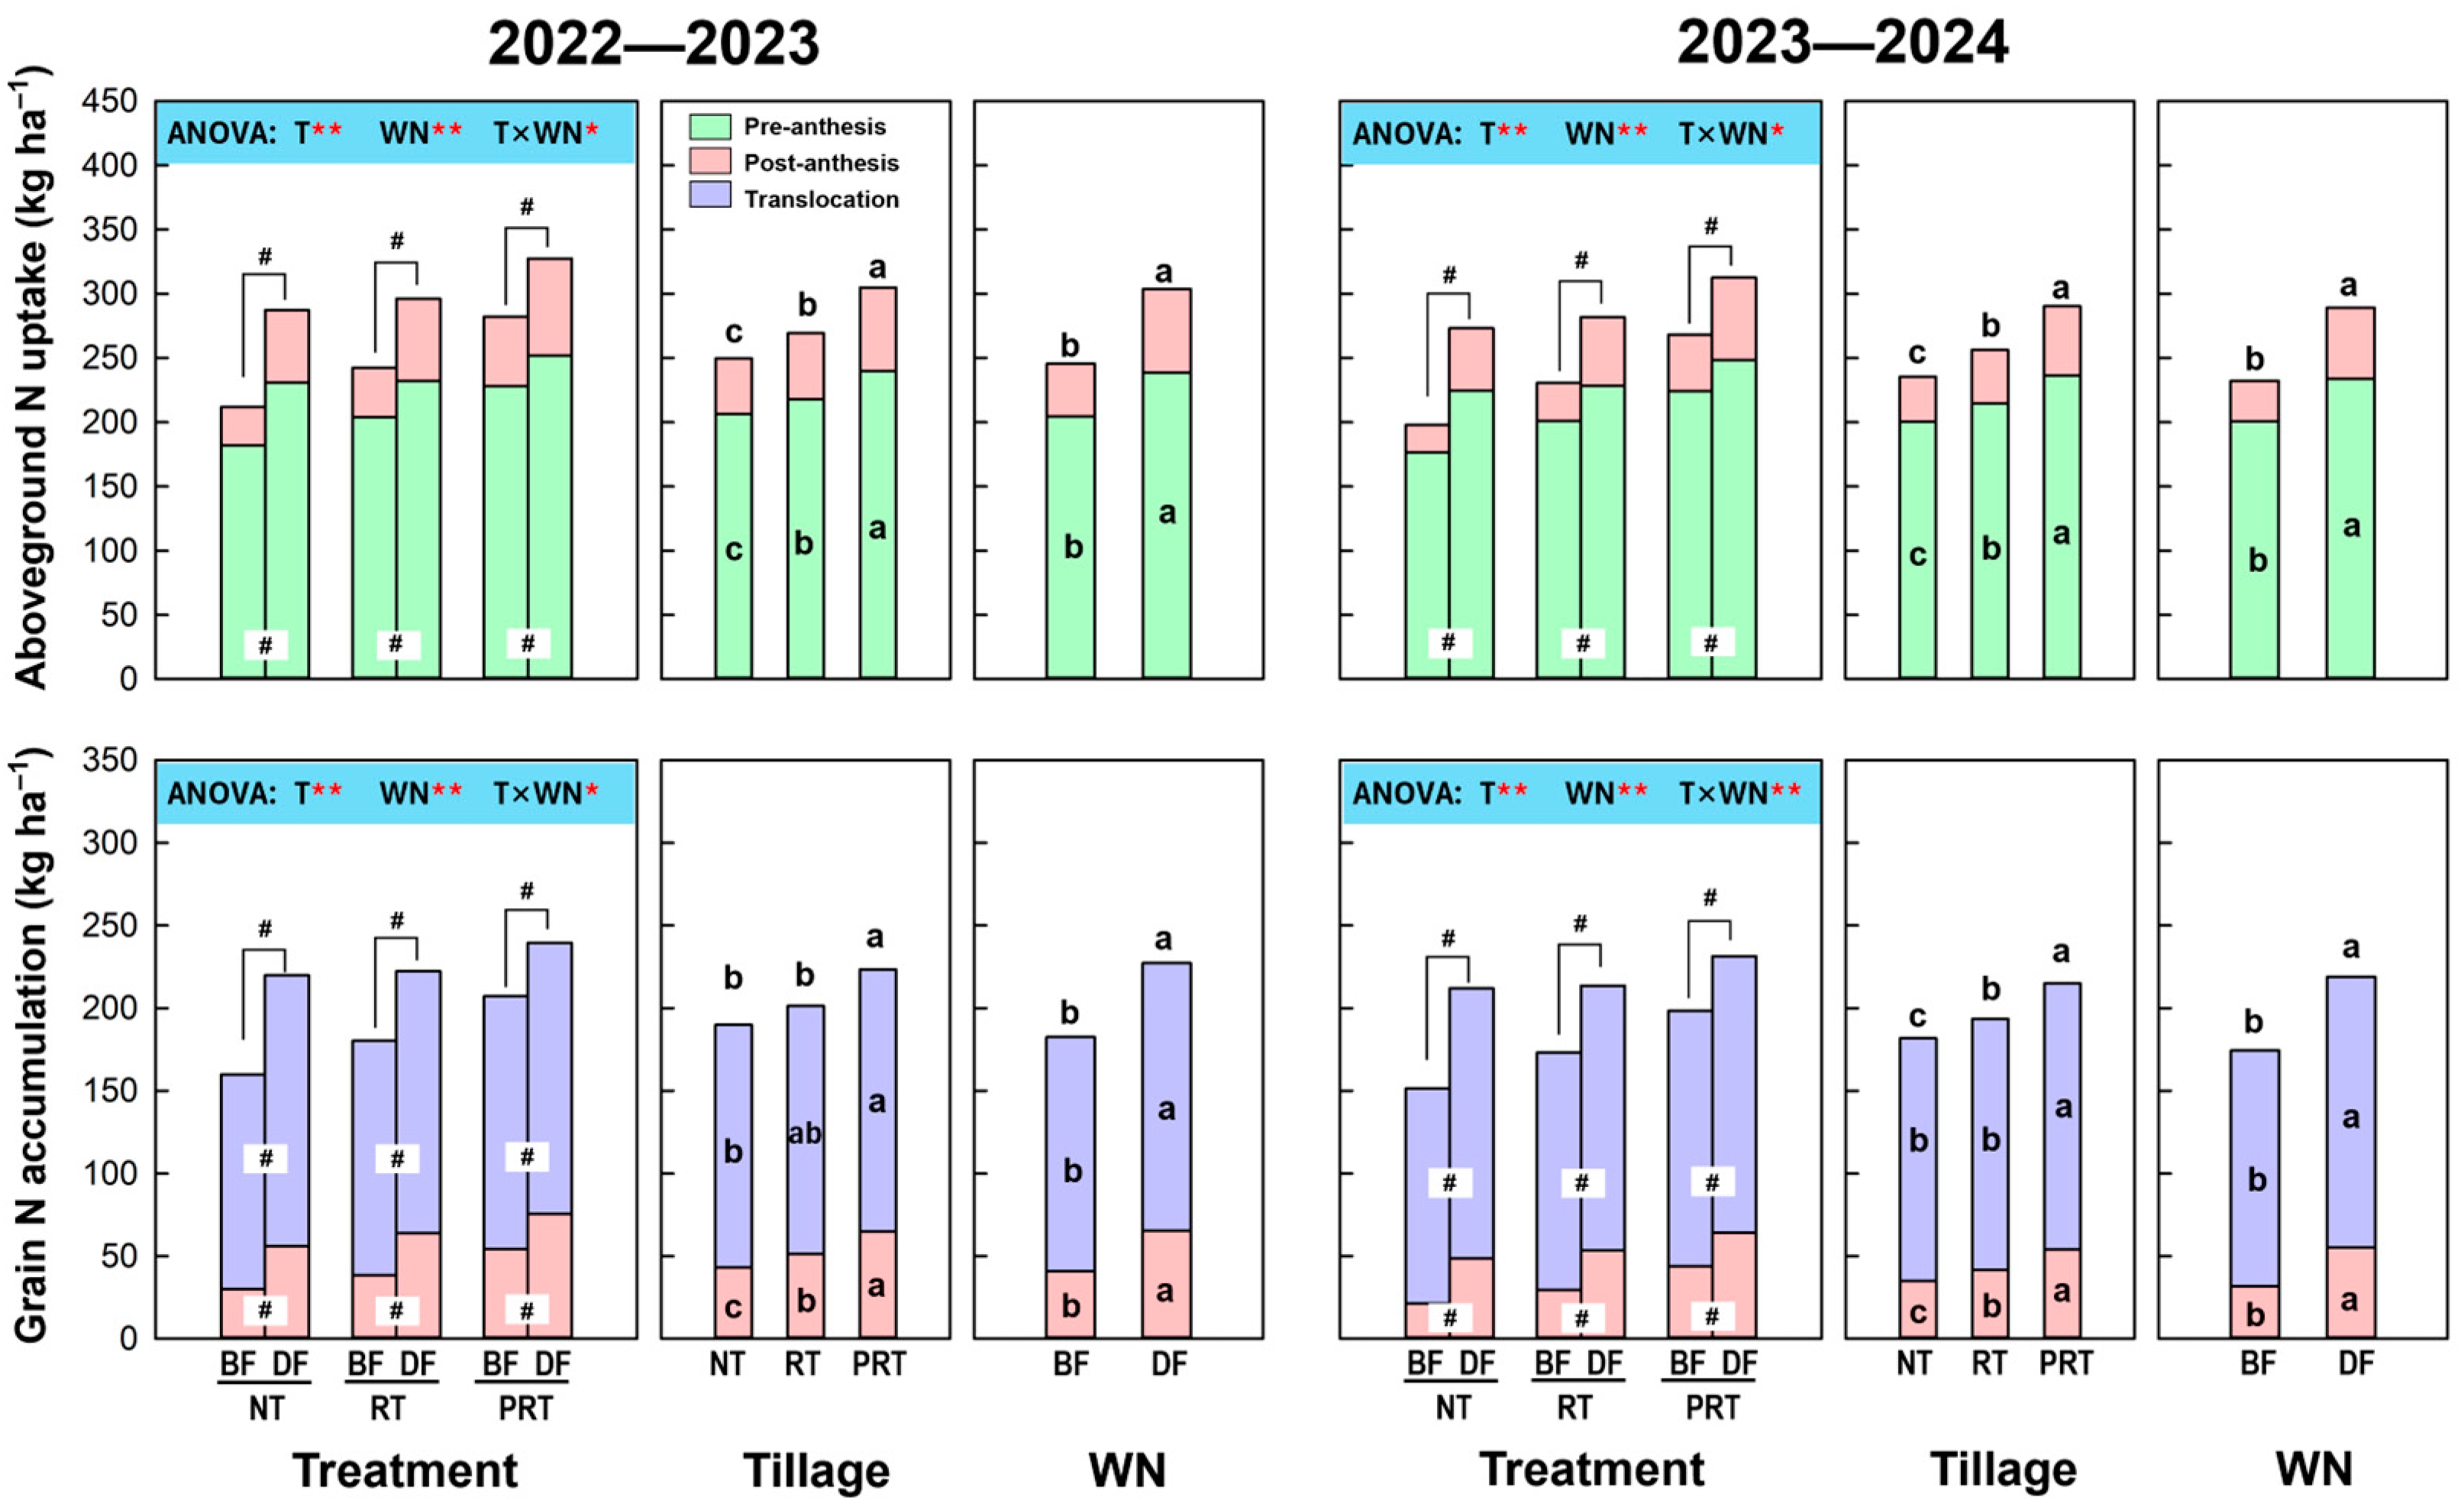
3.1. Nitrogen Uptake and Translocation

Both tillage and WN had significant influences on aboveground N uptake (AGN) and grain N accumulation (GNA) at the maturity of winter wheat (Figure 1). AGN ranged from 212.0 to 327.4 kg ha−1 and from 197.9 to 312.7 kg ha−1 in the 2022–2023 and 2023–2024 seasons, respectively. Averaged across WNs, PRT achieved 13.2–13.3% and 22.1–23.3% higher AGN than RT and NT, respectively. DF increased the average AGN by 23.6–24.5% over BF. Notably, the responses of AGN to DF significantly varied among tillage methods. DF improved the AGN for NT, RT, and PRT by 35.4–38.0%, 22.1–22.2%, and 16.0–16.6%, respectively. The greater AGN by DF under all tillage methods came from the boosted pre-anthesis and post-anthesis N uptake. DF increased pre-anthesis N uptake by 26.9–27.3%, 13.6–13.9%, and 10.5–10.8% under NT, RT, and PRT, respectively. The corresponding percentages for post-anthesis N uptake were 87.1–126.9%, 66.3–80.9% and 39.2–46.5%.
Grain N accumulation (GNA) was significantly affected by tillage and WN, as well as their interaction (Figure 1). PRT accumulated 10.9–11.1% and 17.7–18.3% higher average grain N across WNs than RT and NT, respectively. GNA was significantly increased by DF under all tillage methods. However, the obvious greatest improvement of 37.5–40.1% occurred under NT, followed by RT (23.2–23.4%) and PRT (15.7–16.6%). For all tillage methods, the improved GNA by DF resulted from both the post-anthesis N uptake and NTrans. DF enhanced NTrans by 25.8–26.0%, 11.2–11.4%, and 10.7–10.8% under NT, RT, and PRT.
The Pearson correlation analysis indicated that the yield was significantly correlated with the pre-anthesis N uptake (r2 ≥ 0.9958, p < 0.01), post-anthesis N uptake (r2 ≥ 0.9686, p < 0.01), and AGN (r2 ≥ 0.9962, p < 0.01) in both seasons (Figure 2). Furthermore, the Pearson correlation analysis showed that the increased percentage of yield by DF was significantly related to an increased percentage of N uptake. A significant relationship between increases in yield and N uptake before anthesis and at maturity was observed (r2 ≥ 0.9914, p < 0.01), whereas a relatively weak relationship was observed for post-anthesis N uptake (r2 = 0.8170, p = 0.0134).

3.2. Nitrogen Use, Uptake, and Utilization Efficiencies

The tillage method and WN, as well as their interaction, significantly affected the N use efficiency (NUE) of winter wheat in both seasons (Figure 3). NUE ranged from 18.5 to 25.7 kg kg−1 and from 16.2 to 23.5 kg kg−1 in the 2022–2023 and 2023–2024 seasons, respectively. PRT had a 10.7–10.9% and 16.5–17.2% higher average NUE than RT and NT, respectively. DF increased the average NUE by 16.8–17.8% compared to BF. In addition, the effect of DF on NUE was significantly different among tillage methods. DF improved the NUE under NT, RT, and PRT by 26.2–28.5%, 14.9–15.0%, and 11.0–11.8%, respectively.
Both the tillage method and WN had a significant effect on N uptake efficiency (NUPE) in both seasons (Figure 3). NUPE was valued from 47.9 to 73.9% and from 43.8 to 69.2% in the 2022–2023 and 2023–2024 seasons. Averaged across WNs, NUPE under PRT was 13.2–13.3% and 22.1–23.3% higher than those under RT and NT, respectively. DF boosted NUPE by 23.6–24.5% over BF. The responses of NUPE to DF significantly varied among tillage methods which was evidenced by the significant interaction between tillage and WN. The increase percentages in NUPE by DF for NT, RT, and PRT were 35.4–38.0%, 22.1–22.2%, and 16.0–16.6%, respectively.
Only WN had a significant influence on N utilization efficiency (NUTE), whereas NUTE was not impacted by the tillage method and their interaction (Figure 3). NUTE in the present study ranged from 34.8 to 38.8 kg kg−1 and from 34.0 to 38.1 kg kg−1 in the 2022–2023 and 2023–2024 seasons. Averaged across tillage methods, DF was 5.6–5.7% lower in NUTE than BF.

3.3. Nitrogen Nutrition Index at Anthesis

Both tillage and WN had significant influences on the N nutrition index (NNI) at the anthesis of winter wheat (Figure 4). NNI in the present study ranged from 0.998 to 1.152 and from 1.003 to 1.165 in the 2022–2023 and 2023–2024 seasons, respectively. Averaged across WNs, PRT achieved 5.6–5.7% higher NNI than NT. DF increased the average NNI by 9.2–9.3% compared to BF. Importantly, the effects of DF on NNI significantly differed among tillage methods. A percentage of 14.2–14.4% greater NNI was achieved by DF under NT, followed by 8.6–9.5% for RT and 4.3–5.6% for PRT. In both seasons, grain yield was significantly and linearly related to NNI at anthesis (r2 ≥ 0.9310, p < 0.01) (Figure 5).

3.4. Grain Protein Content and Composition

The tillage method had no significant effect on grain protein content (GPC) or any protein component in either season (Table 1). A significant effect of tillage on the ratio of glutenin to gliadin (GLU/GLI) was observed in the 2022–2023 season, but was not significant in the 2023–2024 season. WN significantly affected GPC, glutenin, gliadin content, as well as GLU/GLI in both seasons. Only GPC, gliadin, and GLU/GLI were significantly impacted by the interaction between tillage and WN. Averaged across tillage methods, WN increased GPC, glutenin, and gliadin content by 6.7–6.8%, 5.0–5.7%, and 14.8–15.2%, respectively, but decreased GLU/GLI by 8.3–8.6%. Increases in GPC by DF compared to BF were 8.9–9.0%, 7.2–7.3%, and 4.2–4.3% under NT, RT, and PRT, respectively. The obvious greater effect of DF on GPC occurred at NT rather than the other tillage methods. A similar situation was observed for gliadin content, but not for glutenin content. Decreases in GLU/GLI by DF were 10.3–13.4%, 8.5–9.0%, and 3.9–4.9% under NT, RT, and PRT, respectively. In both seasons, grain protein content was significantly and linearly related to NNI at anthesis (r2 ≥ 0.9092, p < 0.01) (Figure 6).

3.5. Dough Processing Quality

The tillage method only had a significant effect on maximum tensile resistance in both seasons (Table 2). WN consistently and significantly affected all the dough processing quality traits in both seasons. An insignificant or inconsistent effect of the interaction between tillage and WN was observed for any traits of dough processing quality. Averaged across tillage methods, DF increased water absorption rate by 5.0–5.8% and wet gluten content by 7.0–7.1%, but decreased dough development time and dough stability time, area of stretch, and the maximum tensile resistance by 22.0–24.4%, 19.5–19.9%, 17.6–18.4%, and 15.5–16.1%, respectively.

3.6. Activity of Nitrate Reductase and Glutamine Synthetase in Grains and Flag Leaves

Generally, DF had a positive effect on the activity of nitrate reductase (NR) in grains and flag leaves throughout the post-anthesis phase for all tillage methods (Figure 7). During the process of grain filling, the activity of NR in flag leaves decreased, but it increased first and then decreased in grains in both seasons. For the filling grains, DF significantly and consistently increased the NR activity from the 7th to the 28th day after anthesis under NT. However, the positive effects of DF were relatively weak and of inconsistent statistical significance across two seasons under RT and PRT. For the flag leaves, the obvious highest positive effect of DF on NR activity was observed under NT, followed by RT and PRT.
Glutamine synthetase (GS) activity in grains decreased during the filling process, but it increased first and then decreased, peaking at the 7th day after anthesis (Figure 8). DF also had positive effects on the activity of GS in grains and flag leaves throughout the post-anthesis phase for all tillage methods. Whereas the impact extent of DF varied among tillage methods. The apparent greatest improvement in GS activity occurred under NT and the lowest under PRT in both seasons.

4. Discussion

The results of this study made known the significant influence of both tillage methods and water-nitrogen management on N uptake in irrigated winter wheat. No-tillage (NT) performed with a disadvantage in N absorption compared to intensive tillage (PRT), which was in stark conflict with the results of numerous studies conducted on dryland or rainfed wheat fields where the insufficient water supply was the critical factor for driving N uptake and yield formation [7,35]. A newly published study by Shi et al. [12] found that long-term conservation tillage effectively boosted wheat yield, and improved N uptake by increasing soil water storage and raising surface soil nitrate N levels. Karlen et al. [36] reported that less aggressive or conservative tillage practices were beneficial to achieve and maintain good soil health, including water-stable aggregation and potentially mineralizable nitrogen, thereby enhancing water and nutrient accessibility. However, in regions with sufficient water supply via irrigation, the compacted topsoil hinders root development under NT, limiting the plant’s ability to absorb water and nutrients from the subsoil, which in turn restricts wheat aboveground N accumulation and thereby the yield performance [37,38,39]. This study showed that an average superiority of 55.0–55.2 kg ha−1 (22.1–23.3%) in AGN under PRT was more effective over NT. Though both pre- and post-anthesis N uptake contributed to the improved AGN for PRT, the improvement before anthesis of 33.3–35.9 kg ha−1 was obviously greater than that of 19.1–21.9 kg ha−1 after anthesis. These results indicated that the improved pre-anthesis N uptake mainly accounted for the superiority of AGN at maturity under PRT compared to NT.
In recent years, drip fertigation (DF) has gained increasing popularity in cereal production in arid and semi-arid regions and has been proven to boost N uptake and crop yield [3,4,26,40]. Our results showed that, compared with BF, DF significantly increased average AGN by 23.6–24.5% (57.0–58.0 kg ha−1) which was mainly attributed to the greater N uptake before anthesis. This is consistent with the results reported by Tong et al. [4] and previous studies focusing on maize conducted in semi-arid areas of northeastern China [41] and in the North China Plain [42].
More importantly, our results highlighted the greater response in N uptake to DF under NT compared to RT and PRT (i.e., 35.4–38.0% vs. 22.1–22.2% and 16.0–16.6%). Additionally, the regression analysis indicated that the yield response to DF was driven by the response in N uptake (Figure 2). Zhang et al. [43] reported that, compared to NT, deep tillage (30–40 cm depth) decreased surface soil (0–20 cm layer) bulk density and increased soil porosity during the overwintering period and inorganic N content in the North China Plain. It was also reported that the reduced tillage practice increased mean bulk density but decreased the average soil porosity within the 0–45 cm soil layer, thereby decreasing irrigated winter wheat yield [44]. This might be explained by the fact that the topsoil underneath the cultivator depth in the reduced tillage or no-tillage developed a “no-till pan” [45] which would reduce the root growth and absorption of water and nutrients, eventually restricting yield performance and resources use efficiency [37]. In irrigated wheat-soybean rotation systems in Japan, wheat roots were more concentrated in the surface (0–5 cm) layer under a no-tillage practice, but it distributed more in a deep (20–25 cm) layer of the soil under subsoiling practices with a cultivation depth of 25 cm [46]. It was reasonable to infer that the inferior soil structure limited wheat root development (i.e., water and nutrient absorbing ability), thereby reducing AGN and yield under NT and RT with conventional water and N management–BF in this research. Tong et al. [4] and Li et al. [47] found that, compared to BF, DF significantly increased the surface soil NO3-N content that optimized the availability of nutrients around the root zone, ultimately resulting in higher AGN and yield. In contrast, wheat root development indicators (root length density, surface density, and dry weight density) all decreased under DF, especially in the surface soil layer. In other words, DF boosted AGN and yield mainly by optimizing the availability of N nutrients instead of enlarging the potential absorbing ability of the root system. These above findings encouraged us to attribute the greater gain in N uptake under NT and RT to the optimized availability of N nutrients in surface soil by switching BF to DF. It is desirable to quantify the responses of the soil inorganic N distribution, soil structure, and root architecture to DF throughout the growth season to clearly confirm the above inference in the future.
Crop NUE depends not only on the N uptake efficiency (NUPE) but also on the N utilization efficiency (NUTE) [5,29,48,49,50]. In this study, because the N supply (the sum of N fertilizer input and soil N in the form of NO3 and NH4+ within the depth of 1.0 m) was the same for all treatments, the NUPE could be regarded as the N uptake which had been discussed above. For NUTE, DF displayed an insignificant or weak downregulation for all tillage methods that was contrary to NUPE. Similar observations were reported by Yin et al. [51], Dai et al. [48], and Tong et al. [4]. This could be explained by the law of diminishing returns. Furthermore, the degrees of downregulation in NUTE were obviously lower than the upregulation in NUPE. Herein, DF significantly enhanced the NUE for all tillage methods. Additionally, the greatest gain in NUPE also resulted in the highest response of NUE (26.2–28.5%) to DF under NT.
Nitrogen nutrition index (NNI) is a widely used indicator for evaluating crop N condition [30,51,52,53]. Aside from the N fertilizer rate, irrigation, and fertilization method, the soil tillage also substantially affected crop NNI [54,55]. DF significantly increased NNI for all tillage methods in both years but degrees varied among tillage methods. The greatest improvement in NNI at anthesis by DF of 14.2–14.4% and the lowest of 4.3–5.6% occurred under NT and PRT. On the other hand, there was no significant difference between the tillage methods under DF. These results suggested that DF could fill the gap in crop N nutrition status caused by the poor tillage practice under BF. When the NNI value was not less than 1.0, aboveground N concentration or N uptake would not limit biomass synthesis [52]. In our study, at anthesis, wheat crop NNI of all tillage methods under both BF and DF was close to or beyond 1.0. Similar NNI values at anthesis were recorded by [51,56]. Our results also showed that both grain yield and protein content were significantly and positively related to NNI at anthesis (Figure 5 and Figure 6). This suggested that enhancing the NNI and maintaining it beyond 1.0 at anthesis might be addressed as an effective approach to synchronously improve grain yield and nutritional quality. An NNI of 1.0 could ensure that the wheat crop only possessed an expected quantity of functional N (the sum of structure N and photosynthetic N) for biomass production but without extra storage N. However, from anthesis to maturity, the grain structure establishment and grain protein synthesis required large amounts of N (in the form of nitrogenous compounds) which far exceeded the absorption by roots from the soil. Therefore, adequate or appropriate storage N reserve (i.e., NNI of 1.15) at anthesis and its effective remobilization from vegetative organs to developing grains were necessary for achieving high yield and good quality.
Our results showed that DF significantly increased the grain protein content (GPC) which was attributed to both improved glutenin and gliadin contents. The same situations were also reported by Tong et al. [3] under drip fertigation and Yao et al. [31] under micro-sprinkling fertigation. Hu et al. [57] reported that splitting and delaying N applications improved GPC by 5.2% in relation to a single dose. In this study, the N topdressing was split into four times at the regreening, jointing, booting, and heading stages which also improved the activities of glutamine synthetase (GS) and nitrate reductase (NR) in developing grain and flag leaf under all tillage methods in varying degrees. Thus, the glutenin, gliadin and GPC contents were improved and, consequently, the water absorption rate (WAR) and wet gluten content (WGC) were optimized under DF. However, dough development time (DDT), dough stability time (DST), area of stretch (AS), and maximum tensile resistance (MTR) were decreased under DF compared to BF. It was reported that the glutenin content and ratio of glutenin to gliadin (GLU/GLI) govern the dough properties [1,2,58,59]. Though glutenin and gliadin contents both increased under DF, the greater improvement in gliadin than glutenin (14.8–15.2% vs. 5.0–5.7%) resulted in a lower ratio of glutenin to gliadin (GLU/GLI). Similar results were observed in reports by Yao et al. [2] and Tong et al. [4]. Similar to N uptake, the GPC and gliadin content were boosted by DF at the greatest degree under NT. This might be attributed to the greater positive responses of GS and NR in developing grain and the flag leaf under NT compared to other tillage methods. Xue et al. [60] found that optimizing the N supply during the later stage would benefit gluten protein synthesis and accumulation. This was because the substantially boosted N metabolism in the flag leaf increased the amino acid source to developing grains [5,61].

5. Conclusions

Drip fertigation increased the average AGN across three tillage methods by 23.6–24.5%, but the response of AGN to drip fertigation was significantly different between tillage methods. Drip fertigation boosted N uptake (i.e., NUPE) by 35.4–38.0%, 22.1–22.2%, and 16.0–16.6% under NT, RT, and PRT, respectively. Drip fertigation only had weak or insignificant negative effects on NUTE. Therefore, NUE was significantly enhanced by drip fertigation. Due to boosted N uptake at anthesis, drip fertigation also enhanced NNI, with the greatest improvement under NT. Drip fertigation increased glutenin, gliadin, and total protein contents leading to superior water absorption rate and wet gluten content, but decreased the ratio of glutenin to gliadin, resulting in inferior dough properties. The greatest improvement in the above contents of proteins occurred under NT. In summary, drip fertigation is the effective and practical management for boosting N uptake and use efficiencies, optimizing crop N nutrition status, and enhancing grain protein content and composition, especially for irrigated wheat production with no-tillage.

Supplementary Materials

The following are available online at https://www.mdpi.com/article/10.3390/agronomy15030588/s1, Table S1: Irrigation and N fertilizer management; Figure S1: Daily mean temperature, solar radiation, and precipitation recorded from sowing to maturity in 2022–2023 and 2023–2024 growing seasons.

Author Contributions

Conceptualization, Y.W.; methodology, Y.W. and D.W.; software, Y.W. and Y.F.; validation, Y.W. and D.W.; formal analysis, Y.F., W.L., L.Z., Y.W. and D.W.; investigation, Y.F., W.L., L.Z. and J.S.; resources, D.W. and J.S.; data curation, Y.F. and Y.W.; writing—original draft preparation, Y.F.; writing—review and editing, D.W., J.X., Y.W. and Z.G.; visualization, Y.W.; supervision, Y.W. and Z.G.; project administration, Y.W. and J.X.; funding acquisition, Y.W. and Z.G. All authors have read and agreed to the published version of the manuscript.

Funding

This work was supported by the Shanxi Province Major Science and Technology Special Project (202301140601014-06); the Shanxi Fundamental Research Program (202303021222074); the Shanxi Agricultural University Scientific Research Fund (2020BQ41); the Shanxi Graduate Education and Practice Innovation Project (2024SJ123); and the Shanxi University Technological Innovations Plan (2021L171).

Data Availability Statement

Data are contained within the article.

Conflicts of Interest

The authors declare no conflicts of interest.

References

  1. Zhang, Y.; Dai, X.; Jia, D.; Li, H.; Wang, Y.; Li, C.; Xu, H.; He, M. Effects of Plant Density on Grain Yield, Protein Size Distribution, and Breadmaking Quality of Winter Wheat Grown under Two Nitrogen Fertilisation Rates. Eur. J. Agron. 2016, 73, 1–10. [Google Scholar] [CrossRef]
  2. Yao, C.; Li, J.; Gao, Y.; Zhang, Z.; Liu, Y.; Sun, Z.; Wang, Z.; Zhang, Y. Delayed Application of Water and Fertilizer Increased Wheat Yield but Did Not Improve Quality Parameters. Field Crops Res. 2024, 319, 109649. [Google Scholar] [CrossRef]
  3. Tong, J.; Xiong, Y.; Lu, Y.; Li, W.; Lin, W.; Xue, J.; Sun, M.; Wang, Y.; Gao, Z. Drip Fertigation Enhances the Responses of Grain Yield and Quality to Nitrogen Topdressing Rate in Irrigated Winter Wheat in North China. Plants 2024, 13, 1439. [Google Scholar] [CrossRef]
  4. Tong, J.; Xiong, Y.; Lu, Y.; Li, W.; Lin, W.; Xue, J.; Sun, M.; Wang, Y.; Gao, Z. Drip Fertigation with Moderate Nitrogen Topdressing Rate Achieves High Nitrogen and Water Use Efficiencies forIrrigated Wheat. Agronomy 2025, 15, 259. [Google Scholar] [CrossRef]
  5. Cui, H.; Luo, Y.; Li, C.; Chang, Y.; Jin, M.; Li, Y.; Wang, Z. Effects of Nitrogen Forms on Nitrogen Utilization, Yield, and Quality of Two Wheat Varieties with Different Gluten Characteristics. Eur. J. Agron. 2023, 149, 126919. [Google Scholar] [CrossRef]
  6. Liu, B.; Zhao, X.; Li, S.; Zhang, X.; Virk, A.L.; Qi, J.; Kan, Z.; Wang, X.; Ma, S.; Zhang, H. Meta-analysis of Management-induced Changes in Nitrogen Use Efficiency of Winter Wheat in the North China Plaine. J. Clean. Prod. 2020, 251, 119632. [Google Scholar] [CrossRef]
  7. Adil, M.; Lv, F.; Li, T.; Chen, Y.; Gul, I.; Lu, H.; Lu, S.; Qiu, L. Long-term Effects of Management Practices on Soil Water, Yield and Water Use of Dryland Wheat: A Global Meta-analysis. Eur. J. Soil Sci. 2024, 75, e13541. [Google Scholar] [CrossRef]
  8. Liu, E.; Zhao, B.; Mei, X.; So, H.; Li, J.; Li, X. Effects of no-tillage management on soil biochemical characteristics in northern China. J. Agric. Sci. 2010, 148, 217–223. [Google Scholar] [CrossRef]
  9. Pittelkow, C.M.; Liang, X.; Linquist, B.A.; van Groenigen, K.J.; Lee, J.; Lundy, M.E.; van Gestel, N.; Six, J.; Venterea, R.T.; van Kessel, C. Productivity Limits and Potentials of the Principles of Conservation Agriculture. Nature 2015, 517, 365–368. [Google Scholar] [CrossRef]
  10. Stagnari, F.; Galieni, A.; Speca, S.; Cafiero, G.; Pisante, M. Effects of Straw Mulch on Growth and Yield of Durum Wheat during Transition to Conservation Agriculture in Mediterranean Environment. Field Crops Res. 2014, 167, 51–63. [Google Scholar] [CrossRef]
  11. Adil, M.; Lv, F.; Cao, L.; Lu, H.; Lu, S.; Gul, I.; Bashir, S.; Wang, Z.; Li, T.; Feng, W. Long-term Effects of Agronomic Practices on Winter Wheat Yield and NUE in Dryland Regions of USA and China: A Long-term Meta-analysis. Sci. Rep. 2024, 14, 24777. [Google Scholar] [CrossRef]
  12. Shi, X.; Liu, X.; Jing, J.; Zhang, Y.; Li, P.; Zong, Y.; Zhang, D.; Hao, X. Long-Term No Tillage Straw Mulching Increased Soil Water and Nitrogen Storage in Dryland Wheat on the Loess Plateau, but May Increase Dissolved Organic Nitrogen Leaching. Field Crops Res. 2025, 322, 109705. [Google Scholar] [CrossRef]
  13. Yang, H.; Wu, G.; Mo, P.; Chen, S.; Wang, S.; Xiao, Y.; Ma, H.A.; Wen, T.; Guo, X.; Fan, G. The Combined Effects of Maize Straw Mulch and No-tillage on Grain Yield and Water and Nitrogen Use Efficiency of Dry-land Winter Wheat (Triticum aestivum L.). Soil Tillage Res. 2020, 197, 104485. [Google Scholar] [CrossRef]
  14. Zhao, K.; Wu, J.; Huang, M.; Li, Y.; Zhao, G.; Fu, G.; Wang, C.; Zhang, Z.; Hou, Y.; Yang, Z. Meta Anlysis of the Effects of Tillage Methods on Grain Yield and Water Use Efficiency in Henan. J. Triticeae Crops 2021, 41, 891–903. [Google Scholar] [CrossRef]
  15. Wang, Y.; Song, J.; Li, W.; Yan, T.; Wang, D.; Xue, J.; Gao, Z. Wheat Yield, Biomass, and Radiation Interception and Utilization Under Conservation Tillage: Greater Response to Drip Fertigation Compared to Intensive Tillage. Agronomy 2024, 14, 2849. [Google Scholar] [CrossRef]
  16. Wang, H.; Wu, L.; Cheng, M.; Fan, J.; Zhang, F.; Zou, Y.; Chau, H.W.; Gao, Z.; Wang, X. Coupling Effects of Water and Fertilizer on Yield, Water and Fertilizer Use Efficiency of Drip-Fertigated Cotton in Northern Xinjiang, China. Field Crops Res. 2018, 219, 169–179. [Google Scholar] [CrossRef]
  17. Wang, X.; Xiang, Y.; Guo, J.; Tang, Z.; Zhao, S.; Wang, H.; Li, Z.; Zhang, F. Coupling Effect Analysis of Drip Irrigation and Mixed Slow-release Nitrogen Fertilizer on Yield and Physiological Characteristics of Winter Wheat in Guanzhong Area. Field Crops Res. 2023, 302, 109103. [Google Scholar] [CrossRef]
  18. Guo, J.; Fan, J.; Xiang, Y.; Zhang, F.; Yan, S.; Zhang, X.; Zheng, J.; Li, Y.; Tang, Z.; Li, Z. Coupling Effects of Irrigation Amount and Nitrogen Fertilizer Type on Grain Yield, Water Productivity and Nitrogen Use Efficiency of Drip-Irrigated Maize. Agric. Water Manag. 2022, 261, 107389. [Google Scholar] [CrossRef]
  19. Cheng, M.; Wang, H.; Zhang, F.; Wang, X.; Liao, Z.; Zhang, S.; Yang, Q.; Fan, J. Effects of Irrigation and Fertilization Regimes on Tuber Yield, Water-nutrient Uptake and Productivity of Potato under Drip Fertigation in Sandy Regions of Northern China. Agric. Water Manag. 2023, 287, 108459. [Google Scholar] [CrossRef]
  20. Fan, J.; Wu, L.; Zhang, F.; Yan, S.; Xiang, Y. Evaluation of Drip Fertigation Uniformity Affected by Injector Type, Pressure Difference and Lateral Layout. Irrig. Drain. 2017, 66, 520–529. [Google Scholar] [CrossRef]
  21. Yan, S.; Wu, Y.; Fan, J.; Zhang, F.; Guo, J.; Zheng, J.; Wu, L. Quantifying Grain Yield, Protein, Nutrient Uptake and Utilization of Winter Wheat Under Various Drip Fertigation Regimes. Agric. Water Manag. 2022, 261, 107380. [Google Scholar] [CrossRef]
  22. Delbaz, R.; Ebrahimian, H.; Abbasi, F.; Ghameshlou, A.N.; Liaghat, A.; Ranazadeh, D. A Global Meta-analysis on Surface and Drip Fertigation for Annual Crops under Different Fertilization Levels. Agric. Water Manag. 2023, 289, 108504. [Google Scholar] [CrossRef]
  23. Wang, J.; Liu, W.; Dang, T.; Sainju, U.M. Nitrogen Fertilization Effect on Soil Water and Wheat Yield in the Chinese Loess Plateau. Agron. J. 2013, 105, 143–149. [Google Scholar] [CrossRef]
  24. Bai, S.; Kang, Y.; Wan, S. Drip Fertigation Regimes for Winter Wheat in the North China Plain. Agric. Water Manag. 2020, 228, 105885. [Google Scholar] [CrossRef]
  25. Zheng, J.; Zhou, M.; Zhu, B.; Fan, J.; Lin, H.; Ren, B.; Zhang, F. Drip Fertigation Sustains Crop Productivity while Mitigating Reactive Nitrogen Losses in Chinese Agricultural Systems: Evidence from a Meta-analysis. Sci. Total Environ. 2023, 886, 163804. [Google Scholar] [CrossRef] [PubMed]
  26. Li, H.; Mei, X.; Wang, J.; Huang, F.; Hao, W.; Li, B. Drip Fertigation Significantly Increased Crop Yield, Water Productivity and Nitrogen Use Efficiency with Respect to Traditional Irrigation and Fertilization Practices: A meta-Analysis in China. Agric. Water Manag. 2021, 244, 106534. [Google Scholar] [CrossRef]
  27. Wagner, R. A New Method for Automated Nitrate Determination in Sea Water Using the AutoAnalyzer. In Technicon Symposium; Technicon GmbH: Frankfurt, Germany, 1974. [Google Scholar]
  28. Benesch, R.; Mangelsdorf, P. Eine Methode Zur Colorimetrischen Bestimmung von Ammoniak in Meerwasser. Helgoländer Wiss. Meeresunters 1972, 23, 365–375. [Google Scholar] [CrossRef]
  29. Moll, R.H.; Kamprath, E.J.; Jackson, W.A. Analysis and Interpretation of Factors Which Contribute to Efficiency of Nitrogen Utilization. Agron. J. 1982, 74, 562–564. [Google Scholar] [CrossRef]
  30. Justes, E.; Mary, B.; Meynard, J.-M.; Machet, J.-M.; Thelier-Huchu, L. Determination of a Critical Nitrogen Dilution Curve for Winter Wheat Crops. Ann. Bot. 1994, 74, 397–407. [Google Scholar] [CrossRef]
  31. Yao, C.; Ren, J.; Li, H.; Zhang, Z.; Wang, Z.; Sun, Z.; Zhang, Y. Can Wheat Yield, N Use Efficiency and Processing Quality Be Improved Simultaneously? Agric. Water Manag. 2023, 275, 108006. [Google Scholar] [CrossRef]
  32. Rossmann, A.; Buchner, P.; Savill, G.P.; Hawkesford, M.J.; Scherf, K.A.; Mühling, K.H. Foliar N application at anthesis alters grain protein composition and enhances baking quality in winter wheat only under a low N fertiliser regimen. Eur. J. Agron. 2019, 109, 125909. [Google Scholar] [CrossRef]
  33. AACC. Approved Methods of the American Association of Cereal Chemists; AACCI: St. Paul, MN, USA, 2000; Available online: https://books.google.com/books/about/Approved_Methods_of_the_American_Associa.html?id=pagQAQAAMAAJ (accessed on 26 February 2025).
  34. AACC. Approved Methods of Analysis, 11th ed.; AACCI: St. Paul, MN, USA, 2010; Available online: https://www.cerealsgrains.org/resources/methods/Pages/default.aspx (accessed on 26 February 2025).
  35. Passioura, J.B.; Angus, J.F. Improving Productivity of Crops in Water-Limited Environments. Advan. Agron. 2010, 106, 37–75. [Google Scholar] [CrossRef]
  36. Karlen, D.L.; Cambardella, C.A.; Kovar, J.L.; Colvin, T.S. Soil Quality Response to Long-Term Tillage and Crop Rotation Practices. Soil Tillage Res. 2013, 133, 54–64. [Google Scholar] [CrossRef]
  37. Huang, G.; Chai, Q.; Feng, F.; Yu, A. Effects of Different Tillage Systems on Soil Properties, Root Growth, Grain Yield, and Water Use Efficiency of Winter Wheat (Triticum aestivum L.) in Arid Northwest China. J. Integr. Agric. 2012, 11, 1286–1296. [Google Scholar] [CrossRef]
  38. Ogle, S.M.; Swan, A.; Paustian, K. No-till Management Impacts on Crop Productivity, Carbon Input and Soil Carbon Sequestration. Agric. Ecosyst. Environ. 2012, 149, 37–49. [Google Scholar] [CrossRef]
  39. Blanco-Canqui, H.; Ruis, S.J. No-tillage and Soil Physical Environment. Geoderma 2018, 326, 164–200. [Google Scholar] [CrossRef]
  40. Abubakar, S.A.; Hamani, A.K.M.; Chen, J.; Traore, A.; Abubakar, N.A.; Ibrahim, A.U.; Wang, G.; Gao, Y.; Duan, A. Optimized Drip Fertigation Scheduling Improves Nitrogen Productivity of Winter Wheat in the North China Plain. J. Soil Sci. Plant Nutr. 2022, 22, 2955–2968. [Google Scholar] [CrossRef]
  41. Hou, Y.; Xu, X.; Kong, L.; Zhang, L.; Zhang, Y.; Liu, Z. Improving Nitrogen Contribution in Maize Post-Tasseling Using Optimum Management under Mulch Drip Irrigation in the Semiarid Region of Northeast China. Front. Plant Sci. 2022, 13, 1095314. [Google Scholar] [CrossRef] [PubMed]
  42. Xu, S.; Wei, Y.; Laghari, A.H.; Yang, X.; Wang, T. Modelling Effect of Different Irrigation Methods on Spring Maize Yield, Water and Nitrogen Use Efficiencies in the North China Plain. Math. Biosci. Engin. 2021, 18, 9651–9668. [Google Scholar] [CrossRef]
  43. Zhang, D.; Hao, X.; Fan, Z.; Hu, X.; Ma, J.; Guo, Y.; Wu, L. Optimizing Tillage and Fertilization Patterns to Improve Soil Physical Properties, NUE and Economic Benefits of Wheat-Maize Crop Rotation Systems. Agriculture 2022, 12, 1264. [Google Scholar] [CrossRef]
  44. He, J.; Shi, Y.; Yu, Z. Subsoiling Improves Soil Physical and Microbial Properties, and Increases Yield of Winter Wheat in the Huang-Huai-Hai Plain of China. Soil Tillage Res. 2019, 187, 182–193. [Google Scholar] [CrossRef]
  45. Schlüter, S.; Großmann, C.; Diel, J.; Wu, G.-M.; Tischer, S.; Deubel, A.; Rücknagel, J. Long-Term Effects of Conventional and Reduced Tillage on Soil Structure, Soil Ecological and Soil Hydraulic Properties. Geoderma 2018, 332, 10–19. [Google Scholar] [CrossRef]
  46. Izumi, Y.; Yoshida, T.; Iijima, M. Effects of Subsoiling to the Non-Tilled Field of Wheat-Soybean Rotation on the Root System Development, Water Uptake, and Yield. Plant Prod. Sci. 2009, 12, 327–335. [Google Scholar] [CrossRef]
  47. Li, J.; Xu, X.; Lin, G.; Wang, Y.; Liu, Y.; Zhang, M.; Zhou, J.; Wang, Z.; Zhang, Y. Micro-Irrigation Improves Grain Yield and Resource Use Efficiency by Co-Locating the Roots and N-Fertilizer Distribution of Winter Wheat in the North China Plain. Sci. Total Environ. 2018, 643, 367–377. [Google Scholar] [CrossRef]
  48. Dai, X.; Wang, Y.; Dong, X.; Qian, T.; Yin, L.; Dong, S.; Chu, J.; He, M. Delayed Sowing Can Increase Lodging Resistance While Maintaining Grain Yield and Nitrogen Use Efficiency in Winter Wheat. Crop J. 2017, 5, 541–552. [Google Scholar] [CrossRef]
  49. Zhang, H.; Zhang, J.; Yang, J. Yang a Improving nitrogen use efficiency of rice crop through an optimized root system and agronomic practices. Crop Environ. 2023, 2, 192–201. [Google Scholar] [CrossRef]
  50. Yang, H.; Li, J.; Wu, G.; Huang, X.; Fan, G. Maize Straw Mulching with No-Tillage Increases Fertile Spike and Grain Yield of Dryland Wheat by Regulating Root-Soil Interaction and Nitrogen Nutrition. Soil Tillage Res. 2023, 228, 105652. [Google Scholar] [CrossRef]
  51. Yin, L.; Dai, X.; He, M. Delayed Sowing Improves Nitrogen Utilization Efficiency in Winter Wheat without Impacting Yield. Field Crops Res. 2018, 221, 90–97. [Google Scholar] [CrossRef]
  52. Lemaire, G.; Jeuffroy, M.H.; Gastal, F. Diagnosis Tool for Plant and Crop N Status in Vegetative Stage Theory and Practices for Crop N Management. Eur. J. Agron. 2008, 28, 614–624. [Google Scholar] [CrossRef]
  53. Yao, B.; Wang, X.L.; Lemaire, G.; Makowski, D.; Cao, Q.; Liu, X.J.; Liu, L.L.; Liu, B.; Zhu, Y.; Cao, W.X.; et al. Uncertainty Analysis of Critical Nitrogen Dilution Curves for Wheat. Eur. J. Agron. 2021, 128, 126315. [Google Scholar] [CrossRef]
  54. Lemaire, G.; Gastal, F. N uptake and Distribution in Plant Canopies. In Diagnosis of the Nitrogen Status in Crops; Lemaire, G., Ed.; Springer: Heidelberg, Germany, 1997; pp. 3–43. [Google Scholar]
  55. Jeuffroy, M.; Bouchard, C. Intensity and Duration of Nitrogen Deficiency on Wheat Grain Number. Crop Sci. 1999, 39, 1385–1393. [Google Scholar] [CrossRef]
  56. Ye, T.; Liu, B.; Wang, X.; Zhou, J.; Liu, L.; Tang, L.; Cao, W.; Zhu, Y. Effects of Water-Nitrogen Interactions on the Fate of Nitrogen Fertilizer in a Wheat-Soil System. Eur. J. Agron. 2022, 136, 126507. [Google Scholar] [CrossRef]
  57. Hu, C.; Sadras, V.O.; Lu, G.; Zhang, P.; Han, Y.; Liu, L.; Xie, J.; Yang, X.; Zhang, S. A Global Meta-Analysis of Split Nitrogen Application for Improved Wheat Yield and Grain Protein Content. Soil Tillage Res. 2021, 213, 105111. [Google Scholar] [CrossRef]
  58. Johansson, E.; Prieto-Linde, M.L.; Jönsson, J.Ö. Effects of Wheat Cultivar and Nitrogen Application on Storage Protein Composition and Breadmaking Quality. Cereal Chem. 2001, 78, 19–25. [Google Scholar] [CrossRef]
  59. Zhang, P.; He, Z.; Zhang, Y.; Xia, X.; Chen, D.; Zhang, Y. Association between % SDS-unextractable Polymeric Protein (%UPP) and End-use Quality in Chinese Bread Wheat Cultivars. Cereal Chem. 2008, 85, 696–700. [Google Scholar] [CrossRef]
  60. Xue, C.; Auf’M Erley, G.S.; Rossmann, A.; Schuster, R.; Koehler, P.; Mühling, K.-H. Split Nitrogen Application Improves Wheat Baking Quality by Influencing Protein Composition Rather Than Concentration. Front. Plant Sci. 2016, 7, 738. [Google Scholar] [CrossRef] [PubMed]
  61. Lyu, X.; Liu, Y.; Li, N.; Ku, L.; Hou, Y.; Wen, X. Foliar Applications of Various Nitrogen (N) Forms to Winter Wheat Affect Grain Protein Accumulation and Quality via N Metabolism and Remobilization. Crop J. 2022, 10, 1165–1177. [Google Scholar] [CrossRef]
Figure 1. Aboveground N uptake (AGN) and grain N accumulation (GNA) N of winter wheat at maturity. * and **, significant at 0.05 and 0.01 probability levels, respectively. Data are means, and different lowercase letters indicate significant differences among the means of three tillage methods or two water-nitrogen (WN) management according to the least significant difference test (α = 0.05). # indicates a significant difference between BF and DF under the specific tillage method according to the Student’s t test (α = 0.05).
Agronomy 15 00588 g001
Figure 2. The correlations between grain yield and N uptake (for each season, n = 6), and between increase in yield and increase in N uptake by DF (n = 6).
Agronomy 15 00588 g002
Figure 3. N use efficiency (NUE), N uptake efficiency (NUPE), and N utilization efficiency (NUTE) of winter wheat. * and **, significant at 0.05 and 0.01 probability levels, respectively; ns, not significant at 0.05 probability level. Data are means and error bars are SD (n = 4). Different lowercase letters indicate significant differences among the means of three tillage methods or two water-nitrogen (WN) management according to the least significant difference test (α = 0.05). # indicates a significant difference between BF and DF under the specific tillage method according to the Student’s t test (α = 0.05).
Agronomy 15 00588 g003
Figure 4. Nitrogen nutrition index at anthesis. * and **, significant at 0.05 and 0.01 probability levels, respectively. Data are means and error bars are SD (n = 4). Different lowercase letters indicate significant differences among the means of three tillage methods or two water-nitrogen (WN) management according to the least significant difference test (α = 0.05). # indicates a significant difference between BF and DF under the specific tillage method according to the Student’s t test (α = 0.05).
Agronomy 15 00588 g004
Figure 5. The correlations between grain yield and N nutrition index (NNI) at anthesis (for each season, n = 6).
Agronomy 15 00588 g005
Figure 6. The correlations between grain protein content and N nutrition index (NNI) at anthesis (for each season, n = 6).
Agronomy 15 00588 g006
Figure 7. Dynamics of the activity of nitrate reductase in grains and flag leaves of winter wheat after anthesis. Data are means and error bars are SD (n = 4). * and ** indicate that there is a significant difference between BF and DF under a specific tillage method according to the Student’s t test at α = 0.05 and 0.01, respectively.
Agronomy 15 00588 g007
Figure 8. Dynamics of the activity of glutamine synthetase in grains and flag leaves of winter wheat after anthesis. Data are means and error bars are SD (n = 4). * and ** indicate that there is a significant difference between BF and DF under a specific tillage method according to the Student’s t test at α = 0.05 and 0.01, respectively.
Agronomy 15 00588 g008
Table 1. Grain protein content and composition of winter wheat.
SeasonTillageWNGPC
%
GLU
%
GLI
%
GLO
%
ALB
%
OP
%
GLU/GLI
2022–2023NTBF12.76 c5.19 c3.87 c0.78 a2.19 a0.73 a1.34 a
DF13.90 a5.47 ab4.72 a0.79 a2.18 a0.74 a1.16 d
RTBF13.00 bc5.21 bc4.06 bc0.80 a2.20 a0.73 a1.29 b
DF13.95 a5.53 a4.70 a0.79 a2.19 a0.73 a1.18 d
PRTBF13.25 b5.24 bc4.27 b0.80 a2.20 a0.74 a1.23 c
DF13.80 a5.45 abc4.65 a0.79 a2.19 a0.73 a1.17 d
MEANNT13.33 A5.33 A4.30 B0.79 A2.18 A0.73 A1.25 A
RT13.48 A5.37 A4.38 AB0.80 A2.20 A0.73 A1.23 AB
PRT13.53 A5.34 A4.46 A0.79 A2.19 A0.73 A1.20 B
BF13.00 B5.22 B4.07 B0.79 A2.19 A0.73 A1.28 A
DF13.89 A5.48 A4.69 A0.79 A2.19 A0.73 A1.17 B
ANOVATnsnsnsnsnsns*
WN******nsnsns**
T × WN*ns*nsnsns*
2023–2024NTBF13.20 c5.41 b3.97 c0.81 a2.26 a0.75 a1.36 a
DF14.39 a5.79 a4.75 a0.82 a2.26 a0.77 a1.22 c
RTBF13.46 bc5.47 b4.11 bc0.83 a2.27 a0.78 a1.33 ab
DF14.43 a5.80 a4.80 a0.82 a2.27 a0.73 a1.21 c
PRTBF13.71 b5.54 b4.31 b0.83 a2.28 a0.75 a1.29 b
DF14.29 a5.78 a4.68 a0.82 a2.27 a0.74 a1.24 c
MEANNT13.80 A5.60 A4.36 A0.81 A2.26 A0.76 A1.29 A
RT13.95 A5.64 A4.46 A0.82 A2.27 A0.76 A1.27 A
PRT14.00 A5.66 A4.49 A0.82 A2.27 A0.75 A1.26 A
BF13.46 B5.48 B4.13 B0.82 A2.27 A0.76 A1.33 A
DF14.37 A5.79 A4.74 A0.82 A2.26 A0.75 A1.22 B
ANOVATnsnsnsnsnsnsns
WN******nsnsns**
T × WN*ns*nsnsns**
GPC, grain protein content; GLU, glutenin content; GLI, gliadin content; GLO, globulin content; ALB, albumin content; OP, other proteins content; GLU/GLI, the ratio of glutenin to gliadin. *, **, significant at 0.05 and 0.01 probability levels, respectively; ns, not significant at 0.05 probability level. Different uppercase letters indicate a significant difference between the means of WNs across three tillage methods, or between tillage methods across two WNs, according to the least significant difference test (α = 0.05). Within a column and a season, different lowercase letters indicate a significant difference between treatments (tillage method combined WN) according to the least significant difference test (α = 0.05).
Table 2. Dough processing quality of winter wheat.
SeasonTillageWNWAR
%
DDT
min
DST
min
WGC
%
AS
cm2
MTR
BU
2022–2023NTBF58.70 c4.17 a3.58 a28.70 c43.30 b216.44 b
DF62.20 a3.12 c2.71 d31.30 abc37.20 c193.32 c
RTBF59.70 bc4.13 a3.50 ab29.60 bc47.11 a238.09 a
DF62.40 a3.26 b2.82 cd31.50 ab38.62 c197.87 c
PRTBF60.20 b4.09 a3.38 b30.50 abc46.92 a236.27 a
DF63.00 a3.27 b2.90 c32.30 a37.38 c192.56 c
MEANNT60.45 B3.65 A3.15 A30.00 A40.25 B204.88 B
RT61.05 AB3.70 A3.16 A30.55 A42.87 A217.98 A
PRT61.60 A3.68 A3.14 A31.40 A42.15 A214.42 A
BF59.53 B4.13 A3.49 A29.60 B45.78 A230.27 A
DF62.53 A3.22 B2.81 B31.70 A37.73 B194.58 B
ANOVAT*nsnsns**
WN***********
T × WNns****ns**ns
2023–2024NTBF60.88 a4.49 a3.82 a29.28 b46.16 b232.73 bc
DF64.59 a3.25 b2.89 b32.51 a39.18 c203.83 d
RTBF61.36 a4.46 b3.68 a30.86 ab50.86 a259.70 a
DF64.85 a3.47 b2.99 b32.18 ab40.65 c214.65 cd
PRTBF61.43 a4.44 a3.66 a31.04 ab50.28 a254.54 ab
DF64.84 a3.38 b3.06 b32.97 a40.39 c208.07 d
MEANNT62.74 A3.87 A3.35 A30.90 A42.67 A218.28 B
RT63.11 A3.96 A3.33 A31.52 A45.75 A237.18 A
PRT63.14 A3.91 A3.36 A32.00 A45.33 A231.31 AB
BF61.23 B4.46 A3.72 A30.40 B49.10 A248.99 A
DF64.76 A3.37 B2.98 B32.55 A40.07 B208.85 B
ANOVATnsnsnsnsns*
WN***********
T × WNnsnsnsnsnsns
WAR, water absorption rate; DDT, dough development time; DST, dough stability time; WGC, wet gluten content; AS, area of stretch; MTR, the maximum tensile resistance. *, **, significant at 0.05 and 0.01 probability levels, respectively; ns, not significant at 0.05 probability level. Different uppercase letters indicate a significant difference between the means of WNs across three tillage methods, or between tillage methods across two WNs, according to the least significant difference test (α = 0.05). Within a column and a season, different lowercase letters indicate a significant difference between treatments (tillage method combined WN) according to the least significant difference test (α = 0.05).
Disclaimer/Publisher’s Note: The statements, opinions and data contained in all publications are solely those of the individual author(s) and contributor(s) and not of MDPI and/or the editor(s). MDPI and/or the editor(s) disclaim responsibility for any injury to people or property resulting from any ideas, methods, instructions or products referred to in the content.

