Dual-Channel Co-Spectroscopy–Based Non-Destructive Detection Method for Fruit Quality and Its Application to Fuji Apples

Abstract
:1. Introduction
2. Materials and Methods
2.1. Experimental Apples
2.2. Spectral Platform Setup and Data Collection
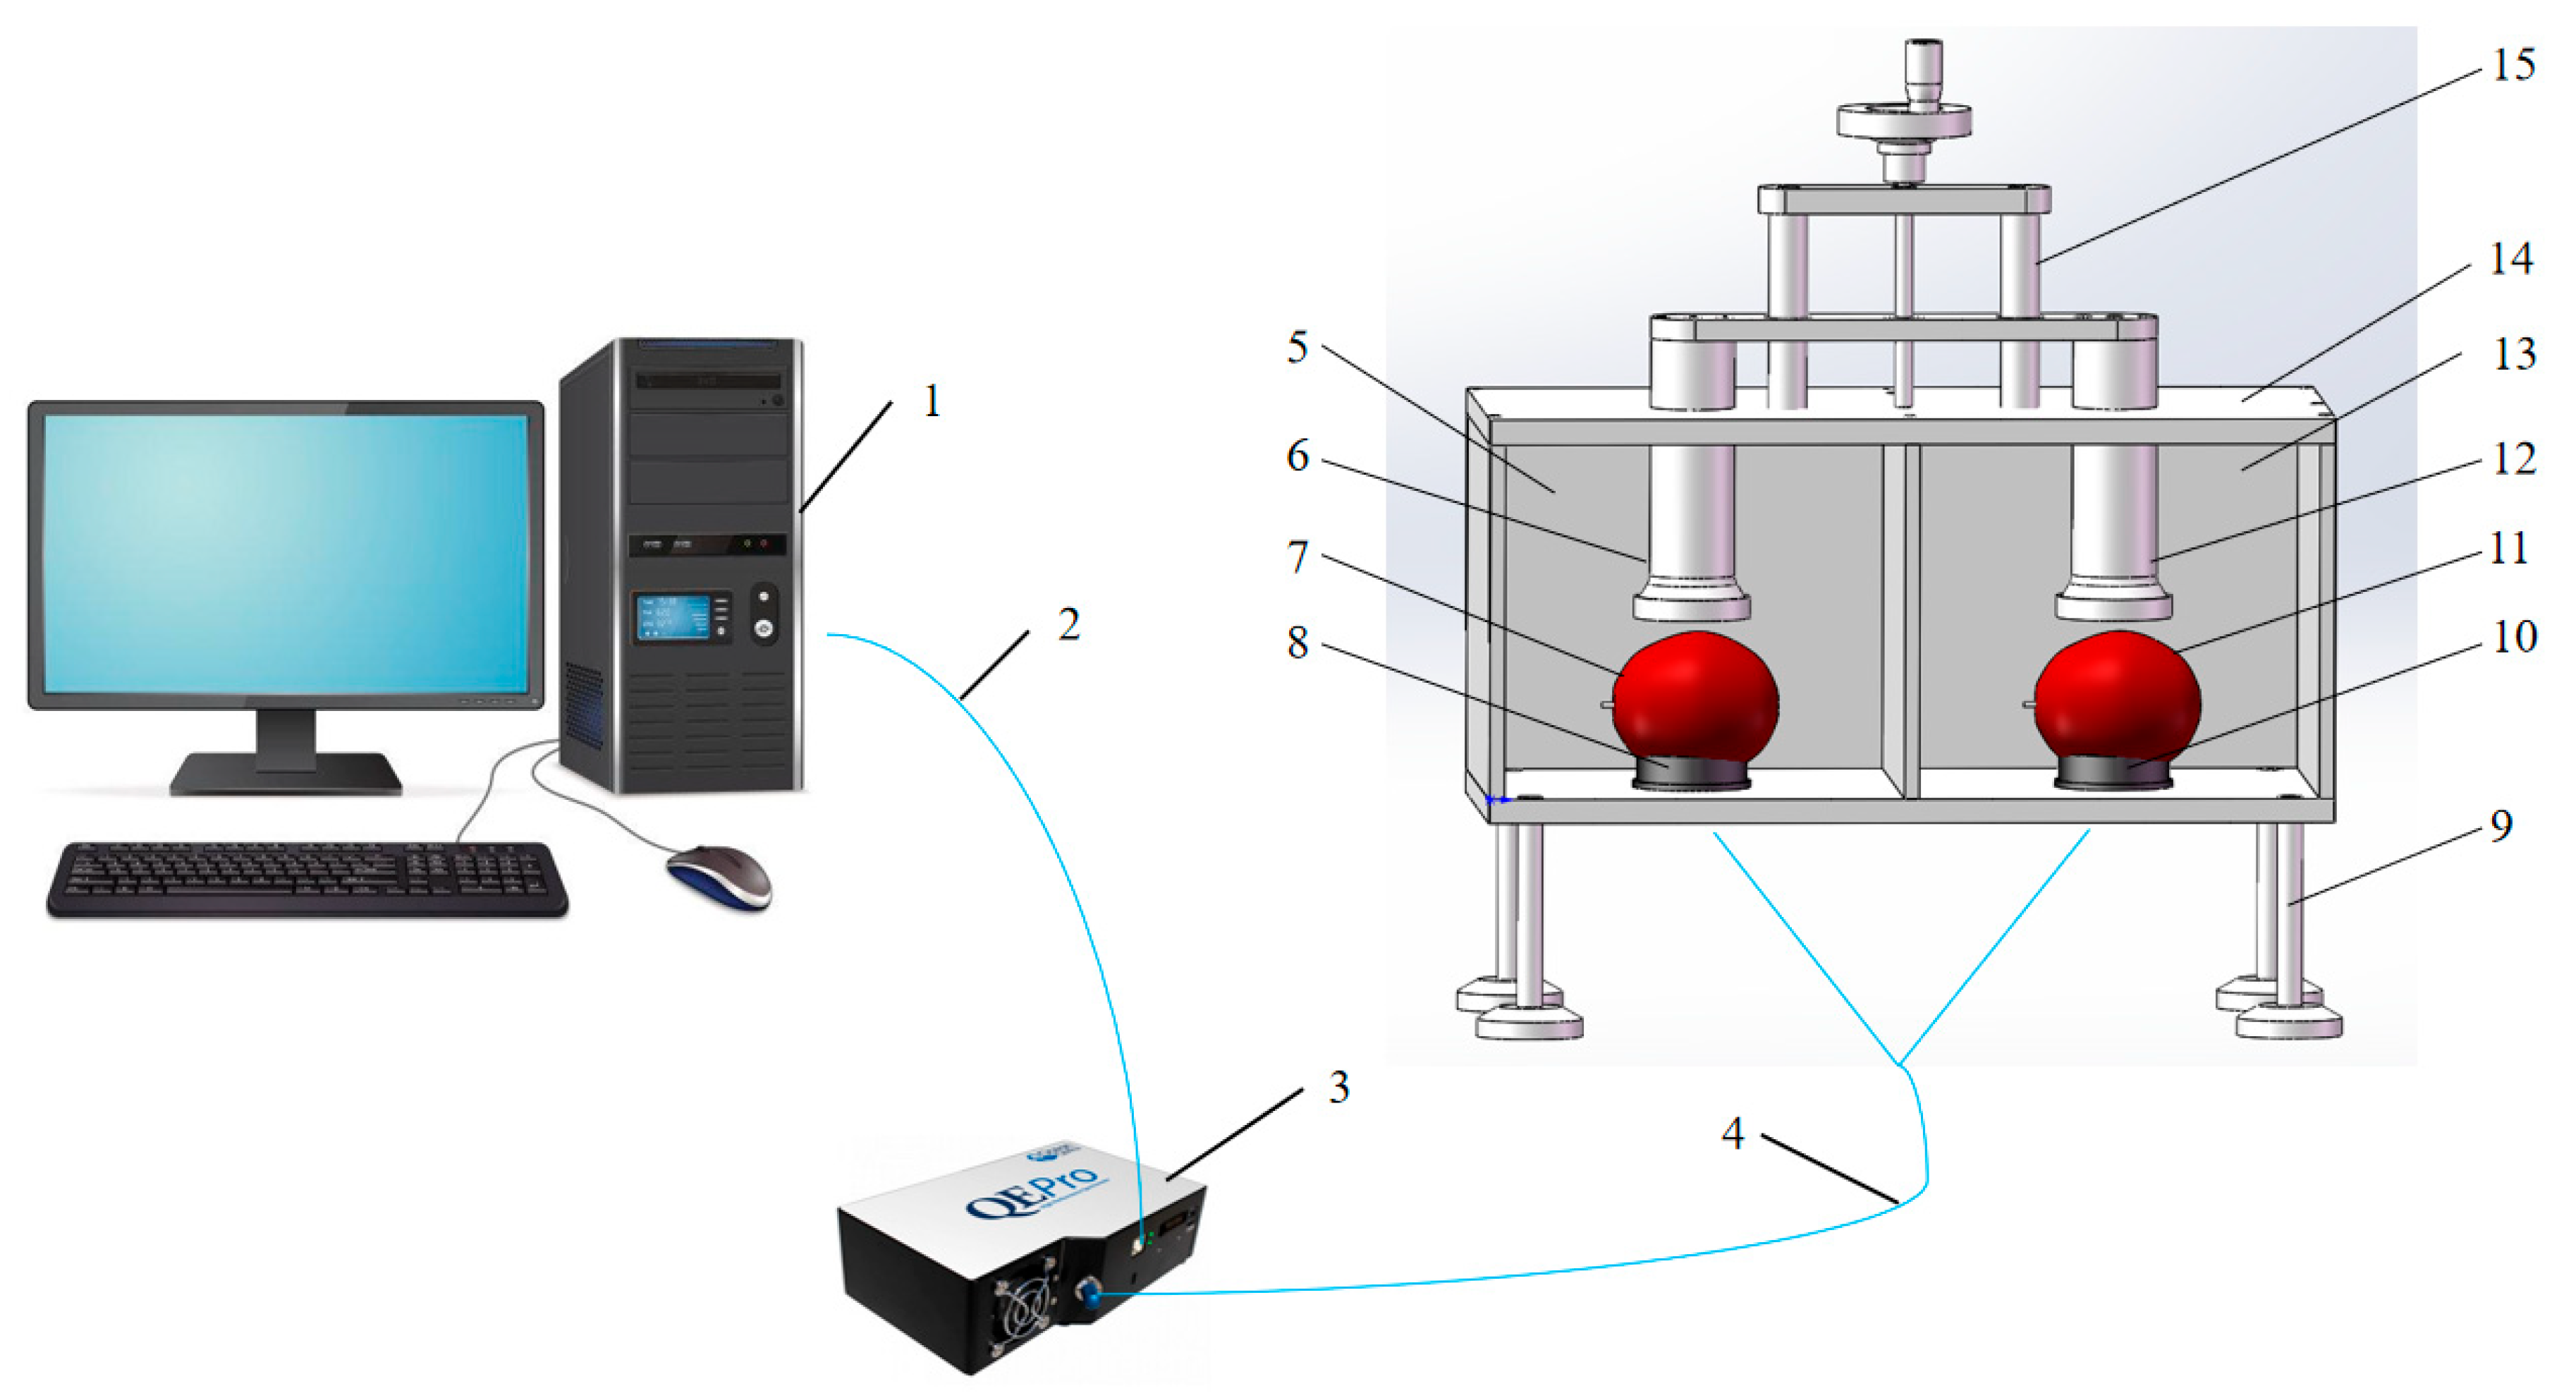
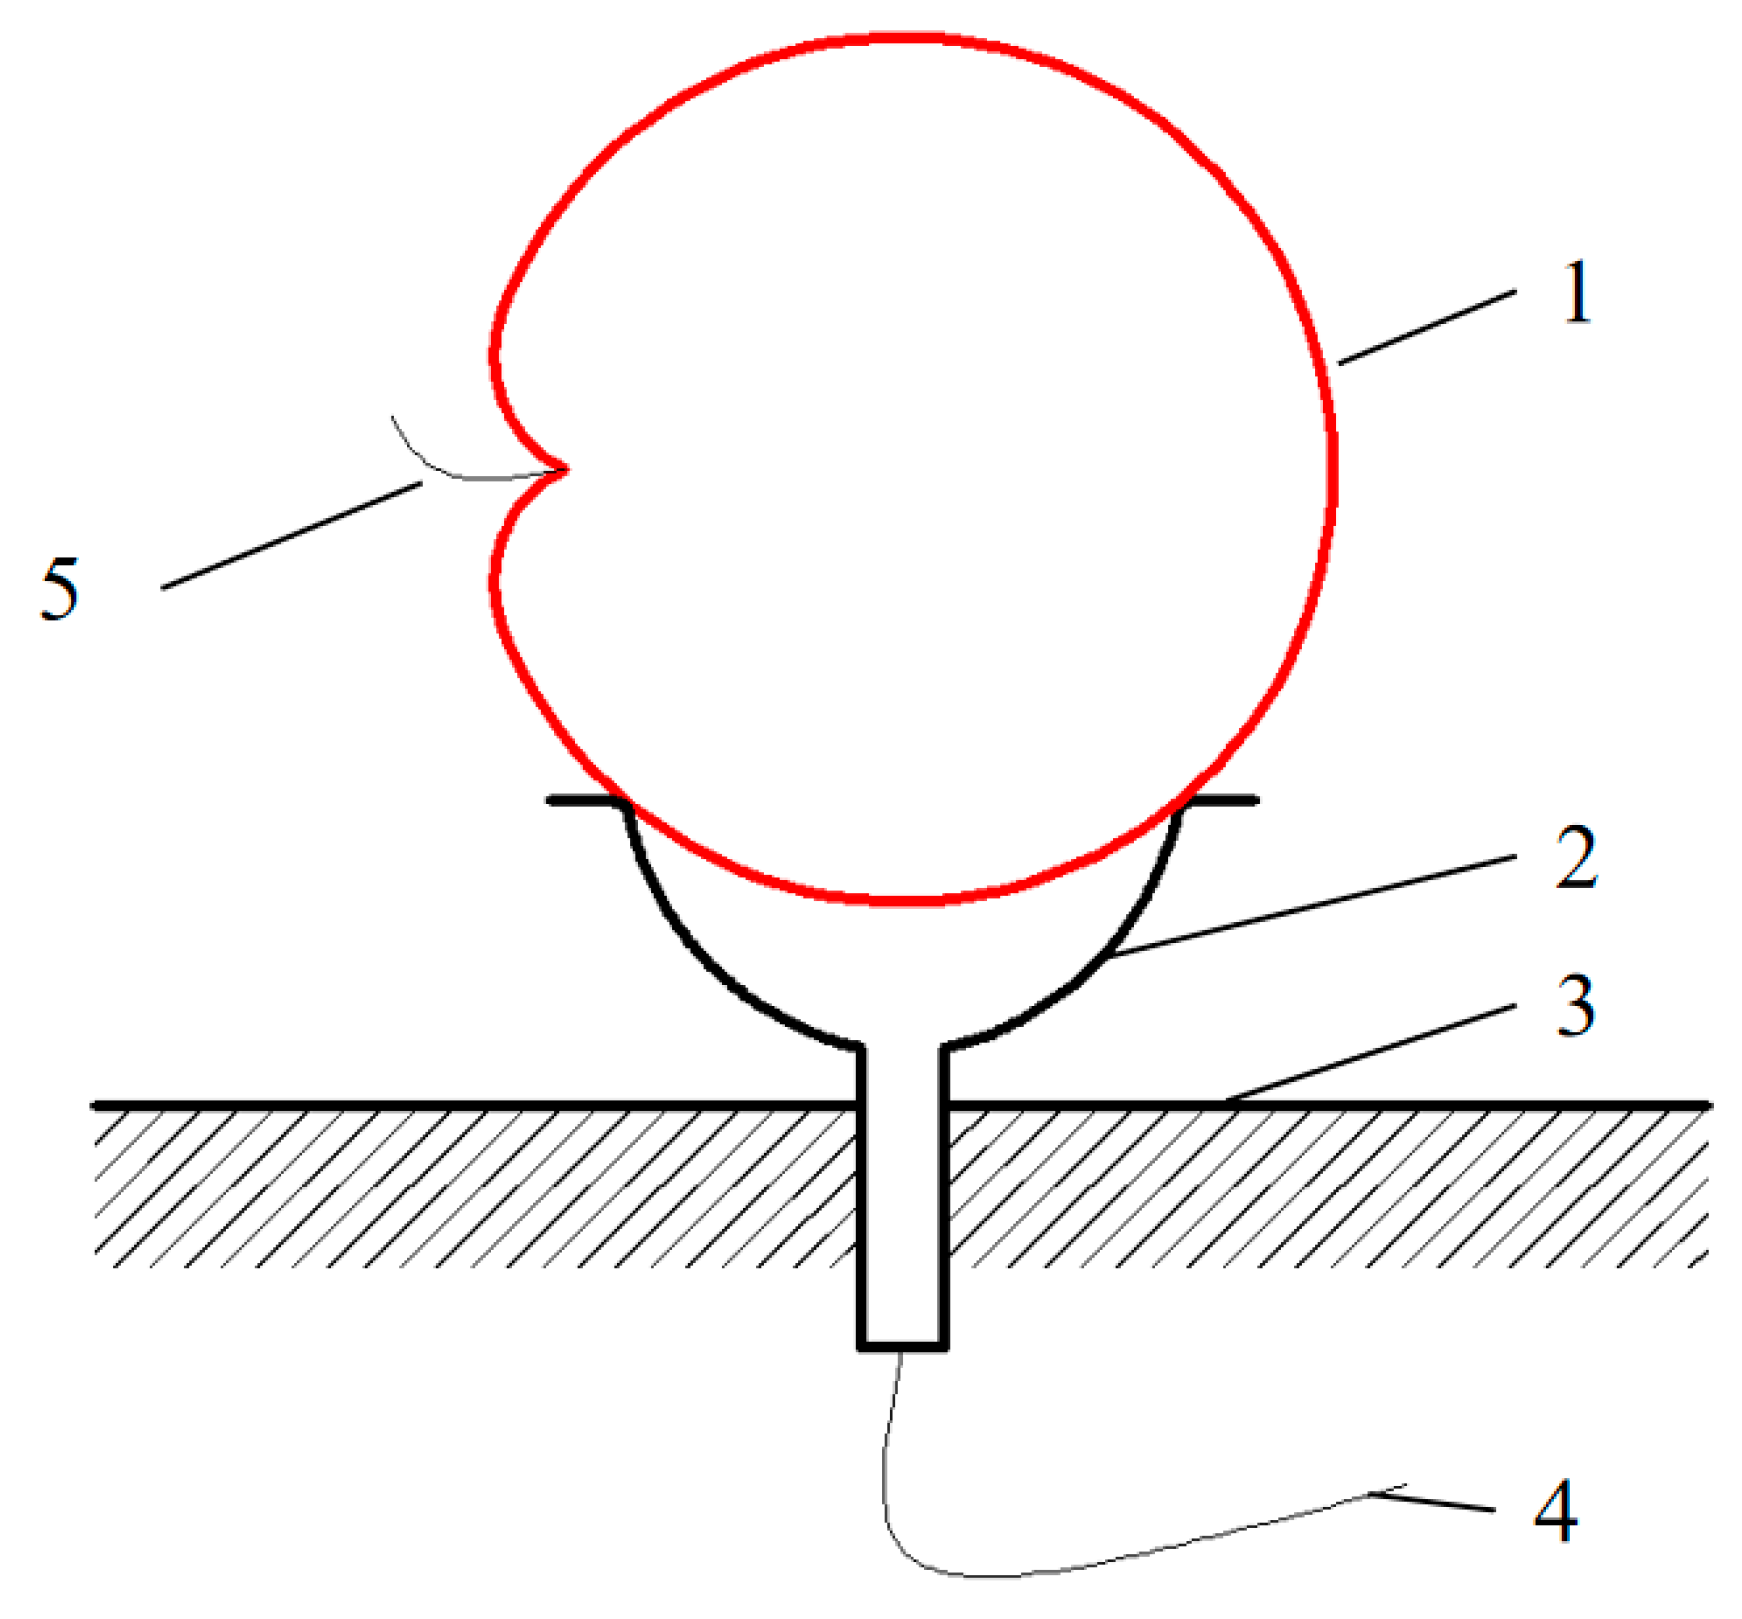
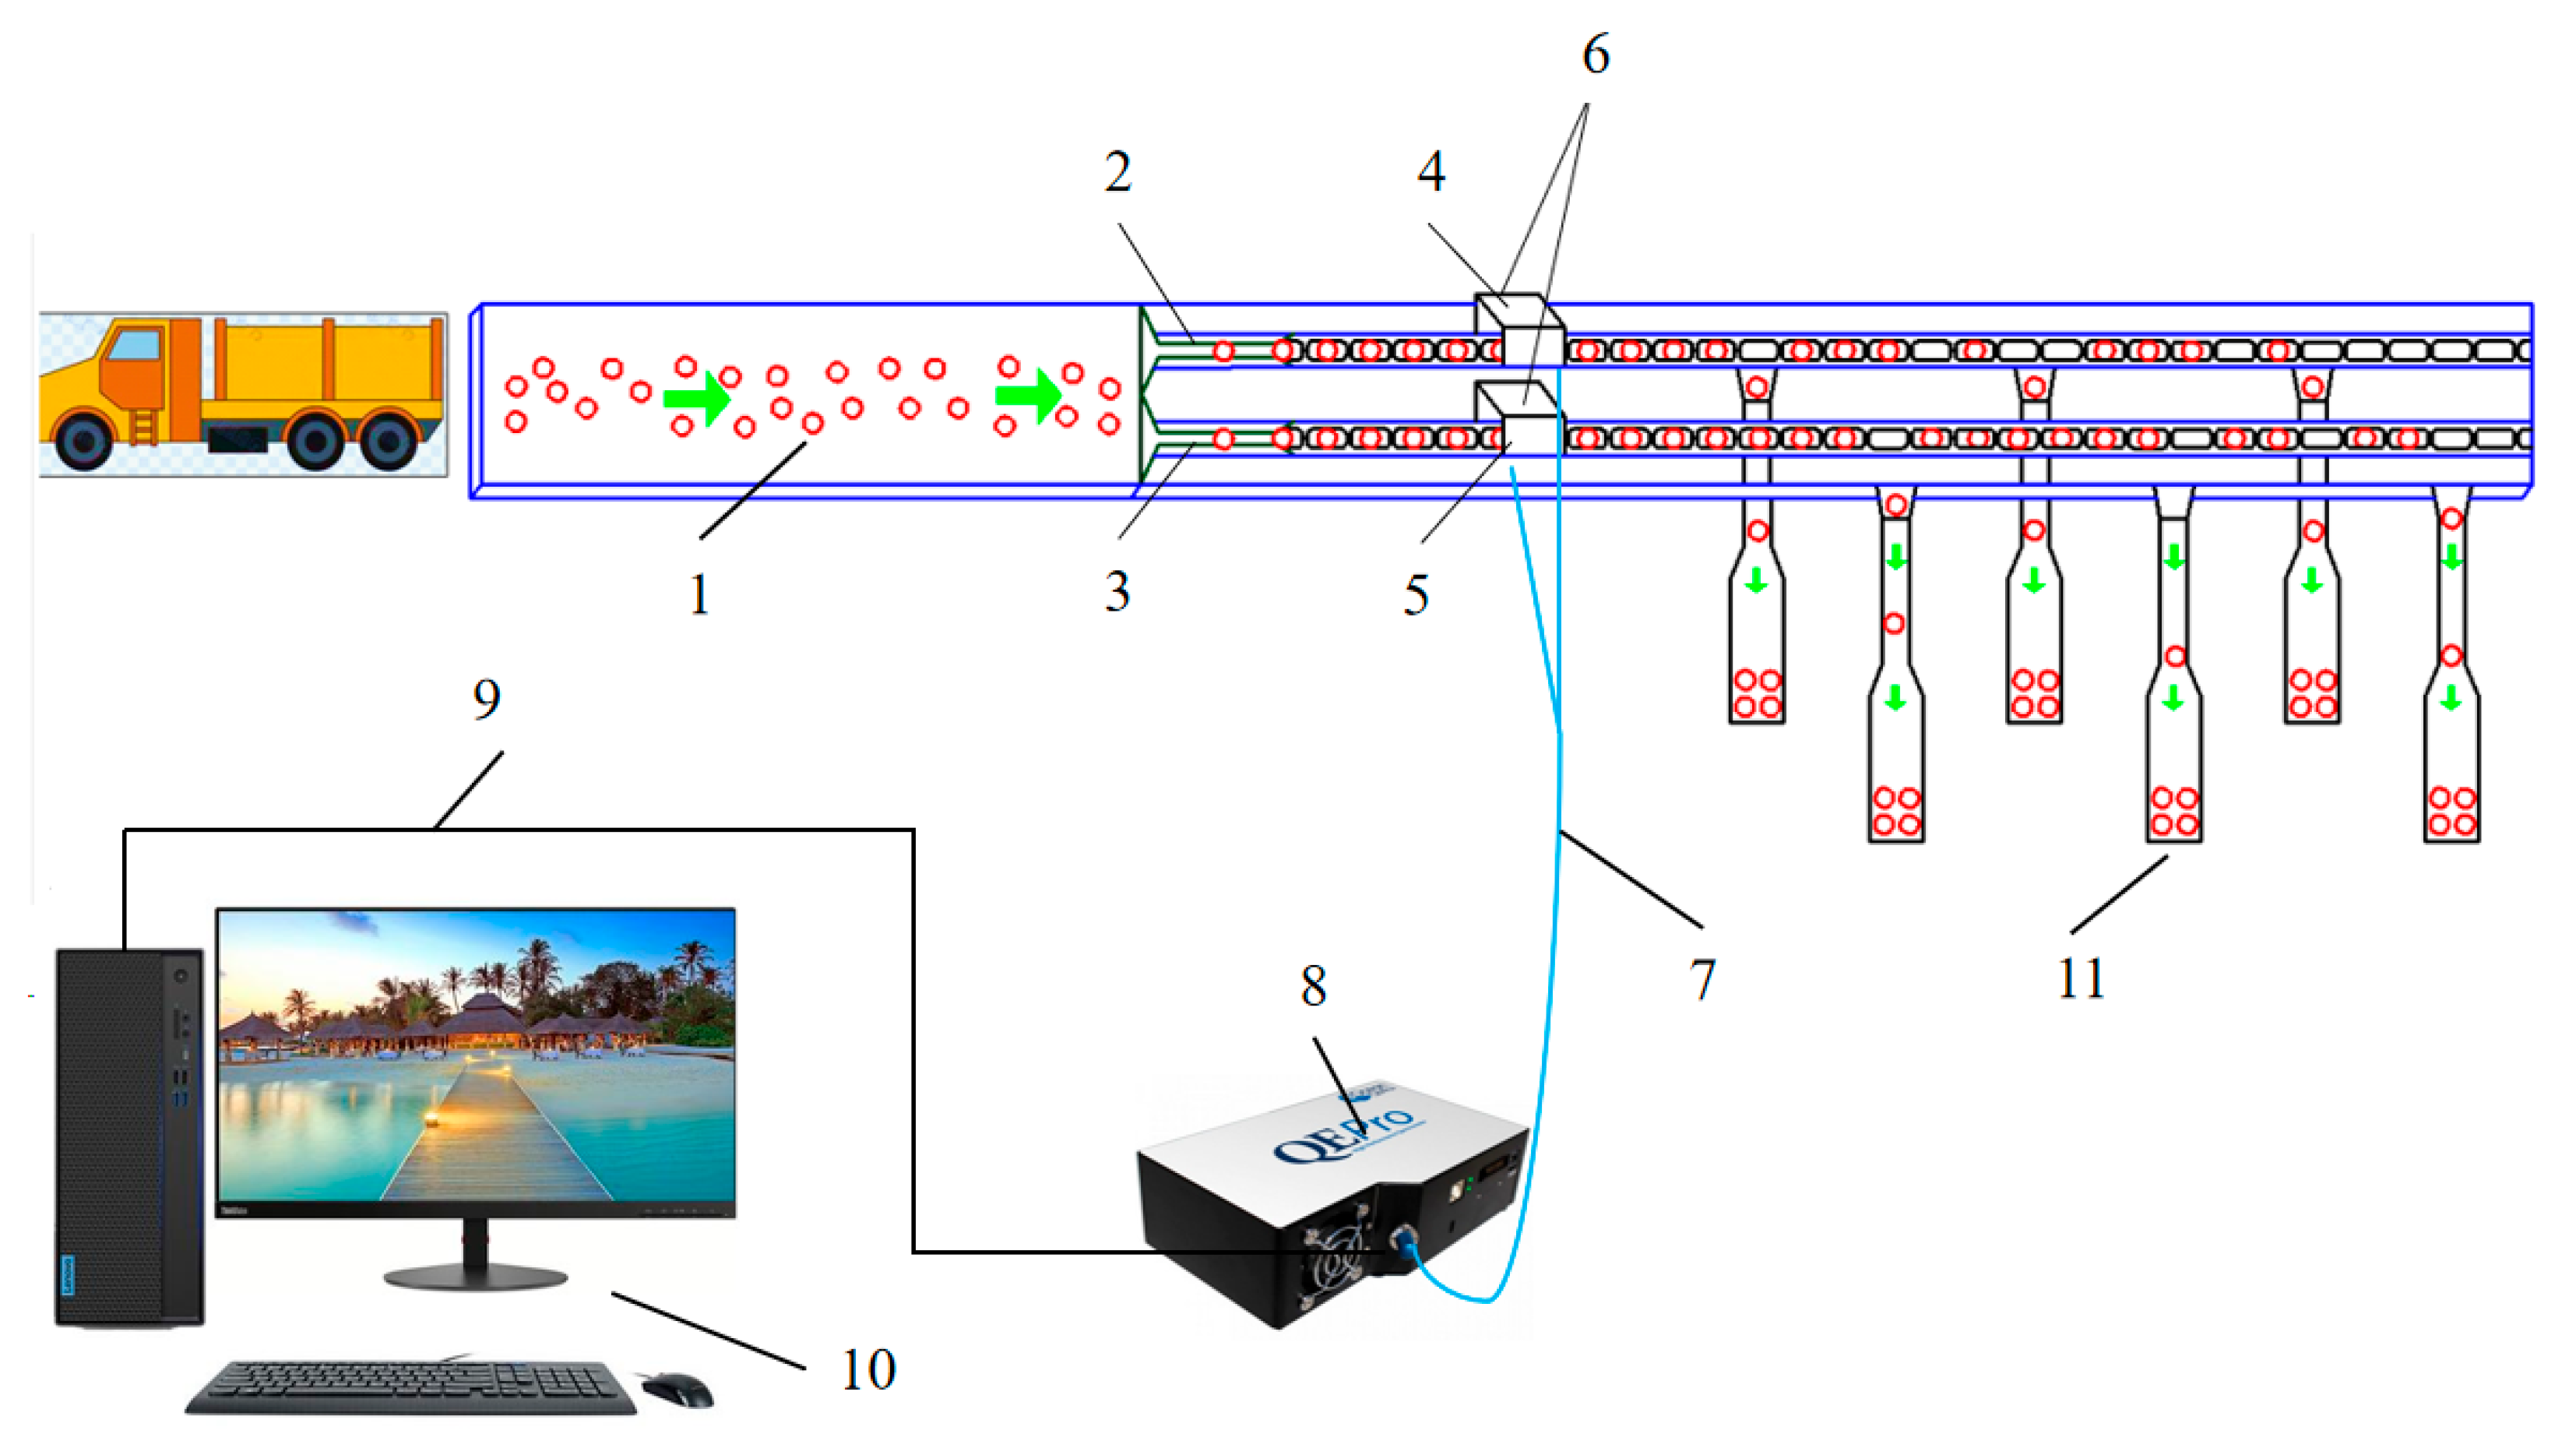
2.2.1. Spectral Platform Construction
2.2.2. Spectral Data Collection
- (1)
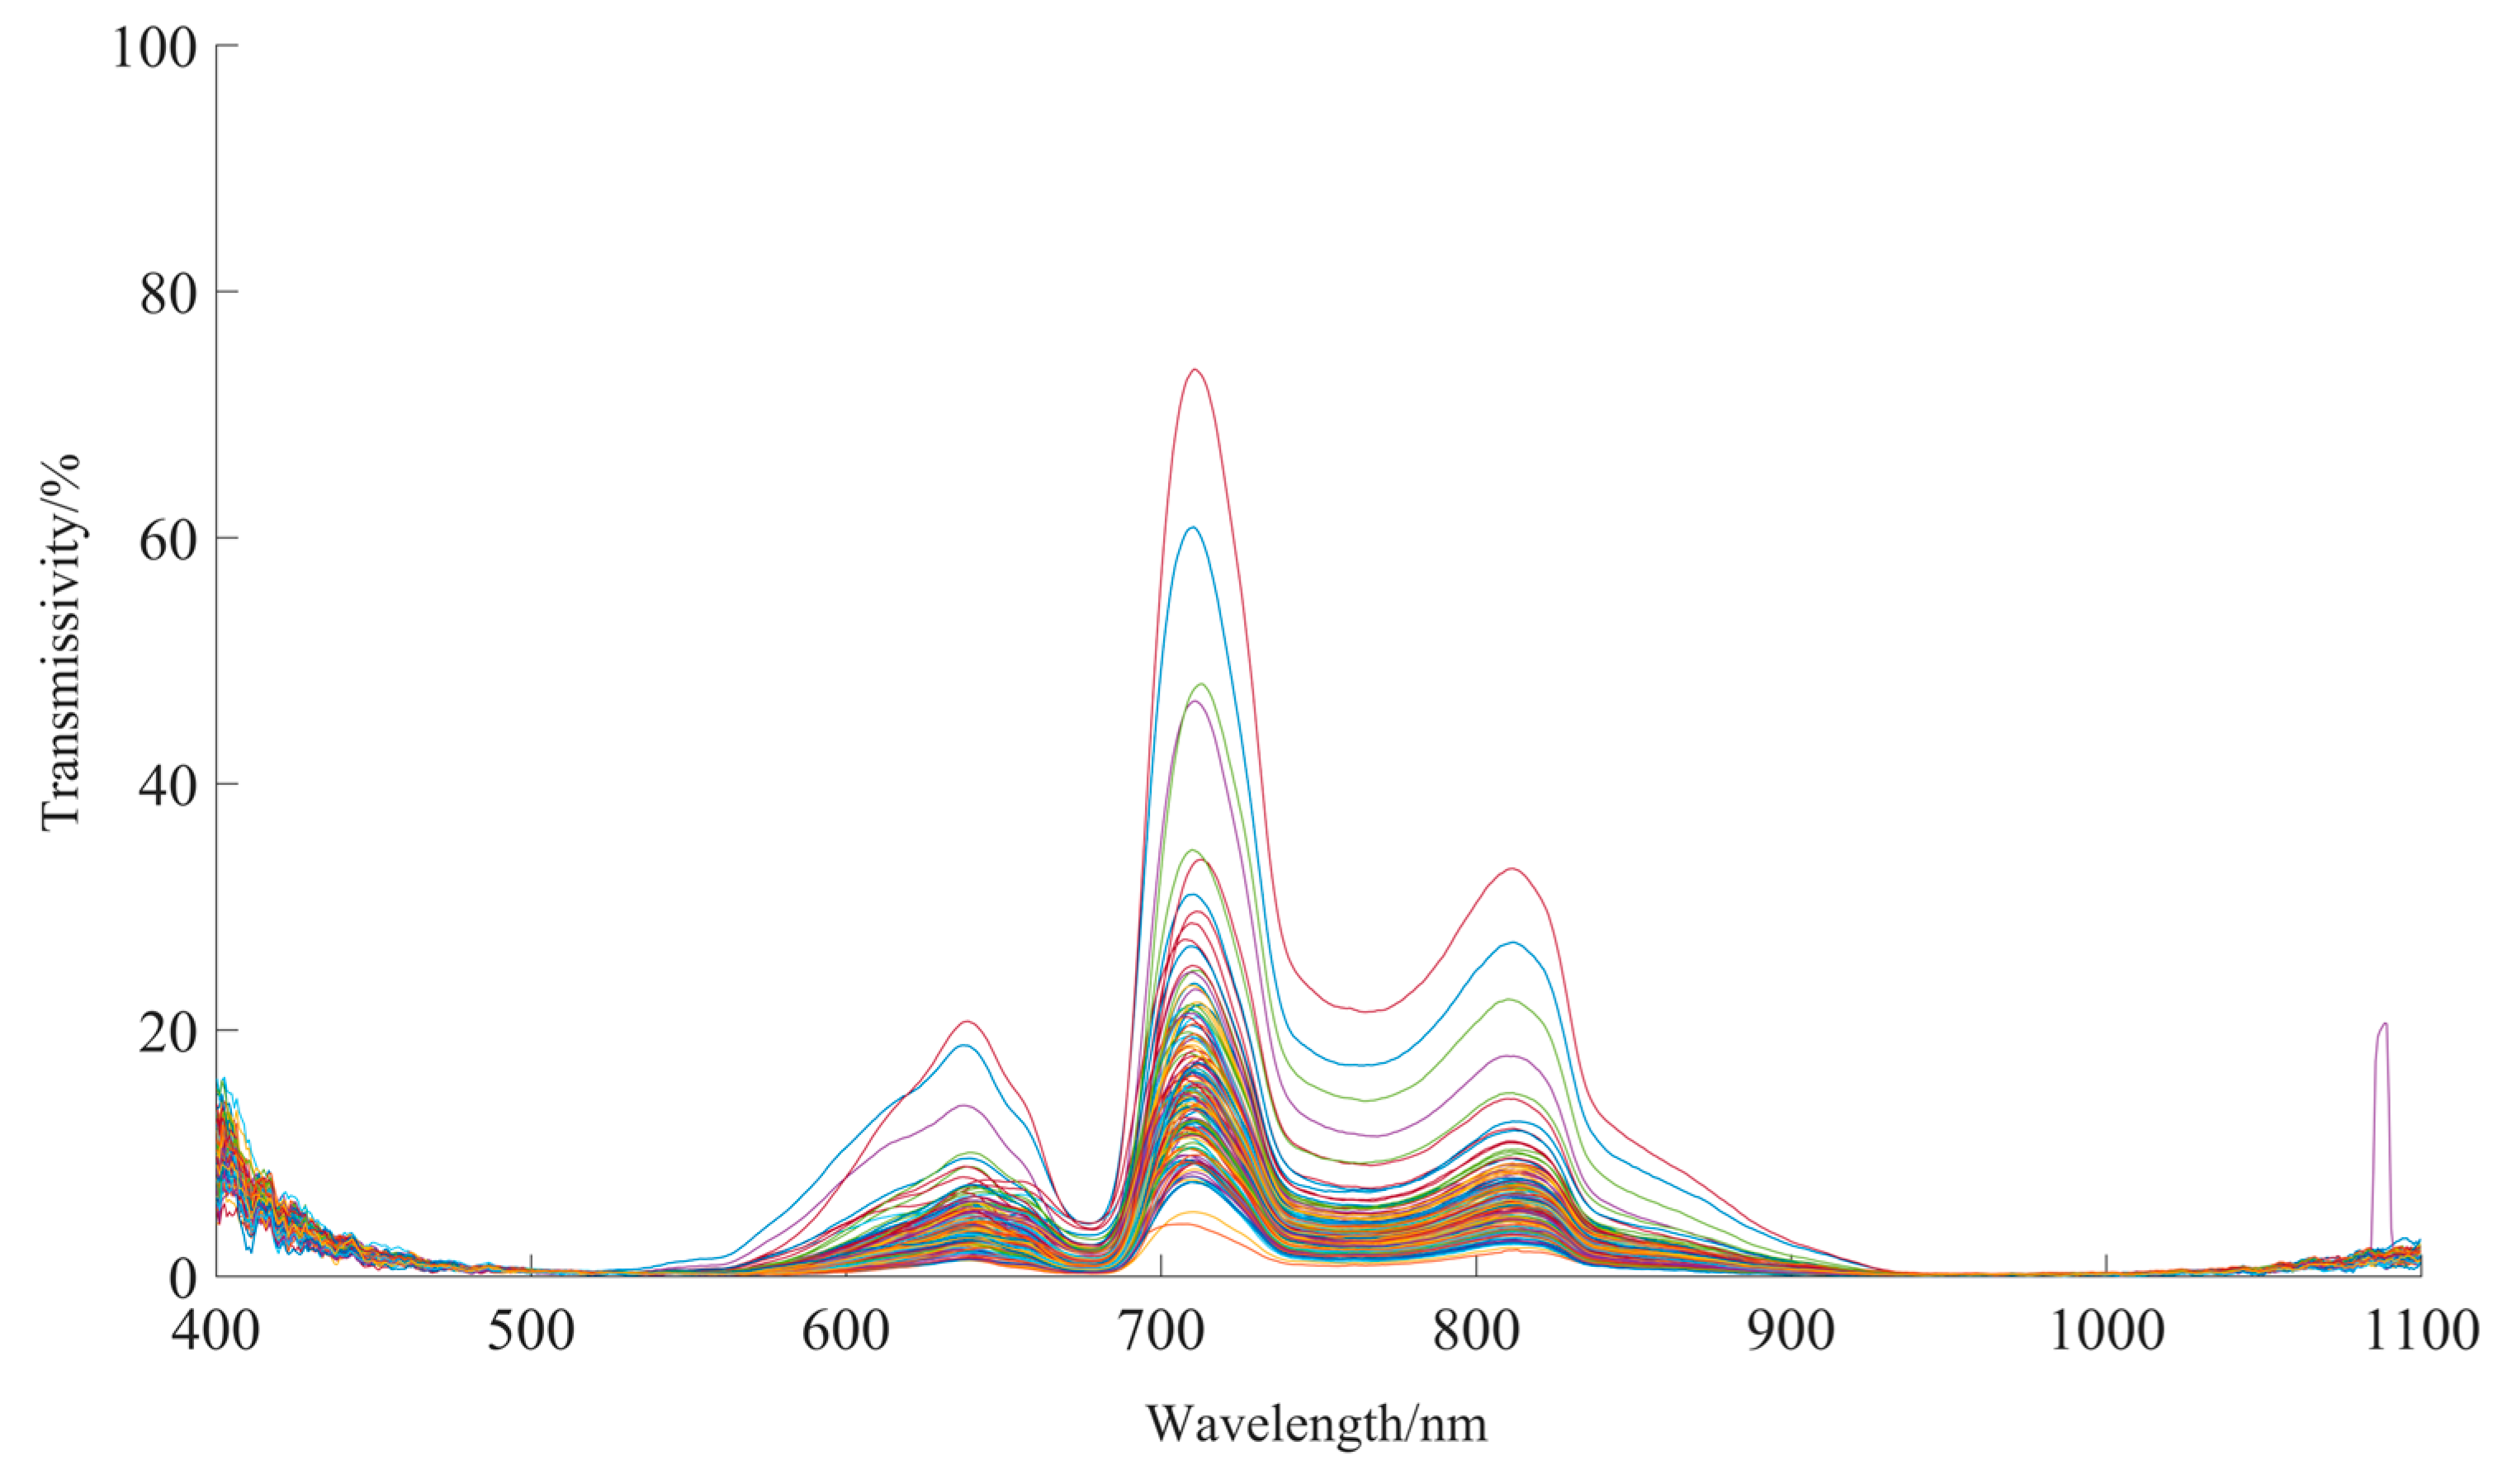
- Single-channel (400–1100 nm range) apple spectral data collection
- (2)
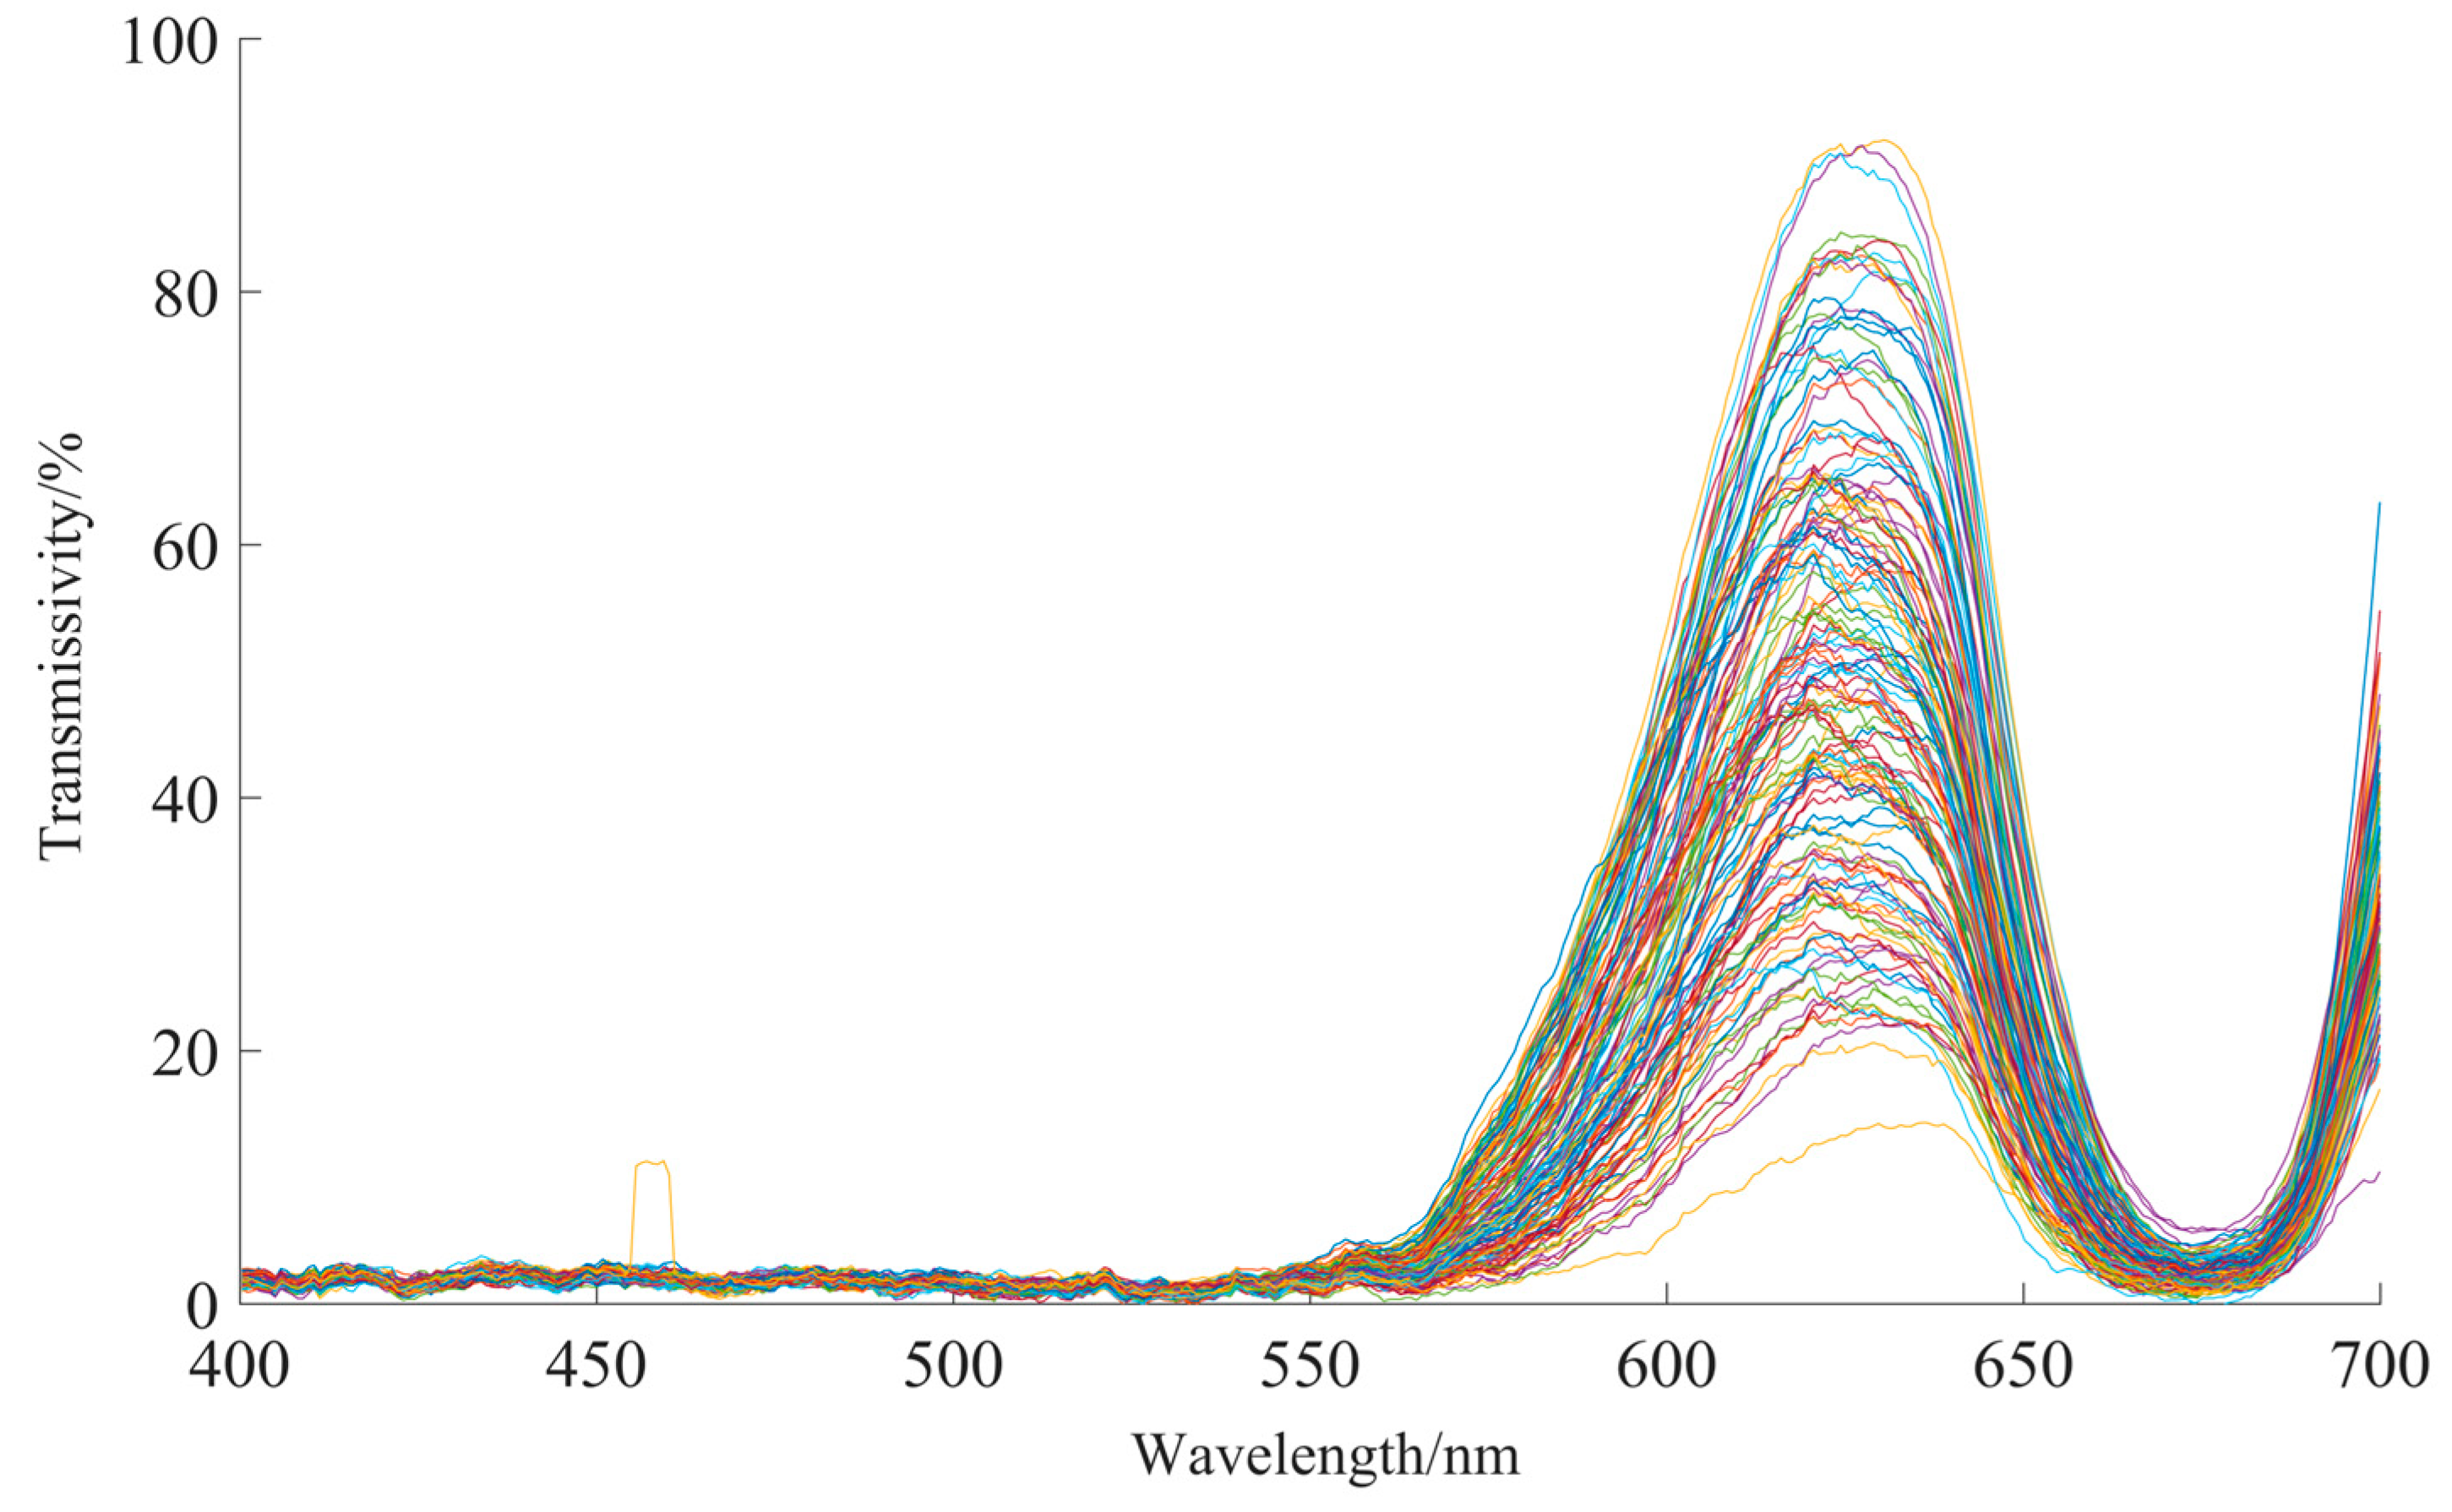
- Dual-channel co-spectroscopy (400–700 nm and 700–1100 nm range) apple spectral data collection
2.3. Determination of Soluble Solids Content
2.4. Data Analysis and Modeling
3. Results
3.1. PLSR Modeling for Soluble Solids Content Using Single-Channel Spectra (400–1100 nm Range)
3.2. Dual-Channel Co-Spectroscopy (400–700 nm and 700–1100 nm Range) PLSR Modeling for Soluble Solids Content
3.2.1. PLSR Modeling for the 400–700 nm Range
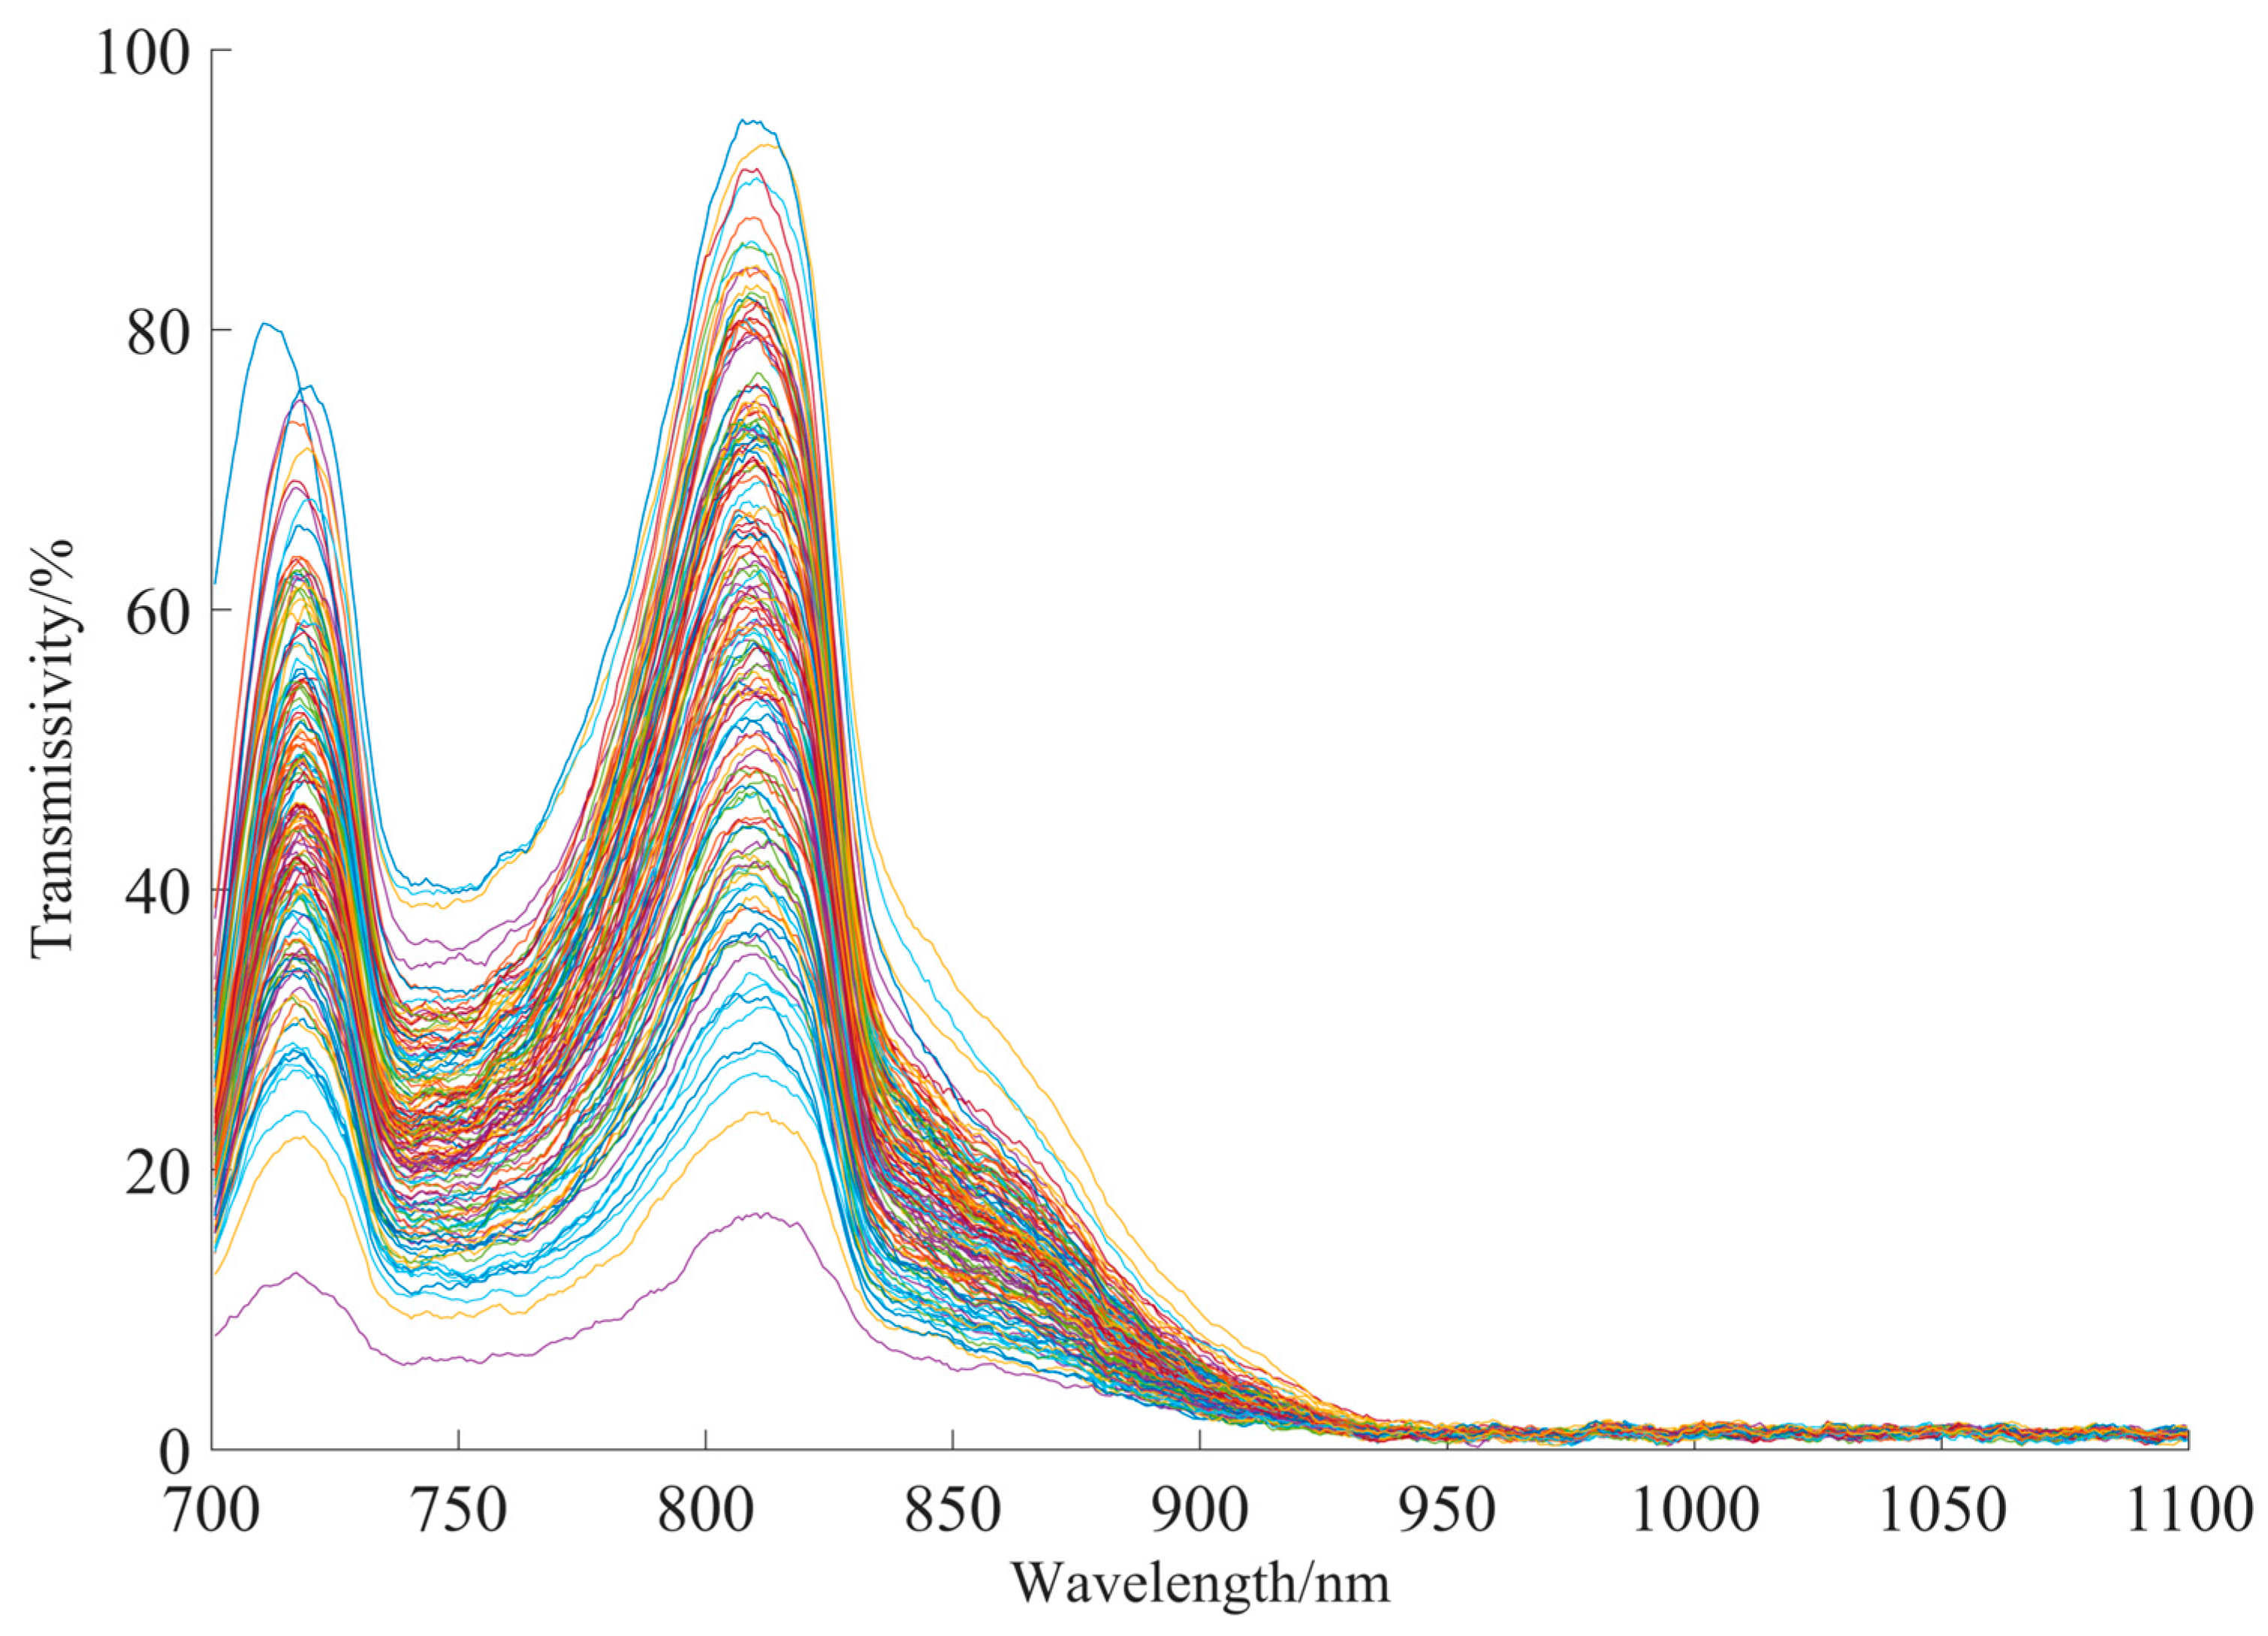
3.2.2. PLSR Modeling for the 700–1100 nm Range
4. Discussion
4.1. Comparison of Spectral Effects After Filter Splitting
4.2. Comparison of PLSR Modeling Performance Between Single and Dual Channels
4.3. Prospects for Non-Destructive Fruit Quality Detection Based on Dual-Channel Co-Spectroscopy
4.4. Selection of Research Subject and Model Application
5. Conclusions
Author Contributions
Funding
Data Availability Statement
Conflicts of Interest
References
- Zhang, F. In 2022, China’s fruit production surpassed 300 million tons. China Fruit News 2023, 40, 51. [Google Scholar]
- Chen, Q.; Yang, Z.; Zhang, Q.; Liu, Y.; Yin, P.; Guo, Y. Research progress on nutrition and functional components in fruit. Hubei Agric. Sci. 2019, 58, 9–13+21. [Google Scholar]
- Ocean, N.; Howley, P.; Ensor, J. Lettuce be happy: A longitudinal UK study on the relationship between fruit and vegetable consumption and well-being. Soc. Sci. Med. 2019, 222, 335–345. [Google Scholar] [CrossRef]
- Ncama, K.; Opara, U.L.; Tesfay, S.Z.; Fawole, O.A.; Magwaza, L.S. Application of Vis/NIR spectroscopy for predicting sweetness and flavour parameters of ‘Valencia’orange (Citrus sinensis) and ‘Star Ruby’grapefruit (Citrus x paradisi Macfad). J. Food Eng. 2017, 193, 86–94. [Google Scholar] [CrossRef]
- Liu, M.; Liu, Y.; Guo, J. Research and Application on Fruit Nondestructive Detection Technology. Agric. Sci. Technol. Equip. 2017, 6, 51–55. [Google Scholar]
- Chen, L.; Duan, D.; Wang, F.; Meng, X.; Zhao, C.; Qian, Y. Research Progress of Non-destructive Testing of Fruit Quality by Hyperspectral Imaging Technology. Guangdong Agric. Sci. 2023, 50, 83–94. [Google Scholar]
- Altieri, G.; Genovese, F.; Tauriello, A.; Di Renzo, G.C. Models to improve the non-destructive analysis of persimmon fruit properties by VIS/NIR spectrometry. J. Sci. Food Agric. 2017, 97, 5302–5310. [Google Scholar] [CrossRef] [PubMed]
- Huang, Y.; Lu, R.; Chen, K. Detection of internal defect of apples by a multichannel Vis/NIR spectroscopic system. Postharvest Biol. Technol. 2020, 161, 111065. [Google Scholar] [CrossRef]
- Li, L.; Huang, W.; Wang, Z.; Liu, S.; He, X.; Fan, S. Calibration transfer between developed portable Vis/NIR devices for detection of soluble solids contents in apple. Postharvest Biol. Technol. 2022, 183, 111720. [Google Scholar] [CrossRef]
- Scalisi, A.; O’Connell, M.G. Application of visible/NIR spectroscopy for the estimation of soluble solids, dry matter and flesh firmness in stone fruits. J. Sci. Food Agric. 2021, 101, 2100–2107. [Google Scholar] [CrossRef]
- Soltani Nazarloo, A.; Rasooli Sharabiani, V.; Abbaspour Gilandeh, Y.; Taghinezhad, E.; Szymanek, M.; Sprawka, M. Feasibility of using VIS/NIR spectroscopy and multivariate analysis for pesticide residue detection in tomatoes. Processes 2021, 9, 196. [Google Scholar] [CrossRef]
- Tilahun, S.; Seo, M.H.; Hwang, I.G.; Kim, S.H.; Choi, H.R.; Jeong, C.S. Prediction of lycopene and β-carotene in tomatoes by portable chroma-meter and VIS/NIR spectra. Postharvest Biol. Technol. 2018, 136, 50–56. [Google Scholar] [CrossRef]
- Wang, J.; Guo, Z.; Zou, C.; Jiang, S.; El-Seedi, H.R.; Zou, X. General model of multi-quality detection for apple from different origins by Vis/NIR transmittance spectroscopy. J. Food Meas. Charact. 2022, 16, 2582–2595. [Google Scholar] [CrossRef]
- Wang, T.; Zhang, Y.; Liu, Y.; Zhang, Z.; Yan, T. Intelligent evaluation of stone cell content of korla fragrant pears by vis/NIR reflection spectroscopy. Foods 2022, 11, 2391. [Google Scholar] [CrossRef] [PubMed]
- Zhang, L. Research on Some Problems of On-Line Nondestructive Detection of Soluble Solids Contents in Crown Pear by VIS/NIR Spectroscopy. Master’s Thesis, Zhejiang University, Zhejiang, China, 2015. [Google Scholar]
- Xu, H. Development and Application of Optimal Model for Nondestructive Evaluation of Fruits Sugar Content Using Visible/Near Infrared Spectroscopy. Ph.D. Thesis, Zhejiang University, Zhejiang, China, 2010. [Google Scholar]
- Ma, J.J.; Wang, K.Q. Research progress of optical non-destructive testing technology for fruit quality. Sci. Technol. Food Ind. 2021, 42, 427–437. [Google Scholar]
- Liu, Y.; Xu, H.; Sun, X.; Jiang, X.; Rao, Y.; Xu, J.; Wang, J. On-line detection of soluble solids content of apples from different origins by visible and near-infrared spectroscopy. Chin. Opt. 2020, 13, 482–491. [Google Scholar]
- Liu, H.; Gong, Z.; Wen, T.; Wang, Z.; Dai, X. Design and experiment of an online detection and sorting system for citrus sugar content based on visible/near infrared spectroscopy. J. Hunan Agric. Univ. (Nat. Sci.) 2023, 49, 497–502. [Google Scholar]
- Huang, Y.; Dong, W.; Chen, Y.; Wang, X.; Luo, W.; Zhan, B.; Liu, X.; Zhang, H. Online detection of soluble solids content and maturity of tomatoes using Vis/NIR full transmittance spectra. Chemom. Intell. Lab. Syst. 2021, 210, 104243. [Google Scholar] [CrossRef]
- Xu, X.; Lu, H.; Wang, X.; Qiu, G.; Wang, C.; Liang, X. Nondestructive detection method for pineapple water core based on visible/near infrared spectroscopy. Trans. Chin. Soc. Agric. Eng. 2021, 37, 287–294. [Google Scholar]
- Xu, S.; Lu, H.; He, Z.; Liang, X. Non-destructive determination of internal soluble solid content in pomelo using visible/near infrared full-transmission spectroscopy. Postharvest Biol. Technol. 2024, 214, 112990. [Google Scholar] [CrossRef]
- Wang, F.; Zhao, C.; Yang, H.; Jiang, H.; Li, L.; Yang, G. Non-destructive and in-site estimation of apple quality and maturity by hyperspectral imaging. Comput. Electron. Agric. 2022, 195, 106843. [Google Scholar] [CrossRef]
- Li, Y.; Jin, G.; Jiang, X.; Yi, S.; Tian, X. Non-destructive determination of soluble solids content using a multi-region combination model in hybrid citrus. Infrared Phys. Technol. 2020, 104, 103138. [Google Scholar] [CrossRef]
- Liu, S.; Huang, W.; Lin, L.; Fan, S. Effects of orientations and regions on performance of online soluble solids content prediction models based on near-infrared spectroscopy for peaches. Foods 2022, 11, 1502. [Google Scholar] [CrossRef] [PubMed]
- Sun, X.; Liu, Y.; Li, Y.; Wu, M.; Zhu, D. Simultaneous measurement of brown core and soluble solids content in pear by on-line visible and near infrared spectroscopy. Postharvest Biol. Technol. 2016, 116, 80–87. [Google Scholar] [CrossRef]
- Ibrahim, A.; Daood, H.G.; Égei, M.; Takács, S.; Helyes, L. A comparative study between Vis/NIR spectroradiometer and NIR spectroscopy for the non-destructive quality assay of different watermelon cultivars. Horticulturae 2022, 8, 509. [Google Scholar] [CrossRef]
- Jie, D.; Xie, L.; Rao, X.; Ying, Y. Using visible and near infrared diffuse transmittance technique to predict soluble solids content of watermelon in an on-line detection system. Postharvest Biol. Technol. 2014, 90, 1–6. [Google Scholar] [CrossRef]
- Khodabakhshian, R.; Emadi, B.; Khojastehpour, M.; Golzarian, M.R. A comparative study of reflectance and transmittance modes of Vis/NIR spectroscopy used in determining internal quality attributes in pomegranate fruits. J. Food Meas. Charact. 2019, 13, 3130–3139. [Google Scholar] [CrossRef]
- Cortés, V.; Cubero, S.; Blasco, J.; Aleixos, N.; Talens, P. In-line application of visible and near-infrared diffuse reflectance spectroscopy to identify apple varieties. Food Bioprocess Technol. 2019, 12, 1021–1030. [Google Scholar] [CrossRef]
- Fu, X.; Ying, Y.; Lu, H.; Xu, H. Comparison of diffuse reflectance and transmission mode of visible-near infrared spectroscopy for detecting brown heart of pear. J. Food Eng. 2007, 83, 317–323. [Google Scholar] [CrossRef]
- Cortés, V.; Blasco, J.; Aleixos, N.; Cubero, S.; Talens, P. Visible and near-infrared diffuse reflectance spectroscopy for fast qualitative and quantitative assessment of nectarine quality. Food Bioprocess Technol. 2017, 10, 1755–1766. [Google Scholar] [CrossRef]
- Guo, W.; Zhao, F.; Dong, J. Nondestructive measurement of soluble solids content of kiwifruits using near-infrared hyperspectral imaging. Food Anal. Methods 2016, 9, 38–47. [Google Scholar] [CrossRef]
- Guo, L.; Tang, X.; Mao, X.; Wan, L. Problems and Countermeasures of Agricultural Products Quality Standard in China. Food Nutr. China 2017, 23, 11–14. [Google Scholar]
- Chu, Q.; Jiang, B.; Yang, L.; Zheng, J.; Dai, Z. Study on Current Situation of Quality Grading System and Chinese Standards for Agricultural Product. Stand. Sci. 2015, 65–69. [Google Scholar]
- Aweta[EB/OL]. Available online: http://www.aweta.nl/ (accessed on 10 April 2024).
- Compac[EB/OL]. Available online: https://www.tomra.com/food (accessed on 10 April 2024).
- TOMRA[EB/OL]. Available online: https://www.tomra.com/en (accessed on 10 April 2024).
- MAF RODA[EB/OL]. Available online: http://www.maf-roda.com/en/ (accessed on 10 April 2024).
- Greefa[EB/OL]. Available online: https://www.greefa.com/ (accessed on 10 April 2024).
- Reemoon[EB/OL]. Available online: https://www.reemoon.com/en (accessed on 15 April 2024).
- Jinong[EB/OL]. Available online: http://www.taiwanjinong.com/ (accessed on 15 April 2024).
- Kepler[EB/OL]. Available online: http://www.keplertech.com.cn/ (accessed on 5 June 2024).
- Deltron[EB/OL]. Available online: https://deltron.tech/ (accessed on 9 July 2024).
- Jereh[EB/OL]. Available online: https://www.jereh.com/en/ (accessed on 9 July 2024).
- Longkou Kaixiang[EB/OL]. Available online: http://www.chinakaixiang.com/ (accessed on 9 July 2024).
- Taiho[EB/OL]. Available online: https://www.chinataiho.com/ (accessed on 2 August 2024).
- NY/T 2637-2014; Determination of Soluble Solids Content in Fruits and Vegetables: Refractometer Method. Ministry of Agriculture and Rural Affairs of the People’s Republic of China: Beijing, China, 2015.
- Guo, Z.; Wang, J.; Song, Y.; Yin, X.; Zou, C.; Zou, X. Design and experiment of the handheld visible-near infrared nondestructive detecting system for apple quality. Trans. Chin. Soc. Agric. Eng. 2021, 37, 271–277. [Google Scholar]
- Yang, A.; Ding, J. Comparative assessment of two methods for estimation of soil organic carbon content by Vis-NIR spectra in Xinjiang Ebinur Lake Wetland. Trans. Chin. Soc. Agric. Eng. 2015, 31, 162–168. [Google Scholar]
- Isaksson, T.; Næs, T. The effect of multiplicative scatter correction (MSC) and linearity improvement in NIR spectroscopy. Appl. Spectrosc. 1988, 42, 1273–1284. [Google Scholar] [CrossRef]
- Bi, Y.; Yuan, K.; Xiao, W.; Wu, J.; Shi, C.; Xia, J.; Chu, G.; Zhang, G.; Zhou, G. A local pre-processing method for near-infrared spectra, combined with spectral segmentation and standard normal variate transformation. Anal. Chim. Acta 2016, 909, 30–40. [Google Scholar] [CrossRef] [PubMed]
- Alcin, O.F.; Sengur, A.; Ghofrani, S.; Ince, M.C. GA-SELM: Greedy algorithms for sparse extreme learning machine. Measurement 2014, 55, 126–132. [Google Scholar] [CrossRef]
- Feng, G.; Huang, G.-B.; Lin, Q.; Gay, R. Error minimized extreme learning machine with growth of hidden nodes and incremental learning. IEEE Trans. Neural Netw. 2009, 20, 1352–1357. [Google Scholar] [CrossRef] [PubMed]
- Jahani, S.; Setarehdan, S.K.; Boas, D.A.; Yücel, M.A. Motion artifact detection and correction in functional near-infrared spectroscopy: A new hybrid method based on spline interpolation method and Savitzky–Golay filtering. Neurophotonics 2018, 5, 015003. [Google Scholar] [CrossRef]
- Solorio-Fernandez, S.; Martínez-Trinidad, J.F.; Carrasco-Ochoa, J.A. A new unsupervised spectral feature selection method for mixed data: A filter approach. Pattern Recognit. 2017, 72, 314–326. [Google Scholar] [CrossRef]
- Sun, T.; Xu, W.-L.; Lin, J.-L.; Liu, M.-H.; He, X.-W. Determination of soluble solids content in navel oranges by Vis/NIR diffuse transmission spectra combined with CARS method. Spectrosc. Spectr. Anal. 2012, 32, 3229–3233. [Google Scholar]
- Liu, Y.; Jiang, X.; Xiong, S.; Liu, D. Using CARS to predict the content of soil organic matter based on Vis-NIR spectra. J. Chin. Agric. Mech. 2016, 37, 240–244. [Google Scholar]
- Liu, Y.; Shi, Y.; Cai, L.; Zhou, T. On-line NIR Detection Model Optimization of Soluble Solids Content in Navel Orange Based on CARS. Trans. Chin. Soc. Agric. Mach. 2013, 44, 138–144. [Google Scholar]
- Krepper, G.; Romeo, F.; de Sousa Fernandes, D.D.; Diniz, P.H.G.D.; de Araújo, M.C.U.; Di Nezio, M.S.; Pistonesi, M.F.; Centurión, M.E. Determination of fat content in chicken hamburgers using NIR spectroscopy and the Successive Projections Algorithm for interval selection in PLS regression (iSPA-PLS). Spectrochim. Acta Part A Mol. Biomol. Spectrosc. 2018, 189, 300–306. [Google Scholar] [CrossRef]
- Centner, V.; Massart, D.-L.; de Noord, O.E.; de Jong, S.; Vandeginste, B.M.; Sterna, C. Elimination of uninformative variables for multivariate calibration. Anal. Chem. 1996, 68, 3851–3858. [Google Scholar] [CrossRef]
- Liu, Y.; Sun, X.; Ouyang, A. Nondestructive measurement of soluble solid content of navel orange fruit by visible–NIR spectrometric technique with PLSR and PCA-BPNN. LWT-Food Sci. Technol. 2010, 43, 602–607. [Google Scholar] [CrossRef]
- Wolda, S.; Sjöstróma, M.; Eriksson, L. PLS-regression: A basic tool of chemometrics. Chemom. Intell. Lab. Syst. 2001, 50, 109–130. [Google Scholar] [CrossRef]
- Meng, Q.; Shang, J.; Huang, R.; Chen, L.; Zhang, Y. Nondestructive detection of soluble solids content in apple by visible-near infrared spectroscopy. Food Ferment. Ind. 2020, 46, 205–209. [Google Scholar]
- Xu, W.; Yao, L.; Sun, T.; Hu, T.; Hu, T.; Liu, M. CARS-SPA baesd Visble/near Infraed spectroscopy on-line detection of apple soluble solids content. Sci. Technol. Food Ind. 2014, 35, 61–64. [Google Scholar]
- Zhang, M. Design and Implementation of Apple Sugar Content Detection Based on Infrared Spectroscopy. Heilongjiang University: Harbin, China, 2017. [Google Scholar]
- Liu, Z.; Wang, L.; GXi, G.; Peng, C.; Jiao, Y. The Current Status and Development of Fruit Maturity Detection Technology. Agric. Technol. 2020, 40, 17–21. [Google Scholar]
- Hu, Y.; Jiang, H.; Zhou, H.; Wang, Y. Research Progress on Nondestructive Detection of Fruit Maturity by Near Infrared Spectroscopy and Hyperspectral Imaging. Sci. Technol. Food Ind. 2021, 42, 377–383. [Google Scholar]
- Guangzhou Biaoqi Optoelectronics [EB/OL]. Available online: http://www.gzbiaoqi.com/ (accessed on 22 August 2024).
- Yang Li, Y.; Peng, Y.; Lü, D.; Li, Y.; Liu, L.; Zhu, Y. Development of Mobile Orchard Local Grading System of Apple Internal Quality. Smart Agric. 2022, 4, 132–142. [Google Scholar]
- Guo, Z.; Huang, W.; Chen, Q.; Peng, Y.; Zhao, J. Model Optimization for the On-line Inspection of Internal Apple Quality by Shortwave Near-infrared Spectroscopy. Mod. Food Sci. Technol. 2016, 32, 147–153. [Google Scholar]
- 2024 China Apple Industry Data Analysis Report. [EB/OL]. Available online: https://www.thepaper.cn/newsDetail (accessed on 26 June 2024).

| Preprocessing Method | Feature Selection | Feature Wavelengths | LVs | Training Set | Test Set | ||
|---|---|---|---|---|---|---|---|
| R2c | RMSEC | R2v | RMSEV | ||||
| Raw spectrum | CARS | 111 | 20 | 0.98 | 0.19 | 0.73 | 0.58 |
| Raw spectrum + MSC | 184 | 30 | 0.99 | 0.05 | 0.90 | 0.36 | |
| Raw spectrum + SNV | 236 | 28 | 0.99 | 0.06 | 0.88 | 0.37 | |
| Raw spectrum + FD | 162 | 27 | 0.99 | 0.04 | 0.87 | 0.41 | |
| Raw spectrum + SD | 162 | 29 | 0.99 | 0.04 | 0.83 | 0.48 | |
| Raw spectrum + SG | 184 | 30 | 0.99 | 0.11 | 0.70 | 0.67 | |
| Raw spectrum | SPA | 24 | 20 | 0.57 | 0.75 | 0.53 | 0.65 |
| Raw spectrum + MSC | 24 | 24 | 0.50 | 0.79 | 0.48 | 0.68 | |
| Raw spectrum + SNV | 24 | 20 | 0.56 | 0.75 | 0.47 | 0.68 | |
| Raw spectrum + FD | 24 | 22 | 0.42 | 0.83 | 0.49 | 0.67 | |
| Raw spectrum + SD | 24 | 23 | 0.41 | 0.82 | 0.50 | 0.68 | |
| Raw spectrum + SG | 24 | 20 | 0.51 | 0.78 | 0.37 | 0.72 | |
| Raw spectrum | UVE | 263 | 20 | 0.94 | 0.30 | 0.43 | 0.92 |
| Raw spectrum + MSC | 222 | 20 | 0.93 | 0.34 | 0.38 | 1.08 | |
| Raw spectrum + SNV | 219 | 25 | 0.96 | 0.25 | 0.31 | 1.08 | |
| Raw spectrum + FD | 78 | 30 | 0.93 | 0.33 | 0.32 | 1.35 | |
| Raw spectrum + SD | 57 | 25 | 0.90 | 0.39 | 0.39 | 1.06 | |
| Raw spectrum + SG | 145 | 30 | 0.89 | 0.41 | 0.52 | 0.88 | |
| Preprocessing Method | Feature Selection | Feature Wavelengths | LVs | Training Set | Test Set | ||
|---|---|---|---|---|---|---|---|
| R2c | RMSEC | R2v | RMSEV | ||||
| Raw spectrum | CARS | 120 | 30 | 0.99 | 0.09 | 0.61 | 0.87 |
| Raw spectrum + MSC | 108 | 30 | 0.99 | 0.11 | 0.64 | 0.92 | |
| Raw spectrum + SNV | 120 | 30 | 0.99 | 0.01 | 0.71 | 0.65 | |
| Raw spectrum + FD | 133 | 29 | 0.99 | 0.02 | 0.88 | 0.39 | |
| Raw spectrum + SD | 133 | 28 | 0.99 | 0.03 | 0.64 | 0.69 | |
| Raw spectrum + SG | 149 | 16 | 0.79 | 0.56 | 0.20 | 1.43 | |
| Raw spectrum | SPA | 24 | 24 | 0.55 | 0.76 | 0.36 | 0.76 |
| Raw spectrum + MSC | 24 | 24 | 0.54 | 0.76 | 0.30 | 0.76 | |
| Raw spectrum + SNV | 24 | 24 | 0.57 | 0.74 | 0.48 | 0.69 | |
| Raw spectrum + FD | 24 | 21 | 0.43 | 0.81 | 0.31 | 0.75 | |
| Raw spectrum + SD | 24 | 23 | 0.47 | 0.79 | 0.26 | 0.77 | |
| Raw spectrum + SG | 24 | 20 | 0.55 | 0.76 | 0.24 | 0.80 | |
| Raw spectrum | UVE | 24 | 19 | 0.71 | 0.64 | 0.20 | 0.94 |
| Raw spectrum + MSC | 30 | 18 | 0.71 | 0.64 | 0.21 | 1.05 | |
| Raw spectrum + SNV | 29 | 24 | 0.62 | 0.71 | 0.17 | 0.97 | |
| Raw spectrum + FD | 14 | 14 | 0.50 | 0.78 | 0.16 | 0.96 | |
| Raw spectrum + SD | 24 | 24 | 0.66 | 0.67 | 0.17 | 1.03 | |
| Raw spectrum + SG | 29 | 20 | 0.54 | 0.76 | 0.17 | 0.91 | |
| Preprocessing Method | Feature Selection | Feature Wavelengths | LVs | Training Set | Test Set | ||
|---|---|---|---|---|---|---|---|
| R2c | RMSEC | R2v | RMSEV | ||||
| Raw spectrum | CARS | 110 | 30 | 0.99 | 0.06 | 0.86 | 0.53 |
| Raw spectrum + MSC | 123 | 30 | 0.99 | 0.04 | 0.80 | 0.62 | |
| Raw spectrum + SNV | 155 | 30 | 0.99 | 0.03 | 0.85 | 0.52 | |
| Raw spectrum + FD | 123 | 30 | 0.99 | 0.02 | 0.94 | 0.33 | |
| Raw spectrum + SD | 123 | 30 | 0.99 | 0.02 | 0.88 | 0.46 | |
| Raw spectrum + SG | 138 | 30 | 0.96 | 0.22 | 0.18 | 1.68 | |
| Raw spectrum | SPA | 24 | 20 | 0.54 | 0.72 | 0.31 | 0.91 |
| Raw spectrum + MSC | 24 | 24 | 0.52 | 0.73 | 0.32 | 0.90 | |
| Raw spectrum + SNV | 24 | 24 | 0.42 | 0.77 | 0.37 | 0.89 | |
| Raw spectrum + FD | 24 | 24 | 0.47 | 0.75 | 0.41 | 0.79 | |
| Raw spectrum + SD | 24 | 24 | 0.49 | 0.74 | 0.47 | 0.83 | |
| Raw spectrum + SG | 24 | 24 | 0.49 | 0.73 | 0.29 | 0.91 | |
| Raw spectrum + RAW | UVE | 22 | 18 | 0.65 | 0.64 | 0.27 | 0.93 |
| Raw spectrum + MSC | 21 | 19 | 0.64 | 0.64 | 0.32 | 0.91 | |
| Raw spectrum + SNV | 20 | 20 | 0.62 | 0.66 | 0.26 | 0.96 | |
| Raw spectrum + FD | 28 | 20 | 0.74 | 0.57 | 0.28 | 0.96 | |
| Raw spectrum + SD | 44 | 20 | 0.87 | 0.42 | 0.18 | 1.11 | |
| Raw spectrum + SG | 20 | 18 | 0.60 | 0.67 | 0.20 | 0.99 | |
| Detection Method | Wavelength Range (nm) | PLSR | |||
|---|---|---|---|---|---|
| Training Set R2c | RMSEC | Test Set R2v | RMSEP | ||
| Single channel | 400–1100 | 0.99 | 0.05 | 0.90 | 0.36 |
| Dual-channel co-spectroscopy | 400–700 | 0.99 | 0.02 | 0.88 | 0.39 |
| 700–1100 | 0.99 | 0.02 | 0.94 | 0.33 | |
| Sorting Line Category | Detection Method | Wavelength Range (nm) | Detection Efficiency (Items per Second) | Number of Spectrometers | 2025 Market Price (CNY) | 2021 Market Price (CNY) | Price Difference (CNY) |
|---|---|---|---|---|---|---|---|
| Single line | Single channel | 400–1100 | 3–5 | 1 | 159,000 | 130,000 | 29,000 |
| Dual line | Dual channel | 400–1100 | 6–10 | 2 | 318,000 | 260,000 | 58,000 |
| Dual channel co-spectroscopy | 400–700 | 6–10 | 1 | 159,000 | 130,000 | 29,000 | |
| 700–1100 |
Disclaimer/Publisher’s Note: The statements, opinions and data contained in all publications are solely those of the individual author(s) and contributor(s) and not of MDPI and/or the editor(s). MDPI and/or the editor(s) disclaim responsibility for any injury to people or property resulting from any ideas, methods, instructions or products referred to in the content. |
© 2025 by the authors. Licensee MDPI, Basel, Switzerland. This article is an open access article distributed under the terms and conditions of the Creative Commons Attribution (CC BY) license (https://creativecommons.org/licenses/by/4.0/).
Share and Cite
Liang, X.; Jiang, T.; Dai, W.; Xu, S. Dual-Channel Co-Spectroscopy–Based Non-Destructive Detection Method for Fruit Quality and Its Application to Fuji Apples. Agronomy 2025, 15, 484. https://doi.org/10.3390/agronomy15020484
Liang X, Jiang T, Dai W, Xu S. Dual-Channel Co-Spectroscopy–Based Non-Destructive Detection Method for Fruit Quality and Its Application to Fuji Apples. Agronomy. 2025; 15(2):484. https://doi.org/10.3390/agronomy15020484
Chicago/Turabian StyleLiang, Xin, Tian Jiang, Wanli Dai, and Sai Xu. 2025. "Dual-Channel Co-Spectroscopy–Based Non-Destructive Detection Method for Fruit Quality and Its Application to Fuji Apples" Agronomy 15, no. 2: 484. https://doi.org/10.3390/agronomy15020484
APA StyleLiang, X., Jiang, T., Dai, W., & Xu, S. (2025). Dual-Channel Co-Spectroscopy–Based Non-Destructive Detection Method for Fruit Quality and Its Application to Fuji Apples. Agronomy, 15(2), 484. https://doi.org/10.3390/agronomy15020484