Article

The Effects of Reducing Nitrogen and Increasing Density in the Main Crop on Yield and Cadmium Accumulation of Ratoon Rice

1
College of Agronomy, Hunan Agricultural University, Changsha 410128, China
2
Agriculture and Rural Bureau of Hengnan County, Hengyang 421100, China
3
Yongzhou Branch of Hunan Provincial Tobacco Company, Yongzhou 425000, China
*
Author to whom correspondence should be addressed.
Agronomy 2025, 15(2), 485; https://doi.org/10.3390/agronomy15020485
Submission received: 6 January 2025 / Revised: 4 February 2025 / Accepted: 11 February 2025 / Published: 17 February 2025
(This article belongs to the Section Soil and Plant Nutrition)

Abstract

:
Rice cultivated in cadmium (Cd)-polluted acidic paddy soil poses important health risks in China. Mitigating Cd accumulation in rice is of crucial importance for food safety and human health. In this study, using Chuangliangyou 669 as the ratoon rice variety, a field experiment was conducted in paddy fields with severe Cd pollution (Cd concentration > 1.0 mg kg−1). The aim was to explore the impacts of different nitrogen (N) fertilizer levels (N1-180 kg hm−2, N2-153 kg hm−2, N3-126 kg hm−2) and planting densities (D1-20 cm × 20 cm, D2-16.7 cm × 16.7 cm) in the main crop on the yield and Cd accumulation characteristics of ratoon rice. The results showed that reducing the amount of N fertilizer would lead to a decrease in the yield of ratoon rice, while increasing the planting density could increase the yield, mainly by increasing the effective panicle. Among the various combined treatments, the yields of N1M2 and N2M2 were relatively high. The planting density had no significant impact on the Cd concentration, translocation factor and bioaccumulation factor of ratoon rice. The Cd concentration in various tissues of ratoon rice decreased significantly with the reduction in N fertilizer application. Reducing N fertilizer application could increase the pH, reduce the concentration of available Cd in the soil and consequently reduce the Cd bioaccumulation factor of various tissues of ratoon rice and the Cd translocation factor from roots and stems to brown rice. Considering both the yield and the Cd concentration in brown rice, N2M2 was the optimal treatment of reducing N and increasing density, which could maintain a relatively high yield while significantly reducing the Cd concentration.

1. Introduction

Cadmium (Cd) is a highly toxic and bioaccumulative heavy metal element, whose presence in the environment has posed a serious threat to agricultural production, especially rice cultivation [1]. Cd is easily absorbed by the roots of rice plants and transported to the above-ground parts, eventually accumulating in the grains. Once humans consume rice with excessive Cd concentration over a long period, Cd will accumulate in the body, leading to Cd poisoning, causing irreversible damage to vital tissues such as the kidneys, liver and bones, and seriously affecting human health and quality of life [2,3]. At present, how to effectively control the Cd concentration in rice has become a key issue that urgently needs to be solved in the fields of agriculture and food safety.
Ratoon rice, as an efficient rice cultivation mode, is mainly cultivated in the warm, humid and water-rich areas of the south, and its prospects are very broad. On the one hand, it can increase the total grain output by sowing once and harvesting twice, thus ensuring national food security. On the other hand, it can increase farmers’ income by saving manpower and costs. In terms of promotion, the planting area of ratoon rice has been continuously expanded, from a smaller scale in the past to the current widespread planting in many places, and the yield has continued to rise. It is playing an increasingly important role in ensuring food supply and promoting agricultural economic development. Compared with conventional rice, ratoon rice has unique growth cycles and physiological characteristics [4]. In terms of Cd accumulation, the Cd absorption in the main crop of ratoon rice significantly affects the ratoon crop. During the growth of the main crop rice, Cd accumulated in the stems and roots is transported again to the newly grown stems, leaves and grains in the ratoon crop [5]. Moreover, due to its relatively short growth period in the ratoon crop and special nutrient redistribution mechanism, ratoon rice differs from single-cropping rice in the dynamics of Cd absorption, transportation and accumulation [6]. Therefore, in-depth research on the growth and development of ratoon rice and its Cd accumulation patterns in Cd-contaminated environments is of great significance for developing prevention and control strategies against Cd pollution in ratoon rice.
Nitrogen (N) fertilizer is not only a key cultivation factor affecting high-yield rice but also has a complex relationship with Cd absorption in rice. On the one hand, the application of N fertilizer can change the physical and chemical properties of the soil, such as soil pH, which affects the absorption of Cd by rice [7,8]. On the other hand, the N nutrition level can influence the physiological and metabolic processes of rice, thus regulating the transport and distribution of Cd within the rice plant [9]. Planting density, as an important agronomic measure in rice cultivation, directly controls the structure and micro-environment of the rice population. In the ratoon rice cultivation system, the setting of density has a chain reaction on the growth of the double-cropping rice [10]. A reasonable density arrangement helps to optimize the population structure of the main crop rice, improve its yield and stress resistance, and also lay a good foundation for the germination and growth of the ratoon crop rice [11]. However, current research on N fertilizer and density mainly focuses on single-cropping rice or double-cropping rice [12,13], with relatively few studies on ratoon rice. Against the backdrop of Cd pollution, research on the interrelationships among N fertilizer, density and ratoon rice is crucial for establishing a scientific and efficient cultivation technology system for increasing the yield of ratoon rice while reducing Cd concentration.
The reasonable management of N fertilizer and density can reduce the Cd concentration in ratoon rice while increasing its yield, thus alleviating the problems of food production reduction and quality decline caused by soil Cd pollution. Moreover, in the context of sustainable agricultural development, delving into the internal relationships among N fertilizer, density, Cd absorption and the yield of ratoon rice can promote the development of ratoon rice cultivation techniques and enhance the economic and ecological benefits of agricultural production [14]. In view of this, in Cd-contaminated soil, the effects of three N fertilizer application amounts and two planting densities on the yield and Cd accumulation characteristics of ratoon rice were studied. The main aims of the study were as follows: (1) to investigate the effects of different N fertilizer application amounts and densities on the yield and Cd concentration of ratoon rice; (2) to study the effects of different treatments on the availability of soil Cd; (3) to assess the differences in Cd absorption, transport, distribution and accumulation of ratoon rice under the interaction of different N fertilizer application amounts and densities.

2. Materials and Methods

2.1. Test Site and Materials

This study was conducted in a paddy field mildly contaminated with Cd in Chenzhou county (26°97′ N, 111°37′ E), Hunan province, China in 2022. The study area adopts a typical double-season rice cropping system and is located in the central mainland of China. It has a subtropical monsoon climate, with an average annual sunshine duration of about 1495.5 h, an average relative humidity of about 70%, an annual precipitation of 1452 mm and an average annual temperature of 17.9 °C.
The Cd concentration of the soil at the study site was 1.36 mg kg−1 and the pH was 5.92. According to Chinese National Soil Pollution Evaluation Regulations, the soil was classed as severe contaminated with Cd (soil Cd concentration > 1.0 mg kg−1) [15]. The study site had red soil with an available Cd concentration of 0.48 mg kg−1, an alkaline hydrolysis N concentration of 165.81 mg kg−1, an available phosphorus concentration of 25.64 mg kg−1, an available potassium concentration of 177.54 mg kg−1, a tissue matter concentration of 28.86 g kg−1, a total N concentration of 2.35 g kg−1, a total phosphorus concentration of 0.86 g kg−1, and a total potassium concentration of 9.43 g kg−1. The ratoon rice variety that was tested was the hybrid rice variety Chuangliangyou 669. The ratoon rice variety used for the test is the indica hybrid rice variety Chuangliangyou 669, which is planted as a mid-season rice in the middle and lower reaches of the Yangtze River, with a full growth period of 136.1 days. The plant height is 118.2 cm, the ear length is 24.9 cm, the number of effective ears per mu is 173,000, the total number of grains per ear is 209.7, the fruit setting rate is 87.2%, the thousand-grain weight is 24.0 g and the average yield per mu is 655.87 kg (www.ricedata.com, accessed on 4 February 2025).

2.2. Experimental Design

A split-plot experimental design was used, with the N application amount as the main plots and planting density as the sub-plots. A protective row 1.5 m wide was set around each plot. In the main crop of ratoon rice, three levels of the N application amount were set (N1-pure N 180 kg hm−2, N2-pure N 153 kg hm−2, N3-pure N 126 kg hm−2) along with two planting densities (D1-20 cm × 20 cm, D2-16.7 cm × 16.7 cm), resulting in a total of six treatments. Each treatment had three replicates, making up 18 plots in total, with each plot having an area of 20 m2. To prevent the seepage of water and fertilizer, the plots were separated by plastic-covered ridges.
The main crop of ratoon rice was sown on 2 April, transplanted on 4 May (with 2 basic seedlings per hole) and harvested on 10 August. During this period, N fertilizer (urea, with 46.4% N content) was applied with a ratio of basal fertilizer–tillering fertilizer–panicle fertilizer = 5:2:3. The application amounts of phosphate fertilizer (P2O5) and potash fertilizer (K2O) were 105 kg hm−2 and 180 kg hm−2, respectively. All of the phosphate fertilizer was applied as basal fertilizer, and potash fertilizer was applied with a ratio of basal fertilizer–panicle fertilizer = 5:5. Basal fertilizer was applied one day before transplantation, tillering fertilizer was applied after the seedlings turned green after transplantation and panicle fertilizer was applied at the 2–3 stages of young panicle differentiation. The ratoon crop was harvested on 20 October. During this period, the application amount of urea for each treatment was 187.5 kg hm−2. Specifically, 112.5 kg hm−2 of urea was top-dressed 7–10 days before the harvest of the main crop as the bud-promoting fertilizer for ratoon rice, and 60 kg hm−2 of potash fertilizer and 75 kg hm−2 of urea were applied as the strong-seedling fertilizer for ratoon rice on the second day after the harvest of the main crop. The water management for all plots was the same. A shallow water layer was maintained during the tillering stage, the field was dried at the end of the tillering stage, a water layer of 3–5 cm was maintained after the booting stage and the water was cut off about 7 days before harvest. Pest and disease control was carried out in accordance with the local unified prevention and control management.

2.3. Measurement Items and Methods

At maturity stage, 80 rice plants in each plot were examined to calculate the effective panicle number per plant. Then, according to the average effective panicle per hole, 5 holes of rice were taken from each plot and brought back to the laboratory for seed testing. The grains per panicle, the seed setting rate and the thousand-grain weight were examined, and then the theoretical yield was calculated. A total of 80 rice plants were randomly selected from each plot for harvest, but the outer three rows were not harvested. After threshing, the straw and empty grains were removed, the grains were weighed and the moisture concentration was determined by the drying method. The actual yield was calculated with a moisture concentration of 13.5%. The following formula was used: actual yield = harvest yield × (1 − moisture concentration)/0.865.
Soil samples taken from a depth of 0 to 20 cm were collected using the five-point sampling method at the full-heading stage, milky stage and maturity stage of both the main crop and ratoon crop. The soil samples were dried in air, and then ground and passed through 20- and 100-mesh sieves to determine the available Cd concentration and pH value in the soil. The available Cd concentration was determined by leaching with DTPA extractant (5 g of dry soil and 0.1 mol CaCl2 at a soil–liquid ratio at 25 °C for 2 h with mixing at 250 rpm), and the Cd concentration in the extracting solution was determined using an AA800 graphite furnace atomic absorption spectrometer (PerkinElmer, Waltham, MA, USA). The soil pH value was measured using a pH meter (PHS-25, Shanghai, China) at a water-to-soil ratio of 5:1.
Before sampling, the number of tillers of 80 rice holes in each plot was investigated, and the average number of tillers per hole was calculated. Then, 5 rice holes were taken from each plot according to the number of tillers and brought back to the room, and the roots, stems, leaves and panicles (the panicles were further divided into branches, empty grains, husks and brown rice) were bagged separately, put into an oven at 105 °C for 0.5 h and dried at 80 °C. Then, they were crushed separately using a stainless steel plant sample crusher and passed through a 100-mesh sieve. For Cd concentration, 0.5 g of the plant samples was weighed and digested with a mixed acid solution (HF-HClO4-HNO3) inagraphite digestion box (DS-360; China National Analytical Center, Guangzhou, China). Then, the Cd concentration in the digestion solution was detected using an AA800 atomic absorption spectrometer (Perkin Elmer, Waltham, MA, USA).
The Cd translocation factor (TF) was calculated using the following equation:
TF = CdA/CdB
where CdA is the Cd concentration of brown rice, and CdB is the Cd concentration of the root, stem, leaf and panicle, respectively.
The Cd bioaccumulation factor (BAF) was calculated using the following equation:
BAFC = CdC/Cdsoil
where CdC is the Cd concentration of the plant tissues (root, stem, leaf or brown rice), and Cdsoil is the Cd concentration of the soil.

2.4. Statistical Analysis

One-way analyses of variance and Pearson correlation tests for the different treatments were performed using SPSS 24 software (IBM, Armonk, NY, USA). The figures and tables were drawn using the Origin 2021 (OriginLab, Northampton, MA, USA) and Excel 2013 (Microsoft Corporation, Redmond, WA, USA).

3. Results

3.1. Effects of N Fertilizer and Density on the Yield of Ratoon Rice

As shown in Table 1, the different N fertilizer application amounts and planting density treatments had a significant impact on the yield and yield components of ratoon rice. For N fertilizer treatments, the actual yields in the main crop and ratoon crop decreased significantly among treatments in the order of N1 > N2 > N3, and both N1 and N2 were significantly higher than N3 by 12–15% and 4–7%, respectively. In terms of the yield-related components, the grains per panicle increased with the increase in N application amount. For density treatments, the actual yields in both the main crop and ratoon crop were the highest in D2, and were significantly higher than those in D1 by 7.51–10.05%. In terms of the yield-related components, there were no significant differences in the grains per panicle, seed setting rate and thousand-grain weight, while the effective panicle was significantly higher in the high-density treatment (D2) than in the low-density treatment (D1). Among the combined treatments, the yields in both the main crop and ratoon crop were the highest in N1D2, followed by N2D2. The main reason was also that N1D2 significantly increased the effective panicle compared with other treatments.

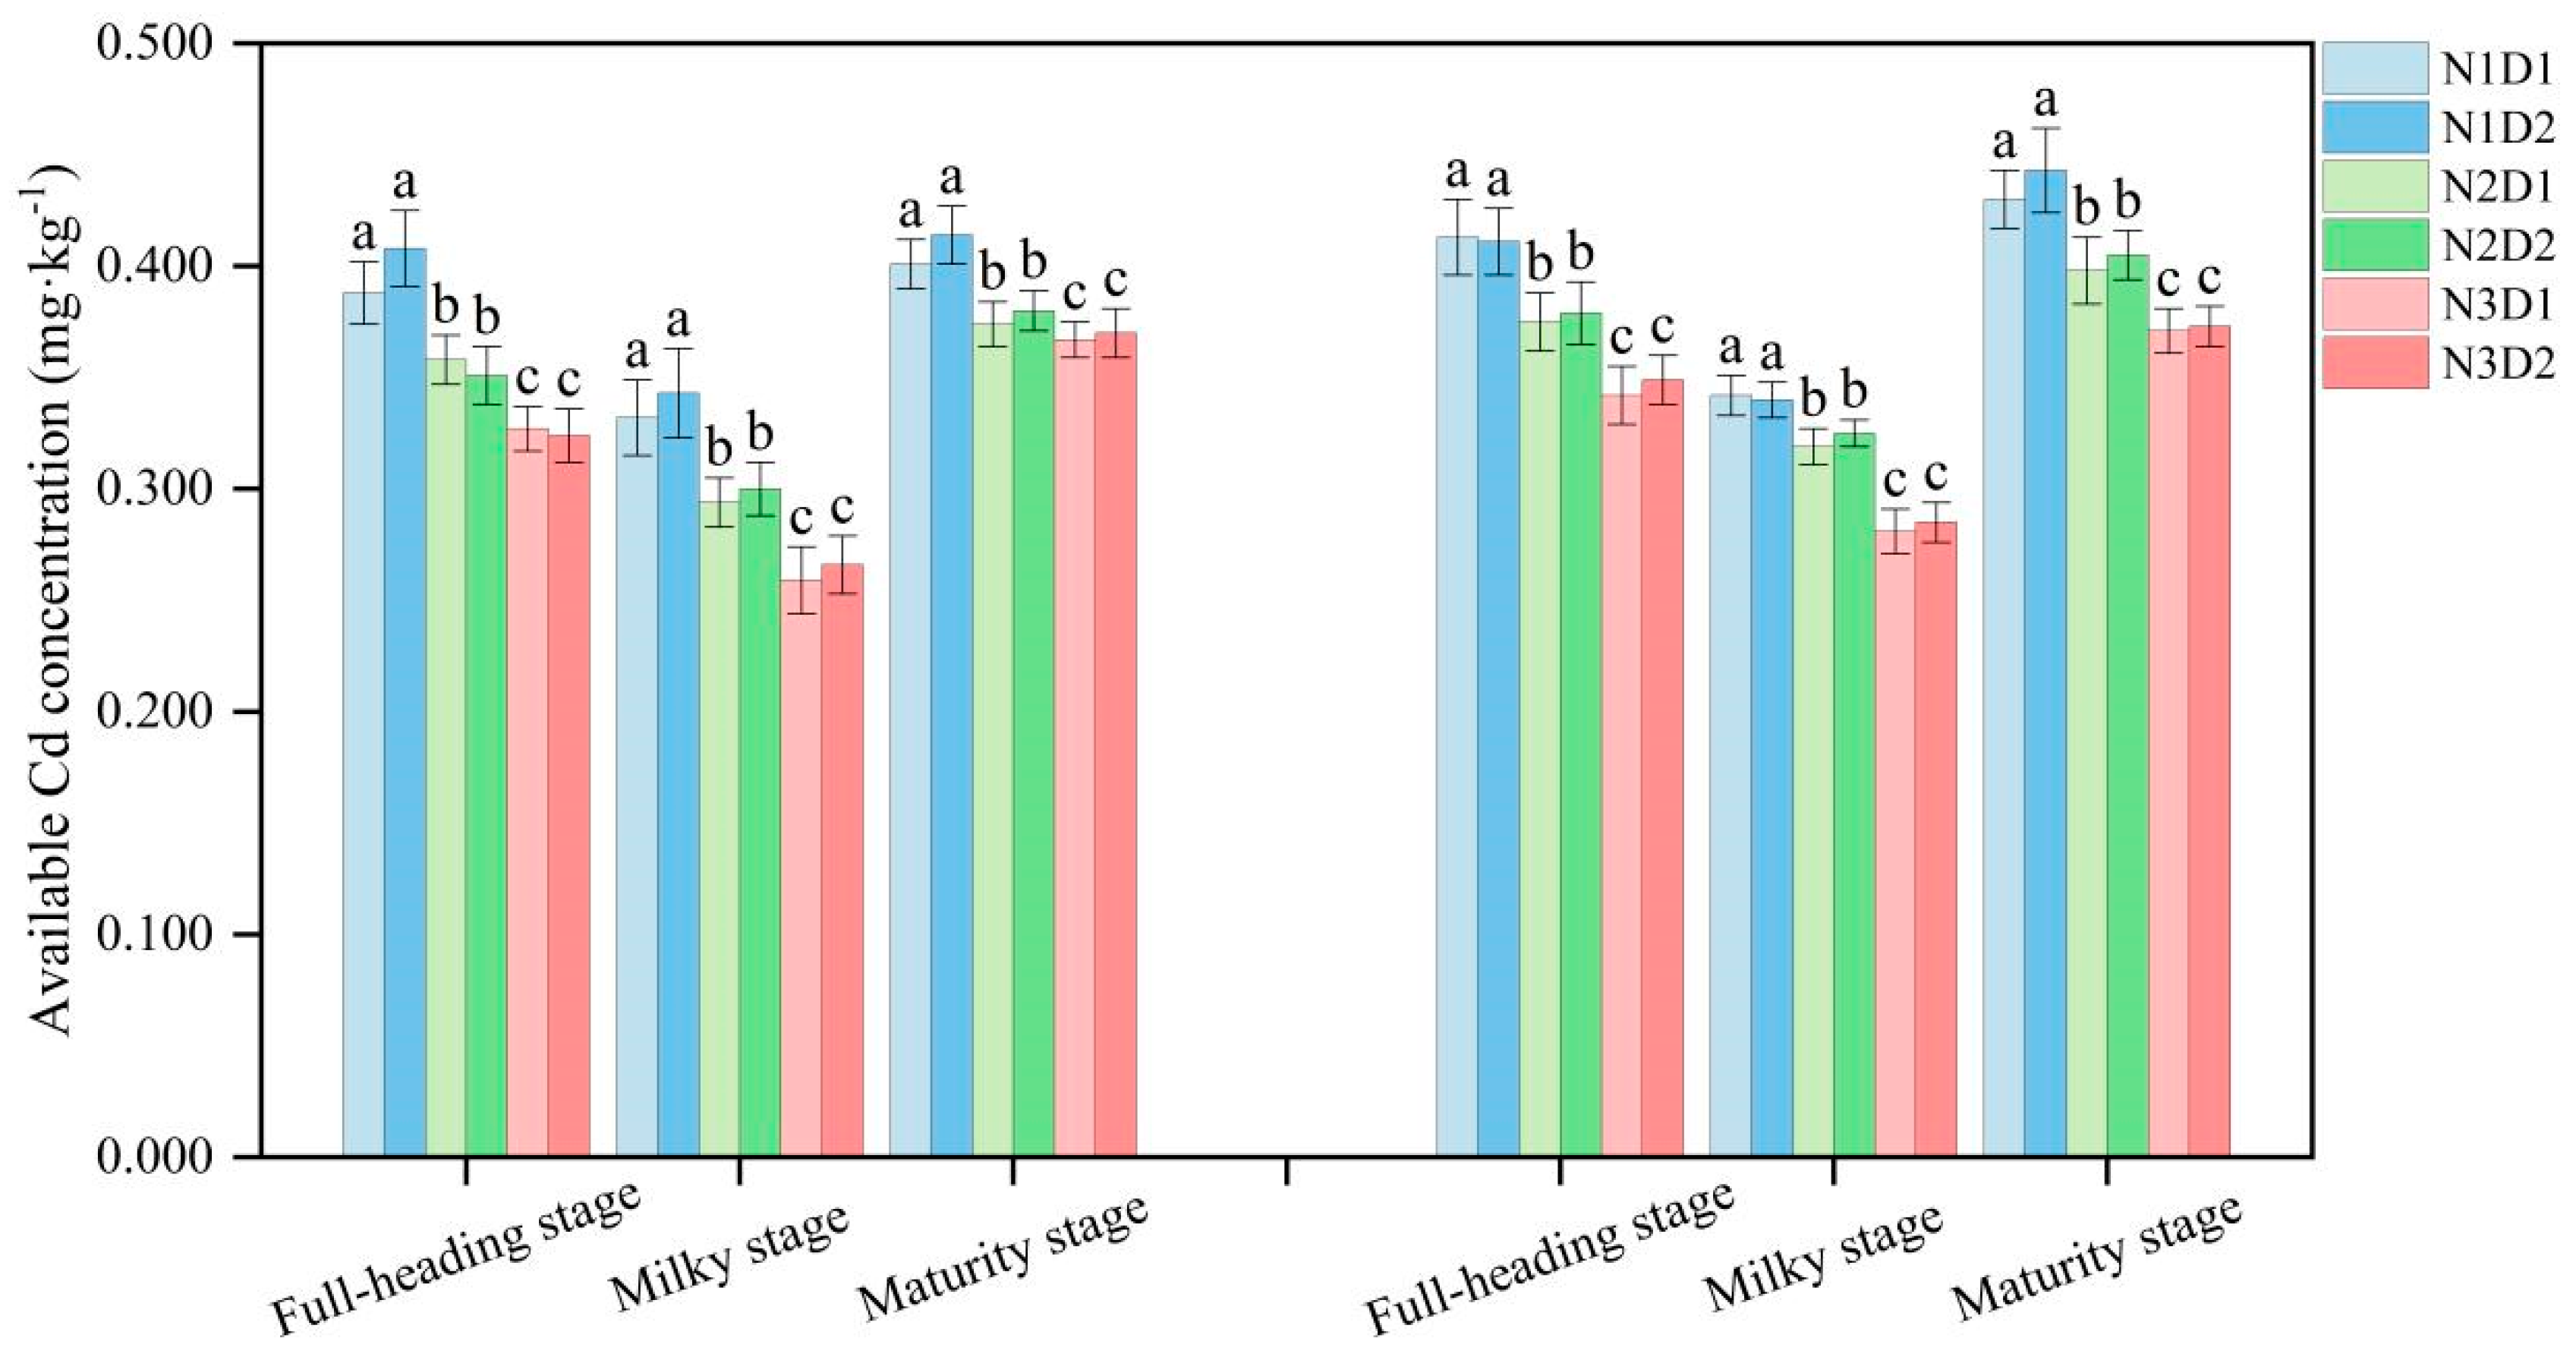
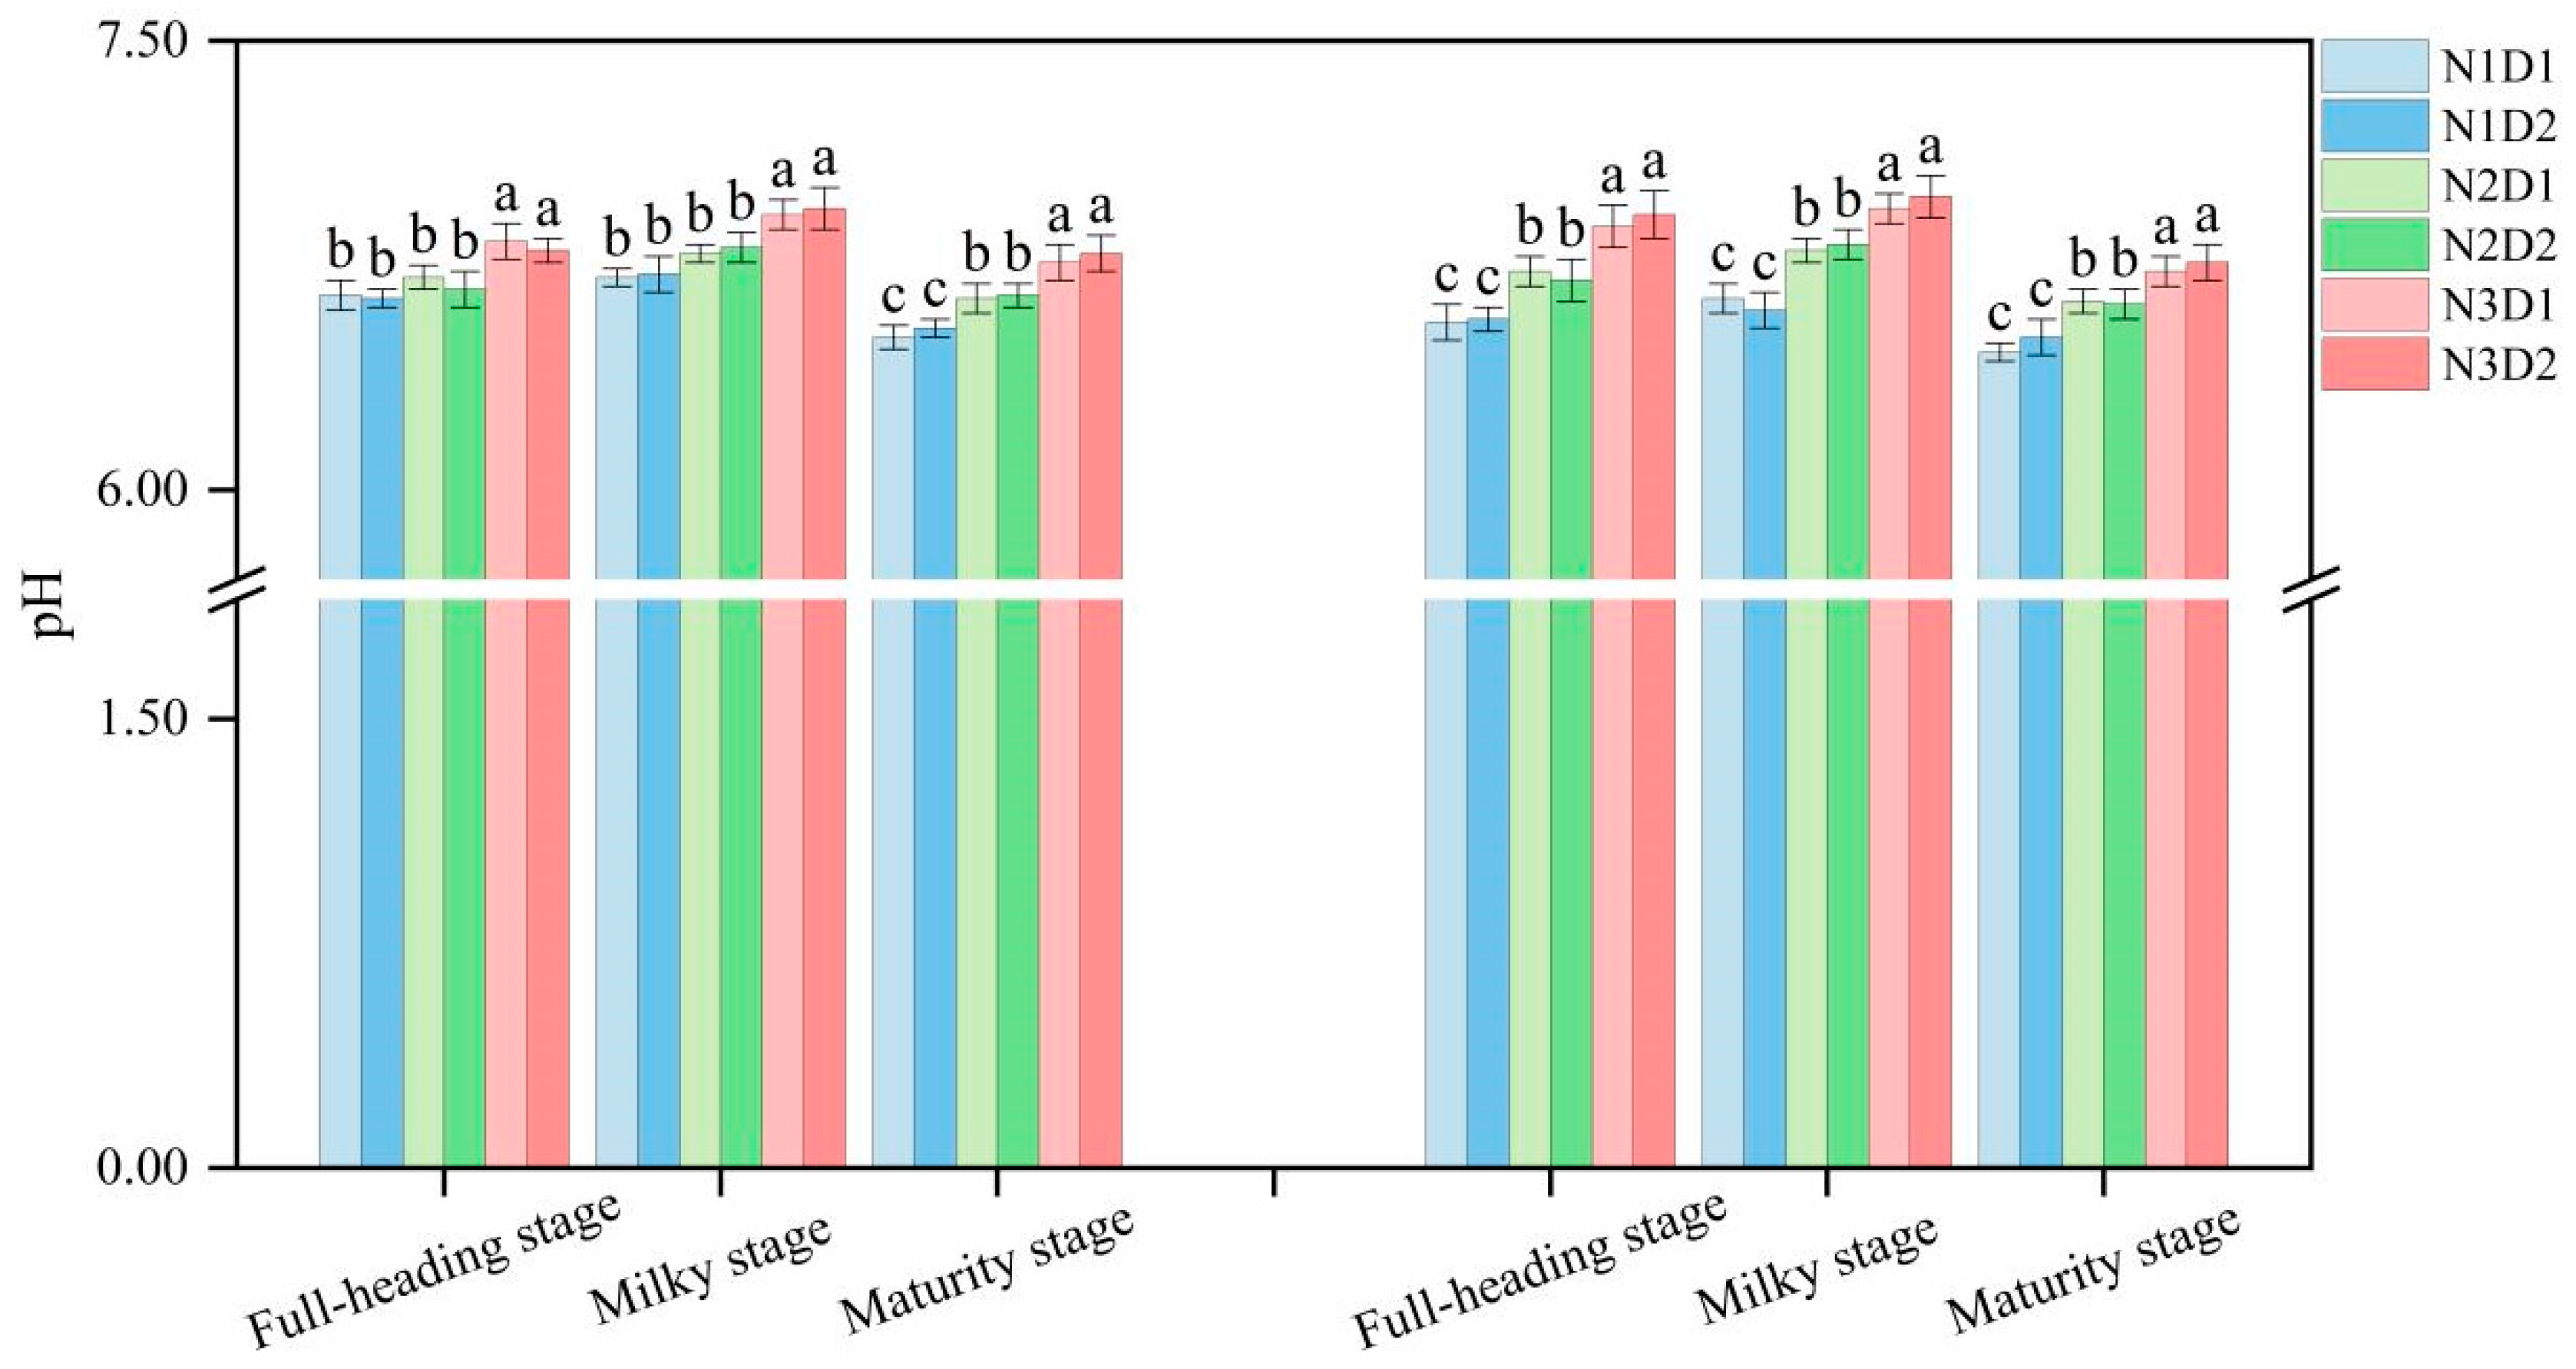
3.2. Effects of N Fertilizer and Density on the pH and Available Cd of Soil

As shown in Figure 1, there were significant differences in the available Cd among different N fertilizer application amount treatments, while the planting density had no significant impact on it. From the full-heading stage to the maturity stage, the soil available Cd concentration of both the main crop and ratoon crop first decreased and then increased. For N fertilizer treatments, the available Cd concentration at each growth stage of the main crop and ratoon crop increased significantly with the increase in N application amount; that is, N1 > N2 > N3. For density treatments, there was no significant difference in the available Cd between D1 and D2. Therefore, among the combined treatments, the available Cd concentration at each growth stage of the main crop and ratoon crop was the highest in the N1 treatment group (N1D1, N1D2), and the lowest in the N3 treatment group (N3D1, N3D2).
As shown in Figure 2, contrary to the performance of available Cd, the pH in the main crop and ratoon crop showed a trend of first increasing and then decreasing from the full-heading stage to the maturity stage. For N fertilizer treatments, the pH at each growth stage in the main crop and ratoon crop decreased significantly among treatments in the order of N3 > N2 > N1. In the main crop, N3 was significantly higher than N1 and N2, and there were significant differences among treatments in the ratoon crop. Different planting density treatments had no significant impact on soil pH. Therefore, for the combined treatments, the soil pH at each growth stage in the main crop and ratoon crop was the highest in the N3 treatment group (N3D1, N3D2) and the lowest in the N1 treatment group (N1D1, N1D2).

3.3. Effects of N Fertilizer and Density on the Cd Accumulation Characteristics of Ratoon Rice

3.3.1. Effects of N Fertilizer and Density on the Cd Concentration of Ratoon Rice

As can be seen from Table 2, the Cd concentration in various tissues of the main crop and ratoon crop under different treatments showed the order of root > stem > leaf > panicle. For N fertilizer treatments, the Cd concentration in various tissues of the main crop and ratoon crop decreased with the reduction in N application amount—that is, N1 > N2 > N3—and there were significant differences among treatments. In the main crop, compared with N2 and N3, the Cd concentration in the root of N1 was 10% and 18% higher, respectively, the Cd concentration in the stem was 6.16% and 12.71% higher, the Cd concentration in the leaf was 19% and 33% higher, and the Cd concentration in the panicle was 17% and 44% higher. In the ratoon crop, compared with N2 and N3, the Cd concentration in the root of N1 was 9% and 16% higher, respectively, the Cd concentration in the stem was 11% and 18% higher, the Cd concentration in the leaf was 17% and 34% higher, and the Cd concentration in the panicle was 33% and 56% higher. There was no significant difference in the Cd concentration of ratoon rice between D1 and D2 under different planting density conditions. Among the combined treatments, except for the root in the main crop, the Cd concentration in other parts of N1D1 and N1D2 was significantly higher than that of the other treatments.
By comparing the Cd concentration in various parts of the panicles at the maturity stage of the main crop and ratoon crop in each treatment (Table 3), it was found that the Cd concentration in different parts of ratoon rice showed the order of branch > grain husk > brown rice > empty grain. The Cd concentration in various parts of the panicle decreased significantly among N fertilizer treatments in the order of N1 > N2 > N3, and there were significant differences among the treatments. For brown rice, N1 was significantly 18% and 31% higher than N2 and N3, respectively, in the main crop, and it was significantly 12% and 32% higher in the ratoon crop. For planting density treatments, the Cd concentration in various parts of the panicle in the main crop and ratoon crop showed the pattern of M1 > M2, but there was no significant difference among the treatments. Among the combined treatments, the Cd concentration in various parts of the panicle was the highest in N1D1, followed by N1D2. In the main crop, only the Cd concentration in brown rice of N1D1 and N1D2 exceeded 0.2 mg·kg−1, while the Cd concentration in brown rice of all treatments was higher than 0.2 mg·kg−1 in the ratoon crop.

3.3.2. Effects of N Fertilizer and Density on Cd Absorption and Translocation in Ratoon Rice

As can be seen from Table 4, the Cd bioaccumulation factor (BAF) of various tissues in both the main crop and ratoon crop among treatments showed the order of root > stem > leaf > panicle > brown rice. For N fertilizer treatments, the BAF of various tissues in the main crop and ratoon crop decreased significantly in the order of N1 > N2 > N3, and there were significant differences among treatments. However, there were no significant differences in the BAF of various tissues among different planting density treatments. Among the combined treatments, except for the root in the main crop, the BAF of other parts in N1D1 and N1D2 was significantly higher than those of other treatments.
As can be seen from Table 5, the planting density had no significant effect on the Cd translocation factor (TF) from various parts to brown rice at the maturity stage, while the N application amount had a certain impact on the TF of the ratoon crop. Among them, the TF in the main crop from the root and stem to brown rice in N1 was significantly higher than those in N2 and N3, while in the ratoon crop, those in N1 and N2 were significantly higher than that in N3. The TF from leaf and panicle to brown rice in the main crop and ratoon crop showed no significant differences under N fertilizer treatments. Among the combined treatments, the TF from root and stem to brown rice in the main crop and ratoon crop was the largest in N1D1, followed by N1D2.

3.3.3. Effects of N Fertilizer and Density on Cd Accumulation of Ratoon Rice

For N fertilizer treatments, the Cd accumulation in various tissues of plants at each stage in the main crop of N1 was significantly higher than that of N2 and N3 (Table 6). For density treatments, the total Cd accumulation of D2 at each growth stage was higher than that of D1; there were significant differences between the two during the transplanting stage to full-heading stage and the milky stage to maturity stage. The Cd accumulation in the stem during the milky stage to maturity stage showed that D2 was significantly higher than D1. During the full-heading to milky stage, Cd in the stem was transferred to other parts. The Cd accumulation in the leaf during the transplanting stage to full-heading stage showed that D2 was significantly higher than D1, and there was no significant difference between treatments at other stages. The Cd accumulation in the panicle of D2 was significantly higher than that of D1 at all stages. Among the combined treatments, in terms of Cd accumulation in the panicle, N1D2 had the highest amount at each stage, followed by N1D1, and N3D1 had the lowest.
For N fertilizer treatments, the Cd accumulation in the panicle and the total Cd accumulation at each stage in the ratoon crop of N1 were significantly higher than those of N2 and N3 (Table 7). Before the full-heading stage, the Cd accumulation in the stem and leaf of N1 was significantly higher than that of N2 and N3. For density treatments, the Cd accumulation in various tissues before the milky stage showed that D2 was significantly higher than D1. However, during the milky stage to maturity stage, the panicle and total Cd accumulation showed that D1 was significantly higher than D2. Among the combined treatments, in terms of the Cd accumulation in the panicle, N1D1 had the highest amount at each stage, followed by N1D2, and N3D2 had the lowest.

4. Discussion

4.1. Effects of Reducing N Fertilizer and Increasing Density on Yield of Ratoon Rice

The nitrogen (N) application amount and planting density are important cultivation factors affecting rice yield, but the interactive effects of N application amount and planting density on rice yield vary. In this study, the rice yield in the main crop and ratoon crop under different N fertilizer treatments showed the order of N1 > N2 > N3, and it was D2 > D1 under different density treatments, which is consistent with previous studies [16,17]. However, conclusions regarding the impact on the yield components of ratoon rice are inconsistent. Yang et al. [18] believe that increasing the effective panicle is an important way to achieve a high yield in the ratoon crop. Liu et al. [19] pointed out that the grains per panicle in the main crop is the decisive factor for yield, while the effective panicle in the ratoon crop determines high-yield rice. In this study, the yield of the ratoon crop was mainly affected by the effective panicle. The effective panicles in both the main crop and ratoon crop were relatively high in N1D2 and N2D2, so the yields were also high in N1D2 and N2D2.

4.2. Effects of Reducing N Fertilizer and Increasing Density on Available Cd of Soil

Whether the absorption and accumulation of Cd in rice grains occur, the source is the Cd absorbed by the rice root from the soil [20]. The pH is the main factor affecting the bioavailability of Cd and directly influences the adsorption of Cd in the soil. Research shows that there is a significant negative correlation between the pH and available Cd [21]. In this experiment, the density had little effect on the soil pH and available Cd, while the N fertilizer application amount had a significant impact. An increase in the N application amount leads to a decrease in the pH and an increase in the available Cd, indicating that reducing N can decrease available Cd by increasing pH. N fertilizer can directly promote the absorption and accumulation of extractable Cd substances by rice plants [22]. The paddy field in this experiment has acidic soil. After urea enters the acidic soil environment, it increases the soil active Cd, significantly increasing the concentrations of extractable Cd and soluble Cd in the soil and promoting the absorption of Cd by rice root. Through nitrification reactions and urease hydrolysis by soil microstructures, N fertilizer generates ammonia and N-containing oxides [23]. After plants absorb ammonium ions to maintain the charge balance in their bodies, the roots secrete H+ into the soil solution, causing the pH value to drop and further increasing the concentration of available Cd [24,25]. In conclusion, the Cd-reducing effect of the measure of reducing N and increasing density is mainly achieved by significantly reducing the concentration of available Cd in the soil due to the decrease in N application amount.

4.3. Effects of Reducing N Fertilizer and Increasing Density on Cd Accumulation Characteristics of Ratoon Rice

There are relatively few studies on the Cd accumulation patterns of ratoon rice. The distribution of Cd is related to nutrient storage and tissue metabolism. Wu et al. [26] found that the absorption and translocation of Cd in ratoon rice are similar to those of N. In this study, the Cd concentration in ratoon rice was mainly affected by the N application amount, while there was no significant difference in the Cd concentration of ratoon rice under planting density treatments. The Cd concentration in ratoon rice decreased with the reduction in the N application amount. In the main crop, the Cd concentration in brown rice of N1 was, significantly, 18% and 31% higher than that of N2 and N3. In the ratoon crop, the Cd concentration in brown rice of N1 was, significantly, 12% and 32% higher than that of N2 and N3. Zhang et al. [27] believed that the Cd concentration in brown rice is related to the coordinated translocation and redistribution of N/Cd from the source to the grains during the grain-formation process after heading. The excessive application of urea can promote plant growth and induce the production of genes encoding Cd absorbing and transporting proteins in rice, thus promoting the absorption and accumulation of Cd [28]. This study found that reducing N decreased the yields of both the main crop and the ratoon crop, as well as the Cd translocation factor from root and stem to brown rice in the main crop and the ratoon crop, and decreased the Cd bioaccumulation factor of various tissues in rice. This indicates that there is indeed a phenomenon of coordinated absorption of N and Cd in rice plants, and there is a positive correlation between N and Cd. Reducing N fertilizer can decrease the absorption and translocation of Cd in ratoon rice.
The Cd concentration in rice grains is derived from the available Cd in the soil, the Cd concentration in above-ground tissues and the translocation of Cd among tissues [29]. Part of the Cd is absorbed from the soil and transported to the stem and leaf of before the full-head stage. Then, some of the Cd2+ stored in the stem and leaf are activated, and the Cd, together with grain proteins (mainly N), is transported in large quantities to the panicle [30,31]. In this study, during the full-heading to milky stage of the main crop and the milky stage to maturity stage of the ratoon crop, the Cd accumulation in the stem and leaf decreased as the N application amount increased, indicating an obvious phenomenon of Cd translocation from the stem and leaf to the panicle. Moreover, the higher the N application amount, the greater the amount of translocation. Another part of the Cd is absorbed by the root and directly transported to the panicle through the xylem. Previous studies have found a positive correlation between N and Cd, and increasing the application amount of urea can promote the absorption and accumulation of Cd in rice [32,33,34]. This study obtained similar results; that is, the Cd concentration in each tissue decreased as the N application amount decreased. Murakami et al. [35] showed that Cd enters the vessels through transport proteins and then accumulates in the above-ground parts of rice and the grains through transpiration and root pressure. Therefore, excessive N application in Cd-contaminated paddy fields must be avoided. In addition, in this study, at the maturity stage of ratoon rice, the Cd concentration in each part showed the order of root > stem > leaf > panicle, and the Cd concentration in the main crop was lower than that in the ratoon crop. The reason may be that the ratoon seedlings germinate from the axillary buds of the stubble in the main crop. The Cd accumulated in the stubble is transferred to the ratoon seedlings along with the transportation of nutrients, which further increases the Cd concentration in the above-ground tissues of the plants in the ratoon crop [36].
The impact of planting density on Cd accumulation in ratoon rice has not been reported. In this study, the planting density had little effect on the Cd concentration, translocation factor and bioaccumulation factor of ratoon rice. This may be related to the fact that the density gradient set in this experiment was not large, and this issue requires further research. However, the Cd accumulation in plants was significantly higher at the high-density treatment (D2) than at the low-density treatment (D1), which should be mainly related to the dry matter weight.

5. Conclusions

Reducing the amount of N fertilizer applied will lead to a decrease in the yield of ratoon rice, but increasing the planting density can increase the yield, mainly by increasing the effective panicle. Among the combined treatments, the yields were relatively high in N1D2 and N2D2. The Cd concentration in the various tissues of ratoon rice decreased with the reduction in N fertilizer application, following the order of N1 > N2 > N3. Reducing N fertilizer application can increase the soil pH and decrease the available Cd concentration, thus reducing the Cd bioaccumulation factor of various tissues and the Cd translocation factor from root and stem to brown rice. The planting density had no significant effect on the Cd concentration, translocation factor and bioaccumulation factor of ratoon rice. Overall, in severely Cd-contaminated paddy fields, the reasonable measure of reducing N and increasing density can significantly reduce the Cd concentration in ratoon rice while maintaining a relatively high yield, with N2D2 showing the best effect.

Author Contributions

Q.T.: Data curation, formal analysis, writing—original draft; D.Z.: Formal analysis, methodology; P.C.: Project administration, resources; S.Y.: Data curation, formal analysis; Z.Y.: Funding acquisition, supervision, project administration, writing—review and editing. All authors have read and agreed to the published version of the manuscript.

Funding

This work was supported by the National Key Research and Development Program of China (2023YFD2301400) and the Hunan Provincial Natural Science Foundation Project (2022JJ30303, 2023JJ60227).

Data Availability Statement

The data that support the findings of this study are available from the corresponding author upon reasonable request.

Acknowledgments

We give special thanks to the anonymous reviewers for their valuable comments. In addition, the authors gratefully acknowledge every teacher, classmate and friend who helped the authors with their experiment and writing.

Conflicts of Interest

Author Dechao Zheng was employed by the Yongzhou Branch of Hunan Provincial Tobacco Company. The remaining authors declare that the research was conducted in the absence of any commercial or financial relationships that could be construed as a potential conflict of interest.

References

  1. Hu, Y.; Cheng, H.; Tao, S. The challenges and solutions for cadmium-contaminated rice in China: A critical review. Environ. Int. 2016, 92, 515–532. [Google Scholar] [CrossRef] [PubMed]
  2. Chaney, R.L. How does contamination of rice soils with Cd and Zn cause high incidence of human Cd disease in subsistence rice farmers. Curr. Pollut. Rep. 2015, 1, 13–22. [Google Scholar] [CrossRef]
  3. Singh, J.; Bhattu, M.; Verma, M.; Bechelany, M.; Brar, S.K.; Jadeja, R. Sustainable Valorization of Rice Straw into Biochar and Carbon Dots Using a Novel One-Pot Approach for Dual Applications in Detection and Removal of Lead Ions. Nanomaterials 2025, 15, 66. [Google Scholar] [CrossRef]
  4. Harrell, D.L.; Bond, J.A.; Blanche, S. Evaluation of main-crop stubble height on ratoon rice growth and development. Field Crops Res. 2009, 114, 396–403. [Google Scholar] [CrossRef]
  5. Yang, D.; Han, D.; Huang, J.; Peng, S. Reducing cadmium accumulation and increasing grain yield with proper timing of flood irrigation in the second season of ratoon rice. Field Crops Res. 2024, 306, 109222. [Google Scholar] [CrossRef]
  6. Yuan, S.; Jiang, Y.; Chen, P.; Tu, N.; Zhou, W.; Yi, Z. Effects of Cultivar Type and Node Position on Cadmium Accumulation Characteristics of Ratoon Rice. Agronomy 2024, 14, 1401. [Google Scholar] [CrossRef]
  7. Yang, Y.; Xiong, J.; Tao, L.; Cao, Z.; Tang, W.; Zhang, J.; Lu, Y. Regulatory mechanisms of nitrogen (N) on cadmium (Cd) uptake and accumulation in plants: A review. Sci. Total Environ. 2020, 708, 135186. [Google Scholar] [CrossRef]
  8. Iqbal, A.; Hussain, Q.; Mo, Z.; Hua, T.; Mustafa, A.E.-Z.M.A.; Tang, X. Vermicompost Supply Enhances Fragrant-Rice Yield by Improving Soil Fertility and Eukaryotic Microbial Community Composition under Environmental Stress Conditions. Microorganisms 2024, 12, 1252. [Google Scholar] [CrossRef]
  9. Huang, W.; Jia, Y.; Niu, C.; Zhang, H.; Wang, Y.; Feng, C. Effects of Carbon-Based Modified Materials on Soil Water and Fertilizer Retention and Pollution Control in Rice Root Zone. Sustainability 2024, 16, 6750. [Google Scholar] [CrossRef]
  10. Asmamaw, B.A. Effect of planting density on growth, yield and yield attributes of rice (Oryza sativa L.). Afr. J. Agric. Res. 2017, 12, 2713–2721. [Google Scholar] [CrossRef]
  11. Xu, F.; Wang, D.; Zhou, X.; Zhang, L.; Guo, X.; Liu, M.; Zhu, Y.; Xiong, H.; Guo, C.; Jiang, P. Integrating Nitrogen, Water, and Other Management Practices to Improve Grain and Ratoon Forage Yields in Perennial Rice. Plants 2024, 13, 3157. [Google Scholar] [CrossRef] [PubMed]
  12. Hu, Q.; Gu, Y.; Lu, X.; Jiang, W.; Zhang, K.; Zhu, H.; Li, G.; Xu, F.; Zhu, Y.; Liu, G.; et al. Effects of One-Time Reduced Basal Application of Controlled-Release Nitrogen Fertilizer with Increased Planting Density on Yield and Nitrogen Utilization of Mechanically Transplanted Japonica Rice. Agronomy 2024, 14, 3072. [Google Scholar] [CrossRef]
  13. Liu, Z.; Li, W.; Geng, S.; Zhang, R.; Dou, M.; Wu, M.; Li, L.; Wang, D.; Wei, X.; Tian, P.; et al. Improvement of Transplanting Rice Yield and Nitrogen Use Efficiency by Increasing Planting Density in Northeast China Under the Optimal Nitrogen Split-Fertilizer Applications. Agriculture 2024, 14, 2015. [Google Scholar] [CrossRef]
  14. Xiang, H.; Ni, L.; Wang, F.; Zhao, B.; Wei, H.; Zhang, J. An effective planting model to decrease cadmium accumulation in rice grains and plants: Intercropping rice with wetland plants. Pedosphere 2023, 33, 355–364. [Google Scholar] [CrossRef]
  15. Li, T.; Liu, Y.; Lin, S.; Xie, Y. Soil pollution management in China: A brief introduction. Sustainability 2019, 11, 556. [Google Scholar] [CrossRef]
  16. Liu, Y.; Li, C.; Fang, B.; Fang, Y.; Chen, K.; Zhang, Y. Potential for high yield with increased seedling density and decreased N fertilizer application under seedling-throwing rice cultivation. Sci. Rep. 2019, 9, 731. [Google Scholar] [CrossRef]
  17. Lin, X.Q.; Zhu, D.F.; Chen, H.Z.; Zhang, Y.P. Effects of plant density and nitrogen application rate on grain yield and nitrogen uptake of super hybrid rice. Rice Sci. 2009, 16, 138–142. [Google Scholar] [CrossRef]
  18. Yang, T.; Zhang, H.; Li, F.; Yang, T.; Shi, Y.; Gu, X.; Chen, M.; Jiang, S. Optimized Tillage Method Increased Rice Yield in Rice Ratooning System. Agriculture 2024, 14, 1768. [Google Scholar] [CrossRef]
  19. Liu, B.; Yuan, S.; Peng, S. A Synthesis Analysis of the Relationship between Main and Ratoon Crop Grain Yields in Ratoon Rice. Agronomy 2024, 14, 2170. [Google Scholar] [CrossRef]
  20. Wang, L.; Wang, Y.; Dai, S.; Wang, B. Surface Display of Multiple Metal-Binding Domains in Deinococcus radiodurans Alleviates Cadmium and Lead Toxicity in Rice. Int. J. Mol. Sci. 2024, 25, 12570. [Google Scholar] [CrossRef]
  21. Cecire, R.; Diana, A.; Giacomino, A.; Abollino, O.; Inaudi, P.; Favilli, L.; Bertinetti, S.; Cavalera, S.; Celi, L.; Malandrino, M. Rice Husk as a Sustainable Amendment for Heavy Metal Immobilization in Contaminated Soils: A Pathway to Environmental Remediation. Toxics 2024, 12, 790. [Google Scholar] [CrossRef] [PubMed]
  22. Alpha, J.M.; Chen, J.; Zhang, G. Effect of nitrogen fertilizer forms on growth, photosynthesis, and yield of rice under cadmium stress. J. Plant Nutr. 2009, 32, 306–317. [Google Scholar] [CrossRef]
  23. Zhang, L.; He, Y.; Lin, D.; Yao, Y.; Song, N.; Wang, F. Co-application of biochar and nitrogen fertilizer promotes rice performance, decreases cadmium availability, and shapes rhizosphere bacterial community in paddy soil. Environ. Pollut. 2022, 308, 119624. [Google Scholar] [CrossRef]
  24. Jalloh, M.A.; Chen, J.; Zhen, F.; Zhang, G. Effect of different N fertilizer forms on antioxidant capacity and grain yield of rice growing under Cd stress. J. Hazard. Mater. 2009, 162, 1081–1085. [Google Scholar] [CrossRef] [PubMed]
  25. Li, L.; Ma, L.; Tang, L.; Huang, F.; Xiao, N.; Zhang, L.; Song, B. Key Factors Controlling Cadmium and Lead Contents in Rice Grains of Plants Grown in Soil with Different Cadmium Levels from an Area with Typical Karst Geology. Agronomy 2024, 14, 2076. [Google Scholar] [CrossRef]
  26. Wu, W.; Ma, Q.; Zhao, Y.; Zhang, Q.; Tang, Y.; Luo, S.; Deng, X. Variation in Cd and As accumulation and health risk in rice-ratoon cropping system: Evidence from two-year field trials involving multiple cultivars in southern China. J. Cereal Sci. 2024, 120, 104046. [Google Scholar] [CrossRef]
  27. Zhang, L.; Jiang, P.; Gou, X.; Zhou, X.; Zhu, Y.; Liu, M.; Xu, F. Integrated water and nitrogen management practices to enhance yield and environmental goals in rice–ratoon rice systems. Agron. J. 2019, 111, 2821–2831. [Google Scholar] [CrossRef]
  28. Xu, C.; Wu, Z.; Zhu, Q.; Zhu, H.; Zhang, Y.; Huang, D. Effect of coated urea on cadmium accumulation in Oryza sativa L. grown in contaminated soil. Environ. Monit. Assess. 2015, 187, 716. [Google Scholar] [CrossRef]
  29. Yu, H.Y.; Liu, C.; Zhu, J.; Li, F.; Deng, D.M.; Wang, Q.; Liu, C. Cadmium availability in rice paddy fields from a mining area: The effects of soil properties highlighting iron fractions and pH value. Environ. Pollut. 2016, 209, 38–45. [Google Scholar] [CrossRef]
  30. Li, A.; Fei, C.; Yang, H.; Zhu, M.; Wang, C.; Hu, H.; Ye, W. Enhanced Adsorption and Biomineralization of Cadmium and Arsenic in Irrigation Water by Biological Soil Crusts: The Key Roles of Iron/Manganese and Urea. Sustainability 2025, 17, 65. [Google Scholar] [CrossRef]
  31. Xu, X.; Mo, Q.; Cai, Z.; Jiang, Q.; Zhou, D.; Yi, J. Promoters, Key Cis-Regulatory Elements, and Their Potential Applications in Regulation of Cadmium (Cd) in Rice. Int. J. Mol. Sci. 2024, 25, 13237. [Google Scholar] [CrossRef]
  32. Liu, J.; Qian, M.; Cai, G.; Yang, J.; Zhu, Q. Uptake and translocation of Cd in different rice cultivars and the relation with Cd accumulation in rice grain. J. Hazard. Mater. 2007, 143, 443–447. [Google Scholar] [CrossRef]
  33. Sebastian, A.; Prasad, M.N.V. Cadmium minimization in rice. A review. Agron. Sustain. Dev. 2014, 34, 155–173. [Google Scholar] [CrossRef]
  34. Li, H.; Luo, N.; Li, Y.W.; Cai, Q.Y.; Li, H.Y.; Mo, C.H.; Wong, M.H. Cadmium in rice: Transport mechanisms, influencing factors, and minimizing measures. Environ. Pollut. 2017, 224, 622–630. [Google Scholar] [CrossRef]
  35. Murakami, M.; Nakagawa, F.; Ae, N.; Ito, M.; Arao, T. Phytoextraction by rice capable of accumulating Cd at high levels: Reduction of Cd content of rice grain. Environ. Sci. Technol. 2009, 43, 5878–5883. [Google Scholar] [CrossRef]
  36. Yang, D.; Peng, S.; Qi, M.; Xiong, Z.; Deng, S.; Wang, F. Comparison of grain cadmium and arsenic concentration between main and ratoon crop in rice ratooning system. Food Chem. 2023, 399, 134017. [Google Scholar] [CrossRef]
Figure 1. Effects of N fertilizer and density on the soil available Cd concentration. N1: N application amount 180 kg hm−2; N2: N application amount 153 kg hm−2; N3: N application amount 126 kg hm−2; D1: planting density 20 cm × 20 cm; D2: planting density 16.7 cm × 16.7 cm. Different lowercase letters above boxes indicate significant differences among the same group under different treatments (n = 3, p < 0.05).
Agronomy 15 00485 g001
Figure 2. Effects of N fertilizer and density on the soil pH. N1: N application amount 180 kg hm−2; N2: N application amount 153 kg hm−2; N3: N application amount 126 kg hm−2; D1: planting density 20 cm × 20 cm; D2: planting density 16.7 cm × 16.7 cm. Different lowercase letters above boxes indicate significant differences among the same group under different treatments (n = 3, p < 0.05).
Agronomy 15 00485 g002
Table 1. Effects of N fertilizer and density on the yield and yield components of ratoon rice.
SeasonTreatmentEffective Panicle
(106 hm−2)
Grains
Per Panicle
Seed Setting
Rate (%)
Thousand-Grain
Weight (g)
Theoretical
Yield (t hm−2)
Actual Yield
(t hm−2)
Main cropN12.80 a169.04 a81.29 a22.42 a8.63 a8.29 a
N22.70 a167.51 a82.57 a22.47 a8.33 a7.99 a
N32.55 b161.36 b82.22 a22.62 a7.62 b7.23 b
D12.56 b165.89 a81.82 a22.54 a7.84 b7.46 b
D22.80 a166.03 a82.22 a22.46 a8.58 a8.21 a
N1D12.68 b167.67 a81.08 b22.53 ab8.21 b7.90 b
N1D22.92 a170.41 a81.50 b22.30 b9.05 a8.68 a
N2D12.59 c166.63 a82.63 a22.63 a8.05 b7.60 b
N2D22.81 a168.39 a82.52 a22.30 b8.70 a8.38 a
N3D12.42 c163.37 ab81.80 b22.45 ab7.25 c6.89 c
N3D22.67 b159.35 b82.64 a22.78 a8.01 b7.57 b
Ratoon cropN13.24 a92.27 b75.44 a21.60 a4.94 a4.49 a
N23.06 a97.34 ab75.88 a20.70 a4.68 a4.29 a
N32.80 b101.01 a75.11 a20.30 a4.29 b4.01 b
D12.92 b95.69 a 75.52 a21.07 a4.50 b4.13 b
D23.13 a98.05 a 75.43 a20.66 a4.72 a4.44 a
N1D13.13 b91.63 c74.89 b21.87 a4.84 a4.33 b
N1D23.34 a92.91 c75.98 a21.33 a5.03 a4.64 a
N2D12.95 b95.82 b76.24 a20.75 b4.50 b4.12 c
N2D23.10 b98.85 ab75.51 ab20.65 b4.69 ab4.45 ab
N3D12.69 c99.62 a75.42 ab20.59 b4.15 b3.85 c
N3D22.94 b102.49 a74.79 b20.01 c4.43 b4.20 b
N1: N application amount 180 kg hm−2; N2: N application amount 153 kg hm−2; N3: N application amount 126 kg hm−2; D1: planting density 20 cm × 20 cm; D2: planting density 16.7 cm × 16.7 cm. For each treatment (N, D, or N × D), different letters in the same column indicate significant differences (p < 0.05).
Table 2. Effects of N fertilizer and density on Cd concentration of ratoon rice at maturity stage (mg kg−1).
TreatmentMain CropRatoon
RootStemLeafPanicleRootStemLeafPanicle
N11.63 a1.52 a0.53 a0.36 a2.00 a1.70 a0.94 a0.54 a
N21.49 b1.43 b0.44 b0.31 b1.83 b1.54 b0.81 b0.41 b
N31.38 c1.35 c0.40 c0.25 c1.73 c1.44 c0.71 c0.35 c
D11.49 a1.44 a0.46 a0.31 a1.86 a1.56 a0.81 a0.44 a
D21.51 a1.42 a0.45 a0.31 a1.85 a1.55 a0.83 a0.43 a
N1D11.57 b1.52 a0.53 a0.36 a2.00 a1.73 a0.92 a0.56 a
N1D21.72 a1.51 a0.53 a0.37 a2.01 a1.67 a0.96 a0.52 a
N2D11.47 c1.43 b0.45 b0.31 b1.82 b1.53 b0.84 b0.41 b
N2D21.51 bc1.43 b0.43 bc0.31 b1.84 b1.55 b0.77 b0.40 b
N3D11.39 d1.36 c0.40 c0.24 c1.75 c1.44 c0.69 c0.35 c
N3D21.36 d1.33 c0.39 c0.26 c1.71 c1.44 c0.73 bc0.35 c
N1: N application amount 180 kg hm−2; N2: N application amount 153 kg hm−2; N3: N application amount 126 kg hm−2; D1: planting density 20 cm × 20 cm; D2: planting density 16.7 cm × 16.7 cm. For each treatment (N, D, or N × D), different letters in the same column indicate significant differences (p < 0.05).
Table 3. Effects of N fertilizer and density on Cd concentration in the panicle of ratoon rice at maturity stage (mg kg−1).
TreatmentMain CropRatoon Crop
BranchGrain HuskEmpty GrainBrown RiceBranchGrain HuskEmpty GrainBrown Rice
N10.33 a0.25 a0.15 a0.22 a1.09 a0.38 a0.29 a0.29 a
N20.30 b0.23 b0.12 b0.19 b1.02 b0.33 b0.27 b0.25 b
N30.24 c0.21 c0.11 c0.17 c0.95 c0.28 c0.21 c0.21 c
D10.29 a0.23 a0.13 a0.19 a1.03 a0.33 a0.26 a0.25 a
D20.29 a0.23 a0.12 a0.19 a1.01 a0.33 a0.25 a0.25 a
N1D10.33 a0.25 a0.15 a0.23 a1.11 a0.38 a0.29 a0.28 a
N1D20.33 a0.25 b0.15 ab0.21 a1.07 a0.37 a0.29 ab0.28 a
N2D10.31 b0.23 c0.13 b0.19 b1.03 a0.33 b0.27 b0.25 b
N2D20.30 c0.23 c0.11 c0.18 b1.02 a0.33 b0.27 b0.25 b
N3D10.24 d0.21 d0.11 c0.17 c0.95 b0.28 c0.22 c0.21 c
N3D20.24 d0.21 e0.10 d0.17 c0.95 b0.29 c0.21 c0.21 c
N1: N application amount 180 kg hm−2; N2: N application amount 153 kg hm−2; N3: N application amount 126 kg hm−2; D1: planting density 20 cm × 20 cm; D2: planting density 16.7 cm × 16.7 cm. For each treatment (N, D, or N × D), different letters in the same column indicate significant differences (p < 0.05).
Table 4. Effects of N fertilizer and density on Cd bioaccumulation factor of ratoon rice.
TreatmentMain CropRatoon Crop
RootStemLeafPanicleBrown RiceRootStemLeafPanicleBrown Rice
N11.20 a1.12 a0.39 a0.27 a0.16 a1.47 a1.25 a0.69 a0.40 a0.20 a
N21.10 b1.05 b0.33 b0.23 b0.14 b1.35 b1.13 b0.59 b0.30 b0.18 b
N31.01 c0.99 c0.29 c0.19 c0.12 c1.27 c1.06 c0.52 c0.26 c0.16 c
D11.09 a1.06 a0.34 a0.22 a0.14 a1.36 a1.15 a0.60 a0.33 a0.19 a
D21.11 a1.05 a0.33 a0.23 a0.14 a1.36 a1.14 a0.61 a0.33 a0.19 a
N1D11.17 b1.12 a0.39 a0.26 a0.17 a1.47 a1.27 a0.67 a0.41 a0.21 a
N1D21.23 a1.11 a0.39 a0.27 a0.16 a1.48 a1.23 a0.72 a0.39 a0.20 a
N2D11.08 c1.05 b0.33 b0.23 b0.14 b1.34 b1.12 b0.62 b0.30 b0.18 b
N2D21.11 bc1.05 b0.32 bc0.22 b0.14 b1.35 b1.14 b0.57 b0.30 b0.18 b
N3D11.02 d1.00 c0.30 c0.18 c0.12 c1.28 c1.06 c0.50 c0.25 c0.15 c
N3D21.00 d0.98 c0.29 c0.19 c0.12 c1.26 c1.06 c0.54 bc0.26 c0.16 c
N1: N application amount 180 kg hm−2; N2: N application amount 153 kg hm−2; N3: N application amount 126 kg hm−2; D1: planting density 20 cm × 20 cm; D2: planting density 16.7 cm × 16.7 cm. For each treatment (N, D, or N × D), different letters in the same column indicate significant differences (p < 0.05).
Table 5. Effects of N fertilizer and density on Cd translocation factor of ratoon rice.
TreatmentMain CropRatoon Crop
Root-
Brown Rice
Stem-
Brown Rice
Leaf-
Brown Rice
Panicle-
Brown Rice
Root-
Brown Rice
Stem-
Brown Rice
Leaf-
Brown Rice
Panicle-
Brown Rice
N10.14 a0.15 a0.42 a0.61 a0.14 a0.16 a0.30 a0.52 a
N20.13 b0.13 b0.42 a0.60 a0.14 a0.16 a0.31 a0.61 a
N30.12 b0.13 b0.42 a0.66 a0.12 b0.15 b0.30 a0.61 a
D10.13 a0.14 a0.42 a0.64 a0.14 a0.16 a0.31 a0.57 a
D20.13 a0.13 a0.42 a0.61 a0.14 a0.16 a0.30 a0.59 a
N1D10.14 a0.15 a0.42 a0.63 ab0.14 a0.16 a0.31 a0.51 b
N1D20.13 b0.14 a0.40 a0.58 b0.14 a0.16 a0.28 a0.54 ab
N2D10.13 b0.13 b0.41 a0.60 ab0.14 a0.16 a0.30 a0.60 a
N2D20.12 b0.13 b0.42 a0.60 ab0.14 a0.16 a0.32 a0.62 a
N3D10.12 b0.13 b0.42 a0.70 a0.12 b0.15 b0.31 a0.60 a
N3D20.12 b0.12 b0.42 a0.64 ab0.12 b0.15 b0.29 a0.61 a
N1: N application amount 180 kg hm−2; N2: N application amount 153 kg hm−2; N3: N application amount 126 kg hm−2; D1: planting density 20 cm × 20 cm; D2: planting density 16.7 cm × 16.7 cm. For each treatment (N, D, or N × D), different letters in the same column indicate significant differences (p < 0.05).
Table 6. Effects of N fertilizer and density on Cd accumulation in the main crop (mg·hm−2).
TissuesTreatmentTransplanting Stage to Full-Heading StageFull-Heading Stage to Milky StageMilky Stage to Maturity StageTissuesTreatment Transplanting Stage to Full-Heading StageFull-Heading Stage to Milky StageMilky Stage to Maturity Stage
Total
accumulation
N12811.09 a1395.86 a6977.46 aStemN11384.33 a−149.97 a5283.43 a
N22259.05 b1008.09 b6369.55 bN21046.93 b−249.24 c4831.97 b
N31714.29 c1020.15 b5789.36 cN3698.41 c−171.98 b4693.49 b
D12148.92 b1086.24 b6038.60 bD11001.18 a−179.13 a4714.56 b
D22374.04 a1196.50 a6718.97 aD21085.26 a−201.66 a5158.03 a
N1D12806.60 a1304.16 a6702.93 bN1D11462.14 a−217.50 bc5143.92 b
N1D22815.58 a1487.57 a7251.99 aN1D21306.52 b−82.45 a5422.94 a
N2D12103.81 c1003.26 b5988.31 cN2D11018.76 c−220.82 bc4612.98 c
N2D22414.30 b1012.93 b6750.79 abN2D21075.10 c−277.67 c5050.95 b
N3D11536.34 e951.28 b5424.58 dN3D1522.64 e−99.09 ab4386.78 c
N3D21892.23 d1089.02 b6154.13 cN3D2874.17 d−244.87 c5000.20 b
LeafN1880.58 a303.68 a74.00 aPanicleN1546.19 a1242.16 a1620.02 a
N2743.55 b257.75 b0.03 bN2468.58 b999.59 b1537.55 b
N3600.42 c229.11 b−33.30 bN3328.64 c963.02 b1129.17 c
D1685.35 b248.22 a24.51 aD1404.51 b1017.15 b1299.53 b
D2797.68 a278.81 a2.64 aD2491.09 a1119.36 a1558.30 a
N1D1845.26 ab273.35 ab80.49 aN1D1499.20 b1248.31 a1478.51 abc
N1D2915.89 a334.01 a67.52 aN1D2593.17 a1236.00 a1761.53 a
N2D1673.18 c252.84 ab3.51 bN2D1411.87 c971.24 b1371.81 bc
N2D2813.92 b262.67 ab−3.45 bN2D2525.28 b1027.93 b1703.29 ab
N3D1537.60 d218.48 b−10.46 bN3D1302.46 d831.89 c1048.26 d
N3D2663.24 c239.74 b−56.15 cN3D2354.81 d1094.15 b1210.08 cd
N1: N application amount 180 kg hm−2; N2: N application amount 153 kg hm−2; N3: N application amount 126 kg hm−2; D1: planting density 20 cm × 20 cm; D2: planting density 16.7 cm × 16.7 cm. For each treatment (N, D, or N × D), different letters in the same column indicate significant differences (p < 0.05).
Table 7. Effects of N fertilizer and density on Cd accumulation in the ratoon crop (mg·hm−2).
TissuesTreatmentTransplanting Stage to Full-Heading StageFull-Heading Stage to Milky StageMilky Stage to Maturity StageTissuesTreatmentTransplanting Stage to Full-Heading StageFull-Heading Stage to Milky StageMilky Stage to Maturity Stage
Total
accumulation
N13074.57 a6777.85 a599.50 aStemN12243.58 a3837.76 a−1051.56 b
N22634.92 b5768.32 b286.93 cN21916.22 b3356.68 b−1023.17 b
N32270.63 c4995.05 c507.07 bN31681.92 c2836.31 c−811.98 a
D12519.63 b5596.33 b538.85 aD11849.77 b3263.07 b−983.42 a
D22800.44 a6097.81 a390.15 bD22044.71 a3424.09 a−941.05 a
N1D12965.44 ab6485.85 b751.36 aN1D12158.40 b3742.96 a−1031.22 ab
N1D23183.69 a7069.85 a447.64 abN1D22328.75 a3932.55 a−1071.9 ab
N2D12485.14 c5609.59 cd255.29 bN2D11834.80 d3305.6 b−1111.76 b
N2D22784.70 b5927.04 c318.56 bN2D21997.64 c3407.76 b−934.57 ab
N3D12108.32 d4693.54 e609.90 abN3D11556.10 e2740.65 c−807.27 a
N3D22432.94 c5296.55 de404.24 abN3D21807.74 d2931.96 c−816.69 a
LeafN1459.26 a928.05 a−228.47 aPanicleN1371.73 a2012.05 a1879.53 a
N2418.45 b788.02 b−251.09 aN2300.26 b1623.62 b1561.18 b
N3338.50 c680.59 c−117.74 aN3250.21 c1478.15 c1436.79 c
D1389.13 b752.51 b−189.48 aD1280.73 b1580.75 b1711.75 a
D2421.67 a845.26 a−208.72 aD2334.06 a1828.46 a1539.92 b
N1D1450.36 a815.22 b−191.35 aN1D1356.68 b1927.67 a1973.93 a
N1D2468.16 a1040.88 a−265.58 aN1D2386.78 a2096.42 a1785.12 b
N2D1389.22 bc747.87 c−228.63 aN2D1261.12 c1556.12 c1595.68 c
N2D2447.67 ab828.17 bc−273.55 aN2D2339.39 b1691.11 b1526.68 c
N3D1327.82 c694.44 c−148.46 aN3D1224.40 c1258.45 d1565.63 c
N3D2349.18 c666.74 c−87.02 aN3D2276.02 c1697.85 b1307.95 d
N1: N application amount 180 kg hm−2; N2: N application amount 153 kg hm−2; N3: N application amount 126 kg hm−2; D1: planting density 20 cm × 20 cm; D2: planting density 16.7 cm × 16.7 cm. For each treatment (N, D, or N × D), different letters in the same column indicate significant differences (p < 0.05).
Disclaimer/Publisher’s Note: The statements, opinions and data contained in all publications are solely those of the individual author(s) and contributor(s) and not of MDPI and/or the editor(s). MDPI and/or the editor(s) disclaim responsibility for any injury to people or property resulting from any ideas, methods, instructions or products referred to in the content.

