Article

Evaluating the Level of Total Mercury Present in the Soils of a Renowned Tea Production Region

1
School of Geographical Sciences, Fujian Normal University, Fuzhou 350117, China
2
College of Resources and Environmental Science, Quanzhou Normal University, Quanzhou 362000, China
3
Key Laboratory for Humid Subtropical Eco-Geographical Processes of Education, Fujian Normal University, Fuzhou 350117, China
4
Environmental Monitoring Center Station of Quanzhou in Fujian Province, Quanzhou 362000, China
*
Author to whom correspondence should be addressed.
Agronomy 2025, 15(2), 435; https://doi.org/10.3390/agronomy15020435
Submission received: 5 January 2025 / Revised: 3 February 2025 / Accepted: 8 February 2025 / Published: 10 February 2025
(This article belongs to the Special Issue Heavy Metal Pollution and Prevention in Agricultural Soils)

Abstract

:
Total mercury pollution in oolong tea garden soils was comprehensively investigated in this study. Soil samples were collected from 146 villages in a famous oolong tea production area. The total mercury content in the soils ranged from 0.025 to 0.296 mg/kg, with a median of 0.105 mg/kg. According to the Soil Accumulation Index Method, 67.81% of samples were pollution-free, 31.51% had pollution levels from none to moderate, and 0.68% were moderately polluted. The PMF model revealed that natural geochemical processes were the main mercury source, contributing 72.4%, with some from transportation, coal combustion, and industrial activities. Most values were below the HQ threshold, suggesting low non-carcinogenic risk from mercury in most soils. Further research is needed to understand mercury’s bioaccumulation in tea leaves and assess short- and long-term exposure risks for a better understanding of its long-term impacts on the tea industry and human health.

1. Introduction

Mercury is widely known as a highly toxic heavy metal pollutant, famous for its strong neurotoxic effects and its ability to accumulate in organisms even at low levels [1,2,3]. The burning of fossil fuels has caused a 3–10 times increase in mercury levels in soil and sediment [4], leading to a serious problem of soil mercury pollution and posing a risk to human food chains [5]. While it was previously believed that tea trees did not accumulate mercury significantly [6], it has been observed that consuming tea can lead to higher levels of mercury in the bloodstream, with tea drinkers showing significantly elevated blood mercury levels compared to non-tea drinkers [7]. Furthermore, tea trees have the ability to absorb mercury from the soil and transport it from the roots to the upper parts through the xylem [8]. It is crucial to thoroughly investigate the characteristics and potential risks of soil mercury pollution in the main tea cultivation regions.
Tea trees are commonly thought to have their roots in the soil, with mercury in the soil likely being the primary source of mercury found in tea leaves. Mercury concentrations in global soil typically range from 0.58 to 1.18 mg/kg, with an average value of 1.1 mg/kg [9]. In Chinese agricultural soils, mean mercury concentrations have varied over four decades, with levels of 0.25 mg/kg during 1976–2000, 0.39 mg/kg during 2001–2005, 0.47 mg/kg during 2006–2010, and 0.34 mg/kg during 2011–2016 [10]. However, soil around mercury mines can have much higher mercury content, such as 7315 mg/kg in the Almaden mine in Spain, 5526 mg/kg in mines in Alaska, and 1500 mg/kg in mines in Italy [11,12]. Industrial activities also contribute to soil mercury pollution, with non-ferrous metal smelters leading to levels up to 355 mg/kg, while other industrial areas generally have lower levels, typically not exceeding 20 mg/kg [3]. Thus, the distribution of mercury content in tea garden soils can directly influence the distribution of mercury content in tea leaves.
Mercury in the environment originates from both natural sources, including the decomposition of mercury-containing rocks, geothermal activity, and volcanic eruptions, as well as human activities such as industrial operations, agriculture, and transportation [13]. For instance, human activities like fertilization and irrigation in tea gardens can result in soil mercury accumulation [14,15]. Furthermore, the transfer of mercury (Hg) contaminations to predominantly soil reservoirs takes place over centuries through the exchange of wet and dry deposition in the atmosphere, leading to an increase in soil Hg reservoirs and subsequent secondary Hg contaminations that contribute to its global distribution [14]. In order to prevent long-term soil contamination with mercury (Hg) and the resulting human exposure to methylmercury (MeHg), it is important to first identify the sources of soil Hg and then control Hg contaminations from these sources by optimizing the main contamination processes [13]. Common sources of Hg in soil include atmospheric deposition, human activities, and natural geological processes. The sources of mercury can be analyzed by examining the variations in the content of other heavy metals like Cu, As, Cd, Ni, Zn, and Pb using a source-tracing model. The relative contributions of these sources to soil Hg levels have been quantitatively assessed in areas such as Hg mining and industrial areas where human activities are the main source of Hg [16,17,18]. However, this assessment has not been conducted in intensive agricultural areas, such as tea production. It is important to consider agricultural planning as an effective strategy for reducing MeHg exposure risks in Hg-contaminated areas. [19,20].
Tea is one of the most popular beverages worldwide, with a global tea planting area of 4.89 million hectares in 2017 and a total tea production of 5.812 million tons, according to The International Tea Commission. However, there is a need for more research on the environmental sustainability of tea production. It is important to conduct quantitative assessments of pollution input and environmental impact throughout the tea production process to improve the sustainability of tea products. In 2018, China was the largest tea producer in the world, accounting for around 45% of global output [21]. Research has shown that the average mercury content in green tea from 43 tea-producing regions in China is 6.3 ± 6.4 μg/kg (dry weight). While the overall mercury content in tea is relatively low, it can be released into the tea infusion during the brewing process, potentially posing a health risk to consumers [22]. This study aimed to investigate the mercury content in tea garden soils and tea leaves in major tea-producing areas, assess its sources, and determine potential health hazards. Large-scale spatial sampling will be conducted at multiple locations to explore the spatial distribution patterns of mercury pollution in tea garden soils. The research will help understand the migration of mercury in tea garden soils and tea leaves, as well as the associated health risks to humans. The findings will provide valuable information for preventing and controlling mercury pollution in tea garden soils, contributing to the sustainable development of the tea industry, environmental protection, and public health.

2. Materials and Methods

2.1. Overview of the Study Area

Quanzhou is situated on the southeastern coast of Fujian Province, south of the Taiwan Strait. It is located between 24°22′ and 25°56′ north latitude and 117°34′ and 119°05′ east longitude. The city is positioned between the mountainous regions in eastern Fujian and the hilly coastal plain in southeastern Fujian, with a subtropical marine monsoon climate. The average annual temperature in Quanzhou ranges from 19.5 °C to 22 °C, and there is plentiful rainfall throughout the year. Known as one of the major oolong tea production areas in China, Quanzhou contributes to nearly one-third of the national tea production. Additionally, Quanzhou is a coastal city with a well-developed industry, boasting a high proportion of industrial output value. This area is also noted for having significant potential sources of mercury pollution.

2.2. Sample Collection and Analysis

Sampling areas were selected from 146 natural villages in four counties within Quanzhou (Anxi, Yongchun, Dehua, Nan’an) in July 2021. In each village, a tea garden with a fertilization period of over 3 years was randomly chosen as the sampling point, and five soil samples were then randomly collected in an S-shape pattern across the tea garden’s planting terrain. Gather soil samples from the 0–20 cm depth of the soil layer, each sample weighing 500 g. Start by mixing each sample individually, then combine them one by one in a larger container for complete blending. Soil pH was measured using a glass electrode pH meter (STARTER 300, OHAUS, Parsippany, NJ, USA) with a soil-to-water ratio of 1:2.5. Total carbon (TC) and total nitrogen (TN) were analyzed using an element analyzer (Elementar Vario EL III, Elementar, Langenselbold, Germany). To analyze heavy metals and other metal elements (such as Cu, As, Cd, Ni, Zn, and Pb) in the soil, 0.2 g of 100 mesh soil samples were weighed into a digestion tube. Then, 8 mL of concentrated nitric acid and 2 mL of perchloric acid were added to the samples. The samples were shaken and heated for digestion on a digestion apparatus for specific time intervals and temperatures. After cooling, 10 mL of 5% nitric acid was added to the soil residue and heated at 70 °C for 1 h. The solution was then transferred to a 50 mL centrifuge tube, shaken, and filtered for ICP-OES analysis. The recovery rate of Changjiang River sediment standard substance (GSD-13) and mixed acid solution were used as blank tests for each batch. Total mercury was measured using catalytic pyrolysis-cold atomic absorption spectrophotometry (MA-3000, Nippon Instruments Corporation, Takatsuki, Japan) following the standard HJ 923-2017 issued by the Ministry of Ecology and Environment of China.

2.3. Evaluation Method

2.3.1. Soil Accumulation Index Method

The soil enrichment index method, proposed by German scientist Müller in 1969, integrates the geochemical background value to accurately assess the influence of both natural sources and human activities on heavy metal elements in the soil. This method serves as a quantitative indicator for evaluating the potential impacts of heavy metal elements in the soil. The calculation formula for this method is as follows:
I geo = log 2 C n k × B n
where Igeo is the ground accumulation index, and Cn is the measured content of element n in the sample. Bn is the geochemical background value of element n in sediments. k is the empirical coefficient, usually 1.5. The ground accumulation index is divided into seven levels: Igeo ≤ 0, level 1, pollution-free; 0 < Igeo ≤ 1, level 2, no pollution to medium pollution; 1 < Igeo ≤ 2, level 3, medium pollution; 2 < Igeo ≤ 3, level 4, medium to strong pollution; 3 < Igeo ≤ 4, level 5, strong pollution; 4 < Igeo ≤ 5, level 6, strong pollution extremely strong pollution; Igeo > 5, level 7, extremely polluted.

2.3.2. Positive Matrix Factorization (PMF) Model

PMF is a receptor model that has been extensively applied to identify the origin of human-made pollutants in air, water, and soil [23,24]. This model works by imposing non-negative constraints on the concentration matrix of chemical species detected at the receptor sites, which is the result of the product of source composition and contribution factor matrices plus a residue matrix. In brief, the model principle can be summarized as follows:
X ij = k = 1 p G ik   F kj + E ij
where p is the number of factors; i is the i-th sample; j is the j-th element; Xij is the matrix that shows the number of j elements present in i samples; Gik is the contribution of factor k to each sample i; Fkj is the distribution of species for each source; Eij is the residual matrix. Moreover, the values of Gik and Fkj must be positive.
Q = i = 1 m j = 1 n ( X ij k = 1 p G ik F kj U ij )
where the robust Q value reduces the impact of outliers in the fitting of the model, and the uncertainties for each sample (Uij) are calculated according to the EPA PMF 5.0 User Guide [25].
U ij = 5 6 × MDL   ( c MDL )
U ij = ( ef × X ij ) 2 + ( 0.5 × MDL ) 2               ( c > MDL )
where the MDL is the detection limit of the element measurement instrument method, and ef is the percentage of uncertainty in the measurement results, with 10% being the usual value as mentioned [26].

2.3.3. Health Risk Assessment Methods

The probable daily intake (PDI) for the general adult population was calculated using the following formula:
PDI = C Hg × IR × γ / bw
In the given context, PDI represents the daily intake of mercury in micrograms per kilogram of body weight (μg/kg bw/day), with the average body weight (bw) considered to be 60 kg [27]. CHg represents the concentration of mercury in tea in micrograms per kilogram (μg/kg), which is determined by multiplying the mercury concentration in the soil of the tea garden by the enrichment factor of mercury in tea [28]. The enrichment factor of mercury in tea was calculated based on the measured data of new tea leaves (since new leaves are mainly used for tea production) and the soil in the tea garden. IR represents the intake rate in grams per day (g/d), with the average tea consumption amount in China estimated to be around 0.3 kg per year [29]. γ represents the leaching rate of mercury in tea, and the leaching rate of multiple brewing is reported to be 32.83% [22].
The hazard quotient (HQ) [27] was used to estimate the total Hg exposure from tea consumption. The HQ value was determined by comparing the PDI with the recommended probable tolerable weekly intake (PTWI) through the following equation:
HQ Hg = 7 × PDI / PTWI
The maximum value of HQHg in this formula is 1, with PTWI set at 4 micrograms per kilogram of body weight per week, as recommended by the Joint FAO/WHO Expert Committee on Food Additives [30].

2.4. Statistical Analysis Methods

SPSS 19.0 and Microsoft Excel 2016 were utilized for organizing and analyzing the experimental data, with Origin 2018 being used to draw the distribution map of mercury concentration and emitted mercury concentration in the sample site. Additionally, RStudio was used to analyze the influencing factors of mercury pollution, and PMF5.0 software was used to analyze the mercury pollution source.

3. Results and Discussion

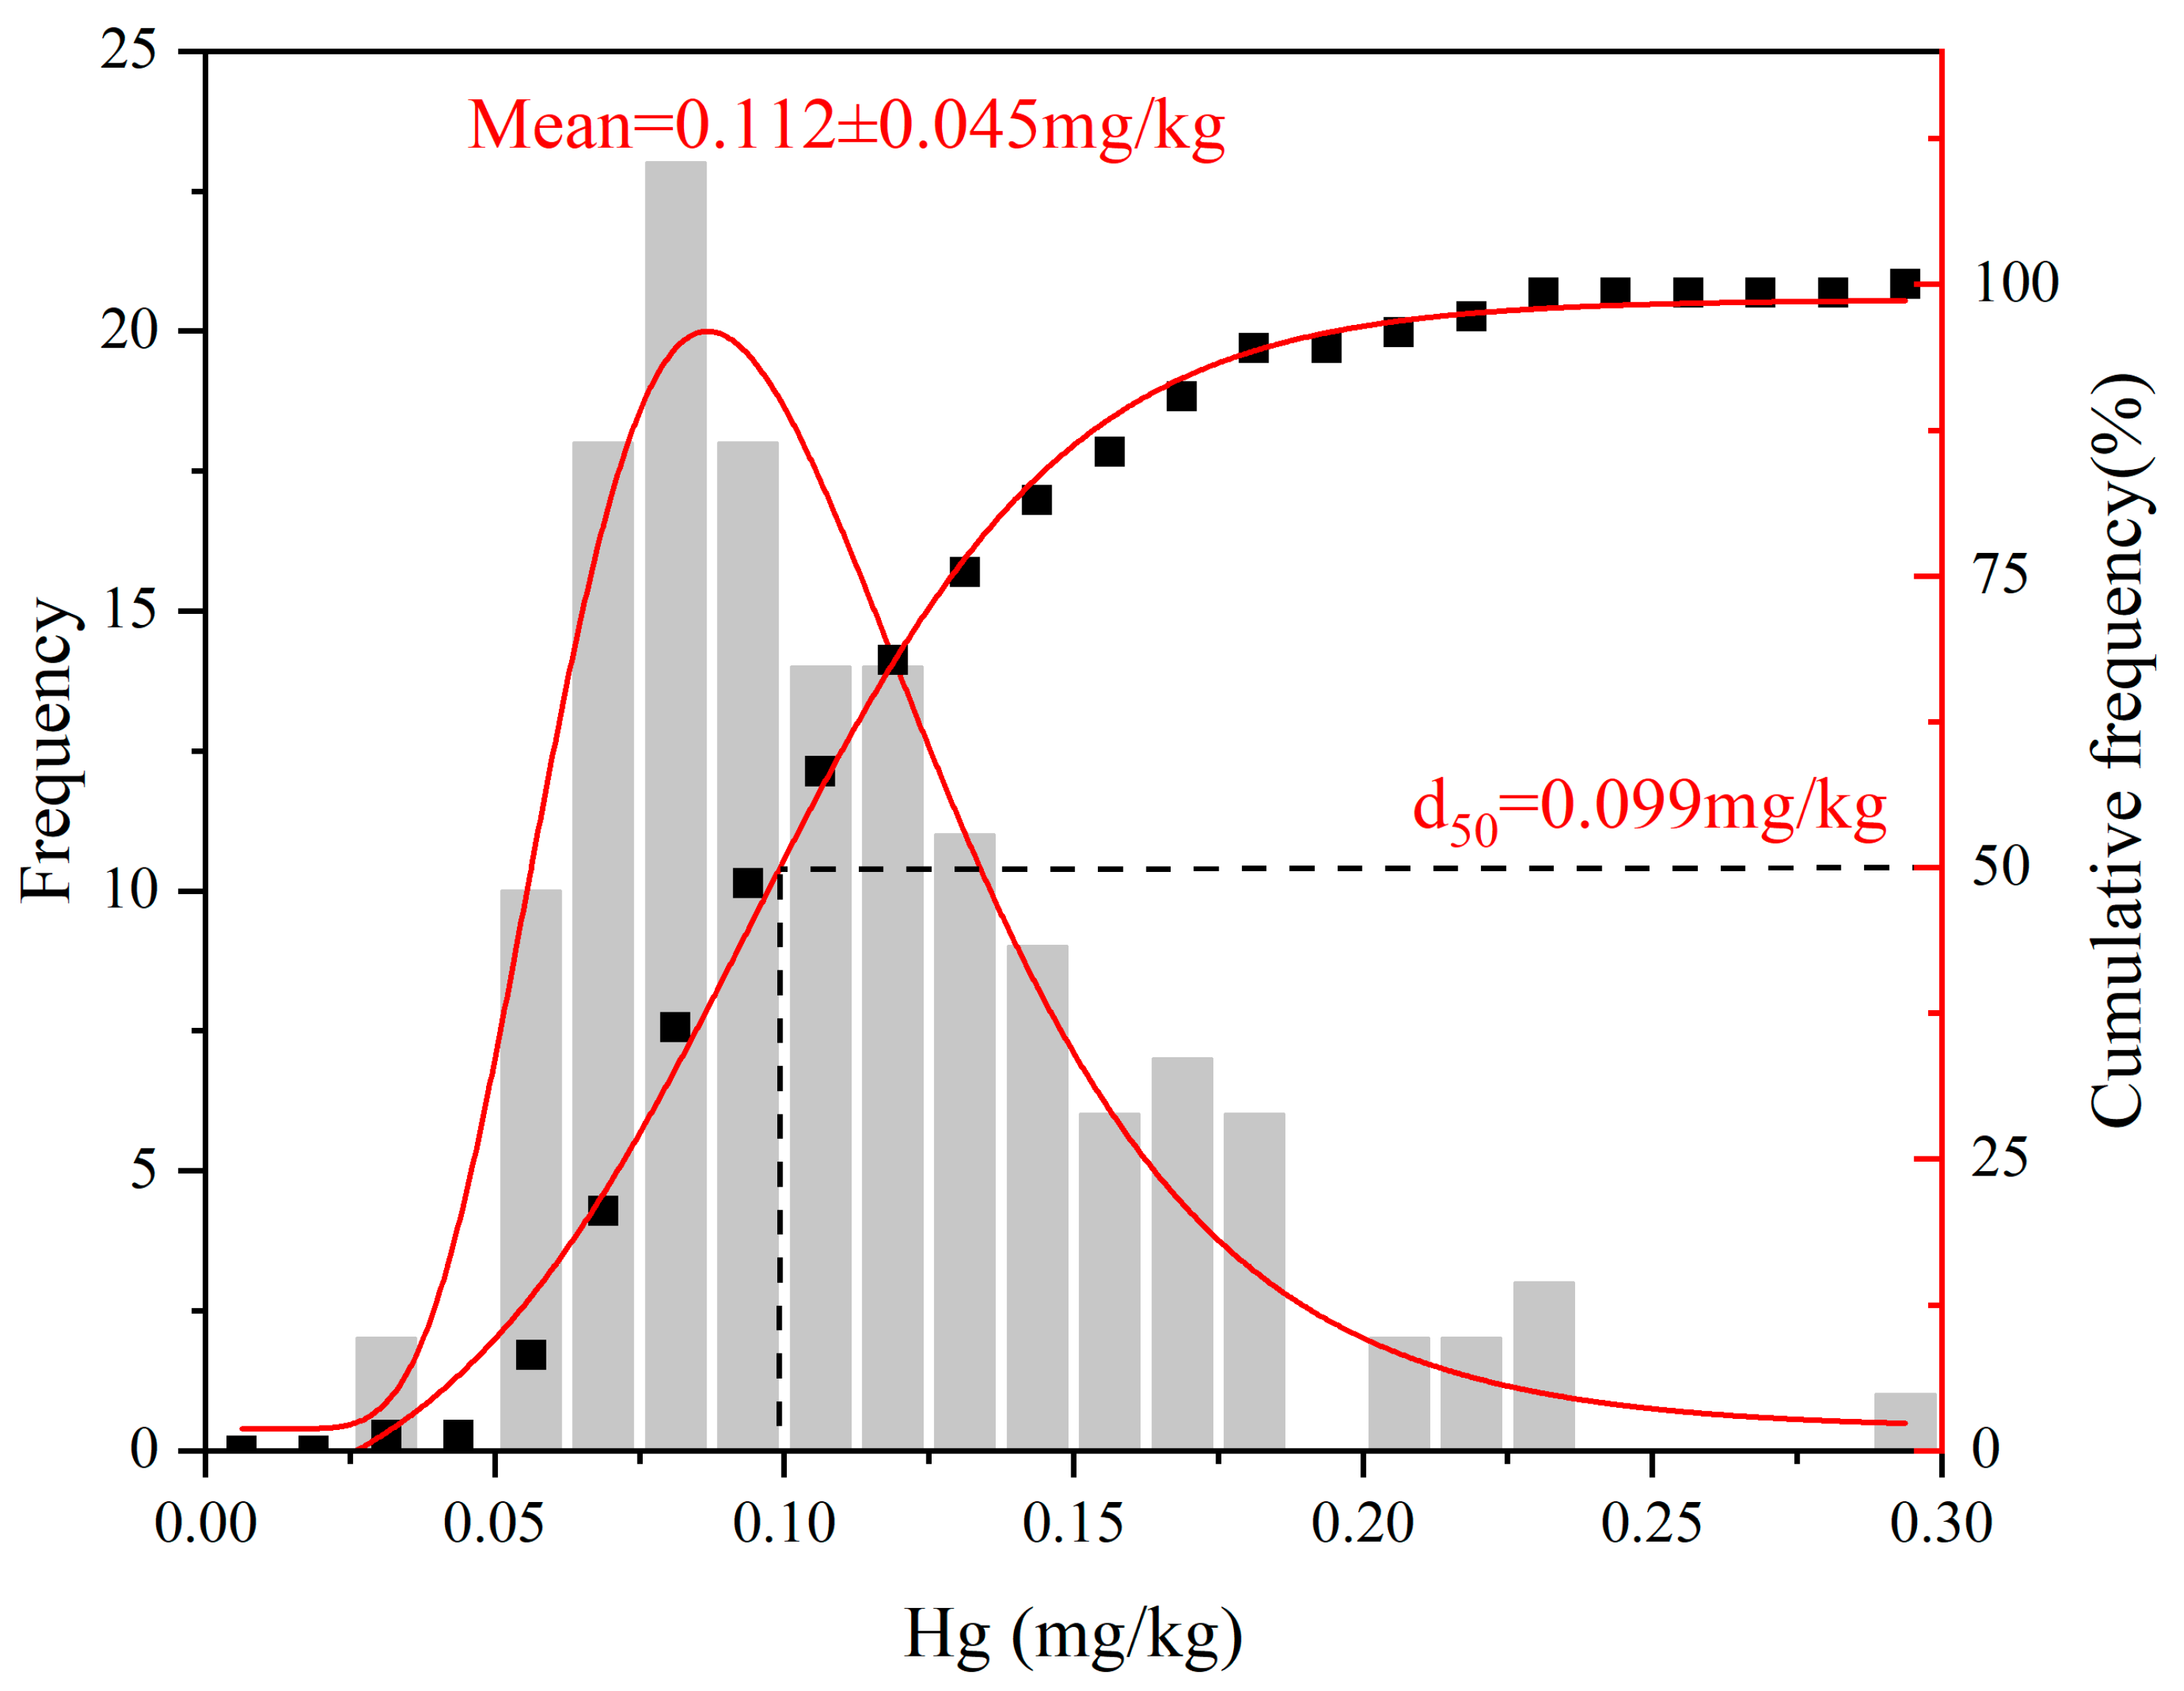
3.1. The Distribution Characteristics and Pollution Evaluation of Total Mercury in Soil of Tea Garden

In the well-known tea production region, the total mercury content in the soil ranged from 0.025 to 0.296 mg/kg, with a median of 0.105 mg/kg (Figure 1). The mercury concentrations in soils near the Jinsha TPP in China were 0.70 mg/kg in cropland and 0.30 mg/kg in forest areas, which were higher than the levels found in the industrial area [31]. These concentrations also exceeded the risk screening value of mercury content in agricultural land soil specified in Chinese national standards (1.3 mg/kg) [32]. Nearly half (48.3%) of the soil samples had mercury concentrations below 0.10 mg/kg, while the majority (90.5%) exceeded the average mercury concentration of 0.0672 mg/kg reported for Spanish soil. The results, shown in Figure 2 through Kriging interpolation, were based on the average mercury content of various township samples. Upon further assessment of the geoaccumulation index (Table 1), it was observed that the mean geoaccumulation index values for Yongchun County, Anxi County, Dehua County, and Nanan City were all negative, indicating that the tea garden soil in these areas was uncontaminated, with low overall total mercury concentration. Despite a moderate pollution level of 1.29 in one sample from Yongchun County, the concentration of this sample was 0.296 mg/kg, well below the level indicating pollution. The detailed pollution level statistics in Table 2 indicated that the majority of samples (67.81%) were free from pollution, while a smaller percentage (31.51%) showed no moderate pollution, and only 0.68% were at a moderate pollution level. Overall, the mercury pollution in tea garden soil was relatively satisfactory, with some samples showing moderate pollution levels that require attention. It is important to consider the cumulative effect of mercury pollution to prevent its larger impact on the environment.
Understanding the distribution patterns of soil mercury and the factors that influence it is essential for preventing and managing mercury pollution. Research conducted in karst catchments in the southwestern region revealed significant variations in soil mercury content among different land use types [33]. Agricultural areas exhibited higher mercury levels compared with forest and grassland areas. In mountainous regions of southwestern China, a study found that soil mercury content decreased with increasing altitude [34]. This decline may be attributed to colder climate conditions and limited vegetation at higher altitudes. A recent investigation in the Qinghai-Tibet Plateau identified distinct distribution patterns of soil mercury in the permafrost region [35]. The presence of soil mercury could be linked to pollution sources such as industrial contaminations and the use of mercury-containing pesticides in urban areas. The distribution of soil mercury content is influenced by various factors, including land use type, climate conditions, terrain, vegetation coverage, and human activities. Frequent human tillage activities in tea gardens can lead to mercury accumulation in tea leaves. Irrigation with mercury-contaminated water sources can introduce mercury into the soil, increasing its absorption by tea trees. Excessive irrigation or poor drainage can change the soil’s redox conditions, affecting mercury bioavailability. Contaminated organic and chemical fertilizers can also increase mercury content in the soil and tea leaves. However, high-quality organic fertilizers can fix mercury and reduce its bioavailability. To mitigate mercury accumulation, use pollution-free irrigation water, control irrigation volume, ensure good soil drainage, use uncontaminated organic fertilizers, apply chemical fertilizers rationally, and avoid long-term use of mercury-containing fertilizers. Further research is required to explore the mechanisms and interactions of these influencing factors to effectively address soil mercury pollution.

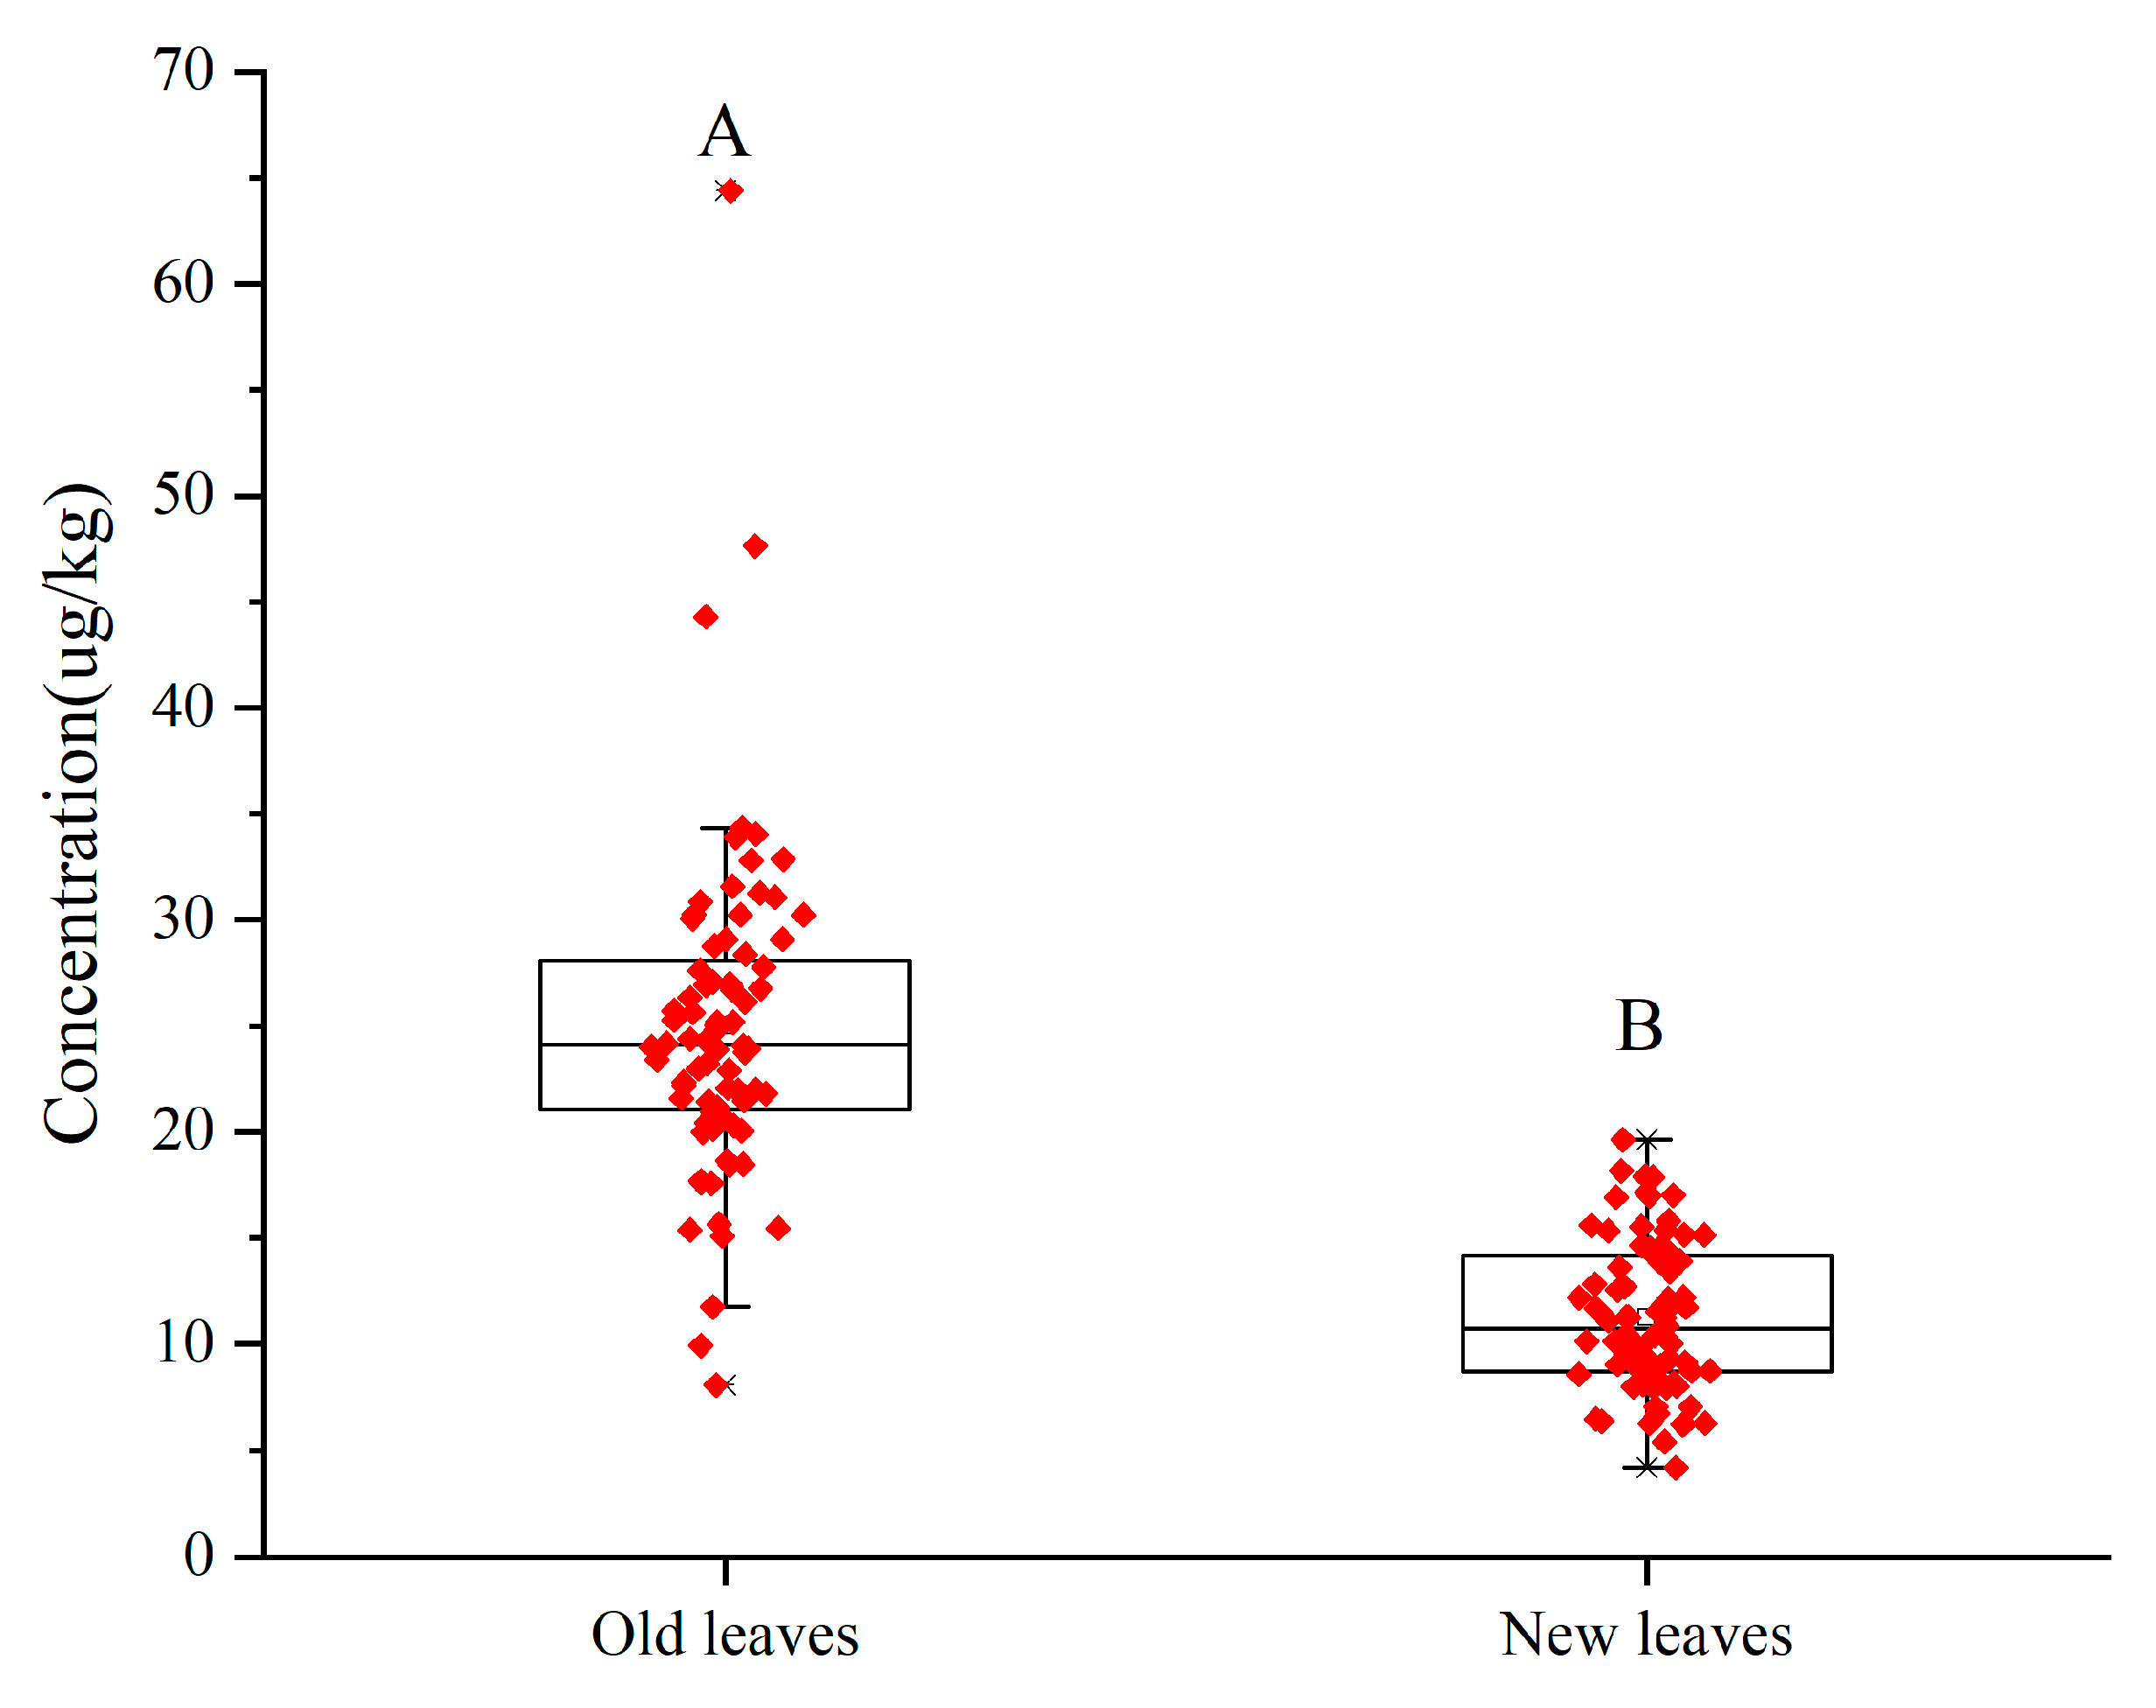
3.2. Distribution of Total Mercury Content in Tea

Mercury content in tea varies depending on the age of the leaves and the region where the tea is produced. A study comparing new leaves (current-year-old) and old leaves (previous-year-old) found a significant difference in mercury levels. New leaves had a mercury content ranging from 4.17 to 19.64 μg/kg, with an average of 11.23 μg/kg, while old leaves had a range of 8.05–64.40 μg/kg, with an average of 24.97 μg/kg (Figure 3). Mercury levels in green tea from 43 tea production areas in China were examined, revealing a range of 1.8–102.9 µg/kg, with an average of 6.3 ± 6.4 µg/kg dry weight [22]. The Wanshan area in Guizhou province, known for its mercury mine, showed higher mercury levels in green tea, which could be controlled by picking the tea at the right time. A total of 86 tea samples from Poland were studied, and discrepancies in mercury levels were noticed among various types of tea [36]. The average mercury content across all samples was 2.47 µg/kg, with Madai tea having the highest levels, followed by green tea, Pu’er tea, white tea, and black tea having the lowest content. Leaf tea samples had higher mercury concentrations (2.54 µg/kg) compared with tea bags (1.16 µg/kg). The bioconcentration factors of mercury can be calculated from the mercury concentrations in new leaves, old leaves, and soil. The bioconcentration factor of mercury in new leaves was 0.118, while that in old leaves was 0.262.

3.3. Source Apportionment of Total Mercury in Tea Garden Soil

The PMF model was utilized to analyze the composition spectra and contribution rates of various heavy metals in the study area, as presented in Table 3. High levels of Cu and Zn were detected in Factor 1, indicating a possible connection to livestock manure, which often contains these metals as antibacterial agents and additives for animal health. Therefore, Factor 1 can be identified as a source related to fertilization. Factor 2 was characterized by a predominance of Ni, suggesting a pollution source linked to electroplating alloys commonly found in wastewater and waste residue from industrial facilities. This categorizes Factor 2 as an industrial source. Factor 3 exhibited a significant contribution from As, a metal primarily originating from coal combustion, labeling Factor 3 as a coal combustion source. Factor 4 showed a substantial contribution from Hg, representing 72.4% of the total, and is classified as a natural source due to the relatively small proportion of other metals and the concentration of mercury being close to the background level. Factor 5 is classified as a traffic-related source due to the high contribution rate of lead, which is as high as 82.1%. The combustion of fuels like gasoline can release lead into the atmosphere. Factor 6 is classified as an irrigation-related source because cadmium and zinc have relatively high contribution rates, possibly derived from industrial wastewater and domestic sewage used for agricultural irrigation. Figure 4 illustrates that Factor 4 has the most significant impact on Hg, accounting for 72.4% of the total influence. Factors 5, 3, and 2 also play a role in influencing Hg levels, indicating that the primary source of mercury in tea garden soil is natural but is also influenced by transportation, coal combustion, and industrial activities. Mercury accumulation from natural and industrial sources can increase soil mercury content over time, leading to absorption and enrichment in tea leaves. Industrial sources such as wastewater, waste gas, and coal combustion emissions, as well as transportation sources like vehicle exhaust, contribute to soil and tea leaf mercury accumulation. This accumulation can degrade soil quality, reduce fertility and water retention, diminish microbial activity, and impact tea tree growth. In tea, mercury accumulation can lower quality, affect taste, aroma, and color, and potentially create an unpleasant odor. Excessive mercury levels in tea pose health risks to consumers, potentially causing chronic diseases with long-term consumption.
This aligns with previous studies indicating relatively low levels of mercury contamination. Soil mercury content can come from natural processes like rock weathering, volcanic activity, and soil formation, as well as human activities such as fossil fuel combustion, mining, smelting, pesticide and fertilizer use, and industrial wastewater discharge. In urban and suburban areas, soil mercury pollution is mainly caused by industrial wastewater discharge and vehicle exhaust contaminations. In Guilin and its surrounding areas, soil mercury pollution is concentrated near industrial zones and traffic routes [37]. Similarly, in Fushun City, heavy metal pollution in urban and rural vegetable gardens is primarily due to industrial wastewater discharge, waste gas contaminations, and the use of fertilizers and pesticides [38]. Soil mercury levels are influenced by factors like soil type, land use patterns, and soil pH. For example, in the southwestern region, agricultural soil mercury levels are mainly affected by the soil parent material and land use patterns, with paddy soil having significantly higher mercury content compared with other soil types [39]. The main source of mercury in tea garden soil is natural, with secondary sources including industrial activities, coal combustion, and transportation. To address this issue, a long-term monitoring mechanism for soil mercury content should be established. Additionally, efforts should be made to strengthen ecological restoration and protection around tea gardens to reduce the impact of natural sources, treat industrial wastewater and waste residue, promote industrial upgrading, optimize the energy structure, enhance clean coal utilization technologies, promote clean energy vehicles, and strengthen traffic management to reduce transportation pollution. By implementing these comprehensive measures, we can effectively address mercury pollution in tea garden soil and ensure the safety of the soil environment and tea quality.

3.4. Health Risk Assessment of Total Mercury in Soil of Tea Garden

The presence of mercury in the soil of tea gardens is closely related to the risk of mercury exposure from consuming tea. The risk of mercury exposure is assessed through the calculation of the PDI for the general adult population using a specific formula. Tea mercury concentration is determined by multiplying soil mercury concentration by the enrichment factor. Daily intake is estimated based on China’s average annual tea consumption, considering the multiple-brewing mercury leaching rate. The HQ is used to evaluate total mercury exposure from tea consumption by comparing PDI with the recommended PTWI. A maximum value for HQ is included in the formula, along with a corresponding PTWI standard. Our calculations, presented in Table 4, show that the daily intake of mercury from tea consumption in the studied area ranges from 0.013 to 0.157 micrograms per kilogram of body weight per day (μg/kg bw/day), with an average intake of 0.050 μg/kg bw/day. When evaluating the risk of mercury exposure using the hazard quotient (HQ) metric, we found that the average HQ value is 0.104 ± 0.042, indicating that the overall exposure level is well below the threshold for concern. However, it is worth noting that the highest HQ value recorded among all sampling sites was 0.275, observed at a location in Jindou Town, Yongchun County, where the soil mercury content measured 296.45 μg/kg. The assessment of mercury exposure risk from tea consumption in this study is based solely on mercury levels in tea garden soils, which has its limitations. Factors such as differences in mercury accumulation between young and old tea leaves, variations in tea processing methods, and the impact of different brewing techniques can all affect the actual risk of mercury exposure. For example, a study in China measured the mercury content in green tea from 11 provinces and evaluated the leaching characteristics of mercury during the brewing process. It was found that the leaching rate of mercury during a single 40 min brewing was 22.6 ± 7.6%, and after brewing four times (3 min each time), the leaching rate increased to 32.8 ± 12.4%. The leaching of mercury from tea leaves is significantly influenced by leaching time, temperature, and the solid–liquid ratio [22].
The cumulative risk of mercury exposure from long-term tea consumption is difficult to determine due to various factors. Different tea varieties have varying abilities to absorb and accumulate mercury, with large-leaf tea plants being more prone to absorption. High mercury content in tea garden soil can lead to higher mercury levels in the tea produced. Tea processing methods can also affect mercury content, with fermentation degree playing a role in mercury migration. Brewing conditions such as time, temperature, and the solid–liquid ratio impact the mercury leaching rate. People who consume a high volume of tea have a higher cumulative risk of mercury exposure. Special groups like children, pregnant women, and the elderly are more sensitive to mercury toxicity and face greater health risks from exposure. While current risk levels are deemed safe, it is important to consider the potential risk from tea cultivated in areas with high mercury pollution. Future research should strive to incorporate these factors in risk assessments to obtain a more comprehensive understanding of mercury exposure from tea consumption.
There is limited research on mercury pollution in tea garden soils, but recent studies have looked into the health risks associated with this type of pollution. One study examined the potential dangers of consuming tea contaminated with mercury over a long period, particularly on the nervous system, kidneys, and other organs [40]. Another study conducted a spatial health risk assessment of mercury pollution in soil from a contaminated site in China, revealing significant health risks to residents, especially children and pregnant women [41]. Additionally, a health risk assessment of mercury pollution in agricultural soil in Shiquan County, Shaanxi Province, found that the pollution mainly comes from industrial contaminations and mining activities, posing a certain health risk to local residents [28]. These assessments emphasize the importance of implementing effective measures to reduce exposure and safeguard human health from soil mercury pollution. They also suggest that different assessment methods and measures should be employed depending on the specific pollution scenarios and environmental conditions.

4. Conclusions

This study analyzed mercury pollution in Chinese Oolong tea garden soils using source-tracing and risk assessment methods. Total mercury content in the soils was low, indicating a low pollution risk based on the soil accumulation index. The PMF model identified natural geochemical processes as the primary source of mercury, with contributions from transportation, coal combustion, and industrial activities. This study calculated the probable daily intake of mercury from tea consumption and found that the non-carcinogenic risk from mercury in most tea garden soils was below the hazard quotient (HQ) level. Further research is needed to understand the bioaccumulation mechanism of mercury in tea leaves and assess potential risks from short-term and long-term exposure. This will improve our understanding of the long-term impacts of mercury on the tea industry and human health.

Author Contributions

The work plan was designed by J.X., and the sampling and experiments were carried out by R.X. and L.L.; data analysis was performed by J.X., with support from Z.H. in manuscript revision. All authors have read and agreed to the published version of the manuscript.

Funding

This work was supported by Environmental Protection Technology Plan Project of Fujian Province (2022R003).

Data Availability Statement

The data sets used and/or analyzed during the current study are available from the corresponding author on request.

Conflicts of Interest

The authors declare no conflicts of interests.

References

  1. Aschner, M. Mercury toxicity. J. Pediatr. 2001, 138, 450–451. [Google Scholar] [CrossRef] [PubMed]
  2. Zahir, F.; Rizwi, S.; Haq, S.; Khan, R. Low dose mercury toxicity and human health. Environ. Toxicol. Pharmacol. 2005, 20, 351–360. [Google Scholar] [CrossRef] [PubMed]
  3. Liu, S.; Wang, X.; Guo, G.; Yan, Z. Status and environmental management of soil mercury pollution in China: A review. J. Environ. Manage 2021, 277, 111442. [Google Scholar] [CrossRef]
  4. Xu, J.; Bravo, A.; Lagerkvist, A.; Bertilsson, S.; Sjöblom, R.; Kumpiene, J. Sources and remediation techniques for mercury contaminated soil. Environ. Int. 2015, 74, 42–53. [Google Scholar] [CrossRef]
  5. Yu, H.; Li, J.; Luan, Y. Meta-analysis of soil mercury accumulation by vegetables. Sci. Rep. 2018, 8, 1261. [Google Scholar] [CrossRef]
  6. Cao, H.; Qiao, L.; Zhang, H.; Chen, J. Exposure and risk assessment for aluminium and heavy metals in Puerh tea. Sci. Total. Environ. 2010, 408, 2777–2784. [Google Scholar] [CrossRef]
  7. Colapinto, C.; Arbuckle, T.; Dubois, L.; Fraser, W. Is there a relationship between tea intake and maternal whole blood heavy metal concentrations? J. Expo. Sci. Environ. Epidemiol. 2016, 26, 503–509. [Google Scholar] [CrossRef]
  8. Krebs, D. The role of ground vegetation in the uptake of mercury and methylmercury in a forest ecosystem. Plant. Soil. 2003, 253, 445–455. [Google Scholar] [CrossRef]
  9. Kabata-Pendias, A.; Pendias, H. Trace Elements in Soils and Plants, 3rd ed.; CRC Press: Boca Raton, FL, USA, 2010. [Google Scholar]
  10. Li, X.; Zhang, J.; Gong, Y.; Yang, S.; Ye, M.; Yu, X.; Ma, J. Status of mercury accumulation in agricultural soils across China (1976–2016). Ecotoxicol. Environ. Saf. 2020, 197, 110564. [Google Scholar] [CrossRef]
  11. Bailey, E.; Gray, J.; Theodorakos, P. Mercury in vegetation and soils atabandoned mercury mines in southwestern Alaska, USA. Geochem. Explor. Environ. Anal. 2002, 2, 275–285. [Google Scholar] [CrossRef]
  12. Rimondi, V.; Gray, J.; Costagliola, P.; Vaselli, O.; Lattanzi, P. Concentration, distribution, and translocation of mercury and methylmercury in mine-waste, sediment, soil, water, and fish collected near the Abbadia San Salvatore mercury mine, Monte Amiata district, Italy. Sci. Total. Environ. 2012, 414, 318–327. [Google Scholar] [CrossRef]
  13. Song, Z.; Wang, C.; Ding, L.; Chen, M.; Hu, Y.; Li, P.; Zhang, L.; Feng, X. Soil Mercury Pollution Caused by Typical Anthropogenic Sources in China: Evidence from Stable Mercury Isotope Measurement and Receptor Model Analysis. J. Clean. Prod. 2020, 288, 125687. [Google Scholar] [CrossRef]
  14. Driscoll, C.; Mason, R.; Chan, H.; Jacob, D.; Pirrone, N. Mercury as a global pollutant: Sources, pathways, and effects. Environ. Sci. Technol. 2013, 47, 4967–4983. [Google Scholar] [CrossRef]
  15. Feng, X.; Li, P.; Fu, X.; Wang, X.; Zhang, H.; Lin, C. Mercury pollution in China: Implications on the implementation of the Minamata Convention. Environ. Sci. Process Impacts 2022, 24, 634–648. [Google Scholar] [CrossRef]
  16. Pribil, M.; Rimondi, V.; Costagliola, P.; Lattanzi, P.; Rutherford, D. Assessing mercury distribution using isotopic fractionation of mercury processes and sources adjacent and downstream of a legacy mine district in Tuscany, Italy. Appl. Geochem. 2020, 117, 104600. [Google Scholar] [CrossRef]
  17. Yevugah, L.; Darko, G.; Bak, J. Does mercury emission from small-scale gold mining cause widespread soil pollution in Ghana? Environ. Pollut. 2021, 284, 116945. [Google Scholar] [CrossRef]
  18. Feng, Z.; Deng, L.; Guo, Y.; Guo, G.; Wang, L.; Zhou, G.; Huan, Y.; Liang, T. The spatial analysis, risk assessment and source identification for mercury in a typical area with multiple pollution sources in southern China. Environ. Geochem. Health 2023, 45, 4057–4069. [Google Scholar] [CrossRef] [PubMed]
  19. Zhou, Y.; Aamir, M.; Liu, K.; Yang, F.; Liu, W. Status of mercury accumulation in agricultural soil across China: Spatial distribution, temporal trend, influencing factor and risk assessment. Environ. Pollut. 2018, 240, 116e124. [Google Scholar] [CrossRef]
  20. Xia, J.; Wang, J.; Zhang, L.; Anderson, C.; Wang, X.; Zhang, H.; Dai, Z.; Feng, X. Screening of native low mercury accumulation crops in a mercurypolluted mining region: Agricultural planning to manage mercury risk in farming communities. J. Clean. Prod. 2020, 262, 121324. [Google Scholar] [CrossRef]
  21. Xu, Q.; Yang, Y.; Hu, K.; Chen, J.; Djomo, S.; Yang, X.; Knudsen, M. Economic, environmental, and emergy analysis of China's green tea production. Sustain. Prod. Consum. 2021, 28, 269–280. [Google Scholar] [CrossRef]
  22. Wang, Q.; Wang, D.; Li, Z.; Wang, Y.; Yang, Y.; Liu, M.; Li, D.; Sun, G.; Zeng, B. Concentrations, leachability, and health risks of mercury in green tea from major production areas in China. Ecotoxicol. Environ. Saf. 2022, 232, 113279. [Google Scholar] [CrossRef] [PubMed]
  23. Sun, X.; Wang, H.; Guo, Z.; Lu, P.; Song, F.; Liu, L.; Liu, J.; Rose, N.; Wang, F. Positive matrix factorization on source apportionment for typical pollutants in different environmental media: A review. Environ. Sci. Process Impacts 2020, 22, 239–255. [Google Scholar] [CrossRef] [PubMed]
  24. Xu, B.; Xu, H.; Zhao, H.; Gao, J.; Liang, D.; Li, Y.; Wang, W.; Feng, Y.; Shi, G. Source apportionment of fine particulate matter at a megacity in China, using an improved regularization supervised PMF model. Sci. Total. Environ. 2023, 879, 163198. [Google Scholar] [CrossRef] [PubMed]
  25. Norris, G.; Duval, R.; Brown, S.; Bai, S. EPA Positive Matrix Factorization (PMF) 5.0 Fundamentals and User Guide; U.S. Environmental Protection Agency: Washington, DC, USA, 2014; pp. 1–136. [Google Scholar]
  26. Li, F.; Zhang, J.; Jiang, W.; Liu, C.; Zhang, Z.; Zhang, C.; Zeng, G. Spatial health risk assessment and hierarchical risk management for mercury in soils from a typical contaminated site, China. Environ. Geochem. Health 2017, 39, 923–934. [Google Scholar] [CrossRef]
  27. Xu, X.; Han, J.; Pang, J.; Wang, X.; Lin, Y.; Wang, Y.; Qiu, G. Methylmercury and inorganic mercury in Chinese commercial rice: Implications for overestimated human exposure and health risk. Environ. Pollut. 2020, 258, 113706. [Google Scholar] [CrossRef]
  28. Wei, M.; Pan, A.; Ma, R.; Wang, H. Distribution characteristics, source analysis and health risk assessment of heavy metals in farmland soil in Shiquan County, Shaanxi Province. Process Saf. Environ. Prot. 2023, 171, 225–237. [Google Scholar] [CrossRef]
  29. Guan, X.; Yang, J. Research on Chinese tea consumption and its corresponding enlightenments. J. Tea. Sci. 2014, 40, 75–79. [Google Scholar]
  30. JECFA. The Joint FAO/WHO Expert Committee on Food Additives Seventy Second Meeting: Summary and Conclusions; JECFA: Geneva, Switzerland, 2010; pp. 1–16. [Google Scholar]
  31. Huang, X.; Hu, J.; Qin, F.; Quan, W.; Cao, R.; Fan, M.; Wu, X. Heavy metal pollution and ecological assessment around the Jinsha Coal-Fired Power Plant (China). Int. J. Environ. Res. Public Health 2017, 14, 1589. [Google Scholar] [CrossRef]
  32. GB 15618-2018; Soil Environmental Quality—Risk Control Standard for Soil Contamination of Agricultural Land. Ministry of Ecology and Environment of the People’s Republic of China; State Administration for Market Regulation: Beijing, China, 2018.
  33. Qu, R.; Han, G.; Liu, M.; Zhang, Q. Vertical distribution and contamination of soil mercury in karst catchment, southwest China: Land-use type influence. Clean-Soil Air Water 2021, 49, 1–8. [Google Scholar] [CrossRef]
  34. Zeng, S.; Wang, X.; Yuan, W.; Luo, J.; Wang, D. Mercury accumulation and dynamics in montane forests along an elevation gradient in Southwest China. J. Environ. Sci. 2022, 34, 1–9. [Google Scholar] [CrossRef]
  35. Liu, Y.; Wang, J.; Guo, J.; Wang, L.; Wu, Q. Vertical distribution characteristics of soil mercury and its formation mechanism in permafrost regions: A case study of the Qinghai-Tibetan plateau. J. Environ. Sci. 2022, 113, 311–321. [Google Scholar] [CrossRef] [PubMed]
  36. Brodziak-Dopierała, B.; Fischer, A.; Szczelina, W.; Stojko, J. The content of mercury in herbal dietary supplements. Biol. Trace Elem. Res. 2018, 185, 236–243. [Google Scholar] [CrossRef]
  37. Qian, J.; Zhang, L.; Liu, H. Soil mercury distribution and pollution in urban and suburbs of Guilin. Geochimica 2000, 29, 94–99. [Google Scholar] [CrossRef]
  38. Li, J.; Liu, M.; Zhang, W.; Tian, Y. Evaluation and source analysis on heavy metal pollution of vegetable garden soil in the urban-rural area of Fushun city. Adv. Mater. Res. 2012, 518–523, 2121–2129. [Google Scholar] [CrossRef]
  39. Li, X.; Liu, H.; Meng, W.; Liu, N.; Wu, P. Accumulation and source apportionment of heavy metal(loid)s in agricultural soils based on GIS, SOM and PMF: A case study in superposition areas of geochemical anomalies and zinc smelting, Southwest China. Process. Saf. Environ. Prot. 2022, 159, 964–977. [Google Scholar] [CrossRef]
  40. Zhang, J.; Yang, R.; Li, Y.; Peng, Y.; Wen, X.; Ni, X. Distribution, accumulation, and potential risks of heavy metals in soil and tea leaves from geologically different plantations. Ecotoxicol. Environ. Saf. 2020, 195, 110475. [Google Scholar] [CrossRef]
  41. Li, Y.; Chang, M.; Ding, S.; Wang, S.; Ni, D.; Hu, H. Monitoring and source apportionment of trace elements in PM2.5: Implications for local air quality management. J. Environ. Manage. 2017, 196, 16–25. [Google Scholar] [CrossRef]
Figure 1. Distribution frequency and cumulative frequency curve of total mercury content in tea garden soil.
Agronomy 15 00435 g001
Figure 2. Kriging interpolation results of total mercury pollution in tea garden soil.
Agronomy 15 00435 g002
Figure 3. Correlation analysis of total mercury in tea garden soil. A and B in capital letters denote a significant difference, with p < 0.01.
Agronomy 15 00435 g003
Figure 4. Analysis of mercury source in the soil of tea garden by PMF model. Factor 1: Fertilization-related Source; Factor 2: Industrial Source; Factor 3: Coal-combustion Source; Factor 4: Natural Source; Factor 5: Traffic-related Source; Factor 6: Irrigation-related Source.
Agronomy 15 00435 g004
Table 1. Evaluation result of soil total mercury accumulation index in tea gardens.
AreaSamplesMinMaxMed
YC49−1.061.29−0.39
AX49−1.190.88−0.01
DH18−2.280.94−0.09
NA30−1.750.47−0.53
Table 2. Total mercury pollution in the soil of tea gardens.
ClassificationPollution DegreeCumulative IndexSamplesProportion(%)
Level 1pollution-freeI ≤ 09967.81
Level 2No pollution to medium pollution0 < I ≤ 14631.51
Level 3medium pollution1 < I ≤ 210.68
Table 3. Source contribution for different elements by positive matrix factorization.
ElementSource Component Spectrum (mg/kg)Source Contribution Rate (%)
Factor 1Factor 2Factor 3Factor 4Factor 5Factor 6Factor 1Factor 2Factor 3Factor 4Factor 5Factor 6
Hg0.0000.0080.0110.0810.0120.0000.26.79.972.410.70.0
Cu10.020.000.391.870.000.0081.60.03.215.20.00.0
As0.180.728.180.000.000.931.87.281.70.00.09.3
Cd0.0060.0000.0020.0060.0000.02914.50.04.413.60.067.5
Ni0.0710.650.570.490.001.150.682.44.43.80.08.9
Zn7.311.901.927.7616.5232.3110.82.82.811.524.447.7
Pb0.002.120.000.0048.228.400.03.60.00.082.114.3
Factor 1: Fertilization-related Source; Factor 2: Industrial Source; Factor 3: Coal-combustion Source; Factor 4: Natural Source; Factor 5: Traffic-related Source; Factor 6: Irrigation-related Source.
Table 4. The statistical evaluation of daily potential mercury intake and hazard quotient in the tea-consuming population.
MinMaxMeanStd.
PDI (μg/kg bw/day)0.0130.1570.0600.024
HQHg (%)0.0230.2750.1040.042
Disclaimer/Publisher’s Note: The statements, opinions and data contained in all publications are solely those of the individual author(s) and contributor(s) and not of MDPI and/or the editor(s). MDPI and/or the editor(s) disclaim responsibility for any injury to people or property resulting from any ideas, methods, instructions or products referred to in the content.

