Abstract
Decision support systems (DSSs) can improve decision making in integrated pest management (IPM), but are still underutilised despite proven environmental and economic benefits. To overcome the barriers to DSS adoption, this study analyses survey data from 31 farmers and 94 farm advisors, researchers and developers across 11 European countries. Using machine learning techniques, respondents were first categorised into clusters based on their responses to the questionnaire. The clusters were then explained using classification trees. For each cluster, customised approaches were proposed to overcome the barriers to DSS adoption. For farmers, these include building trust through co-development, offering free trials, organising practical workshops and providing clear instructions for use. For farm advisors and researchers, involvement in the development of DSS and giving them access to information about the characteristics of the DSS is crucial. IPM DSS developers should focus on 14 key recommendations to improve trust and the ease of use, increase the transparency of DSS descriptions and validation, and extend development to underserved sectors such as viticulture and vegetable farming. These recommendations aim to increase the uptake of DSSs to ultimately improve the implementation of IPM practises and help reduce the risk and use of pesticides across Europe despite the ever-growing challenges in agriculture.
1. Introduction
Agricultural production is becoming increasingly unpredictable in the face of climate change. Increasingly frequent extreme weather events are causing considerable damage to crops [1]. Warmer air temperatures allow for a faster development of pests, more generations in a year, or changes in pest distribution into new areas where there are few or no natural enemies [2]. Due to increasing pest pressure in Europe, as a consequence of increasing temperatures, farmers and farm advisors need to adapt farming practices to the new conditions.
Many decision support systems (DSSs) are available for integrated pest management (IPM) to help farmers and farm advisors deal with unpredictable weather fluctuations and the associated increased pest pressure [3,4,5,6]. Some of these systems also help to adapt current agricultural practises to these challenges. IPM DSSs are information technology tools that use data from linked databases (e.g., data warehouses), user input data and built-in models to predict the risk of pest damage occurrence [3] and suggest the optimal timing for an agro-technical measure (e.g., pesticide application) [6,7]. Optimising the timing of the application of the measure can significantly improve the effectiveness of the measure (e.g., the efficacy of a plant protection product) and thus reduce the number of treatments, resulting in a decreased environmental impact and lower agricultural production costs [7,8].
Although many DSSs have proven their effectiveness in the scientific literature [3,7,8,9,10,11,12,13,14,15] and there is a wide range of DSSs in Europe for use in IPM [3,4,5,6,16,17,18], their consultation by farmers and farm advisors is unexpectedly low [19,20]. The reasons for the low uptake vary depending on the socio-economic status of farmers and farm advisors (i.e., farm size, country, etc.), but also on their previous experience of using a DSS [20].
Due to the many economic and environmental benefits of using validated IPM DSSs, it is important that they are promoted to farmers and farm advisors. In addition, the importance of IPM DSS adoption is also highlighted by the increasing consumer demand for food produced with lower pesticide inputs [21] and the objectives set out in the European Commission’s strategies, which include stricter environmental criteria and stricter environmental protection [22,23,24]. The European Commission published two reports identifying shortcomings in the current Sustainable Use Directive (SUD) [25] in 2017 [26] and 2020 [27], highlighting a lack of education and knowledge transfer, an insufficient use of alternative methods for plant protection and a lack of holistic approaches to implementing sustainable practices in the use of pesticides. Despite this, the European Commission rejected a new stricter regulation on the sustainable use of plant protection products [28], due to concerns on potential impacts on crop productivity.
The use of DSSs can help farmers and farm advisors, especially in the area of holistic problem solving (e.g., considering and integrating multiple factors such as environmental sustainability, crop health, economic efficiency and social considerations in decision making) [7], which is insufficiently supported by current legislation in the European Union (EU) on the use of pesticides [26,27]. Some DSSs are structured in a way that enables breaking down complex problems into smaller sub-problems, where the most appropriate alternative is selected only after integrating the solutions to the sub-problems [29]. This approach makes the proposed alternative explainable and allows the user to consider the context in which the alternative was proposed when deciding whether or not to follow the advice of the DSSs. The additional advantages of using IPM DSSs are that the scientific and practical expertise is codified and made easily accessible to decision makers, leading to the optimisation and adaptation of current agricultural practises to make farms more resilient and responsive to pressing problems. Thus, the use of DSSs has the potential to enable a faster transfer of knowledge from science to practice, helping users to reduce environmental impact and production costs while maintaining or improving the quality and quantity of yields.
Researchers and DSS developers are attempting to promote IPM DSSs through a variety of approaches. These include the development of DSS architectures to make them as user-friendly and accessible as possible [6,30,31,32]. Another approach is the publication of review articles describing DSSs for use in IPM as well as in other areas of agriculture [3,4,5,6,33,34]. The typology for DSSs in IPM has been defined and implemented in a free web tool “IPM Adviser” [35], in which descriptions of the characteristics of more than 70 DSSs for IPM in Europe are available [16]. Another example is the integration of the results of multiple European IPM DSSs into a single platform with a single graphical interface and user account, which simplifies access to the DSS results [36].
This research was conducted within the EU project IPM Decisions (grant number 817617), which also addresses identified barriers to the adoption of DSSs among farmers and farm advisors [36]. The project has successfully linked IPM DSSs from across Europe into a user-friendly platform [36] that allows easier access and possibly a wider adoption of DSSs. A previous study found statistically significant differences in the reasons why farmers and farm advisors use or do not use IPM DSSs depending on the region of Europe [20]. By surveying farmers, farm advisors, researchers and DSS developers and analysing the qualitative data collected through the survey, this study aims to build on the previous findings and propose effective strategies to overcome the identified barriers and promote the adoption of IPM DSSs among farmers and farm advisors across Europe. It also aims to provide recommendations for DSS developers and promoters to support the digitalisation of agriculture across Europe.
2. Materials and Methods
The data were obtained through a survey of farmers, farm advisors, researchers and DSS developers in 11 European countries (Table 1). The respondents were from the countries participating in the IPM Decisions project, with the exception of one participant from Austria who attended the workshop in Germany. The participants of the workshops represent countries divided into three major environmental and agro-climatic regions of Europe, reflecting the environmental stratification of Europe: (1) Atlantic–Northern Europe, (2) Continental–Central and (3) Mediterranean–Southern [37]. The survey was conducted during IPM Decisions project workshops held in April and May 2022. An additional eight responses were gathered in an extra online workshop held in Slovenia in July 2022. This extra added workshop followed the same script as other workshops across Europe. The workshops were held online and were not part of a larger event. The workshops followed the research objectives of the IPM Decisions project, which included understanding the barriers and incentives to IPM DSS adoption among different stakeholders. Participants responded to the questionnaire voluntarily and were not compensated for their responses. Before the survey began, participants gave informed consent to participate in the study anonymously. Participants found information about the workshop via the established procedure from previous IPM Decisions project workshops [20] (i.e., via the social media channels of the IPM Decisions project or its partners, via email invitations sent by the national workshop organisers to their networks, or via invitations from other participants). By diversifying invitation channels we contributed to randomised sampling [38]. Participants were encouraged to bring along other farmers, farm advisors, researchers and DSS developers to join the workshop to further decrease our impact on the selection of participants. Participation in the workshop was free of charge. In total 125 participants attended the workshops across Europe (Table 1).

Table 1.
Survey participant structure, involved countries and their corresponding agroclimatic European regions.
2.1. Survey
Participants answered an online questionnaire consisting only of closed-ended questions. The questionnaire included a branched question, related to the participant’s profession, which was used to differentiate between farmers and non-farmers (farm advisors, researchers and DSS developers). This allowed us to design more specific and tailored questions for farmers, as their way of using a DSS differs from that of other participant groups. The questionnaire consisted of 30 questions for farmers and 29 questions for farm advisors, researchers and DSS developers. Questions were grouped into three thematic sections:
- About respondents and their experiences with DSSs.
- Overcoming identified barriers to DSS uptake (two similar sets of questions, one specifically for farmers and the other specifically for farm advisors, researchers and DSS developers).
- User preferences for DSS characteristics.
The first section of the questionnaire consisted of seven general questions such as age and gender as well as their experience with the use of DSSs. This section ended with the question: “Are you a farmer?”. Based on the responses, the questionnaire branched. If the answer was “yes” the participant proceeded with 16 questions for farmers. If the answer was “no”, the respondents defined their role as (1) farm advisor, (2) researcher or (3) DSS developer (multiple answers were possible) and proceeded with 15 questions for non-farmer respondents.
Section two of both sets of questions was developed to respond to the results of the previous study, where barriers to DSS use among farmers and farm advisors were identified [20]. For each of the main barriers identified, we asked how respondents would like to approach overcoming the barrier by providing 2–4 closed-ended answers (i.e., solutions). After completing the second section, in the third section, all respondents answered the same five additional questions about their preferences in relation to the characteristics of DSSs. A full set of questions and response options can be found in Appendix A.
2.2. Analysis
To analyse the data obtained from the online questionnaires, we followed the methodological approach described in the study by Marinko et al. [20] in which an innovative machine learning methodology for analysing survey data is presented and described in detail. The analysis process was carried out in four steps: (1) dimensionality reduction, (2) cluster analysis, (3) classification models and (4) statistical analysis.
2.2.1. Dimensionality Reduction
By answering the survey, each respondent creates a multidimensional statistical profile characterised by the 24 and 22 questions for both groups of respondents, respectively, representing their attitudes towards experienced barriers and preferred DSS characteristics (Appendix A). As confirmed by Marinko et al. [20], the high-dimensional data scatters intrinsically lower-dimensional information (patterns) across multiple dimensions, which makes it complex for analysis. The dimensionality reduction step aims to eliminate unnecessary complexity and reduce the data to a lower intrinsic dimensionality while preserving the relative distance between the respondents.
For this analysis, we employed the Uniform Manifold Approximation and Projection (UMAP) algorithm [39]—a versatile manifold learning and dimensionality reduction technique. UMAP aims to preserve the global structure of the high-dimensional data by finding a low-dimensional embedding that best retains the underlying fuzzy topological relationships.
The dimensionality reduction is conducted over an encoded dataset (where nominal variables are converted to dummy variables), except for those variables that have ordered scale values (e.g., age category, farm size, experience with DSSs, benefit from workshop, and the length of workshop), which are left as ordered variables (the order of the values is important). The UMAP method is configured with one parameter—the number of neighbours, for which the set of 3, 4, 5, 8, 10 and 15 are tested (Table 2). The dimensionality reduction is repeated 30 times for the stability of the results and the final output is picked from the best-performing runs using the clustering validation metric of silhouette width, as described in the following section.
Table 2.
Configuration of the Uniform Manifold Approximation and Projection (UMAP), Hierarchical Density-Based Spatial Clustering of Applications with Noise (HDBSCAN) and K-means clustering methods used for dimensionality reduction and clustering. Settings that are not provided are considered to retain their default values.
2.2.2. Clustering Analysis
To test respondents’ tendency to form clusters, which may indicate a way to tackle the barriers to wider DSS adoption, we used a density-based (HDBSCAN) and partition-based (K-means) clustering algorithm over embedded profiles into lower-dimensional space.
K-means clustering [40] is a centroid-based partitioning algorithm that iteratively assigns data points to k-predefined clusters by minimizing the within-cluster sum of squares. Each cluster is represented by its centroid, and data points are assigned to the nearest centroid based on Euclidean distance. The algorithm assumes spherical cluster geometry and is particularly effective for datasets with well-separated, isotropic clusters of similar size. The K-means clustering requires a pre-specified number of clusters and for these analyses, we tested values for k = 2, 3 and 4.
HDBSCAN (Hierarchical Density-Based Spatial Clustering of Applications with Noise) [41] is a density-based clustering algorithm that identifies clusters as regions of high point density separated by regions of lower density. HDBSCAN can detect clusters of varying shapes and densities while automatically identifying noise points, making it particularly suitable for complex, heterogeneous datasets. This method requires specifying the minimum number of points allowed in a cluster and we perform tests using n = 3, 5, 8 and 10.
We perform separate clustering analyses for (1) farmers and (2) farm advisors, researchers and DSS developers (ARDs) and we evaluate their fit using average silhouette width (ASW) [42]. ASW measures both cluster cohesion and separation. For each data point, the silhouette coefficient combines two metrics: the mean intra-cluster distance (representing cluster cohesion), and the mean distance to the nearest neighbouring cluster (representing separation). The ASW value ranges between −1 and 1, with a score closer to 1 indicating perfect matching between points and their corresponding clusters, while values closer to −1 show weak and wrong clusters’ structure.
The experimental setup included 30 runs of the dimensionality reduction process, each followed by clustering analysis with both HDBSCAN and K-means clustering (using all of the above values for their corresponding hyperparameter). First, the best-performing clustering per hyperparameter value is selected automatically using ASW across all 30 repeated runs. Then, the final clustering for each group of respondents is selected by visually inspecting the short-listed clustering outcomes—clustering with HDBSCAN (min. 5 points in a cluster) for farmers and K-means (with 3 clusters) for farm advisors and researchers and DSS developers. In the remainder of the analyses, we use the above selections.
2.2.3. Classification Models
In this step of analysis, we used a machine learning approach to develop classification models that distinguish between the clusters formed in the cluster analysis. In this way, we aimed to uncover the attributes that explain the differences between these groups. The J4.8 algorithm, an implementation of the C4.5 decision tree algorithm [43] within the WEKA software package version 3.8.4 [44], was used to create the classification models. This method allowed us to map the two-dimensional clustering results back to the original dimensions of the dataset, providing insight into the attributes that define each cluster. In particular, the classification models predict the nominal value of a dependent variable corresponding to the different clusters identified during the cluster analysis. The classification model has a hierarchical structure where the internal nodes represent tests for certain attributes, the branches indicate the results of these tests and the leaf nodes provide predictions for the dependent variable (i.e., the cluster number). The performance of the classification model is evaluated based on the proportion of correctly predicted instances, which serves as an indicator of the model’s prediction accuracy [45]. To estimate the accuracy of the model on unseen data, we applied leave-one-out cross-validation, a special case of cross-validation that is particularly suitable for datasets with limited instances. In this approach, the dataset is split so that each instance is used as a test case, while the remaining instances are used for training. The process is repeated for each instance and the results are averaged to calculate the overall prediction accuracy [45]. In order to explain the differences between the clusters, classification models were created where the included attributes highlight the key factors that differ between the groups (clusters) of respondents.
2.2.4. Statistical Analysis
In the last step of the data analysis, a statistical analysis was carried out to check whether there were differences in the answers to the individual questions between the respondents, who were classified in different clusters. In this way, we checked the appropriateness of the structure of the machine learning models for the classification of clusters. At the same time, we gained insight into other, relatively less important factors that nevertheless have a statistically significant influence on the predicted variable, i.e., on the classification of the respondent into a particular cluster. For the statistical analysis, we used a z-test for the comparison of two proportions at a confidence interval of 95% [46,47].
3. Results
3.1. Demographic Characteristics of the Workshop Participants
The age structure of group one—farmers—and group two—farm advisors, researchers and developers—was similar, with a slightly higher proportion of younger participants (18–34 years old) among the farmers. Of the farmers, 39% were 18–34 years old, 58% were 35–59 years old and 3% were 60 or more years old. Among the ARDs surveyed, 28% were between 18 and 34 years old, 61% were 35–59 years old and 12% were 60 or more years old. The majority (71%) of farmers were male, while the gender structure is more balanced among ARDs, with 55% males and 43% females and 2% preferring not to specify their gender. Of the farmers, 61% had a level of education up to and including a bachelor’s degree. The proportion of farmers with a Master’s or PhD degree was 39%. The educational structure among ARDs was 33% with up to a bachelor’s degree and 67% with a Master’s or PhD degree. The proportion of farmers with small farms (less than 10 ha) was 29%; 19% of farmers had farms of 11–30 ha. The least represented group were farmers with farms between 31 and 60 ha (6%). The majority of farmers had farms of more than 60 ha (45%). In the second group, a large proportion of participants work on farms of up to 10 ha (38%). Only a few participants work on farms with a size between 11 and 30 ha (14%). The group of ARDs working on farms of 31–60 ha was the least represented (9%). The largest proportion of them work on farms larger than 60 ha (39%). The under-representation of certain groups of participants (e.g., farmers with a farm size of 31–60 ha) is due to the decision of those invited not to participate or to the lack of farms from this size category. A more detailed description of the data categories mentioned in Section 2.1 can be found in the following subsections.
3.2. Clustering of Survey Respondents
The results of the cluster analysis enabled us to visualise the variability of the answers given by the survey respondents. Participants who gave the most similar answers to most of the questions are grouped together in the x, y plot. Based on their responses, farmers have been grouped into two clusters (Figure 1a), while farm advisors, researchers and DSS developers formed three clusters (Figure 1b), (Table 3). No outliers were identified for either participant type (role).
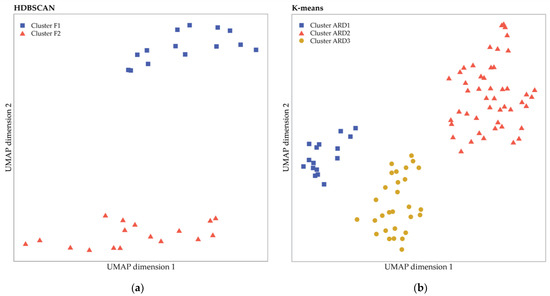
Figure 1.
Distribution of points representing (a) farmers (n = 31) and (b) farm advisors, researchers and DSS developers (ARDs), (n = 94) in a two-dimensional plane and the clusters they form (two clusters of farmers and three clusters of ARDs). For farmers, Hierarchical Density-Based Spatial Clustering of Applications with Noise (HDBSCAN) was used with at least five points in the cluster, while for ARDs K-means with three clusters was used.
Table 3.
Summary of dimensionality reduction, clustering and validation metrics for best performing clustering outcomes for both groups of respondents.
3.3. Interpreting Respondent Clusters Using Classification Trees
The clustering analysis was followed by the development of machine learning models for the classification of discovered clusters. In addition to identifying the most explainable attributes when clustering the respondents based on their responses to the questionnaire, this analysis allowed us to look at hierarchical levels of included explainable attributes.
3.3.1. Farmers
Farmers were categorised into two clusters (Cluster F1 and Cluster F2) based on their responses to the questionnaire. According to the structure of the induced classification model, the most explainable attributes for grouping farmers into the two clusters were ‘Farm size’, which indicates how large their farm is, and ‘Experience with DSS’, which indicates how experienced the farmer is with using DSSs (Figure 2).
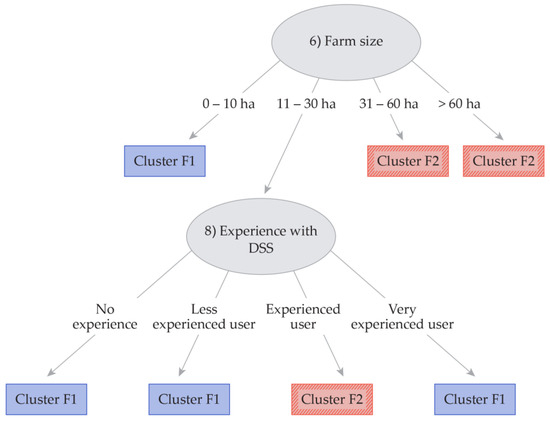
Figure 2.
Model for classification of farmers into two corresponding clusters. The model correctly classified 96.8% of the 31 instances. Numbers in front of attributes correspond to question number. All questions and response options can be found in Appendix A.
Farmers with small farms (0–10 ha) were classified into Cluster F1, together with farmers whose farm size is 11–31 ha and who have no experience with DSSs or are less experienced in using DSSs. Farmers with a farm size of 11–30 ha who are very experienced with DSS use were classified in Cluster F1. Cluster F2 consisted of farmers with either large (31–60 ha) or very large farms (>60 ha) or farmers with medium-sized farms (11–30 ha) who are experienced users of DSSs. The statistical analysis provides additional explanations, which are statistically confirmed at p < 0.05 (Table 4).
Table 4.
Questions with statistically significant differences (p < 0.05) between farmers from Cluster F1 and Cluster F2. The symbol ► indicates questions that correspond to the attributes included in the classification model for farmers.
Statistically based profiles of farmers in Cluster F1 and F2 (Table 4)
The majority of farmers categorised in Cluster F1 are from Southern Europe (79%). Only 7% are from Central Europe. In Cluster F2, the majority of farmers were from Central Europe (53%), followed by farmers from Northern Europe (47%). In Cluster F1, there are predominantly farmers with small farms (0–10 ha) (64%), followed by farmers with medium-sized farms (11–30 ha) (36%), while in Cluster F2 there is no one with a small farm (0–10 ha), only 6% with medium-sized farms (11–30 ha) and the majority of farmers have large farms (>60 ha) (82%). In Cluster F1, the majority predominantly grow fruit, including olives (50%), and only 14% of farmers grow mainly arable crops, including hops. The majority in Cluster F2 mainly grow arable crops including hops (82%) and only 6% of farmers mainly grow fruit, including olives. In Cluster F1, the majority had no experience with DSSs (79%) and none of the farmers were experienced users who use DSSs regularly, while there was a high proportion of experienced DSS users in Cluster F2 (29%). In addition, the proportion of farmers from Cluster F2 who had no experience with DSSs was lower than in Cluster F1 (24% in Cluster F2 compared to 79% in Cluster F1). In Cluster F1, the majority are willing to pay for DSS workshops (64%). Of the farmers who are willing to pay for training workshops, 44% are willing to pay only for longer (full-day) training workshops, while 56% are willing to pay regardless of the duration of the DSS training workshop. In Cluster F2, the majority are not willing to pay for a DSS training workshop (76%). The majority in both clusters consider the specific description of the crop damage risk assessment and the proposed risk mitigation measures to be the most trustworthy level of detail (64% in Cluster F1 and 76% in Cluster F2). However, a large proportion of respondents in Cluster F1 responded that they would trust a very detailed description of the crop damage risk assessment and proposed risk mitigation measures the most (29%), while no one in Cluster F2 chose this answer. The majority in both clusters responded that demonstrating the usefulness of the new digital support services through practical examples on farms, fairs, workshops, etc., would encourage them most to use these technologies. However, the proportion of respondents who chose this answer was lower in Cluster F1 (57%) than in Cluster F2 (82%). In Cluster F1, the majority would like to participate in the development of a new IPM DSSs (57%), but still a very large proportion would not (43%). In contrast, the vast majority in Cluster F2 would participate in the development of a new IPM DSSs (88%).
To summarise, Cluster F1 mainly represents Southern European smallholders who focus on fruit growing, have limited experience with DSSs and are more willing to pay for workshops, and have a greater desire for more detailed information. In contrast, Cluster F2 consists mainly of large-scale farmers from Central and Northern Europe who are mostly arable farmers, have more experience with DSSs and are less willing to pay for training, but are highly motivated by practical demonstrations and are keen to contribute to the development of new DSSs. The overall differences reflect the different geographical, farm and technological characteristics of the two clusters, with Cluster F2 being more advanced in the adoption of DSSs and large-scale farming practises.
3.3.2. Farm Advisors, Researchers and DSS Developers
Farm advisors, researchers and DSS developers (ARDs) were grouped into three clusters (Cluster ARD1, Cluster ARD2 and Cluster ARD3) based on their responses to the questionnaire. The most explainable attribute for the assignment to the respective clusters is ‘Farm size’, which indicates the size of the farms they work with. This attribute is followed by ‘Calibration of already developed DSS’, which reflects their willingness to help calibrate existing DSSs for use in their study/clients’ farms. The third most explainable attribute is ‘Development of new DSS’ which reflects their willingness to participate in the development of new DSSs for use in their study/clients’ farms (Figure 3).
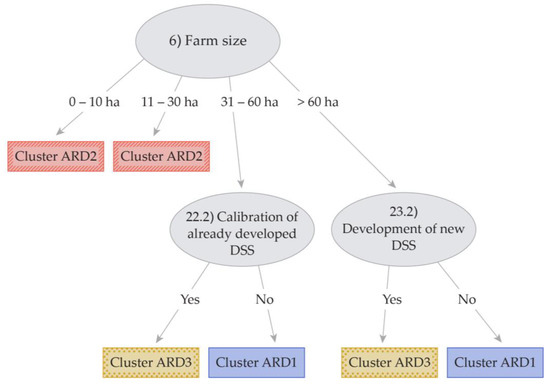
Figure 3.
Model for classification of farm advisors, researchers and DSS developers (ARDs) into three corresponding clusters. The model correctly classified 94.7% of the 94 instances. Numbers in front of attributes correspond to question number. All questions and response options can be found in Appendix A.
Farm advisors, researchers and DSS developers who work predominantly for large farms (31–60 ha) and are not willing to participate in the calibration of already developed DSSs in order to use them on their study or clients’ farms were classified in Cluster ARD1, together with ARDs who work predominantly for very large farms (>60 ha) and are not willing to participate in calibration of new DSSs in order to use them on their study or clients’ farms. Those who work predominantly for small- (0–10 ha) and medium-sized (11–30 ha) farms were classified in Cluster ARD2. ARDs who work predominantly for large farms (31–60 ha) and are willing to participate in the calibration of already developed DSSs in order to use them on their study or clients’ farms and those who work predominantly for very large farms (>60 ha) and are willing to participate in the calibration of new DSSs in order to use them on their study or clients’ farms were classified in Cluster ARD3. An additional statistical analysis showed the importance of additional classification attributes and confirmed significant differences (p < 0.05) in the responses of the ARDs who were classified into three clusters (Table 5).
Table 5.
Questions with statistically significant differences (p < 0.05) between farm advisors, researchers and DSS developers from Clusters ARD1, ARD2 and ARD3. Statistically significant differences in pairwise comparisons of cluster responses are marked with *. The symbol ► indicates questions that correspond to the attributes included in the classification model for ARD.
Statistically based profiles of farm advisors, researchers and DSS developers in Clusters ARD1 and ARD2 (Table 5)
Only 6% of farm advisors, researchers and DSS developers classified in Cluster ARD1 were from Southern Europe, while Cluster ARD2 had a large proportion of respondents from Southern Europe (35%). There were no significant differences in the other regions. In Cluster ARD1, the proportion of respondents aged 60 years or older was higher (31%) than in Cluster ARD2 (4%). In Cluster ARD1, the majority works for larger farms (>60 ha; 81%) and nobody works for a farm with less than 10 ha, while in Cluster ARD2 the majority works for small- (0–10 ha; 73%) and medium-sized farms (11–30 ha; 24%) and nobody works for a farm of more than 60 ha. In Cluster ARD1, 75% work predominantly with arable crops. In Cluster ARD2, this share is lower (45%), but still represents the majority of responses. In Cluster ARD1, 63% would prefer to search by themselves in the catalogue with descriptions of the features of existing DSSs to select the most suitable DSS, while in Cluster ARD2 only 22% prefer this. In Cluster ARD1, 56% of respondents would expect DSS workshops to provide an overview of existing DSSs for their region (e.g., introduction to a set of available DSSs, their benefits and limitations and examples of good practice), while in Cluster ARD2, 29% chose this answer. In Cluster ARD1, 75% would not be willing to conduct workshops for farmers and 25% would conduct workshops, in contrast to Cluster ARD2 where 35% would not be willing to conduct workshops for farmers and 65% would conduct workshops. In Cluster ARD1, 94% would not be willing to participate in the calibration of already developed DSSs and 6% would be willing. In Cluster ARD2, 29% would not be willing to participate in the calibration of already developed DSSs and 71% would be willing. In Cluster ARD1, no one would be willing to participate in the calibration of new DSSs. In Cluster ARD2, 82% would be willing to participate in the calibration of new DSSs and only 18% would not be willing.
To summarise, respondents assigned to Cluster ARD1 tend to be older, work on larger farms and are more focused on arable crops. They are generally more independent in their approach to DSS selection, but less willing to participate in workshops or DSS calibration activities. In contrast, respondents assigned to Cluster ARD2 are younger, work predominantly on smaller farms and are more open to participating in workshops, DSS calibration and collaborations. The geographical difference also shows that Southern European respondents are more strongly represented in Cluster ARD2.
Statistically based profiles of farm advisors, researchers and DSS developers in Cluster ARD2 and Cluster ARD3 (Table 5)
The majority of respondents in Cluster ARD2 and Cluster ARD3 come from Central Europe (43% in Cluster ARD2 and 53% in Cluster ARD3). In Cluster ARD2, 22% come from Northern Europe and 35% from Southern Europe, while in Cluster ARD3, 45% come from Northern Europe and only 3% from Southern Europe. In Cluster ARD2, the majority work on small- (0–10 ha; 73%) and medium-sized farms (11–30 ha; 24%) and nobody works on farms larger than 60 ha, in contrast to Cluster ARD3 where the majority work on very large (>60 ha; 73%) and large farms (31–60 ha; 24%) and nobody works on small- or medium-sized farms (0–30 ha). In Cluster ARD2, 45% of respondents work predominantly with arable crops and 14% with vegetables, while in Cluster ARD3, 83% work predominantly with arable crops and nobody with vegetables. In Cluster ARD2, 16% are experienced users and use DSSs regularly, 39% have no experience with the use of DSSs. In Cluster ARD3, 45% are experienced users and use DSSs regularly and 10% have no experience with the use of DSSs. The majority in Cluster ARD2 would prefer to familiarise themselves with digital support services in group training workshops (in a group with other farm advisors) (67%), and 14% would prefer to do it individually, with instructions in text or video format and without technical support. In Cluster ARD3, 24% would prefer to get familiar with digital support services in group training workshops (in a group with other farm advisors), and 38% would prefer to do it individually, with instructions in text or video format and without technical support. In Cluster ARD2, the majority answered that a free basic version of the DSS with easy to understand instructions in text or video format would be best for them (69%), and 31% answered that a more advanced DSS, that can be obtained through a grant and includes all of the technical support required for use would be more appropriate for them. In Cluster ARD3, this proportion is 45% and 55%, respectively. In Cluster ARD2, 71% would be willing to participate in the calibration of DSSs that have already been developed, while 29% would not be willing to do so. In contrast, in Cluster ARD3, 97% would be willing to participate in the calibration of DSSs that have already been developed, while 3% would not be willing to do so.
To summarise, the respondents assigned to Cluster ARD2 tend to work on smaller farms, come from all three regions (with a notable proportion from Southern Europe), have less experience with DSSs and prefer group workshops to learn more about digital support services. They are generally more inclined towards simple DSSs with simple instructions compared to respondents assigned to Cluster ARD3. On the other hand, Cluster ARD3 represents respondents who are mainly from Central and Northern Europe, tend to work on large farms, have more experience with DSSs and prefer individual learning with text or video instructions. They favour advanced DSSs with technical support and the majority are willing to participate in the calibration of existing DSSs. Overall, respondents assigned to Cluster ARD3 show a higher level of technological engagement and a preference for advanced systems compared to respondents assigned to Cluster ARD2.
Statistically based profiles of farm advisors, researchers and DSS developers in Cluster ARD1 and Cluster ARD3 (Table 5)
The majority in both Cluster ARD1 and Cluster ARD3 would prefer to access general information on DSSs through demonstration workshops and training (examples of good practice) (69% in Cluster ARD1 and 79% in Cluster ARD3). In Cluster ARD1, a large proportion of respondents favoured access to general information on DSSs through the media (31%), while in Cluster ARD3, only 7% chose this answer. In Cluster ARD1, 63% of respondents would prefer to search for themselves in the catalogue with descriptions of the features of existing DSSs when choosing the most appropriate DSS, compared to 28% in Cluster ARD3. In Cluster ARD1, 75% would not be willing to conduct the DSS training workshops for farmers and 25% would conduct the workshops, while in Cluster ARD3, 83% would conduct the workshops for farmers and only 17% would not be willing to conduct the workshops. In Cluster ARD1, the majority would prefer to get familiar with digital support services in group training workshops (in a group with other farm advisors) (56%). In Cluster ARD3, 24% would prefer this option. In Cluster ARD1, 94% would not be willing to participate in the calibration of already developed DSSs and only 6% would be willing to do so, in contrast to Cluster ARD3, where 97% would be willing to participate in the calibration of already developed DSSs and only 3% would not be willing to do so. In Cluster ARD1, no one would be willing to participate in the development of new DSSs. In Cluster ARD3, 97% would be willing to participate in the development of new DSSs and only 3% would be unwilling to do so.
To summarise, members of both Cluster ARD1 and Cluster ARD3 prefer to learn about DSSs through demonstration workshops. However, Cluster ARD1 participants are more willing to learn about DSSs through the media and prefer to search for DSSs through a catalogue on their own. Respondents assigned to Cluster ARD3 show a much stronger willingness to organise workshops for farmers compared to respondents assigned to Cluster ARD1. Cluster ARD1 participants favour group training workshops to get familiar with digital support services, while Cluster ARD3 participants are more open to other learning methods and are more enthusiastic about participating in the calibration of already developed DSSs and the development of new DSSs.
Comparative summary of farm advisors, researchers and DSS developers in three clusters (Figure 3 and Table 5)
Based on the above descriptions of both the classification model (Figure 3) and the additional statistical analysis (Table 5), we summarised the specific characteristics of each cluster and the main differences between the respondents in the Clusters ARD1, ARD2 and ARD3.
Cluster ARD1 is characterised by an older age group, with a higher proportion of respondents aged 60 or older. These respondents predominantly work on larger farms and, unlike the other clusters, show a strong preference for independent learning, particularly when it comes to selecting a DSS. A significant proportion of respondents assigned to Cluster ARD1 prefer to search for the most suitable DSSs by themselves, which is much less common in Clusters ARD2 and ARD3. Furthermore, Cluster ARD1 participants are generally more reluctant to organise training workshops for farmers or to participate in the calibration of existing DSSs or the development of new DSSs. This lack of willingness is in stark contrast to the more committed attitude among respondents assigned to other clusters.
Cluster ARD2, on the other hand, is characterised by a focus on small- and medium-sized farms and a significant number of respondents from Southern Europe. This cluster also has a more balanced mix of DSS experience, ranging from users with no experience to those who are more familiar with DSS use. In contrast to Cluster ARD1, the majority of Cluster ARD2 participants favour group workshops, reflecting their preference for learning in a collaborative environment. They also tend to favour a free basic version of DSSs over more advanced options, which contrasts with Cluster ARD3 where there is a stronger interest in advanced DSS solutions with extensive technical support.
Finally, Cluster ARD3 is characterised by more experienced DSS users, who work on large or very large farms. This cluster shows a strong preference for individualised learning. Many respondents prefer to familiarise themselves with DSSs through text or video tutorials rather than in group workshops. Cluster ARD3 participants are also the most willing to participate in the calibration of existing DSSs, as well as the development of new DSSs. In addition, they are more likely to favour advanced DSS options that can be purchased through grants and include comprehensive technical support. This distinguishes them from Cluster ARD2, which favours more basic DSS versions.
3.4. Majority Responses Across Europe
In addition to the results presented in the previous sections, we found that the majority of respondents in both groups across Europe choose the same answer to some of the questions (i.e., agreed on the same approach to overcoming some of the barriers to IPM DSS adoption). Although various measures have been taken to avoid sample bias (Section 2), the following results should be interpreted with caution, which is why we present the majority responses from farmers (Table 6) and farm advisors, researchers and DSS developers (Table 7) only in tabular form and without in-depth interpretation.
Table 6.
List of questions to which the majority (>60%) of farmers gave the same answer regardless of the cluster they belong to and the majority response (n = 31).
Table 7.
List of questions to which the majority (>60%) of farm advisors, researchers or DSS developers gave the same answer regardless of the cluster they belong to and the majority response (n = 94).
The questions to which the majority of farmers give the same answer, regardless of the cluster to which they belong, show that they have very similar attitudes, needs and preferences with regard to some aspects of DSSs. Farmers address similar issues such as training, information access, motivation, participation and customisation to understand the factors that influence DSS adoption and to identify strategies for effective implementation. This consistency of responses emphasises the prevalence of certain attitudes and needs within the European agricultural sector.
The questions to which the majority of farm advisors and DSS developers give the same answer, regardless of the cluster to which they belong, show a common view on the introduction and adoption of DSSs in agriculture. In particular, a majority (>60%) have a similar attitude towards training, motivation and involvement in the development and use of DSSs.
In addition to the questionnaire presented above, respondents were invited to respond to a series of non-mandatory questions in Section 3 of the questionnaire relating to the characteristics of DSSs. Only question A1 had three answer options (Appendix A, Table A5). All other questions in this section offered yes/no response options. We found no statistically significant differences (p < 0.05) between the responses of respondents from both groups ((1) farmers and (2) farm advisors, researchers and DSS developers) to all questions except for question A3, where a higher proportion of farmers responded that they would not use a DSS requiring the manual input of data from the field compared to ARDs. However, the majority in both groups responded that they would use such a DSS (Figure 4).
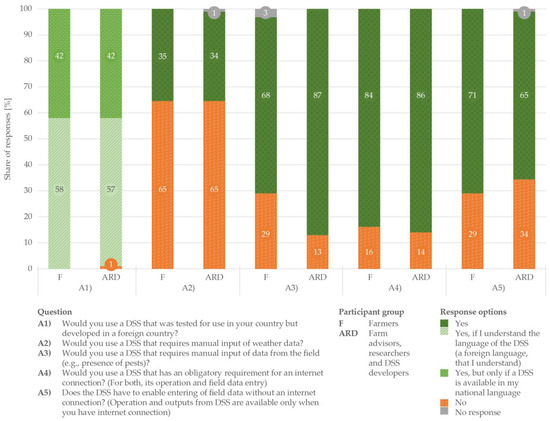
Figure 4.
Respondents’ answers to the section of the questionnaire relating to the characteristics of DSSs. Responses were obtained from 31 farmers and 93 farm advisors, researchers and decision support systems (DSS) developers (ARDs). Positive responses are coloured in shades of green, while the answer “No” is coloured orange. All questions and response options can be found in Appendix A, Table A5.
3.5. Approaches to Overcoming Barriers to DSS Adoption
Questionnaires used in this study were designed to identify the most appropriate approaches with an aim to overcome identified barriers to DSS adoption in agriculture across Europe. The questionnaires were adapted to address key identified barriers to DSS adoption such as (1) a lack of trust in DSSs, (2) a lack of experience with DSSs, (3) perceived need for training in IT, (4) willingness to pay for DSSs, (5) the ease of use of DSSs, (6) low participation in DSS demonstration workshops, (7) poor access to marketing information about DSSs and (8) crop-specific requirements and expectations from DSSs [20,30,48].
Tailored approaches to overcoming barriers to the adoption of DSSs by farmers from Cluster F1
To address the lack of trust among farmers classified in Cluster F1, DSS developers should increase co-operation with farmers from smaller fruit farms and involve them in the development, calibration and validation of IPM DSSs, which the majority of farmers in this cluster are open to (response to barrier 1). Involving them in the development and/or validation process would allow them to familiarise themselves with the available tools (response to barriers 2, 3 and 7). As a large proportion of farmers from this cluster are not willing to co-operate in the development and/or validation of DSSs, developers should consider engaging them through free trial versions of DSSs with limited functionality and step-by-step instructions on how to use the DSS. Through this approach, farmers will also provide valuable feedback to DSS developers and help them focus their energy and resources on the features that are actually needed and used, simplifying the user interface (response to barriers 5 and 8), while increasing the value of such a tool, reducing development costs and potentially increasing farmers’ trust and willingness to pay for a DSS (response to barriers 1 and 4). Alternatively, DSS developers could attract farmers from this cluster by organising DSS workshops, as the survey results show that these farmers are very interested in learning more about DSS and that they are more willing to pay for such workshops than for using a DSS. To increase the number of participants, the workshops should be short (1–2 h) and conducted online (response to barrier 6). The focus of such workshops should be on demonstrating the benefits of DSS through practical examples, as this is most likely to encourage farmers to use the new digital support services, including DSSs. Although numerous DSSs have been developed, not all crops are equally well covered by DSSs [16], so the additional development of DSSs in poorly supported sectors (e.g., viticulture, vegetables, hops, olives and other fruits) would be welcome (response to barrier 8).
Tailored approaches to overcoming barriers to the adoption of DSSs by farmers from Cluster F2
With some adjustments, most of the proposed approaches described above could also be applied to farmers from Cluster F2. To increase trust in DSSs, DSS developers should increase co-operation with farmers from larger arable farms and involve them in the development and validation process (response to barriers 1, 2, 3, 5, 7 and 8). An even higher proportion of farmers from Cluster F2 compared to Cluster F1 are willing to participate in the development or validation of existing or new DSSs, so workshops targeting farmers represented by this cluster should use a higher degree of interactive components. In contrast to the farmers from Cluster F1, farmers in this cluster are slightly more experienced, so they are less willing to participate in introductory workshops for DSSs, which is why the majority in this cluster are not willing to pay for DSS workshops, and offering advanced DSS workshops may improve engagement. Even if they are not willing to pay for DSS workshops, they are still motivated when they see practical examples. Therefore, the participation of developers and the presentation of DSSs at fairs and farms is recommended to increase the use of DSSs by farmers from this cluster (response to barrier 6).
Tailored approaches to overcoming barriers to the adoption of DSSs by farm advisors and researchers from Cluster ARD1
Farm advisors and researchers have different needs than farmers and have different expectations from DSSs. Among the barriers mentioned above (barriers 1 to 8), (1) a lack of trust in DSSs, (6) low participation in DSS demonstration workshops and (7) poor access to marketing information about DSSs stand out as the most important barriers to the adoption of DSSs, at least for farm advisors [20].
In this cluster of potential users, trust in DSSs can be strengthened by providing them with descriptions of the characteristics of developed DSSs (response to barrier 1). The respondents in this cluster showed great interest in searching for information about DSSs and selecting the most appropriate DSSs by themselves. For this purpose, the typology for IPM DSSs was developed and implemented in the IPM Adviser webtool [16,35]. The tool enables a transparent and standardised description of DSSs for IPM and offers users the opportunity to find out about and compare existing IPM DSSs and their properties in a user-friendly way (response to barrier 7). Their participation in DSS workshops could be increased by including an overview of existing DSSs for their region (e.g., introduction to a set of available DSSs, their benefits and limitations, and examples of good practice) in the workshop programme (response to barrier 6). However, respondents in this cluster, who tend to be older, work on larger farms and focus more on arable crops, showed less interest in attending the workshops compared to their independent search through lists, catalogues and tools such as IPM Adviser. A large proportion of respondents in Cluster ARD1 prefer to receive general information about DSSs via the media, which emphasises the independence of this group.
Tailored approaches to overcoming barriers to the adoption of DSSs by farm advisors and researchers from Cluster ARD2
Trust in DSSs can be improved in this cluster in a similar way to farmers, by including farm advisors and researchers in the development and validation of DSSs (response to barrier 1). Most of the members of this cluster, which is made up of people who work predominantly in both arable and mixed farming and who work on small- and medium-sized farms, are willing to share their knowledge with farmers and organise workshops for them. It is important to emphasise that the first step of knowledge exchange should be the training of farm advisors and researchers by the DSS developers. They can then pass this knowledge on to farmers in workshops designed specifically for them.
The majority in this cluster is willing to cooperate on the development and validation of DSSs. In contrast to Cluster ARD1, the results show that implementing DSS workshops is more suitable for Cluster ARD2, as the majority in this group prefer to familiarize themselves with digital support services through group training with other farm advisors. To increase participation in the DSS workshops for Cluster ARD2, the aim of the workshops should be to demonstrate DSSs with examples of good practice (e.g., how to choose the most appropriate DSS and how to use it) (response to barrier 6). As the majority of this group are beginners, it is proposed to provide a free basic version of the DSS with limited functionality so that users can familiarise themselves with the tool and at the same time are not overwhelmed by advanced functions with a flatter learning curve (response to barriers 2, 3, 4 and 5). As well as farmers from Cluster ARD1, this cluster would benefit from the additional development of DSSs in poorly supported sectors (e.g., viticulture, vegetables, hops, olives and other fruits) (response to barrier 8).
Tailored approaches to overcoming barriers to the adoption of DSSs by farm advisors and researchers from Cluster ARD3
In Cluster ARD3, which is dominated by farm advisors and researchers working on very large arable farms, the approach to overcoming the lack of trust is to provide them with high quality and detailed text or video instructions on how to use a particular DSS and how to interpret the results (response to barriers 1, 2, 3 and 5). This approach could also replace some of the support and knowledge transfer that usually takes place in DSS workshops, as this approach is more effective in this cluster than group workshops. Cluster ARD3 is the most open to collaboration in the development and validation of new or existing DSSs, which is a very valuable asset for the further development of DSSs. It also consists of people who generally have more experience with DSSs compared to the other two clusters and are more willing to use a paid version of a DSS. At a higher level (i.e., at the level of policy makers), another effective approach to increasing uptake in this group could be to subsidise the use of DSSs (response to barrier 4).
General recommendations for DSS developers
Unlike the tailored recommendations for farm advisors and researchers grouped into Clusters ARD1, ARD2 and ARD3, this section provides broader, cluster-independent guidance specifically for DSS developers. Developers are not direct users of DSSs, but are responsible for developing tools that meet the diverse needs of their users. Therefore, the recommendations outlined here focus on removing development barriers in order to increase the potential of new DSSs to have higher adoption across the European agricultural sector. To achieve this, the following 14 actions are proposed:
(1) Provide clearly structured outputs from DSSs that allow users to obtain an understandable (not too general or very detailed) description of the crop damage risk assessment and proposed mitigation measures (response to barrier 1). (2) Provide access to validation data or to publications describing the validation results (response to barrier 1). (3) Provide instructions in text or video form (response to barriers 1, 2, 3 and 5). (4) Involve farmers, farm advisors and researchers in the further development or validation of tools and take their advice and suggestions for improvement into account (response to barriers 1, 4 and 5). (5) Offer a free, limited trial version if the DSS is chargeable (response to barriers 1, 2, 3, 4 and 5). (6) Ensure that the user interface is easy to use (response to barriers 3 and 5). User experience could be improved in combination with (7) minimising the manual input of data that can be automatically obtained (e.g., weather data), (8) by allowing the input of field observation data without internet access (for DSSs running on mobile phones and tablets) and (9) by translating the DSS into the local language or providing a translation into a language commonly spoken/understood by users in that country (response to barrier 5). (10) Consider integrating your DSS with existing platforms in your region (e.g., the IPM Decisions platform across Europe, or ISIP in Germany or VIPS in Norway) (response to barriers 5 and 7). (11) Organise DSS workshops for farm advisors and researchers and offer them the opportunity to run or collaborate in DSS workshops for farmers (response to barriers 6 and 7). (12) Encourage users to share positive experiences with other farmers, farm advisors or researchers (response to barrier 7). (13) Provide transparent descriptions of the characteristics and requirements of the DSS so that users can compare it with other DSSs and choose the one that suits them best (e.g., IPM Adviser) (response to barrier 7). Finally, (14) consider developing DSSs for poorly supported sectors and their needs (e.g., viticulture, vegetables, hops, olives and other fruits) (response to barrier 8). These general recommendations can be more broadly applied to the wider development of online resources supporting European advisors.
4. Discussion
Organising workshops in 11 national languages in 11 countries, which should be as uniform as possible, is an organisationally and logistically complex task, requiring careful coordination between the workshop organisers in each country. Through this coordination, a robust methodology was refined and adopted for this research. Numerous aspects of the workshops were considered, including which topics to include in the questionnaire [5,19,20,48,49,50,51], advantages and disadvantages of questionnaire design [52] and the invitation strategy [20,38]; everything was adjusted to serve the purpose of the research and provide quality data for analysis while at the same time reducing or avoiding bias. Furthermore, the data analyses were conducted in a way that ensures high reliability of the results from a relatively small sample size [20]. Analysing the distribution of demographic characteristics and the distribution of respondents’ experiences with DSSs showed that we captured considerable variability among participants (Section 3.1). Additional measures were taken to further justify the relevance of our conclusions: A statistical analysis was conducted, which confirmed statistically significant (p < 0.05) differences between the different clusters for all attributes included in the decision trees (Figure 2, Table 4, Figure 3 and Table 5). In addition, a comparison of the different groups ((1) farmers and (2) ARDs) was avoided due to the different number and structure of respondents. This comparison was only made in Figure 4, which shows all of the respondents’ answers to one section of the questionnaire. Caution was exercised when interpreting the majority responses of the individual groups (Table 6 and Table 7) and a high threshold value (60%) was set to ensure that the presented results are as reliable as possible.
Despite all of the measures taken, survey studies are unavoidably subject to some form of inaccuracy or bias due to the uniqueness of respondent’s previous experiences and personal bias in favour of or against the research topic, in our case, decision support systems. In this work, the location, timing, promotion, and implementation of the workshops were designed to minimise any bias in the socio-economic diversity of attendees, and this process was reviewed and approved by the projects ethics committee prior to the surveys being conducted. Feedback from national workshop leads suggested that attendance was nationally representative, though individual regional attendance may not represent that of other regions. Therefore, the underrepresentation of some groups in different regions is difficult to separate from regional agricultural characteristics of agricultural communities in the participating countries (e.g., farm size). It is nevertheless important to point out that the classification trees and all interpretations presented in this study, although statistically significant, explain with great accuracy only the variability of responses in our sample. This provides us with an important fundamental insight on the basis of which assumptions can be made for the whole of Europe. Further research extending this work at a national level, or by larger pan-European research institutions or statistical agencies (e.g., Joint Research Centre, Eurostat and FAO) with greater access to respondents and higher human and financial resources could upgrade this research. Such validation at a greater scale would support the development of more detailed national and/or international policy guidelines to further facilitate the adoption of IPM DSSs across Europe.
Several studies have attempted to identify the reasons for the low uptake of DSSs in agriculture and proposed different ways and general solutions to overcome them [5,19,48,49,50,51], including a recent study [20] that led to the identification of region-specific barriers to the adoption of DSSs separately for farmers and farm advisors. In this work [20], respondents were asked to assess barriers while the solutions to the identified barriers had been provided by the authors. In the present study, which followed on from the previous work, we opted for a closed-ended questionnaire and offered respondents a range of more specific possible solutions to overcome the barriers to DSS adoption identified in the literature. The main advantage of this novel approach, compared with the previous approach, is that here we can identify specific solutions to a particular barrier that have the most support from farmers, farm advisors and researchers and therefore have the greatest potential to impact the IPM DSS adoption rate among them in IPM, and more broadly in the agricultural sector across Europe.
For both (1) farmers and (2) farm advisors, researchers and DSS developers (ARDs) across 11 European countries, farm size plays the most important role in classification into clusters. This can be explained by the fact that farms of different sizes have different needs and expectations of a DSS. Although most DSSs provide decision support regardless of field/farm size, decisions are made differently on farms of different sizes [53], which also affects approaches to overcoming barriers to DSS adoption. The outcome of a poor pest management decision on an individual farm business in terms of the loss of quality and/or quantity of yield will impact small, medium and large businesses in different way, and so the role of DSSs changes between these groups.
Although a previous study found differences between European regions (Northern, Central and Southern Europe) in terms of barriers to DSS adoption [20], this study found no significant differences at a regional level in terms of the best approach to overcoming these barriers. The questionnaire analysis identified several approaches or measures to overcome the barriers to DSS uptake, which were also confirmed in the literature. For example, the importance of the user-friendliness of DSSs in agriculture is recognised and underlined with several other proposed DSS structures [6,30,32]. The willingness of farmers to pay for DSSs is low [20,30], although it has been demonstrated several times that DSSs can improve the profitability of production [7,8,17]. This is consistent with the findings of this study and is supported by the majority response in both groups that the free basic version of a DSS is best for them and that they prefer this to an advanced DSS that can be purchased through a grant and includes all of the technical support required to use it. However, this response needs to be considered in context, as it can be explained by the respondents’ previous experience with DSSs, as many of them had little or no experience of using a DSS. The willingness to pay generally increases the more experience the user has with DSSs [54]. Some of the technical limitations of DSSs were also reported by farm advisors, namely the lack of high-speed internet in all clients’ fields, which is a problem as the input of data from field observations is dependent on internet access [20]. To overcome this barrier, it is proposed to reduce the dependence on the internet and allow some data (e.g., pest observations) to be entered offline, so that internet access is only required to run the DSS. This solution is only applicable to DSSs that do not run as a web application via an internet browser. Once again, the involvement of end users in the development of DSSs has proven to be crucial, as already emphasised in several research papers [5,12,49,55], as it at least partially addresses several identified barriers simultaneously (Section 3.5). The results of this study show that the majority of respondents, regardless of their role or categorisation in the clusters, were willing to participate in the development of new DSSs or the validation of existing DSSs, encouraging DSS developers to engage with their target users.
The implementation of some of the proposed approaches harbours their own challenges. For example, as part of the EU project IPM Decisions, we considered some of the solutions proposed in this paper, such as the preferred duration, format and location of the workshops. The recruitment of farmers and advisors to participate in workshops is challenging, especially where a representative cross section of the people is needed, and even more so where the inclusion of currently unengaged individuals is valuable to the purpose of the work. Some of the proposed solutions are associated with financial costs to DSS researchers and developers, which may affect their business model and expected revenue. If free trial versions are offered as a way of promoting uptake, the challenge of the conversion rate to a paid version and the user’s commitment to use the DSS also needs to be factored into business models [56,57]. Given the numerous financial implications of the proposed measures for DSS developers, the introduction of subsidies or grants for the use of or subscription to DSSs is one of the key approaches to overcoming the barriers to DSS adoption. It could be argued that subsidies disproportionately benefit large farms [58]; however, large farms are also more likely to progress to more advanced and often paid-for DSSs. Subsidies for DSS research, development and trial access would help DSS developers to reduce the burden of supporting free software on developers while encouraging the use of IPM DSSs. In addition, this would also help achieve the goal of the digitalisation and modernisation of farm management and decision-making, as well as the environmental benefits through the reduced risk and use of pesticides while simultaneously reducing pesticide exposure for farmers and consumers. These objectives have also been recognised as important by the EU Commission in various strategies such as the European Green Deal [22], the Biodiversity Strategy [24], the Farm to Fork Strategy [23] and the Strategy for Shaping Europe’s Digital Future [59]. The EU Commission has funded or is currently funding several projects to improve knowledge sharing and promote the uptake of innovation in agriculture through networks and demonstrations. This includes raising end-user awareness of the benefits of using DSSs (e.g., NEFERTITI [60]), facilitating the use of already developed DSSs across Europe, while highlighting their advantages (e.g., IPM Decisions [61]), promoting digitalisation in agriculture (e.g., DEMETER [62]), developing new DSSs for use in agriculture (e.g., AFarCloud [63]) and validating existing DSSs in agriculture (e.g., Fairway [64]). In addition, according to the IPM Adviser web tool [35], 39% of the 79 described DSSs for IPM are available free of charge, another 34% offer a limited free version or are available free of charge for certain user groups (e.g., farmers from a specific country) and only 27% are not free and do not offer a free trial version (as of 24 January 2025).
5. Conclusions
This study primarily identified the best approaches for overcoming barriers to DSS adoption in 11 European counties with possible implications for other countries within Europe experiencing similar barriers to DSS adoption.
These results were obtained by using the methodology developed by Marinko et al. [20], thus confirming its applicability in qualitative studies (questionnaire analysis).
The proposed measures for farmers, farm advisors and researchers provide tangible solutions to overcome barriers to DSS adoption. Fourteen specific actions listed for DSS developers support the future development of IPM DSSs and other DSSs for use in agriculture. They also promote opportunities for integration with broader platforms supporting advisory services, ensuring a higher potential for adoption by farmers, farm advisors and researchers. A greater uptake of IPM DSSs will help reduce the use of pesticides, mitigate the impact of agriculture on the environment and contribute to achieving the goals set out in the European strategies mentioned above [22,23,24,59].
Further research is needed to confirm the results of this study across Europe and worldwide. DSS developers adopting the proposed 14 general measures will facilitate an increased adoption of DSSs in the agricultural sector, promote transparency, and establish the quality criteria needed to build trust among farmers and their advisors.
Author Contributions
Conceptualization, J.M. and M.D.; methodology, J.M., M.D. and V.K.; validation, J.M.; formal analysis J.M.; investigation, J.M.; resources, M.D.; data curation, J.M.; writing—original draft preparation, J.M., M.D. and V.K.; writing—review and editing, J.M., M.D. and M.R.; visualization, J.M.; supervision, M.D.; project administration, M.D.; funding acquisition, M.D. and M.R. All authors have read and agreed to the published version of the manuscript.
Funding
This study was conducted as part of the European project IPM Decisions, and in collaboration with the European project AdvisoryNetPEST. IPM Decisions has received funding from the European Research Council (ERC) under the European Union’s Horizon 2020 research and innovation programme (grant agreement 817617) and was supported by the Slovenian Research and Innovation Agency (ARIS), (grant P2-0103). AdvisoryNetPEST has received funding from the ERC under the European Union’s Horizon Europe research and innovation programme (grant agreement 101134122) and UK Research and Innovation (grant agreement 10098938).
Institutional Review Board Statement
The data were collected in accordance with Article 14 of the model grant agreement, and a self-assessment ethics assessment was undertaken prior to surveys and workshops, including the completion of an Ethics Issues Table. No further ethics approvals were required as all participants were over 18 years old; no sensitive data were collected; the data were pseudonymized and the analysis was independent of personal data. The surveys were reviewed and overseen by the IPM Decisions Ethics Board, chaired by an independent chair. All relevant activities respected European and national laws, and ethics approval was obtained by relevant institutional and/or national parties as required. Written informed consent was obtained from all participants.
Data Availability Statement
The data presented in this study are available on Zenodo: https://doi.org/10.5281/zenodo.10217188.
Acknowledgments
We would like to thank the workshop facilitators of the IPM decisions project who organised workshops across Europe and the workshop participants for their participation in the workshops and their responses to the questionnaire. We would also like to thank Lenka Trdina from the Jožef Stefan Institute for her help with the graphic editing of the figures in this article.
Conflicts of Interest
The authors declare no conflicts of interest. The funders had no role in the design of the study; in the collection, analyses, or interpretation of data; in the writing of the manuscript or in the decision to publish the results.
Appendix A. Online Questionnaire for Workshop Participants
Table A1.
Informed consent for all participants of the workshops.
Table A1.
Informed consent for all participants of the workshops.
| Question No. | Question | Answer Options | |
|---|---|---|---|
| a | b | ||
| 1 | To proceed with the survey please read carefully the following sentences and tick the relevant boxes as appropriate. I understand that my participation is voluntary and I am free to withdraw at any time, without giving a reason and with no foreseeable consequences. I agree that the data gathered in this study may be stored (after being anonymized) in a secure storage facility and will be destroyed five years after the study ends. I confirm that I have read and understood the terms and conditions and I agree to take part in this study. | I agree | I do not agree |
If the respondents answered “I agree”, they continued with the questionnaire, otherwise the survey was finished. All respondents agreed and continued answering the questionnaire (Table A2).
Table A2.
Section 1 of the questionnaire for all respondents who gave their consent to be included in the study.
Table A2.
Section 1 of the questionnaire for all respondents who gave their consent to be included in the study.
| Question No. | Question | Answer Options | |||||
|---|---|---|---|---|---|---|---|
| a | b | c | d | e | f | ||
| 2 | Which country are you from? 1 | ||||||
| 3 | Which age group do you belong to? | 18–34 | 35–59 | 60 or more | |||
| 4 | Which gender are you? | Male | Female | Non-binary | I prefer not to say | ||
| 5 | What is the highest level of education you have attained? | Vocational qualification or High school degree or Bachelor’s degree | Master’s degree or PhD | Other | |||
| 6 | What is the size of your farm/the farms of your customers’/your study farm? | 0–10 ha | 11–30 ha | 31–60 ha | > 60 ha | ||
| 7 | Which is the predominant crop type on your farm? (only one answer possible) | Arable crops, hops | Orchards, olive trees | Vineyards | Vegetables | Ornamental plants (flowers…) | Mixed (e.g., livestock and arable crops, etc.) |
| 8 | How experienced are you in using decision support systems (DSSs)? | I have no experience—I have never tried using a DSS | Less experienced—I have tried a DSS but do not use it | Experienced user—I use a DSS regularly | Very experienced user—I use a DSS very often and am familiar with a wider range of tools | ||
| 9 | Are you a farmer? | Yes | No | ||||
1 Possible response options for this question were all European countries and the answer “other” with the possibility to write an answer.
Table A3.
Section 2 of the questionnaire for those who answered “Yes” to question No. 9 (Farmers).
Table A3.
Section 2 of the questionnaire for those who answered “Yes” to question No. 9 (Farmers).
| Question No. | Question | Answer Options | |||
|---|---|---|---|---|---|
| a | b | c | d | ||
| 10.1 | Would you benefit from attending a DSS training workshop? | I would benefit a lot from training | I would benefit moderately from training | I would benefit less from training | |
| 11.1 | What would you expect to see in a DSS training workshop? | Introductory lectures about decision support systems. (For example: What are DSSs and what is their role in IPM, technical requirements…) | An overview of existing DSSs for your region. (For example, introduction to a set of available DSSs, their benefits and limitations and examples of good practice) | Demonstration of DSSs with examples of good practice. (For example, how to choose the most appropriate DSS and how to use it) | |
| 12.1 | I would like to attend the DSS training workshop: | Online | At my own farm or a farm nearby (in person) | At the developer’s headquarters, consultancy, research institution, etc. | At an agricultural fair |
| 13.1 | What should be the length of the training workshop? | Short review workshop (1–2 h) | A more detailed half-day workshop (3–5 h) | Full-day or multi-day workshop (6–15 h) | |
| 14.1 | Would you be willing to pay to attend an educational workshop about DSSs? | Yes, regardless of the duration of the workshop | Yes, but only for full-day or multi-day workshops | No | |
| 15.1 | Which proof of the reliability of the DSS is acceptable to you? | Confidence in the developers of the DSS (presentation materials about the DSS, information on the website) | Personal recommendations from farmers, agricultural advisors and other users of the DSS | Only proven reliability in a concrete example (demonstration workshop) | |
| 16.1 | What level of detail of the results of the DSS is the most trustworthy to you? | General assessment of the risk of crop damage | Specific description of the risk assessment of crop damage and proposed risk mitigation measures | A very detailed description of the risk assessment of crop damage and proposed risk mitigation measures | |
| 17.1 | How would you prefer to access general information about a DSS? | Personal discussion with agricultural advisors or DSS developers | Demonstration workshops and trainings (examples of good practice) | Media (articles in agricultural magazines, social networks, TV programmes, …) | |
| 18.1 | What kind of support for choosing the most suitable DSS would you use? | Reviews and rankings published in the media (social networks, web, magazines, TV…) | Personal recommendation from an agricultural advisor or DSS developer | My own search through the catalogue with descriptions of the features of existing DSSs | |
| 19.1 | How would you like to begin using a selected DSS for the first time? | Individually, with guidance in the form of text or video and without the help of technical support | Individually, with technical support (consultant, DSS developer) | In group training workshops (in a group with other farmers) | |
| 20.1 | What encourages you the most to begin using new digital support services (such as pest risk notifications, weather forecast, drought warning, or DSSs)? | Personal recommendation from a farmer or farm advisor | Demonstrations of the usefulness of the new technologies through practical examples (farms, fairs, workshops…) | Demonstrations of the usefulness of new technologies in the media (social networks, web, magazines, TV…) | |
| 21.1 | How do you like to be introduced to new digital support services including DSSs? | Individually, with instructions in text or video format and without technical support | Individually, with the help of technical support (consultant, developer) | In group training workshops (in a group with other farmers) | |
| 22.1 | Which is the most appropriate form of DSS for your needs? | Free basic version of the DSS with easy to understand instructions in text or video format | A more advanced DSS, which can be obtained through a grant and includes all the technical support required to use it | ||
| 23.1 | Would you be willing to participate in the calibration of already developed DSSs in order to use them on your farm and/or farms in your area? | Yes | No | ||
| 24.1 | Would you be willing to participate in the development of new DSSs that take into account the characteristics of your farm and/or farms in your area? | Yes | No | ||
| 25.1 | How would you prefer to deal with multiple pests occurring simultaneously on your fields? | By using several individual DSSs, one DSS per pest | By using one DSS for several pests at the same time. | ||
Table A4.
Section 2 of the questionnaire for those who answered “No” to question No. 9 (farm advisors, researchers and/or DSS developers).
Table A4.
Section 2 of the questionnaire for those who answered “No” to question No. 9 (farm advisors, researchers and/or DSS developers).
| Question No. | Question | Answer Options | |||
|---|---|---|---|---|---|
| a | b | c | d | ||
| 10.2 | Are you a (Multiple answers possible!) | Farm advisor | Researcher | DSS developer | |
| 11.2 | How would you prefer to access general information on DSSs? | Personal discussion with DSS developers | Demonstration workshops and training (examples of good practice) | Media (articles in agricultural magazines, social networks, TV programmes…) | |
| 12.2 | What kind of support for choosing the most suitable DSS would you use? | Reviews and rankings published in the media (social networks, web, magazines, TV…) | Personal recommendations from the DSS developer | My own search through the catalogue with descriptions of the features of existing DSSs | |
| 13.2 | Would you benefit from attending a DSS training workshop? | I would benefit a lot from training | I would benefit moderately from training | I would benefit less from training | |
| 14.2 | What would you expect to see at a DSS training workshop? | Introductory lectures about decision support systems. (For example, what are DSSs and what is their role in IPM, technical requirements…) | An overview of existing DSSs for your region. (For example, introduction to a set of available DSSs, their benefits and limitations and examples of good practice) | Demonstration of DSSs with examples of good practice. (For example, how to choose the most appropriate DSS and how to use it) | |
| 15.2 | I would prefer to attend the DSS training workshop: | Online | At one or more of my clients’ farms (in person) | At the headquarters of the developer, consultancy, research institution, etc. | At an agricultural fair |
| 16.2 | What should be the length of the training workshop? | Short review workshop (1–2 h) | A more detailed half-day workshop (3–5 h) | Full-day or multi-day course (6–15 h) | |
| 17.2 | Would you be willing to pay to attend an educational workshop about DSSs? | Yes, regardless of the duration of the workshop | Yes, but only for full-day or multi-day workshop | No | |
| 18.2 | Would you be willing to conduct training workshops about DSSs for farmers? | Yes | No | ||
| 19.2 | What encourages you the most to use the new digital support services (such as pest risk notifications, weather forecast, drought warning, or DSSs)? | Personal recommendation from other farm advisors or DSS developers | Demonstrations of the usefulness of the new technologies through practical examples (farms, fairs, workshops…) | Demonstrations of the usefulness of new technologies in the media (social networks, web, magazines, TV…) | |
| 20.2 | How do you like to get familiar with new digital support services? | Individually, with instruction in text or video format and without technical support | Individually, with technical support from DSS developers | In group training workshops (in a group with other agricultural advisors) | |
| 21.2 | Which is the most appropriate form of DSS for your needs? | A free basic version of the DSS with easy to understand instructions in text or video format | A more advanced DSS, which can be obtained through a grant and includes all the technical support required to use it | ||
| 22.2 | Would you be willing to participate in the calibration of already developed DSSs in order to use them on your client’s/study farms? | Yes | No | ||
| 23.2 | Would you be willing to participate in the development of new DSSs that take into account the characteristics of your client’s/study farms? | Yes | No | ||
| 24.2 | How would you prefer to deal with multiple pests occurring simultaneously in your client’s/study fields? | By using several individual DSSs, one DSS per pest | By using one DSS for several pests at the same time. | ||
Table A5.
Section 3 of the questionnaire for all respondents: DSS characteristics. Questions in this section were not mandatory.
Table A5.
Section 3 of the questionnaire for all respondents: DSS characteristics. Questions in this section were not mandatory.
| Question No. | Question | Answer Options | ||
|---|---|---|---|---|
| a | b | c | ||
| A1 | Would you use a DSS that was tested for use in your country but developed in a foreign country? | Yes, if I understand the language of the DSS (a foreign language, that I understand) | Yes, but only if a DSS is available in my national language | No |
| A2 | Would you use a DSS that requires manual input of weather data? | Yes | No | |
| A3 | Would you use a DSS that requires manual input of data from the field (e.g., presence of pests)? | Yes | No | |
| A4 | Would you use a DSS that has an obligatory requirement for an internet connection? (For both, its operation and field data entry) | Yes | No | |
| A5 | Does the DSS have to enable the entering of field data without an internet connection? (Operation and outputs from DSS are available only when you have internet connection) | Yes | No | |
References
- Shukla, P.R.; Skeg, J.; Buendia, E.C.; Masson-Delmotte, V.; Pörtner, H.-O.; Roberts, D.; Zhai, P.; Slade, R.; Connors, S.; Van Diemen, S. Climate Change and Land: An IPCC Special Report on Climate Change, Desertification, Land Degradation, Sustainable Land Management, Food Security, and Greenhouse Gas Fluxes in Terrestrial Ecosystems; IPCC: Geneva, Switzerland, 2019; p. 864. [Google Scholar]
- Skendžić, S.; Zovko, M.; Živković, I.P.; Lešić, V.; Lemić, D. The impact of climate change on agricultural insect pests. Insects 2021, 12, 440. [Google Scholar] [CrossRef] [PubMed]
- Damos, P. Modular structure of web-based decision support systems for integrated pest management. A review. Agron. Sustain. Dev. 2015, 35, 1347–1372. [Google Scholar] [CrossRef]
- Bazán-Vera, W.; Bermeo-Almeida, O.; Samaniego-Cobo, T.; Alarcon-Salvatierra, A.; Rodríguez-Méndez, A.; Bazán-Vera, V. The Current State and Effects of Agromatic: A Systematic Literature Review. In Proceedings of the Technologies and Innovation: Third International Conference, CITI 2017, Guayaquil, Ecuador, 24–27 October 2017; pp. 269–281. [Google Scholar]
- Rossi, V.; Sperandio, G.; Caffi, T.; Simonetto, A.; Gilioli, G. Critical success factors for the adoption of decision tools in IPM. Agronomy 2019, 9, 710. [Google Scholar] [CrossRef]
- Tonle, F.B.; Niassy, S.; Ndadji, M.M.; Tchendji, M.T.; Nzeukou, A.; Mudereri, B.T.; Senagi, K.; Tonnang, H.E. A road map for developing novel decision support system (DSS) for disseminating integrated pest management (IPM) technologies. Comput. Electron. Agric. 2024, 217, 108526. [Google Scholar] [CrossRef]
- Lázaro, E.; Makowski, D.; Vicent, A. Decision support systems halve fungicide use compared to calendar-based strategies without increasing disease risk. Commun. Earth Environ. 2021, 2, 224. [Google Scholar] [CrossRef]
- Caffi, T.; Rossi, V.; Bugiani, R. Evaluation of a warning system for controlling primary infections of grapevine downy mildew. Plant Dis. 2010, 94, 709–716. [Google Scholar] [CrossRef] [PubMed]
- Johnen, A.; Meier, H. A weather-based decision support system for managing oilseed rape pests. In Proceedings of the Brighton Crop Protection Conference Pests and Diseases, Brighton, UK, 13–16 November 2000; pp. 793–800. [Google Scholar]
- Jones, V.P.; Brunner, J.F.; Grove, G.G.; Petit, B.; Tangren, G.V.; Jones, W.E. A web-based decision support system to enhance IPM programs in Washington tree fruit. Pest Manag. Sci. Former. Pestic. Sci. 2010, 66, 587–595. [Google Scholar] [CrossRef]
- Caffi, T.; Legler, S.E.; Rossi, V.; Bugiani, R. Evaluation of a warning system for early-season control of grapevine powdery mildew. Plant Dis. 2012, 96, 104–110. [Google Scholar] [CrossRef]
- Rossi, V.; Salinari, F.; Poni, S.; Caffi, T.; Bettati, T. Addressing the implementation problem in agricultural decision support systems: The example of vite. net®. Comput. Electron. Agric. 2014, 100, 88–99. [Google Scholar] [CrossRef]
- Kanatas, P.; Travlos, I.S.; Gazoulis, I.; Tataridas, A.; Tsekoura, A.; Antonopoulos, N. Benefits and limitations of decision support systems (DSS) with a special emphasis on weeds. Agronomy 2020, 10, 548. [Google Scholar] [CrossRef]
- Demirel, M.; Kumral, N.A. Artificial intelligence in integrated pest management. In Artificial Intelligence and IoT-Based Technologies for Sustainable Farming and Smart Agriculture; IGI Global: Hershey, PA, USA, 2021; pp. 289–313. [Google Scholar]
- Maraveas, C. Incorporating artificial intelligence technology in smart greenhouses: Current state of the art. Appl. Sci. 2023, 13, 14. [Google Scholar] [CrossRef]
- Marinko, J.; Blažica, B.; Jørgensen, L.N.; Matzen, N.; Ramsden, M.; Debeljak, M. Typology for decision support systems in integrated pest management and its implementation as a web application. Agronomy 2024, 14, 485. [Google Scholar] [CrossRef]
- Pertot, I.; Caffi, T.; Rossi, V.; Mugnai, L.; Hoffmann, C.; Grando, M.S.; Gary, C.; Lafond, D.; Duso, C.; Thiery, D. A critical review of plant protection tools for reducing pesticide use on grapevine and new perspectives for the implementation of IPM in viticulture. Crop Prot. 2017, 97, 70–84. [Google Scholar] [CrossRef]
- Di Guardo, A.; Capri, E.; Calliera, M.; Finizio, A. MIMERA: An online tool for the sustainable pesticide use at field scale. Sci. Total Environ. 2022, 846, 157285. [Google Scholar] [CrossRef] [PubMed]
- Gent, D.H.; De Wolf, E.; Pethybridge, S.J. Perceptions of risk, risk aversion, and barriers to adoption of decision support systems and integrated pest management: An introduction. Phytopathology 2011, 101, 640–643. [Google Scholar] [CrossRef]
- Marinko, J.; Ivanovska, A.; Marzidovšek, M.; Ramsden, M.; Debeljak, M. Incentives and barriers to adoption of decision support systems in integrated pest management among farmers and farm advisors in Europe. Int. J. Pest Manag. 2023, 1–18. [Google Scholar] [CrossRef]
- Nitzko, S.; Bahrs, E.; Spiller, A. Consumer willingness to pay for pesticide-free food products with different processing degrees: Does additional information on cultivation have an influence? Farming Syst. 2024, 2, 100059. [Google Scholar] [CrossRef]
- EU Commission. The European Green Deal, COM(2019) 640 final. In Communication from the Commission to the European Parliament, the European Council, the Council, the European Economic and Social Committee and the Committee of the Regions; EU Commission: Brussels, Belgium, 2019. [Google Scholar]
- EU Commission. Farm to fork strategy: For a fair, healthy and environmentally-friendly food system, COM(2020) 381 final. In Communication from the Commission to the European Parliament, the Council, the European Economic and Social Committee and the Committee of the Regions; EU Commission: Brussels, Belgium, 2020. [Google Scholar]
- EU Commission. EU Commission. EU Biodiversity Strategy for 2030 Bringing nature back into our lives, COM(2020) 380 final. In Communication from the Commission to the European Parliament, the Council, the European Economic and Social Committee and the Committee of the Regions; EU Commission: Brussels, Belgium, 2020. [Google Scholar]
- EU Parliament. Directive 2009/128/EC of the European Parliament and of the Council of 21 October 2009 establishing a framework for Community action to achieve the sustainable use of pesticides. Off. J. Eur. Union 2009, 309, 71–86. [Google Scholar]
- EU Commission. Report from the Commission to the European Parliament and the Council on Member State National Actions Plans and on Progress in the Implementation of Directive 2009/128/EC on Sustainable Use of Pesticides Brussels, COM (2017) 587 Final; EU Commission: Brussels, Belgium, 2017. [Google Scholar]
- EU Commission. Report from the Commission to the European Parliament and the Council on the Experience Gained by Member States on the Implementation of National Targets Established in Their National Action Plans and on Progress in the Implementation of Directive 2009/128/EC on the Sustainable Use of Pesticides, COM (2020) 204 Final; EU Commission: Brussels, Belgium, 2020; p. 19. [Google Scholar]
- EU Commission. Proposal for a Regulation of the European Parliament and of the Council on the Sustainable Use of Plant Protection Products and Amending Regulation (EU) 2021/2115, COM (2022) 305 Final; EU Commission: Brussels, Belgium, 2022. [Google Scholar]
- Craheix, D.; Bergez, J.-E.; Angevin, F.; Bockstaller, C.; Bohanec, M.; Colomb, B.; Doré, T.; Fortino, G.; Guichard, L.; Pelzer, E.; et al. Guidelines to design models assessing agricultural sustainability, based upon feedbacks from the DEXi decision support system. Agron. Sustain. Dev. 2015, 35, 1431–1447. [Google Scholar] [CrossRef]
- Rose, D.C.; Sutherland, W.J.; Parker, C.; Lobley, M.; Winter, M.; Morris, C.; Twining, S.; Ffoulkes, C.; Amano, T.; Dicks, L.V. Decision support tools for agriculture: Towards effective design and delivery. Agric. Syst. 2016, 149, 165–174. [Google Scholar] [CrossRef]
- Rose, D.C.; Parker, C.; Fodery, J.; Park, C.; Sutherland, W.J.; Dicks, L.V. Involving stakeholders in agricultural decision support systems: Improving user-centred design. Int. J. Agric. Manag. 2018, 6, 80–89. [Google Scholar] [CrossRef]
- Pechlivani, E.M.; Gkogkos, G.; Giakoumoglou, N.; Hadjigeorgiou, I.; Tzovaras, D. Towards Sustainable Farming: A Robust Decision Support System’s Architecture for Agriculture 4.0. In Proceedings of the 2023 24th International Conference on Digital Signal Processing (DSP), Rhodes, Greece, 11–13 June 2023; pp. 1–5. [Google Scholar]
- Singh, N.; Gupta, N. ICT based decision support systems for Integrated Pest Management (IPM) in India: A review. Agric. Rev. 2016, 37, 309–316. [Google Scholar] [CrossRef]
- Wallhead, M.; Zhu, H. Decision support systems for plant disease and insect management in commercial nurseries in the Midwest: A perspective review. J. Environ. Hortic. 2017, 35, 84–92. [Google Scholar] [CrossRef]
- IPM Adviser: Online Tool for Selection and Comparisson of Decision Support Systems in Integrated Pest Management in Europe. Available online: https://ipmadviser.ijs.si/ (accessed on 23 January 2025).
- IPM Decisions Platform: A “One-Stop Shop” for Decision Support in Integrated Pest Management. Available online: https://www.platform.ipmdecisions.net/ (accessed on 12 December 2024).
- Metzger, M.J.; Bunce, R.G.H.; Jongman, R.H.; Mücher, C.A.; Watkins, J.W. A climatic stratification of the environment of Europe. Glob. Ecol. Biogeogr. 2005, 14, 549–563. [Google Scholar] [CrossRef]
- Daniel, E.; Tafida, A.M.; Abubakar, S.A.; Abdulrahman, A.O.; Abubakar, S.O. Sampling bias and its implications for research validity. Afr. J. Soc. Behav. Sci. 2024, 14, 4181–4193. [Google Scholar]
- McInnes, L.; Healy, J.; Melville, J. Umap: Uniform manifold approximation and projection for dimension reduction. arXiv 2018, arXiv:1802.03426. [Google Scholar] [CrossRef]
- MacQueen, J. Some methods for classification and analysis of multivariate observations. In Proceedings of the 5th Berkeley Symposium on Mathematical Statistics and Probability, Berkeley, CA, USA, 18–21 July 1965 and 27 December 1965–7 January 1966; University of California Press: Berkeley, CA, USA, 1967; pp. 281–297. [Google Scholar]
- Campello, R.J.; Moulavi, D.; Sander, J. Density-based clustering based on hierarchical density estimates. In Proceedings of the Pacific-Asia Conference on Knowledge Discovery and Data Mining, Gold Coast, Australia, 14–17 April 2013; pp. 160–172. [Google Scholar]
- Ben-David, S.; Ackerman, M. Measures of clustering quality: A working set of axioms for clustering. Adv. Neural Inf. Process. Syst. 2008, 21, 1–8. [Google Scholar]
- Quinlan, J.R. C4.5: Programs for Machine Learning; Morgan Kaufmann Publishers: San Mateo, CA, USA, 1993. [Google Scholar]
- Frank, E.; Hall, M.A.; Witten, I.H. The WEKA workbench. In Online Appendix for Data Mining: Practical Machine Learning Tools and Techniques; Morgan Kaufmann Publishers: San Francisco, CA, USA, 2016. [Google Scholar]
- Witten, I.; Frank, E.; Hall, M.; Pal, C. Data Mining Fourth Edition: Practical Machine Learning Tools and Techniques; Morgan Kaufmann Publishers Inc.: San Francisco, CA, USA, 2016. [Google Scholar]
- Zou, K.H.; Fielding, J.R.; Silverman, S.G.; Tempany, C.M. Hypothesis testing I: Proportions. Radiology 2003, 226, 609–613. [Google Scholar] [CrossRef] [PubMed]
- Zar, J. Biostatistical Analysis, 5th ed.; Prentice-Hall/Pearson: Upper Saddle River, NJ, USA, 2010; 944p. [Google Scholar]
- Ara, I.; Turner, L.; Harrison, M.T.; Monjardino, M.; DeVoil, P.; Rodriguez, D. Application, adoption and opportunities for improving decision support systems in irrigated agriculture: A review. Agric. Water Manag. 2021, 257, 107161. [Google Scholar] [CrossRef]
- Jørgensen, L.N.; Noe, E.; Nielsen, G.C.; Jensen, J.E.; Ørum, J.E.; Pinnschmidt, H.O. Problems with disseminating information on disease control in wheat and barley to farmers. Eur. J. Plant Pathol. 2008, 121, 303–312. [Google Scholar] [CrossRef][Green Version]
- Rossi, V.; Caffi, T.; Salinari, F. Helping farmers face the increasing complexity of decision-making for crop protection. Phytopathol. Mediterr. 2012, 51, 457–479. [Google Scholar]
- Shtienberg, D. Will decision-support systems be widely used for the management of plant diseases? Annu. Rev. Phytopathol. 2013, 51, 1–16. [Google Scholar] [CrossRef] [PubMed]
- Dalati, S.; Marx Gómez, J. Surveys and Questionnaires. In Modernizing the Academic Teaching and Research Environment: Methodologies and Cases in Business Research; Marx Gómez, J., Mouselli, S., Eds.; Springer International Publishing: Cham, Switzerland, 2018; pp. 175–186. [Google Scholar]
- Taramuel-Taramuel, J.P.; Montoya-Restrepo, I.A.; Barrios, D. Drivers linking farmers’ decision-making with farm performance: A systematic review and future research agenda. Heliyon 2023, 9, e20820. [Google Scholar] [CrossRef] [PubMed]
- Akaka, J.; García-Gallego, A.; Georgantzis, N.; Tisserand, J.; Vasileiou, E.; Ramsden, M. Decision support systems adoption in pesticide management [version 2; peer review: 2 approved, 2 approved with reservations]. Open Res. Eur. 2024, 4, 142. [Google Scholar] [CrossRef] [PubMed]
- Oliver, D.M.; Fish, R.D.; Winter, M.; Hodgson, C.J.; Heathwaite, A.L.; Chadwick, D.R. Valuing local knowledge as a source of expert data: Farmer engagement and the design of decision support systems. Environ. Model. Softw. 2012, 36, 76–85. [Google Scholar] [CrossRef]
- Koch, O.F.; Benlian, A. The effect of free sampling strategies on freemium conversion rates. Electron. Mark. 2017, 27, 67–76. [Google Scholar] [CrossRef]
- Li, H. Converting free users to paid subscribers in the SaaS context: The impact of marketing touchpoints, message content, and usage. Prod. Oper. Manag. 2022, 31, 2185–2203. [Google Scholar] [CrossRef]
- Key, N.; Roberts, M.J. Government payments and farm business survival. Am. J. Agric. Econ. 2006, 88, 382–392. [Google Scholar] [CrossRef]
- EU Commission. Shaping Europe’s digital future, COM(2020) 67 final. In Communication from the Commission to the European Parliament, the Council, the European Economic and Social Committee and the Committee of the Regions; EU Commission: Brussels, Belgium, 2020. [Google Scholar]
- Networking European Farms to Enhance Cross Fertilisation And Innovation Uptake Through Demonstration. Available online: https://cordis.europa.eu/project/id/772705 (accessed on 23 January 2025).
- Stepping-up IPM Decision Support for Crop Protection. Available online: https://cordis.europa.eu/project/id/817617 (accessed on 23 January 2025).
- Building an Interoperable, Data-Driven, Innovative and Sustainable European Agri-Food Sector. Available online: https://cordis.europa.eu/project/id/857202 (accessed on 23 January 2025).
- Aggregate Farming in the Cloud. Available online: https://cordis.europa.eu/project/id/783221 (accessed on 23 January 2025).
- Farm Systems That Produce Good Water Quality for Drinking Water Supplies. Available online: https://cordis.europa.eu/project/id/727984 (accessed on 23 January 2025).
Disclaimer/Publisher’s Note: The statements, opinions and data contained in all publications are solely those of the individual author(s) and contributor(s) and not of MDPI and/or the editor(s). MDPI and/or the editor(s) disclaim responsibility for any injury to people or property resulting from any ideas, methods, instructions or products referred to in the content. |
© 2025 by the authors. Licensee MDPI, Basel, Switzerland. This article is an open access article distributed under the terms and conditions of the Creative Commons Attribution (CC BY) license (https://creativecommons.org/licenses/by/4.0/).