Article

Stem-Leaf Segmentation and Morphological Traits Extraction in Rapeseed Seedlings Using a Three-Dimensional Point Cloud

1
Cultivation and Construction Site of National Key Laboratory for Crop Genetics and Physiology in Jiangsu Province, Yangzhou University, Yangzhou 225009, China
2
Jiangsu Co-Innovation Center for Modern Production Technology of Grain Crops, Yangzhou University, Yangzhou 225009, China
3
Research Institute of Smart Agriculture, Yangzhou University, Yangzhou 225009, China
*
Author to whom correspondence should be addressed.
Agronomy 2025, 15(2), 276; https://doi.org/10.3390/agronomy15020276
Submission received: 20 December 2024 / Revised: 18 January 2025 / Accepted: 20 January 2025 / Published: 22 January 2025
(This article belongs to the Special Issue Unmanned Farms in Smart Agriculture)

Abstract

:
Developing accurate, non-destructive, and automated methods for monitoring the phenotypic traits of rapeseed is crucial for improving yield and quality in modern agriculture. We used a line laser binocular stereo vision technology system to obtain the three-dimensional (3D) point cloud data of different rapeseed varieties (namely Qinyou 7, Zheyouza 108, and Huyou 039) at the seedling stage, and the phenotypic traits of rapeseed were extracted from those point clouds. After pre-processing the rapeseed point clouds with denoising and segmentation, the plant height, leaf length, leaf width, and leaf area of the rapeseed in the seedling stage were extracted by a series of algorithms and were evaluated for accuracy with the manually measured values. The following results were obtained: the R2 values for plant height data between the extracted values of the 3D point cloud and the manually measured values reached 0.934, and the RMSE was 0.351 cm. Similarly, the R2 values for leaf length of the three kinds of rapeseed were all greater than 0.95, and the RMSEs for Qinyou 7, Zheyouza 108, and Huyou 039 were 0.134 cm, 0.131 cm, and 0.139 cm, respectively. Regarding leaf width, R2 was greater than 0.92, and the RMSEs were 0.151 cm, 0.189 cm, and 0.150 cm, respectively. Further, the R2 values for leaf area were all greater than 0.98 with RMSEs of 0.296 cm2, 0.231 cm2 and 0.259 cm2, respectively. The results extracted from the 3D point cloud are reliable and have high accuracy. These results demonstrate the potential of 3D point cloud technology for automated, non-destructive phenotypic analysis in rapeseed breeding programs, which can accelerate the development of improved varieties.

1. Introduction

With the rapid development of agricultural information technology, the application of image processing technology for 3D reconstruction of crops has become a global research hotspot in recent years [1]. Rapeseed (Brassica napus L.) has always been one of the most important oil crops in China, belonging to the Brassicaceae family, with various utilization values such as oil, vegetables, flowers, feed, and biomass fuels [2,3]. It is an important economic crop with a planting scale ranking among the top three in the world [4]. Its planting area is second only to staple food crops such as rice and wheat. The acquisition of morphological and structural traits in rapeseed is extremely important in the cultivation and breeding research of rapeseed, as the phenotypic traits of crops reflect the quality and growth status of crops [5]. Plant phenotype is the result of the interaction between gene expression and environmental factors, and is also an important factor in determining crop yield, quality, and stress resistance. Plant phenotype is also one of the important directions in modern crop breeding research, mainly studying the relationship between plant external phenotype and genetic factors. It plays an indispensable role in the process of crop breeding and contributes to the development of breeding. Until now, the monitoring of rapeseed phenotypes has been carried out manually relying on the experience of researchers, which is time-consuming, laborious, and often causes damage to the field crops. Therefore, real-time, high-precision, non-destructive, and automated monitoring of the phenotypic traits of field crops is of great significance in modern agriculture.
Generally, the image processing technology used to automatically measure the phenotypic parameters of the crop is only a two-dimensional image of the plant, which cannot show the real spatial morphology of the plant, and the phenotypic parameters obtained are limited and of low accuracy [6,7]. Thus, the use of three-dimensional (3D) point clouds to obtain the phenotypic parameters and 3D reconstruction of crop has become one of the most important symbols of agricultural innovation [8,9]. The acquired 3D point cloud data usually contain information such as spatial coordinates, RGB color, reflection intensity, and normal vector, etc., which can be reconstructed as a 3D model and is of great significance for extracting crop phenotypic features and visualizing them in 3D [10].
Recently, computer technology has been gradually applied in agriculture, and the 3D reconstruction technology of plants has developed rapidly, which has made non-destructive monitoring of plants and obtaining phenotypic parameters become a hotspot of research. Shi et al. [11] utilized a 3D reconstruction process and an algorithm based on image sequences to restore the 3D model of plants to a certain extent, and demonstrated the feasibility of using 3D reconstruction for plant phenotyping. Yin et al. [12] established a human–computer interaction system based on binocular stereo vision for a virtual growth model of plants, and obtained phenotypic parameters of Arabidopsis thaliana (L.) Heynh after completing 3D construction. They further found that, compared with the real values of linear fitting, the correlation coefficients of leaf length, leaf width, and stalk length were 0.940, 0.974, and 0.986, respectively, and the errors were all within ±5%, showing that the system was reliable for 3D reconstruction of Arabidopsis thaliana (L.) Heynh.
In terms of plant 3D reconstruction, the use of 3D laser scanning technology can quickly obtain plant 3D information and reconstruction for the determination of plant phenotypic parameters [13]. Sun et al. [14] proposed a method for reconstructing plant leaf surfaces based on 3D scanning point clouds. This method generates an initial surface mesh from the point cloud through Delaunay triangulation after removing noise points, and applies optimization algorithms to eliminate erroneous edges. This method can reconstruct high-quality 3D surfaces of plant leaves from point cloud data, and is also applicable to complex shapes such as withered leaves. Li et al. [15] also used a 3D laser scanner to obtain point cloud data of cucumber leaves, and then successfully obtained a geometric 3D model of cucumber leaves by using Imageware software and OpenGL. Based on a structured light 3D information acquisition system and rotation platform, Fang et al. [9] obtained point cloud data of rapeseed and improved the registration technique, thereby improving the registration accuracy and accelerating the processing speed of point cloud data. Wang et al. [16] used a 3D scanning system to obtain point cloud data of cucumber, corn, and grape leaves and reconstructed them while further improving accuracy and realism.
Previously, studies have shown the feasibility of using 3D reconstruction for plant phenotyping, but there is a lack of application specifically for rapeseed in field conditions. Existing technologies like LiDAR and structured light 3D scanners have been used in other crops, but not extensively in rapeseed, mainly limited by two factors: (1) the complex structure of rapeseed, with significant interference between organs such as stems, leaves, and pods; (2) during the growth process of rapeseed, there are significant changes in organ morphology. Taking the leaves as an example, during the seedling stage/early stage of bolting, the leaves are relatively smooth, while during the late stage of bolting, the leaves show characteristics of wrinkles and curls [17,18]. Therefore, current research on the three-dimensional structural phenotype of rapeseed mainly focuses on extracting and measuring phenotypes of single individuals or single organs with plant types. This study aims to fill this gap by utilizing 3D laser scanning to non-destructively capture and analyze phenotypic traits of rapeseed, focusing on plant height, leaf length, leaf width, and leaf area, to develop a more efficient and accurate method for improving rapeseed yield and quality.
In this study, we processed and analyzed the 3D point cloud in order to obtain a more efficient and accurate method for the extraction of crop parameters. After preprocessing the original point cloud, the Euclidean distance method was used to extract the plant height of individual rapeseed point clouds. After segmenting the rapeseed leaves, the greedy projection triangulation algorithm was used to obtain the leaf area of the rapeseed leaves. Further, the study was conducted with main objectives to (1) develop a non-destructive, high-precision method for extracting phenotypic traits of rapeseed using 3D laser scanning technology, (2) evaluate the accuracy of the extracted phenotypic data by comparing them with manually measured values, (3) demonstrate the potential of 3D point cloud data in enhancing the understanding and monitoring of rapeseed growth for improved yield and quality.

2. Materials and Methods

2.1. Field Experimental Design

The experiment was carried out in 2021–2022 at the Agricultural College Experimental Field of Yangzhou University in Yangzhou, Jiangsu Province, China (32°23′21.13″ N, 119°25′23.82″ E). Three varieties (Qinyou 7, Zheyouza 108, and Huyou 039) of rapeseed were selected for the experiment. The sowing was carried out through the strip method. Cover soil depth was 2–4 cm. There were three replications of each variety, and the area of each plot was 9 m2 with an isolation zone of 0.5 m. The soil was mainly composed of yellow/brown soil. The whole experiment was carried out with recommended fertilization by applying 112 kg/ha of nitrogen, 44 kg/ha of phosphorus, and 72 kg/ha of potassium. The irrigation method was drip irrigation, with an interval of 2–3 days between irrigation. The planting date was 15 October 2022. Further, due to the fact that this experimental rapeseed direct seeding period was late, mulching protection was performed when the weather temperature was extremely low.

2.2. Point Cloud Data Acquisition Methodology

2.2.1. Point Cloud Data Acquisition

This study utilized a binocular stereo vision system based on line lasers to collect point clouds of large areas of rapeseed. The whole set of equipment contained intelligent binocular cameras: infrared lasers, air-plug power supply and hard-trigger cables, air-plug gigabit network cables, and other hardware. The equipment applied several high-precision wide-area stereo cameras. Four cameras were installed on the top surface and two cameras were installed on the side. The top camera size was 400 × 66 × 75 mm, the side camera size was 260 × 66 × 75 mm, and the manufacturer was Beijing Weijing Intelligent Technology Co., Ltd. (Haidian District, Beijing, China). The resolution was 1536 × 2048, the spatial resolution was ±1 mm, the position repetition accuracy was ±0.5 mm, and the maximum scanning frequency was 2000 Hz. The scanning height was 1 m from the ground and the lens focal length was 6 mm. The operating temperature was –10 degrees Celsius–50 degrees Celsius, the storage temperature was–20 degrees Celsius–70 degrees Celsius, and the scan was carried out at noon on a clear and cloudless day. During the camera installation, cameras were fixed in position with laser emission angles set perpendicular to ensure precise alignment. The data collected were transmitted via 5G technology to a central control room for processing. The system, driven by a motion guide mechanism, conducted comprehensive scans to generate a 3D model of the field. Point cloud data were acquired using this setup, allowing for detailed capture and analysis of the rapeseed plants. The scanning mechanism is shown in Figure 1. When conducting 3D scanning, the vehicle slid along the track to the scanned area. Before scanning, it was necessary to ensure that there were no people or animals in the field, and that the sliding track was free of debris to avoid safety accidents. The operation process of the intelligent phenotype platform was as follows:
(1)
Open the control cabinet installed on the right side of the vehicle with the key and turn on the main switch to power on the entire system. (After scanning, power off the entire system.)
(2)
After entering the Weijing Intelligent HPPC local control software, connect the IP addresses of the four stereo cameras and connect the devices.
After entering the main interface, pay attention to whether the words “driving” and “scanning mechanism” below are displayed in green. Green indicates a successful connection.
(3)
Release the emergency stop status of the vehicle, enable the vehicle to automatically exit, and then manually reset the X-axis and Z-axis of the scanning mechanism to avoid errors in the distance traveled by the vehicle.
(4)
To detect the ROI for each camera, the specific method is to first define the left eye ROI (note: The designated ROI must include all laser lines on the surface of the test object. Based on this, the smaller the ROI, the higher the frame rate.) Then, the ROI for the right eye is delineated using the same method. Click “Apply” or “OK” to take effect.
(5)
After setting the location of the community, move the vehicle to the community. When the vehicle movement is over, confirm whether the crop to be photographed is under the camera, and then adjust the position of the scanning mechanism, especially the scanning height. In this experiment, the height of the scanner was set at about one meter from the top of the crop. If the scanning height is too high or too low, the target point cloud will be missing.
(6)
When the scanning mechanism is running, if the point cloud image effect is not good, check whether the laser line is in the camera. If not, redefine the ROI.
(7)
After the scanning is completed, the device will be stored and the system will be shut down.
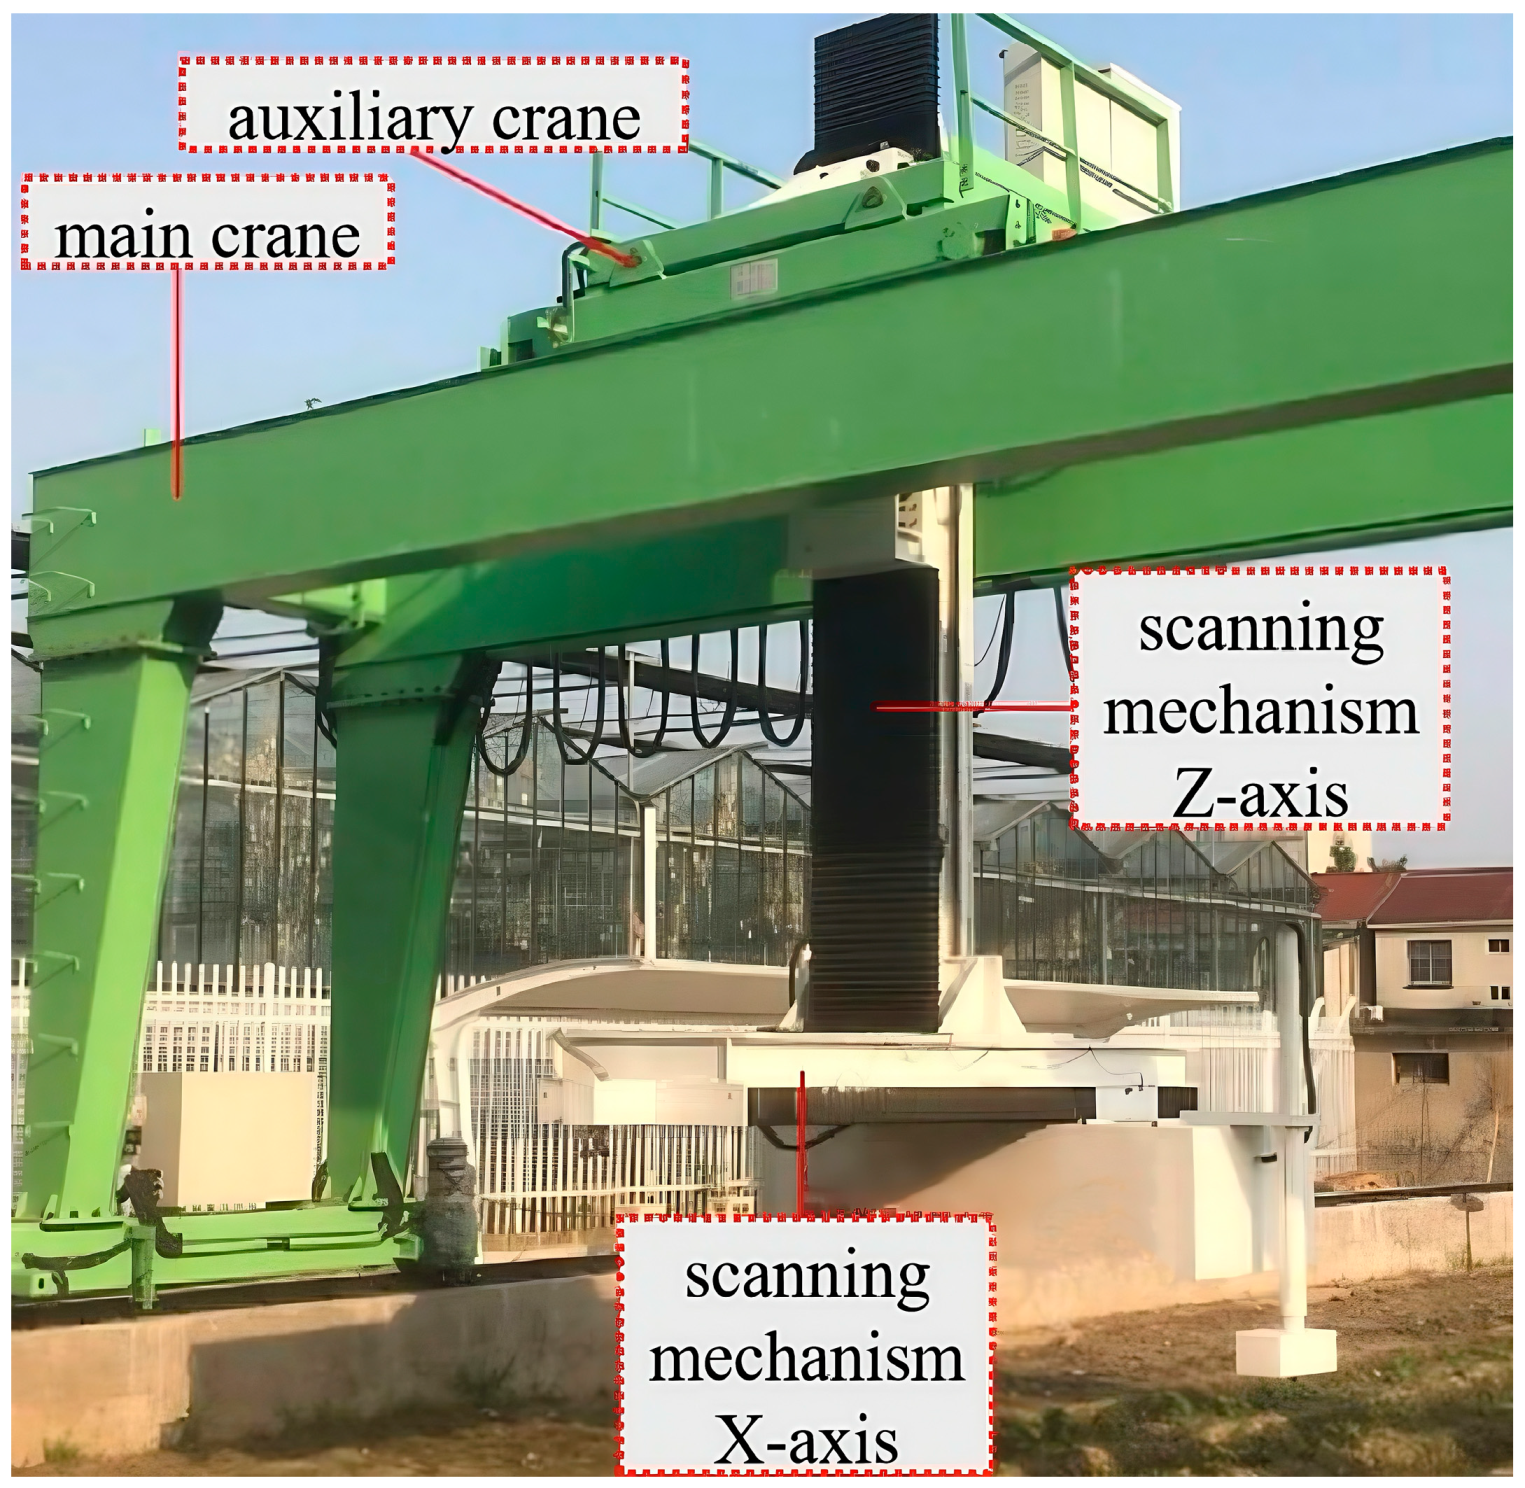
Figure 1. Field scanning mechanism.
Agronomy 15 00276 g001

2.2.2. Target Point Cloud Extraction

After obtaining point cloud data, this experiment processed the point cloud data using PCL 1.11.1 software on the Windows 10 operating system. While extracting phenotypic traits of rapeseed, usually a single plant of rapeseed is processed, which can avoid the reduction in accuracy through influence of non-target point cloud. Thus, after pre-processing the point cloud of rapeseed, such as denoising and segmentation, it is necessary to segment a single plant of rapeseed, and conditional filtering was used in this experiment to extract the point cloud of a single plant of rapeseed. The process of conditional filtering is as follows: (1) Read the point cloud and create a conditional object. Among them, there are two types of conditions: “and” type or “or” type. The “and” type refers to the condition that all listed conditions need to be met, while the “or” type refers to the condition that satisfies one of the listed conditions. (2) Set filtering conditions, specify the dimension and range of filtering, traverse the point cloud, and determine whether each point in the point cloud meets the set conditions. If it meets the conditions, keep it, otherwise delete it. (3) The points left after the point cloud traversal are the required point cloud. This method is more flexible and not limited to a coordinate system, and can set the range of multiple axes at once, but it is not complicated, and can be used to filter the point cloud simply and quickly.

2.3. Methodology for Extraction of Morphological Structural Parameters of Rapeseed

2.3.1. Plant Height Extraction

The vertical distance from the base of the rapeseed plant to the apex of the plant crown was taken as the plant height (cm), and the base of the plant was the junction point between the plant and the soil. Five plants were selected from each variety, and the vertical distance from the highest point of the plant to the ground was measured manually with a ruler, which was the measured value of plant height. We split the point cloud of single rapeseed plant using CloudCompare software 2.11.3, and fixed the base of the plant on the xy-plane. We found the highest point of the rapesd plant, and then the height of the ant as the vertical distance from the highest point to the xy plane, as shown in Figure 2. The following formula was used for calculating the plant height of the rape plant:
H = Z m a x Z m i n
where: Z max and Z min are the Z-axis coordinates of the highest point of the point cloud of a single rapeseed plant, and the Z-axis coordinates of the intersection of the base of the plant and the xy plane, respectively.

2.3.2. Leaf Length and Width Extraction

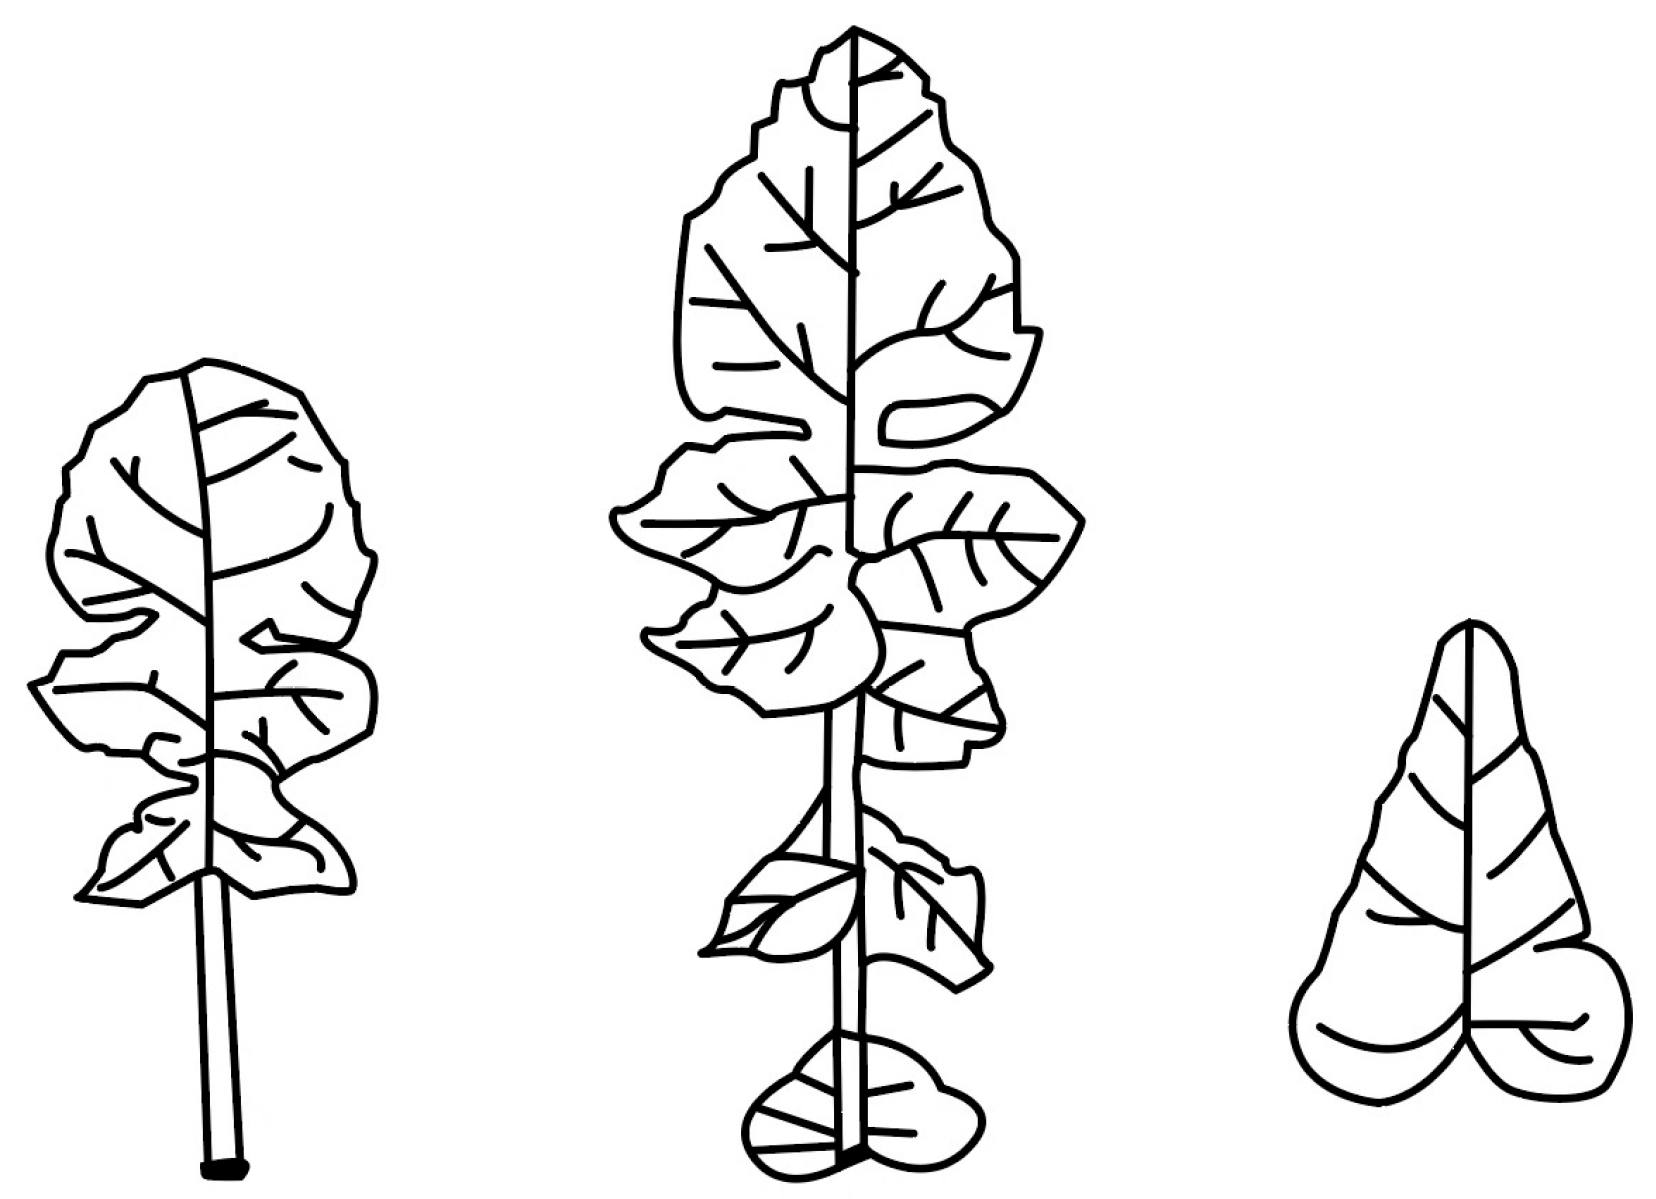
The three rapeseed varieties used in this experiment are all kale-type rapeseed, which are incomplete and mostly lobed. With the advancement of the reproductive period of rapeseed, the leaf morphology of the grown leaves becomes different, and the kale-type rapeseed leaves are classified into three types, long-stalked leaves, short-stalked leaves, and sessile leaves, according to the leaf morphology and petiole length [19] (Figure 3). In this experiment, leaf length (cm) and leaf width (cm) were measured for the four-leaf stage of rapeseed, and all rapeseed leaves at this stage were long-stalked leaves. In measuring, the leaf length of long-stalked leaves usually refers to the length of the leaf body, i.e., excluding the length of the petiole, and the leaf width is the width of the widest part of the leaf body.
When measuring the leaf length and width of the point cloud of rapeseed leaves, the Euclidean distance between the vertices at the two ends of the leaf body cannot be taken as the leaf length because the leaf blade has a certain curvature. Therefore, we used a thin rope, and attached it to the surface of the leaf blade according to the leaf veins of the leaf blade placement. Later on, we intercepted the apex of the two ends of the long axis of the leaf blade, and then stretched the thin rope, and finally the length measured with a ruler was considered as the leaf length. Similarly, five measurements were taken and the average value was calculated. Further, five measurements were also taken to measure the leaf width as the middle of the leaf blade at the widest point, and average value was recorded.
We use the principle that the sum of the lengths of any two sides of a triangle is greater than the length of the third side to extract plant height from the three-dimensional point cloud of rapeseed in CloudCompare software 2.11.3, while gradually reducing the step size for calculating leaf length, as shown in Figure 4. Futher, the method of extracting the leaf width as consistent with the leaf length. The steps of calculation are as follows:
Set the coordinates of the two end points of the blade as A (x1, y1, z1), B (x2, y2, z2), the Euclidean distance L between A and B points was counted as the original length of the blade;
Consider point C (x3, y3, z3) on the blade, where x3 = X 1 + X 2 2 and y3 =   y 1 + y 2 2 ;
The distance between points A and C was denoted as L2 and the distance between points B and C was denoted as L3;
L1 = L2 + L3, if L = L1, then the length of the blade is L1, if it is not equal, then L is equal to L2, L3, respectively, back to step 2 again to carry out the later steps.
Figure 4. A pictorial representation of leaf length measurement through point clouds. (A, coordinate (x1, y1, z1); B, coordinate (x2, y2, z2); C, coordinate (x3, y3, z3)).
Agronomy 15 00276 g004

2.3.3. Leaf Area Extraction

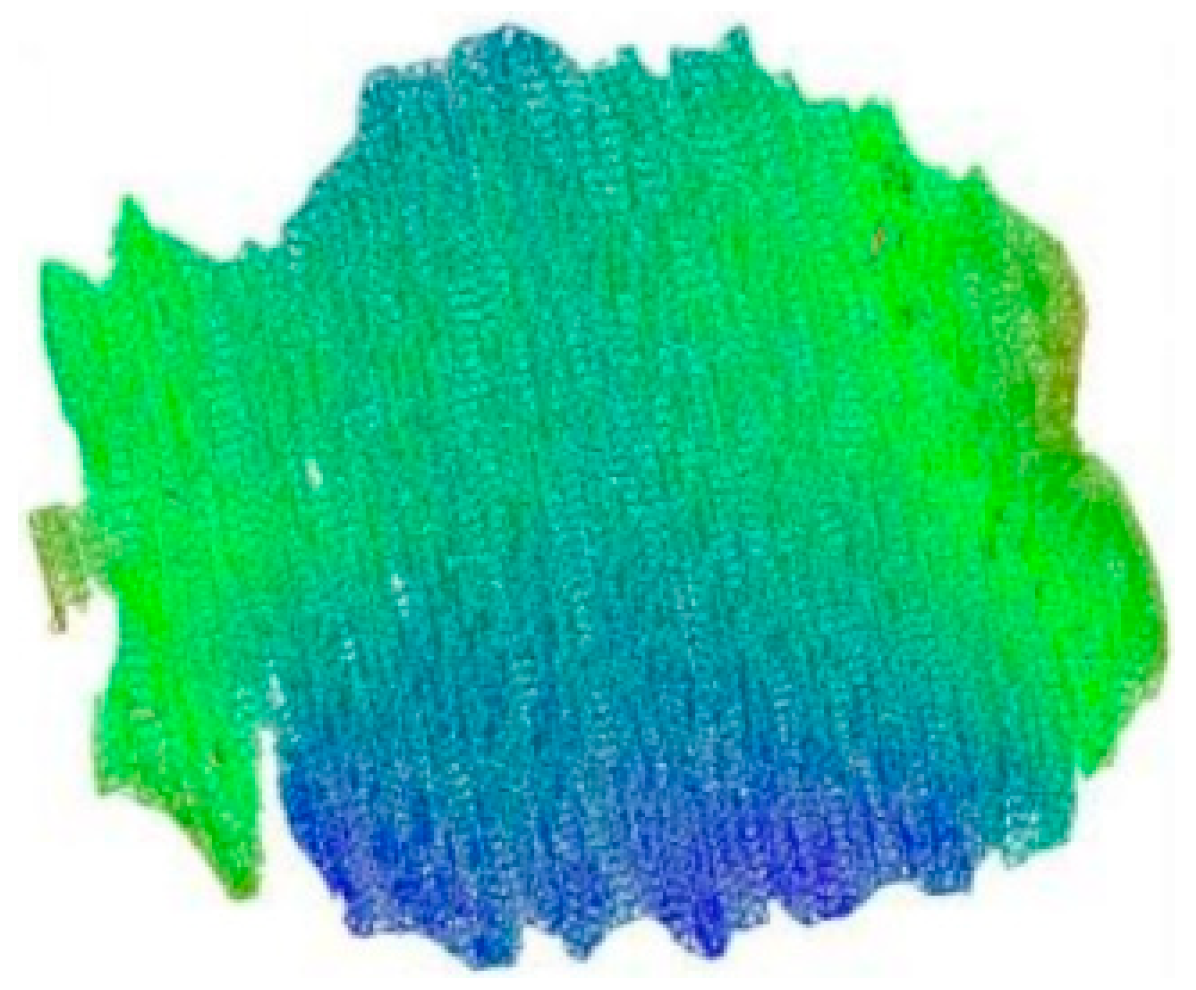
When extracting the leaf area (cm2) in this experiment, the greedy projection triangulation algorithm was firstly utilized to triangulate the leaf quickly. The method can directly reflect the surface area of the object in the three-dimensional space, and it is simple to calculate and easy to understand and apply. The surface of the blade is composed of multiple triangular slices, forming a complete triangular mesh surface, and then the area of whole leaf was considered as the sum of areas of these triangular slices. The greedy projection triangulation algorithm consists of the following three steps: first, the normals in the point cloud were calculated, and the oriented point cloud was projected into a two-dimensional coordinate plane; then, the spatial region growth algorithm based on Delaunay triangulation was used to triangulate the point cloud in the coordinate plane; this algorithm continuously expands the boundaries of the surface after a sample triangular slice has been selected as the initial surface, resulting in a surface composed of triangular meshes. Finally, the topological connections of the original point cloud were determined from the connections of the in-plane point cloud, resulting in a triangular mesh surface model. The greedy projection triangulation algorithm was used to triangulate the blade, as shown in Figure 5, the leaf area was the sum of all the triangular surfaces. In this study, we first used Heron’s formula to calculate the area of each triangular surface (Equation (2)), and then we used summation formula to calculate the area of a blade (Equation (3)), and the calculation formula is as follows:
p i = a i + b i + c i 2 S i = p i p i a i p i b i p i c i
    S = i = 0 n s i
where ai, bi, and ci are the lengths of the three sides of the triangular faceted piece, pi is half the perimeter of the triangle, i is the triangular faceted piece index number, and n is the total number of triangular faceted pieces.
Five plants were selected from each variety and four leaves were manually measured. A grid method was used for manual measurement of leaf area. Each small square was 1 square centimeter. The leaf was laid flat on the grid paper, and the leaf shape was traced along the edge of the leaf with a pencil the number of grids occupied by the leaf shape was considered to be the leaf area. In the calculation of the grid, if the edge of the leaf was in more than half of the grid it was counted as a grid, while if it was in less than half of the grid it was ignored.

2.4. Accuracy Assessment

In order to verify the accuracy of extracting plant phenotypes based on the 3D point cloud, this paper selects the coefficient of determination (R2) and the root mean square error (RMSE) as the evaluation indexes by comparing the manually measured values with the extracted values from the 3D point cloud. Further, the calculation formulas are shown in Equations (4) and (5):
R 2 = i = 1 n x i x ¯ y i y ¯ i = 1 n x i x ¯ 2 i = 1 n y i y ¯ 2
R M S E = i = 1 n y i x i 2 n
where n is the total sample size, x i   is the manually measured value, x   ¯ is the average of the manually measured values, y i   is the extracted value from the 3D point cloud, and y ¯   is the average of the extracted values.

2.5. Data Processing and Analysis

SPSS 26.0 was used to compare the agronomic traits of different varieties by single factor analysis of variance, and Origin 2021 was used for plotting.

2.6. Technology Roadmap

The technical roadmap of this article is shown in Figure 6. This study utilized a line laser binocular stereo vision system to obtain data. The point cloud data during the seedling stage of rapeseed enabled the measurement of phenotypic parameters such as plant height, leaf length, leaf width, and leaf area. The relevant phenotypic parameters have been manually measured for accuracy analysis and evaluation, with the hope of improving the way three-dimensional information of crops can be obtained.

3. Results

3.1. Agronomic Parameters at Seedling Stage

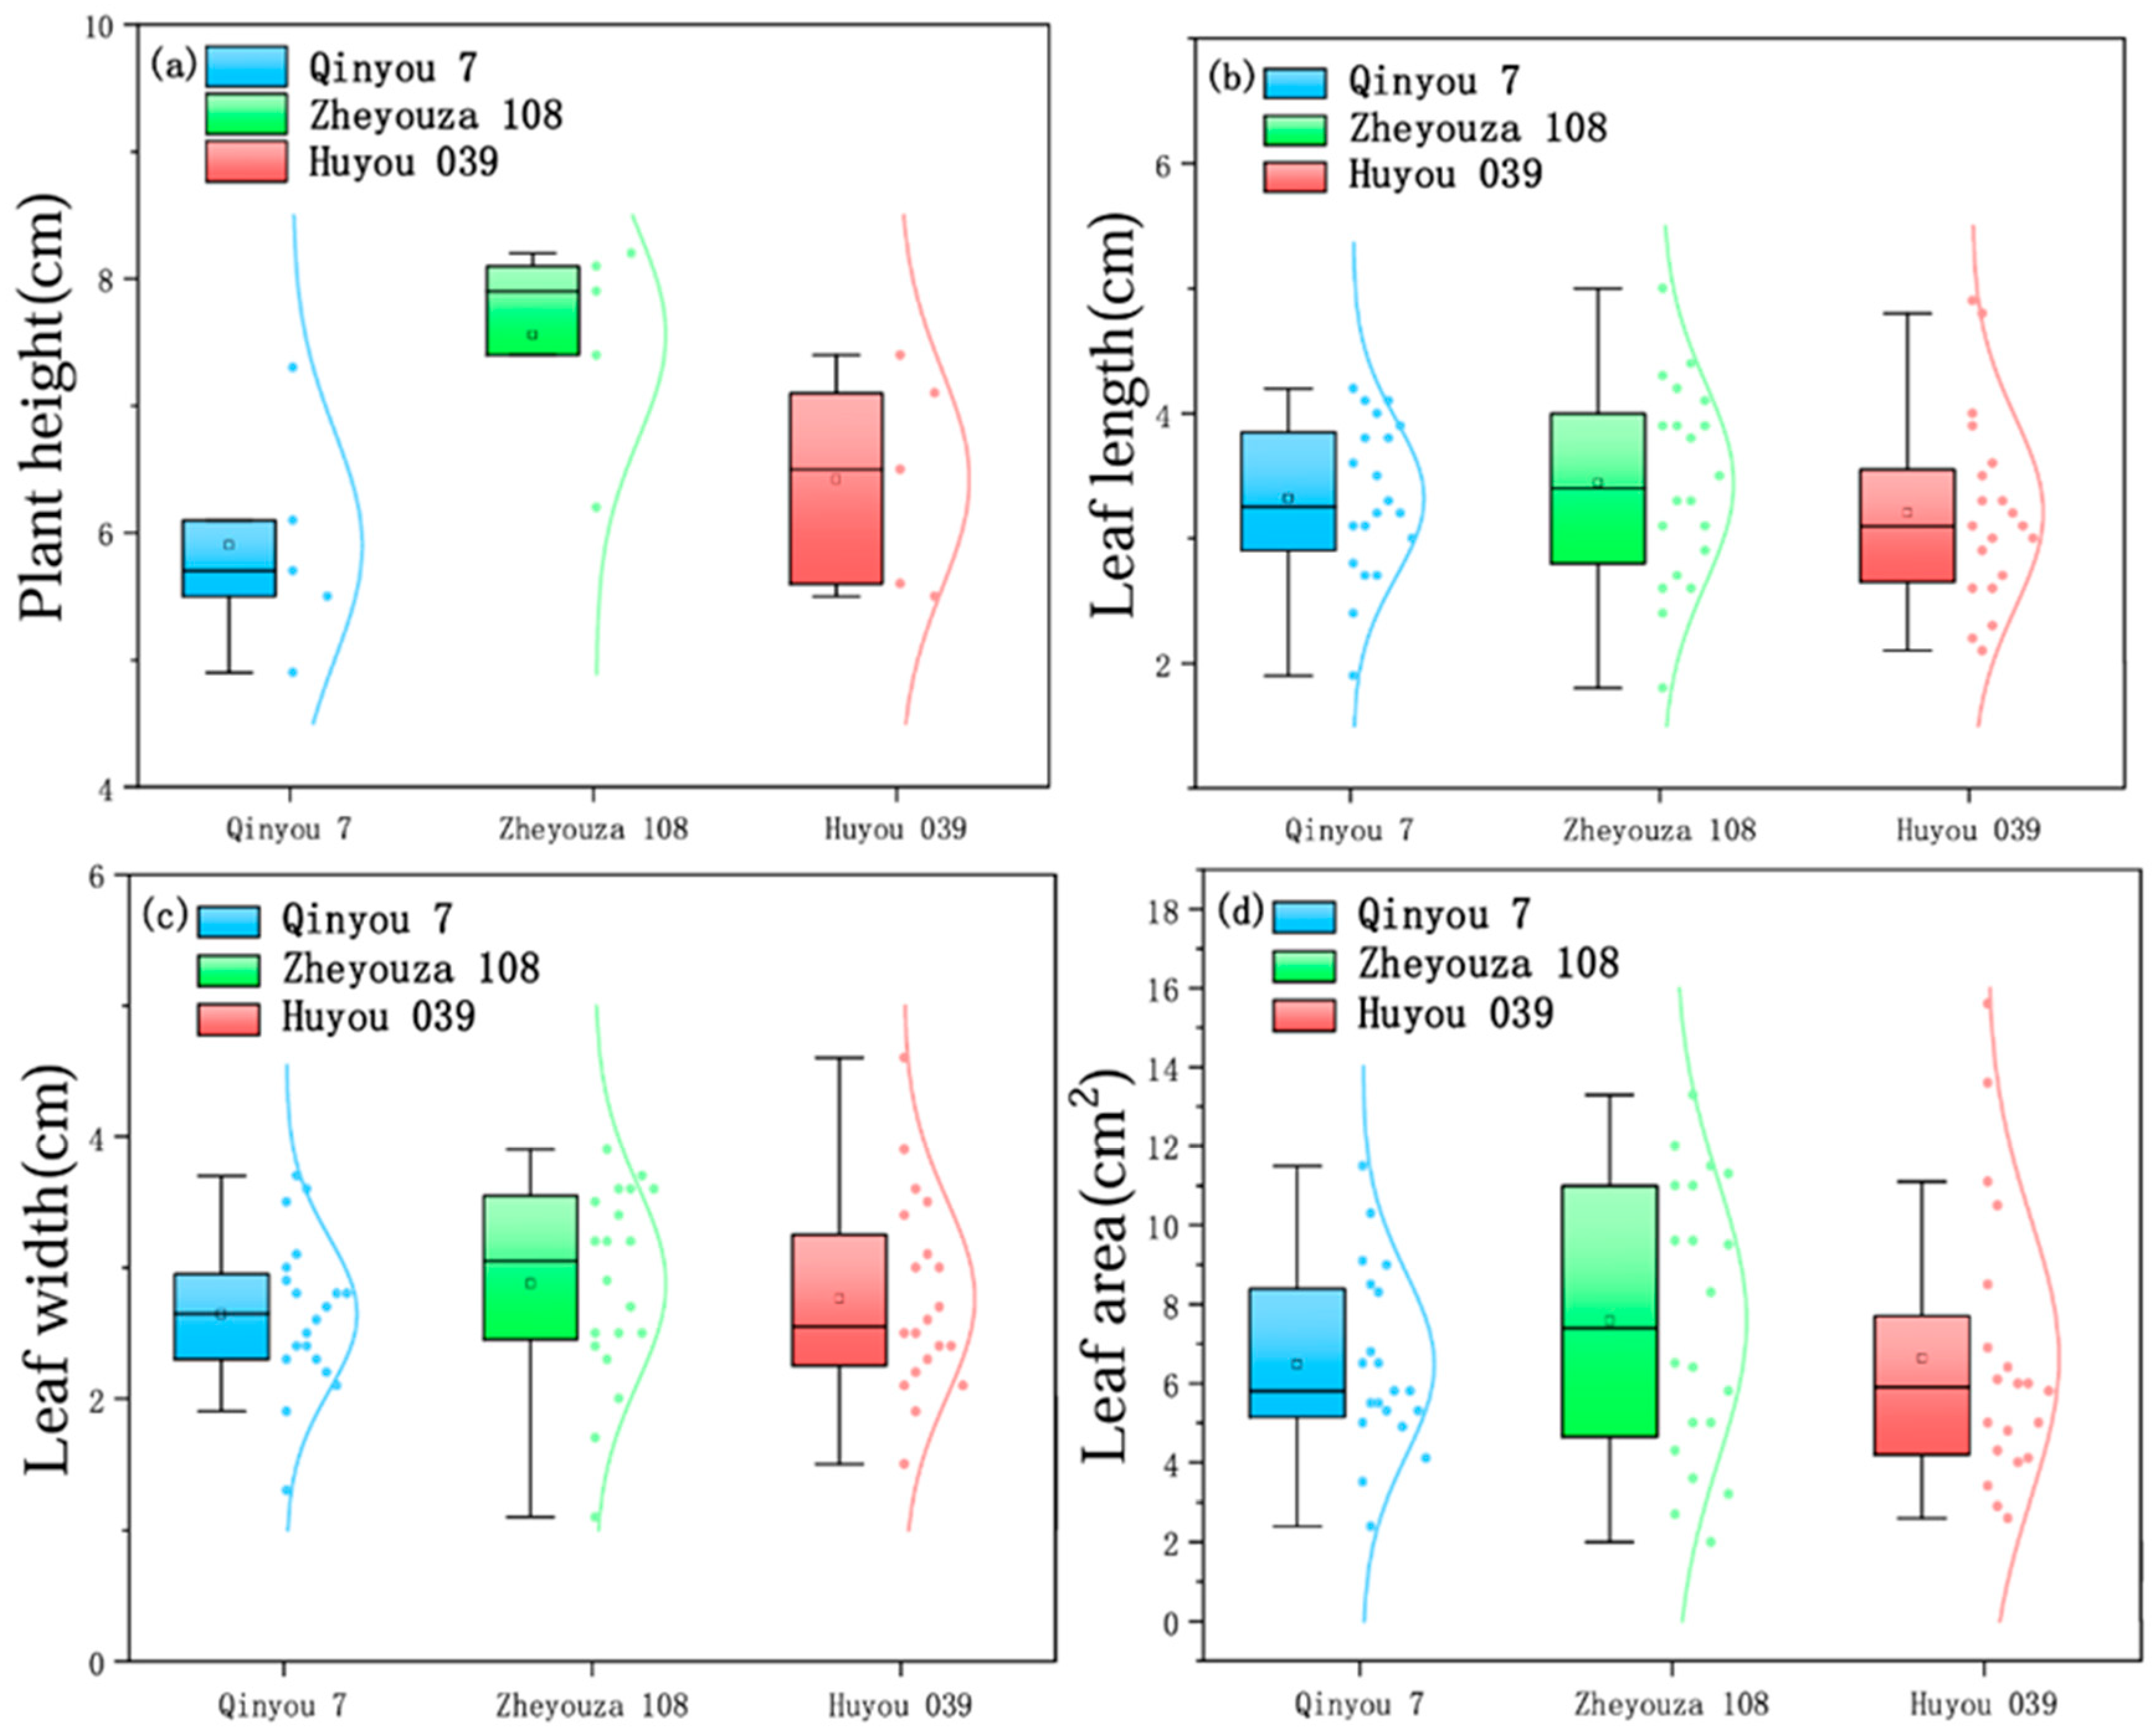
During the seedling stage of three rapeseed varieties, plant height, leaf length, leaf width, and leaf area were measured manually. Five plants were measured for each variety, and four leaves were measured for each plant. The result is shown in Figure 7. The average plant heights measured for the Qinyou 7, Zheyouza 108, and Huyou 039 were 5.9, 7.56, and 6.42 cm; the average leaf length was 3.32, 3.44, and 3.21 cm, the average leaf width was 2.65, 2.88, and 2.77 cm, and the average leaf area was 6.48, 7.58, and 6.63 cm2, respectively. The corresponding ranges for plant height, leaf length, leaf width, and leaf area of the three varieties were 4.9 to 8.2 cm, 1.8 to 5 cm, 1.1 to 4.6 cm, and 2 to 15.6 cm2, respectively. The results indicate that there were significant differences in plant height, leaf length, leaf width, and leaf area among the three varieties of rapeseed during the seedling stage. Among them, Zheyouza 108 had the highest average plant height, Qinyou7 had the lowest average plant height, and Huyou039 had the most scattered distribution of plant height. The overall trend of changes in leaf length, leaf width, and leaf area tends to be consistent, with the distribution of Zheyouza 108 being the most dispersed and having the highest average value. These may be determined by their variety characteristics.
The data presented in Table 1 show a comparison of agronomic traits among different rapeseed varieties (M ± SD).
Table 1 shows the plant height of different varieties was significantly different (p < 0.05), The plant height of Zheyouza 108 was the highest, and that of Qinyou 7 was the lowest. There were differences in agronomic parameters among different varieties during the same period, resulting in errors when using 3D point cloud measurements. Significant differences are beneficial for the establishment and validation of the model.

3.2. Estimation of Plant Height

3.2.1. Plant Height Measurement

Data given in Table 2 present the extracted plant height data for three varieties of rapeseed.
Table 2 shows the average values of the three-dimensional extracted values and manually measured values of the plant height of rapeseed plants during the seedling stage. From Table 1, it can be seen that the plant height of the three varieties from high to low were as follows: Zheyouza 108, Huyou 039, Qinyou 7. Comparing the 3D extracted values with manually measured values, it can be seen that the errors of Zheyouza 108 and Huyou 039 are relatively small, with errors of 0.1 and 0.06 cm, respectively, and differences of 1.3% and 0.9%. The error of Qinyou 7 is relatively large, at 0.78 cm, with a difference amplitude of 13.3%. This may be due to differences in variety.

3.2.2. Evaluation of Plant Height Extraction Accuracy

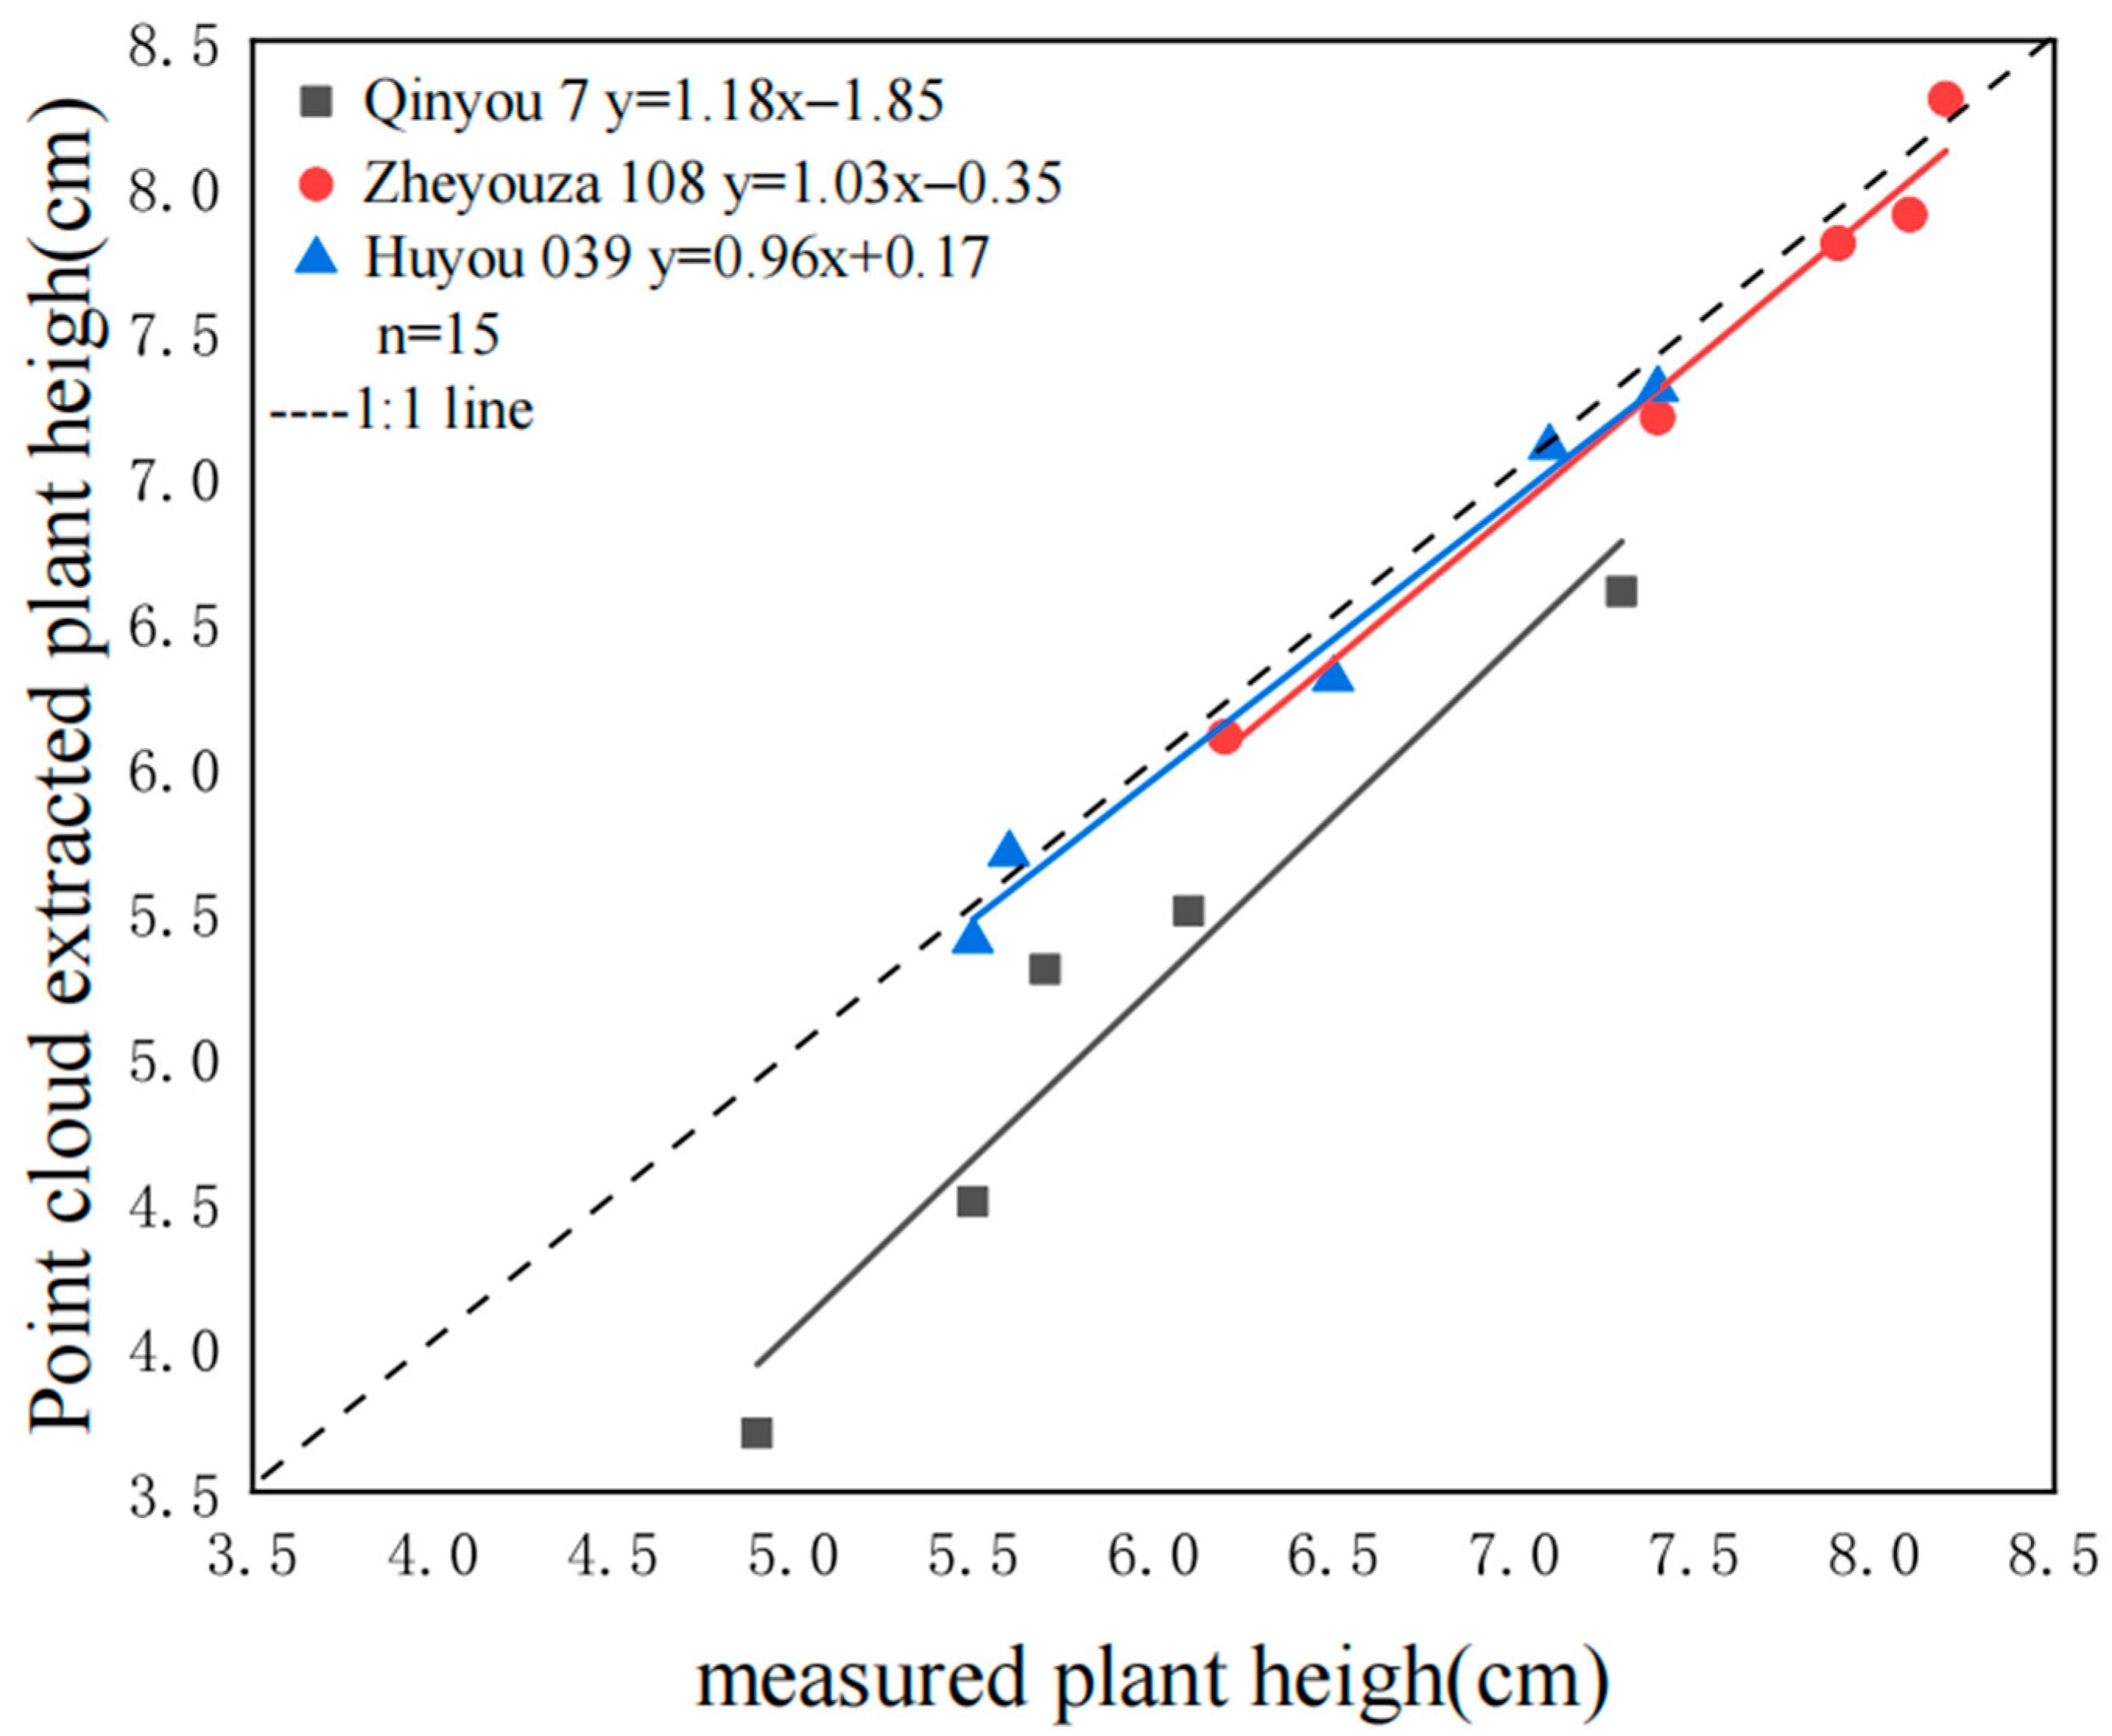
The relationship between the measured values of rapeseed plant height and the values of plant height extracted from the 3D point cloud was established to verify the accuracy of this experiment by using the statistical methods of the R language, as shown in Figure 8.
We found that the plant height extracted from the 3D scanning point cloud of rapeseed has a high degree of agreement with the manually measured values. The R2 values of the leaf length of the three varieties of rapeseed, Qinyou 7, Zheyouza 108, and Huyou 039, were 0.936, 0.981, and 0.983, respectively, while the corresponding values for RMSE were 0.318 cm, 0.138 cm, and 0.127 cm, respectively, which indicates that this method can reflect the plant height of rapeseed more accurately.

3.3. Estimation of Leaf Length, Leaf Width, and Leaf Area Parameters

3.3.1. Extraction of Leaf Length and Width

All the rapeseed plants selected in the seedling stage of this experiment were in the five-leaf stage, but the bottom-most cotyledons of some rapeseed samples were missing, so this experiment only extracted the parameters of the leaf blade for the four leaves excepting the cotyledons. The 3D extracted values of leaf length and leaf width of rapeseed at the seedling stage are given in Table 3 and Table 4, respectively.
From the table, it can be seen that as the leaf position increases from high to low, the leaf length of Qinyou 7 first decreases and then increases, while the leaf length of Zheyouza 108 and Huyou 039 first increases and then decreases. The length of the same leaf varies among different varieties. On Leaf 1, Qinyou 7 is the longest, followed by Huyou 039, and Zheyouza 108 is the shortest (with a length difference of up to 0.66 cm). On Leaves 2, 3, and 4, Zheyouza 108 is the longest (with length differences of up to 0.32, 0.14, and 0.7 cm). Huyou 039 on Leaf 2 is longer than Qinyou 7, while Qinyou 7 on Leaves 3 and 4 is longer than Huyou 039.
From the table, it can be seen that as the leaf position increases from high to low, the leaf width of Qinyou 7 and Huyou 039 first increases and then decreases, while the leaf width of Zheyouza 108 gradually decreases. The width of the same leaf varies among different varieties. On Leaf 1, Huyou 039 is the widest, followed by Qinyou 7, and Zheyouza 108 is the shortest (with a width difference of 0.58 cm). On Leaves 2, 3, and 4, Zheyouza 108 is the widest (with width differences of 0.58, 0.32, and 0.88 cm). Huyou 039 on Leaves 2 and 3 is wider than Qinyou 7, and Qinyou 7 on Leaf 4 is wider than Huyou 039.

3.3.2. Evaluation of Leaf Length and Width Extraction Accuracy

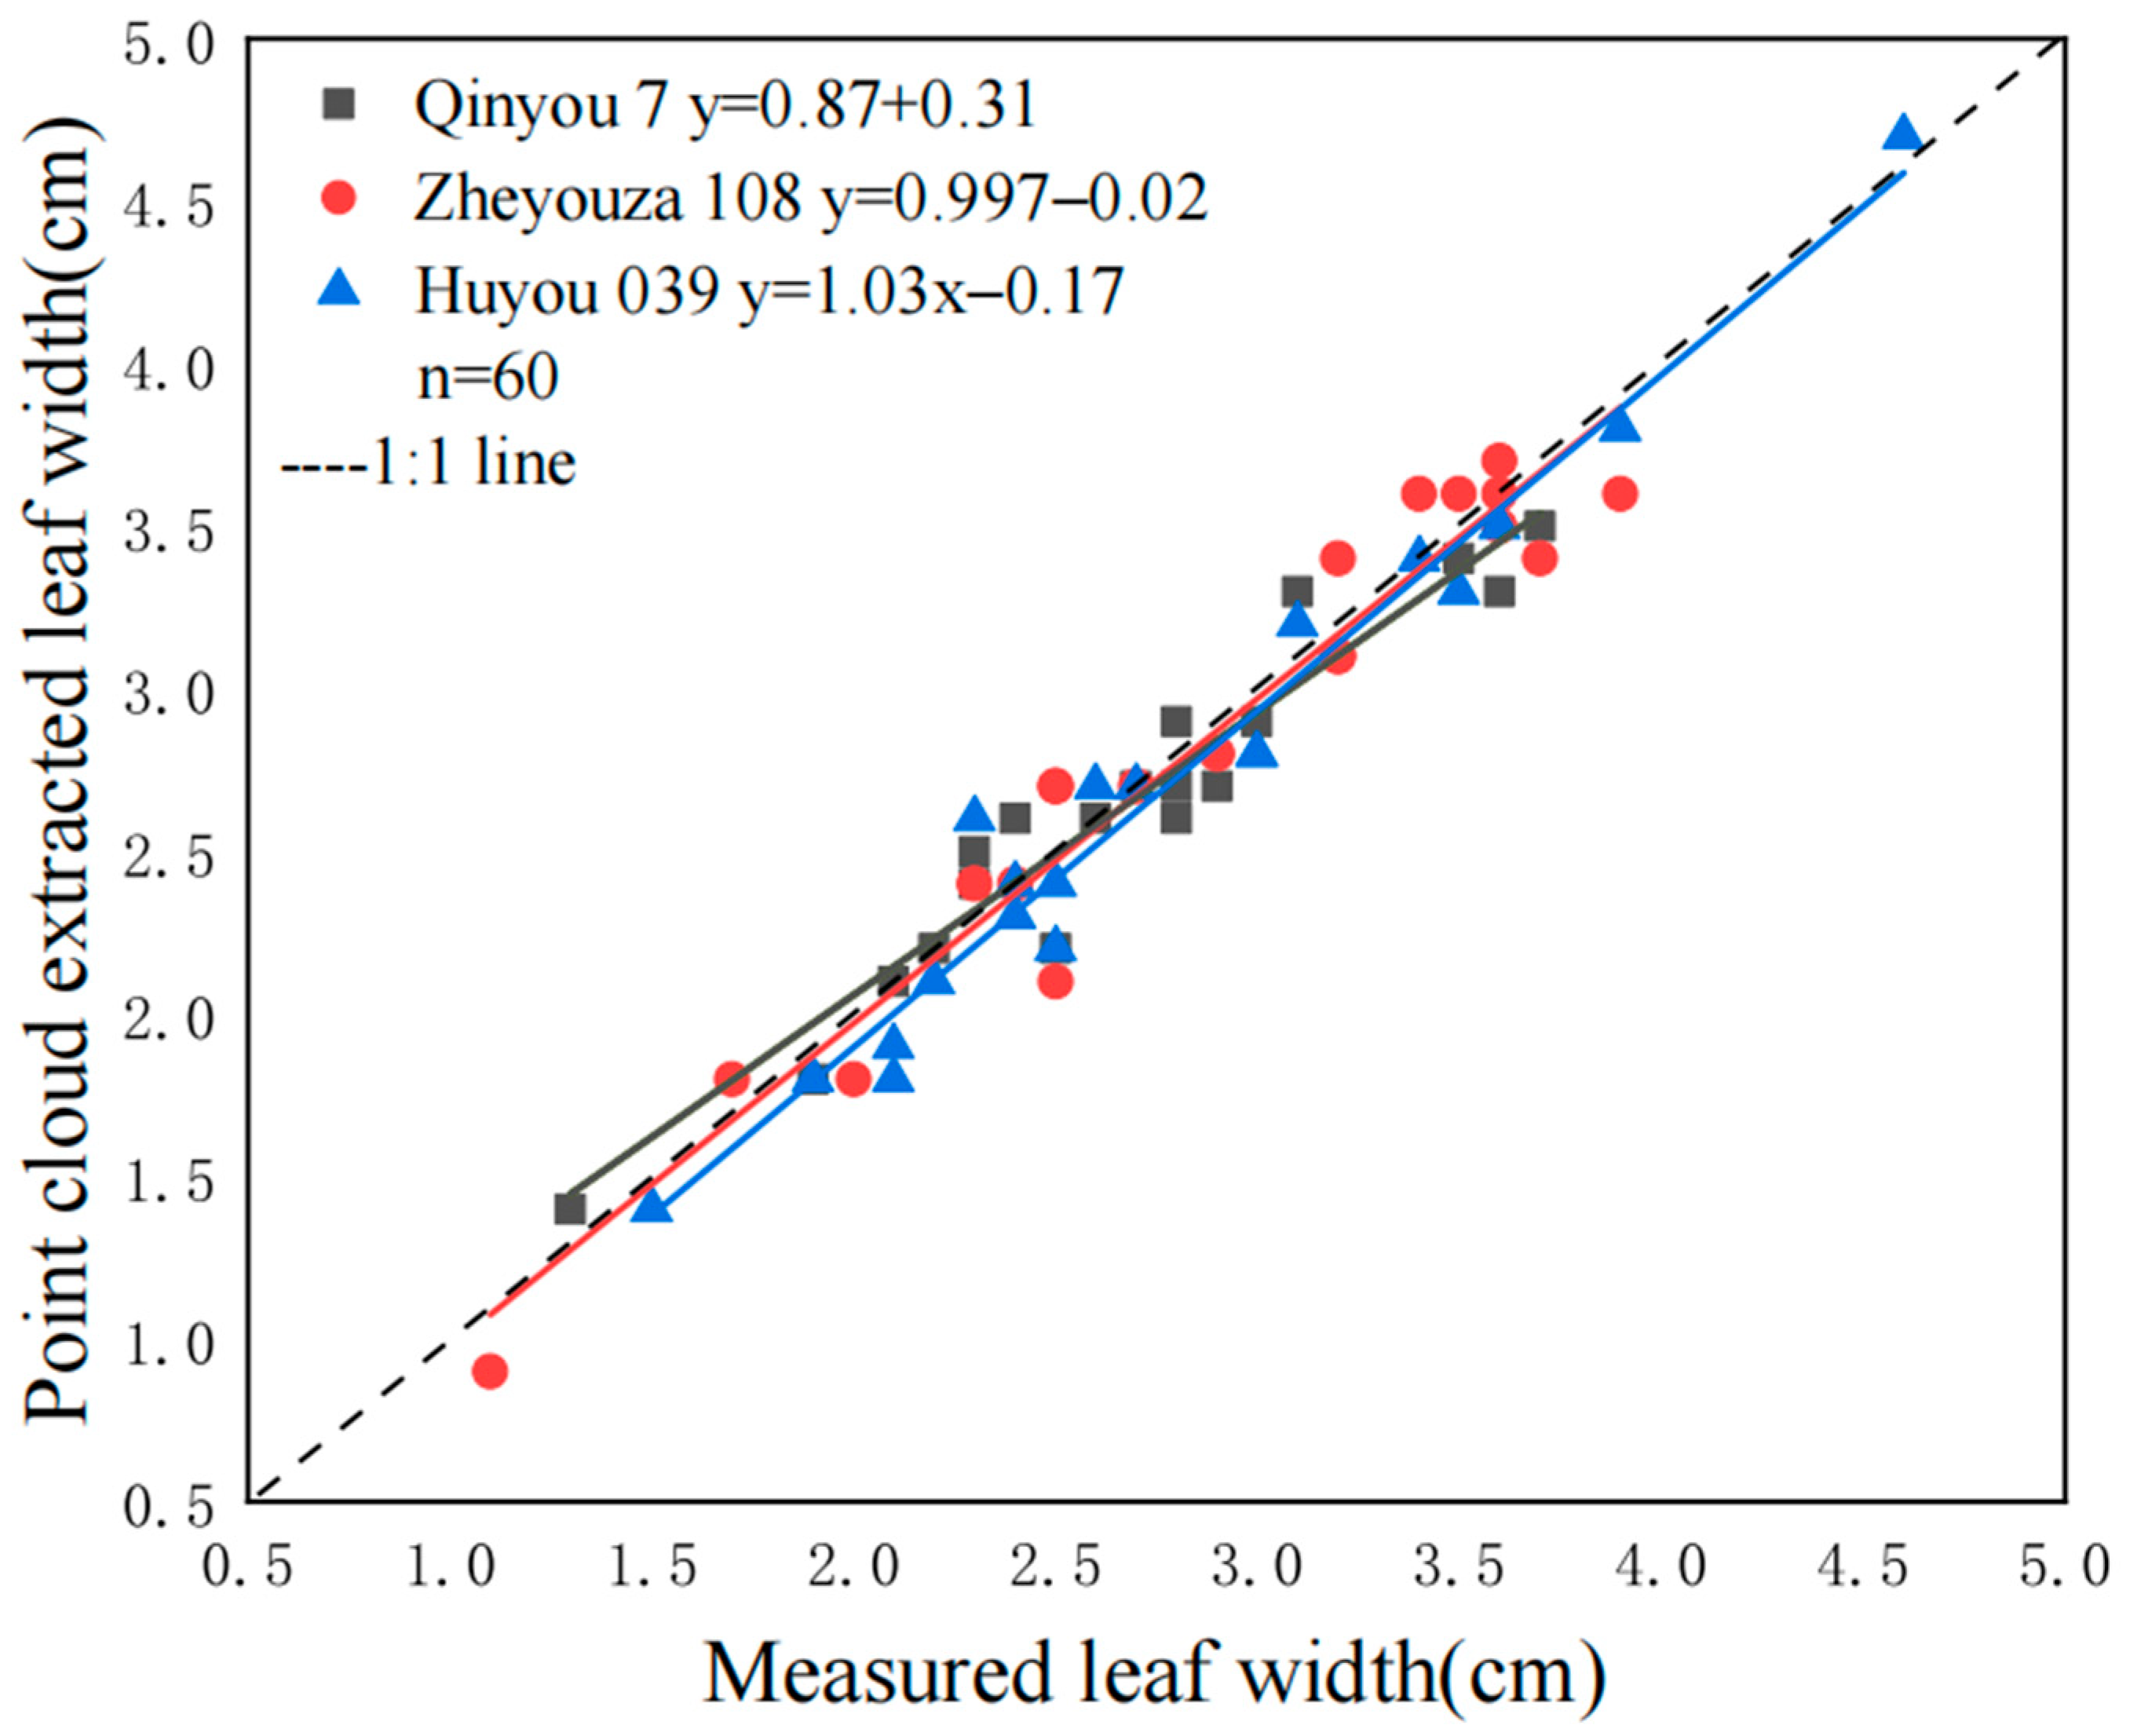
We make accuracy comparison of leaf length and leaf width extracted from three varieties of rapeseed by 3D scanning and manual measurement as shown in Figure 9 and Figure 10, respectively. The R2 values of the leaf length of the three varieties of rapeseed, Qinyou 7, Zheyouza 108, and Huyou 039, were 0.950, 0.975, and 0.969, respectively, while, the corresponding values for RMSE were 0.134 cm, 0.131 cm, and 0.139 cm, respectively. Regarding R2 of the leaf width of the three varieties of rapeseed, the values were greater than 0.92 as 0.923, 0.943, and 0.966, respectively, while the corresponding values for RMSE were 0.151 cm, 0.189 cm, and 0.150 cm, respectively. It indicates that the approach used in this study well reflects the real leaf length and leaf width of the plants and shows good robustness.

3.3.3. Extraction of Leaf Area

Table 5 shows the data extracted for measuring the leaf area of the three rapeseed varieties through the 3D point cloud. It cannot be concluded from the table that there is a significant difference in leaf area among the three varieties of rapeseed during the seedling stage, and further evaluation is needed through precision analysis.
From the table, it can be seen that as the leaf position increases from high to low, the leaf area of Qinyou 7 and Zheyouza 108 gradually decreases, while the leaf area of Huyou 039 first increases and then decreases. The area of different varieties at the same leaf position varies. In Leaves 1 and 4, Zheyouza 108 has the largest area, Huyou 039 at Leaf 1 is larger than Qinyou 7, and Qinyou 7 at Leaf 4 is larger than Huyou 039 (the area difference can reach 1.28 and 4.22 cm2). In Leaves 2 and 3, Huyou 039 has the largest area, followed by Zheyouza 108, and Qinyou 7 has the smallest (the area difference can reach 1.44 and 0.42 cm2).

3.3.4. Evaluation of Leaf Area Extraction Accuracy

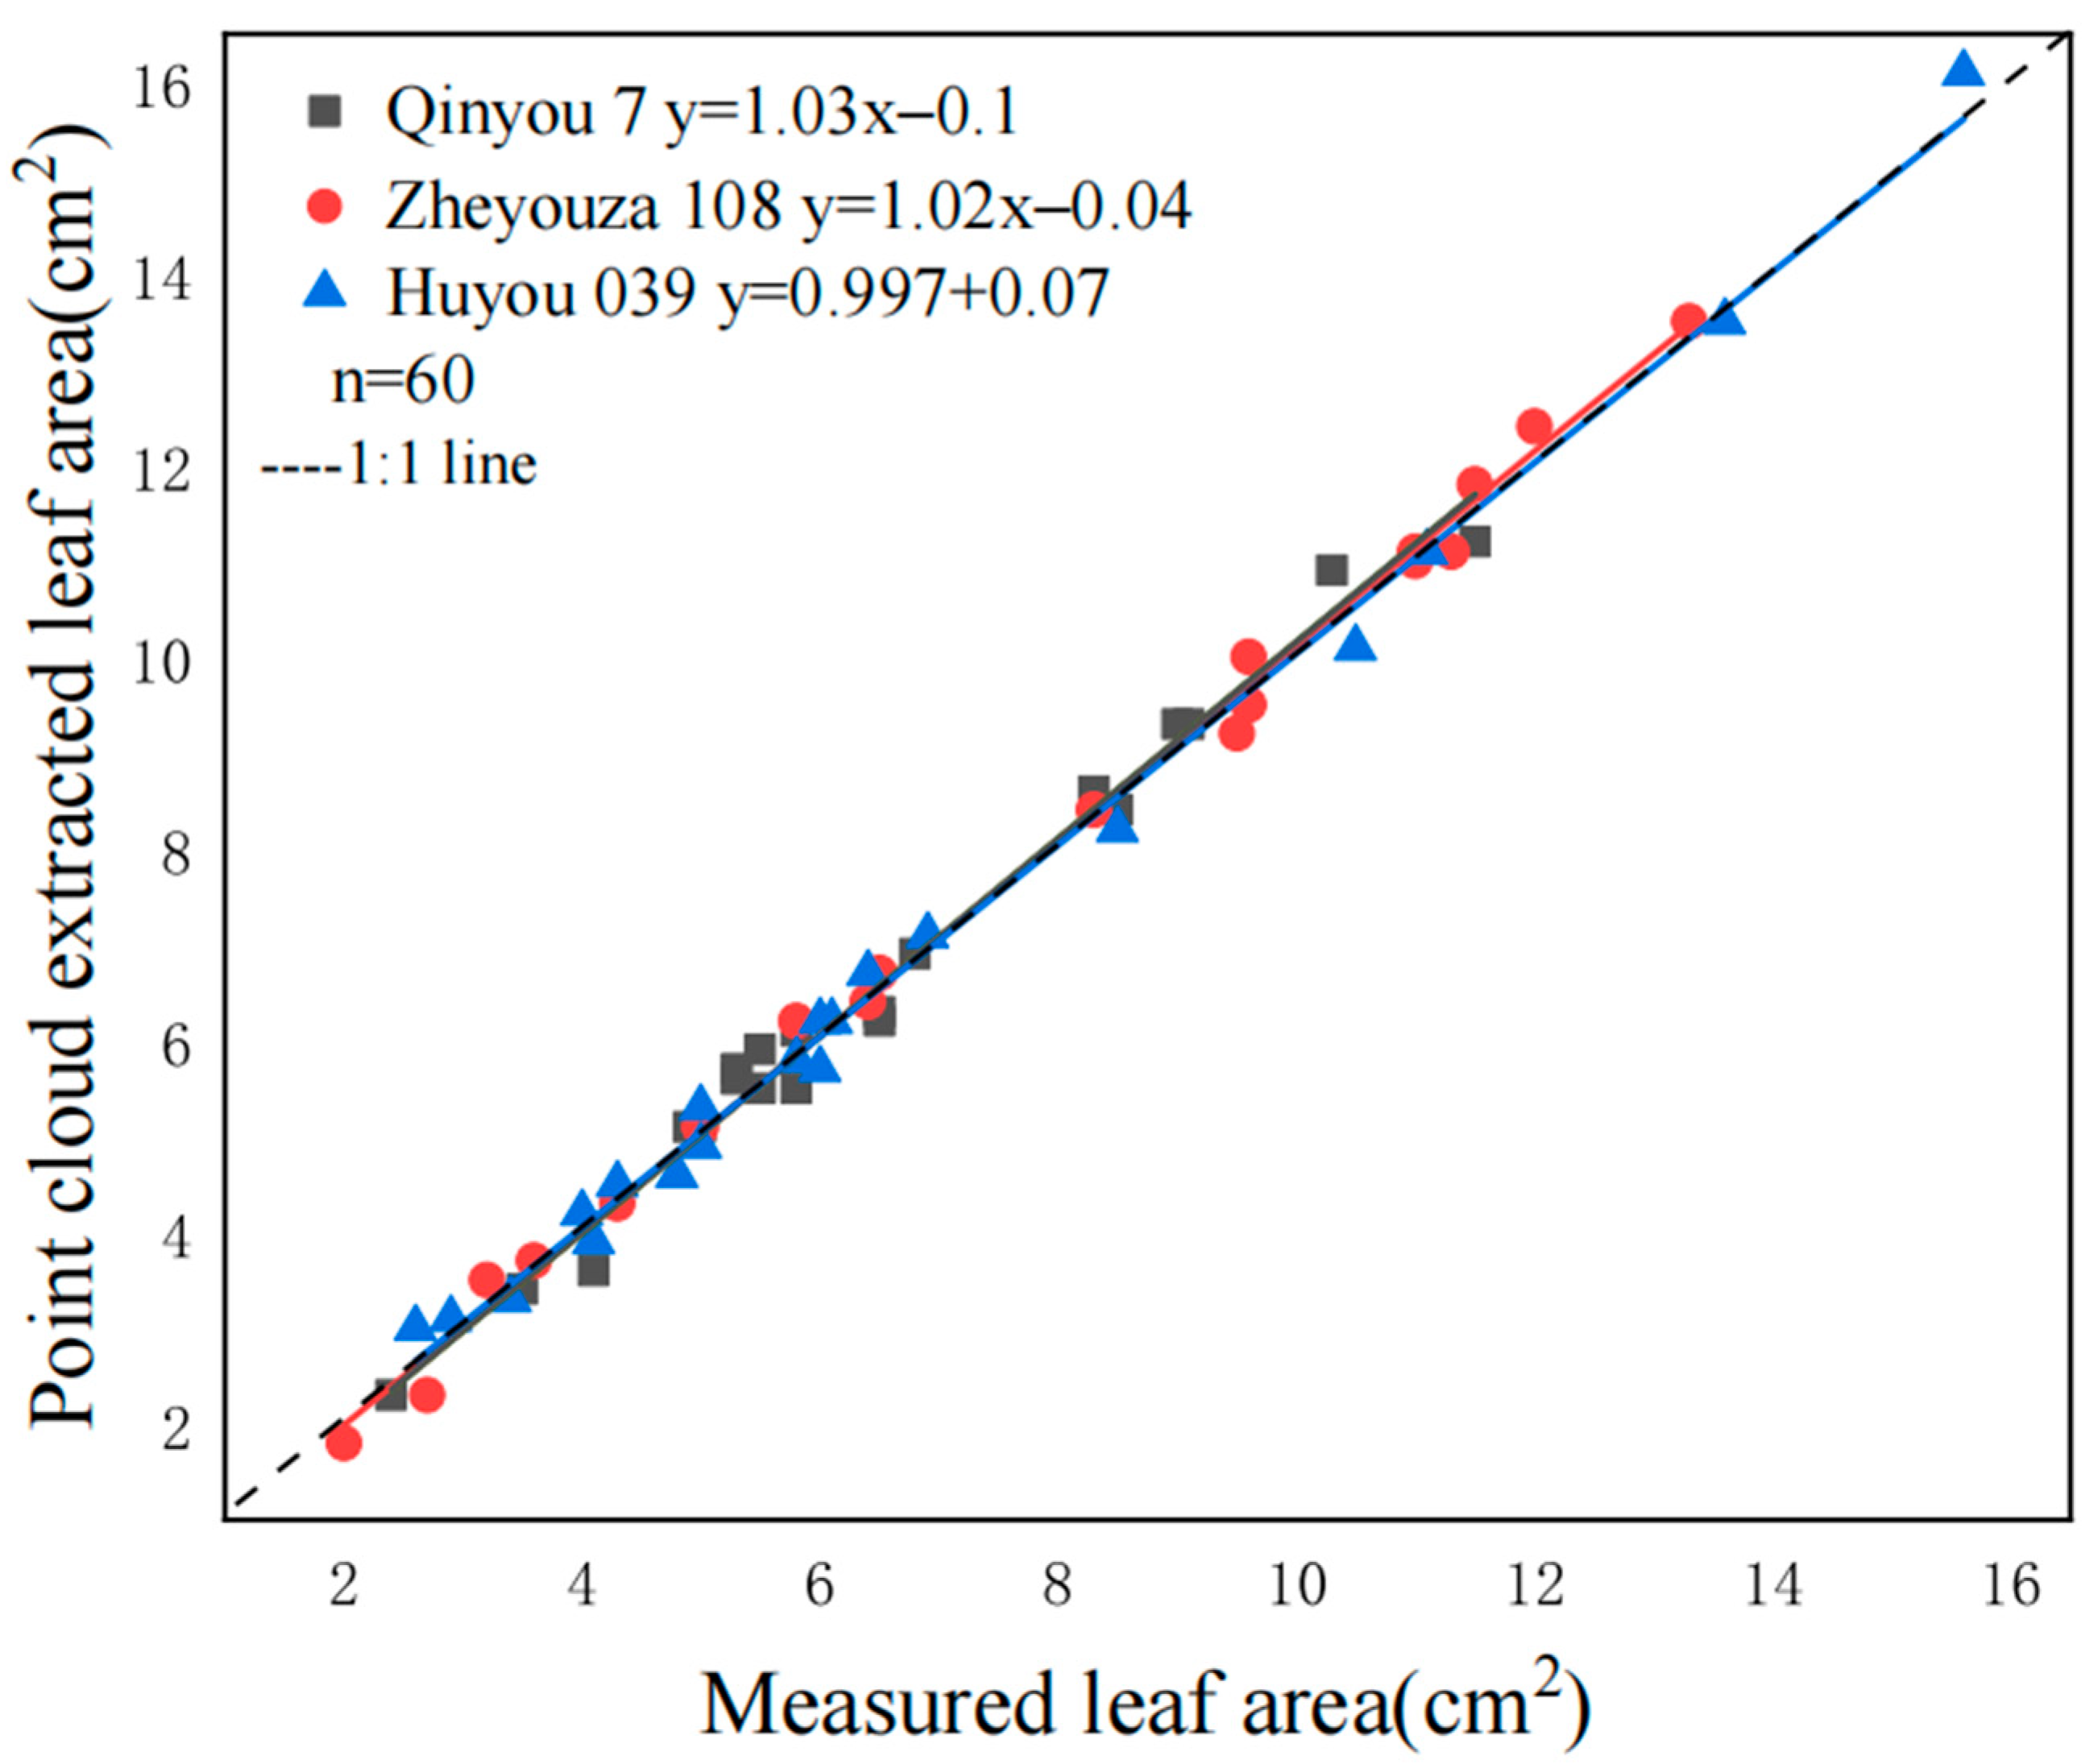
Results presented in Figure 11 show the accuracy estimation of leaf area of rapeseed varieties at the seedling stage. To further validate the accuracy of the 3D point cloud-based leaf area measurement, we used regression analysis to assess the degree of fit between the manually measured leaf area values and the values extracted from the 3D point cloud. In the analyses performed on three oilseed rape varieties, the R2 values exceeded 0.98, as Qinyou 7 with an R2 of 0.986, Zheyouza 108 showing 0.996, and Huyou 039 with an R2 value of 0.995. These R2 values indicate a very high agreement between the leaf area extracted from the point cloud data and the manually measured values, suggesting that the technique used is able to reflect the true leaf area very accurately.
Meanwhile, the root mean square error (RMSE) results further support this conclusion. The RMSE was 0.296 cm2 for Qinyou 7, 0.231 cm2 for Zheyouza 108, and 0.259 cm2 for Huyou 039. These low RMSE values also indicate that the deviation between the leaf area data extracted from the 3D point cloud and the manually measured values is small and the error margin is well controlled.

4. Discussion

The phenotypic traits of crops to some extent reflect the current survival status of plants. By understanding the phenotypic traits, cultivation measures can be adjusted in a timely manner to improve crop yield and quality. Traditional manual measurement of phenotypic traits is time-consuming, labor-intensive, and the measurement results are subjective. To solve this problem, different methods for extracting phenotypic parameters have emerged. The extraction of plant phenotype parameters based on images and 3D point clouds is currently one of the two most widely used methods, which can achieve the extraction of phenotype parameters of plants such as maize [20,21,22], soybeans [23,24,25], cotton [26], sugar beets [27], and wheat [28]. Analyzing the phenotypic traits such as plant height, leaf length, leaf width, and leaf area of rapeseed may help in understanding the current growth status of the crop. The acquisition of morphological and structural traits of rapeseed is extremely important in the cultivation and breeding research of rapeseed [29,30]. However, accurately and effectively segmenting 3D point cloud data is an important step in point cloud processing, which affects the accuracy of subsequent point cloud processing. The number and structure of point clouds can pose certain difficulties in point cloud segmentation. Therefore, accurate and efficient segmentation remains a research hotspot. Lin et al. [31] combined Euclidean clustering and normal direction difference to achieve point cloud leaf segmentation in early bolting of rapeseed. In addition, they also performed stem and fruit segmentation on a single branch of rapeseed during the siliqua stage. Xu et al. [32] captured a branch of rapeseed in the pod stage, obtained and reconstructed a point cloud model using a TOF camera, and based on this, used clustering algorithms to achieve single branch rapeseed pod segmentation and counting. Zhao et al. [33] used the cubic Bezier surface method combined with manual control points to reconstruct a three-dimensional mesh model of rapeseed leaves with a simple structure during the seedling stage. Teng [34] used U-Net to segment stems and leaves of early-bolting rapeseed plants and calculate phenotype parameters. However, the material used was only a single main stem, and the branching structure was similar to that of corn and sorghum. Shi [35] collected complete point clouds of rapeseed plants during the pod stage and performed statistical calculations. However, she used fewer plant branches and pods, and did not consider the interference between organs such as pods and stem branches in complex plant types.
In current study, we extracted phenotypic parameters from 3D point clouds of rapeseed, including plant height, leaf length, leaf width, and leaf area. When rapeseed was at the seedling stage, we adopted a segmentation method based on regional growth to segment a single complete rapeseed leaf point cloud, which is consistent with the research results of Paproki et al. [26]. Paproki et al. [26] proposed a new 3D grid-based technique for time high-throughput plant phenomenology and conducted preliminary tests on the analysis of cotton vegetative growth. By directly comparing quantitative data based on automatic grids with manually measured individual stem height, leaf width, and leaf length, average absolute errors of 9.34%, 5.75%, and 8.78% and correlation coefficients of 0.88, 0.96, and 0.95 were obtained, respectively. Our results were similar to Liu and Zhang et al. [27] who successfully calculated the 3D phenotypic structure information of maize seedlings including plant height, three-dimensional volume, leaf area, and leaf circumference from 3D point clouds generated from images while using the region growing algorithm to perform leaf segmentation. Similarly, Xiao et al. [25] also performed the segmentation of various organs in soybean plants using a normal differential difference algorithm, an improved region growing algorithm, and point cloud curvature features, and efficiently extracted phenotypic parameters such as leaf area, leaf width, leaf length, leaf inclination angle, and stem thickness through improved triangulation, and the nearest-neighbor algorithm.
We found that combining plane fitting with direct filtering has a good effect on removing ground point clouds. Further, for accuracy of subsequent point cloud phenotype parameter extraction, in this experiment we only preserved the leaf edges through the point cloud edge extraction method, making the extraction of key points more accurate, while, for the outlier noise points generated during the scanning process, using statistical filtering to denoise helps to obtain a relatively smooth rapeseed point cloud. This article sets a threshold for conditional filtering based on the spatial coordinates of individual rapeseed plants, which can effectively segment the point cloud of individual rapeseed plants.
Although rapid reconstruction of rapeseed 3D models has been achieved in previous studies, the point clouds obtained from 3D scanning or multi-view 3D reconstruction of plants suffer from issues such as missing information about leaf edges and plant interiors [36,37], making them unsuitable for 3D reconstruction of complex plants and making it difficult to extract organ-scale phenotype parameters with high precision [38,39]. Our study proposes an organ segmentation and phenotype parameter measurement method based on 3D point clouds of plants. The proposed method has a good segmentation effect on the mutual adhesion of rapeseed leaves during the seedling stage, providing an effective solution for organ segmentation and phenotype parameter measurement of multi-branched crops. This method can be widely used in plant analysis research due to its fast, direct, and automatic data collection, which reduces labor to a certain extent, improves efficiency, and compensates for the shortcomings of two-dimensional image information loss.
In summary, the line laser binocular stereo vision technology used in this experiment is feasible, which is consistent with the various studies mentioned above; the methods are the same, and the extraction of plant phenotypic traits is non-destructive, but each has its own limitations. The point cloud scanning device used in this article is not limited to individual plants. It can be applied in large fields, with simple operation and high accuracy. However, it has the problems of high cost and inconvenience in carrying, and the large number of point clouds obtained requires a certain amount of time for processing. Future research should aim to integrate 3D point cloud phenotypic data with genotypic information to better understand the genetic basis of important agronomic traits, potentially leading to more targeted breeding strategies and improved crop varieties. Additionally, exploring the application of 3D point cloud technology in a wider range of crops and under different environmental conditions could broaden its utility in precision agriculture. Advancements in computational power and the development of more efficient algorithms could help to mitigate the current challenges associated with data processing. There is also potential for developing more cost-effective and portable 3D imaging solutions, making this technology more accessible to a broader range of users.

5. Conclusions

This study mainly focuses on evaluating the extraction accuracy of rapeseed morphological traits based on 3D point cloud segmentation. We used a region growing method for the leaf area measurement from point clouds. The proposed method efficiently extracted the rapeseed morphological traits. The conditional filtering method successfully extracted the cloud points from a single rapeseed plant. Correlation analysis was performed between the manually measured plant height, leaf length, leaf width, and leaf area of rapeseed at the seedling stage and the values extracted from the 3D point cloud. The results showed that this experiment obtained quantitative metrics of the plant height, leaf length, leaf width, and leaf area of rapeseed.
The ultimate goal of extracting phenotype parameters of rapeseed in this article is to serve the improvement in crop yield and quality. However, it can not only be improved from cultivation measures, but also combined with genotypes to explore the phenotype traits of different varieties in the future, providing new means for crop breeding. Overall, our study findings provide an advanced approach for researchers and farmers to more effectively monitor crop growth, thereby improving agricultural practices and increasing crop productivity.

Author Contributions

Conceptualization, B.S. and C.S.; methodology, B.S., L.Z. and C.S.; software, M.Z.; validation, M.Z.; formal analysis, B.S.; investigation, L.Z. and M.Z.; resources, D.H. and M.Z.; data curation, B.S., M.Z. and D.H.; writing—original draft preparation, B.S. and M.Z.; writing—review and editing, B.S., M.Z., L.Z., D.H. and C.S.; supervision, C.S.; funding acquisition, C.S. All authors have read and agreed to the published version of the manuscript.

Funding

This research was funded by the Key Research and Development Program (Modern Agriculture) of Jiangsu Province (BE2022335, BE2022338).

Data Availability Statement

The original contributions presented in the study are included in the article; further inquiries can be directed to the corresponding author.

Acknowledgments

I sincerely thank all the contributors to this paper, without whom the output of this paper would not be possible.

Conflicts of Interest

The authors declare no conflicts of interest.

References

  1. Yu, S.; Liu, X.; Tan, Q.; Wang, Z.; Zhang, B. Sensors, systems and algorithms of 3D reconstruction for smart agriculture and precision farming: A review. Comput. Electron. Agric. 2024, 224, 109229. [Google Scholar] [CrossRef]
  2. Hegewald, H.; Wensch-Dorendorf, M.; Sieling, K.; Christen, O. Impacts of break crops and crop rotations on oilseed rape productivity: A review. Eur. J. Agron. 2018, 101, 63–77. [Google Scholar] [CrossRef]
  3. Xu, P.; Zhu, Y.; Zhang, Y.; Jiang, J.; Yang, L.; Mu, J.; Yu, X.; He, Y. Global Analysis of the Genetic Variations in miRNA-Targeted Sites and Their Correlations With Agronomic Traits in Rapeseed. Front. Genet. 2021, 12, 741858. [Google Scholar] [CrossRef] [PubMed]
  4. Zheng, Q.; Liu, K. Worldwide rapeseed (Brassica napus L.) research: A bibliometric analysis during 2011–2021. Oil Crop Sci. 2022, 7, 157–165. [Google Scholar] [CrossRef]
  5. Goodacre, R.; Roberts, L.; Ellis, D.I.; Thorogood, D.; Reader, S.M.; Ougham, H.; King, I. From phenotype to genotype: Whole tissue profiling for plant breeding. Metabolomics 2007, 3, 489–501. [Google Scholar] [CrossRef]
  6. Murphy, K.M.; Ludwig, E.; Gutierrez, J.; Gehan, M.A. Deep Learning in Image-Based Plant Phenotyping. Annu. Rev. Plant Biol. 2024, 75, 771–795. [Google Scholar] [CrossRef] [PubMed]
  7. Mostafa, S.; Mondal, D.; Panjvani, K.; Kochian, L.; Stavness, I. Explainable deep learning in plant phenotyping. Front. Artif. Intell. 2023, 6, 1203546. [Google Scholar] [CrossRef] [PubMed]
  8. Jin, S.; Su, Y.; Wu, F.; Pang, S.; Gao, S.; Hu, T.; Liu, J.; Guo, Q. Stem–Leaf Segmentation and Phenotypic Trait Extraction of Individual Maize Using Terrestrial LiDAR Data. IEEE Trans. Geosci. Remote Sens. 2019, 57, 1336–1346. [Google Scholar] [CrossRef]
  9. Fang, H.; Hu, L.; He, R.; He, Y. Research on methods of plant 3D information acquisition. Trans. Chin. Soc. Agric. Eng. 2012, 28, 142–147. [Google Scholar]
  10. Wu, S.; Wen, W.; Gou, W.; Lu, X.; Zhang, W.; Zheng, C.; Xiang, Z.; Chen, L.; Guo, X. A miniaturized phenotyping platform for individual plants using multi-view stereo 3D reconstruction. Front. Plant Sci. 2022, 13, 897746. [Google Scholar] [CrossRef]
  11. Shi, W.; Hao, Y.; Zhao, M.; Lv, Z.; Hu, X.; Li, F. Plant phenotype analysis based on 3D reconstruction technology. Internet Things Technol. 2019, 9, 84–86. [Google Scholar] [CrossRef]
  12. Yin, Y.; Zhang, H.; Zheng, J. Plant phenotype analysis based on 3D reconstruction technology. Internet Things Technol. 2021, 42, 129–135. [Google Scholar] [CrossRef]
  13. Jin, X.; Nie, C.; Shi, L. Crop phenotypic trait identification technology promotes the development of smart agriculture. In Proceedings of the 19th Annual Conference of the Chinese Crop Society, Wuhan, China; 2020. [Google Scholar]
  14. Sun, Z.; Lu, S.; Guo, X.; Wen, W. Surfaces reconstruction of plant leaves based on point cloud data. Trans. Chin. Soc. Agric. Eng. 2012, 28, 184–190. [Google Scholar]
  15. Li, Q.; Mao, H.; Li, P.; Le, Z. 3D visualization of plant leaves based on laser scanning point cloud data. Anhui Agric. Sci. 2011, 39, 20239–20241. [Google Scholar] [CrossRef]
  16. Wang, Y.; Wen, W.; Guo, X.; Zhao, C. 3D reconstruction of plant leaves based on point cloud data. J. Chin. Agric. Sci. Technol. 2014, 16, 83–89. [Google Scholar] [CrossRef]
  17. Dong, S.; Lin, B.; Lin, T.; Shi, X.; Zhang, D.; Xu, Z.; Yan, H.; Shi, X. Measurement and visual modelling of the three-dimensional structure of oilseed rape plants. Zhejiang Agric. J. 2013, 25, 926–932. [Google Scholar]
  18. Li, F.Y.; Huang, H.; Mei, G.U.; Guan, C.Y. Research progress toward the ideal type of rapeseed plant. Chin. J. Oil Crop Sci. 2023, 45, 4–16. [Google Scholar]
  19. Liu, H. Practical Rapeseed Cultivation; Shanghai Science and Technology Press: Shanghai, China, 1987. [Google Scholar]
  20. Li, Y.; Liu, J.; Zhang, B.; Wang, Y.; Yao, J.; Zhang, X.; Fan, B.; Li, X.; Hai, Y.; Fan, X. Three-dimensional reconstruction and phenotype measurement of maize seedlings based on multi-view image sequences. Front. Plant Sci. 2022, 13, 974339. [Google Scholar] [CrossRef] [PubMed]
  21. Wang, Y.; Wen, W.; Wu, S.; Wang, C.; Yu, Z.; Guo, X.; Zhao, C. Maize Plant Phenotyping: Comparing 3D Laser Scanning, Multi-View Stereo Reconstruction, and 3D Digitizing Estimates. Remote Sens. 2019, 11, 63. [Google Scholar] [CrossRef]
  22. Li, S.; Zhang, A.; Zhang, X.; Yang, Z.; Li, M. Method for extracting three-dimensional phenotypic information of maize seedlings at the leaf scale. Prog. Laser Optoelectron. 2023, 60, 71–79. [Google Scholar]
  23. Ma, X.; Wei, B.; Guan, H.; Cheng, Y.; Zhuo, Z. A method for calculating and simulating phenotype of soybean based on 3D reconstruction. Eur. J. Agron. 2024, 154, 127070. [Google Scholar] [CrossRef]
  24. Zhu, R.; Sun, K.; Yan, Z.; Yan, X.; Yu, J.; Shi, J.; Hu, Z.; Jiang, H.; Xin, D.; Zhang, Z.; et al. Analysing the phenotype development of soybean plants using low-cost 3D reconstruction. Sci. Rep. 2020, 10, 7055. [Google Scholar] [CrossRef]
  25. Xiao, Y.; Liu, S.; Hou, C.; Liu, Q.; Li, F.; Zhang, W. Organ segmentation and phenotype analysis of soybean plants based on 3D point cloud. China Agric. Sci. Technol. Her. 2023, 25, 115–125. [Google Scholar] [CrossRef]
  26. Paproki, A.; Sirault, X.; Berry, S.; Furbank, R.; Fripp, J. A novel mesh processing based technique for 3D plant analysis. BMC Plant Biol. 2012, 12, 63. [Google Scholar] [CrossRef] [PubMed]
  27. Liu, Y.; Zhang, G.; Shao, K.; Xiao, S.; Wang, Q.; Zhu, J.; Wang, R.; Meng, L.; Ma, Y. Segmentation of Individual Leaves of Field Grown Sugar Beet Plant Based on 3D Point Cloud. Agronomy 2022, 12, 893. [Google Scholar] [CrossRef]
  28. Fang, W.; Feng, H.; Yang, W.; Duan, L.; Chen, G.; Xiong, L.; Liu, Q. High-throughput volumetric reconstruction for 3D wheat plant architecture studies. J. Innov. Opt. Health Sci. 2016, 9, 1650037. [Google Scholar] [CrossRef]
  29. Fu, D.H.; Jiang, L.Y.; Mason, A.S.; Xiao, M.L.; Zhu, L.R.; Li, L.Z.; Zhou, Q.H.; Shen, C.J.; Huang, C.H. Research progress and strategies for multifunctional rapeseed: A case study of China. J. Integr. Agric. 2016, 15, 1673–1684. [Google Scholar] [CrossRef]
  30. Hu, J.; Chen, B.; Zhao, J.; Zhang, F.; Xie, T.; Xu, K.; Gao, G.; Yan, G.; Li, H.; Li, L.; et al. Genomic selection and genetic architecture of agronomic traits during modern rapeseed breeding. Nat. Genet. 2022, 54, 694–704. [Google Scholar] [CrossRef] [PubMed]
  31. Lin, Y.; Ruifang, Z.; Pujuan, S.; Pengfei, W. Segmentation of crop organs through region growing in 3D space. In Proceedings of the 2016 Fifth International Conference on Agro-Geoinformatics (Agro-Geoinformatics), Tianjin, China, 18–20 July 2016; pp. 1–6. [Google Scholar]
  32. Xu, Y.; Lu, K.; Pan, L.; Liu, T.; Zhou, Y.; Wang, B. Three-dimensional reconstruction of oilseed rape branches based on RGB-D camera with angiosperm identification and localisation. J. Agric. Mach. 2019, 50, 21–27. [Google Scholar]
  33. Zhao, L.; Wen, W.; Peng, Y.; Guo, X.; Lu, S.; Du, J. Research on geometric modelling of oilseed rape at seedling stage. Anhui Agric. Sci. 2011, 39, 14005–14007. [Google Scholar] [CrossRef]
  34. Teng, X. Three-Dimensional Reconstruction of Oilseed Rape Plants Based on RGB-D Camera and Algorithm for Carex Phenotype Detection. Bachelor’s Thesis, Huazhong Agricultural University, Wuhan, China, 2022. [Google Scholar]
  35. Shi, P. Research on Point Cloud Data Processing Method for Automatic Measurement of Phenotypic Parameters in Mature Oilseed Rape. Bachelor’s Thesis, Huazhong Agricultural University, Wuhan, China, 2017. [Google Scholar]
  36. Yang, M.; Cho, S.I. High-Resolution 3D Crop Reconstruction and Automatic Analysis of Phenotyping Index Using Machine Learning. Agriculture 2021, 11, 1010. [Google Scholar] [CrossRef]
  37. Yang, D.; Yang, H.; Liu, D.; Wang, X. Research on automatic 3D reconstruction of plant phenotype based on Multi-View images. Comput. Electron. Agric. 2024, 220, 108866. [Google Scholar] [CrossRef]
  38. Li, Y.; Xia, H.; Liu, Y.; Ji, K.; Huo, L.; Ni, C. Research on Morphological Indicator Extraction Method of PinusmassonianaLamb. Based on 3D Reconstruction. Forests 2023, 14, 1726. [Google Scholar] [CrossRef]
  39. Yang, Y.; Zhang, J.; Wu, K.; Zhang, X.; Sun, J.; Peng, S.; Li, J.; Wang, M. 3D Point Cloud on Semantic Information for Wheat Reconstruction. Agriculture 2021, 11, 450. [Google Scholar] [CrossRef]
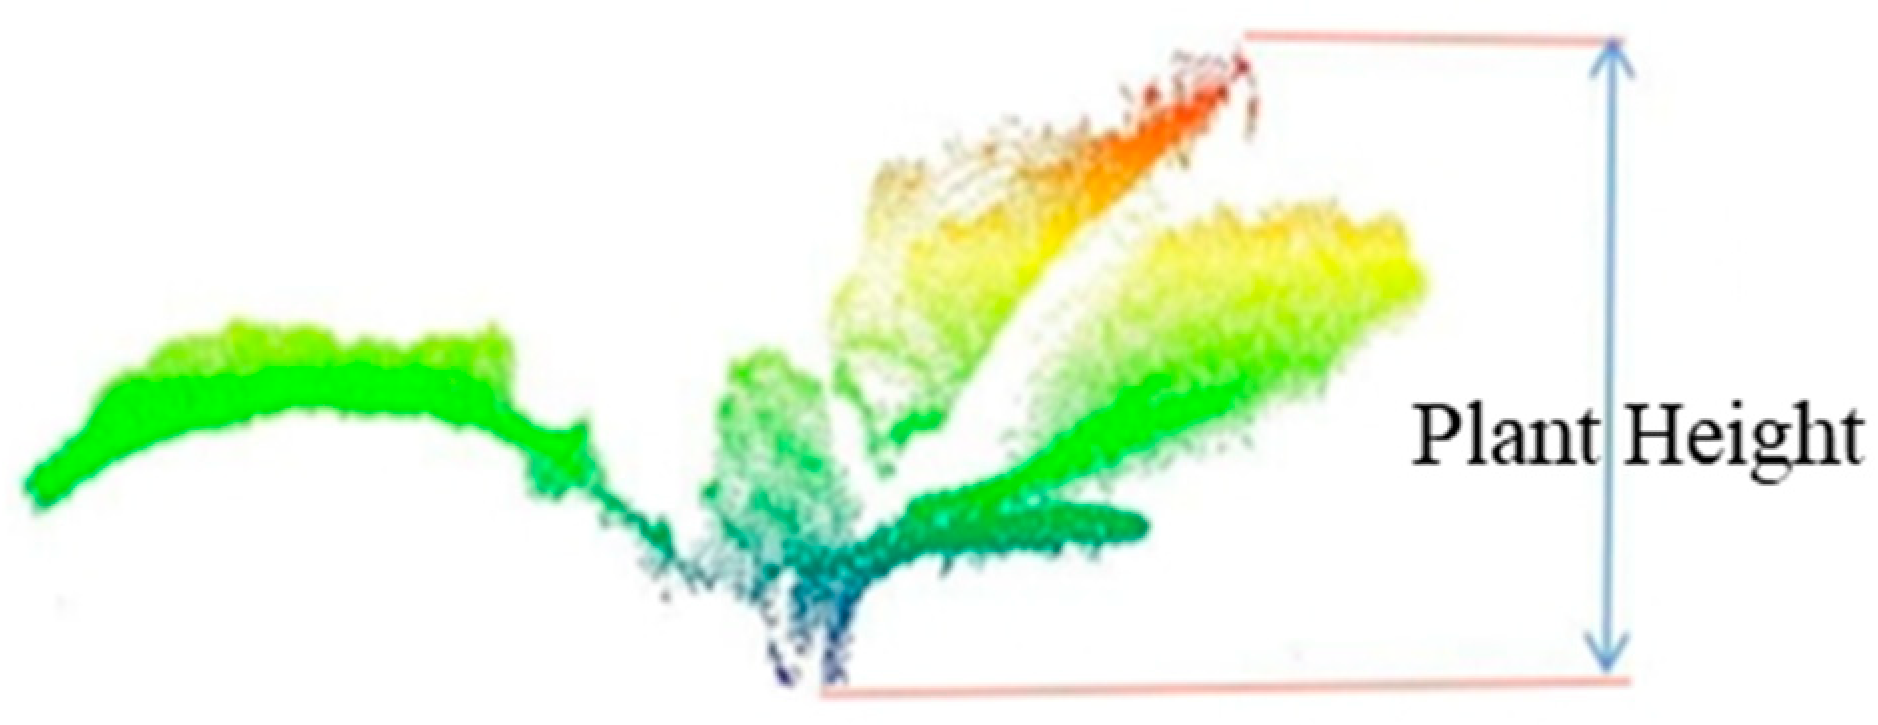
Figure 2. Schematic diagram of rapeseed plant height.
Agronomy 15 00276 g002
Figure 3. Leaf morphology of rapeseed leaves. Long-stalked (left), short-stalked (middle), and sessile (right).
Agronomy 15 00276 g003
Figure 5. A pictorial representation of the rapeseed leaf after greedy projection.
Agronomy 15 00276 g005
Figure 6. Technology roadmap.
Agronomy 15 00276 g006
Figure 7. Variations in agronomic parameters among different rapeseed varieties at the seedling stage: (a) plant height; (b) leaf length; (c) leaf width; (d) leaf area.
Agronomy 15 00276 g007
Figure 8. Accuracy estimation of plant height of rapeseed varieties extracted from point clouds.
Agronomy 15 00276 g008
Figure 9. Accuracy estimation of leaf length of rapeseed varieties extracted from point clouds.
Agronomy 15 00276 g009
Figure 10. Accuracy estimation of leaf width of rapeseed varieties extracted from point clouds.
Agronomy 15 00276 g010
Figure 11. Accuracy estimation of leaf area of rapeseed varieties extracted from point clouds.
Agronomy 15 00276 g011
Table 1. Comparison of agronomic traits between different varieties (M ± SD).
GroupLeaf LengthLeaf WidthLeaf AreaPlant Height
Qinyou 73.32 ± 0.63 a2.65 ± 0.58 a6.48 ± 2.32 a5.90 ± 0.89 b
Zheyouza 1083.44 ± 0.80 a2.88 ± 0.75 a7.58 ± 3.53 a7.56 ± 0.82 a
Huyou 0393.21 ± 0.76 a2.77 ± 0.75 a6.63 ± 3.53 a6.42 ± 0.86 ab
Note: Different lowercase letters in the table indicate significant differences between varieties, p < 0.05.
Table 2. Comparison of average plant height (cm) data between 3D point cloud extraction and manual measurement in different rapeseed varieties.
VarietyPlant Height (cm)Difference (%)
3D Extraction ValueManual Measurement Value
Qinyou 75.95.1213.3
Zheyouza 1087.567.461.3
Huyou 0396.426.360.9
Table 3. Extraction of average leaf length (cm) from 3D point cloud in different rapeseed varieties.
VarietyLeaf Length (cm)
Leaf 1Leaf 2Leaf 3Leaf 4
Qinyou 73.42.943.483.5
Zheyouza 1082.743.723.63.5
Huyou 0393.143.43.462.8
Table 4. Extraction of average leaf width (cm) from 3D point cloud in different rapeseed varieties.
VarietyLeaf Width (cm)
Leaf 1Leaf 2Leaf 3Leaf 4
Qinyou 72.482.522.82.68
Zheyouza 1082.043.13.123.12
Huyou 0392.622.932.24
Table 5. Extraction of average area (cm2) from 3D point cloud in different rapeseed varieties.
VarietyLeaf Area
Leaf 1Leaf 2Leaf 3Leaf 4
Qinyou 75.525.977.76
Zheyouza 1086.86.87.19.92
Huyou 0396.247.347.425.7
Disclaimer/Publisher’s Note: The statements, opinions and data contained in all publications are solely those of the individual author(s) and contributor(s) and not of MDPI and/or the editor(s). MDPI and/or the editor(s) disclaim responsibility for any injury to people or property resulting from any ideas, methods, instructions or products referred to in the content.