Article

A Multi-Feature Estimation Model for Olive Canopy Chlorophyll Combining XGBoost with UAV Imagery

1
College of Forestry, Southwest Forestry University, Kunming 650224, China
2
Precision Agriculture Laboratory, School of Life Sciences, Technical University of Munich, 80333 Munich, Germany
3
College of Big Data and Intelligent Engineering, Southwest Forestry University, Kunming 650224, China
4
Yunnan Key Laboratory of Plateau Wetland Conservation, Restoration and Ecological Services, Kunming 650224, China
5
College of Ecology and Environment (College of Wetlands), Southwest Forestry University, Kunming 650224, China
*
Author to whom correspondence should be addressed.
Agronomy 2025, 15(12), 2718; https://doi.org/10.3390/agronomy15122718
Submission received: 9 October 2025 / Revised: 10 November 2025 / Accepted: 11 November 2025 / Published: 26 November 2025

Abstract

Olive (Olea europaea L.) is an important woody oil crop worldwide, and accurate estimation of leaf chlorophyll content is critical for assessing nutritional status, photosynthetic capacity, and precision crop management. Unmanned aerial vehicle (UAV) remote sensing, with high spatiotemporal resolution, has increasingly been applied in crop growth monitoring. However, the small, thick, waxy leaves of olive, together with its complex canopy structure and dense arrangement, may reduce estimation accuracy. To identify sensitive features related to olive leaf chlorophyll and to evaluate the feasibility of UAV-based estimation methods for olive trees with complex canopy structures, UAV multispectral orthophotos were acquired, and leaf chlorophyll was measured using a SPAD (Soil Plant Analysis Development) meter to provide ground-truth data. A dataset including single-band reflectance, vegetation indices, and texture features was built, and sensitive variables were identified by Pearson correlation. Modeling was performed with linear regression (LR), Random Forest (RF), Extreme Gradient Boosting (XGBoost), Partial Least Squares Regression (PLSR), and Support Vector Machine (SVM). Results showed that two spectral bands (green and red), one vegetation index (TCARI/OSAVI), and twelve texture features correlated strongly with SPAD values. Among the machine learning models, XGBoost achieved the highest accuracy, demonstrating the effectiveness of integrating multi-feature UAV data for complex olive canopies. This study demonstrates that combining reflectance, vegetation indices, and texture features within the XGBoost model enables reliable chlorophyll estimation for olive canopies, highlighting the potential of UAV-based multispectral approaches for precision monitoring and providing a foundation for applications in other woody crops with complex canopy structures.

1. Introduction

The olive tree (Olea europaea L.) is a woody industrial oil crop of global significance. Its value lies not only in its high oil yield and high-quality olive oil but also in its by-products, including leaves and fruit residues. These by-products can be used to extract bioactive compounds, such as oleuropein and polyphenols, which are widely applied in food processing, pharmaceuticals, cosmetics, and nutritional supplements, thereby forming an integrated value chain from cultivation to the development of functional products [1]. In addition, olive leaves and processing residues are rich in bioactive components, such as hydroxytyrosol and oleuropein derivatives, which are increasingly being utilized through green extraction technologies for the development of functional foods and pharmaceuticals [2]. It has been recognized by the Food and Agriculture Organization of the United Nations (FAO) as a key crop for enhancing agricultural resilience in arid regions due to its high oil yield, long lifespan, strong ecological adaptability, and carbon sequestration capacity [3]. Olive trees have a planting history of thousands of years in the Mediterranean region and have now expanded to North America, South America, Australia, Central Asia, and arid regions of Africa, demonstrating their potential for sustainable development [4]. They are also widely cultivated in China [5]. With the continued global expansion of olive tree cultivation, rapidly obtaining large-scale growth parameters has become an urgent challenge, among which estimating chlorophyll content is currently one of the research focuses.
Chlorophyll is the core photosynthetic pigment in plants, and its concentration is directly related to photosynthetic capacity, nutritional status, and crop health [6]. Dynamically monitoring chlorophyll content during olive growth can provide critical data for nitrogen management, pest and disease early warning systems, and fruit quality prediction [7]. However, traditional methods for quantifying chlorophyll mainly rely on destructive sampling and laboratory analysis, which are inefficient, costly, and cannot support real-time monitoring at the orchard scale [8]. Although portable devices (such as SPAD meters) allow non-destructive on-site measurements, their sampling points are sparse and have limited spatial representativeness, affecting the ability to accurately detect canopy changes at the stand scale [9].
With the advancement of precision agriculture, drones (UAVs) equipped with multispectral sensors have become key tools for monitoring crop growth dynamics. Their high spatiotemporal resolution, operational flexibility, and non-destructive characteristics make it efficient to obtain canopy spectral reflectance data, thereby promoting accurate estimation of key agronomic parameters, including chlorophyll content, leaf area index (LAI), aboveground biomass, and soil moisture, while significantly enhancing the ability to detect spatial heterogeneity. In practical applications, combining UAV multispectral imagery with crop growth models has been proven to be effective for yield estimation of field crops such as maize [10,11]. For orchard crops with complex canopies (such as apple trees), this technology also shows strong adaptability in chlorophyll monitoring [12]. UAV multispectral remote sensing has further expanded into agricultural environmental monitoring, such as using machine learning-assisted soil moisture estimation in citrus orchards [13], and evaluating transpiration and drought stress based on energy balance models in pistachio orchards to support precision irrigation [14]. Multimodal UAV datasets can also be used for yield prediction and lodging detection in soybean cultivation, promoting agricultural automation [15,16]. Overall, these applications establish a comprehensive monitoring framework covering multiple crops, parameters, and spatiotemporal scales, providing reliable data support for precision agricultural management.
The main features currently used for UAV-based multispectral estimation of crop chlorophyll content include single-band reflectance, vegetation indices, and texture information. Reflectance features serve as a basic source of information, directly reflecting the canopy’s response to light at different wavelengths, and are widely applied in chlorophyll content modeling for various crop types [17]. Vegetation indices enhance sensitivity to chlorophyll by combining specific wavelength bands, thereby improving the ability to capture the physiological state of the canopy [18]. Texture features, by capturing the spatial variability of images, compensate for the limitations of purely spectral features in representing differences in canopy structure [19]. A new research trend is to integrate these three features together, combining single-band reflectance, vegetation indices, and texture features through joint modeling methods to enhance the stability and generalization capability of chlorophyll estimation, demonstrating superior performance across various crops such as walnuts and apples [20].
As a key tool for integrating multi-source features, machine learning can deeply explore the nonlinear relationships between spectral reflectance, vegetation indices, and texture information in UAV multispectral remote sensing. This approach significantly improves the accuracy and generalization ability of chlorophyll estimation. In soybean studies, spectral resampling is used to simulate multispectral reflectance data, and vegetation indices are input into support vector machines (SVM), partial least squares regression (PLSR), or neural networks. These models have shown performance significantly superior to univariate methods [21]. For tall fescue (Mombaça grass), hyperspectral-derived indices processed by SVM enhanced the robustness of the models [22]. Research on lemongrass (Cymbopogon citratus) and sugarcane (Saccharum officinarum) indicates that combining vegetation indices with gray-level co-occurrence matrix (GLCM) texture features through random forests (RF) can effectively improve the retrieval of chlorophyll in structurally complex crops [23,24]. In studies on sugar beet, integrating machine learning with novel spectral indices has significantly enhanced the predictive accuracy of chlorophyll content and yield-quality parameters under different nitrogen levels [25].
The decline or yellowing of olive leaf chlorophyll content can result from various factors, mainly including iron deficiency, which is particularly common in limestone or alkaline soils [26]; deficiencies in nutrients such as nitrogen or magnesium [27]; water stress (including drought and over-irrigation) [28]; as well as root diseases or pest infestations [29]. Leaf yellowing is often an early signal of physiological or nutritional imbalance in plants. If not addressed, it can lead to reduced photosynthetic capacity, decreased oil yield, and even affect the long-term productivity of orchards. Therefore, an important problem that needs to be addressed is how to diagnose physiological or nutritional disorders in olive trees through timely and accurate monitoring of chlorophyll content, thereby providing a basis for adjusting management measures. In addition, as a woody oil crop, olive leaves are small and narrow, thick, and covered with a layer of wax. Although this structure is beneficial for drought resistance and water retention, it increases the difficulty of chlorophyll monitoring, mainly due to strong specular reflection and the complexity of spectral signals [30]. In view of these characteristics, it is currently uncertain whether UAV-based multispectral methods, which are widely used for farmland crops, can achieve reliable chlorophyll estimation in olive trees. Against this background, this study selected a typical olive planting area in Eshan County, Yunnan Province, as the research site and conducted a study on the inversion of olive leaf chlorophyll content based on a multi-source data fusion approach. SPAD values were obtained using ground-based portable instruments as actual chlorophyll measurements, while high-resolution remote sensing images of the study area were acquired using drones equipped with multispectral sensors. Single-band reflectance, vegetation indices, and texture features were extracted, followed by the application of univariate linear regression and various machine learning models to invert and model the chlorophyll content of olive leaves.

2. Materials and Methods

2.1. Study Area and Experimental Design

The study area is situated at an olive plantation in Dianzhong Town, Eshan County (Yuxi City, Yunnan Province, China; 102°15′16.471″ E to 102°15′26.981″ E, 24°25′39.295″ N to 24°25′43.756″ N). Characterized by a subtropical highland monsoon climate, the region exhibits an annual mean temperature of 17.2 °C, precipitation of ~861 mm, and sunshine duration of 2700 h. With elevations ranging from 1550 to 2393 m, significant diurnal temperature fluctuations and intense solar radiation enhance photosynthetic efficiency and oil accumulation in olive trees, optimally supporting their thermic and photic requirements. The acidic red soil (classified as Ferralic Cambisol per WRB taxonomy) features loose texture and favorable drainage, facilitating robust root development and micronutrient uptake. Plantation geometry follows a spacing regime of 7 m (row) × 5 m (plant), promoting canopy health, light penetration, and airflow to ensure stable high yields (Figure 1).
In this study, a total of 60 individual olive tree samples were collected for SPAD-based chlorophyll content inversion. To ensure the scientific rigor of model training and evaluation, the samples were randomly divided into a modeling set (42 trees) and a validation set (18 trees) at a ratio of 7:3. The modeling set was used to train regression and machine learning models in order to capture the relationships among single-band reflectance, vegetation indices, texture features, and chlorophyll content. The validation set was employed for independent assessment of prediction accuracy and generalization ability, thereby ensuring that the models remain robust when applied to unseen samples.

2.2. Ground-Based SPAD Measurement Data Acquisition

Within the study area, 60 olive trees exhibiting vigorous growth and no visible pest/disease symptoms were selected as sampling units. To account for canopy heterogeneity, one healthy mature leaf was collected from the mid-upper canopy in each cardinal direction (east, south, west, north) per tree, minimizing positional bias [31]. Leaf chlorophyll content was measured using a SPAD-502 chlorophyll meter (Konica Minolta, Tokyo, Japan). Before each measurement session, the meter was calibrated. The probe was pressed without a sample until an audible “beep” was heard and the display showed “N = 0”, indicating successful calibration. Measurements were performed on the adaxial (sunlit) surface of one leaf from each direction under consistent ambient illumination and from similar branch heights. The reliability of the SPAD-502 for olive leaves has been confirmed by Benítez et al. [26], who found a strong correlation (R2 = 0.90, p < 0.001) between SPAD readings and destructively measured chlorophyll content. Furthermore, SPAD values generally reflect actual leaf chlorophyll concentration, as shown in previous studies across different species [32,33]. Based on this validation, SPAD values from the four directions were averaged to represent the mean chlorophyll level of each tree and used as reference data for model calibration and evaluation.

2.3. Acquisition and Processing of Multispectral Data from Unmanned Aerial Vehicles

This study used the DJI Mavic 3 Enterprise series (M3E) unmanned aerial vehicle (UAV) platform equipped with the DJI Mavic 3 Multispectral (M3M) camera (DJI Company, Shenzhen, China) to acquire multispectral imagery from UAVs. The M3M camera features four spectral channels: Green (G, 560 ± 16 nm), Red (R, 650 ± 16 nm), Red Edge (RE, 730 ± 16 nm), and Near-Infrared (NIR, 860 ± 26 nm). Combined with the M3E drone’s vertical takeoff and landing (VTOL) capability and real-time kinematic (RTK) positioning system, it is suitable for small-scale crop monitoring and precision agriculture research. To ensure image quality and radiometric consistency, flight operations were conducted between 12:00 PM and 1:00 PM to minimize the impact of sunlight variations caused by changes in solar altitude angle [34]. During the flight mission, the flight altitude was set to 50 m, the flight speed to 6 m/s, the forward overlap to 80%, and the side overlap to 70% to ensure the integrity of image stitching and the accuracy of geometric reconstruction. At this altitude, the imagery provided a ground sampling distance (GSD) of approximately 2.2 cm per pixel. The M3M camera is equipped with an automatic radiometric correction feature. After acquiring the UAV imagery, the images were stitched into an orthomosaic using Pix4Dmapper 4.5.6 (Pix4D S.A., Lausanne, Switzerland). Calibration plates, captured prior to takeoff, were used to convert the image’s digital numbers (DN) to reflectance values. Pix4D’s algorithms then automatically adjusted for variations in brightness and contrast, ensuring smooth transitions between the images. Since the flight occurred around noon with minimal cloud cover and shadows, each olive tree canopy was manually delineated as a region of interest (ROI), and the average feature values within each tree’s canopy ROI were computed.

2.4. Single-Band, Vegetation Indices, and Texture Feature Extraction

Using ENVI 5.6 (Harris Geospatial Solutions, Broomfield, CO, USA), the canopy area of each olive tree was delineated as a region of interest (ROI) on the multispectral orthomosaic. Average reflectance values were extracted from the G, R, RE, and NIR single-band images to obtain the average reflectance values of pixels within each ROI, which serve as the spectral characteristics of individual olive tree canopies. Referring to previous studies on vegetation health and chlorophyll monitoring [35], typical vegetation indices (VIs) were calculated from the orthomosaic images, including the Normalized Difference Vegetation Index (NDVI), Normalized Difference Red-Edge Index (NDRE), and Transformed Chlorophyll Absorption-Reflectance Index (TCARI), etc. (Table 1). These vegetation indices were calculated from the reflectance values of each band in the multispectral images and served as important input variables for the model. To comprehensively characterize the structural complexity, spatial variability, and spectral heterogeneity of olive canopy layers [36], this study employed the Gray Level Co-occurrence Matrix (GLCM) method to extract eight typical texture features from the aforementioned four single-band images, including mean, variance, contrast (Contrast), Homogeneity, Energy (Angular Second Moment, ASM), Entropy, Correlation, and Dissimilarity, to comprehensively reflect the texture information of the canopy area.

2.5. Feature Selection

Pearson correlation analysis [52] was employed to evaluate the linear relationships between each spectral, vegetation index, and texture feature and SPAD values. To reduce dimensionality and avoid introducing redundant information caused by highly correlated variables, features showing significant correlations with SPAD (|r| ≥ 0.45, p < 0.01) were selected as sensitive variables and used as input features for model development. This feature screening also helps mitigate potential multicollinearity issues among variables at the data preprocessing stage, thereby improving the stability and efficiency of subsequent modeling. All correlation analyses were conducted using IBM SPSS Statistics 27.0 (IBM Corp., Armonk, NY, USA).

2.6. Model Construction

This study was conducted in a Python 3.13 environment, where the selected sensitive spectral bands, vegetation indices (VIs), and texture features were used as model inputs to construct SPAD-based chlorophyll content estimation models for olive leaves. First, a univariate linear regression model was established using a single variable as input to evaluate the independent explanatory power of different features on chlorophyll content. Subsequently, multi-feature combinations of sensitive spectral bands, vegetation indices, and texture features were used to construct four machine learning models: RF, XGBoost, PLSR, and SVM. Univariate linear regression analyzes the linear relationship between a single independent variable and the dependent variable [19]. RF is an ensemble learning method that reduces overfitting risk by integrating multiple trees and introducing random feature selection [53]. XGBoost optimizes the loss function iteratively, offering high computational efficiency and strong resistance to overfitting, making it widely applicable to large-scale nonlinear regression problems [54]. PLSR addresses multicollinearity through dimensionality reduction [55]. SVM implement structural risk minimization for small-sample, high-dimensional data challenges [56]. To optimize performance, all four machine learning methods underwent systematic hyperparameter tuning via grid search.

2.7. Model Accuracy Evaluation

To evaluate model predictive accuracy and reliability, this study employed three metrics: the coefficient of determination (R2), root mean square error (RMSE), and relative predictive deviation (RPD) (Formulas (1)–(3) [57]). Generally, RPD > 1.4 indicates acceptable predictive capability, while RPD > 2 demonstrates excellent performance. Through statistical comparison of these metrics across four regression models, this work objectively assesses predictive performance to identify the optimal approach.
R 2 = 1 i   = 1 n y i y ^ i 2 i   = 1 n y i y ¯ 2
RMSE = 1 n i = 1 n y i = y ^ i 2
RPD = SD RMSE = 1 n 1 i   = 1 n y i y ¯ 2 RMSE
Among them, y i is the measured SPAD value, y ^ i is the SPAD value predicted by the model, y ¯ represents the average value of the measured SPAD values, n is the number of samples in the test set, SD represents the standard deviation of the measured SPAD values, and RMSE is the root mean square error between the predicted values and the measured values.
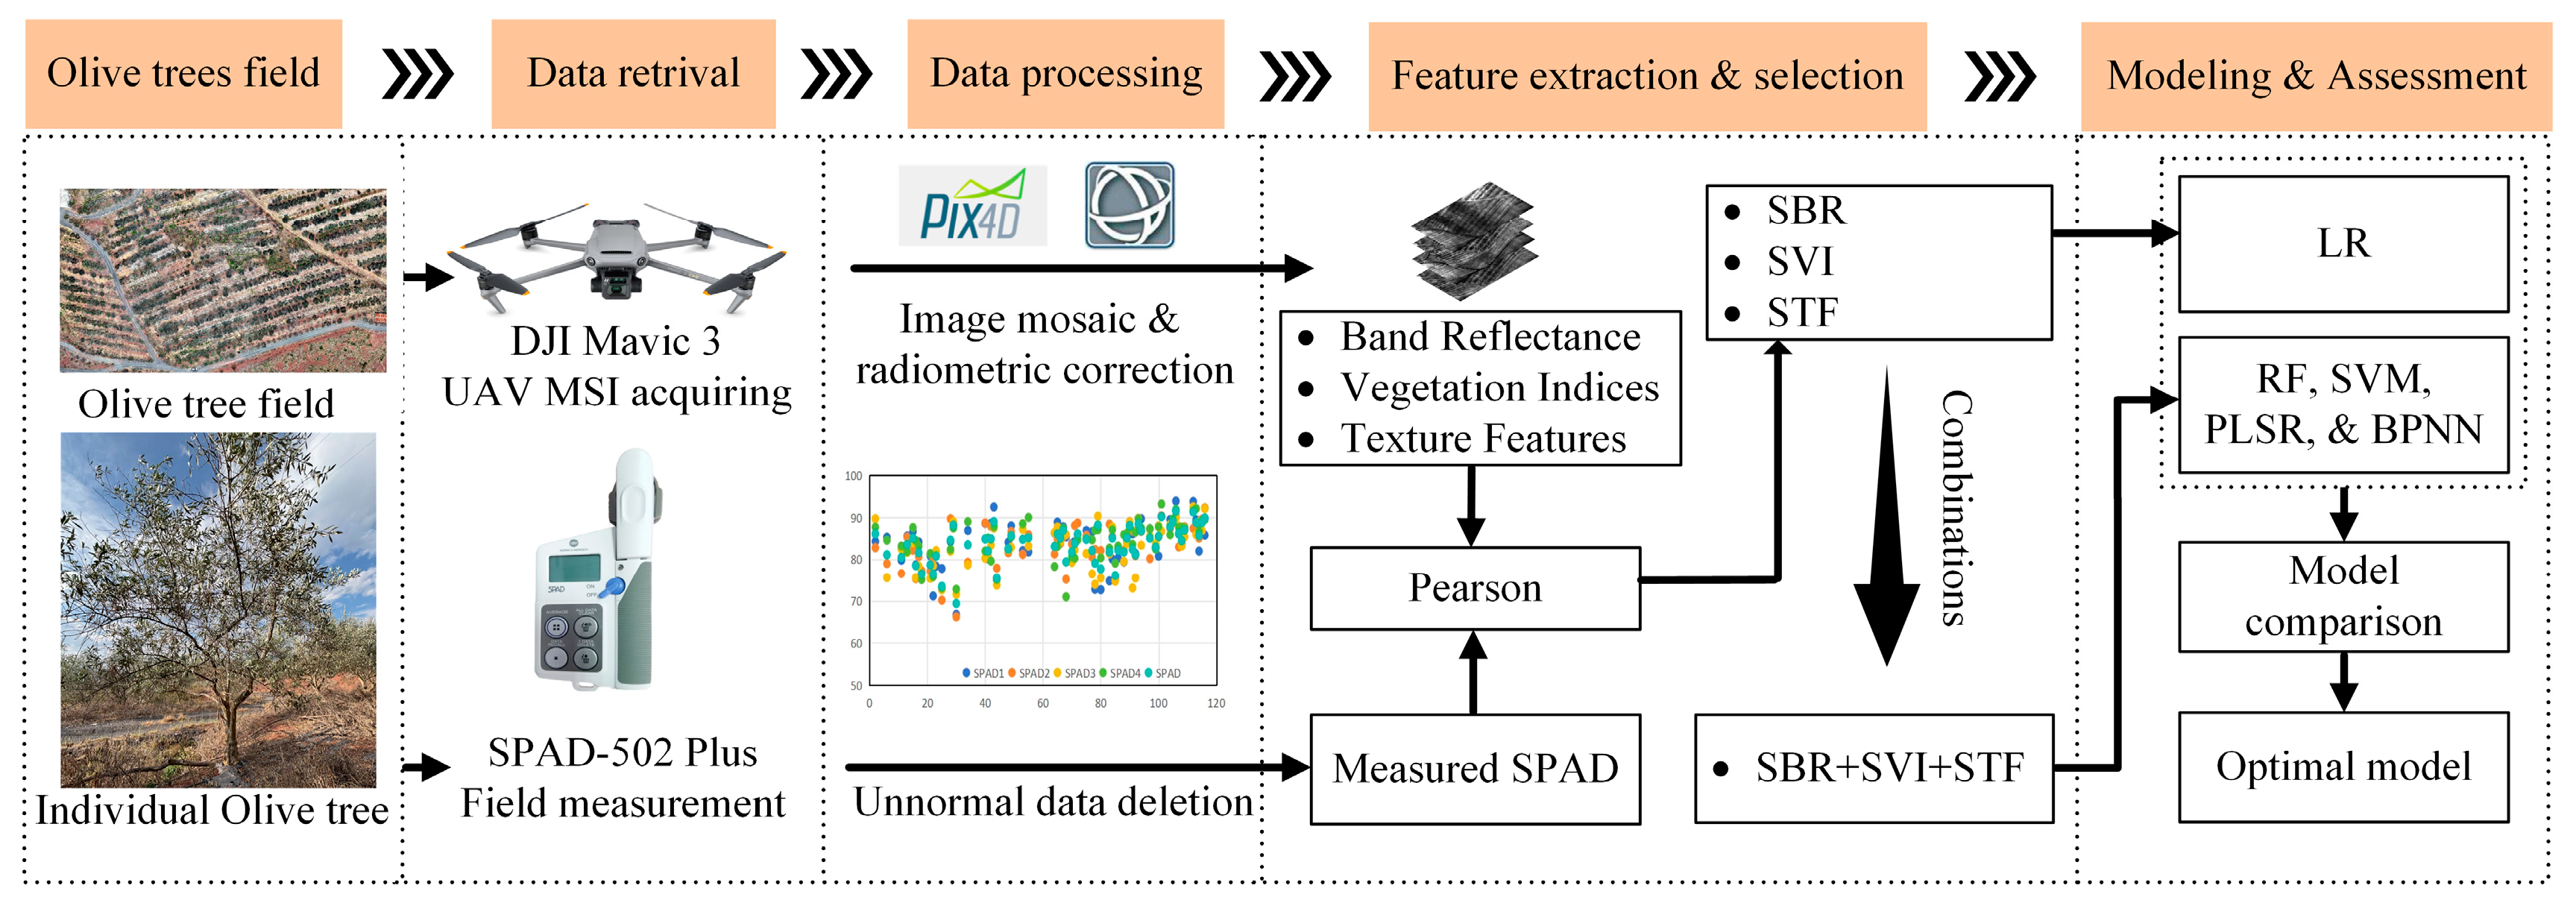
This study developed a comprehensive technical workflow encompassing data collection, feature extraction, and model evaluation (Figure 2). At the data level, chlorophyll content information of olive leaves was obtained by integrating UAV-based multispectral imagery with measured SPAD values. At the feature level, a set of sensitive features was established through spectral and texture feature extraction followed by correlation-based selection. At the modeling level, both univariate linear regression and multiple machine learning models were constructed using single- and multi-feature inputs, and their performance was compared and evaluated. This workflow achieved a systematic integration from data acquisition and feature optimization to model inversion, providing a complete technical pathway for the remote sensing estimation of chlorophyll content in olive leaves.

2.8. SHAP Analysis for Model Interpretability

To elucidate the interpretability of the optimal model and clarify the intrinsic relationships between multispectral features and predicted chlorophyll content in olive leaves, this study employs the SHapley Additive exPlanations (SHAP) method based on game theory principles [58]. SHAP quantifies the importance of each feature and its directional impact on the model’s predictions by calculating the contribution of each feature to the prediction outcome. This process is implemented using the SHAP library in a Python 3.13 environment.

3. Results

3.1. Correlation Between Multiple Features and SPAD

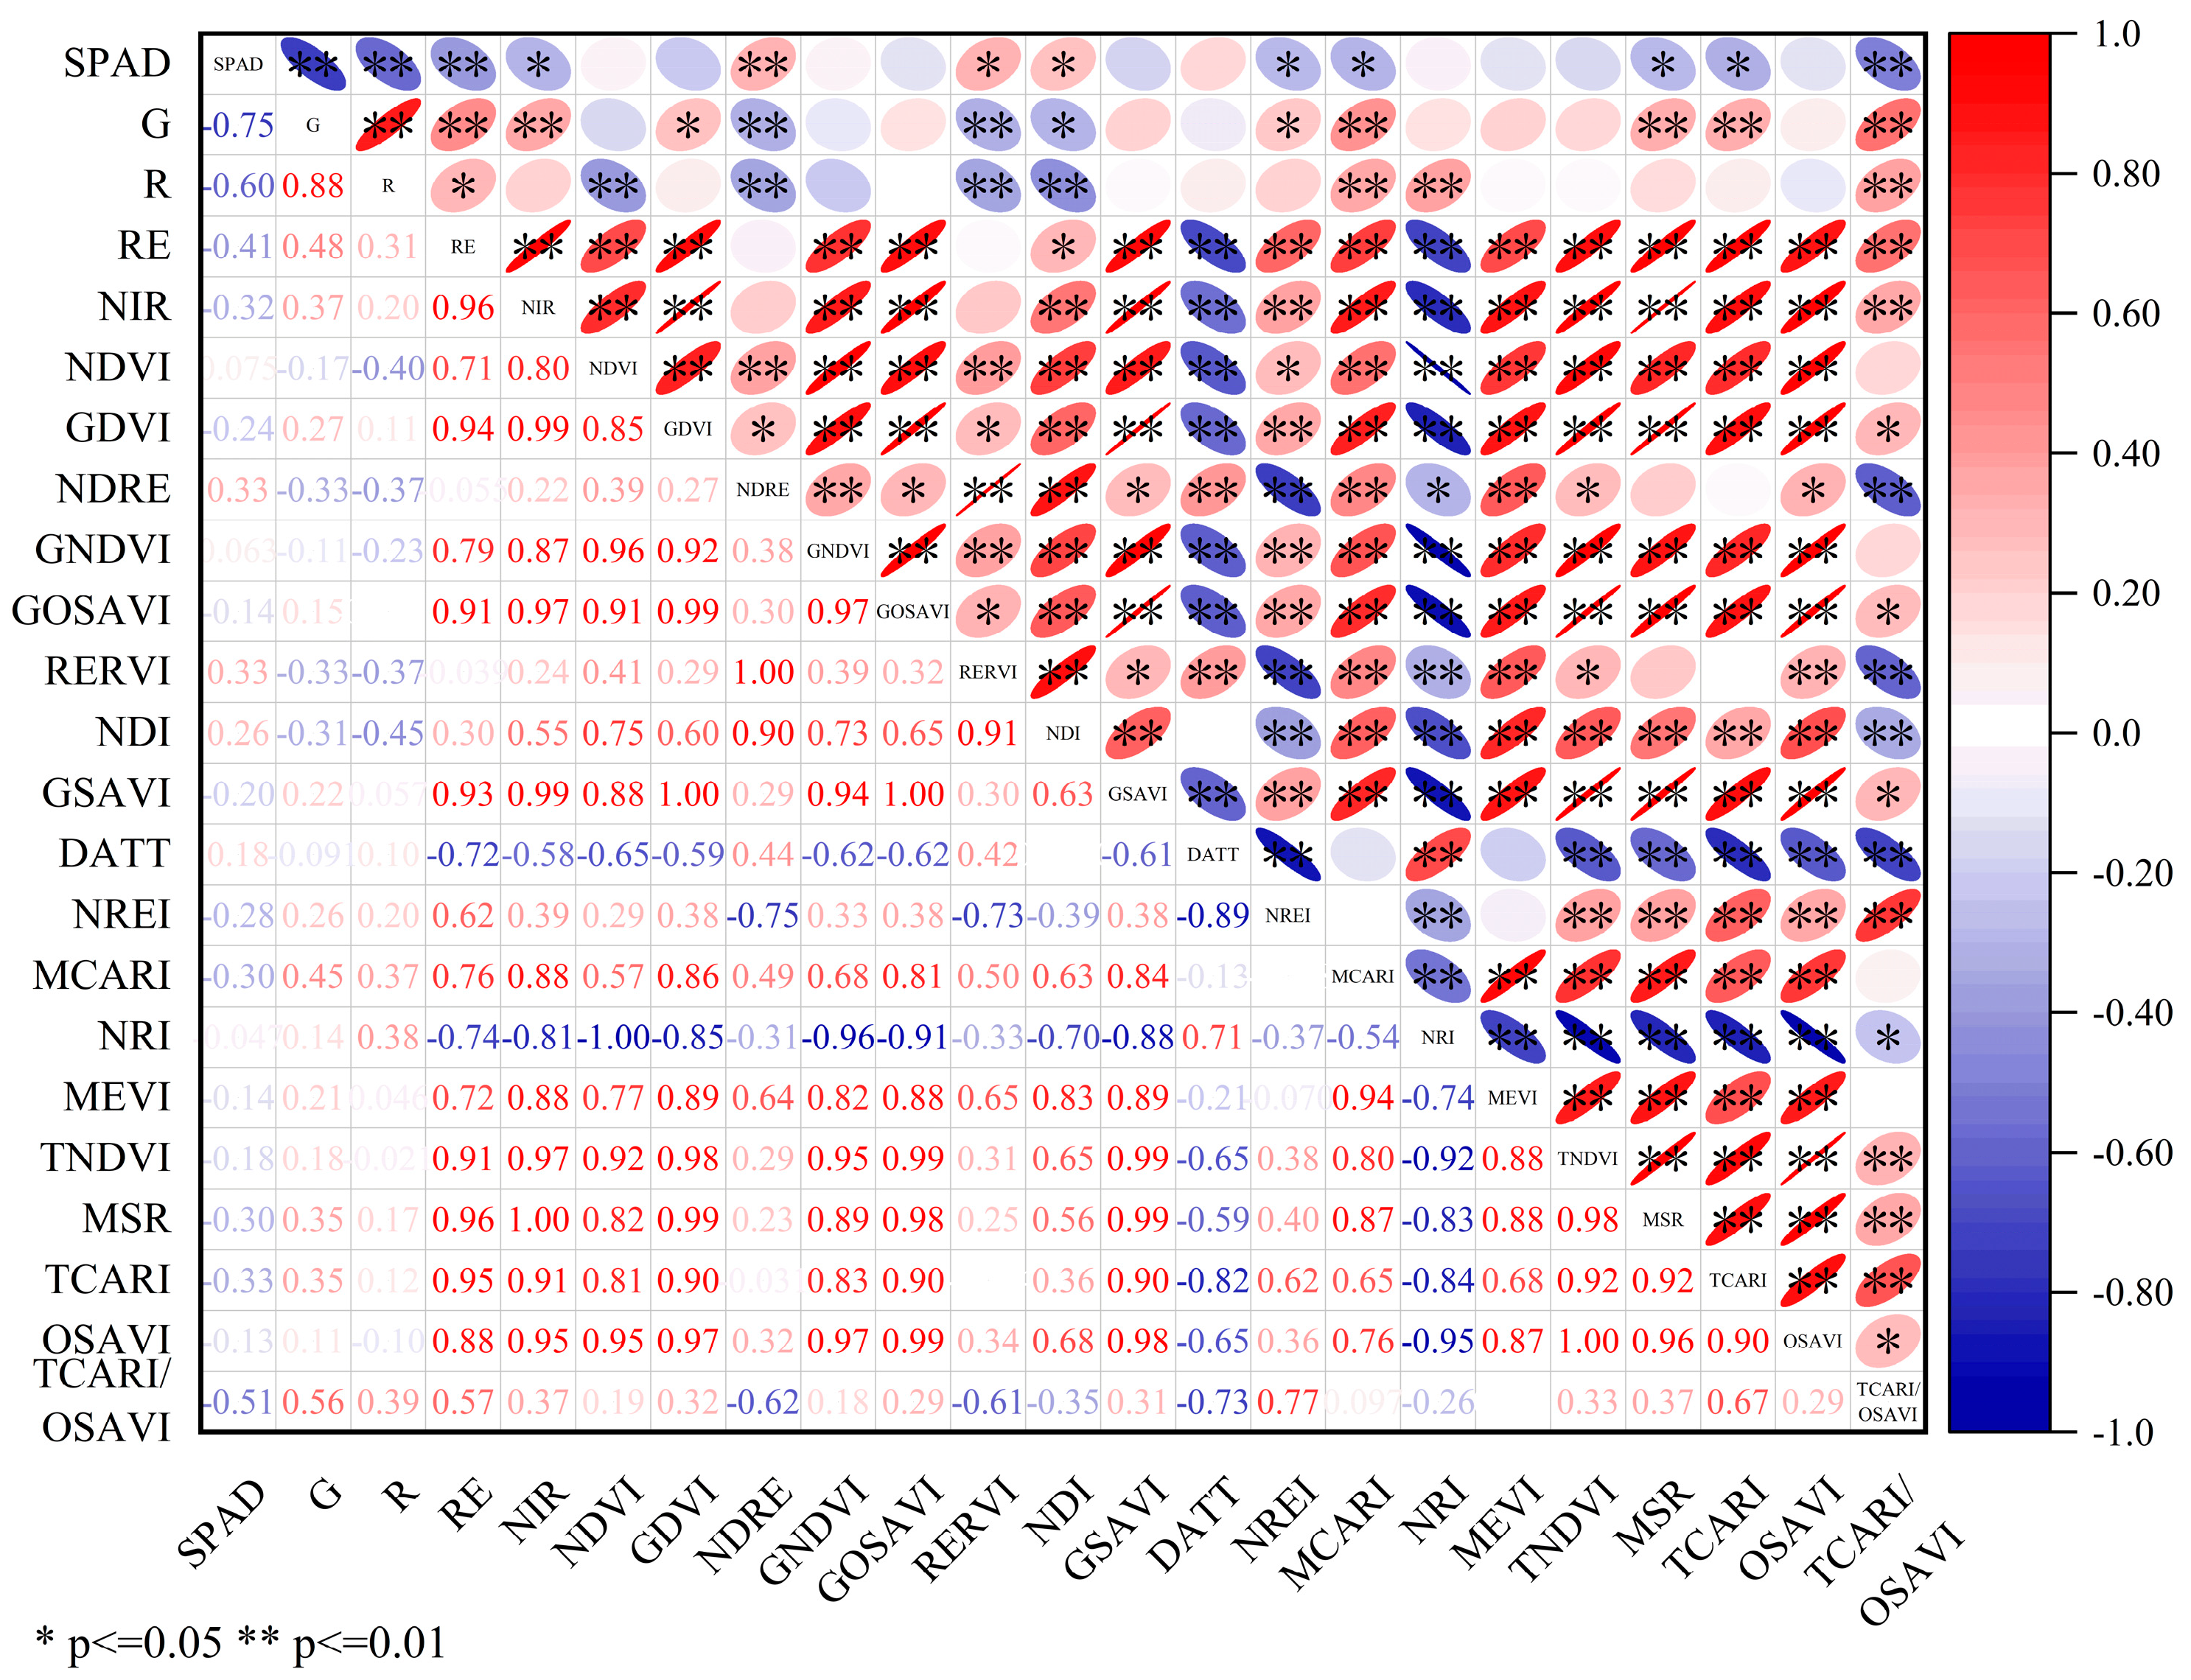
To reduce model complexity and improve prediction performance, this study used Pearson correlation analysis to screen for sensitive features among the extracted single-band reflectance, vegetation indices, and texture features. The analysis results indicate that, among the spectral features, the three single bands G, R, and RE are extremely significantly correlated with SPAD values at the p < 0.01 level, with correlation coefficients of −0.75, −0.60, and −0.41, respectively; the NIR band is significantly correlated at the p < 0.05 level, with a correlation coefficient of −0.32; NDRE and TCARI/OSAVI were highly significantly correlated with SPAD values at the p < 0.01 level, with correlation coefficients of 0.33 and 0.51, respectively; RERVI, NDI, NREI, MCARI, MSR, and TCARI were significantly correlated at the p < 0.05 level, with correlation coefficients ranging from 0.26 to 0.33 in absolute value. The remaining indices did not show significant correlation with SPAD values (Figure 3).
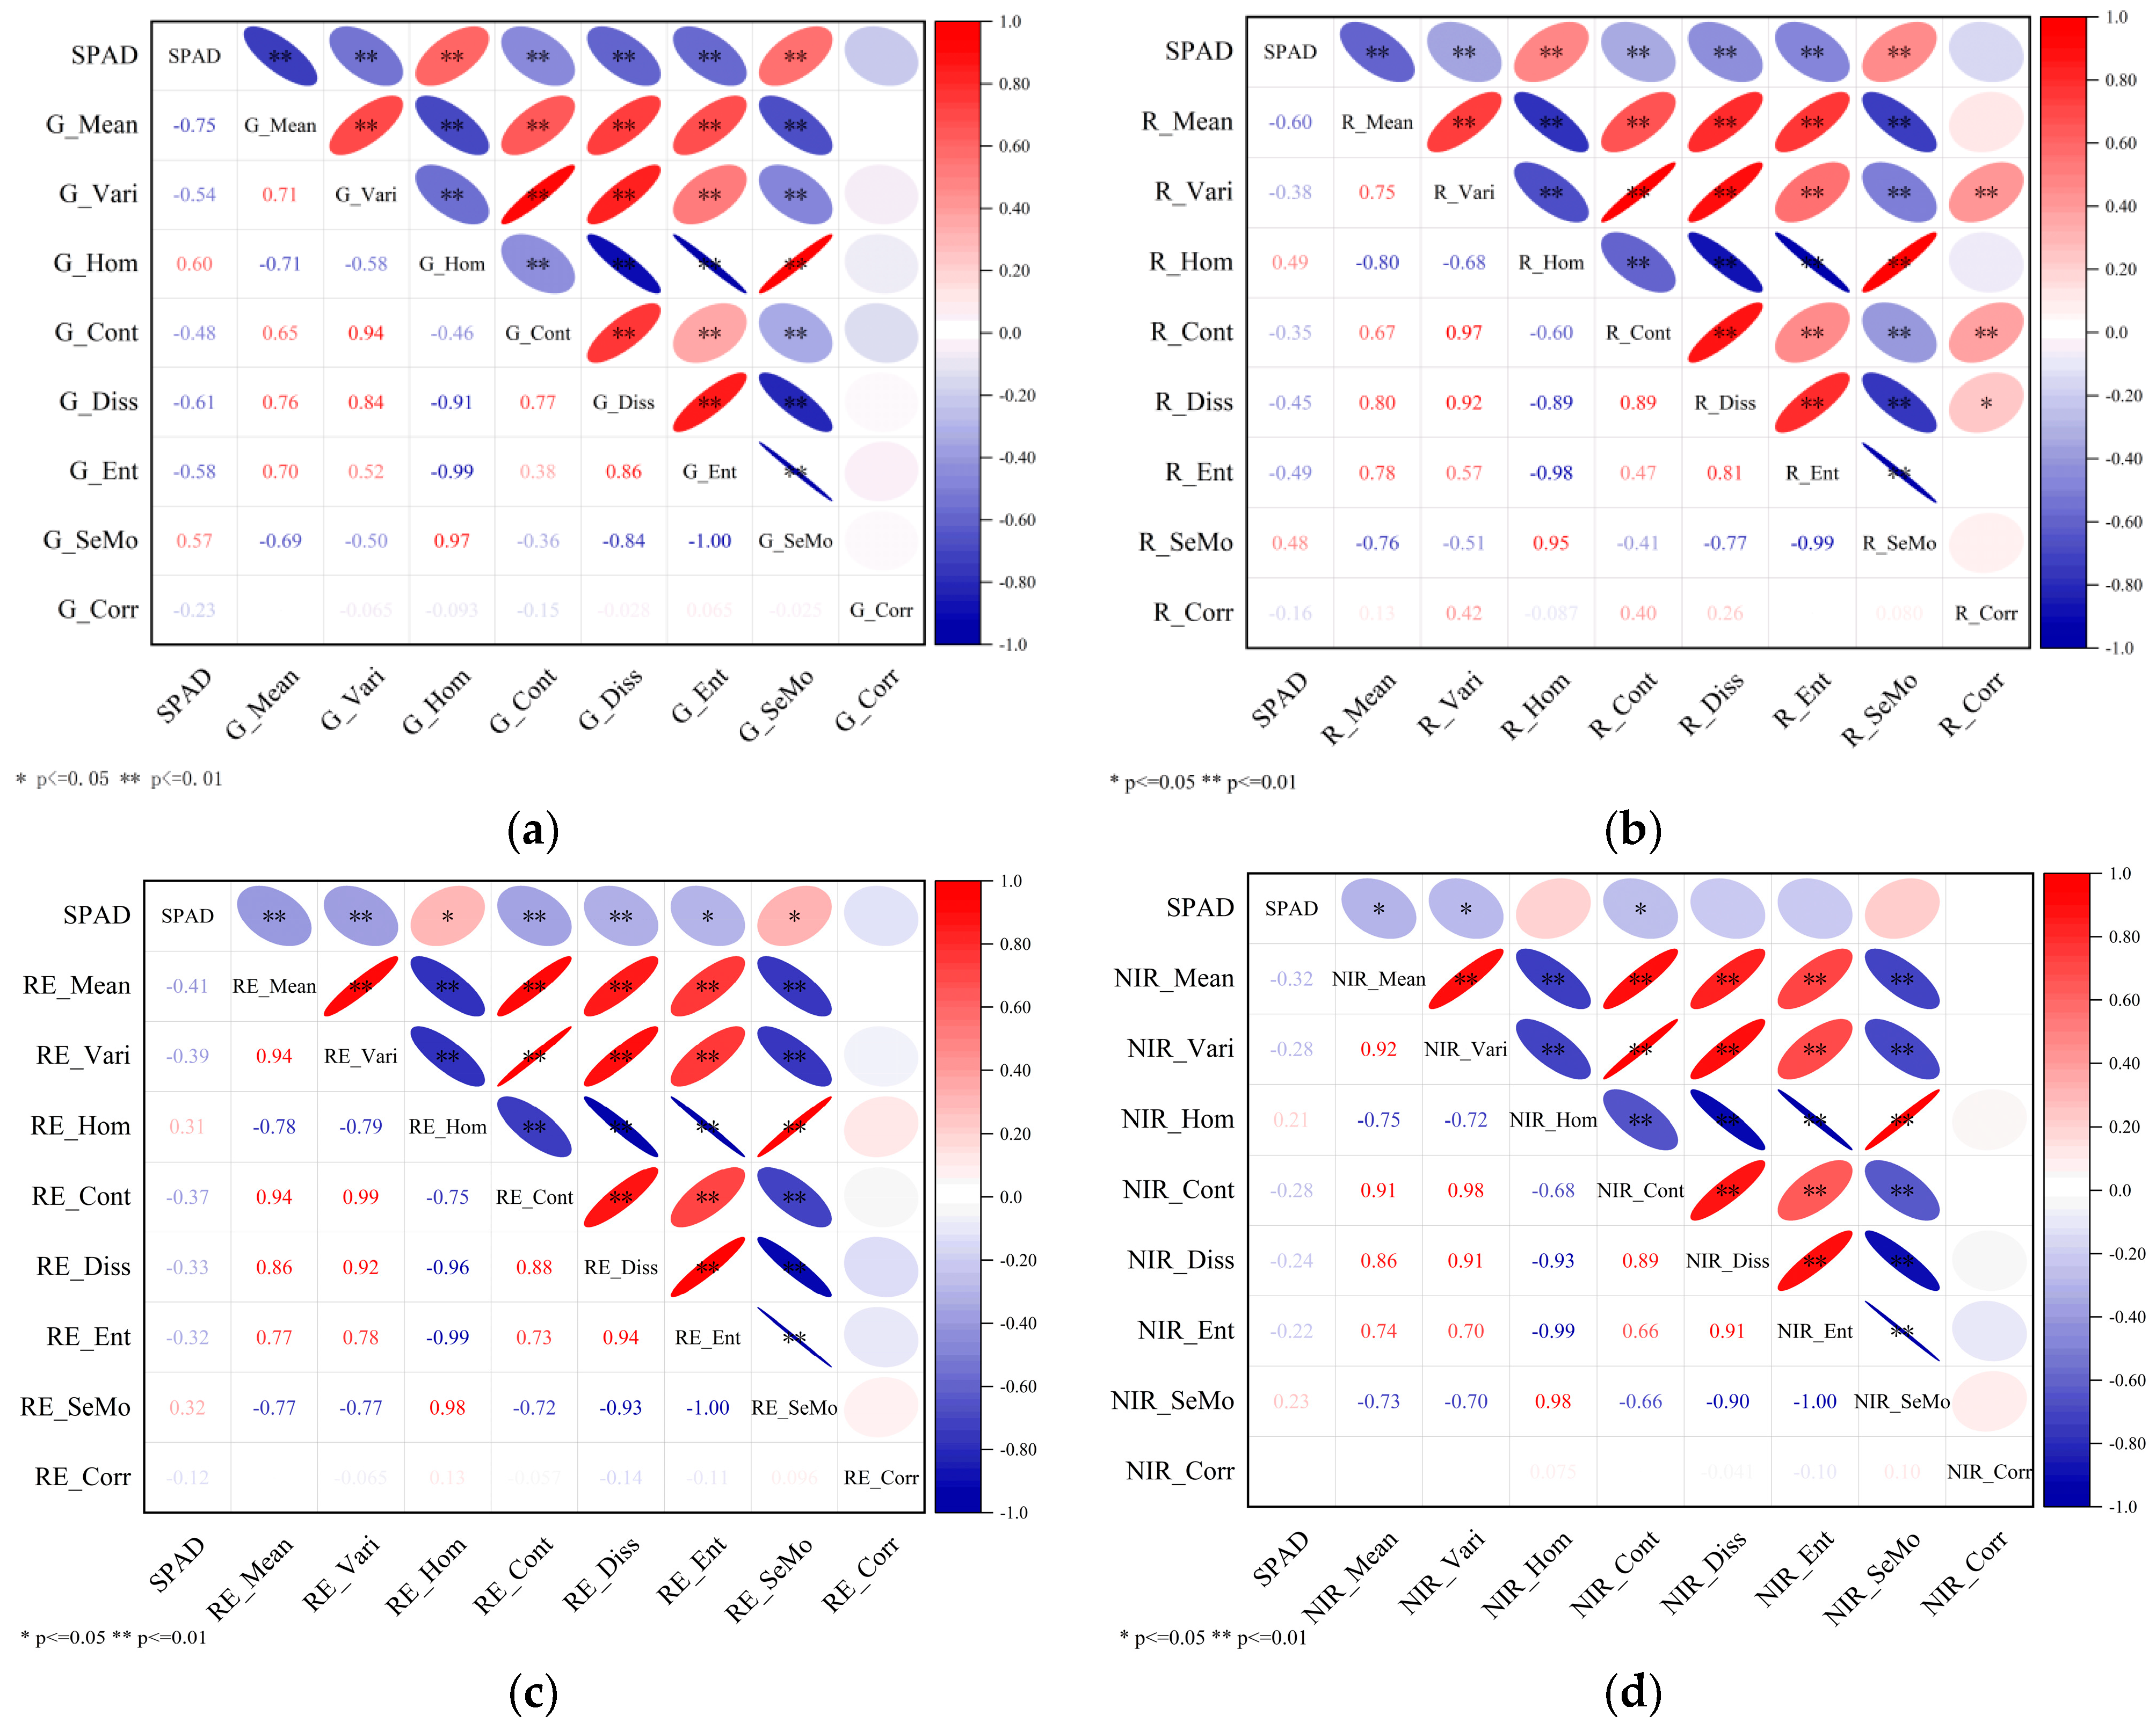
Among the 32 texture features extracted from four single-band spectra, 12 features— R_Mean, R_Hom, R_Diss, R_Ent, R_SeMo, G_Mean, G_Vari, G_Hom, G_Cont, G_Diss, G_Ent, and G_SeMo—demonstrated highly significant correlations (p < 0.01) with absolute correlation coefficients all exceeding 0.45. Additionally, six other features—RE_Hom, RE_Ent, RE_SeMo, NIR_Mean, NIR_Vari, and NIR_Cont—showed significant correlations at p < 0.05 level, with absolute correlation coefficients ranging between 0.28 and 0.32 (Figure 4a–d).
Based on the correlation analysis results, this study employed a correlation coefficient ≥ 0.45 as the screening criterion and ultimately selected two single bands (G, R), one vegetation index (TCARI/OSAVI), and 12 texture features as input variables for the model. The findings indicate that, in the estimation of olive leaf chlorophyll content using SPAD readings, the spectral reflectance of the G and R bands, the TCARI/OSAVI vegetation index, and canopy texture features exhibit a stronger response to variations in chlorophyll concentration. This feature selection provides a critical foundation for subsequent model development.

3.2. Univariate Linear Regression (LR) Inversion Model

Based on the 15 selected sensitive features, univariate linear regression models were constructed to investigate the predictive capability of individual variables for SPAD values in olive leaves. The results indicated significant differences in model accuracy among the features, suggesting a hierarchical sensitivity of spectral and texture features in representing chlorophyll content (Table 2).
Overall, single-band features generally outperformed vegetation indices and most texture features. Among them, the G band and G_Mean exhibited the highest predictive ability, with R2 values of 0.68 and RMSEs of 1.90 and 1.88, respectively, in the validation set, corresponding to RPDs of 1.81 and 1.83, demonstrating strong stability and applicability. In contrast, the Red band and R_Mean showed slightly lower model accuracy but remained at acceptable levels (R2 = 0.62, RPD = 1.66–1.68), indicating that single-band spectral features possess certain independent explanatory power for chlorophyll content. Regarding vegetation indices, TCARI/OSAVI performed substantially worse than single-band and most texture features, achieving only R2 = 0.33 and RPD = 1.26. This suggests that, for species such as olive with narrow and waxy leaves, traditional vegetation indices may be influenced by spectral reflection interference and non-chlorophyll background signals, thereby reducing their predictive capability. Texture features exhibited considerable variation in performance. G_Mean and G_Diss demonstrated relatively strong estimation ability, with R2 values of 0.68 and 0.58 and RPDs of 1.83 and 1.59, indicating modeling potential. In contrast, features such as G_Hom, G_Ent, and G_SeMo showed poor predictive performance, with R2 values ranging from 0.41 to 0.44 and RPDs around 1.34–1.38, insufficient for stable inversion. Among red-band texture features, R_Hom, R_Ent, and R_Diss exhibited intermediate performance, slightly better than their green-band counterparts, but still markedly inferior to the best single-band features.
In summary, the univariate linear regression models revealed certain patterns regarding single-variable explanatory power: spectral single-band features, particularly the G band, exhibited the highest sensitivity to chlorophyll content, while some texture features could partially complement spectral information, albeit with considerable variability. Vegetation indices contributed minimally under the conditions of this study and did not demonstrate the anticipated advantages. These findings provide a critical basis for subsequent multivariate modeling: although individual features can partially reflect variations in chlorophyll content, they are insufficient to fully characterize its complexity, necessitating multi-feature integration and nonlinear modeling to further enhance predictive performance.

3.3. Construction of RF, XGBoost, PLSR, and SVM Inversion Models

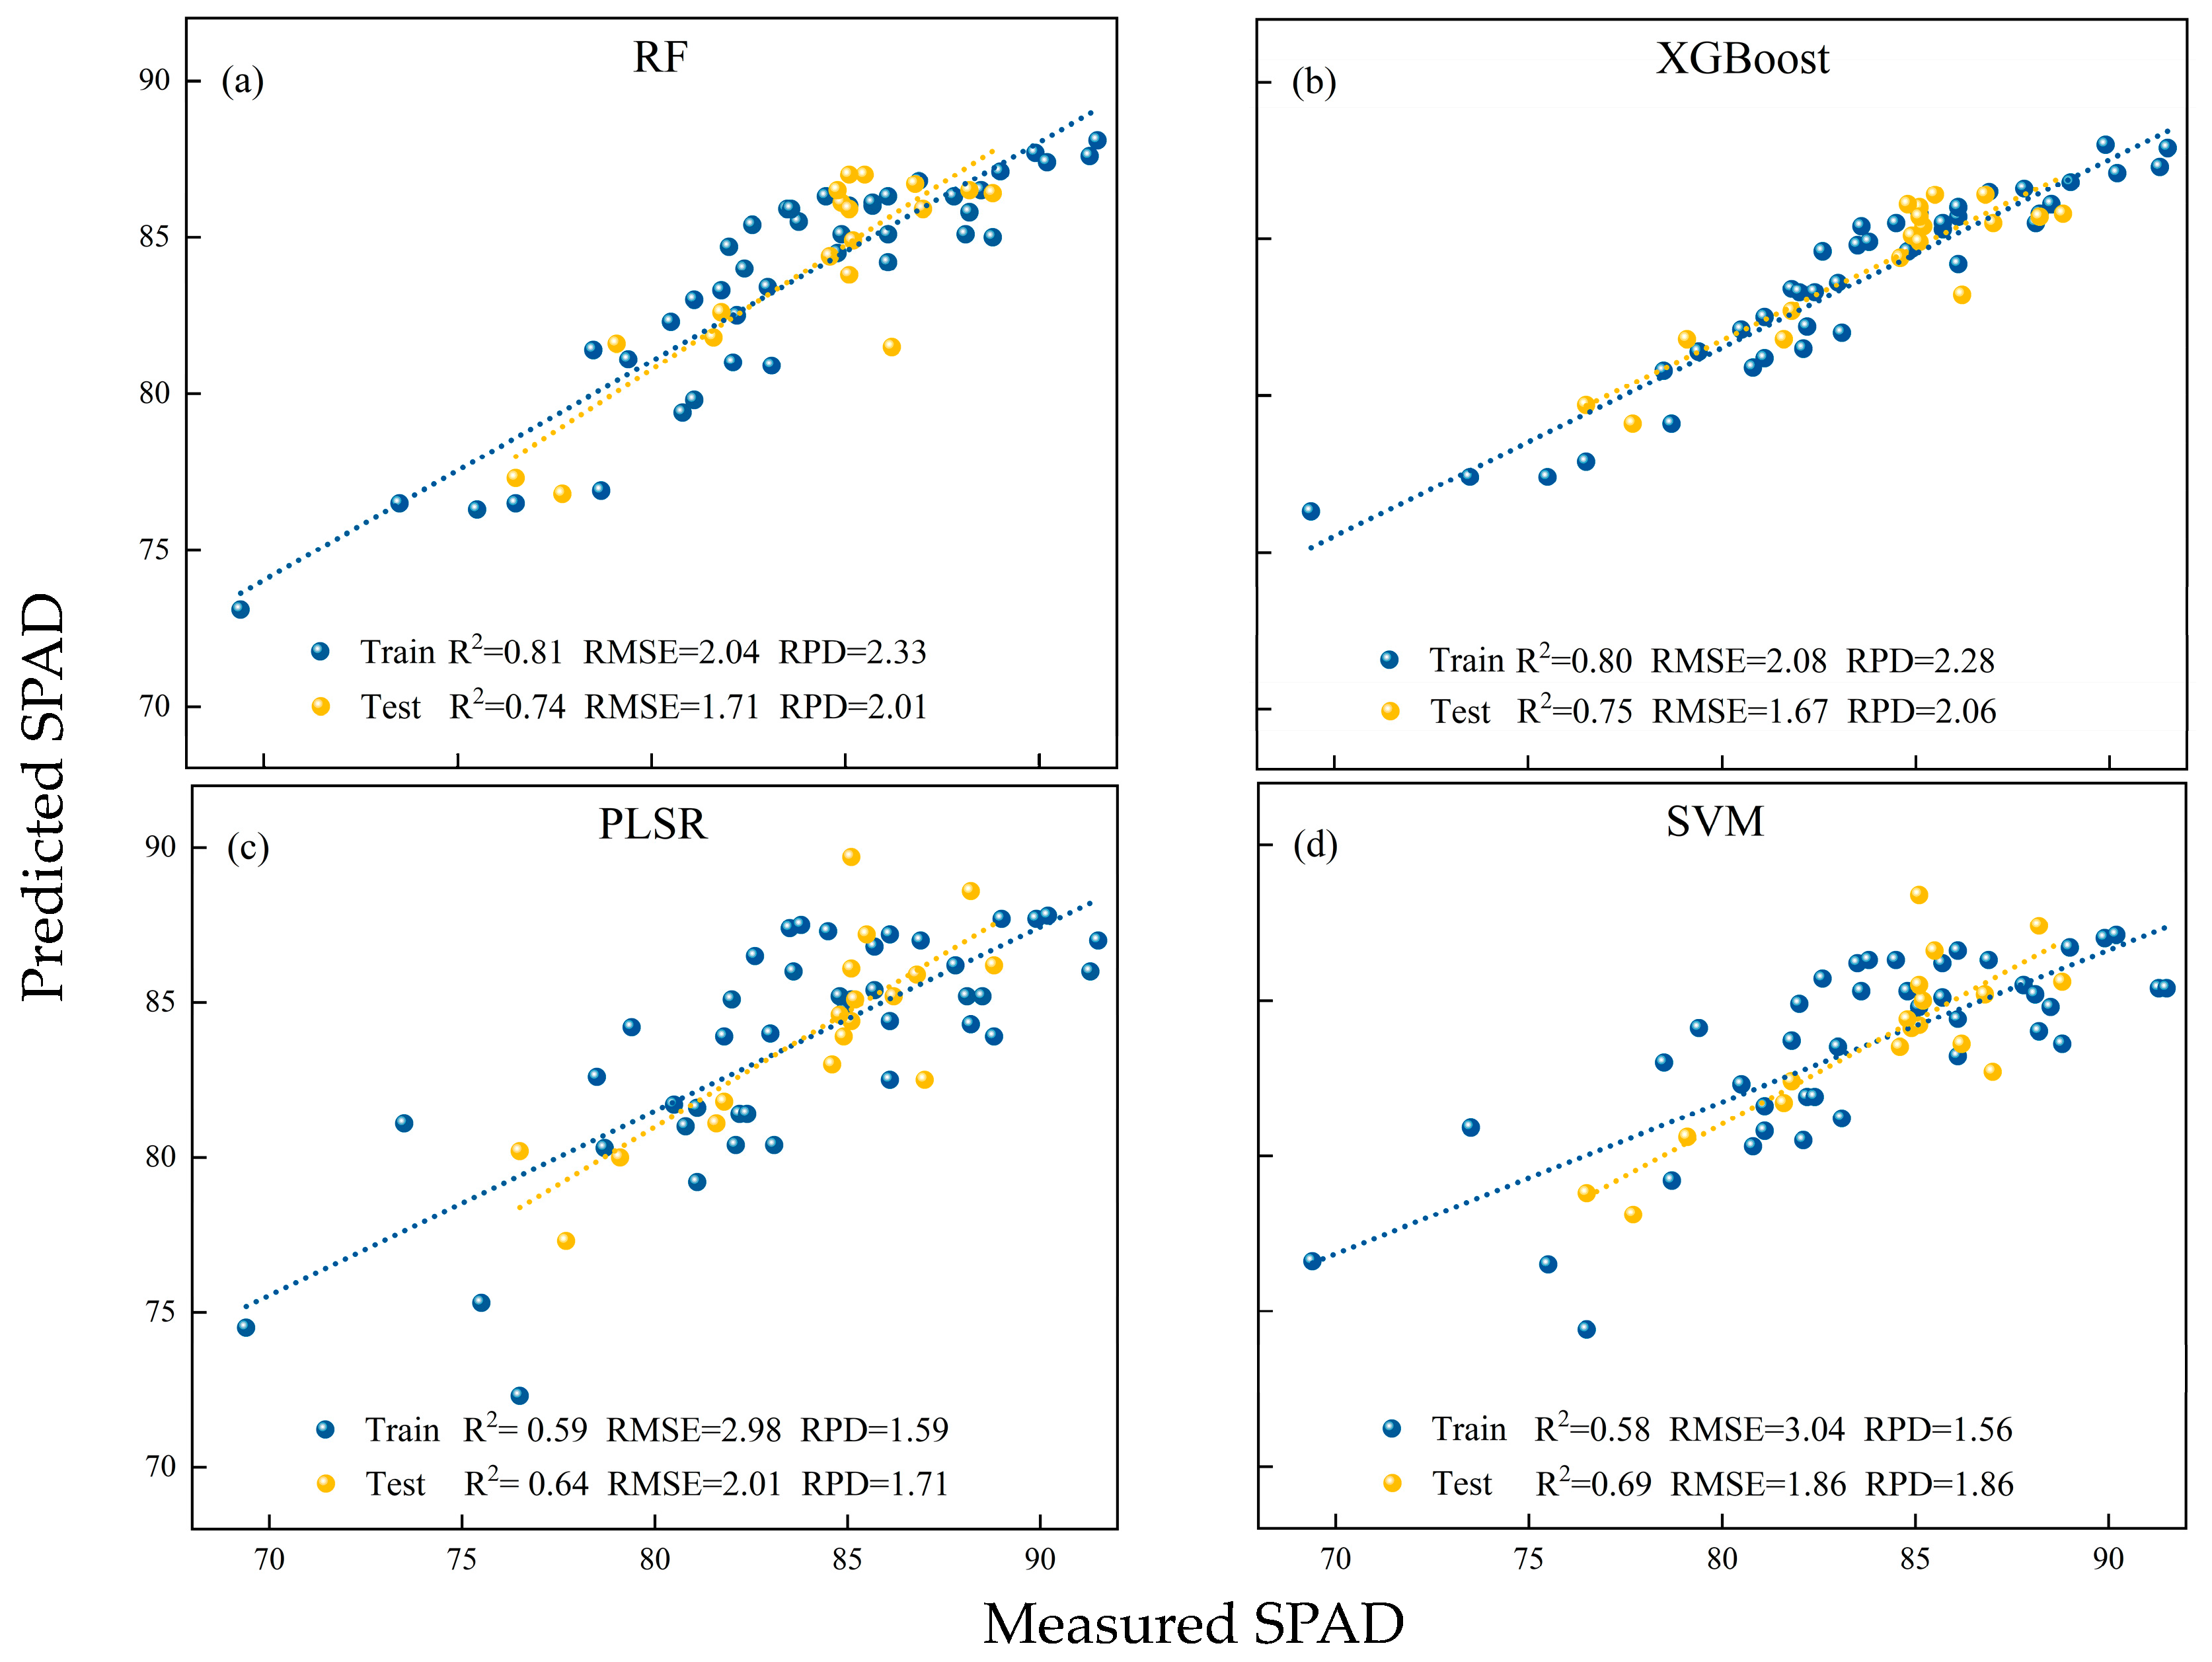
Following the integration of the 15 selected sensitive features, four types of inversion models were constructed: RF, XGBoost, PLSR, and SVM. The results indicated significant differences in model accuracy among the machine learning methods, each exhibiting its own strengths and limitations (Figure 5).
Overall, the ensemble-based RF and XGBoost models demonstrated the best performance in estimating chlorophyll content of olive leaves. The XGBoost model achieved the highest accuracy on the validation set, with R2 = 0.75, RMSE = 1.67, and RPD = 2.06, highlighting its remarkable capability in capturing nonlinear relationships and efficiently utilizing features. The RF model closely followed, achieving R2 = 0.74, RMSE = 1.71, and RPD = 2.01 on the validation set, also demonstrating high predictive stability. This comparison suggests that tree-based ensemble algorithms can fully exploit the complex interactions among spectral and texture features, thereby effectively improving inversion accuracy. In contrast, the traditional linear modeling method PLSR performed noticeably worse than RF and XGBoost in this study. Although PLSR can partially mitigate multicollinearity among features, its adaptability is limited because the relationships between chlorophyll content and spectral–texture features are significantly nonlinear. The validation set R2 was only 0.64, with RMSE = 2.01 and RPD = 1.71, indicating relatively weak overall predictive capability. These results imply that relying solely on linear dimensionality reduction and regression methods is insufficient to comprehensively capture the complexity of chlorophyll inversion. The SVM model exhibited intermediate performance among the four methods, achieving R2 = 0.69, RMSE = 1.86, and RPD = 1.86 on the validation set. While it improved upon PLSR, it still fell short of RF and XGBoost. This discrepancy reflects the inherent limitations of SVM in handling high-dimensional complex features, as its performance is highly dependent on kernel type and parameter settings. Even with optimization, its performance under multi-source feature integration remains inferior to tree-based algorithms.
A comprehensive comparison (Table 3) indicates that both RF and XGBoost exhibited strong modeling capabilities, with RPD values exceeding 2.0, satisfying the criteria for robust inversion. Among them, XGBoost slightly outperformed RF, achieving higher fitting accuracy and lower prediction errors, representing the optimal chlorophyll content inversion model in this study. RF followed closely, with strong generalization potential. In contrast, SVM and PLSR performed relatively poorly, insufficient for high-accuracy inversion requirements. Overall, tree-based ensemble algorithms demonstrated superior performance in estimating chlorophyll content of olive leaves, further confirming the potential of nonlinear modeling for complex crop parameter inversion.

3.4. Interpretation of XGBoost Model Using SHAP

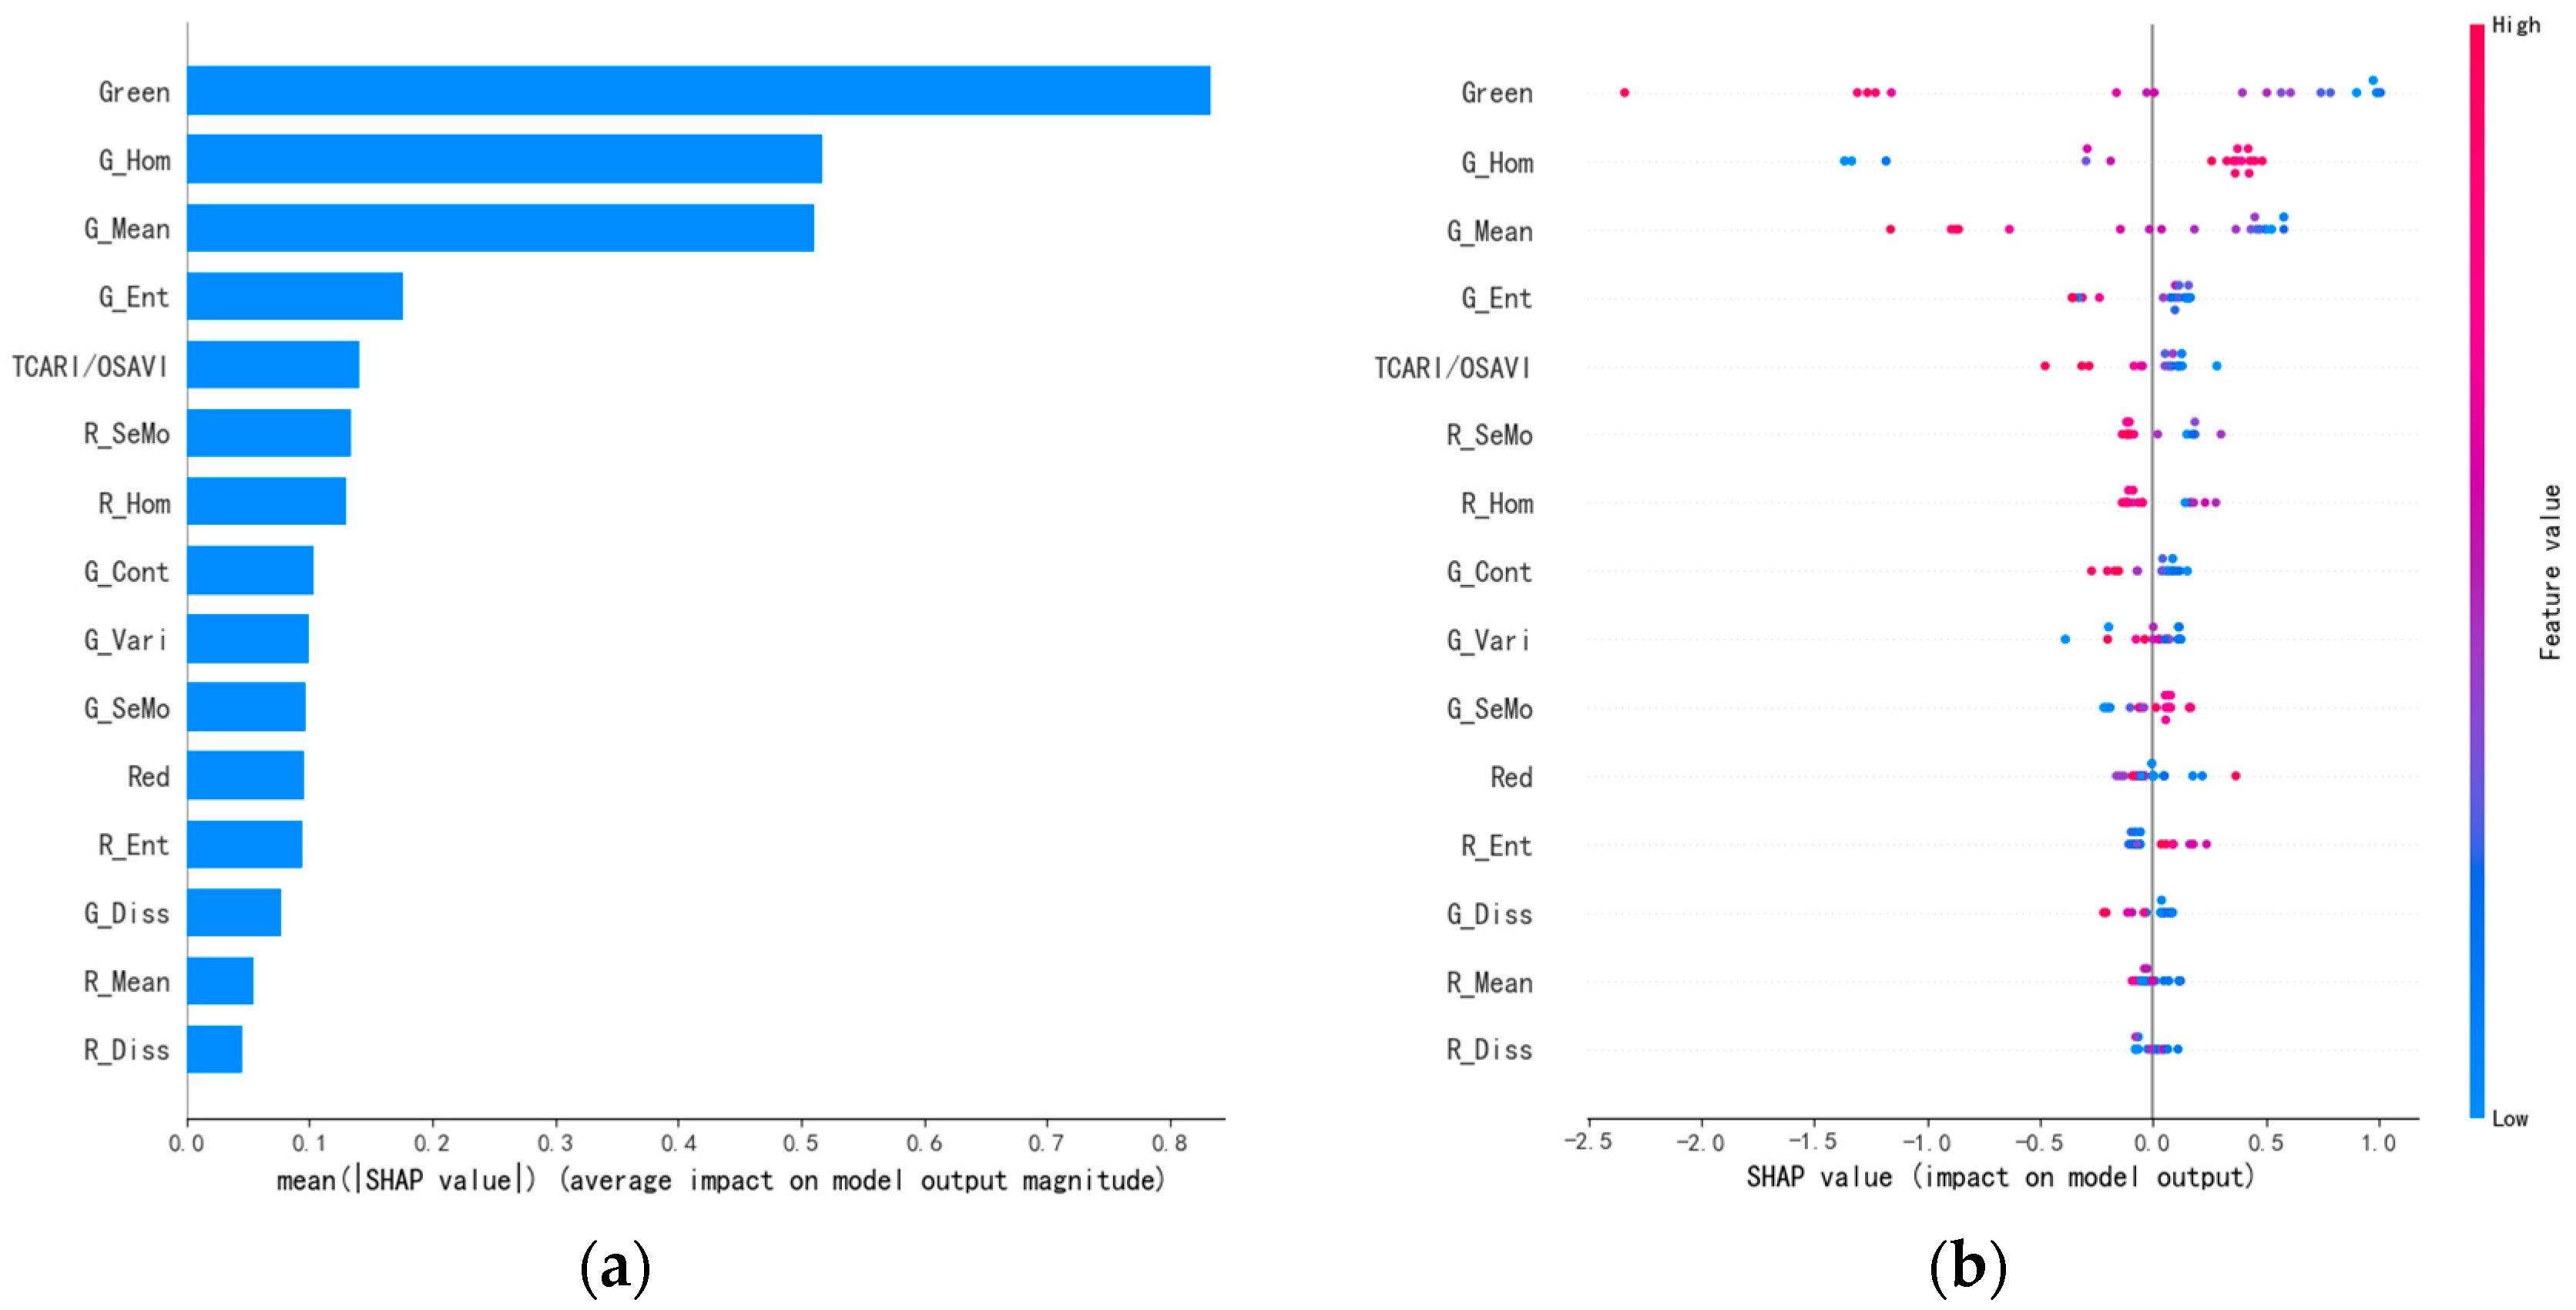
To further elucidate how different features influence chlorophyll prediction in olive leaves, SHAP-based interpretability analysis was conducted on the optimal XGBoost model (Figure 6). The feature importance plot (Figure 6a) showed that Green, G_Hom, and G_Mean were the top three contributing variables, indicating that the green band reflectance and its textural attributes play dominant roles in model prediction. As revealed by the SHAP summary plot (Figure 6b), the Green feature exhibited the widest range of SHAP values, suggesting its strongest overall impact on model output. High Green values (red points) were predominantly distributed in the negative SHAP region, while low values (blue points) appeared in the positive SHAP region, indicating that higher green reflectance decreases the predicted chlorophyll content. This pattern is fully consistent with the Pearson correlation analysis, which showed a significant negative correlation between the Green band and SPAD values. In contrast, high G_Hom values (red points) were concentrated in the positive SHAP region, suggesting that greater textural homogeneity increases the predicted chlorophyll content. Meanwhile, high G_Mean and G_Ent values (red or purple points) were mainly located in the negative SHAP region, implying that higher mean brightness and entropy reduce the model-predicted chlorophyll levels. Overall, the SHAP analysis clearly delineates the magnitude and direction of each feature’s influence on model prediction, providing quantitative evidence for interpreting the spectral–textural mechanisms underlying chlorophyll variation.

4. Discussion

4.1. Correlation Between Multiple Features and Chlorophyll Content in the Complex Canopy of Olive Trees

Compared with crops with larger or thinner leaves, such as citronella [23], sugarcane [24], and apple [59], where NDVI, DVI, and EVI correlate well with SPAD, olive leaves are smaller, thicker, and covered with a waxy layer, leading to a different spectral response. In our study, the green band (about 550 nm) emerged as the most sensitive feature for SPAD estimation. This can be explained by the light penetration properties within the leaves: fluorescence studies have shown that green light travels a longer path than red light, with approximately 50% of green light penetrating about 240 μm of mesophyll tissue, whereas red light is absorbed more quickly and reflects mainly the surface chlorophyll [60]. Additionally, scattering at the air–cell wall interfaces enhances the path length of green light, making it particularly sensitive to chlorophyll in thick, waxy leaves.
In the application of vegetation indices, the TCARI/OSAVI vegetation index demonstrated the strongest correlation, which aligns with the unique leaf structure and physiological characteristics of olive trees. TCARI/OSAVI combines the green band, red edge band, and near-infrared band, effectively reducing the influence of soil background and non-vegetation areas, thereby more accurately capturing changes in chlorophyll. TCARI was designed to account for soil background interference, reducing its impact on vegetation reflectance and improving estimation accuracy [61]. In contrast, traditional indices such as NDRE, RERVI, and MCARI performed poorly, as the waxy leaf surface interferes with the red-edge signal, while NDI and MSR, effective in other crops, showed low correlation due to olive leaf morphology and structure [62]. Consistent with Guermazi et al. [62], who reported the robustness of TCARI/OSAVI at the regional scale using Sentinel-2 imagery, this study demonstrates that high-resolution UAV imagery at the individual tree level allows extraction of fine-scale texture features, and correlation and SHAP analyses indicate that integrating these texture features with spectral and vegetation index data may further enhance model robustness in complex olive canopies. These texture features, capturing leaf surface heterogeneity and microstructural variations, are strongly correlated with SPAD values and, when integrated with spectral and vegetation index data, contribute to enhanced model robustness in complex olive canopies [59,63].

4.2. Significance and Applicability Analysis of Univariate Linear Regression in the Estimation of SPAD in Olive Oil

Based on the 15 selected sensitive features, univariate linear regression (LR) models were constructed in this study, revealing both the strengths and limitations of single-variable predictions for SPAD estimation in olive leaves. Overall, the Green band and certain texture features demonstrated relatively high accuracy, whereas vegetation indices and most other texture features exhibited limited predictive performance. This disparity indicates that LR performs optimally only when there is a pronounced first-order relationship between the input variable and the target parameter, as exemplified by the Green band and G_Mean in this study, which achieved high R2 and RPD values, suggesting that these features can provide stable results at a relatively low cost [64]. However, for composite indices such as TCARI/OSAVI, predictive capability declined markedly. This is primarily because these indices are constructed from multiple spectral bands, introducing stronger nonlinear signals. The complex structure of olive leaves, including a waxy layer and thick cuticle, makes such indices more susceptible to scattering and background interference, thereby limiting the ability of LR to extract stable relationships. In other words, single-band features provide LR with a “clear spectral fingerprint,” whereas the complexity of composite indices exceeds the explanatory capacity of a linear framework, resulting in reduced performance [65].
Furthermore, the performance of LR is highly sensitive to crop type and leaf structural differences. Previous studies have indicated that vegetation indices often lack stability across different crops and environmental conditions, particularly in woody species, where linear relationships are constrained by leaf thickness, epidermal characteristics, and cuticle layers [66]. Olive is a typical representative of such species, and this study confirmed that while LR can select certain effective features in this crop, its overall predictive capability remains limited. The differential performance of texture features further highlights the selectivity of LR. For instance, G_Mean and G_Diss maintained relatively good linear relationships with SPAD, indicating that the spatial structure captured by UAV imagery can, under certain conditions, reflect physiological status through simple linear functions [67]. However, most texture features exhibited lower accuracy, suggesting that they are more susceptible to canopy heterogeneity and imaging noise, and thus have limited utility within the LR framework. The performance of red-edge indices further underscores the limitations of LR. Although previous studies have shown that red-edge bands are highly sensitive to nitrogen and chlorophyll content [68], TCARI/OSAVI performed poorly in this study, implying that the unique spectral structure of olive leaves may reduce the effectiveness of red-edge signals. These findings suggest that even theoretically sensitive bands may not be stably captured through linear approaches due to crop-specific characteristics.
Despite these limitations, LR models remain valuable in practice due to their simplicity and interpretability. In agricultural production, rapid and low-cost diagnostic methods are particularly important for nutrient supply and nitrogen management. Simplified approaches proposed in previous research have demonstrated that, even under complex nutrient dynamics, linear models can provide effective guidance for field decision-making [69]. Therefore, the main value of LR in SPAD estimation for olive leaves lies not in achieving high-precision modeling, but in sensitive feature identification, mechanistic validation, and rapid diagnostics. In summary, LR can identify key features sensitive to chlorophyll content in olive leaves, offering advantages of simplicity, interpretability, and ease of implementation. However, its predictive accuracy is constrained by leaf structure, spectral complexity, and multi-source interference, and for applications requiring higher precision, it should be combined with multivariate or nonlinear modeling approaches.

4.3. Significance and Applicability Analysis of Different Machine Learning Modeling Algorithms in SPAD Estimation of Olive Oil

The results of this study indicate that different modeling methods exhibit distinct performance in SPAD estimation of olive leaves, with RF and XGBoost achieving the highest accuracy, SVM showing intermediate performance, and PLSR performing the weakest. Unlike previous studies on crops with simpler canopy structures, such as wheat, maize, or sugarcane [9,11,47], research on woody oil crops like olive, which have small, narrow leaves with waxy surfaces and complex crown architecture, is limited. It remains unclear whether leaf chlorophyll prediction approaches developed for herbaceous crops can be effectively transferred to such complex trees. This disparity is primarily related to the ability of the algorithms to capture nonlinear relationships. Olive leaves are thick and possess a waxy surface, making spectral signals susceptible to specular reflection and canopy structural interference, which leads to complex nonlinear coupling between the features and SPAD values. In this context, tree-based models such as RF and XGBoost can effectively characterize the interactions among high-dimensional variables through multi-level splitting, significantly improving modeling accuracy. In this study, the validation set R2 values of RF and XGBoost were 0.74 and 0.75, respectively, with RPD values exceeding 2.0, meeting the criteria for robust inversion. This demonstrates that high-resolution UAV multispectral imagery combined with ensemble learning can achieve reliable chlorophyll estimation in olive trees, providing a technical basis for precision nutrient monitoring and rapid field diagnostics in woody oil crops. Furthermore, although the high sensitivity of red-edge bands to nitrogen and chlorophyll content has been well documented [68], their effectiveness in olive leaves can be compromised by structural interference. Only RF and XGBoost were able to effectively utilize red-edge information, further highlighting the suitability of nonlinear models for complex crops.
To further elucidate the “black-box” mechanisms of XGBoost, SHapley Additive exPlanations (SHAP) analysis was performed. The SHAP results (Figure 6) reveal the synergistic and complementary roles of spectral and texture features in model decision-making. Among all features, the Green band (Figure 6a) exhibited dominant influence, with a wide SHAP value distribution indicating a critical regulatory effect on predictions. A stable negative correlation (Figure 6b) was observed between Green reflectance and SHAP values, meaning that higher green reflectance corresponds to lower predicted chlorophyll content. This aligns with plant physiological principles: olive leaves are thick and possess a waxy layer, which limits green light absorption at ~550 nm. When chlorophyll content is low, more green light is reflected, producing the observed negative correlation.
Texture features displayed more nuanced contributions. G_Hom (homogeneity) generally had a positive impact, with higher values corresponding to better chlorophyll status, likely reflecting canopy structural integrity and leaf physiological function. Conversely, G_Mean (mean brightness) and G_Ent (entropy) showed negative effects at high values, suggesting that increased brightness or local structural complexity may indicate functional decline or structural disorder. These insights highlight the importance of integrating texture information with spectral and vegetation indices to capture both physiological and structural variability in olive leaves, thereby enhancing the interpretability and robustness of tree-based models.
In comparison, the linear model PLSR exhibited clearly limited performance. While PLSR can mitigate multicollinearity among features through dimensionality reduction, its core assumption relies on a linear relationship between the predictors and the target variable. In crops such as olive, where spectral signals are complex, this assumption is difficult to satisfy. In this study, PLSR achieved only R2 = 0.64 and RPD = 1.71 on the validation set, markedly lower than the nonlinear models, indicating its limited ability to fully capture the nonlinear associations between chlorophyll content and spectral–texture features. Similar phenomena have been observed in other crops, where linear methods show insufficient explanatory power under environmental interference and structural diversity [70]. Therefore, the role of PLSR in this study primarily lies in providing a baseline for comparison and assisting in feature interpretation, rather than serving as a high-precision modeling tool. By contrast, SVM performance was intermediate between PLSR and tree-based models. Through kernel mapping, SVM can capture certain nonlinear patterns, achieving R2 = 0.69 and RPD = 1.86 on the validation set. While superior to PLSR, its overall stability is limited. Previous studies have shown that SVM predictive performance is highly dependent on the choice of kernel function and parameter settings, and even after optimization, it is difficult to match tree-based algorithms under multi-source feature integration [71].
From an applicability perspective, different models occupy distinct roles in SPAD estimation of olive leaves. RF and XGBoost offer superior accuracy and stability, making them suitable for scenarios requiring high precision and robustness. SVM can provide supplementary prediction capability but is limited by parameter sensitivity and thus has restricted practical adaptability. PLSR, on the other hand, is more appropriate as an interpretative or comparative tool to reveal fundamental relationships among variables. Previous research also emphasizes that the practical value of an algorithm in complex crop monitoring depends on its ability to flexibly handle feature heterogeneity and uncertainty [72]. Therefore, the results of this study not only confirm the advantages of nonlinear modeling for chlorophyll estimation in olive leaves but also provide guidance for model selection: in practice-oriented production environments, RF and XGBoost should be prioritized, whereas PLSR and SVM can serve in explanatory or moderate-to-low precision applications.
These results highlight the value of integrating high-resolution UAV data with nonlinear models to extend chlorophyll prediction to woody crops with complex canopy structures, offering a practical foundation for precision nutrient monitoring and management.

4.4. Research Significance and Future Prospects

This study focuses on the estimation of chlorophyll content (SPAD) in woody industrial oil crops—specifically, olive trees. By integrating multi-source remote sensing features such as single-band reflectance, vegetation indices, and texture metrics, it systematically evaluates the performance of various machine learning models. This provides technical support for enhancing the accuracy and generalizability of remote sensing-based monitoring of olive growth status. The results not only confirm that multi-source feature fusion improves the detection of spatial variability in chlorophyll within complex canopy structures but also demonstrate the modeling advantages of ensemble learning approaches in high-dimensional nonlinear regression tasks. In this study, chlorophyll was estimated using SPAD values, which indicate relative rather than absolute chlorophyll content. Although SPAD has been shown to correlate well with destructively measured chlorophyll in olive leaves, its readings may still vary among varieties and environments. Therefore, our results should be interpreted as reflecting relative chlorophyll status within the canopy.
Olive trees, as a quintessential evergreen woody industrial oil crop, possess a range of unique characteristics inherent to their species. For instance, their leaves are leathery, thick, and densely arranged, exhibiting prominent surface venation and high reflectance stability. These features render traditional remote sensing estimation methods, which rely solely on single spectral features, prone to saturation under high-density canopy conditions. This study introduces texture features derived from imagery, effectively capturing leaf arrangement patterns and local spatial structural information. This approach partially compensates for the limitations of spectral features in representing canopy heterogeneity, thereby further enhancing the accuracy and stability of models used for SPAD value estimation.
Since the study site is an artificially cultivated forest and uniform pruning was carried out prior to data collection to promote canopy ventilation, light penetration, and fruit growth, structural parameters (such as crown width, tree height, and canopy density) were not included as modeling variables in this experiment. These structural factors typically directly reflect differences in the distribution of tree biomass and chlorophyll content and have significant estimation potential. Future research could integrate airborne or ground-based LiDAR [73] and drone oblique photography technologies to extract canopy geometric structure parameters, achieving comprehensive integration of spectral, textural, and structural information, thereby further enhancing the model’s accuracy, generalization capability, and spatial adaptability.
It is worth noting that the training and validation samples used in this study were collected from the same orchard and growth period. Random data splitting may not fully eliminate spatial autocorrelation effects, and thus the model’s generalizability across independent sites remains to be further validated. In addition, based on our previous measurements, SPAD values of olive leaves during the fruit-ripening stage (e.g., ~110 in September) are substantially higher than those during the flowering stage examined in this work (~80), suggesting a strong phenological influence on chlorophyll levels. Therefore, cross-year or cross-phenology validation may introduce systematic bias and was not included in the current assessment. In future studies, spatially blocked cross-validation and independent-orchard and multi-phenological-stage datasets will be incorporated to more rigorously evaluate model transferability and robustness.
Furthermore, although this study employed traditional machine learning techniques (RF and XGBoost), achieving commendable results, limitations remain in the form of a strong dependence on feature engineering and limited model adaptability. In the future, it may be worthwhile to explore the use of deep learning models (such as convolutional neural networks (CNN) and attention mechanisms like Transformers) [74] to automatically extract multi-scale, high-dimensional spatio-temporal features directly from remote sensing imagery, thereby capturing the complex spatial textures and spectral response patterns of olive canopy structures. Especially in large-scale, cross-regional, and multi-temporal remote sensing monitoring tasks, deep learning methods, with their strong feature representation capabilities and nonlinear modeling capabilities, are expected to significantly improve the accuracy and stability of SPAD content estimation.
In addition, chlorophyll reduction in olive leaves is closely associated with physiological disorders including nutrient deficiencies (e.g., iron chlorosis), drought stress, or root diseases. The UAV-based chlorophyll estimation framework developed in this study provides a practical tool for identifying spatially heterogeneous stress signals at an early stage. Although differentiating specific stress types requires integration with soil nutrient analysis, leaf element diagnosis, and water status indicators, the generated chlorophyll maps can serve as a decision-support basis for targeted field inspections, refined fertilization, and irrigation scheduling. Future research will focus on incorporating these complementary physiological datasets to establish a more comprehensive stress-diagnosis system for olives, enabling intelligent and timely orchard management interventions.
In summary, this study not only provides a methodological foundation for precise remote sensing modeling of structurally complex and distinctly textured woody industrial oil crops such as olive trees but also broadens the application scope of multi-source information fusion in chlorophyll remote sensing estimation. Future research could further integrate structural parameters [75], expand data sources, and incorporate deep learning frameworks to advance the intelligent management and data-driven decision-making of olive cultivation and other woody economic crops in precision agriculture, industrial processing, and ecological monitoring, thereby promoting a green and efficient development of the industry chain.

5. Conclusions

This study utilized UAV-based multispectral imagery to extract multiple features, including spectral reflectance, vegetation indices, and texture characteristics, and combined Pearson correlation analysis to select sensitive variables. The systematic evaluation of commonly used modeling methods for SPAD estimation in olive leaves revealed that, due to the complex leaf structure, small leaf size, and thick waxy epidermis of olive leaves, univariate linear regression models were generally limited in fully capturing the complex relationships between chlorophyll content and single-band reflectance, vegetation indices, or texture features, resulting in restricted accuracy for linear model predictions.
Further multi-model comparisons highlighted the advantages of nonlinear and ensemble learning methods for chlorophyll estimation. RF and XGBoost exhibited the best performance when integrating multi-source features, with R2, RMSE, and RPD significantly outperforming PLSR and SVM, confirming the superiority of tree-based algorithms in capturing nonlinear relationships and feature interactions. The combination of UAV multispectral remote sensing and machine learning not only leverages the high spatial resolution, flexibility, and non-destructive acquisition of UAV data to substantially improve chlorophyll estimation accuracy, but also underscores the necessity of multi-feature integration. Particularly under complex canopy conditions, nonlinear modeling methods demonstrated strong adaptability and robustness. Overall, this study provides both theoretical and technical support for nutrient monitoring in woody industrial oil crops such as olive, demonstrating the feasibility and application potential of integrating UAV multispectral imagery with machine learning. The findings offer valuable references for precision chlorophyll monitoring, plant health diagnosis, and industrial-scale crop management.

Author Contributions

Conceptualization, W.Z., D.L. and W.K.; methodology, W.K.; software, N.L.; validation, W.Z., F.W. and Z.L.; formal analysis, W.Z.; investigation, F.W. and S.S.; resources, W.K.; data curation, Z.L.; writing—original draft preparation, W.Z.; writing—review and editing, D.L. and W.K.; visualization, W.Z.; supervision, W.K.; project administration, W.K.; funding acquisition, N.L. and W.K. All authors have read and agreed to the published version of the manuscript.

Funding

This research was supported by Yunnan Fundamental Research Projects (202301BD070001-160), Yunnan International Joint Laboratory of Natural Rubber Intelligent Monitor and Digital Applications (202403AP140001), the Xingdian Talent Support Program (XDYC-CYCX-2024-0021, YNWRQNBJ-2019-270), the Yunnan Province Academician Li Wei Workstation (202505AF350082), and the Yunnan Province Expert Workstation of Chen Yong (202505AF350005).

Data Availability Statement

The datasets presented in this article are not readily available because the data are part of an ongoing study. Requests to access the datasets should be directed to the corresponding author.

Conflicts of Interest

The authors declare no conflicts of interest.

References

  1. International Olive Council. World Market of Olive Oil and Table Olives—Data from December 2024. Available online: https://www.internationaloliveoil.org/world-market-of-olive-oil-and-table-olives-data-from-december-2024/ (accessed on 1 August 2025).
  2. Angulo, L.A.; Laaroussi, H.; Ousaaid, D.; Bakour, M.; Lyoussi, B.; Ferreira-Santos, P. Sustainable Valorization of Olive Oil By-Products: Green Extraction of Phytochemicals, Encapsulation Strategies, and Food Applications. J. Food Sci. 2025, 90, e70412. [Google Scholar] [CrossRef] [PubMed]
  3. FAO. More per Drop: Building Resilience and Adding Value in Morocco’s Olive Oil Sector. Available online: https://www.fao.org/investment-centre/latest/news/detail/more-per-drop--building-resilience-and-adding-value-in-morocco-s-olive-oil-sector/en (accessed on 1 August 2025).
  4. International Olive Council. IOC Newsletter No. 190 (May–June 2024). Available online: https://www.internationaloliveoil.org/wp-content/uploads/2024/06/NEWSLETTER_190_ENG.pdf (accessed on 1 August 2025).
  5. Zhang, Y.; Wei, L.; Zhou, Y.; Kou, W.; Fauzi, S.S.M. Integrating UAV-RGB Spectral Indices by Deep Learning Model Enables High-Precision Olive Tree Segmentation Under Small Sample. Forests 2025, 16, 924. [Google Scholar] [CrossRef]
  6. Gitelson, A.A.; Gritz, Y.; Merzlyak, M.N. Relationships between leaf chlorophyll content and spectral reflectance and algorithms for non-destructive chlorophyll assessment in higher plant leaves. J. Plant Physiol. 2003, 160, 271–282. [Google Scholar] [CrossRef]
  7. Delalieux, S.; Vandermaesen, J.; Vanbrabant, Y.; Wuyts, M.; Dierckx, W.; Tits, L. The uncharted territory of drone-based cross-season monitoring for precision horticulture. In Proceedings of the 13th European Conference on Precision Agriculture, Budapest, Hungary, 18–22 July 2021. [Google Scholar] [CrossRef]
  8. Ye, H.; Huang, W.; Huang, S.; Cui, B.; Dong, Y.; Guo, A.; Ren, Y.; Jin, Y. Recognition of banana fusarium wilt based on UAV remote sensing. Remote Sens. 2020, 12, 938. [Google Scholar] [CrossRef]
  9. Yin, H.; Huang, W.; Li, F.; Yang, H.; Li, Y.; Hu, Y.; Yu, K. Multi-temporal UAV imaging-based mapping of chlorophyll content in potato crop. PFG-J. Photogramm. Remote Sens. Geoinf. Sci. 2023, 91, 91–106. [Google Scholar] [CrossRef]
  10. Guo, Y.; Wang, H.; Wu, Z.; Wang, S.; Sun, H.; Senthilnath, J.; Wang, J.; Robin Bryant, C.; Fu, Y. Modified red blue vegetation index for chlorophyll estimation and yield prediction of maize from visible images captured by UAV. Sensors 2020, 20, 5055. [Google Scholar] [CrossRef]
  11. Fu, G.; Li, C.; Liu, W.; Pan, K.; He, J.; Li, W. Maize yield estimation based on UAV multispectral monitoring of canopy LAI and WOFOST data assimilation. Eur. J. Agron. 2025, 168, 127614. [Google Scholar] [CrossRef]
  12. Wang, J.; Zhang, Y.; Han, F.; Shi, Z.; Zhao, F.; Zhang, F.; Pan, W.; Zhang, Z.; Cui, Q. Estimation of Canopy Chlorophyll Content of Apple Trees Based on UAV Multispectral Remote Sensing Images. Agriculture 2025, 15, 1308. [Google Scholar] [CrossRef]
  13. Liu, Q.; Wu, Z.; Cui, N.; Zheng, S.; Zhu, S.; Jiang, S.; Wang, Z.; Gong, D.; Wang, Y.; Zhao, L. Soil moisture content estimation of drip-irrigated citrus orchard based on UAV images and machine learning algorithm in Southwest China. Agric. Water Manag. 2024, 303, 109069. [Google Scholar] [CrossRef]
  14. Khormizi, H.Z.; Malamiri, H.R.G.; Ferreira, C.S.S. Estimation of Evaporation and Drought Stress of Pistachio Plant Using UAV Multispectral Images and a Surface Energy Balance Approach. Horticulturae 2024, 10, 515. [Google Scholar] [CrossRef]
  15. Zhou, L.; Zhang, Y.; Chen, H.; Sun, G.; Wang, L.; Li, M.; Sun, X.; Feng, P.; Yan, L.; Qiu, L.; et al. Soybean yield estimation and lodging classification based on UAV multi-source data and self-supervised contrastive learning. Comput. Electron. Agric. 2025, 230, 109822. [Google Scholar] [CrossRef]
  16. Yue, J.; Yang, H.; Yang, G.; Fu, Y.; Wang, H.; Zhou, C. Estimating vertically growing crop above-ground biomass based on UAV remote sensing. Comput. Electron. Agric. 2023, 205, 107627. [Google Scholar] [CrossRef]
  17. Zhang, C.; Chen, Z.; Chen, R.; Zhang, W.; Zhao, D.; Yang, G.; Xu, B.; Feng, H.; Yang, H. Retrieving the chlorophyll content of individual apple trees by reducing canopy shadow impact via a 3D radiative transfer model and UAV multispectral imagery. Plant Phenomics 2025, 7, 100015. [Google Scholar] [CrossRef]
  18. Singh, K.; Huang, Y.; Young, W.; Harvey, L.; Hall, M.; Zhang, X.; Lobaton, E.; Jenkins, J.; Shankle, M. Sweet Potato Yield Prediction Using Machine Learning Based on Multispectral Images Acquired from a Small Unmanned Aerial Vehicle. Agriculture 2025, 15, 420. [Google Scholar] [CrossRef]
  19. Biswal, S.; Pathak, N.; Chatterjee, C.; Mailapalli, D.R. Estimation of aboveground biomass from spectral and textural characteristics of paddy crop using UAV-multispectral images and machine learning techniques. Geocarto Int. 2024, 39, 2364725. [Google Scholar] [CrossRef]
  20. Wang, R.; Tuerxun, X.; Zheng, J. Improved estimation of SPAD values in walnut leaves by combining spectral, texture, and structural information from UAV-based multispectral image. Sci. Hortic.-Amst. 2024, 328, 112940. [Google Scholar] [CrossRef]
  21. Gao, C.; Li, H.; Wang, J.; Zhang, X.; Huang, K.; Song, X.; Yang, W.; Feng, M.; Xiao, L.; Zhao, Y.; et al. Combined use of spectral resampling and machine learning algorithms to estimate soybean leaf chlorophyll. Comput. Electron. Agric. 2024, 218, 108675. [Google Scholar] [CrossRef]
  22. Sánchez, M.R.; Silva, C.A.A.C.; Demattê, J.A.M.; Mendonça, F.C.; Silva, M.A.d.; Romanelli, T.L.; Fiorio, P.R. Predictive modelling of chlorophyll in Mombaça grass leaves by hyperspectral reflectance data and machine learning. Grass Forage Sci. 2024, 79, 543–556. [Google Scholar] [CrossRef]
  23. Khan, M.S.; Yadav, P.; Semwal, M.; Prasad, N.; Verma, R.K.; Kumar, D. Predicting canopy chlorophyll concentration in citronella crop using machine learning algorithms and spectral vegetation indices derived from UAV multispectral imagery. Ind. Crops Prod. 2024, 219, 119147. [Google Scholar] [CrossRef]
  24. Narmilan, A.; Gonzalez, F.; Salgadoe, A.S.A.; Kumarasiri, U.W.L.M.; Weerasinghe, H.A.S.; Kulasekara, B.R. Predicting Canopy Chlorophyll Content in Sugarcane Crops Using Machine Learning Algorithms and Spectral Vegetation Indices Derived from UAV Multispectral Imagery. Remote Sens. 2022, 14, 1140. [Google Scholar] [CrossRef]
  25. Elsayed, S.; El-Hendawy, S.; Elsherbiny, O.; Okasha, A.M.; Elmetwalli, A.H.; Elwakeel, A.E.; Memon, M.S.; Ibrahim, M.E.M.; Ibrahim, H.H. Estimating Chlorophyll Content, Production, and Quality of Sugar Beet under Various Nitrogen Levels Using Machine Learning Models and Novel Spectral Indices. Agronomy 2023, 13, 2743. [Google Scholar] [CrossRef]
  26. Benítez, M.L.; Pedrajas, V.M.; del Campillo, M.C.; Torrent, J. Iron chlorosis in olive in relation to soil properties. Nutr. Cycl. Agroecosys. 2002, 62, 47–52. [Google Scholar] [CrossRef]
  27. Machado de Souza, F.B.; Toledo Coelho, V.A.; Pio, R.; Rodas, C.L.; Pereira da Silva, I.; de Melo, E.T.; da Hora Farias, D. Visual symptoms and nutritional deficiencies in olive plants subjected to nutrient deprivation. Acta Sci. Agron. 2019, 41, e39582. [Google Scholar] [CrossRef]
  28. Connor, D.J. Adaptation of olive (Olea europaea L.) to water-limited environments. Aust. J. Agric. Res. 2005, 56, 1181–1189. [Google Scholar] [CrossRef]
  29. Buonaurio, R.; Almadi, L.; Famiani, F.; Moretti, C.; Agosteo, G.E.; Schena, L. Olive leaf spot caused by Venturia oleaginea: An updated review. Front. Plant Sci. 2022, 13, 1061136. [Google Scholar] [CrossRef]
  30. Bacelar, E.A.; Correia, C.M.; Moutinho-Pereira, J.M.; Gonçalves, B.C.; Lopes, J.I.; Torres-Pereira, J.M.G. Sclerophylly and leaf anatomical traits of five field-grown olive cultivars growing under drought conditions. Tree Physiol. 2004, 24, 233–239. [Google Scholar] [CrossRef]
  31. Shibaeva, T.G.; Mamaev, A.V.; Sherudilo, E.G. Evaluation of a SPAD-502 Plus Chlorophyll Meter to Estimate Chlorophyll Content in Leaves with Interveinal Chlorosis. Russ. J. Plant Physl. 2020, 67, 690–696. [Google Scholar] [CrossRef]
  32. Zhang, R.; Yang, P.; Liu, S.; Wang, C.; Liu, J. Evaluation of the Methods for Estimating Leaf Chlorophyll Content with SPAD Chlorophyll Meters. Remote Sens. 2022, 14, 5144. [Google Scholar] [CrossRef]
  33. Uddling, J.; Gelang-Alfredsson, J.; Piikki, K.; Pleijel, H. Evaluating the relationship between leaf chlorophyll concentration and SPAD-502 chlorophyll meter readings. Photosynth. Res. 2007, 91, 37–46. [Google Scholar] [CrossRef]
  34. Tu, Y.-H.; Phinn, S.; Johansen, K.; Robson, A.; Wu, D. Optimising drone flight planning for measuring horticultural tree crop structure. ISPRS J. Photogramm. 2020, 160, 83–96. [Google Scholar] [CrossRef]
  35. Brewer, K.; Clulow, A.; Sibanda, M.; Gokool, S.; Naiken, V.; Mabhaudhi, T. Predicting the chlorophyll content of maize over phenotyping as a proxy for crop health in smallholder farming systems. Remote Sens. 2022, 14, 518. [Google Scholar] [CrossRef]
  36. Liu, Y.; Feng, H.; Yue, J.; Jin, X.; Li, Z.; Yang, G. Estimation of potato above-ground biomass based on unmanned aerial vehicle red–green–blue images with different texture features and crop height. Front. Plant Sci. 2022, 13, 938216. [Google Scholar] [CrossRef]
  37. Haghighian, F.; Yousefi, S.; Keesstra, S. Identifying tree health using sentinel-2 images: A case study on Tortrix viridana L. infected oak trees in Western Iran. Geocarto Int. 2022, 37, 304–314. [Google Scholar] [CrossRef]
  38. De Castro, A.I.; Shi, Y.; Maja, J.M.; Peña, J.M. UAVs for vegetation monitoring: Overview and recent scientific contributions. Remote Sens. 2021, 13, 2139. [Google Scholar] [CrossRef]
  39. Zhao, X.; Li, Y.; Chen, Y.; Qiao, X.; Qian, W. Water chlorophyll a estimation using UAV-based multispectral data and machine learning. Drones 2022, 7, 2. [Google Scholar] [CrossRef]
  40. Sripada, R.P.; Heiniger, R.W.; White, J.G.; Weisz, R. Aerial color infrared photography for determining late-season nitrogen requirements in corn. Agron. J. 2005, 97, 1443–1451. [Google Scholar] [CrossRef]
  41. Jasper, J.; Reusch, S.; Link, A. Active sensing of the N status of wheat using optimized wavelength combination: Impact of seed rate, variety and growth stage. In Proceedings of the Precision Agriculture’09, European Conference on Precision Agriculture, Wageningen, The Netherlands, 6–8 July 2009. [Google Scholar] [CrossRef]
  42. Zha, Y.; Gao, J.; Ni, S. Use of normalized difference built-up index in automatically mapping urban areas from TM imagery. Int. J. Remote Sens. 2003, 24, 583–594. [Google Scholar] [CrossRef]
  43. Datt, B. Visible/near infrared reflectance and chlorophyll content in Eucalyptus leaves. Int. J. Remote Sens. 1999, 20, 2741–2759. [Google Scholar] [CrossRef]
  44. Cao, Q.; Miao, Y.; Wang, H.; Huang, S.; Cheng, S.; Khosla, R.; Jiang, R. Non-destructive estimation of rice plant nitrogen status with Crop Circle multispectral active canopy sensor. Field Crops Res. 2013, 154, 133–144. [Google Scholar] [CrossRef]
  45. Xiao, Y.; Zhao, W.; Zhou, D.; Gong, H. Sensitivity analysis of vegetation reflectance to biochemical and biophysical variables at leaf, canopy, and regional scales. IEEE Trans. Geosci. Remote Sens. 2013, 52, 4014–4024. [Google Scholar] [CrossRef]
  46. Huang, W.; Yang, Q.; Pu, R.; Yang, S. Estimation of nitrogen vertical distribution by bi-directional canopy reflectance in winter wheat. Sensors 2014, 14, 20347–20359. [Google Scholar] [CrossRef]
  47. Tahir, M.N.; Naqvi, S.Z.A.; Lan, Y.; Zhang, Y.; Wang, Y.; Afzal, M.; Cheema, M.J.M.; Amir, S.R. Real time monitoring chlorophyll content based on vegetation indices derived from multispectral UAVs in the kinnow orchard. Int. J. Precis. Agric. Aviat. 2018, 1, 24–31. [Google Scholar] [CrossRef]
  48. Chen, J.M. Evaluation of vegetation indices and a modified simple ratio for boreal applications. Can. J. Remote Sens. 1996, 22, 229–242. [Google Scholar] [CrossRef]
  49. Devadas, R.; Lamb, D.W.; Simpfendorfer, S.; Backhouse, D. Evaluating ten spectral vegetation indices for identifying rust infection in individual wheat leaves. Precis. Agric. 2009, 10, 459–470. [Google Scholar] [CrossRef]
  50. Rondeaux, G.; Steven, M.; Baret, F. Optimization of soil-adjusted vegetation indices. Remote Sens. Environ. 1996, 55, 95–107. [Google Scholar] [CrossRef]
  51. Wu, C.; Niu, Z.; Tang, Q.; Huang, W. Estimating chlorophyll content from hyperspectral vegetation indices: Modeling and validation. Agric. For. Meteorol. 2008, 148, 1230–1241. [Google Scholar] [CrossRef]
  52. Benesty, J.; Chen, J.; Huang, Y.; Cohen, I. Pearson Correlation Coefficient. In Noise Reduction in Speech Processing; Cohen, I., Benesty, J., Huang, Y., Eds.; Springer: Berlin/Heidelberg, Germany, 2009; Volume 2, pp. 1–4. [Google Scholar] [CrossRef]
  53. Belgiu, M.; Drăguţ, L. Random forest in remote sensing: A review of applications and future directions. ISPRS J. Photogramm. Remote Sens. 2016, 114, 24–31. [Google Scholar] [CrossRef]
  54. Wang, D.; Xing, Y.; Fu, A.; Tang, J.; Chang, X.; Yang, H.; Yang, S.; Li, Y. Mapping Forest Aboveground Biomass Using Multi-Source Remote Sensing Data Based on the XGBoost Algorithm. Forests 2025, 16, 347. [Google Scholar] [CrossRef]
  55. Luedeling, E.; Gassner, A. Partial Least Squares Regression for analyzing walnut phenology in California. Agric. For. Meteorol. 2012, 158–159, 43–52. [Google Scholar] [CrossRef]
  56. Felipetto, H.S.; Mercante, E.; Viana, O.; Elias, A.R.; Benin, G.; Scolari, L.; Armadori, A.; Donato, D.G. Combining machine learning with UAV derived multispectral aerial images for wheat yield prediction, in southern Brazil. Eur. J. Remote Sens. 2025, 58, 2464663. [Google Scholar] [CrossRef]
  57. Gaston, E.; Frías, J.M.; Cullen, P.J.; O’Donnell, C.P.; Gowen, A.A. Prediction of Polyphenol Oxidase Activity Using Visible Near-Infrared Hyperspectral Imaging on Mushroom (Agaricus bisporus) Caps. J. Agric. Food Chem. 2010, 58, 6226–6233. [Google Scholar] [CrossRef]
  58. Lundberg, S.M.; Erion, G.; Chen, H.; DeGrave, A.; Prutkin, J.M.; Nair, B.; Katz, R.; Himmelfarb, J.; Bansal, N.; Lee, S.-I. From local explanations to global understanding with explainable AI for trees. Nat. Mach. Intell. 2020, 2, 56–67. [Google Scholar] [CrossRef] [PubMed]
  59. Zhang, C.; Chen, Z.; Yang, G.; Xu, B.; Feng, H.; Chen, R.; Qi, N.; Zhang, W.; Zhao, D.; Cheng, J.; et al. Removal of canopy shadows improved retrieval accuracy of individual apple tree crowns LAI and chlorophyll content using UAV multispectral imagery and PROSAIL model. Comput. Electron. Agric. 2024, 221, 108959. [Google Scholar] [CrossRef]
  60. Vogelmann, T.C.; Evans, J.R. Profiles of light absorption and chlorophyll within spinach leaves from chlorophyll fluorescence. Plant Cell Environ. 2002, 25, 1313–1323. [Google Scholar] [CrossRef]
  61. Poblete, T.; Watt, M.S.; Buddenbaum, H.; Zarco-Tejada, P.J. Chlorophyll content estimation in radiata pine using hyperspectral imagery: A comparison between empirical models, scaling-up algorithms, and radiative transfer inversions. Agric. For. Meteorol. 2025, 362, 110402. [Google Scholar] [CrossRef]
  62. Guermazi, E.; Wali, A.; Ksibi, M. Combining remote sensing, SPAD readings, and laboratory analysis for monitoring olive groves and olive oil quality. Precis. Agric. 2024, 25, 65–82. [Google Scholar] [CrossRef]
  63. Song, Z.; Liu, Y.; Yu, J.; Guo, Y.; Jiang, D.; Zhang, Y.; Guo, Z.; Chang, Q. Estimation of Chlorophyll Content in Apple Leaves Infected with Mosaic Disease by Combining Spectral and Textural Information Using Hyperspectral Images. Remote Sens. 2023, 16, 2190. [Google Scholar] [CrossRef]
  64. Abdikan, S.; Sekertekin, A.; Narin, O.G.; Delen, A.; Sanli, F.B. A comparative analysis of SLR, MLR, ANN, XGBoost and CNN for crop height estimation of sunflower using Sentinel-1 and Sentinel-2. Adv. Space Res. 2023, 71, 3045–3059. [Google Scholar] [CrossRef]
  65. Angel, Y.; McCabe, M.F. Machine Learning Strategies for the Retrieval of Leaf-Chlorophyll Dynamics: Model Choice, Sequential Versus Retraining Learning, and Hyperspectral Predictors. Front. Plant Sci. 2022, 13, 722442. [Google Scholar] [CrossRef] [PubMed]
  66. Hussain, S.; Teshome, F.T.; Tulu, B.B.; Awoke, G.W.; Hailegnaw, N.S.; Bayabil, H.K. Leaf area index (LAI) prediction using machine learning and UAV based vegetation indices. Eur. J. Agron. 2025, 168, 127557. [Google Scholar] [CrossRef]
  67. Tunca, E.; Köksal, E.S.; Akay, H.; Öztürk, E.; Taner, S.Ç. Novel machine learning framework for high-resolution sorghum biomass estimation using multi-temporal UAV imagery. Int. J. Environ. Sci. Technol. 2025, 22, 13673–13688. [Google Scholar] [CrossRef]
  68. Thieme, A.; Jennewein, J.; Hively, W.D.; Lamb, B.T.; Whitcraft, A.K.; Mirsky, S.B.; Reberg-Horton, S.C.; Justice, C. Multispectral red-edge indices accurately estimate nitrogen content in winter cereal cover crops. Agron. J. 2025, 117, e70011. [Google Scholar] [CrossRef]
  69. Constantin, J.; Minette, S.; Vericel, G.; Jordan-Meille, L.; Justes, E. MERCI: A simple method and decision-support tool to estimate availability of nitrogen from a wide range of cover crops to the next cash crop. Plant Soil 2024, 494, 333–351. [Google Scholar] [CrossRef]
  70. Khlghatyan, A.; Medvedev, A.; Muradyan, V.; Hovsepyan, A.; Avetisyan, R.; Ayvazyan, G.; Parseghyan, A.; Asmaryan, S. Exploring multisource remote sensing capacities for spatiotemporal analysis and quantification of chlorophyll of vineyards in Armenia. Agric. Res. 2025, 1–17. [Google Scholar] [CrossRef]
  71. Zhu, W.; Sun, Z.; Huang, Y.; Yang, T.; Li, J.; Zhu, K.; Zhang, J.; Yang, B.; Shao, C.; Peng, J.; et al. Optimization of multi-source UAV RS agro-monitoring schemes designed for field-scale crop phenotyping. Precis. Agric. 2021, 22, 1768–1802. [Google Scholar] [CrossRef]
  72. Wang, L.; Zhang, H.; Bian, L.; Zhou, L.; Wang, S.; Ge, Y. Poplar seedling varieties and drought stress classification based on multi-source, time-series data and deep learning. Ind. Crops Prod. 2024, 218, 118905. [Google Scholar] [CrossRef]
  73. Qiu, S.; Zhu, X.; Zhang, Q.; Tao, X.; Zhou, K. Enhanced estimation of crown-level leaf dry biomass of Ginkgo saplings based on multi-height UAV imagery and digital aerial photogrammetry point cloud data. Forests 2024, 15, 1720. [Google Scholar] [CrossRef]
  74. Yue, Z.; Zhang, Q.; Zhu, X.; Zhou, K. Chlorophyll content estimation of Ginkgo seedlings based on deep learning and hyperspectral imagery. Forests 2024, 15, 2010. [Google Scholar] [CrossRef]
  75. Zhou, K.; Qiu, S.; Cao, F.; Wang, G.; Cao, L. Coupling PROSPECT with prior estimation of leaf structure to improve the retrieval of leaf nitrogen content in Ginkgo from bidirectional reflectance factor spectra. Plant Phenomics 2024, 6, 0282. [Google Scholar] [CrossRef] [PubMed]
Figure 1. Overview of the study area and sampling design. (a) represented the geographical location of the study area; (b) showed the UAV orthophoto of the olive orchard; (c) displayed an individual olive tree; (d) illustrated the canopy SPAD measurement scheme, where three leaves were measured in each of the four canopy directions (east, south, west, and north), and their average was used as the canopy SPAD value; (e) showed the upper (e1) and lower (e2) surfaces of olive leaves, which exhibited distinct color differences and both possessed a thick waxy layer.
Agronomy 15 02718 g001
Figure 2. Workflow of this study.
Agronomy 15 02718 g002
Figure 3. Pearson correlation coefficients between single band, vegetation index, and SPAD.
Agronomy 15 02718 g003
Figure 4. Pearson correlation coefficient between texture features of different bands and SPAD. (a) G; (b) R; (c) RE; (d) NIR.
Agronomy 15 02718 g004
Figure 5. SPAD estimation models constructed using multi-feature inputs, including single-band reflectance, vegetation indices, and texture features. (a) RF; (b) XGBoost; (c) PLSR; (d) SVM.
Agronomy 15 02718 g005
Figure 6. SHAP-based interpretability analysis of the XGBoost model. (a) Bar plot of mean absolute SHAP values showing the overall contribution of each feature to the model output. (b) SHAP summary plot illustrating the influence direction and magnitude of each feature on the predicted chlorophyll content; red and blue points represent high and low feature values, respectively.
Agronomy 15 02718 g006
Table 1. Vegetation indices generated from multispectral images in this study.
Vegetation IndicesFormulaReferences
Normalized Difference Vegetation Index (NDVI) ρ NIR ρ R ρ NIR   +   ρ R [37]
Green Difference Vegetation Index (GDVI) ρ NIR ρ G ρ NIR   + ρ G [9]
Normalized Difference Rededge Index (NDRE) ρ NIR ρ RE ρ NIR   +   ρ RE [38]
Green Normalized Difference Vegetation (GNDVI) ρ NIR ρ G ρ NIR   +   ρ G [39]
Green Optimized Soil Adjusted Vegetation (GOSAVI) ρ NIR ρ G ρ NIR   +   ρ G   +   0.16 [40]
Red Edge Ratio Vegetation Index (RERVI) ρ NIR ρ RE [41]
Normalized Difference Index (NDI) ρ NIR ρ RE ρ NIR   +   ρ R [42]
Green Soil Adjusted Vegetation Index (GSAVI) 1.5   × ρ NIR ρ G ρ NIR   +   ρ G   +   0.5 [40]
DATT ρ NIR ρ RE ρ NIR ρ R [43]
Normalized Red Edge Index (NREI) ρ RE ρ RE   +   ρ NIR   +   ρ G [44]
Modified Chlorophyll Absorption In Reflectance Index (MCARI) ( ρ NIR ρ RE ) 0.2   × ( ρ NIR ρ R )   ×   ρ NIR ρ RE [45]
Normalized Red Vegetation Index (NRI) ρ R ρ RE   +   ρ NIR   +   ρ R [46]
Modified Enhanced Vegetation Index (MEVI) 2.5   × ρ NIR ρ RE ρ NIR + 6   ×   ρ RE 7.5   ×   ρ G + 1 [44]
Transformed Normalized Difference Vegetation Index (TNDVI) ρ NIR ρ R ρ NIR   +   ρ R   +   0.5 [47]
Modified Simple Radio
Soil-Adjusted Vegetation Index (MSR)
ρ NIR ρ R 1 ρ NIR + ρ R + 1 [48]
Transformed Chlorophyll Absorption Reflectance Index (TCARI) 3 × ( ( ρ RE ρ R ) 0.2   ×   ( ρ RE ρ G )   ×   ( ρ RE ρ R ) ) [49]
Optimized Soil-Adjusted Vegetation Index (OSAVI) ( 1 + 0.16 )   × ρ NIR ρ R ρ NIR   +   ρ R   +   0.16 [50]
TCARI/OSAVI T C A R i O S A V i [51]
ρ G ,   ρ R ,   ρ RE ,   and   ρ NIR represent the reflectance of the G, R, RE, NIR bands, respectively.
Table 2. Performance of univariate linear regression models for chlorophyll estimation based on different features.
FeaturesExpressionTraining SetValidation Set
R2RMSERPDR2RMSERPD
Gy = −888.4677x + 117.20710.533.211.480.681.901.81
Ry = −540.4216x + 102.81250.303.921.210.622.081.66
TCARI/OSAVIy = −112.4576x + 104.44790.254.061.170.332.751.26
R_Meany = −1.4082x + 102.17440.303.911.210.622.051.68
R_Homy = 45.1415x + 54.15910.174.271.110.572.201.57
R_Dissy = −8.5110x + 92.75370.134.371.080.512.341.48
R_Enty = −16.1965x + 107.29850.174.261.110.532.301.50
R_SeMoy = 51.8824x + 68.90770.174.271.110.502.361.46
G_Meany = −2.1226x + 116.05960.533.211.470.681.881.83
G_Variy = −2.3749x + 92.11920.254.051.170.482.401.43
G_Homy = 61.7750x + 46.34480.343.791.250.412.571.34
G_Conty = −0.8193x + 89.65200.174.251.110.462.471.40
Table 3. Performance comparison of models constructed using multi-feature inputs, including single-band reflectance, vegetation indices, and texture features.
ModelsTraining SetValidation Set
R2RMSERPDR2RMSERPD
RF0.732.411.960.741.712.01
XGBoost0.782.172.180.751.672.06
PLSR0.612.921.620.642.011.71
SVM0.573.051.550.691.861.86
Disclaimer/Publisher’s Note: The statements, opinions and data contained in all publications are solely those of the individual author(s) and contributor(s) and not of MDPI and/or the editor(s). MDPI and/or the editor(s) disclaim responsibility for any injury to people or property resulting from any ideas, methods, instructions or products referred to in the content.