1. Introduction
The efficient development and utilization of urban land resources have led to increasingly serious environmental problems [
1]. In particular, the black soil region in Eastern Inner Mongolia, China, as a vital component of the Eurasian chernozem belt, serves as a crucial commodity grain and animal husbandry base, holding an irreplaceable strategic role in ensuring regional food security. However, this fragile ecosystem is facing threats of soil degradation and pollution caused by high-intensity agricultural practices and industrial/mining activities. The distribution characteristics of heavy metal contamination in agricultural soils in China show a trend of “obvious regional differences and complex evolution” [
2], and urbanization [
3] has caused agricultural soils near urban areas to suffer from varying degrees of heavy metal contamination. Soil heavy metals are non-biodegradable, persistent, and highly toxic [
4], which makes contaminated farmland exert direct negative impacts on soil ecosystems, directly related to food security and potential health risks [
5].
Recently, studies have begun to address heavy metal pollution in the Inner Mongolia black soil region. For instance, Zerizghi et al. assessed ecological and health risks around coal mining areas, while Xie et al. comprehensively evaluated the ecological risk of heavy metals around a typical lead (Pb) and zinc (Zn) mining area in eastern Inner Mongolia Autonomous Region [
6,
7]. However, most of these studies focused on single methods or specific local areas. A systematic and comprehensive assessment of heavy metal pollution in farmland soils across the entire eastern black soil region—particularly one integrating static environmental carrying capacity, quantitative source apportionment, and population-specific health risks—remains scarce. Therefore, it is crucial to identify the sources of soil heavy metals and conduct a comprehensive pollution assessment to analyze the risk levels posed to humans.
The Nemero Comprehensive Pollution Index Method, Enrichment Factor Method, Geo-Accumulation Index Method, and Potential Ecological Risk Index Method have been widely used for evaluating heavy metal contamination in soils and assessing ecological risks [
8]. In this study, the static environmental carrying capacity (QI) was used to systematically identify the pollution level of specific sites and key pollution elements, thereby determining the regional total pollutant discharge standard. The static environmental carrying capacity (QI) reflects the maximum level of pollutants that a system can receive over a given period without causing environmental pollution. This concept has been widely applied to hydrological and atmospheric systems. Soil heavy metal environmental capacity can serve as a pollution evaluation index to determine the status of soil heavy metal contamination and provide critical reference data for metal emission reduction measures [
9].
Currently, pollution source allocation methods can be divided into two categories: pollution source identification and pollution source quantification [
10]. The former uses tools like the Geographic Information System (GIS), Principal Component Analysis (PCA), Factor Analysis (FA), and Cluster Analysis (CA) to identify major pollution sources [
10], while the latter employs receptor models, initially developed for source assignment of atmospheric pollutants. Receptor models such as the Chemical Mass Balance (CMB) and Positive Matrix Factorization (PMF) have been widely used because they can quantitatively determine the contributions of various sources in many studies [
11]. The PMF model, an improved receptor model based on traditional factor analysis, is capable of providing non-negative source contributions based on chemical compositions and has become one of the dominant methods for determining the number of soil heavy metal contamination sources and the contribution of each source to heavy metal elements [
12]. Thus, PMF models have also been used to identify potential metal sources in agricultural soils [
13].
While many studies have assessed heavy metal contamination, ecological risk and health risk in individual cities or counties of the black soil areas in Heilongjiang, Jilin and Liaoning Provinces, integrated assessments covering the entire eastern chernozem belt of Inner Mongolia have been largely overlooked. This belt, including Hulunbuir, Xing’an League, Chifeng and Tongliao, is an important grain and livestock production base and represents the western segment of the national black soil protection plan. Recent work has combined potential ecological risk indices, environmental capacity and PMF in selected black soil sub-regions such as the Sanjiang Plain and Liaoning black soil area, yet these case studies are limited in spatial extent and rarely integrate static environmental carrying capacity (QI) with source apportionment and age-specific health risk assessment at a regional scale.
In this study, soils of Eastern Inner Mongolia were analyzed for soil Cr, Ni, Cu, As, Cd, Pb, and Zn contents, and we evaluated soil contamination sites and risk levels using the geo-accumulation index method, static environmental carrying capacity, and potential risk index. Various sources of soil heavy metals were quantified via PMF and the risks of soil heavy metals to the human body were determined through a human health risk assessment model, providing a scientific basis for soil heavy metal pollution prevention, control, and remediation of contaminated soils.
2. Materials and Methods
2.1. Overview of the Study Area
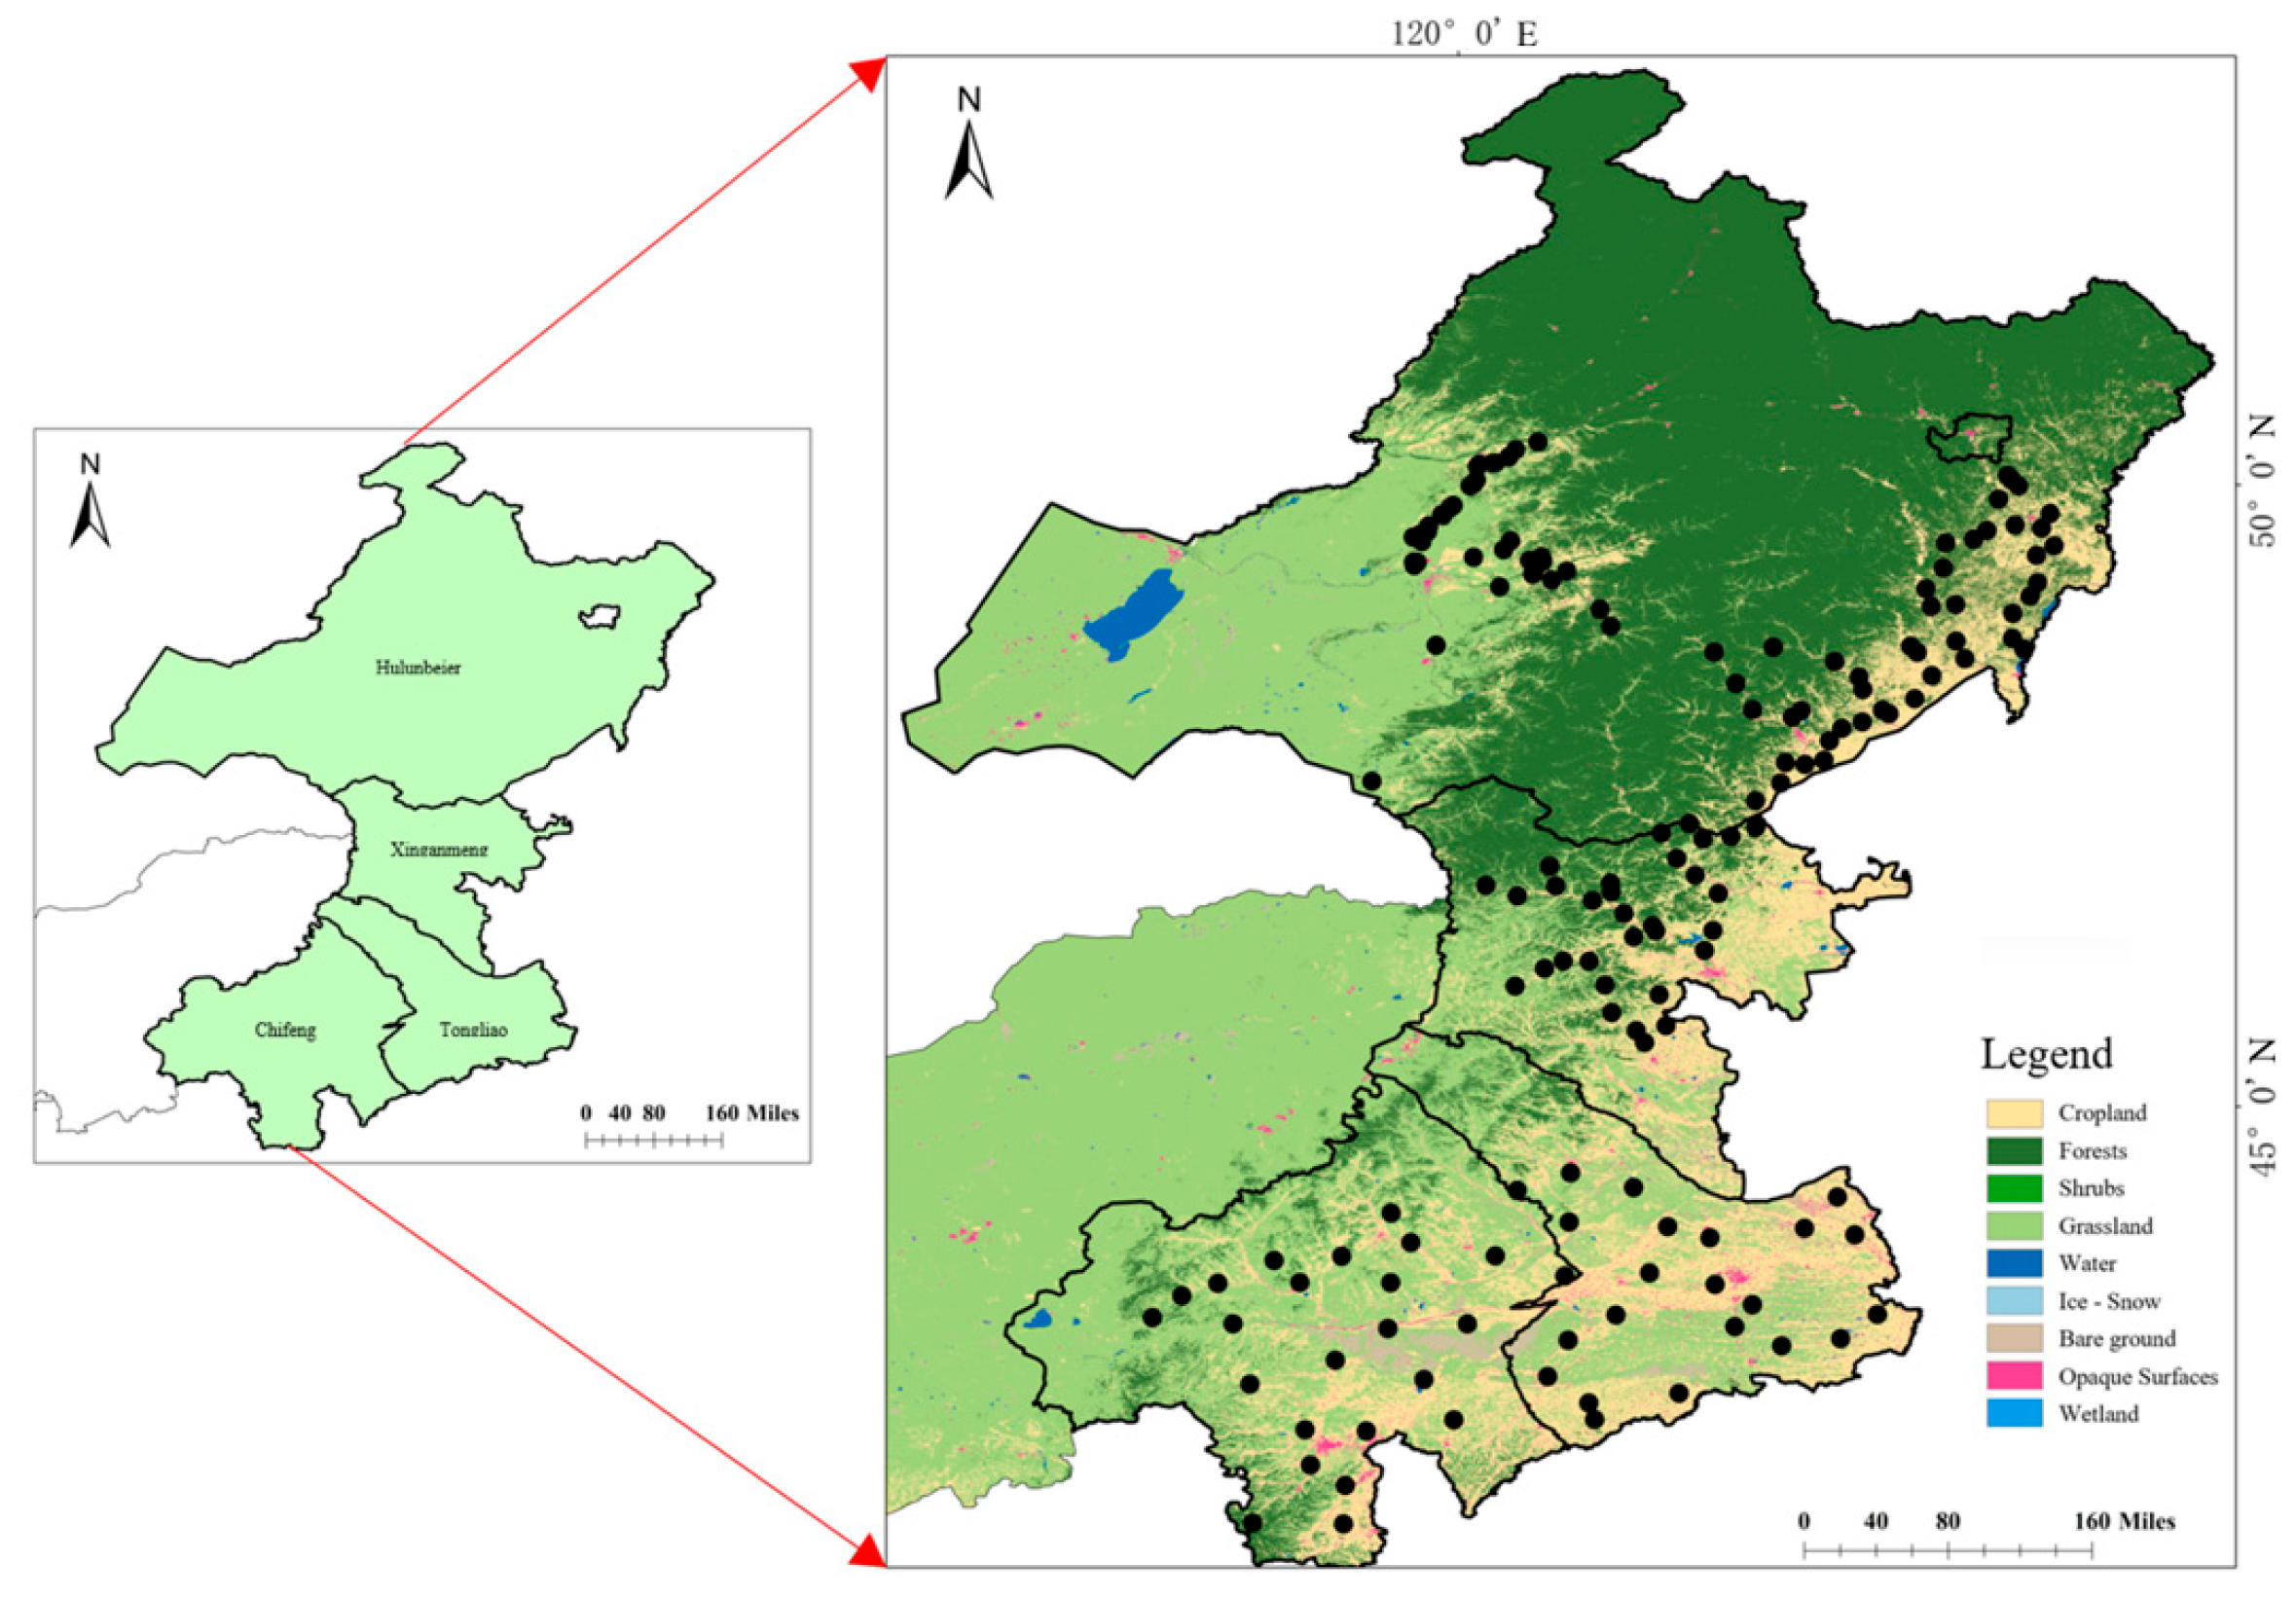
The study area includes Hulunbeier, Xing’anmeng, Chifeng, and Tongliao (41°17′–53°20′ N, 115°13′–126°04′ E) in Eastern Inner Mongolia, where the main land uses are forest land, grassland, paddy field, and dry field; the vegetation is distributed as broad-leaved forests, coniferous forests, mixed coniferous–broad-leaved forests, and grasslands; and the soil types are dominated by alluvial and calcareous soils. The main crops in the sampling zone are rice, soybean, and rapeseed. The soil thickness is 60–120 cm, the average temperature ranges from 0 to 10 °C, and the annual precipitation is 100–600 mm, characterizing a temperate continental monsoon climate.
2.2. Sample Collection and Analysis
From 5 to 22 August 2023, a total of 163 composite topsoil samples (0–20 cm) were collected from agricultural fields across the four prefectures of Hulunbeier, Xing’anmeng, Chifeng and Tongliao. At each sampling site, four subsamples were taken along a short diagonal within a ~10 m × 10 m plot and thoroughly homogenized in the field to obtain approximately 1 kg of soil as one composite sample representing that site. Soil samples collected from the field were immediately returned to the laboratory on separate trays, stripped of leaves, weeds, debris, and other foreign matter, and left to dry naturally in a ventilated, sunny, and light-protected area. The samples were air-dried at room temperature, ground, and sieved through a 100-mesh soil sieve and a 2 mm soil sieve, then preserved for analysis. GPS was utilized to accurately locate each sampling point (
Figure 1).
Soil samples were pre-treated and digested according to “HJ 832-2017”, and then seven heavy metals (Cr, Ni, Cu, As, Cd, Pb, and Zn) were determined using the HNO3-HCl-HClO4 method. Among them, Zn was determined by inductively coupled plasma optical emission spectrometry (ICP-OES, PerkinElmer Optima 8300, Prodigy7, Waltham, MA, USA), and Cr, Ni, Cu, As, Pb, and Cd concentrations were measured by ICP-MS (NexION 300 Platinum Elmer Instruments Shanghai Co. Waltham, MA, USA); pH was determined following “HJ 962-2018”, available phosphorus (AP) according to “NY/T 1121.7-2014”; available potassium (AK) was determined using “NY/T 889-2004”, which specifies the method for available and slowly available potassium in soil; and organic matter (OM) was determined via “NY/T 1121.6-2014”. The detection limits for Cr, Ni, Cu, As, Pb, Zn, and Cd were 2, 2, 0.7, 0.2, 1, 5, and 0.03 mg·kg−1, respectively, while those for AP, AK, and OM were 0.1 mg·kg−1, 0.5 mg·kg−1, and 0.6 g·kg−1. Quality assurance was ensured using duplicate samples, blanks, and standard reference soils (GSS-5a and GSS-6a). Standard recoveries ranged from 85% to 123% with relative standard deviations (RSDs) of duplicate samples <5%. The analytical methods were validated for accuracy and precision using national soil standards (GBW series), and sample quality was strictly monitored through proportional sampling and anomaly checking, with results meeting monitoring requirements.
2.3. Evaluation Methodology
2.3.1. Index of Geo-Accumulation
The geo-accumulation index (
Igeo) was proposed by the German scientist Muller and is widely used to evaluate the degree of contamination of soil and sediment with heavy metals [
14]. The calculation formula is as follows:
where
Ci is the measured content of soil heavy metal
i (mg-kg
−1);
Bi is the evaluation standard value of soil heavy metal
i (mg-kg
−1), and 1.5 denotes the coefficient of variation in the background value caused by crustal movement [
13]. The background values of soil elements in Inner Mongolia were used in the paper, as well as the grading criteria of the ground accumulation index method (
Table 1).
2.3.2. Static Environmental Carrying Capacity
Soil static environmental carrying capacity (
QI) was introduced to characterize the impact of heavy metal pollution on soil environmental quality. Compared with traditional pollution indicators, the soil static environmental carrying capacity considers both the critical and background values of soil heavy metal concentrations. In addition to evaluating metal enrichment,
QI also has the advantage of reflecting sustainable development capacity, which plays a crucial role in improving soil environmental quality and remediating soil pollutants [
9].
-
represents the single environmental carrying index for metal I;
and
represent the existing and total environmental carrying capacity, calculated as follows:
where
M denotes the soil weight per hectare of arable land;
and
are the detected concentration and background value of metal I; and
represents the evaluation standard of metal I for the screening value of soil risk control criteria (GB 15618-2018, China). In order to assess the environmental carrying capacity of a single site for multiple metals, the
QI was calculated as follows:
where
n denotes the total number of selected heavy metals, and the
QI values are classified into five categories (
Table 2).
2.3.3. Potential Risk Index (PRI) Methodology
The index of potential ecological risk (
Table 3) takes into account both the average content of heavy metals and the link between ecological effects, environmental effects and toxicology of heavy metals [
15]. The potential ecological risk is determined from the local elemental background values of soil heavy metals [
16]. The formula is as follows:
where RI is the potential ecological risk index;
is the ecological risk indicator factor for heavy metal element I;
is the toxicity response factor for heavy metal I;
Wi is the measured value of heavy metal
i (mg-kg
−1); and
Bi is the local background value of heavy metal
i (mg-kg
−1). The toxicity response factors for heavy metals were set as Cr = 2, Ni = 5, Cu = 5, As = 10, Pb = 5, Zn = 1 and Cd = 30 [
16].
2.4. Positive Matrix Factorization
Positive Matrix Factorization (PMF) is an analytical model that decomposes the sample data matrix into factor contributions and factor profiles, accounting for multiple influencing factors. It weights the sample content and estimated uncertainty for individual data points relative to the overall dataset. The PMF model calculates the uncertainty-weighted error between observed and predicted concentrations at receptor sites, then identifies major pollution sources and their contributions via least-squares optimization [
17]. In this study, PMF was implemented through the EPA-PMF 5.0 software [
18], with specific calculation parameters and formulas detailed in the literature [
19]. The uncertainty quantification followed the methodology proposed in Chen Zhifan’s study [
20].
2.5. Human Health Risk Assessment
In this study, carcinogenic and non-carcinogenic risks were evaluated for two age groups (children and adults) in the study area via three exposure routes: direct ingestion, inhalation, and dermal contact, using the Health Risk Assessment (HRA) model proposed by the US EPA [
21]. Among exposure pathways, direct ingestion of heavy metals posed the highest health risk to the population, followed by dermal contact and inhalation. Chronic non-carcinogenic risks were assessed for Cr, Ni, Cu, As, Pb, Zn, and Cd, while Cr, Ni, As, and Cd were evaluated for carcinogenicity [
22]. Relevant parameters were derived from the literature [
23], and detailed calculation procedures are described as follows:
where
CS is the measured soil heavy metal (mg/kg) (
Table 4 and
Table 5).
The non-carcinogenic risk (
HI) and total non-carcinogenic risk (
THI) of a single metal were calculated under the three exposure pathways. If
HI or
THI > 1, it indicates that the heavy metal poses a non-carcinogenic risk to humans; conversely, it represents that soil heavy metals do not pose a risk to human health [
24]. Carcinogenic risk (
CR) is used to assess the likelihood of an individual’s exposure to a carcinogenic risk [
25,
26], where
i in
CRi. represents different pathways;
TCR is expressed as a combined carcinogenic risk value. Heavy metals are considered to pose a carcinogenic risk to humans if
CR or
TCR > 1 × 10
−4 [
27];
CR or
TCR < 10
−6 indicates that there is no carcinogenic risk to humans [
27]. a
CR or
TCR in the range of 1 × 10
−6 to 1 × 10
−4 indicates that soil heavy metals pose an acceptable carcinogenic risk to the population [
28,
29,
30].
For non-carcinogenic and carcinogenic risk calculations, inhalation hazard quotients (
HQinh) and carcinogenic risks (
CRinh) were only calculated when an inhalation reference concentration (RfC) or inhalation unit risk/slope factor (IUR/
SFinh) was available for a given metal. For metal–pathway combinations without such toxicity values, the corresponding inhalation risk was not quantified and is denoted as ‘–’ in
Table 5.
Table 4.
Relevant input parameters for characterizing the daily exposure dose of heavy metals under various exposure routes.
Table 4.
Relevant input parameters for characterizing the daily exposure dose of heavy metals under various exposure routes.
| Name | Parameter Symbol | Unit | Children | Adult | Reference |
|---|
| Average weight | BW | kg | 15.9 | 56.8 | [31] |
| Average exposure time | AT | day | ED×365 (non-
carcinogenic)
ED×70
(carcinogenic) | ED×365 (non-
carcinogenic)
ED×70
(carcinogenic) | [31,32] |
| Duration of exposure | ED | years | 6 | 24 | [31] |
| Frequency of exposure | EF | day/year | 350 | 350 | [31] |
| Direct intake rate | Ring | mg/day | 200 | 100 | [31] |
| Inhalation rate | Rinh | m3/day | 7.5 | 14.5 | [31] |
| Particulate emission factor | PEF | m3/kg | 1.36 × 10⁹ | 1.36 × 10⁹ | [32] |
| Skin Exposure Area | SA | m2 | 2448 | 5075 | [31] |
| Dermal absorption factor | ABS | - | 0.001 | 0.001 | [32] |
Table 5.
Reference dose (RfD) for non-carcinogenic metals and slope factor (
SF) for carcinogenic metals [
32,
33,
34].
Table 5.
Reference dose (RfD) for non-carcinogenic metals and slope factor (
SF) for carcinogenic metals [
32,
33,
34].
| RfD (mg/kg/Day) | SF (per mg/kg/Day) |
|---|
| | Direct Ingestion | Inhalation
Ingestion | Skin Contact | Direct Ingestion | Inhalation
Ingestion | Skin Contact |
|---|
| Cr | 3 × 10⁻³ | 2.86 × 10⁻⁵ | 6 × 10⁻⁵ | 5 × 10⁻² | 4.2 × 101 | 2 × 101 [35] |
| Ni | 2 × 10⁻² | 9 × 10⁻⁵ | 5.4 × 10⁻³ | 1.7 [36] | 8.4 × 10⁻¹ | 4.25 × 101 [36] |
| Cu | 4 × 10⁻² | 4 × 10⁻² [37] | 1.2 × 10⁻² | — | — | — |
| As | 3 × 10⁻⁴ | — | 1.23 × 10⁻⁴ | 1.5 | 1.51 × 101 | 3.66 |
| Pb | 3 × 10⁻³ | 3.52 × 10⁻³ [37] | 5.25 × 10⁻⁴ | 8.5 × 10⁻³ | 4.2 × 10⁻² [38] | — |
| Zn | 3 × 10⁻¹ | 3 × 10⁻¹ [37] | 6 × 10⁻² | — | | — |
| Cd | 1 × 10⁻³ | 2.86 × 10⁻⁶ | 2.5 × 10⁻⁵ | — | 6.3 | — |
| Zn | 3 × 10⁻¹ | 3 × 10⁻¹ [37] | 6 × 10⁻² | — | | Skin contact |
2.6. Data-Processing Analyses
This study was based on IBM SPSS Statistics 26.0, EPA PMF 5.0, Excel 2021 applications to complete the statistical analysis of the data, and Arc GIS 10.8.1, Origin 2022 applications to form graphs.
3. Results and Discussion
3.1. Descriptive Analysis of Heavy Metals in Agricultural Soils
All seven target heavy metals were detected above the method detection limits in all soil samples (
Table 6). The mean concentrations of Cr, Ni, Cu, As, Cd, Pb, and Zn in the study area were 61.77, 26.77, 17.07, 12.11, 0.08, 12.61, and 85.71 mg·kg
−1, respectively. The concentrations of Pb and Zn were lower than the background values for Inner Mongolia soils, while the mean concentrations of Cr, Ni, Cu, As, and Cd were 1.49, 1.37, 1.21, 1.61, and 1.51 times higher than their respective background values. Compared with the screening values for soil contamination risks in agricultural land, As and Cd exceeded the standards at only one site, and 6.21% of Ni sampling points exceeded the threshold. This indicates that significant metal accumulation in agricultural soils is typically associated with high anthropogenic impacts [
39].
The coefficient of variation (CV) characterizes the spatial variability of soil heavy metals [
40]. A CV ≤ 0.2 is classified as weak heterogeneity, 0.2 < CV ≤ 0.5 as moderate heterogeneity, and CV > 0.5 as strong heterogeneity. In the study area, Ni, Cu, Cd, available phosphorus, and available potassium exhibited strong heterogeneity, while the remaining elements showed moderate heterogeneity. The average concentration-to-background value ratios of Ni, As, and Cd were significantly higher than those of other elements, leading to the preliminary conclusion that Ni, As, and Cd were the primary pollutants in the study area’s soil.
Table 6.
Descriptive statistics of heavy metals in agricultural soils.
Table 6.
Descriptive statistics of heavy metals in agricultural soils.
| Heavy Metals | Unit | Maximum | Minimum | Mean Standard | Deviation | Coefficient of Variation | Inner Mongolia Soil Background Value | Mean/Background Value |
|---|
| Cr | mg/kg | 173.01 | 15.14 | 61.77 | 23.22 | 0.38 | 41.40 | 1.49 |
| Ni | mg/kg | 136.67 | 2.28 | 26.77 | 23.37 | 0.87 | 19.5 | 1.37 |
| Cu | mg/kg | 110.52 | 2.06 | 17.07 | 10.19 | 0.60 | 14.10 | 1.21 |
| As | mg/kg | 54.92 | 1.57 | 12.11 | 5.95 | 0.49 | 7.50 | 1.61 |
| Cd | mg/kg | 0.49 | 0.02 | 0.08 | 0.05 | 0.58 | 0.053 | 1.51 |
| Pb | mg/kg | 43.97 | 1.84 | 12.61 | 5.63 | 0.45 | 17.20 | 0.73 |
| Zn | mg/kg | 192.82 | 15.07 | 85.71 | 39.35 | 0.46 | 59.10 | 1.45 |
| AP | mg/kg | 125.89 | 9.55 | 38.45 | 20.90 | 0.54 | - | - |
| AK | mg/kg | 844.94 | 56.96 | 193.86 | 106.33 | 0.55 | - | - |
| OM | g/kg | 78.11 | 6.66 | 39.20 | 17.70 | 0.45 | - | - |
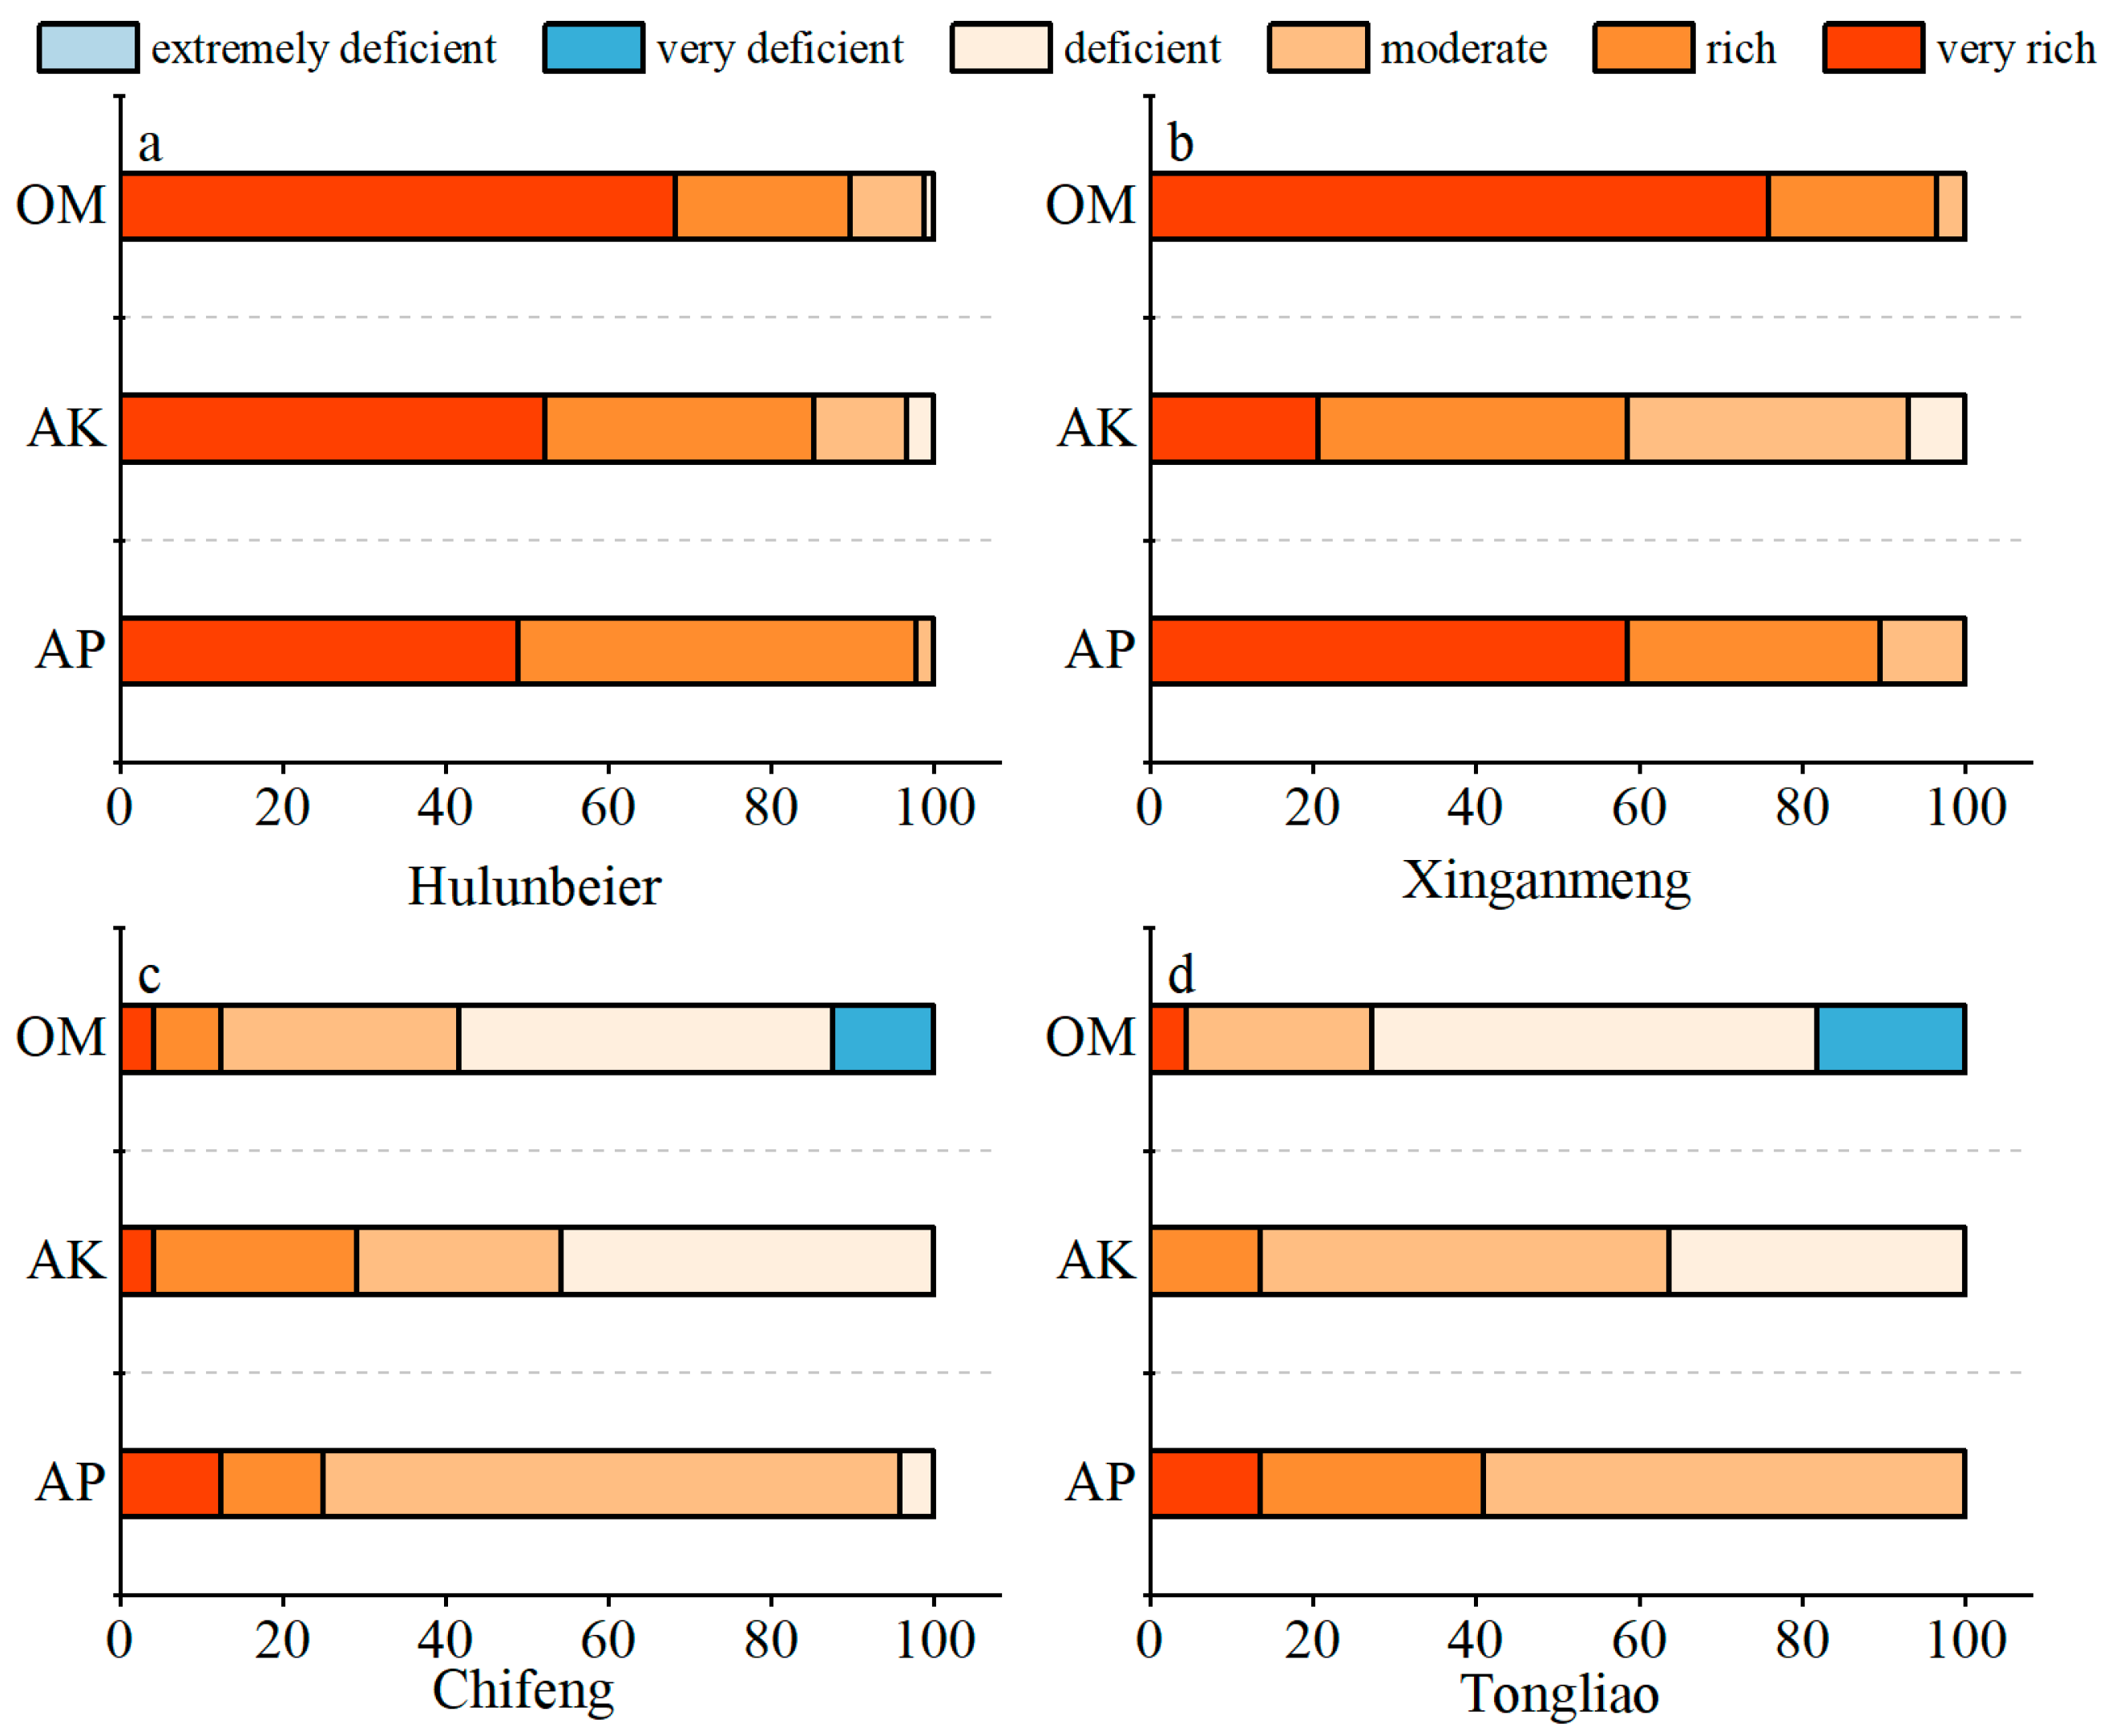
Soil organic matter plays a decisive role in maintaining soil structure and supplying nutrients. It not only promotes plant growth but also enhances soil permeability, water and fertilizer retention capacity, and improves soil structure. According to the soil fertility grading standard of the Second National Soil Census, soils in the study area (
Figure 2) were rich in available phosphorus, available potassium, and organic matter, except for those in Tongliao and Chifeng, which were deficient in organic matter. The higher contents of available phosphorus and available potassium may be attributed to the application of chemical and organic fertilizers to farmland soils [
41].
3.2. Characteristics of Heavy Metal Pollution in Agricultural Soils
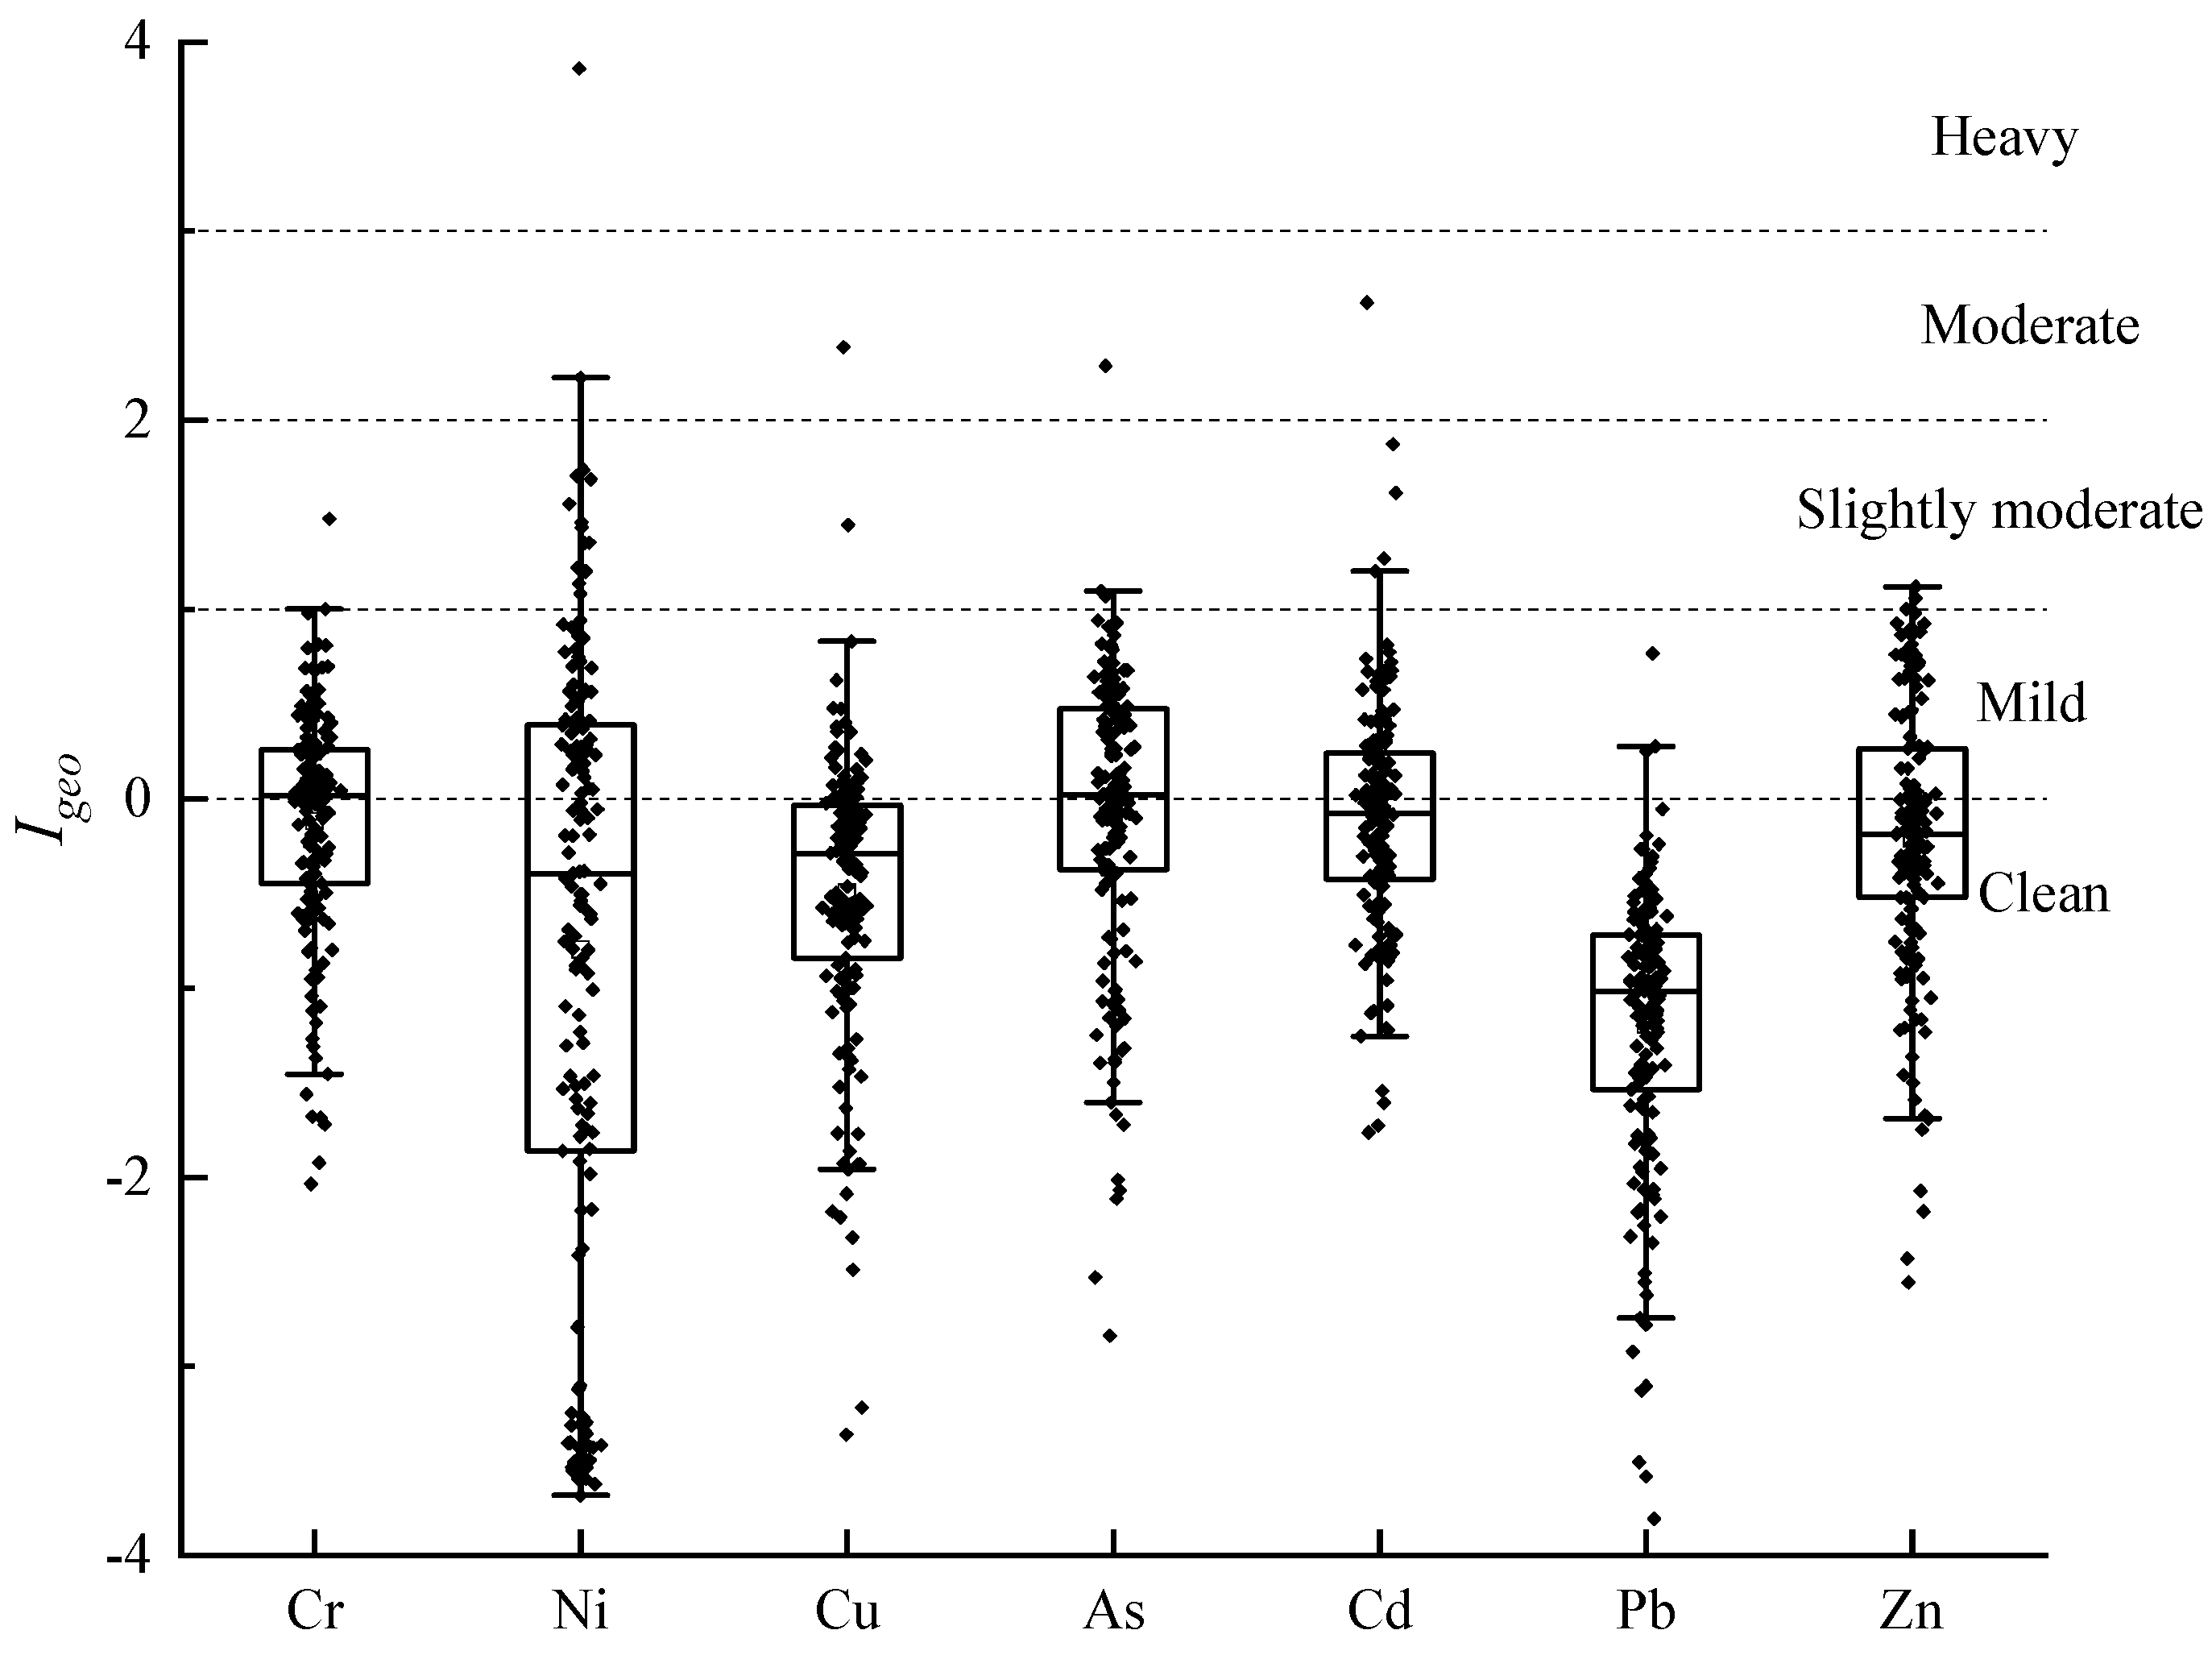
The results of the land accumulation index (
Figure 3) showed that the I
geo of Cu and Pb in the soil were −3.36~2.39, −3.81~0.77, Cu (22.70%) and Pb (1.84%) were in mild pollution, and the remaining sites were in clean condition; Cr, As, Cd and Zn were in the range of −2.04~1.48, −2.84~2.29, −1.76~2.62 and −2.56~1.12; Cr (55.15%), Zn (33.74%), Cd (42.94%) were in the mildly polluted state, and As (54.00%) was mainly in the mildly polluted state; the I
geo of Ni was in the range of −3.68~3.86, with large fluctuations, and 41.72% of the points were above mildly polluted, indicating that Ni was significantly affected by human activities.
The static environmental carrying capacity of heavy metals in farmland soils (
Table 7) showed that Ni was slightly polluted in the Hulunbeier area, while all other elements had low pollution levels. In the Xing’anmeng area, As and Zn were slightly polluted, whereas Chifeng and Tongliao showed minimal pollution.
Table 7.
Evaluation results of heavy metal soil environmental quality in the study area.
Table 7.
Evaluation results of heavy metal soil environmental quality in the study area.
| Aera | Cr | Ni | Cu | As | Pb | Zn | Cd |
|---|
| Hulunbeier | 0.87 | 0.51 | 0.97 | 0.75 | 1.02 | 0.85 | 0.91 |
| Xinganmeng | 0.86 | 1.32 | 0.95 | 0.58 | 1.05 | 0.54 | 0.93 |
| Chifeng | 0.97 | 0.99 | 0.98 | 0.91 | 1.04 | 1.03 | 0.95 |
| Tongliao | 1.04 | 1.10 | 1.04 | 1.13 | 1.09 | 0.83 | 1.01 |
Using the environmental carrying capacity of Hohhot, Xing’anmeng, Chifeng, and Tongliao four specific points of pollution assessment (
Table 7), the results indicated that: Hohhot Cr in the cordon line accounted for 82.95%, in the clean accounted for 10.23%; Ni elements clean, cordon line, slightly polluted, moderately contaminated, heavily contaminated accounted for 14.77%, 37.50%, 26.14%,10.23%, 11.36%; As is mainly alert and slightly polluted, accounting for 60.23% and 43.18%, respectively. Cd is mainly in the warning line, accounting for 87.50%, but there is a point in the state of heavy pollution; Zn is mainly in the light pollution, accounting for 78.41%. Pollution in Xing’anmeng is concentrated in As and Zn elements, with As elements accounting for 34.48% and 55.17% of the alert line and slight pollution, respectively, and Zn elements are relatively scattered, with clean, alert line, slight pollution and moderate pollution accounting for 10.34%, 21.14%, 41.38% and 24.14%, respectively. The Chifeng area is relatively lightly polluted, and it should be noted that the element accounts for 16.67% of the slight pollution. The pollution of Zn element in the Tongliao area needs to be noticed compared with other elements, accounting for 50.00% of the slight pollution. In general, Ni, As and Zn elements are relatively serious and need attention.
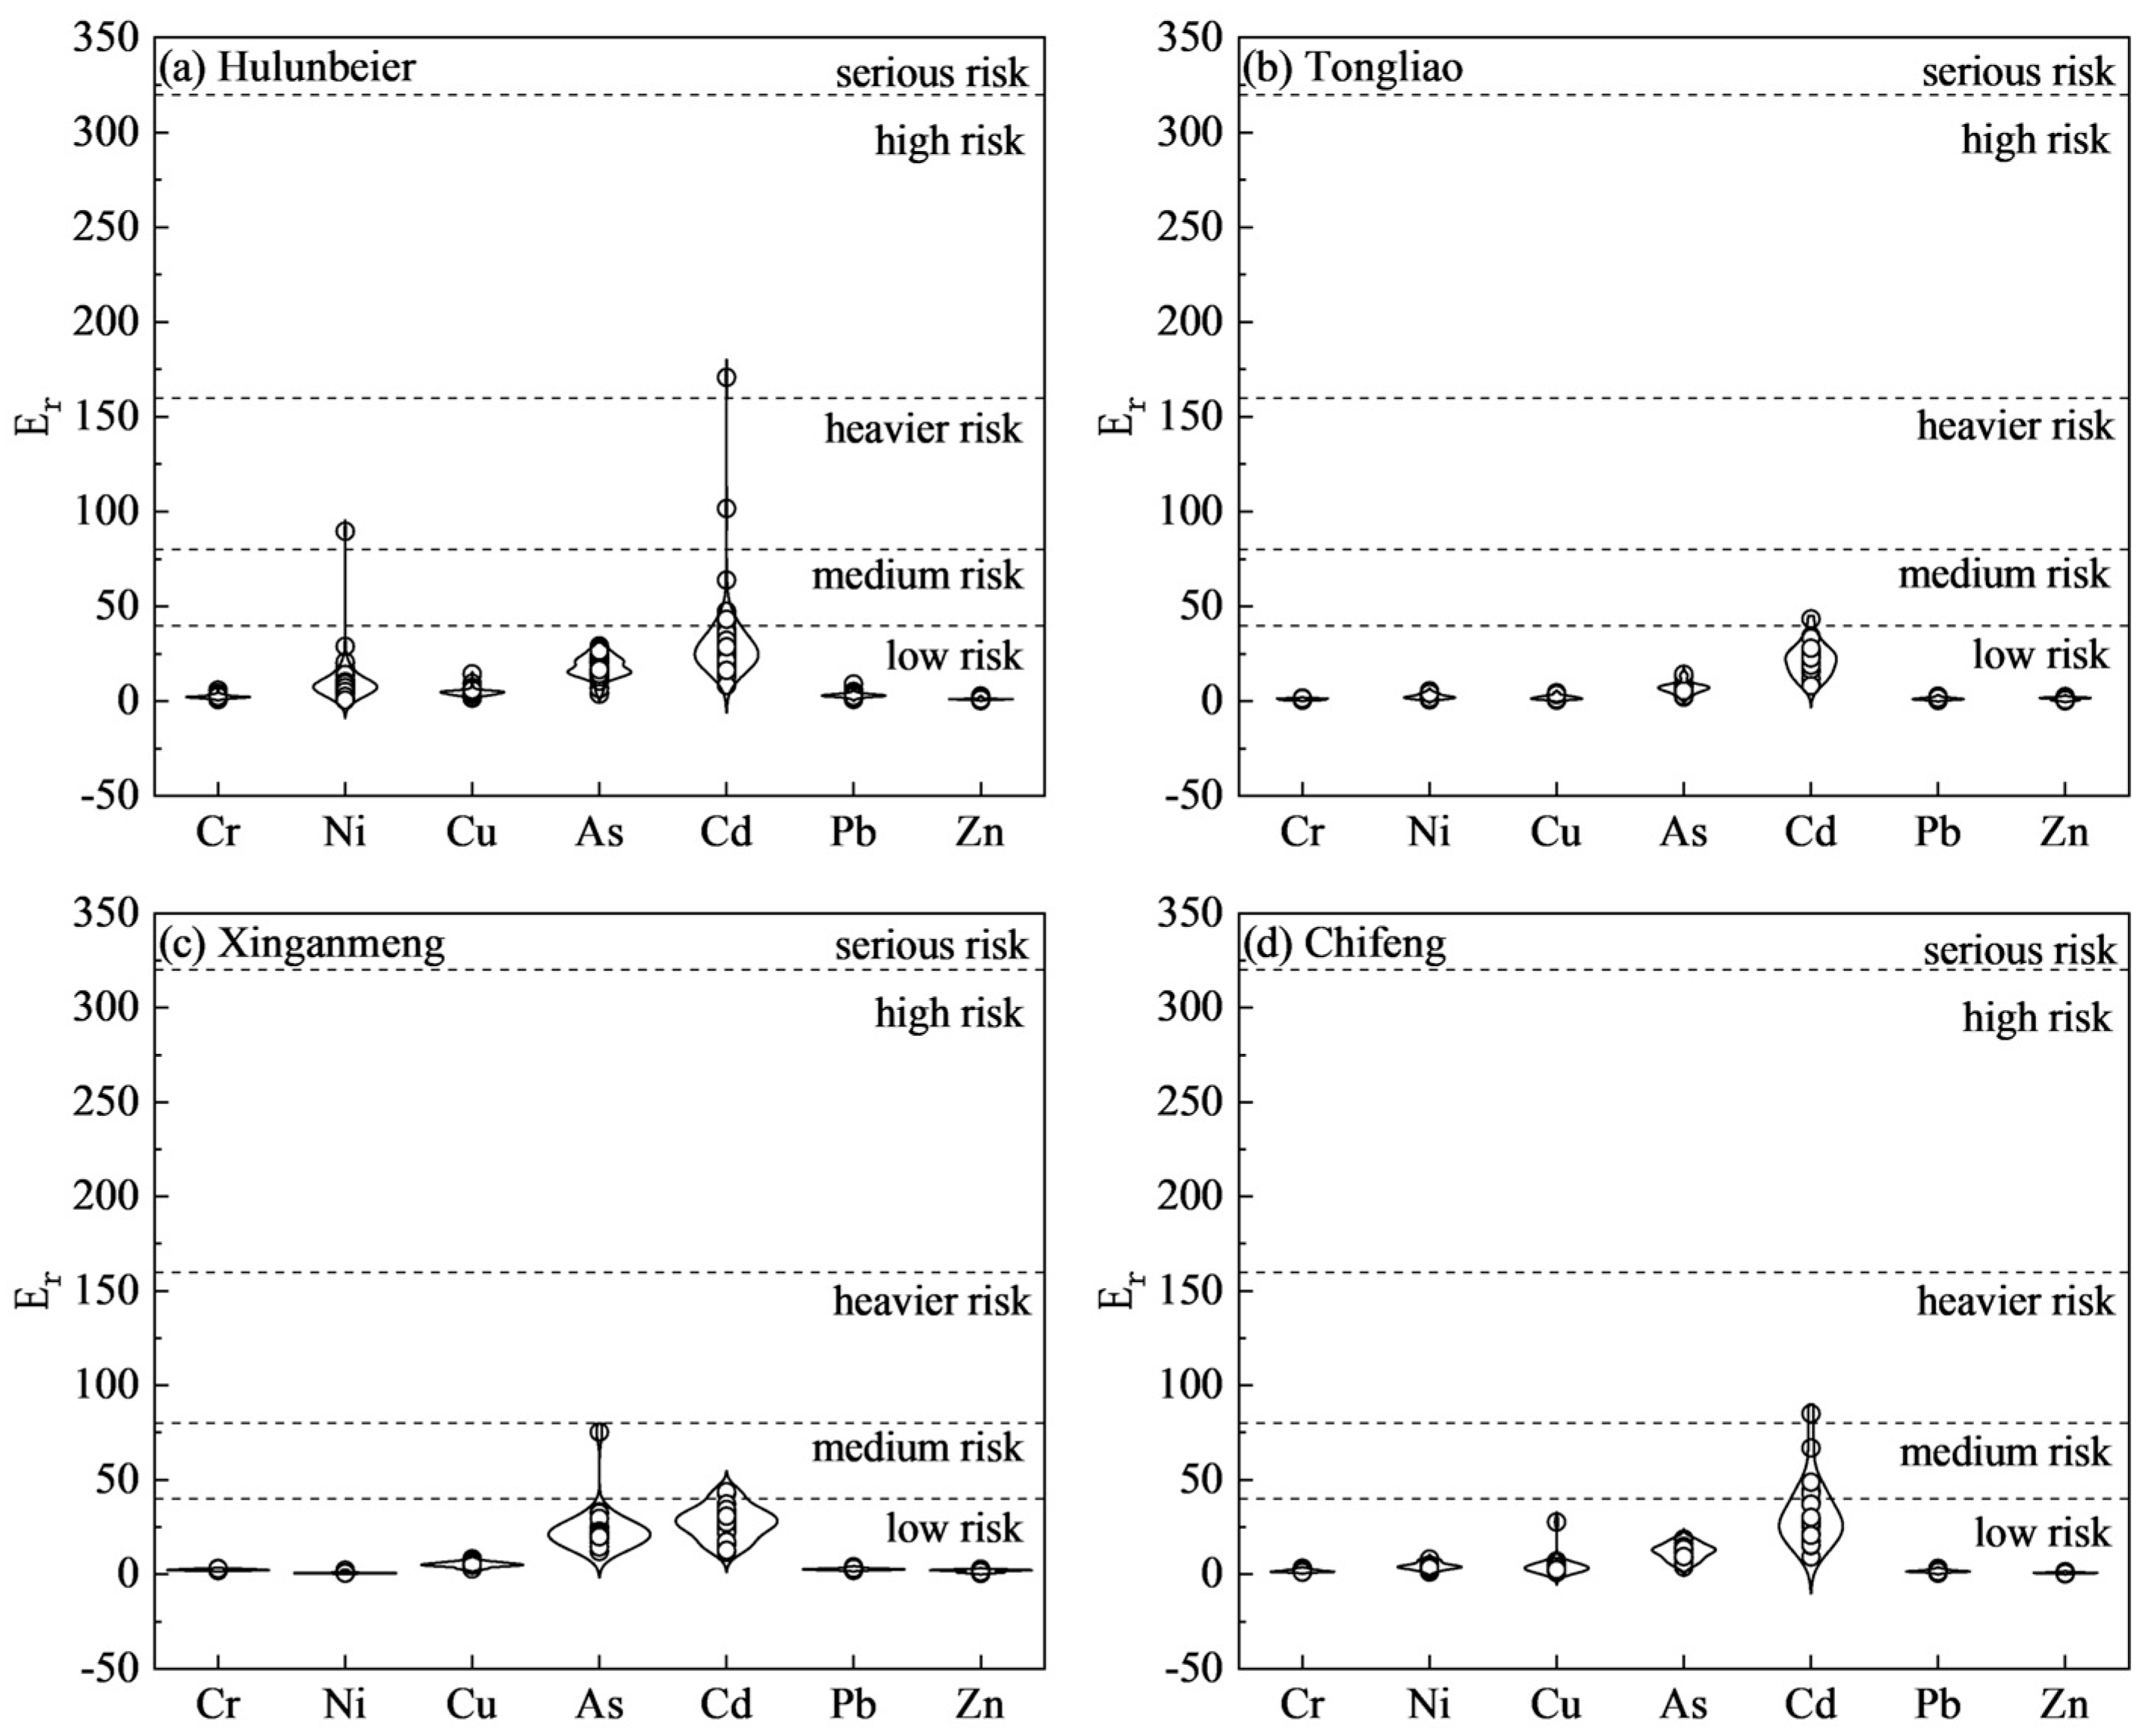
The average values of potential ecological risks
) of heavy metals in the study area were as follows: Cd (27.87) > As (16.58) > Ni (6.17) > Cu (4.27) > Pb (2.60) > Cr (2.11) > Zn (1.21), and none of the other heavy metals had any obvious risks except Cd. In terms of regions, Ni in Hulunbeier (
Figure 4a) has one point at high risk, and Cd has one point at medium risk, heavy risk and high risk, respectively. Tongliao (
Figure 4b) has a low level of overall pollution, with one point at medium risk for Cd and all other points at low risk. Xing’anmeng (
Figure 4c) was lightly polluted, with only one point at medium risk for As, 10.34% of the points at medium risk for Cd, and all other elements at low risk. Chifeng (
Figure 4d) was lightly polluted by other elements, with 16.67% of Cd at medium risk and 8.33% at heavy risk, mainly at low risk. Other elements were at low risk.
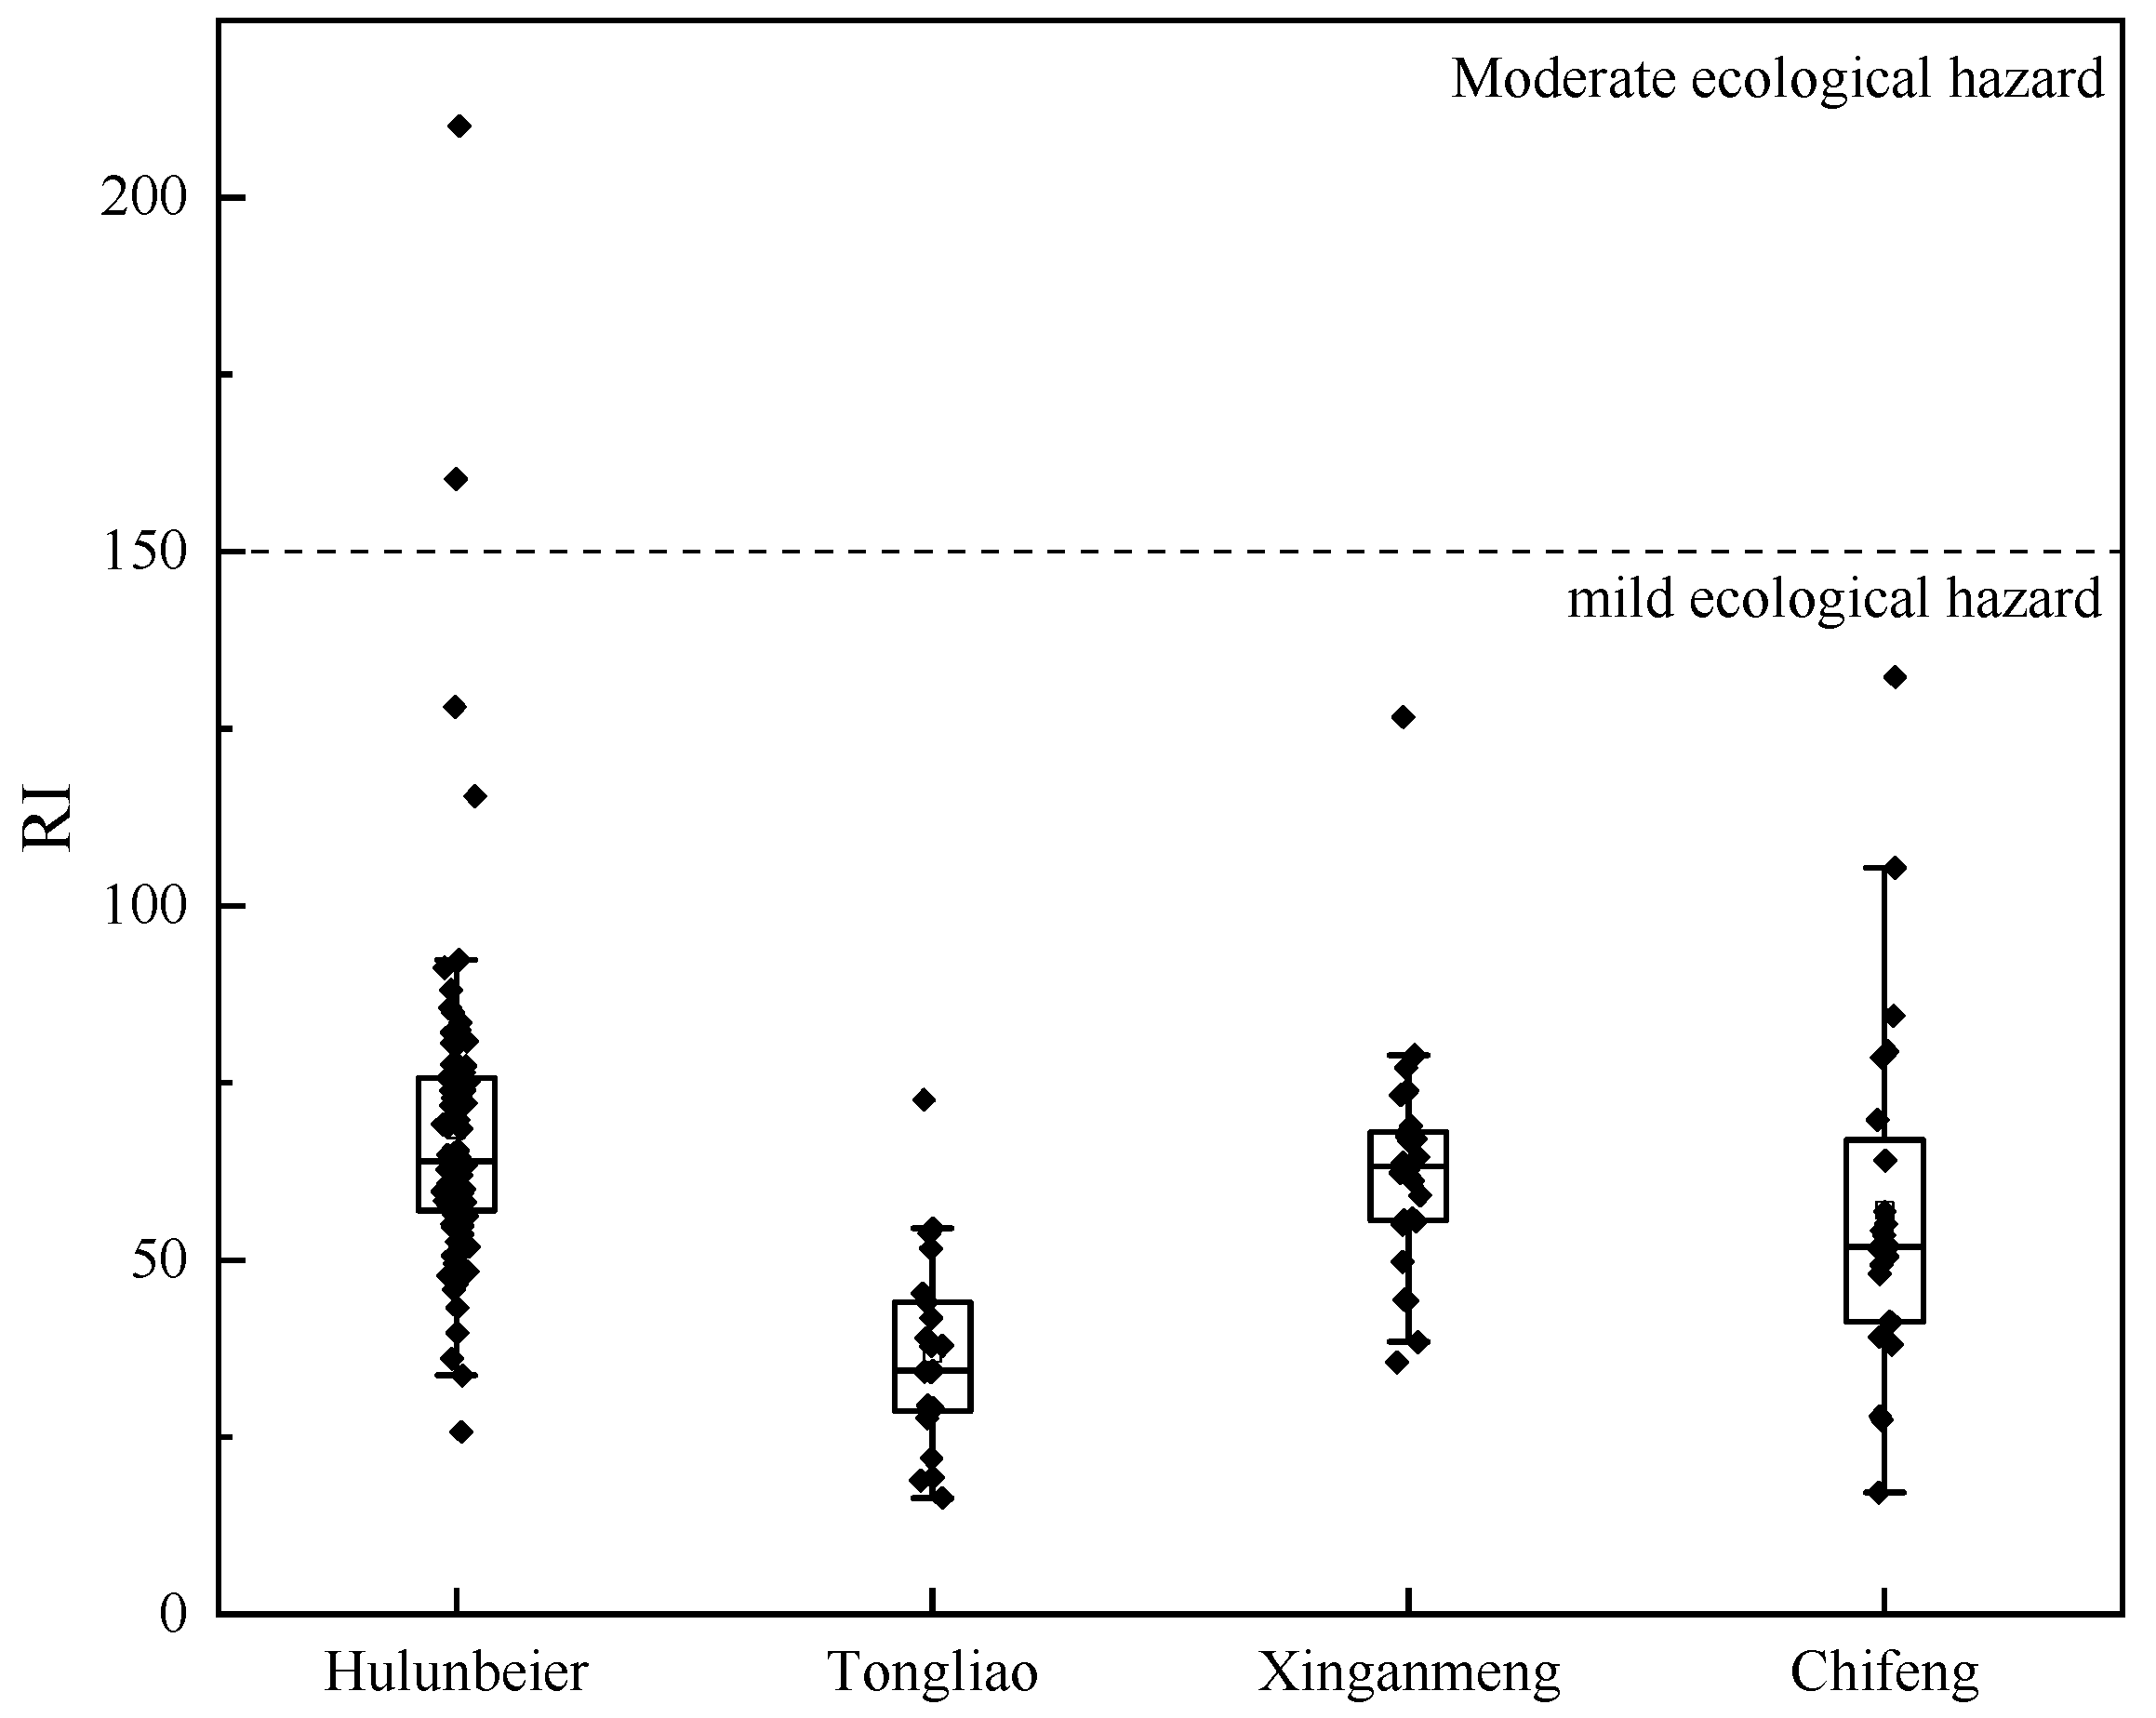
The comprehensive ecological risk index (RI) of the study area ranged from 16.44 to 210.03 (
Figure 5), with the highest risk in Hulunbeier (2.27% of sites at moderate risk) and minimal pollution in other regions. This aligns with previous studies [
41,
42,
43] showing severe ecological risks from soil Cd in coal mining areas. The main potential risk factor in the topsoil was Cd, with other heavy metals presenting low risks, and the combined ecological risk was at a mild level.
3.3. Spatial Distribution of Heavy Metals in Agricultural Soils
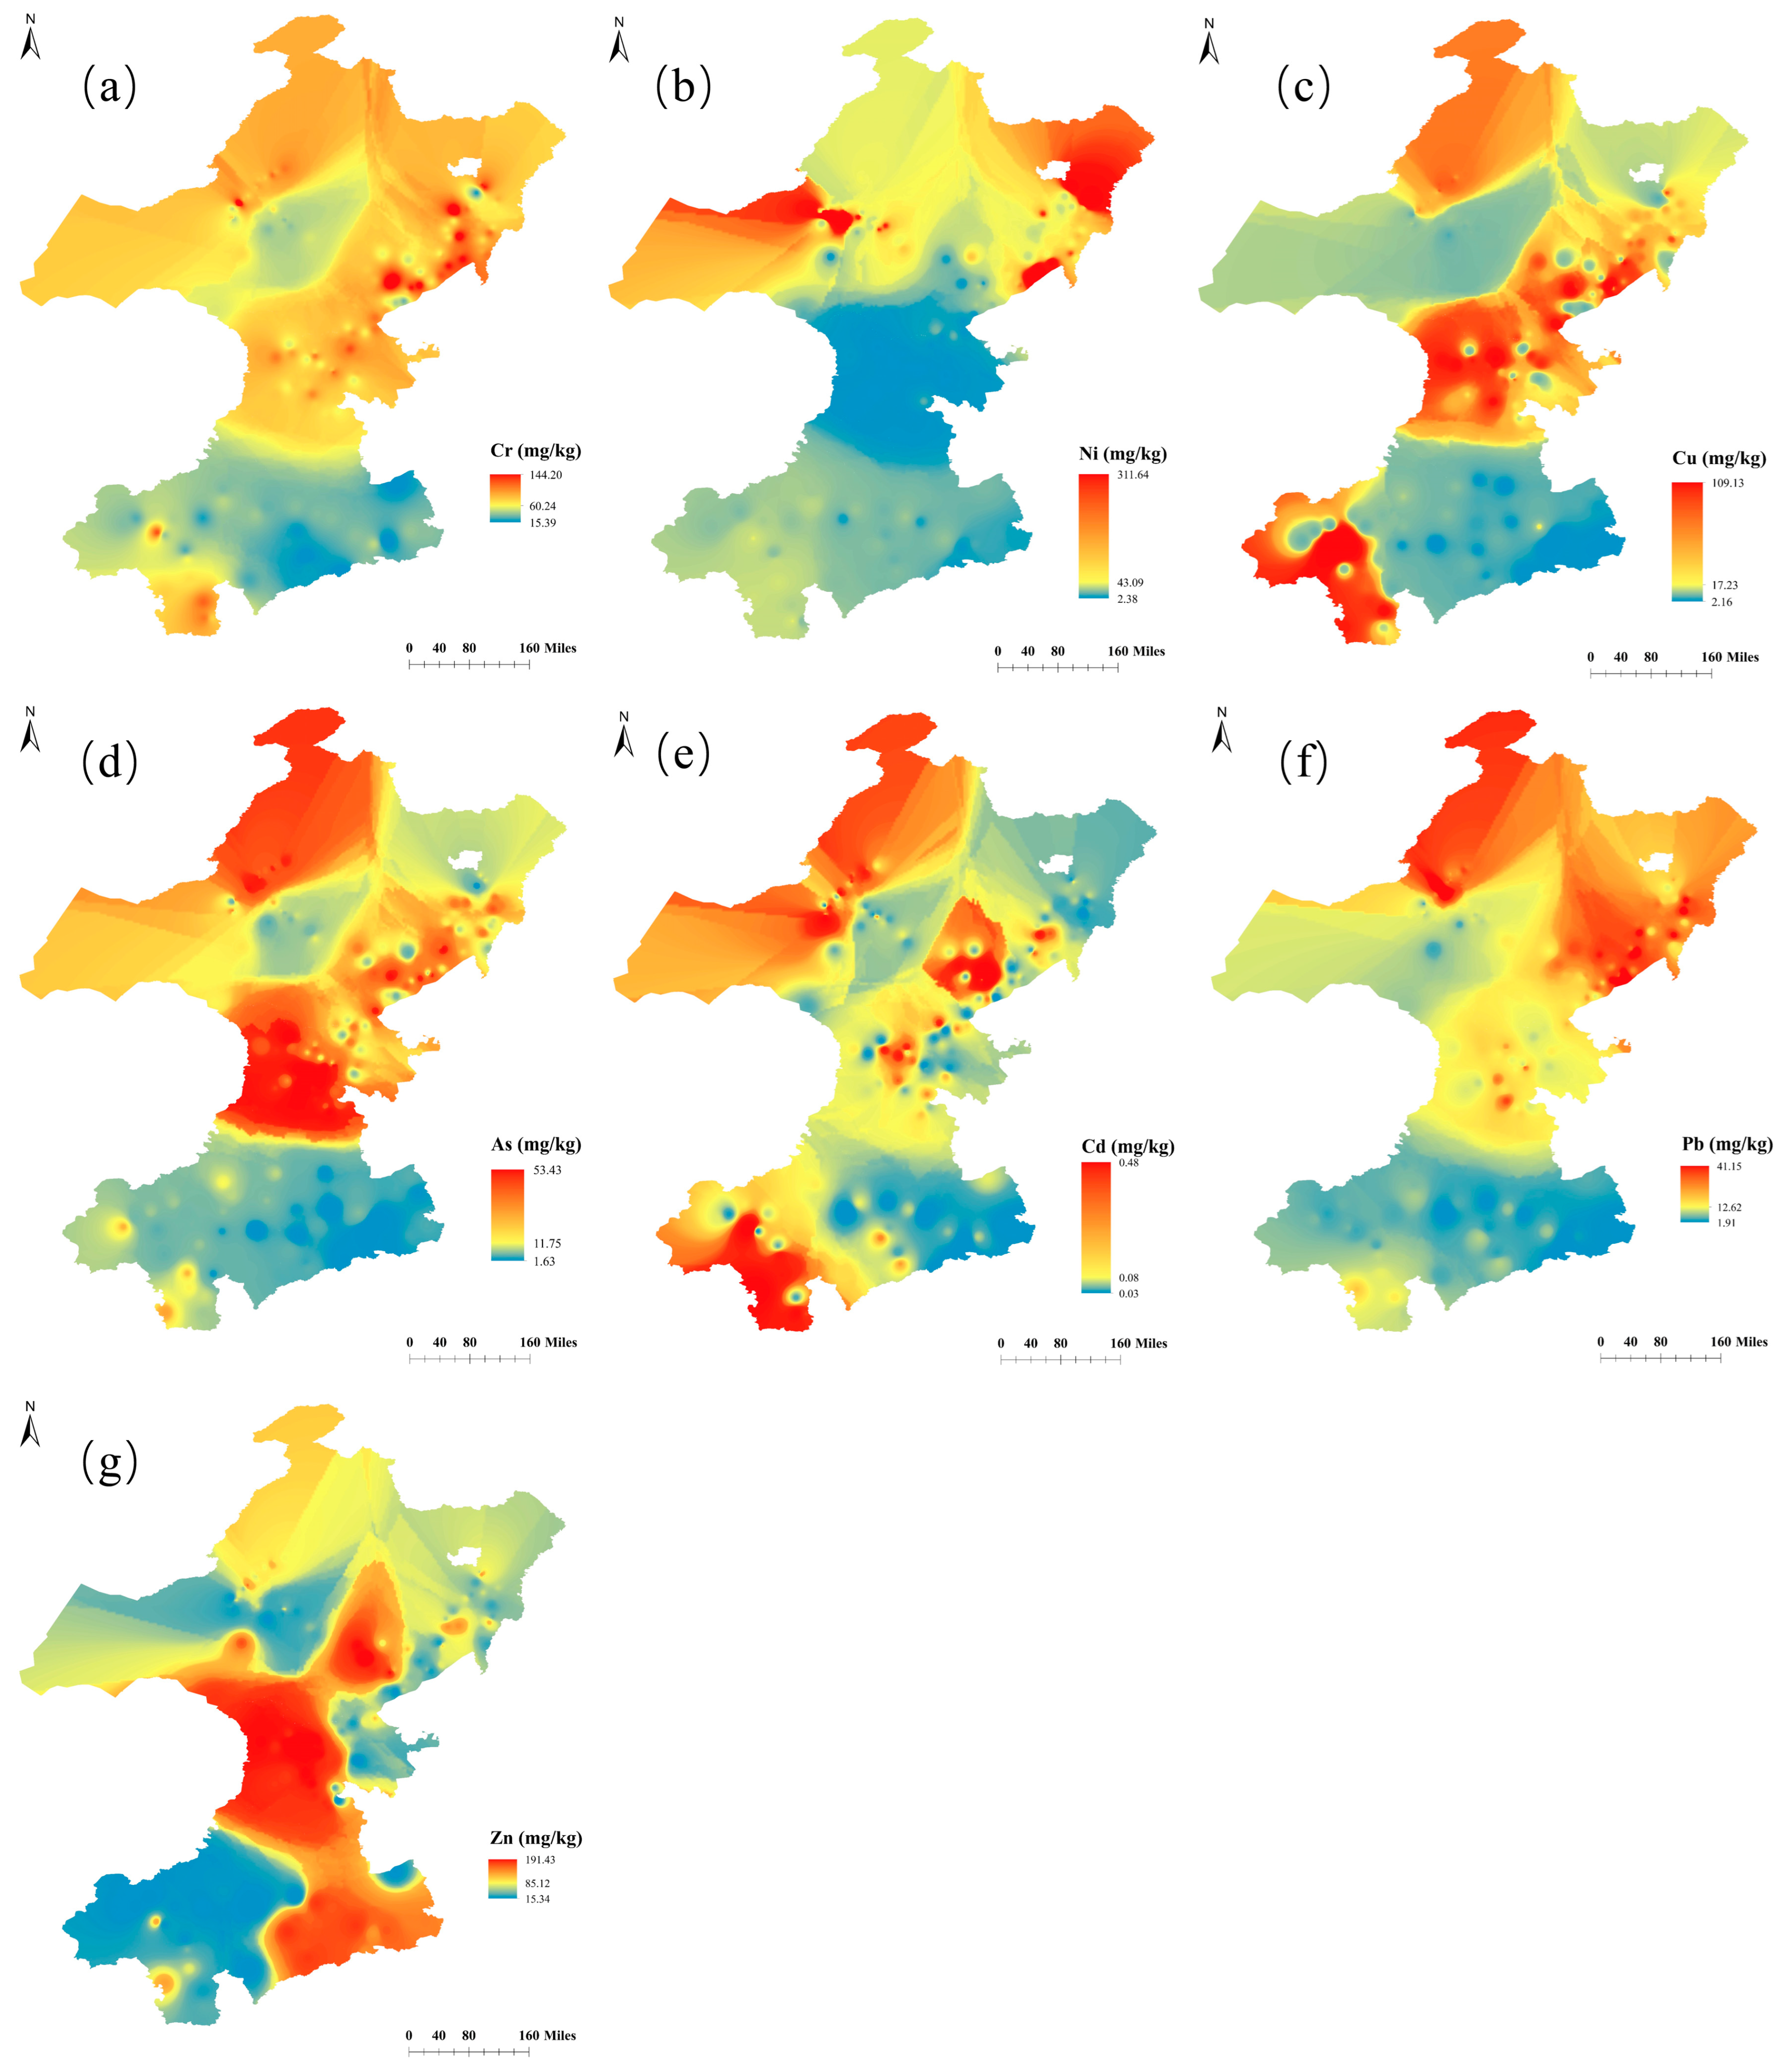
The spatial distributions of heavy metals As, Cr, and Cu were similar, with obvious high-value areas concentrated in the centre and low-value areas in the southeast (
Figure 6). The spatial distributions of Pb and Ni are similar, with high-value areas concentrated in the northern part of the study area, showing a patchy pattern. The spatial distribution of Zn is consistent, with high-value areas gradually spreading from the centre and southeast, and low-value areas concentrated in the northwest and southwest. The high-value areas of Cd are concentrated in the southwest and northwest. The spatial distribution of Zn content shows consistency, with high-value areas spreading gradually from the central and southeastern parts of the study area, and low-value areas concentrated in the northwestern and southwestern parts. The high-value area of Cd is concentrated in the northwestern part of the study area, where large coal fields are distributed, core industrial parks are concentrated in the north and south, and large petrochemical plants are also located. This indicates that anthropogenic activities play a significant role in the accumulation of heavy metals.
Overall, the spatial patterns of Cd, Ni, As and Zn in the Eastern Inner Mongolia chernozem belt can be explained by the combined influence of specific anthropogenic activities. Ni and Pb hotspots in the northern part of the study area coincide with large coalfields, coal-washing plants, power plants and major highways, pointing to coal mining, industrial emissions and traffic as dominant sources. In contrast, the enrichment of Cd and Zn in the central and northeastern agricultural belts reflects long-term inputs of phosphate fertilizers and organic manures in intensively cultivated maize and soybean fields. Localized As hotspots near mining–industrial clusters and in some long-term cultivated plots likely result from coal-related emissions and the legacy of As-containing pesticides. The relatively low metal levels and QI values in parts of Chifeng and Southern Tongliao are consistent with their land use history as low-input agricultural or grassland areas with fewer industrial facilities, indicating that the residual environmental capacity of black soils there remains comparatively high.
3.4. Sources of Heavy Metals in Agricultural Soils
3.4.1. Relevance Analysis
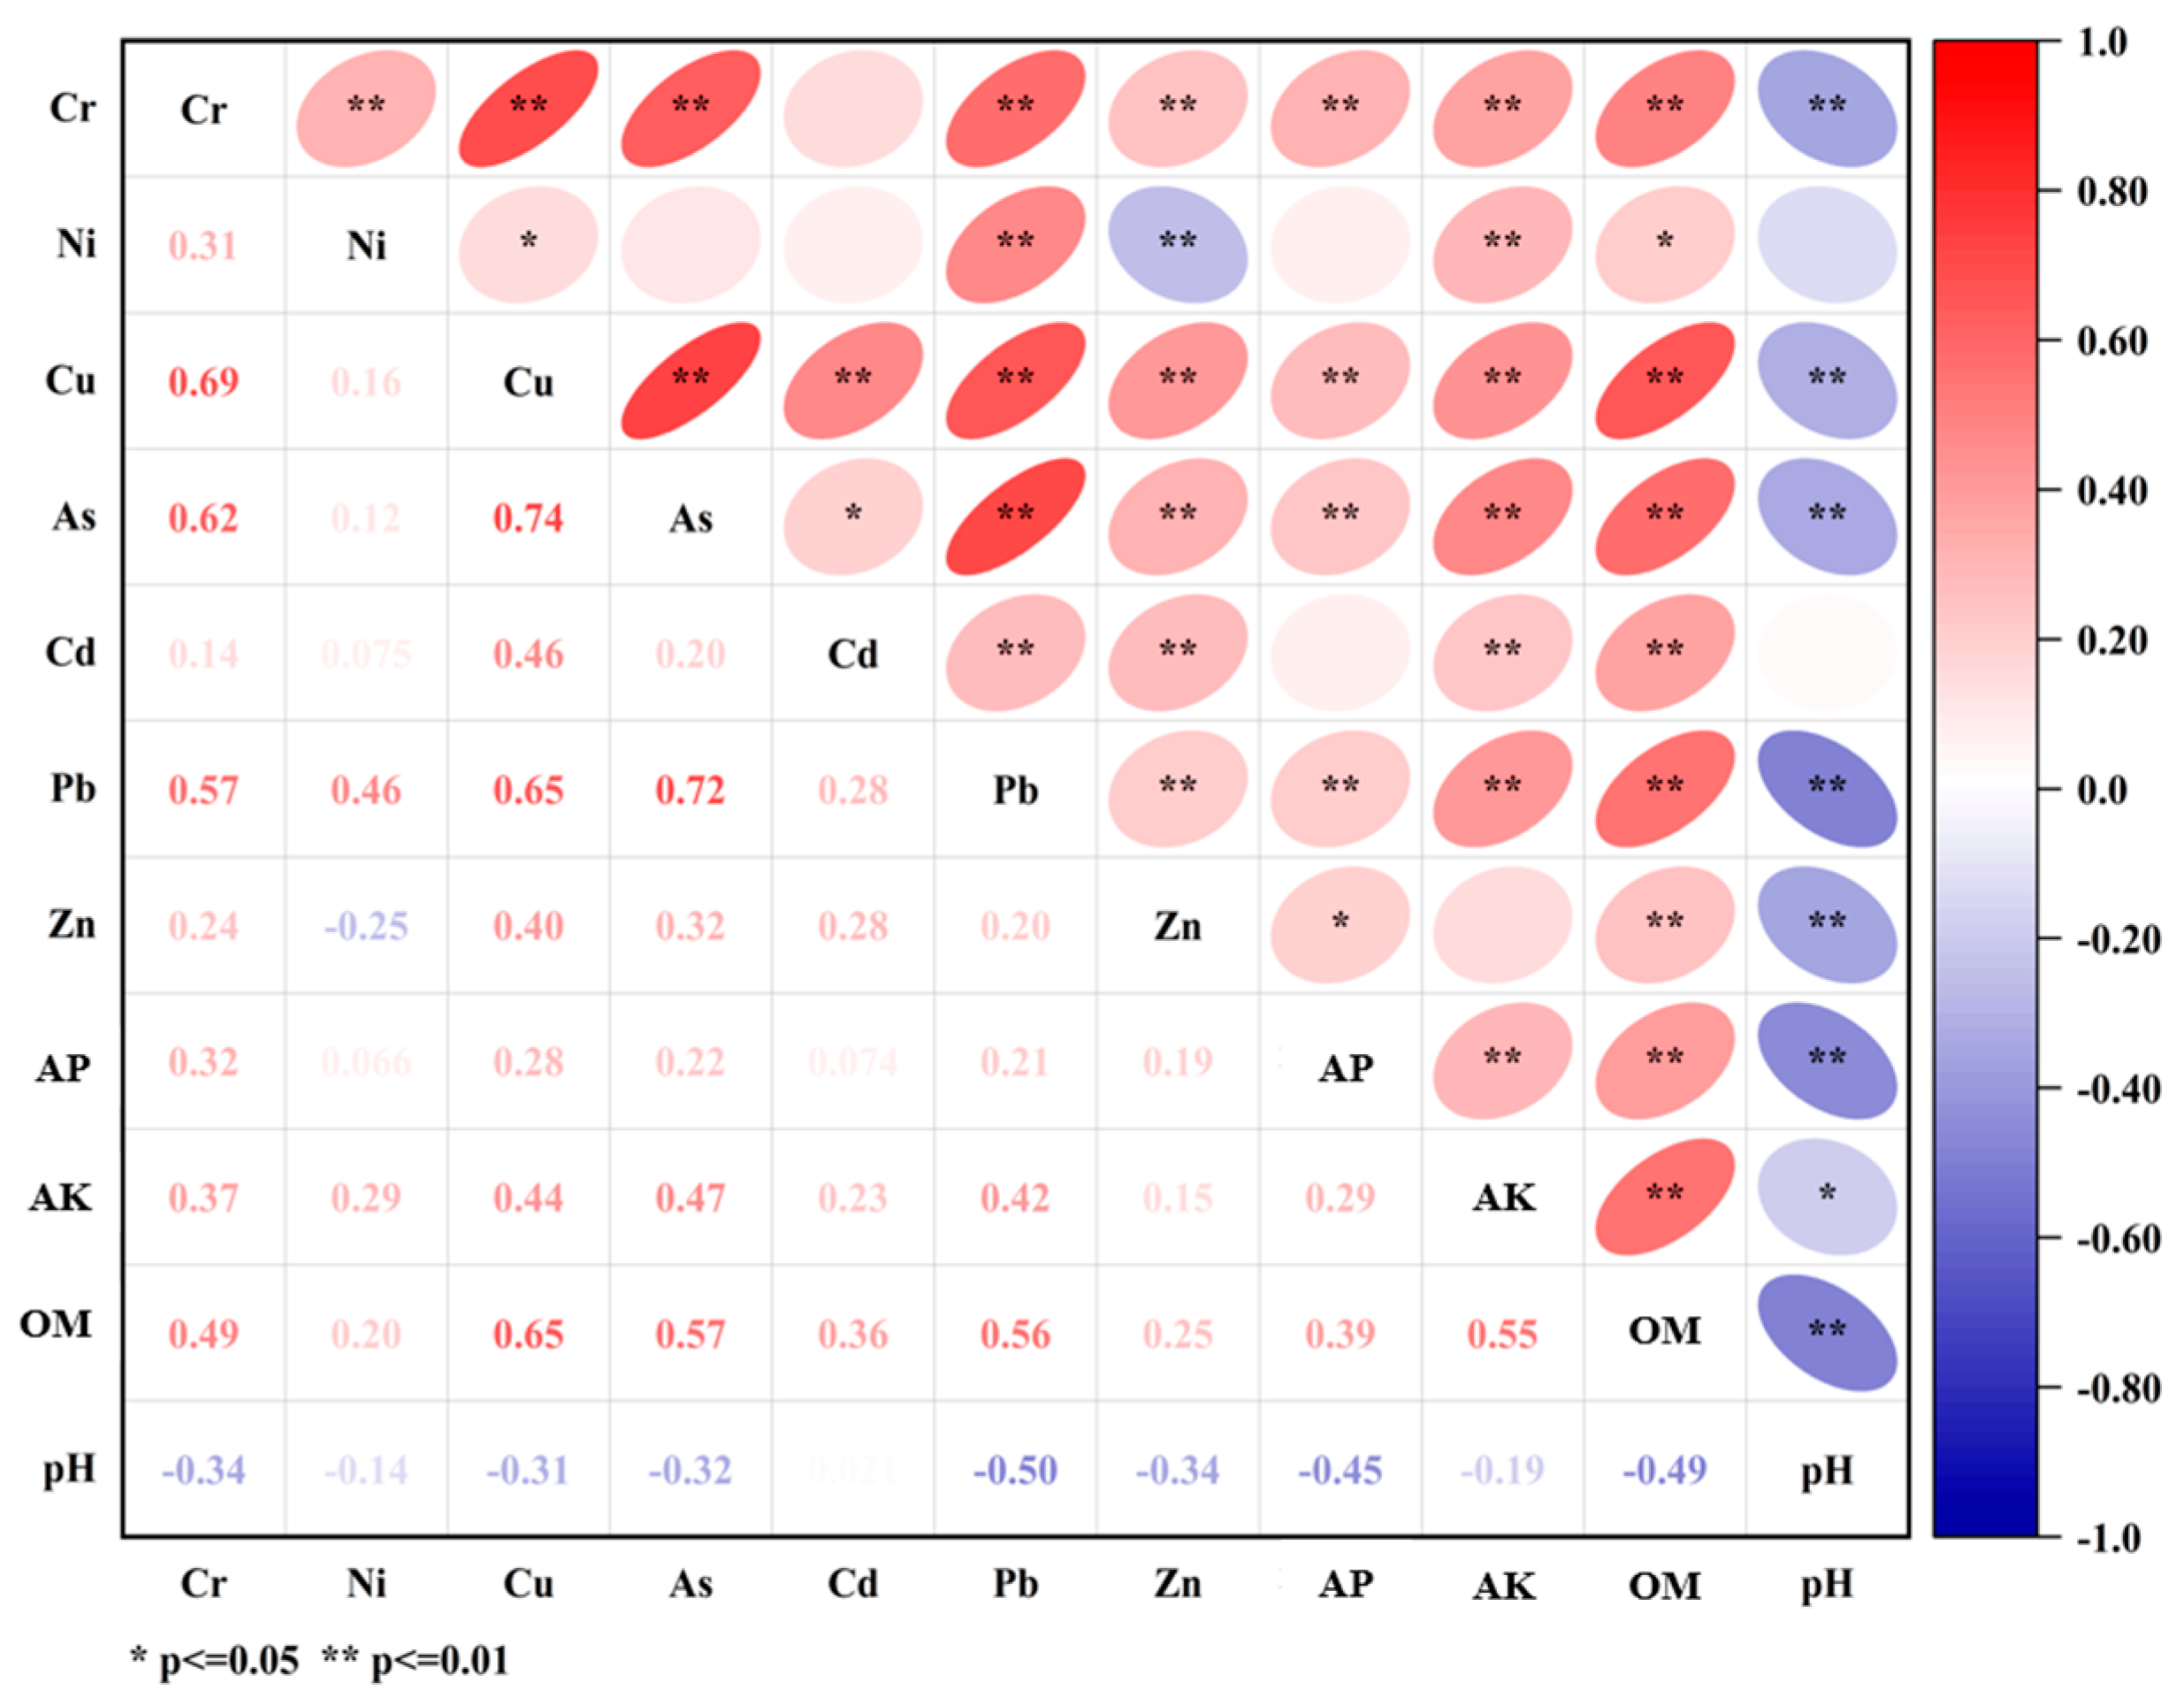
Pearson correlation analysis was conducted for the seven heavy metal elements, available phosphorus, available potassium, organic matter, and pH of the soil (
Figure 7). In the study area, Cu-As and As-Pb exhibited close relationships, with correlation coefficients exceeding 0.74 and 0.72, respectively. Additionally, Cr-Cu, Cu-Pb, Cr-As, Cr-Pb, and the combinations of organic matter with Cu, As, and Pb also showed strong correlations (r > 0.5). Heavy metals with significant positive correlations likely share the same sources [
40]. Elements with relatively weak correlations require further analysis using the PMF model.
3.4.2. Positive Matrix Factorisation Model (PMF)
PMF software for Inner Mongolia soils indicated that the signal-to-noise ratios of the seven heavy metal elements, and showed that the signal-to-noise ratios of the seven heavy metal elements were greater than 2, indicating high data accuracy. A factor number range of 3–5 was set for the operation, and 100 iterations with random starting points were performed for each factor number. When the factor number was 3, the QRobust value in the output results was similar to the QTheory value in the database, confirming that the number of pollution sources was appropriately chosen and the analysis results were reliable [
44].
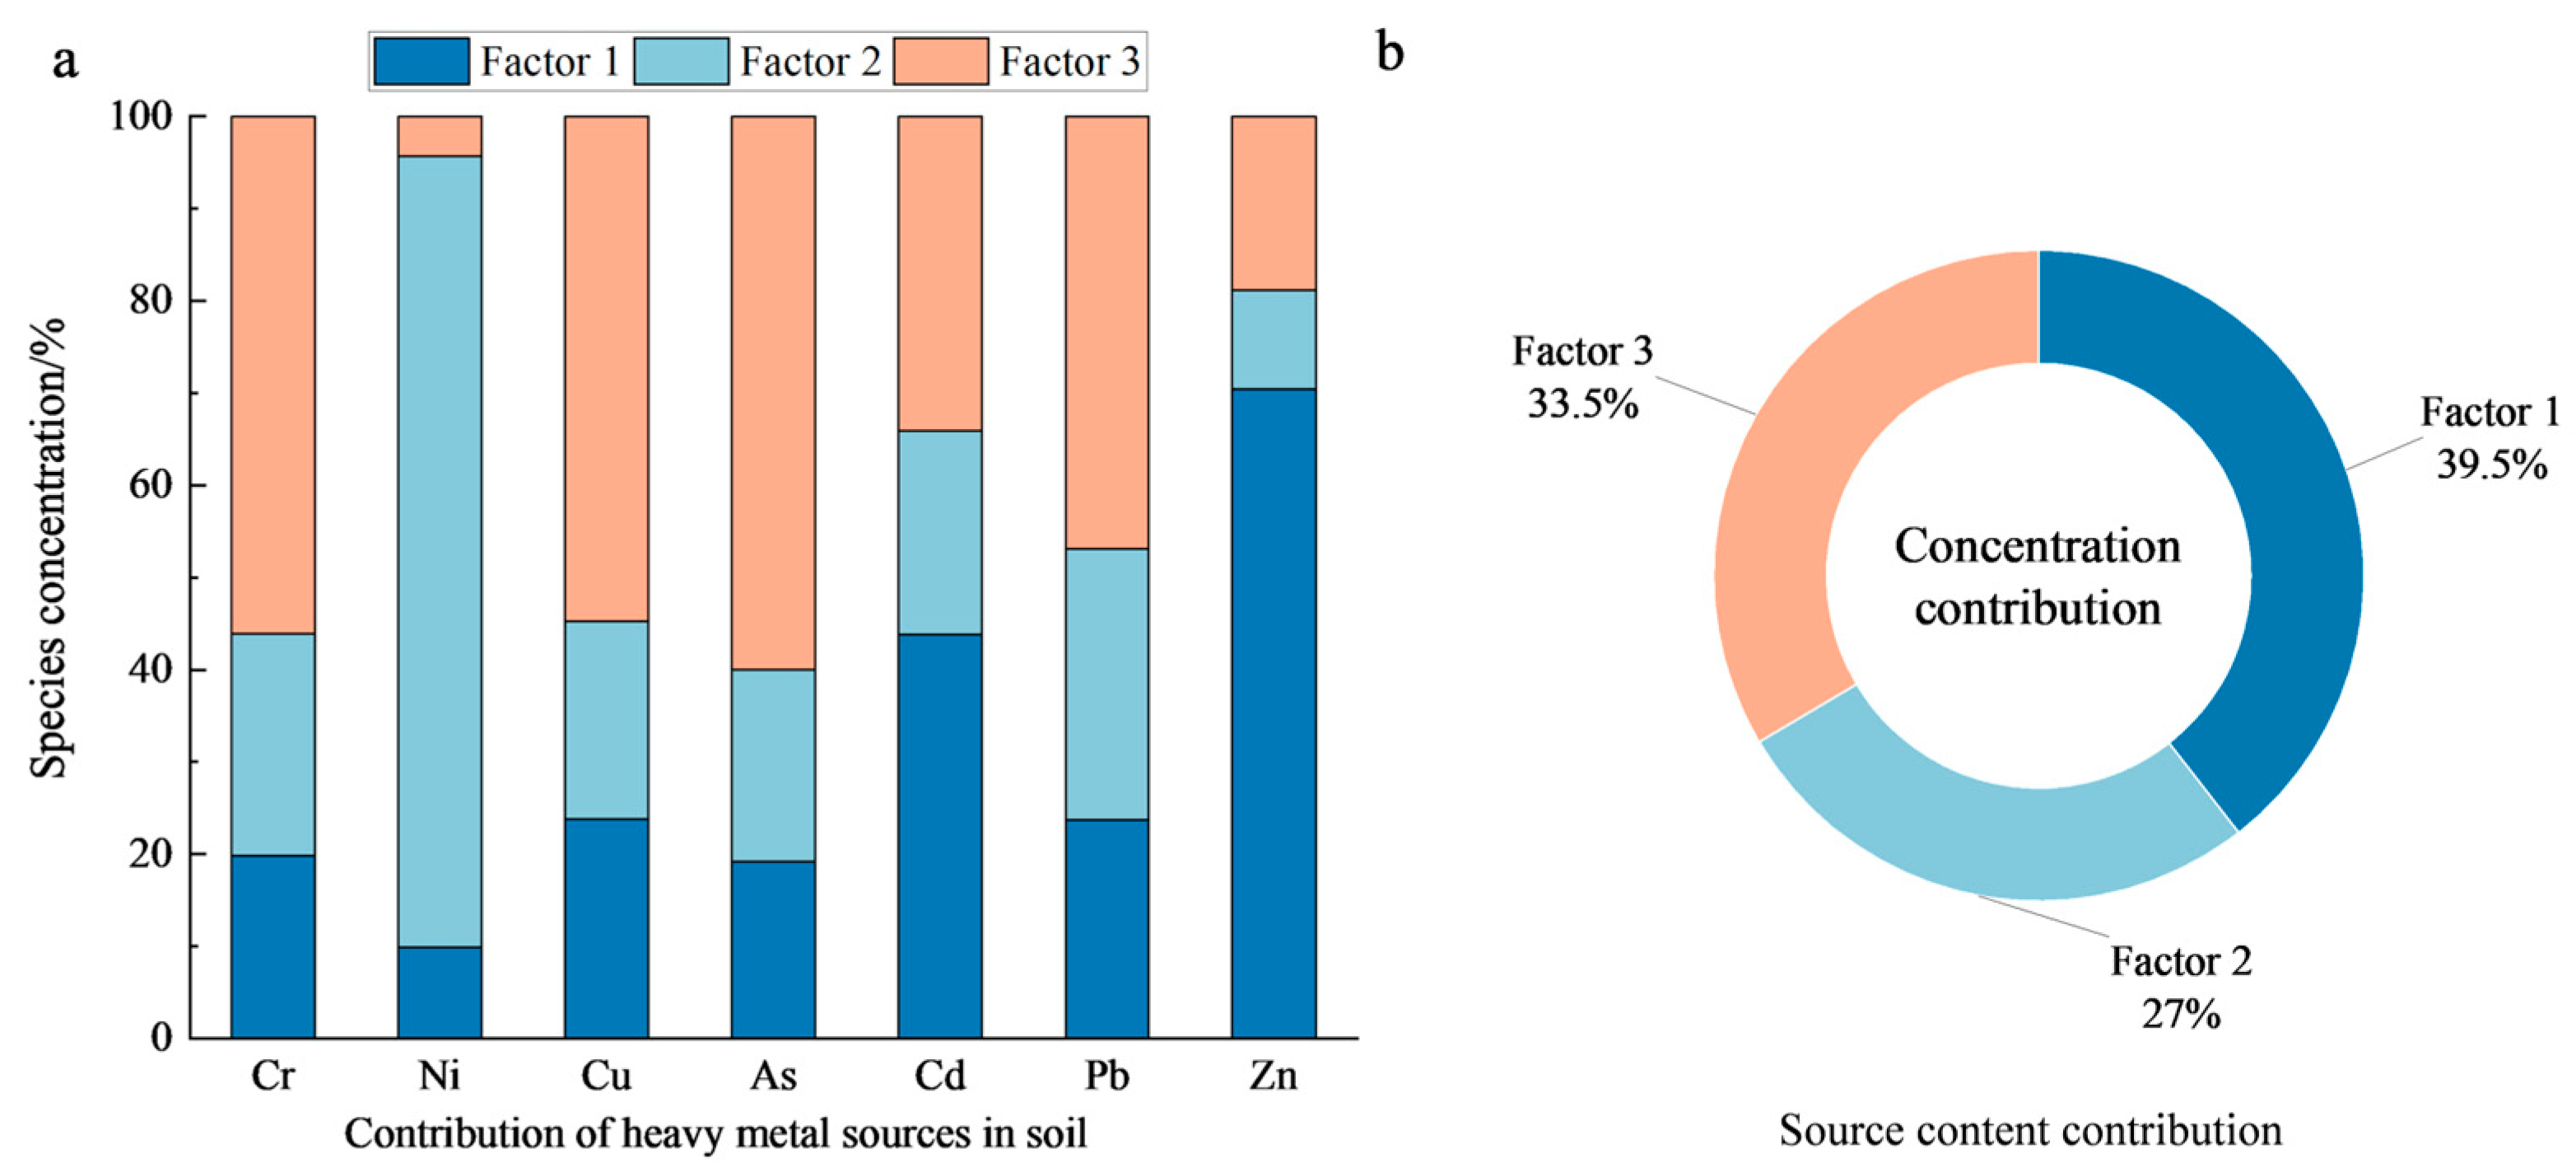
The main loading elements of factor 1 are Zn and Cd (
Figure 8), with contribution rates of 70.39% and 43.82%, respectively, which can be regarded as the signature elements of factor 1. The coefficients of variation for Cd and Zn are relatively high, with 70% of the Zn and 78% of the Cd points exceeding the background values of the soils, which suggests that the Zn and Cd in the soils are greatly influenced by human activities. Cd is concentrated in the northwestern and southwestern regions of the study area, which are rich in mineral resources, and activities related to industrial and mining industries may be the source of soil Cd contamination [
45]. Zn is often used as a hardness additive for automobile tyres, an antioxidant and lubricant detergent, and Zn-containing dusts are generated into the soil during agricultural activities and automobile driving [
46]. It has been shown that the elements Cd and Zn are widely used in agricultural production [
47]. Increased intensity of agrochemical use may be a major factor in the relative enrichment of soil Cd and Zn. Chemical fertilizers and pesticides often contain Cd [
48], especially phosphate fertilizers, which are rich in Cd [
49], and pesticides lead to the risk of Cu accumulation in soil [
50]. Therefore, Factor 1 may be derived from mixed agricultural practice-transport sources (39.46%).
The main loading elements in factor 2 were Ni (85.86%) and Pb (39.40%), which can be used as signature elements of factor 2. Unlike previous studies, the coefficient of variation in the Ni element was high and strongly differentiated, and 50% of the points of Ni exceeded the soil background value, indicating that Ni was significantly enriched in the study area and strongly influenced by human activities [
51]. It has been shown that Ni in the 10–20 cm soil layer is significantly affected by industrial activities [
52], and Ni is also one of the associated metals in rock coal mines [
53]. The high value areas of Ni are where large coal fields are located, which may be affected by the transport of coal field mining. Meanwhile, G10 and G31 provincial highways and expressways run through the study area, and vehicle emissions, tyre wear and leaded petrol can lead to a large amount of Pb entering the environment, resulting in the accumulation of elemental Pb in the soil. Therefore, factor 2 can be classified as a source of mineral-related activities (27.01%).
The main loading elements in factor 3 were As, Cr, and Cu, which were highly significantly correlated with CVs of 0.38, 0.46, and 0.6, respectively, and only Cu belonged to the strong divergent type. Its contribution was 59.98%, 56.15%, 54.76%, respectively, and the application of phosphorus and organic fertilizers also led to a certain degree of Cr enrichment [
54], and the compounds of Cu are the important components of pesticides, which generally enter into the soil with the spraying of pesticides, fertilizers, etc.; the accumulation of As in farmland soil has a direct link with the excessive application of chemical fertilizers and pesticides [
55]. Studies have shown that As, Cr, and Cu elements are relatively stable and are usually considered crustal elements, mainly from soil properties. Despite the existence of natural background levels, the enrichment of As, Cr, and Cu in the topsoil of our study area is more likely to reflect the influence of long-term and intensive anthropogenic agricultural activities, such as the application of pesticides and fertilizers. Based on this, Factor 3 can be assumed that factor 3 is based on pesticide and fertilizer-related agricultural practices (33.53%).
Overall, the spatial distribution of PMF factor scores is consistent with the geography of land use, mining–industrial belts and transportation corridors in the Eastern Inner Mongolia chernozem region. Factor 1 scores are elevated in the intensively cultivated central belt and along major national and provincial roads, where fertilizer and manure inputs and traffic intensity are higher. Factor 2 peaks in the northern mining–industrial belt, coinciding with the main coal mining cluster and associated industrial parks, where Ni and As concentrations in topsoil are consistently elevated. In contrast, Factor 3 dominates in long-term high-input maize and soybean cropland in the central and eastern parts of the study area, away from the main industrial centres but characterized by intensive use of phosphate fertilizers and organic manures. These qualitative spatial correspondences support the interpretation of Factors 1–3 as mixed agricultural–traffic sources, mineral-related sources and agrochemical (pesticide–fertilizer) sources, respectively.
3.5. Human Health Risk Assessment of Heavy Metals in Agricultural Soils
The human health risk assessment showed (
Table 8) that the mean non-carcinogenic risk (HI) for adults was ranked: As (3.43 × 10
−2) > Cr (1.38 × 10
−2) > Pb (2.41 × 10
−3) > Ni (8.54 × 10
−4) > Cu (2.43 × 10
−4) > Zn (1.64 × 10
−4) > Cd (5.16 × 10
−5). The mean HI values of the children were ranked: As (2.44 × 10
−1) > Cr (8.29 × 10
−2) > Pb (1.69 × 10
−2) > Ni (5.9 × 10
−3) > Cu (1.72 × 10
−3) > Zn (1.15 × 10
−3) > Cd (3.22 × 10
−4). The elements As, Cr and Pb pose a high risk to public health, and they are prioritized as non-carcinogenic risks [
56]. Between adults and children, the effects of heavy metals on CR were as follows: Ni > Cr >As > Pb> Cd. Ni contributed the most to CR compared to other elements. The mean CR values for both children and adults ranged from 1 × 10
−11 to 1 × 10
−5, indicating an acceptable range. Direct and inhalation ingestion posed a greater non-carcinogenic hazard to children than to adults; among the different pathways of carcinogenic risk, direct ingestion and dermal exposure were higher in children than in adults, and children were at a greater risk than adults.
A single individual heavy metal risk is not sufficient to represent the overall risk of heavy metals to human health [
57,
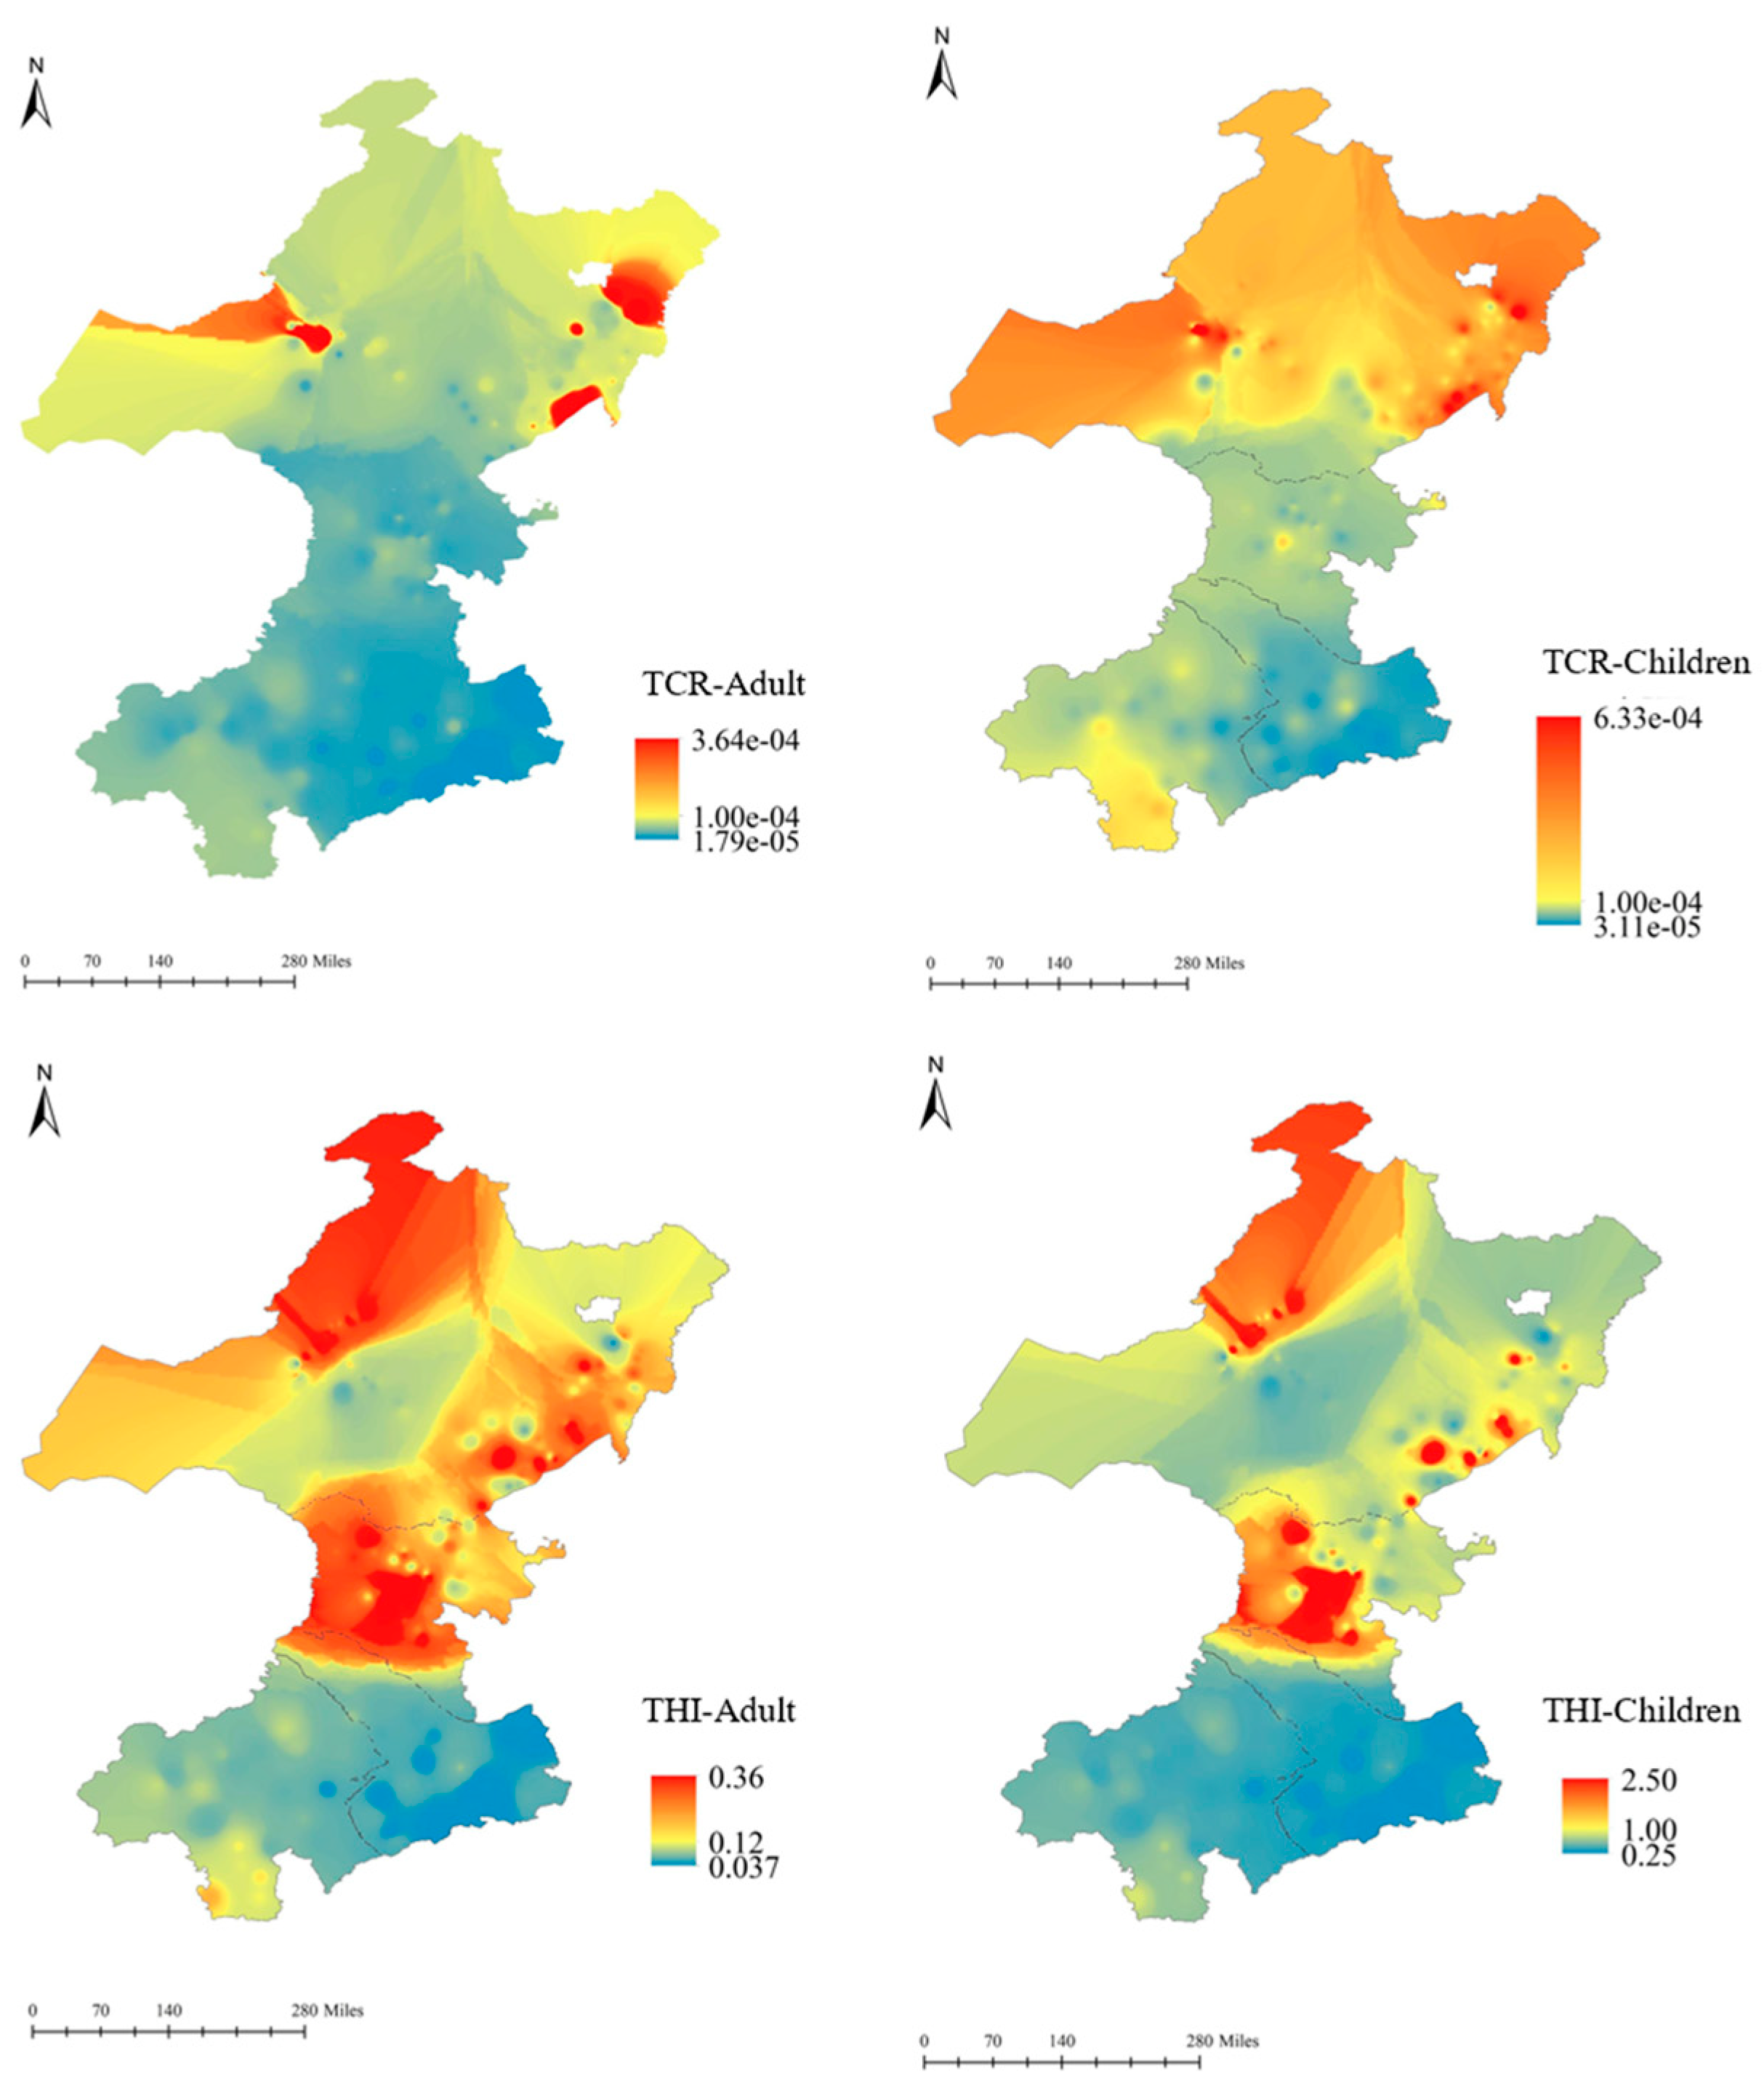
58]. The trends in the distribution of non-carcinogenic and carcinogenic risks were similar for adults and children (
Figure 9), with the distribution of high values concentrated in the north and south-west of the region, which is similar to the results of previous studies [
59]. Specifically, the total non-carcinogenic risk (THI) for adults in the study area was below 1, indicating that the risk was at an acceptable level in adults. The non-carcinogenic risk (THI) for children was higher than 1, mainly concentrated in the central and northern parts of the study area, indicating that heavy metals already pose a non-carcinogenic risk to children. This spatial pattern is consistent with the higher proportions of slightly and moderately polluted sites identified by QI and I
geo in Hulunbeier and the central–northern sub-regions (
Section 3.2), suggesting that the cumulative inputs of agrochemicals and emissions from nearby coal mining and transportation corridors may jointly elevate children’s exposure doses. In addition, children’s more frequent outdoor activities and hand-to-mouth behaviours in these rural settlements further amplify their intake of contaminated soil particles, which helps to explain why the non-carcinogenic risk is more prominent for children than for adults in the same areas. Overall, heavy metals may pose a greater health risk to children. For adults, the TCR data were below 1 × 10
−4 in most areas, compared to 15 sampling sites in the northern region, where the data were above 1 × 10
−4. For children, 46.58% of the areas had TCR data greater than 1 × 10
−4, suggesting that heavy metals may pose a stronger carcinogenic risk to children, mainly in the central and north-eastern parts of the study area. Children are likely to be at greater serious risk than adults. The main reason for this is that children have higher intake rates and lower body weights and are therefore exposed to higher doses than adults [
60], and additional precautions need to be provided to reduce children’s exposure to soil.
4. Conclusions
(1) The mean concentrations of Cr, Ni, Cu, As, Cd, Pb, and Zn in the study area were 61.77, 26.77, 17.07, 12.11, 0.08, 12.61, and 85.71 mg/kg, respectively. Compared with the screening values in GB 15618-2018 Soil Environmental Quality—Risk Control Standards for Soil Contamination of Agricultural Land, 6.21% of Ni samples exceeded the standard. According to the soil fertility grading criteria of the Second National Soil Census, soils in the study area were rich in available phosphorus, available potassium, and organic matter.
(2) The soil pollution evaluation of the sampling points using the land accumulation index method, potential ecological risk assessment and static environmental carrying capacity showed that Cr (55.15%), As (54.00%), Cd (42.94%), Ni (41.72%) and Zn (33.74%) were in the mildly contaminated condition; the static environmental carrying capacity indicated that Ni, As and Zn were the main elements causing pollution; the potential ecological pollution index of Cd, Ni and As was a mild ecological hazard, and As, Cd, Ni, Cr and Zn in the study area were at high risk of more serious pollution, reflecting the fact that the soil had been polluted to a certain extent.
(3) Pearson correlation analysis revealed strong inter-element relationships among the seven soil heavy metals. Source apportionment results indicated that the pollution sources in the study area consisted of agricultural practice–transportation mixed sources (39.46%), mineral-related activity sources (27.01%), and pesticide–fertilizer agricultural sources (33.53%).
(4) Human health risk assessment showed that children faced higher risks than adults. The total non-carcinogenic risk (THI) for children exceeded 1 in the central and northern study areas, indicating non-carcinogenic hazards. Among all sampling sites, 46.58% posed carcinogenic risks to children, with Ni identified as the primary carcinogenic element. Overall, the results revealed significant ecological and human health risks. In the future, it is essential to promote green agriculture to reduce the use of Cd-containing fertilizers and Zn-containing pesticides and strengthen environmental supervision of mining areas and surrounding soils, while promoting cleaner production techniques. It is recommended that local residents enhance their own protective measures.
From a production perspective, our findings support the following management recommendations: (i) optimizing fertilizer structure by reducing Cd- and Ni-rich phosphate fertilizers and promoting low-impurity products; (ii) strengthening the control of As- and Cu-containing pesticides and encouraging integrated pest management; (iii) implementing stricter emission and dust control around mining-industrial clusters and along major transportation corridors; and (iv) prioritizing soil and crop monitoring, as well as risk-based land use (e.g., limiting edible crops and favouring forage or industrial crops) in identified high-risk zones.
Author Contributions
L.X. contributed to the conceptualization, data curation, methodology, validation, writing—original draft, and writing—review and editing. Z.G. contributed to the conceptualization, data curation, methodology, validation, visualization, writing—original draft, and writing—review and editing. J.J. and G.S. contributed to the conceptualization, funding acquisition, supervision, and writing—reviewing and editing. All authors have read and agreed to the published version of the manuscript.
Funding
This research was supported by the Major Program of the National Natural Science Foundation of China (22494680, 22494682) to G.S.
Data Availability Statement
Data are available on request from the authors.
Conflicts of Interest
The authors declare that the research was conducted in the absence of any commercial or financial relationships that could be construed as potential conflicts of interest.
References
- Sow, A.Y.; Ismail, A.; Zulkifli, S.Z. Geofractionation of heavy metals and application of indices for pollution prediction in paddy field soil of Tumpat, Malaysia. Environ. Sci. Pollut. Res. 2013, 20, 8964–8973. [Google Scholar] [CrossRef] [PubMed]
- Mai, X.; Tang, J.; Tang, J.; Zhu, X.; Yang, Z.; Liu, X.; Zhuang, X.; Feng, G.; Tang, L. Research progress on the environmental risk assessment and remediation technologies of heavy metal pollution in agricultural soil. J. Environ. Sci. 2025, 149, 1–20. [Google Scholar] [CrossRef] [PubMed]
- Xie, T.; Hou, Y.; Chen, W.P.; Wang, M.E.; Lu, S.D.; Li, C.X. Progress in research on the impact of urbanisation on soil ecosystems. J. Ecol. 2019, 39, 1154–1164. [Google Scholar]
- Liu, H.; Pan, X.; Wei, W.; Huang, J.M.; Song, Y.; Zhao, G.H.; Wang, X.D. Characteristics, Potential Ecological Risks and Sources of Heavy Metal Pollution in Cultivated Soil in Anqing, Yangtze River Basin. Environ. Sci. 2025, 46, 3248–3260. [Google Scholar] [CrossRef]
- Chen, W.J. Research on challenges and countermeasures for the prevention and control of heavy metal pollution in Chinese agricultural soils. Environ. Dev. 2020, 32, 67–68. [Google Scholar] [CrossRef]
- Zerizghi, T.; Guo, Q.; Tian, L.; Wei, R.; Zhao, C. An integrated approach to quantify ecological and human health risks of soil heavy metal contamination around coal mining area. Sci. Total Environ. 2022, 814, 152653. [Google Scholar] [CrossRef]
- Xie, S.; Lan, T.; Xing, A.; Chen, C.; Meng, C.; Wang, S.; Xu, M.; Hong, M. Spatial distribution and ecological risk of heavy metals and their source apportionment in soils from a typical mining area, Inner Mongolia, China. J. Arid. Land 2023, 15, 1196–1215. [Google Scholar] [CrossRef]
- Tang, J.-L.; Zhao, K.; Hu, R.-X.; Xu, T.; Wang, Y.-X.; Yang, Y.; Zhou, B.-H. Characteristics, source analysis and pollution evaluation of heavy metal content in surface soil of Chuzhou City. Environ. Sci. 2023, 44, 3562–3572. [Google Scholar] [CrossRef]
- Xia, F.; Zhao, Z.; Niu, X.; Wang, Z. Integrated pollution analysis, pollution area identification and source apportionment of heavy metal contamination in agricultural soil. J. Hazard. Mater. 2024, 465, 133215. [Google Scholar] [CrossRef]
- Liu, H.; Qu, M.; Zhang, J.; Kang, J.; Zhao, Y.; Huang, B. Advances in soil pollutant source analysis techniques. Environ. Monit. Early Warn. 2021, 13, 1–6+19. [Google Scholar]
- Yu, D.; Wang, Y.; Ding, F.; Chen, X.; Wang, J. Comparison of source analysis methods for heavy metal contamination of soils in China in the last decade. Soil Bull. 2021, 52, 1000–1008. [Google Scholar] [CrossRef]
- Xu, H.; Wang, H.; Singh, B.P.; Croot, P.; Zhang, C. Identification of possible sources for potentially toxic elements and polycyclic aromatic hydrocarbons and their spatially varying relationships in urban soils of Dublin, Ireland. Environ. Pollut. 2023, 333, 122034. [Google Scholar] [CrossRef]
- Hua, Y.-P. Distribution Characteristics, Risk Assessment and Source Analysis of Pollutants on Regional Agricultural Land in Xuzhou. Master’s Thesis, China University of Mining and Technology, Xuzhou, China, 2022. [Google Scholar] [CrossRef]
- Muller, G. Index of Geoaccumulation in Sediments of the Rhine River. GeoJournal 1969, 2, 108–118. [Google Scholar]
- Hu, X.; Lei, C.; Wang, X.; Song, J.; Hu, X.; Xu, G. Evaluation of heavy metal contamination and potential ecological risk in soils of southern Dianjiang, Chongqing. Anhui Agric. Sci. 2023, 51, 64–67+76. [Google Scholar]
- Håkanson, L. An ecological risk index for aquatic pollution control. A sedimentological approach. Water Res. 1980, 14, 975–1001. [Google Scholar] [CrossRef]
- Xu, H.; Wang, S.; Li, S.; Chen, H.; Huang, L.; Fu, W.; Xie, S.; Liu, S.; Zhou, Y.; Wu, Z. Characteristics and sources of heavy metal contamination in agricultural soils of typical urban-rural combination zones in Guangdong. J. Environ. Sci. 2024, 44, 277–287. [Google Scholar] [CrossRef]
- Xu, B.; Xu, H.; Zhao, H.; Gao, J.; Liang, D.; Li, Y.; Wang, W.; Feng, Y.; Shi, G. Source apportionment of fine particulate matter at a megacity in China, using an improved regularization supervised PMF model. Sci. Total Environ. 2023, 879, 163198. [Google Scholar] [CrossRef]
- He, Y.; Wang, W.; Chen, Y.; Hua, J.; Deng, C.; Li, H. Source-sink response analysis of heavy metals and soil pollution assessment in non-ferrous metal industrial agglomeration areas based on decision unit. Sci. Total Environ. 2024, 906, 167437. [Google Scholar] [CrossRef]
- Chen, Z.; Hua, Y.; Xu, W.; Pei, J. Source analysis of heavy metal contamination in peri-urban farmland based on a positive definite matrix factor analysis model. Acta Sci. Circumstantiae 2020, 40, 276–283. [Google Scholar] [CrossRef]
- Taghavi, M.; Bakhshi, K.; Zarei, A.; Hoseinzadeh, E.; Gholizadeh, A. Soil pollution indices and health risk assessment of metal(loid)s in the agricultural soil of pistachio orchards. Sci. Rep. 2024, 14, 8971. [Google Scholar] [CrossRef]
- Yu, G.; Chen, F.; Zhang, H.; Wang, Z. Pollution and health risk assessment of heavy metals in soils of Guizhou, China. Ecosyst. Health Sustain. 2021, 7, 1859948. [Google Scholar] [CrossRef]
- Liu, Z. Research on Heavy Metal Pollution and Risk of Agricultural Soil in Key Industrial and Agricultural Areas of Hexi Region. Ph.D. Thesis, Lanzhou University, Lanzhou, China, 2023. [Google Scholar] [CrossRef]
- Liu, L.; Zhang, C.; Wang, Z.; Zhang, F.; Deng, W.; Dai, J. A study on the source analysis of heavy metals in agricultural soils and the spatial differentiation characteristics of health risks--Taking Duping Township, Wushan County, Chongqing Municipality as an Example. Southwest J. Agric. 2024, 37, 1099–1107. [Google Scholar] [CrossRef]
- Su, C.; Meng, J.; Zhou, Y.; Bi, R.; Chen, Z.; Diao, J.; Huang, Z.; Kan, Z.; Wang, T. Heavy Metals in Soils From Intense Industrial Areas in South China: Spatial Distribution, Source Apportionment, and Risk Assessment. Front. Environ. Sci. 2022, 10, 820536. [Google Scholar] [CrossRef]
- Zhao, X.; Li, Z.; Wang, D.; Tao, Y.; Qiao, F.; Lei, L.; Huang, J.; Ting, Z. Characteristics, source apportionment and health risk assessment of heavy metals exposure via household dust from six cities in China. Sci. Total Environ. 2021, 762, 143126. [Google Scholar] [CrossRef] [PubMed]
- Li, L.; Jin, Y.; Chen, Y.; Ma, Y.; Pu, G.; Shen, Y. Human Health Risk Assessment of Heavy Metals in Soil from Vegetable Orchards of Farmland in Jiaxing City. Guangzhou Chem. Ind. 2022, 50, 168–171. [Google Scholar]
- Yang, C.; Jiang, L.; Meng, C. Distribution characteristics and risk assessment of heavy metal content in arable soils in Pingba District, Guizhou Province. South China Agric. Sci. Technol. 2023, 44, 91–98. [Google Scholar]
- Zhang, L.-R.; Peng, X.-B.; Ma, Y.-L.; Kang, L.; Zhang, Y.-E.; Wang, Q.-L.; Zhang, S.-L. Risk assessment and attribution analysis of “five toxic” heavy metals in arable land in Lanzhou City. Environ. Sci. 2022, 43, 4767–4778. [Google Scholar] [CrossRef]
- Jia, Z. Characteristics, Source Analysis and Ecological Health Risk Assessment of Heavy Metal Pollution in Soil of Northwest Yu. Ph.D. Thesis, Southwest University, Chongqing, China, 2021. [Google Scholar] [CrossRef]
- HJ 25.3-2014; Technical Guidelines for Risk Assessment of Contaminated Sites. Ministry of Environmental Protection of the People’s Republic of China: Beijing, China, 2014. (In Chinese)
- US EPA. Soil Screening Guidance: Technical Background Document; Superfund; US EPA: Washington, DC, USA, 1996.
- Zhao, R.; Guan, Q.; Luo, H.; Lin, J.; Yang, L.; Wang, F.; Pan, N.; Yang, Y. Fuzzy synthetic evaluation and health risk assessment quantification of heavy metals in Zhangye agricultural soil from the perspective of sources. Sci. Total Environ. 2019, 697, 134126. [Google Scholar] [CrossRef]
- Luo, H.; Wang, Q.; Guan, Q.; Ma, Y.; Ni, F.; Yang, E.; Zhang, J. Heavy metal pollution levels, source apportionment and risk assessment in dust storms in key cities in Northwest China. J. Hazard. Mater. 2022, 422, 126878. [Google Scholar] [CrossRef]
- Wang, H.-Z.; Cai, L.-M.; Wang, Q.-S.; Hu, G.-C.; Chen, L.-G. A comprehensive exploration of risk assessment and source quantification of potentially toxic elements in road dust: A case study from a large Cu smelter in central China. Catena 2021, 196, 104930. [Google Scholar] [CrossRef]
- Chen, G.; Wang, X.; Wang, R.; Liu, G. Health risk assessment of potentially harmful elements in subsidence water bodies using a Monte Carlo approach: An example from the Huainan coal mining area, China. Ecotoxicol. Environ. Saf. 2019, 171, 737–745. [Google Scholar] [CrossRef] [PubMed]
- Wei, X.; Gao, B.; Wang, P.; Zhou, H.; Lu, J. Pollution characteristics and health risk assessment of heavy metals in street dusts from different functional areas in Beijing, China. Ecotoxicol. Environ. Saf. 2015, 112, 186–192. [Google Scholar] [CrossRef] [PubMed]
- Kamunda, C.; Mathuthu, M.; Madhuku, M. Health Risk Assessment of Heavy Metals in Soils from Witwatersrand Gold Mining Basin, South Africa. Int. J. Environ. Res. Public Health 2016, 13, 663. [Google Scholar] [CrossRef] [PubMed]
- Ren, Y.; Cao, W.G.; Xiao, S.Y.; Li, X.Z.; Pan, D.; Wang, S.H. Advances in the distribution, hazards and treatment technologies of heavy metals in soils. Geol. China 2024, 51, 118–142. [Google Scholar]
- Xie, L.; Pan, J.; Bai, H.; Zhang, P.; Kang, X.; Wang, F.; Zhu, Y. GIS-based spatial distribution and contamination evaluation of heavy metals in agricultural soils—An example from a township in Jiangning District, Nanjing, China. Soil Sci. J. 2020, 57, 316–325. [Google Scholar]
- Ning, C.; Wang, J.; Cai, K. Research progress on the effect of organic fertiliser on soil fertility and soil environmental quality. J. Ecol. Environ. 2016, 25, 175–181. [Google Scholar] [CrossRef]
- Zhao, J.; Cao, C.; Chen, X.; Zhang, W.; Ma, T.; Irfan, M.; Zheng, L. Source-specific ecological risk analysis and critical source identification of heavy metal(loid)s in the soil of typical abandoned coal mining area. Sci. Total Environ. 2024, 947, 174506. [Google Scholar] [CrossRef]
- Wu, C.; Huang, F.; Wei, L.; Yi, S.; Wu, Y.; Huang, Z.; Yi, M.; Li, F. Do the residual metals in multiple environmental media surrounding mines pose ecological and health risks? A case of an abandoned mining area in central south China. Environ. Res. 2024, 257, 119279. [Google Scholar] [CrossRef]
- Norris, G.; Duvall, R.; Brown, S.; Bai, S. EPA Positive Matrix Factorization (PMF) 5.0 Fundamentals and User Guide. 2014. Available online: https://cfpub.epa.gov/si/si_public_record_report.cfm?Lab=NERL&direntryid=308292 (accessed on 5 April 2024).
- Dong, T.-H.; Pan, S.-F.; Zhang, R.-J.; Jiang, L.-H.; Guo, Y.; Ji, X.-H.; Xie, Y.-H. Source analysis of heavy metal contamination in agricultural soils in stone coal mining area and surrounding regions based on APCS-MLR and PMF models. Environ. Sci. 2025, 46, 3209–3219. [Google Scholar] [CrossRef]
- Ai, J.; Wang, N.; Yang, J. Soil heavy metal source analysis in the Jipigou gold mining area based on the UNMIX model. Environ. Sci. 2014, 35, 3530–3536. [Google Scholar] [CrossRef]
- Liang, J.; Feng, C.; Zeng, G.; Gao, X.; Zhong, M.; Li, X.; Li, X.; He, X.; Fang, Y. Spatial distribution and source identification of heavy metals in surface soils in a typical coal mine city, Lianyuan, China. Environ. Pollut. 2017, 225, 681–690. [Google Scholar] [CrossRef]
- Zeng, Q.; Fu, T.; Zou, H.; Teng, L.; Wu, K.; Xie, T.; He, T. Characteristics of spatial distribution and source analysis of soil heavy metals in chilli cultivation area in a county of Guizhou Province. J. Agric. Environ. Sci. 2021, 40, 102–113. [Google Scholar] [CrossRef]
- Wang, Y.; Duan, X.; Wang, L. Spatial distribution and source analysis of heavy metals in soils influenced by industrial enterprise distribution: Case study in Jiangsu Province. Sci. Total Environ. 2020, 710, 134953. [Google Scholar] [CrossRef] [PubMed]
- Xia, Z.-S.; Bai, Y.-R.; Wang, Y.-Q.; Gao, X.-L.; Ruan, X.-H.; Zhong, Y.-X. Spatial distribution and source analysis of soil heavy metals in small watersheds of the Ningnan mountainous area based on PMF model. Environ. Sci. 2022, 43, 432–441. [Google Scholar] [CrossRef]
- Liu, Y.; Shen, W.; Fan, K.; Pei, W.; Liu, S. Spatial Distribution, Source Analysis, and Health Risk Assessment of Heavy Metals in the Farmland of Tangwang Village, Huainan City, China. Agronomy 2024, 14, 394. [Google Scholar] [CrossRef]
- Zhu, S.; Li, S.-Y.; Yu, Y.; Zhu, Y.-J.; Qiao, J.-B.; Shao, M.-A. Spatial distribution, influencing factors, risk evaluation and source analysis of heavy metals in farmland soil profiles in the Guanzhong Plain. Environ. Sci. 2025, 46, 2501–2511. [Google Scholar] [CrossRef]
- Dai, X.; Shen, Z.; Hu, H.; Shi, H.; He, Z.; Li, Q.; Liu, A. Evaluation of heavy metal contamination and source analysis of sediments in a stone coal mining area downstream of Zishui. J. Agric. Environ. Sci. 2024, 43, 1123–1130. [Google Scholar]
- Dong, L.; Hu, W.; Huang, B.; Liu, G.; Qu, M.; Kwong, W.-H. Heavy metal source analysis of soil heavy metals in peri-urban farmland based on the positive-definite matrix factor analytical model. Chin. Environ. Sci. 2015, 35, 2103–2111. [Google Scholar]
- Yang, J.-Z.; Gong, J.-J.; Wang, Z.-L.; Gao, J.-W.; Yang, J.-K.; Hu, S.-Q.; Tang, S.-X. Enrichment factors, health risks and source identification of heavy metals in soils from agricultural land in semi-arid areas of Hainan Island. Environ. Sci. 2022, 43, 4590–4600. [Google Scholar] [CrossRef]
- Chen, H.; Teng, Y.; Lu, S.; Wang, Y.; Wang, J. Contamination features and health risk of soil heavy metals in China. Sci. Total Environ. 2015, 512–513, 143–153. [Google Scholar] [CrossRef]
- Song, T.; Tong, S.; An, Y. Bioconcentrations and health risk assessment of heavy metals in paddy fields—A case study in Naoli River Basin, Sanjiang Plain, China. Arab. J. Geosci. 2021, 14, 1988. [Google Scholar] [CrossRef]
- Omar, N.; Praveena, S.; Aris, A.; Hashim, Z. Health Risk Assessment using in vitro digestion model in assessing bioavailability of heavy metal in rice: A preliminary study. Food Chem. 2015, 188, 46–50. [Google Scholar] [CrossRef]
- Jiang, H.-H.; Cai, L.-M.; Wen, H.-H.; Hu, G.-C.; Chen, L.-G.; Luo, J. An integrated approach to quantifying ecological and human health risks from different sources of soil heavy metals. Sci. Total Environ. 2020, 701, 134466. [Google Scholar] [CrossRef]
- Men, C.; Liu, R.; Xu, F.; Wang, Q.; Guo, L.; Shen, Z. Pollution characteristics, risk assessment, and source apportionment of heavy metals in road dust in Beijing, China. Sci. Total Environ. 2018, 612, 138–147. [Google Scholar] [CrossRef]
| Disclaimer/Publisher’s Note: The statements, opinions and data contained in all publications are solely those of the individual author(s) and contributor(s) and not of MDPI and/or the editor(s). MDPI and/or the editor(s) disclaim responsibility for any injury to people or property resulting from any ideas, methods, instructions or products referred to in the content. |
© 2025 by the authors. Licensee MDPI, Basel, Switzerland. This article is an open access article distributed under the terms and conditions of the Creative Commons Attribution (CC BY) license (https://creativecommons.org/licenses/by/4.0/).
