Article

Novel Resistance Determinants from Cucumber PI 197085 Against Pseudoperonospora cubensis

by
Wojciech Szczechura
1,
Urszula Kłosińska
1,
Marzena Nowakowska
1,*,
Katarzyna Nowak
1,
Marcin Nowicki
2,
Elżbieta U. Kozik
1 and
Mirosław Tyrka
3,*
1
Department of Genetics, Breeding, and Biotechnology of Vegetable Crops, The National Institute of Horticulture Research, 96-100 Skierniewice, Poland
2
Department of Entomology and Plant Pathology, Institute of Agriculture, University of Tennessee, Knoxville, TN 37996, USA
3
Department of Biotechnology and Bioinformatics, Rzeszow University of Technology, 35-959 Rzeszów, Poland
*
Authors to whom correspondence should be addressed.
Agronomy 2025, 15(11), 2633; https://doi.org/10.3390/agronomy15112633
Submission received: 20 October 2025 / Revised: 10 November 2025 / Accepted: 13 November 2025 / Published: 17 November 2025

Abstract

Downy mildew, caused by Pseudoperonospora cubensis, remains a major constraint to cucumber (Cucumis sativus L.) production worldwide. The erosion of resistance conferred by the historic dm-1 gene has heightened the quest for new and enduring sources of resistance. PI 197085, a resistant accession identified under Central European field conditions, remains largely genetically unexplored. In this study, an evenly saturated genetic linkage map was developed using an F2 population derived from PI 197085 × PI 175695, which comprised 164 polymorphic markers spanning all seven chromosomes. Composite interval mapping revealed five quantitative trait loci (QTLs) linked to resistance against P. cubensis, distributed across chromosomes 2, 3, 4, and 5. Candidate gene analysis within the QTL intervals identified clusters of receptor-like kinases, transcription factors, and redox-related enzymes, suggesting that resistance in PI 197085 is polygenic and regulator-rich. The improved resolution of the linkage map enabled more precise localization of resistance loci and uncovered novel genomic regions that were not previously detected in this population. These findings provide a foundation for marker-assisted selection and fine-mapping efforts aimed at developing cucumber cultivars with the robust and durable resistance to P. cubensis.

1. Introduction

Downy mildew is one of the most destructive foliar diseases that affect cucurbit crops worldwide. It is caused by Pseudoperonospora cubensis (Berk. & Curt.) Rostovzev (PC), an obligate biotrophic oomycete from the family Peronosporaceae, which infects a broad range of cucurbit species across more than 20 genera [1,2,3,4]. The pathogen’s high adaptive capacity and resilience to adverse environmental conditions contribute to recurring epidemics, particularly in regions favorable for cucurbit cultivation [3,5,6,7]. In cucumber (Cucumis sativus L.), yield losses can be substantial, especially under warm and humid conditions conducive to infection and pathogen spread [1,5,6]. Long-distance dispersal of sporangia further facilitates outbreaks over a wide geographic area [2,7,8,9]. PC is heterothallic, with two mating types (A1 and A2) capable of forming oospores through sexual recombination, thus enhancing its evolutionary potential [10,11,12,13]. Genetic studies have revealed the existence of at least two major host-adapted pathogen clades that differ in virulence spectrum and host preferences, which likely contributes to the emergence of novel, resistance-breaking populations [5,6,13,14,15,16].
Although fungicides remain widely used to manage PC, their effectiveness is increasingly constrained by the emergence of fungicide-resistant strains, environmental concerns, and regulatory restrictions [7,17]. Therefore, breeding resistant cultivars has become a critical strategy for sustainable and environmentally sound control of this pathogen [5,17,18,19,20]. Importantly, the remarkable evolutionary plasticity of PC, including the emergence of new races and resistance-breaking lineages, has repeatedly eroded the effectiveness of previously resistant cucumber cultivars, which underscore the need for the continuous identification and characterization of resistance genes.
Accordingly, the genetic basis of PC resistance in cucumber has been the subject of extensive research over the past several decades [17,21,22,23,24,25,26,27,28,29,30,31,32,33,34,35,36,37,38,39,40,41,42,43,44,45,46]. As early as 1942, resistant cucumber lines were developed, with resistance in many accessions attributed to the recessive gene dm-1, which was originally derived from PI 197087 [39,40]. Introgression of this gene enabled the release of resistant cultivars such as ‘Gy4’, ‘Chipper’, and the Marketmore series [42,47]. Subsequent studies showed that dm-1 represents a mutant allele of the Staygreen (Sgr) gene located on chromosome 5 [29]. For nearly five decades, dm-1 conferred highly effective resistance, until it was overcome in 2004 by new virulent PC strains [16,48]. The breakdown of dm-1-conferred resistance underscored the urgent need for novel and durable resistance sources.
To identify effective resistance genes, a coordinated screening program was conducted between 2005 and 2007 in Clinton, NC (USA) and Skierniewice (Poland), within the collaborative initiative of the USDA Agricultural Research Service, North Carolina State University, and the Research Institute of Vegetable Crops in Skierniewice [19]. A total of 1295 cucumber cultigens, including Plant Introduction accessions, breeding lines, and elite cultivars, were evaluated for PC resistance under field conditions. Across all environments and years, three Sikkim-type cucumber accessions (PI 605996, PI 197088, and PI 330628) consistently showed the highest resistance [19]. In addition to these globally confirmed resistant accessions, screenings conducted in Poland highlighted PI 197085, PI 197086, ‘Ames 2353’, and ‘Ames 2354’ as valuable resistance sources under Central European conditions. Altogether, six accessions (PI 197088, PI 330628, PI 197085, PI 197086, ‘Ames 2353’, ‘Ames 2354’) exhibited higher levels of PC resistance than previously known in Poland [17,41].
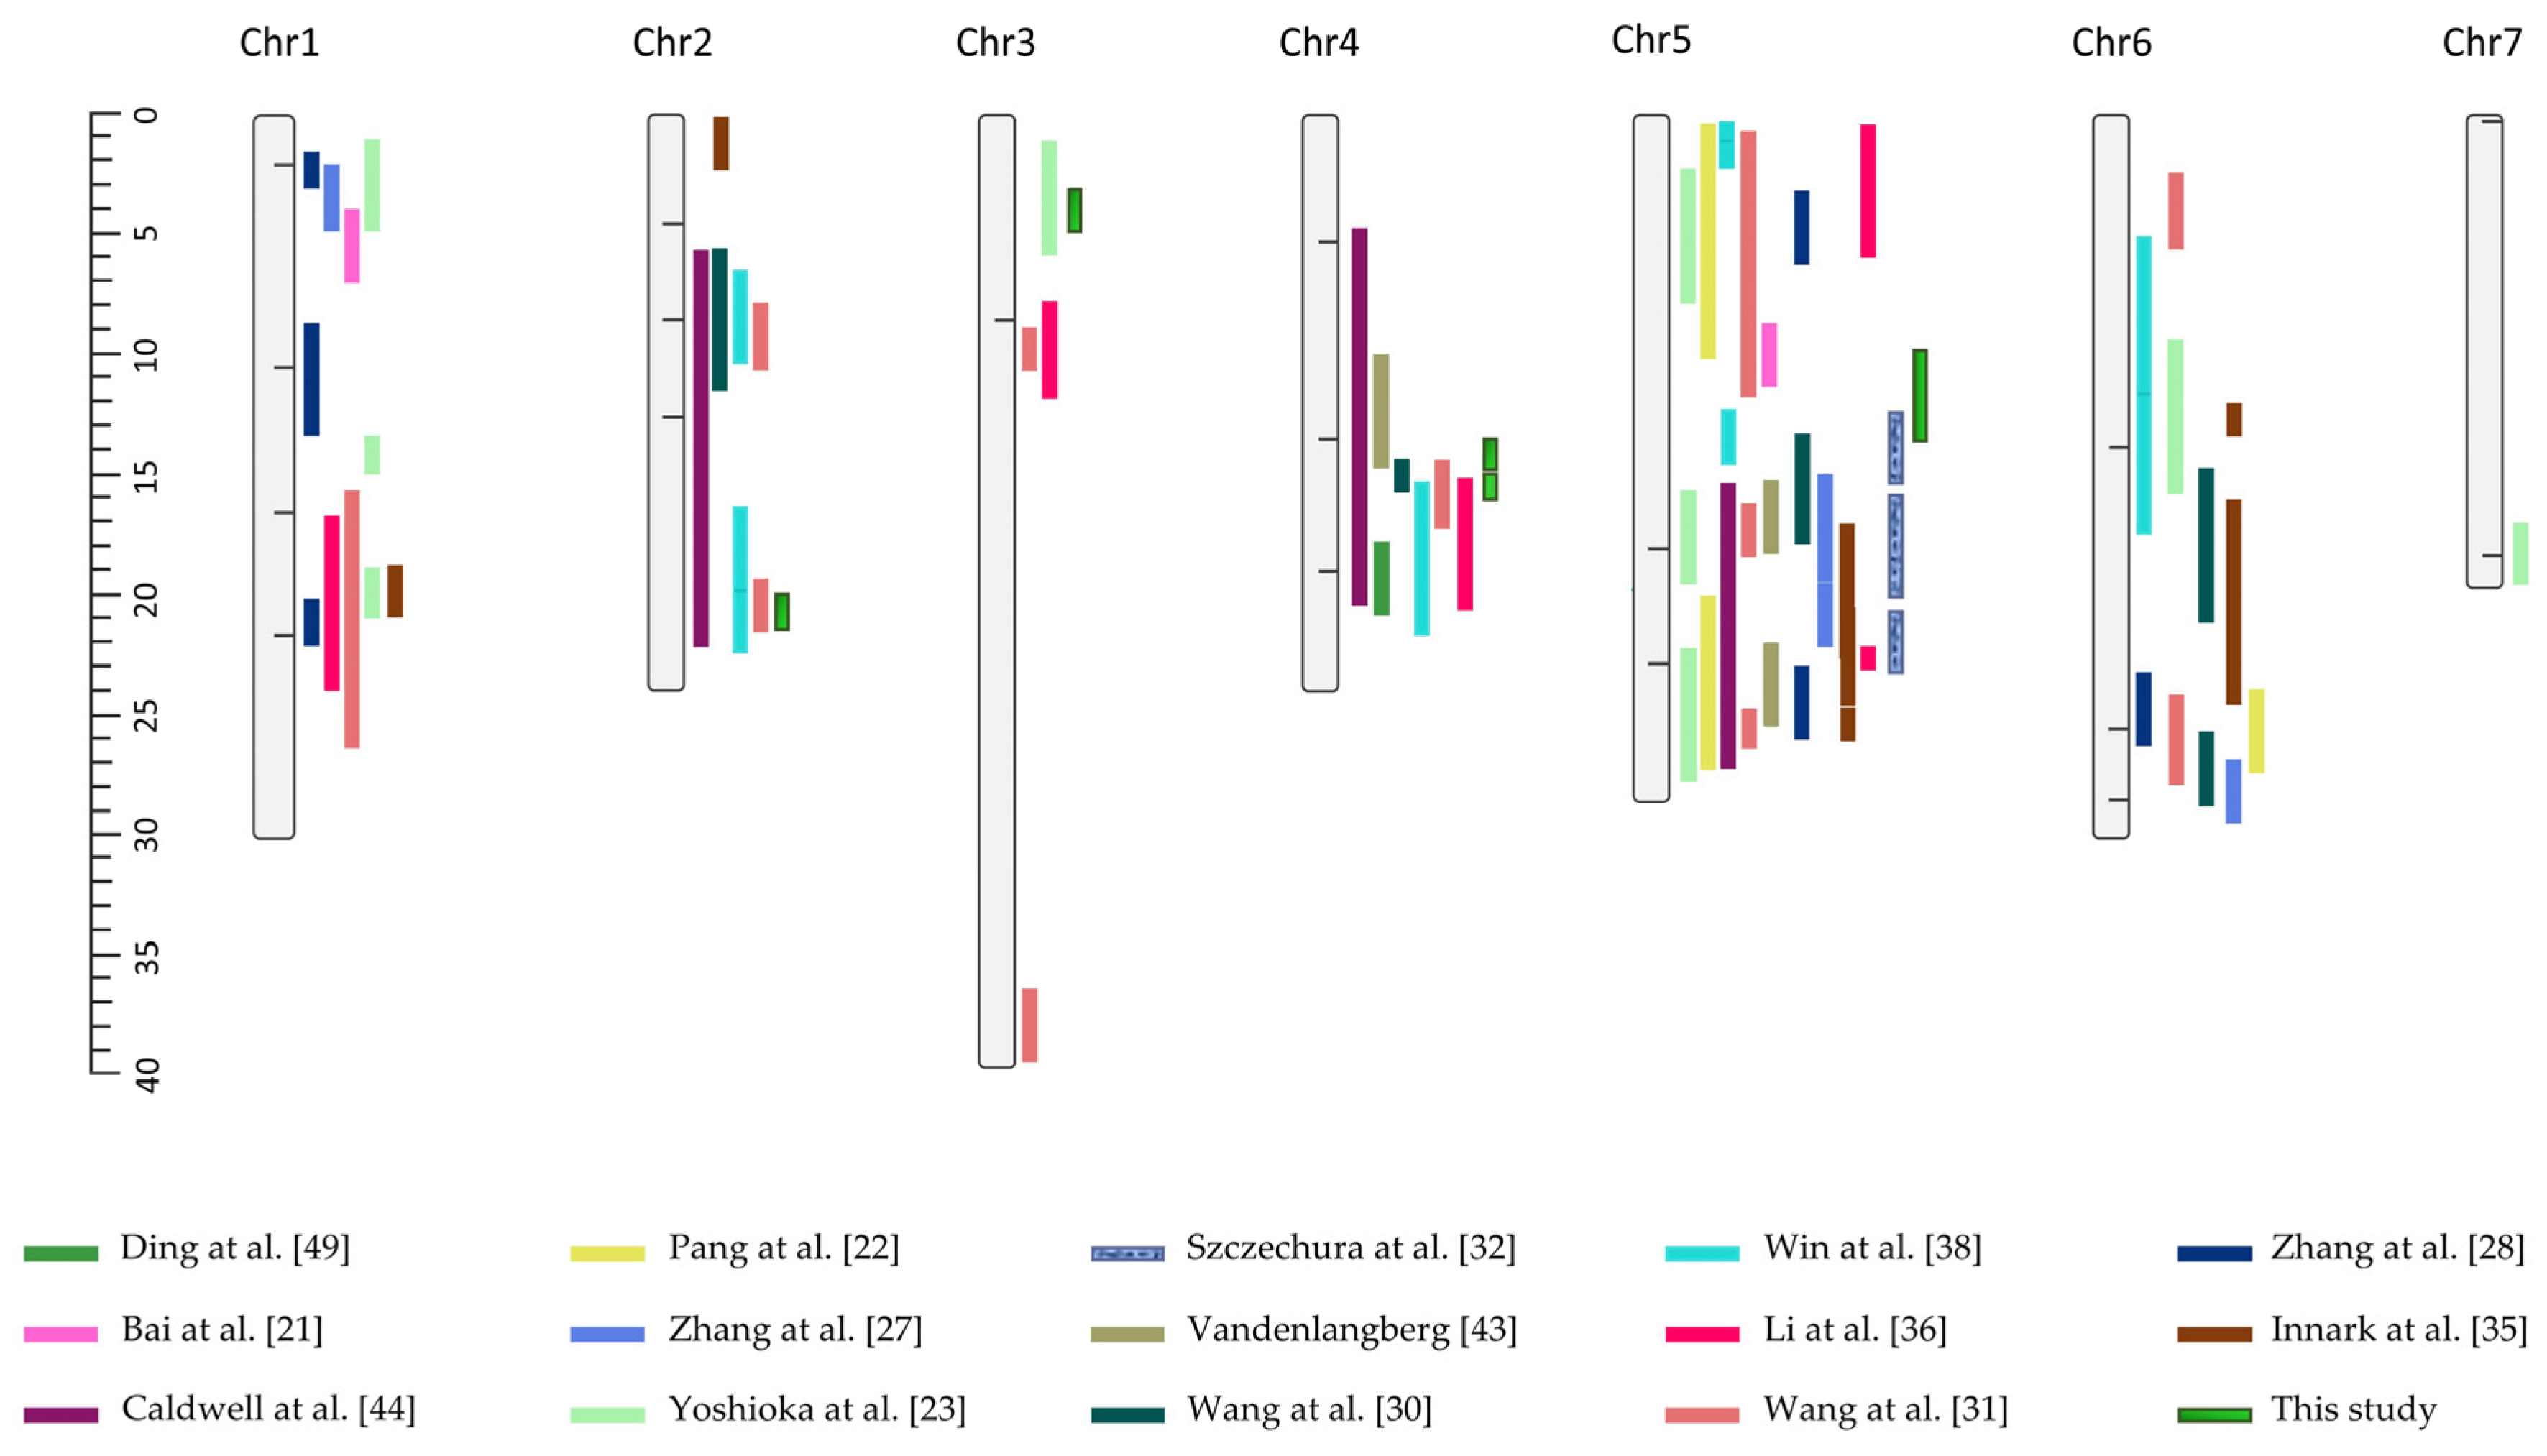
Subsequent mapping studies have corroborated that cucumber PC resistance is polygenic, with multiple quantitative trait loci (QTLs) identified across diverse C. sativus germplasm sources, including PI 197088, PI 330628, K8, IL52, and TH118FLM, among others [17,21,22,23,27,28,30,31,32,35,36,38,43,44,49] (Figure 1). The number, chromosomal positions, and effect sizes of these loci exhibited considerable variation among studies, likely because of differences in the genetic background, pathogen isolates, developmental stage analyzed (seedlings vs. adult plants), environmental conditions, and criteria applied for disease evaluation [35,43,50,51]. In addition to biparental mapping, a genome-wide association study of 97 cucumber lines further underscored the polygenic nature of resistance, because of the identification of 18 loci distributed across nearly all chromosomes, of which six were consistently detected across environments [37]. Collectively, these investigations converge on the conclusion that PC resistance in cucumber is governed by a complex, environmentally dependent genetic architecture, thereby underscoring the necessity for further genetic characterization across diverse germplasm.
Among the resistant accessions identified, PI 197085 stands out as a promising yet underexplored source of PC resistance. Early mapping efforts in the PI 197085 (Resistant, R) × PI 175695 (Susceptible, S) F2 population resulted in preliminary mapping of three putative QTLs on chromosome 5 [32]. However, the low density of DNA markers limited both the resolution and the utility of this map for breeding applications. Notably, field trials conducted over multiple years confirmed the high and stable resistance of PI 197085 in Poland, thus indicating that this accession may harbor unique alleles for marker-assisted selection.
Building on these observations, the objective of this study was to refine the genetic characterization of PI 197085. A higher-resolution linkage map of the PI 197085 × PI 175695 F2 population evenly covered with DNA markers was constructed and the QTLs for PC resistance were reanalyzed. We hypothesized that the increased resolution of the genetic linkage map would enable more precise identification of existing resistance loci, reveal QTLs that have not been resolved in previous studies, and clarify whether PI 197085 shares resistance regions with other well-characterized germplasms.

2. Materials and Methods

2.1. Plant Material

Two cucumber accessions were used as parents: the resistant PI 197085 (origin: Assam, India) and the susceptible PI 175695 (origin: Kayseri, Turkey), both sourced from the North Central Regional Plant Introduction Station (Ames, IA, USA). These accessions were selected based on their contrasting levels of PC resistance as previously documented [19,41]. An F2 population was developed from a cross between PI 197085 (R) and PI 175695 (S), as previously described [32]. The present study was carried out on the same mapping population, but a new set of 115 F2 plants was analyzed, a sample size comparable to our earlier work to facilitate direct comparison between studies. In contrast to the previous study, the density of DNA markers was markedly increased, which improved the resolution of the linkage map and allowed for refined QTL analysis of PC resistance.

2.2. Field Evaluation of PI 197085 Resistance

To evaluate PI 197085, a comparative analysis with two resistant accessions (Ames 2354 and PI 197088) and a susceptible control (PI 175695) was conducted in multiyear field trials at the National Institute of Horticultural Research (NIHR, Skierniewice, Poland). Trials were conducted over four growing seasons (2021–2024) under natural infection and standard agronomic practices with no fungicides. The experiment followed a randomized complete block design with three replicates per year, and each plot contained 30 plants of a single accession. Each year, seeds were sown in the second decade of July in single-row plots, 5 m in length and spaced 1 m apart. Prior to sowing, basic mineral fertilization was applied and adjusted according to the results of soil analysis. Drip irrigation was used as required. Disease symptom severity was determined based on the percentage of infected leaf area per plant. The following disease classes, developed by Jenkins and Wehner [53], were used, with minor modifications: (0 = 0; 1 = 0.1–8; 2 = 8.1–15; 3 = 15.1–25; 4 = 25.1–35; 5 = 35.1–45; 6 = 45.1–65; 7 = 65.1–80; 8 = 81.1–90; 9 = >90% of the infected leaf area per plant) at the seasonal peak of the symptoms. For the analysis, the mean disease severity index (DSI) was determined by calculating the average of three replicate plot ratings. For descriptive summaries, means ± standard error (SE) were reported for each accession in each year. Data visualization was performed using R (v.4.3.3) [54], and the ggplot2 package (v.4.0.0) [55].

2.3. Phenotypic Evaluation of the F2 Mapping Population Under Controlled Inoculation

PC resistance was evaluated under controlled phytotron conditions following the inoculation and scoring procedures detailed by Szczechura et al. [32]. The pathogen inoculum originated from local PC isolates collected from naturally infected leaves of the susceptible cucumber genotypes PI 175695 and ‘Coolgreen’ grown in the experimental field of NIHR (Skierniewice, Poland). Briefly, plants at the two-to three-leaf stage were inoculated with a sporangial suspension (5 × 10⁴ sporangia mL−1) and incubated under high-humidity conditions (90–95% relative humidity) conducive to infection. Ten days post-inoculation, when the susceptible line PI 175695 exhibited the highest susceptibility (classes 8 and 9), disease symptoms were scored using a 0–9 scale (see Section 2.2) [53]. The DSI was calculated independently for both the parental accessions and the F2 mapping population [32]. Data visualization was performed in R (v.4.3.3) [54] using the packages ggplot2 (v.4.0.0) [55], ggbeeswarm (v.0.7.2) [56], and cowplot (1.2.0) [57]. Based on the degree of infection expressed on a rating scale from 0 to 9, plants from classes 0–2 were classified as resistant, those from classes 3–4 as intermediately resistant, those from classes 5–6 as intermediately susceptible, and those from classes 7–9 as susceptible.

2.4. DNA Marker Analysis and Linkage Map Construction

Genomic DNA from parental accessions and 115 F2 individuals was extracted, as described by Szczechura et al. [32], and used for genotyping. In total, 717 DNA markers were evaluated. Of these, 479 newly tested markers comprised 318 simple sequence repeat (SSR), 64 cleaved amplified polymorphic sequence (CAPS), and 97 insertion–deletion (InDel) markers (Table S1). These were analyzed together with 238 markers from the earlier study, namely 178 random amplified polymorphic DNA (RAPD), seven inter-simple sequence repeat (ISSR), seven sequence-characterized amplified region (SCAR), and 46 SSRs.
Markers were selected based on prior reports of their association with PC resistance [27,34,38,43,44,58,59,60,61,62,63,64,65,66,67] and the reference cucumber genetic map [68], with emphasis on regions previously linked to resistance, as well as genomic intervals that were underrepresented in the original map. Marker sequences were obtained from published sources and public databases, or were designed de novo using Primer3 (v.4.1.0) [69]. Polymorphism for the selected molecular markers was initially assessed between the two parental lines (PI 197085 and PI 175695), and exclusively the polymorphic markers were subsequently used to genotype the 115 F2 plants. PCR amplifications were performed using DreamTaq DNA Polymerase (Thermo Fisher Scientific, Waltham, MA, USA), following the manufacturer’s protocol. The amplification products were resolved by agarose or polyacrylamide gel electrophoresis, depending on the required resolution. The details of primers, annealing temperatures, and PCR conditions are provided in Table S1. Marker segregation was evaluated by chi-square (χ2) tests at α = 0.05 to determine conformance with expected Mendelian ratios (1:2:1 or 3:1).
An updated linkage map was constructed using JoinMap 4.0 [70], maximum likelihood mapping algorithm, and the Kosambi mapping function [71]. A logarithm of odds (LOD) score threshold of 3.0 was applied for grouping markers into linkage groups (LG). Chromosomal assignments were based on alignment to the ‘Chinese Long’ (inbred line 9930; hereafter referred to as CL9930 v3.0) reference genome [72], and the marker order was further cross-referenced with previously established high-resolution cucumber maps [68]. LG were assigned to cucumber chromosomes based on their physical positions in the CL9930 v3.0 reference genome [72], thereby allowing direct reference to chromosomes in QTL descriptions. Collinearity was evaluated by regressing genetic positions (cM) against physical positions (Mb; CL9930 v3.0) and by computing Spearman’s rank correlation for each chromosome. Legacy multi-locus markers without unambiguous physical anchors (e.g., RAPD, ISSR) were excluded from collinearity statistics but retained in the linkage analysis.

2.5. QTL Analysis and Identification of Candidate Genes

QTL analysis was carried out using Composite Interval Mapping (CIM) implemented in WinQTL Cartographer (v.2.5) [73]. The analysis parameters were set as follows: Model 6, forward stepwise regression, a maximum of five background markers, a 10 cM window size, and a 1 cM walk speed. The significance thresholds were determined using 1000 permutations at α = 0.01, corresponding to a genome-wide LOD threshold of 4.50. For each detected QTL, the chromosomal position, LOD score, proportion of phenotypic variance explained (R2), additive (AE), and dominance (DE) effects were recorded. Detected QTLs were designated using the trait abbreviation (dm) followed by chromosome number and locus number, according to the nomenclature guidelines proposed by Wang et al. [74].
The physical intervals of QTLs were inferred by anchoring flanking markers to the CL9930 v3.0 reference genome using BLASTN searches performed within the CuGenDBv2 platform [75]. Genes located within the resulting QTL intervals were retrieved based on the genome annotation available in CuGenDBv2, allowing the preliminary functional characterization of the candidate regions.

3. Results

3.1. Field Performance of PI 197085 Resistance

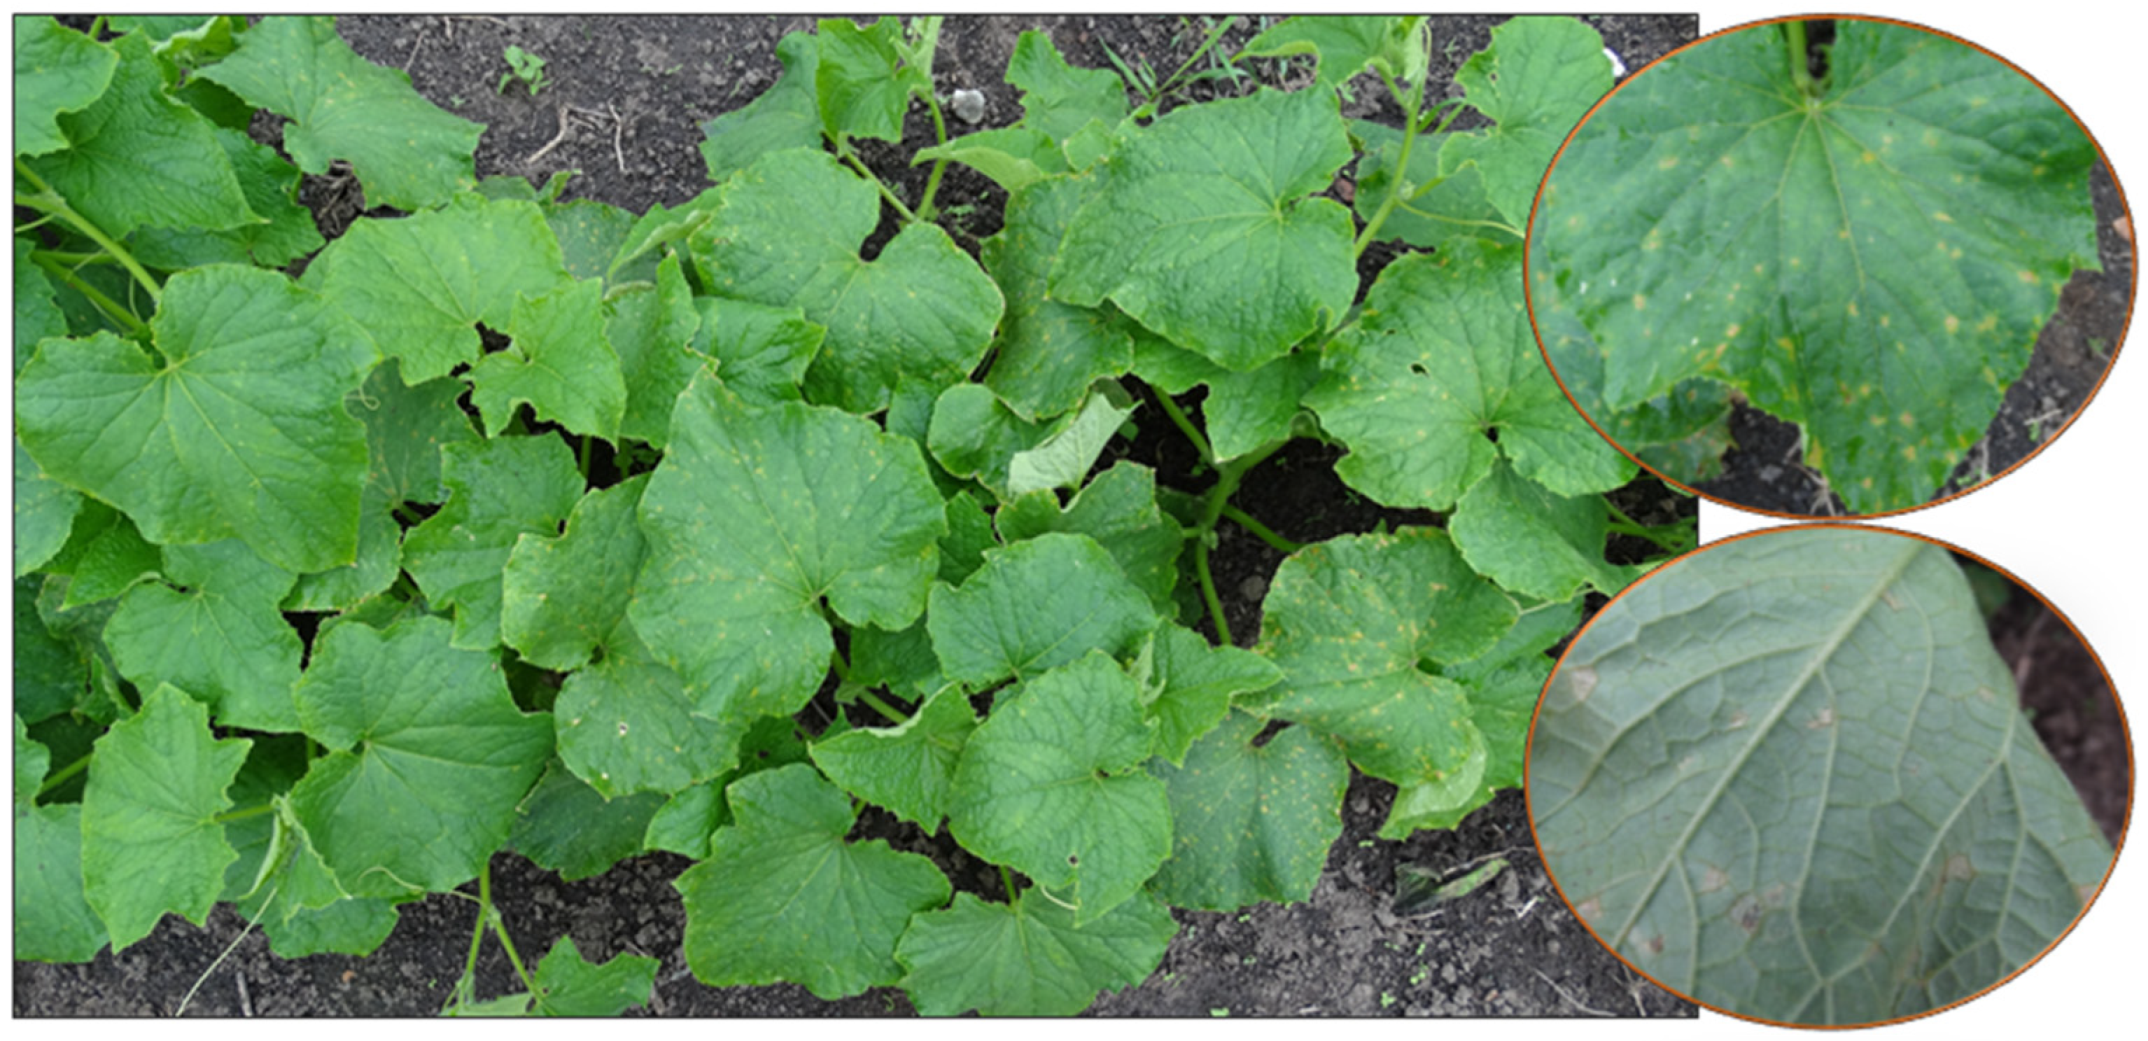
Over four field seasons, PI 197085 consistently exhibited low PC severity (Figure 2). The accession maintained a DSI of 1.0 or lower in three of four years, indicating minimal disease impact (Figure 3). In 2023, the mean disease severity increased slightly to 1.8 but remained within the low severity range. The multiyear mean disease severity of 0.73 for PI 197085 was comparable to that of ‘Ames 2354’ (0.58) and PI 197088 (0.55), which indicated practical equivalence among these resistant accessions. These findings across various seasons confirm the stability of PI 197085 and endorse its utility as a resistant and valuable resource for breeding programs. In contrast, PI 175695 plants exhibited high susceptibility (DSI = 8.5 and 9.0 in 2024 and 2021–2023, respectively) (Figure 2 and Figure 4).

3.2. Phenotypic Reaction of the Cucumber Plants to P. cubensis Inoculation

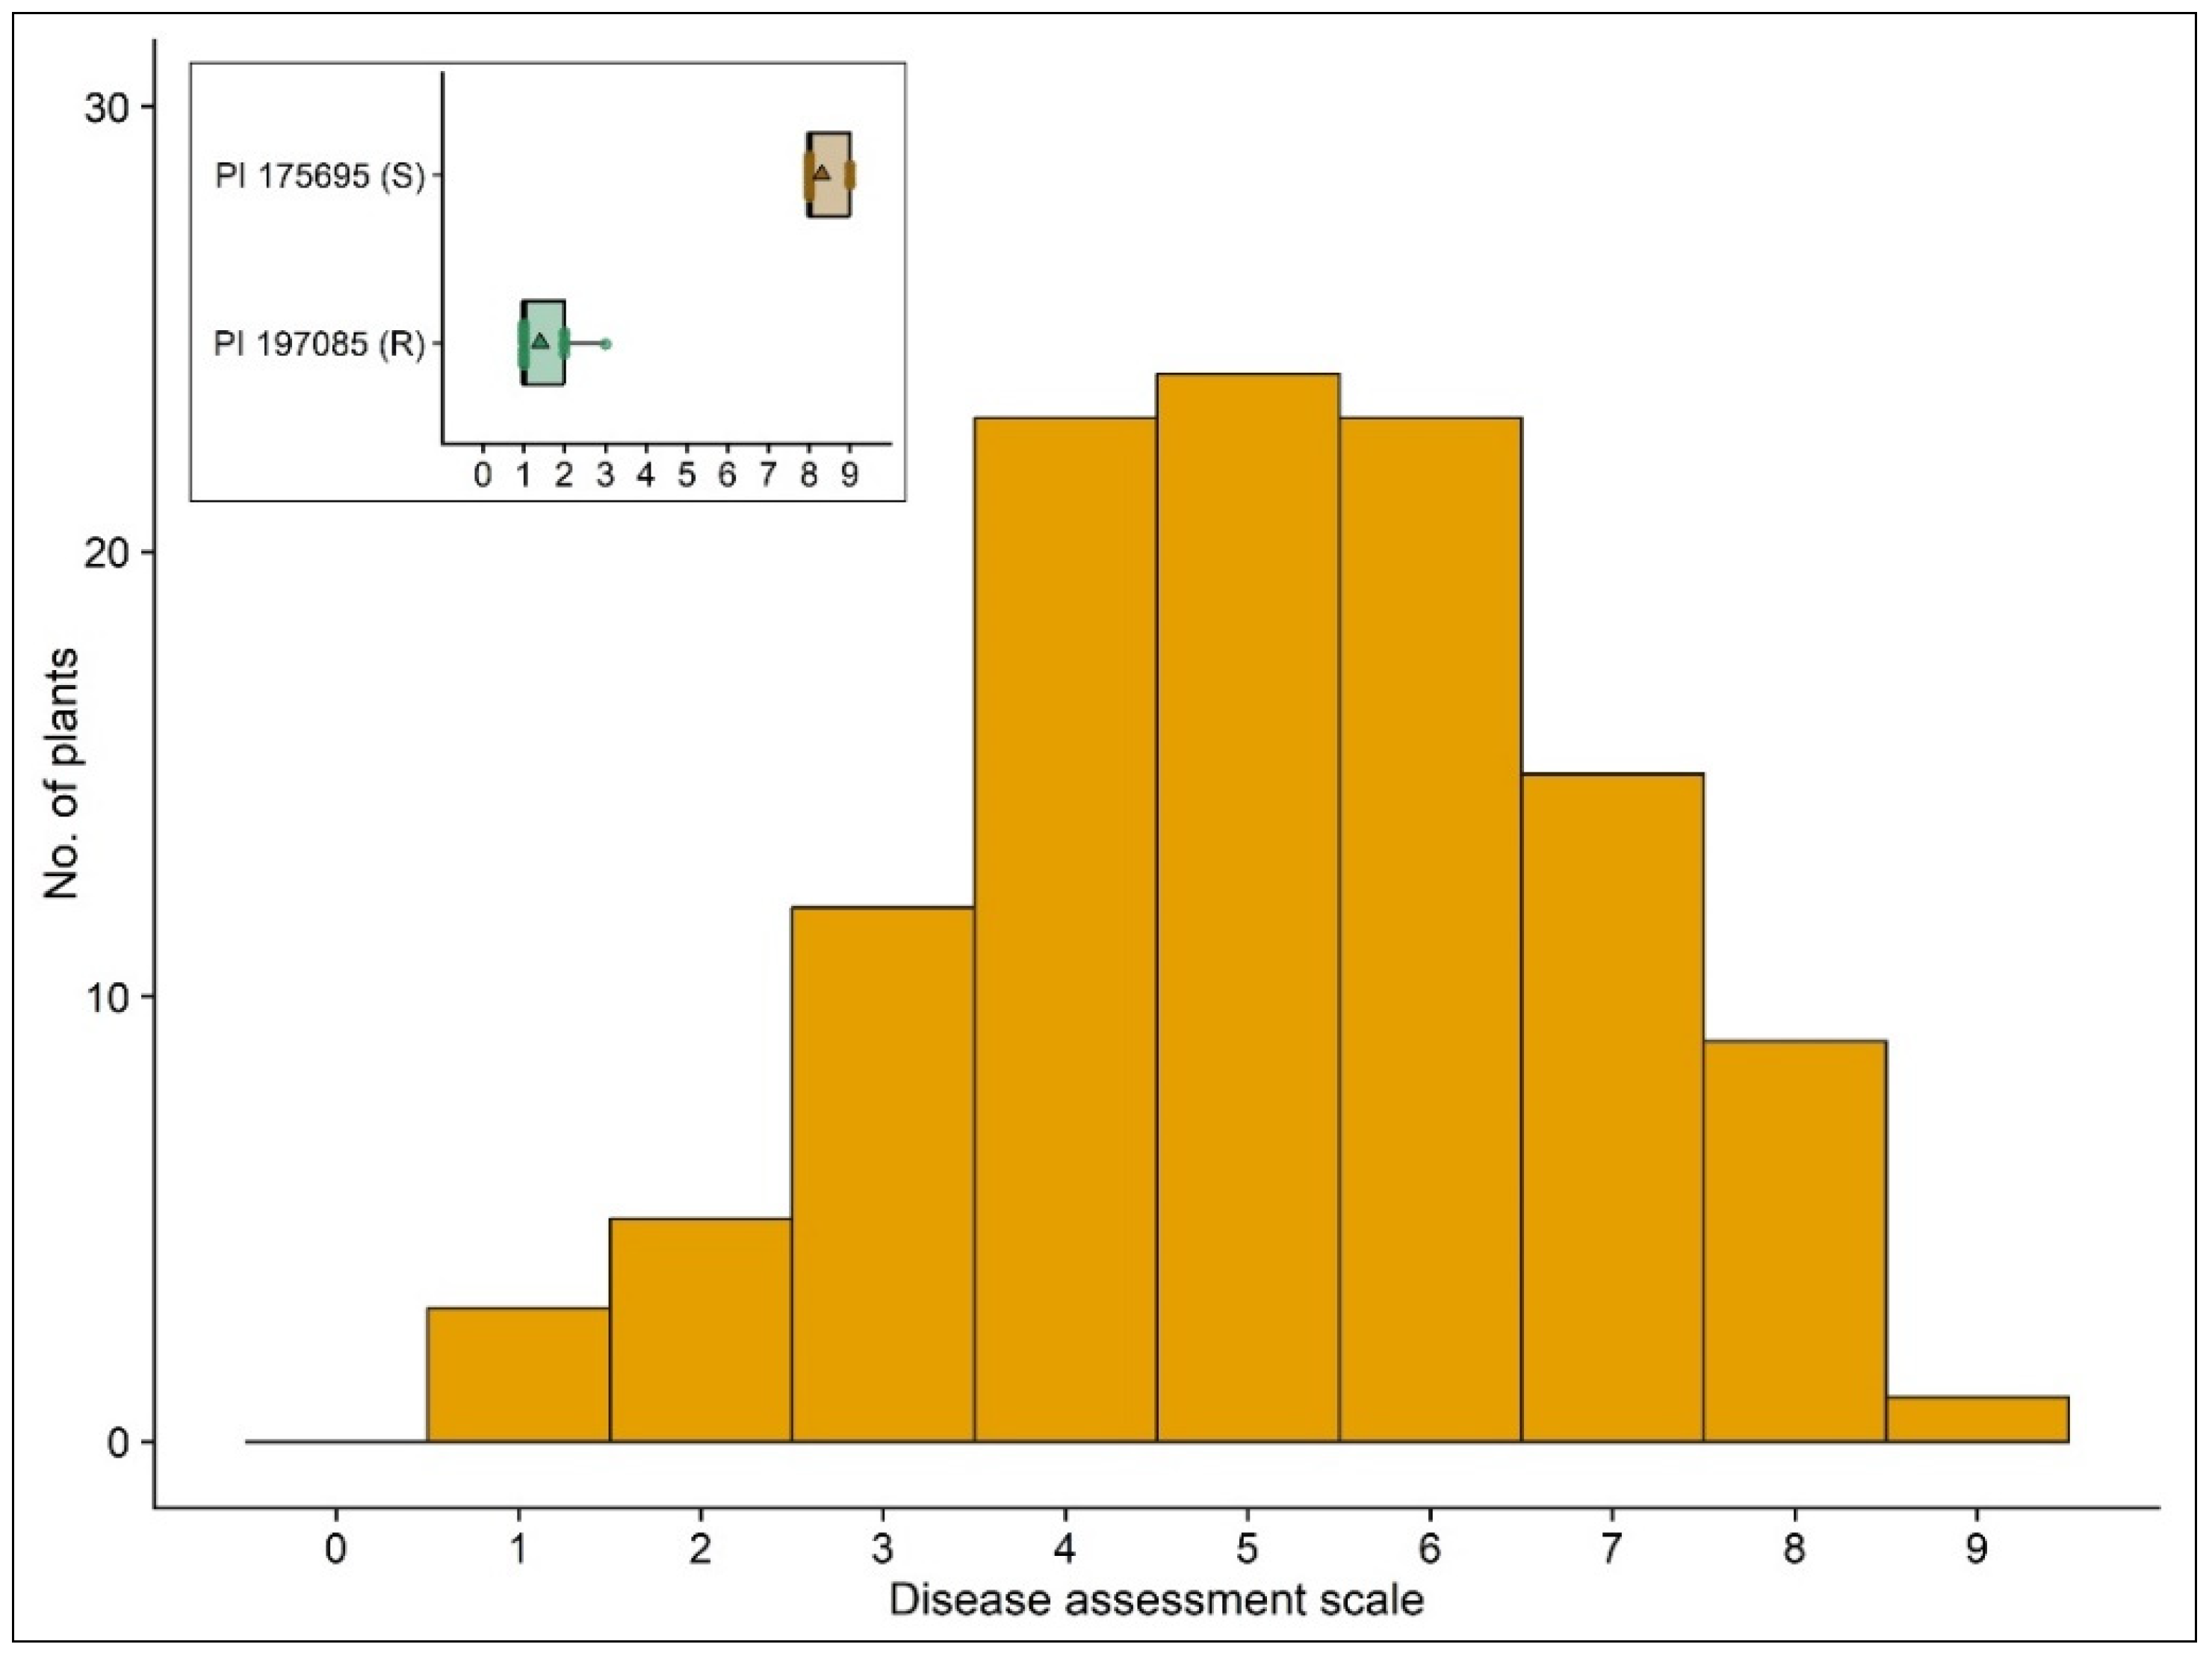
PI 197085 plants exhibited a low level of disease symptoms (DSI = 1.4), predominantly assigned to resistance classes 1 and 2 (Figure 5). In contrast, PI 175695 plants were uniformly susceptible (DSI = 8.3) and were scored in disease classes 8 and 9. The F2 population (n = 115; DSI = 5.1) exhibited a continuous distribution of disease severity across nearly all rating classes (1 through 9), with no individuals assigned to class 0 (Figure 5). The largest groups in the F2 generation were intermediately resistant (classes 3–4) and intermediately susceptible (classes 5–6), which constituted 30.4% and 40.9% of the entire F2 population, respectively. This pattern contributes additional evidence to the putatively quantitative nature of PC resistance derived from PI 197085.

3.3. Construction of the Genetic Linkage Map

To improve the resolution of the previous genetic map of the F2 population derived from the cross PI 197085 × PI 175695 [32], a substantially larger set of molecular markers was evaluated. In addition to the original 238 markers (178 RAPD, 7 ISSR, 7 SCAR, and 46 SSR), 479 more markers were tested, including 318 SSRs, 64 CAPS, and 97 InDels. Across the entire set, 177 markers (24.7%) exhibited clear polymorphism between the parental lines and were subsequently used to genotype 115 F2 individuals. Of these, a subset of 13 polymorphic markers showed ambiguous segregation patterns or inconsistent placement across linkage analyses and therefore could not be reliably assigned to any linkage group, which led to their exclusion from the final map. Eventually, 164 high-quality markers were integrated into a refined linkage map that spanned all seven chromosomes of cucumber, thereby enabling more detailed and reliable QTL detection. This set comprised 111 SSRs, 21 InDels, 8 CAPS, 1 SCAR, 1 ISSR, and 21 RAPD markers. The total map length was 798.14 centimorgans (cM), with an average inter-marker distance of 5.43 cM (Table 1 and Table S2), which represents a substantial improvement over the earlier low-density version that consisted of only 29 marker loci [32].
The revised map revealed variability in both length and marker density across the chromosomes. The size of individual LGs ranged from 78.62 cM for chromosome 1 (LG1, 17 loci) to 150.28 cM for chromosome 6 (LG6, 25 loci). The number of markers per linkage group ranged from 15 (LG2, chromosome 2) to 42 (LG5, chromosome 5), with an average of 23.4 loci per chromosome. LG5 was the most saturated region, with the smallest average inter-marker interval (2.26 cM), whereas LG2 and LG3 exhibited the sparsest coverage, with only 15 and 21 markers, and average distances of 7.65 cM and 8.68 cM, respectively.
With improved coverage, the majority markers aligned with their expected physical positions on the cucumber reference genome, with no major order conflicts across chromosomes (Figure S2). This collinearity supports the robustness of the updated linkage map. Overall, the updated genetic map provides notably improved resolution and more uniform coverage of the cucumber genome, which enables more precise detection and localization of QTLs associated with PC resistance.

3.4. Identification of QTLs Underlying Resistance to P. cubensis

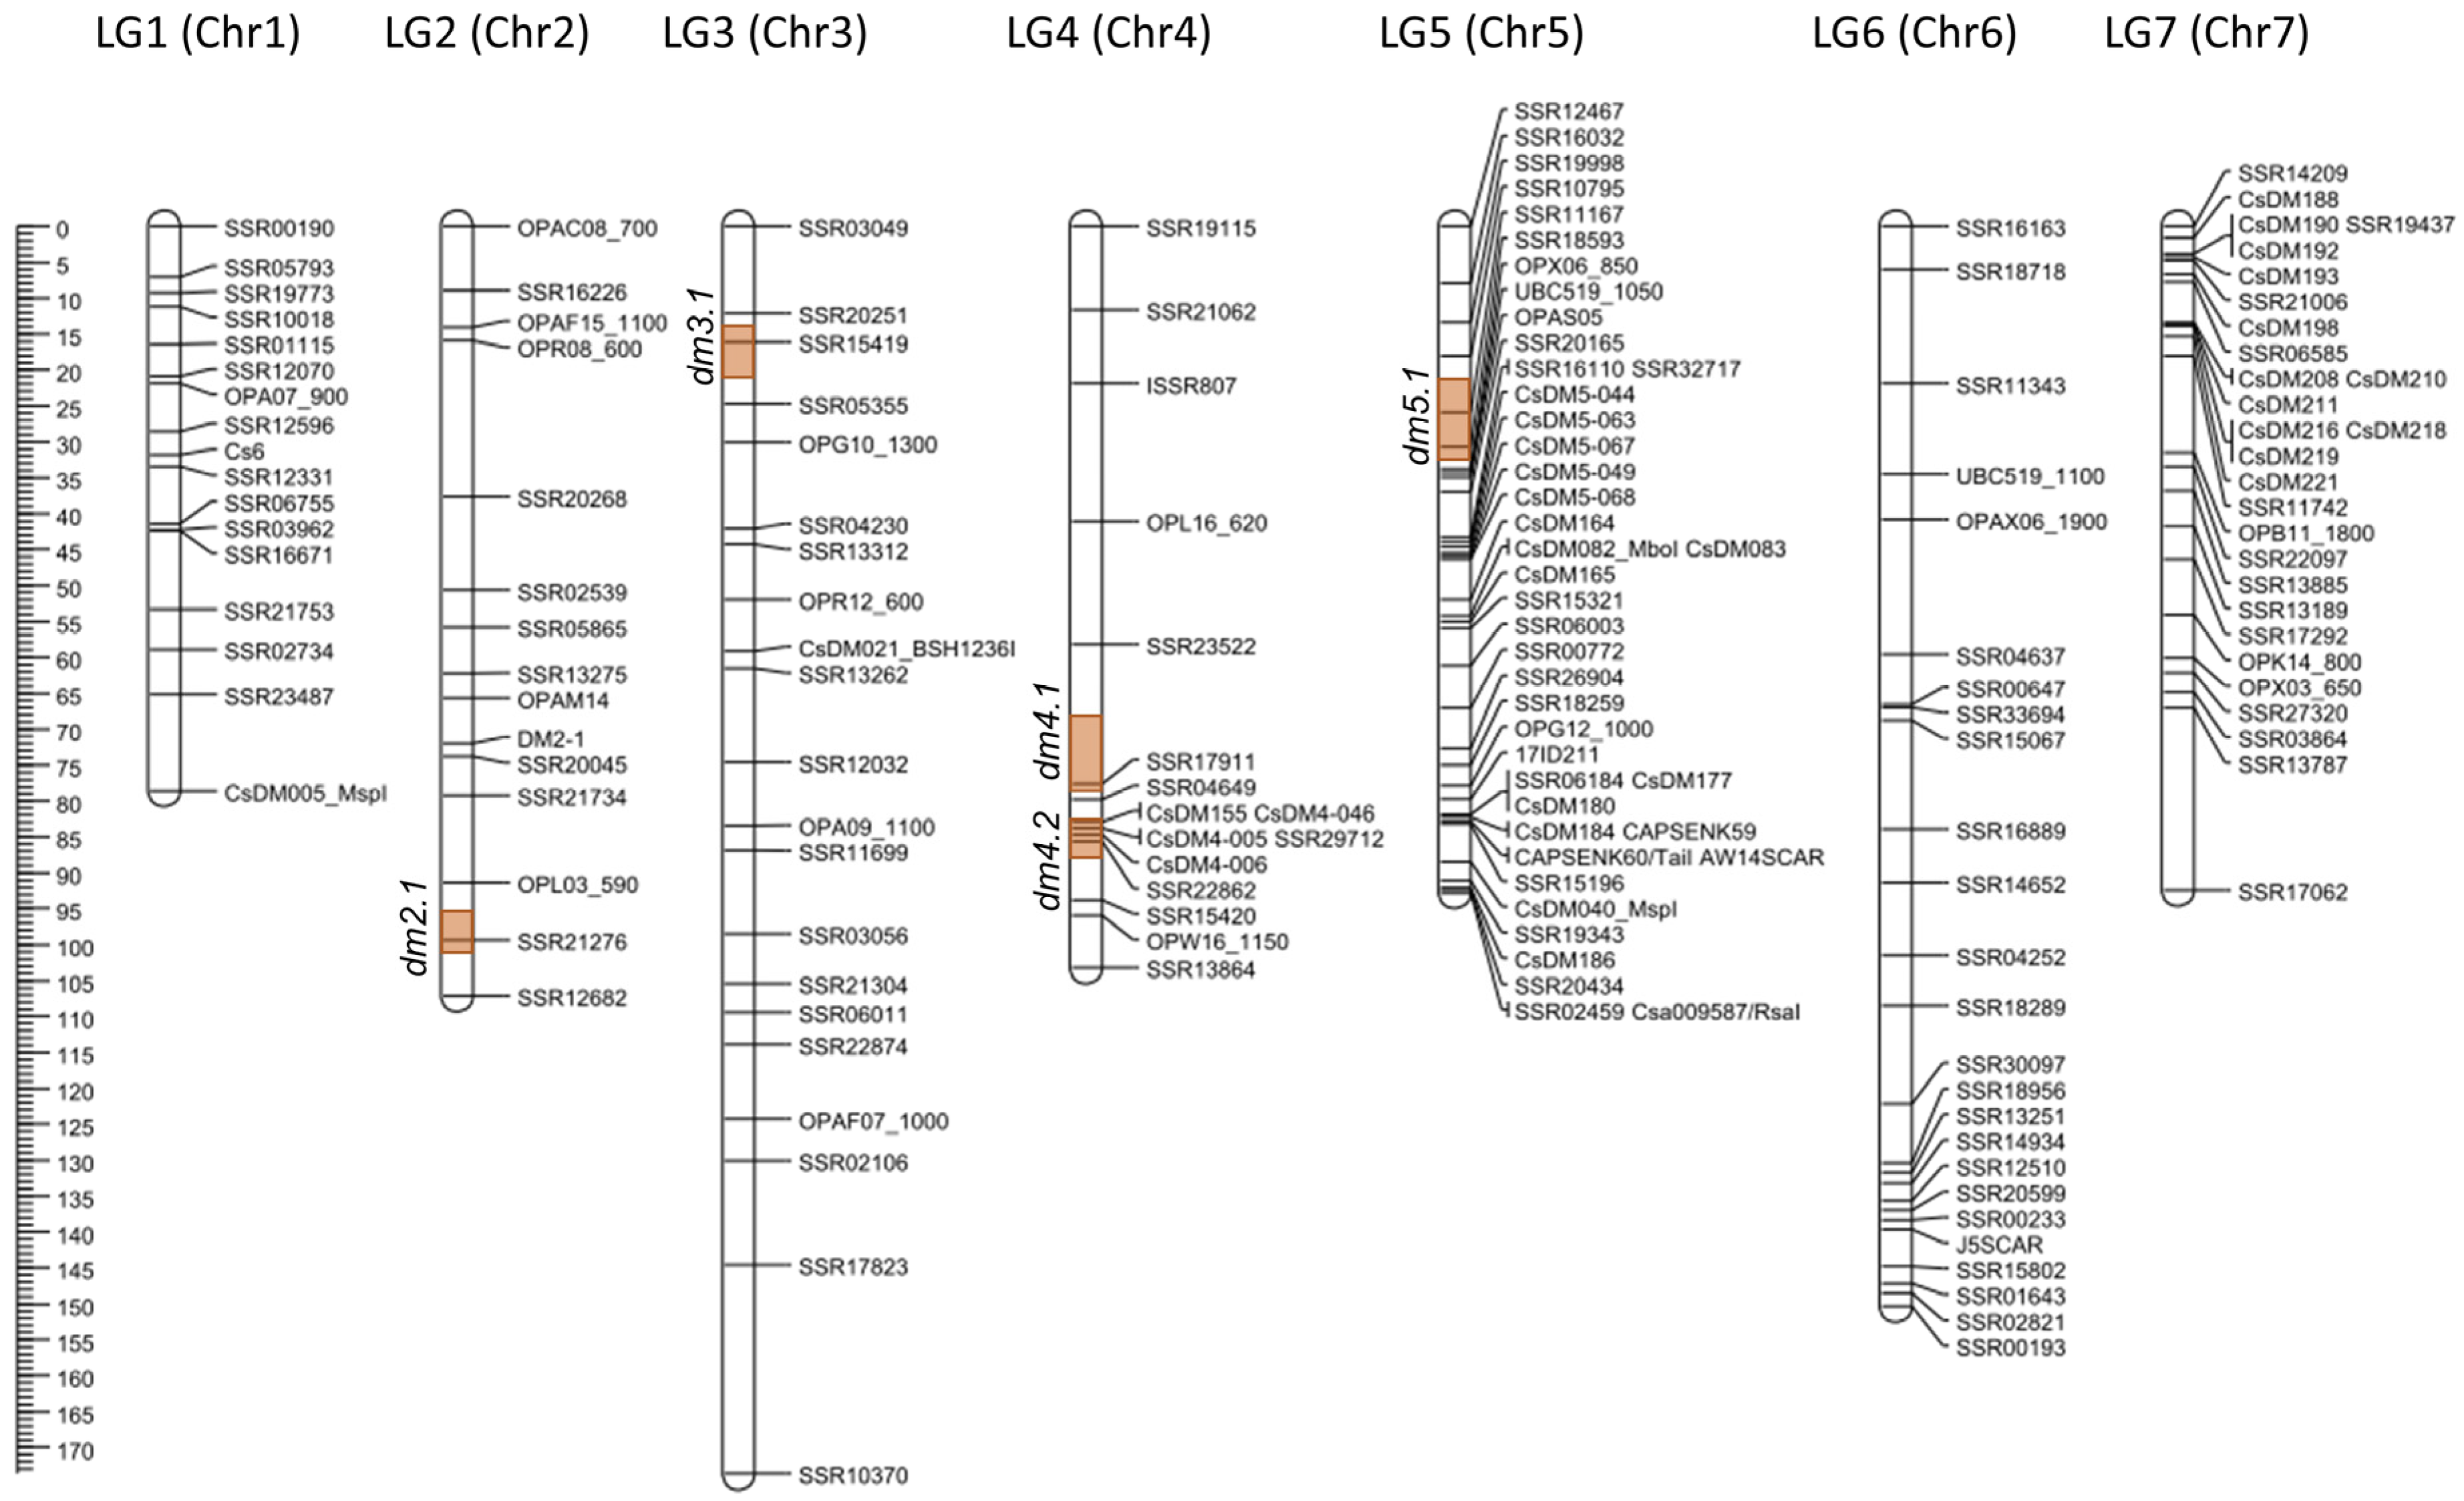
Permutation testing established a significance threshold of LOD 4.50 (α = 0.01), which was applied for QTL detection using composite interval mapping (CIM). Five QTLs associated with PC resistance were detected across four cucumber chromosomes: 2, 3, 4, and 5 (Table 2; Figure 6 and Figure S1). This represents a substantial improvement compared with previous analyses of the same mapping population, in which only three loci were identified, all located on chromosome 5, most likely due to limited marker density [32].
The identified QTLs exhibited moderate to high LOD scores ranging from 5.01 to 9.78, and accounted for 5.5% to 14.7% of the phenotypic variance. Four loci (dm2.1, dm3.1, dm4.1, and dm4.2) had moderate effects (10% ≤ R2 ≤ 15%), whereas one locus (dm5.1) represented a minor-effect QTLs (R2 < 10%).
On chromosome 2, a single moderate-effect QTL, dm2.1, was mapped at 99.01 cM with an LOD score of 7.85, accounting for 14.7% of the phenotypic variance, which marked it as the highest-effect locus observed in this study. The confidence interval for this locus spanned from 95.6 to 101.2 cM, with the nearest marker, SSR21276, located at 99.41 cM, close to the peak. Furthermore, a single moderate-effect QTL, dm3.1, was identified on chromosome 3 at 17.01 cM. This locus exhibited the highest LOD score (9.78) among all identified QTLs and explained 14.0% of the phenotypic variance. Marker SSR15419, situated at 16.08 cM, was closest to the peak and anchored this region. Two additional QTLs were identified on chromosome 4. The first QTL, dm4.1, was mapped at 77.0 cM, co-localized with SSR17911 (77.6 cM), and flanked on the right by SSR04649 (79.8 cM). dm4.1 had an LOD value of 6.80 and accounted for 9.8% of the variance. The second QTL, dm4.2, was positioned at 84.01 cM (LOD = 7.14) and explained 10.4% of the variance. This locus was embedded within a dense marker cluster (CsDM155, SSR29712, CsDM4-006) and extended toward SSR22862 (85.6 cM), spanning the 1-LOD interval from 80.1 to 88.7 cM. Given their physical proximity and overlapping intervals, dm4.1 and dm4.2 likely delineate the same resistance region on chromosome 4. The two peaks may reflect either distinct but closely linked QTL with partially overlapping effects or a single underlying locus resolved as adjacent peaks due to limited marker density and local recombination heterogeneity. Finally, a minor-effect QTL, dm5.1, was mapped to chromosome 5 at 29.01 cM (LOD = 5.01), accounting for 5.5% of the phenotypic variance. It was positioned between SSR11167 (25.9 cM) and SSR18593 (30.7 cM), corresponding to a 1-LOD interval of 21.4–32.7 cM.
All QTLs displayed negative additive effects (Table 2), thereby indicating that resistance alleles were consistently contributed by PI 197085, the resistant parental accession. Variations in dominance effects were observed: dm3.1 and dm5.1 showed moderate negative dominance values (heterozygotes shifted slightly toward the resistant parent PI 197085), whereas dm4.1 and dm4.2 had near-zero dominance effects (−0.089 and −0.091, respectively), which suggested almost purely additive gene action. In contrast, dm2.1 exhibited a small positive value, which indicated a minor shift toward susceptibility. The QTLs identified here are consistent with the quantitative segregation observed in the F2 population, thus supporting the polygenic nature of PC resistance in PI 197085 and pointing to a potentially more complex genetic basis than inferred from the previous low-density map [32].

3.5. Prediction of Candidate Resistance Genes in Genomic Regions Harboring QTLs

Approximate physical intervals corresponding to the detected QTLs were inferred by aligning flanking markers with the CL9930 v3.0 reference genome [72]. These ranges should be considered indicative rather than definitive, as the resolution of QTL boundaries is still limited by marker density and recombination frequency. Within the delimited regions, annotated genes were cataloged and their numbers were estimated for each QTL (Table 3 and Table S3).
On chromosome 2, the interval dm2.1 extended from 22.06 to 22.85 Mb and comprised 127 genes, of which 98 were annotated. This region encompasses several defense-associated domains, including an NB-ARC protein (CsaV3_2G033580), a leucine-rich repeat family protein (CsaV3_2G033250), and protein LYK2 (CsaV3_2G034210), consistent with pathogen perception and intracellular signaling. It also contains several transcription factors (WRKY, NAC, MYB, and TGA7-like), as well as signaling components, including a dynamin GTPase (CsaV3_2G033270) and a SNARE-associated Golgi protein (CsaV3_2G033510).
On chromosome 3, dm3.1 covered 3.22 and 5.04 Mb with the peak marker SSR15419 anchored at 3.33 Mb and contained 199 genes, of which 161 were annotated. A compact core segment from 3.22 to 3.44 Mb (21 genes) comprised several functionally plausible candidates, such as a WRKY transcription factor (CsaV3_3G003840), a vacuolar cation/proton exchanger (CsaV3_3G003980), a proteasome activator subunit (CsaV3_3G003990), and a cluster of subtilisin-like proteases. The broader interval also included transcriptional regulators (MYB35, ERF3, and bHLH123-like), cell-wall-modifying enzymes (pectin lyases, and COBRA-like proteins), and ubiquitin-related proteins.
Two distinct intervals were detected on chromosome 4. dm4.1 was located between 17.71 and 17.83 Mb and harbored 12 genes, of which 10 were annotated. This region contains the ethylene-responsive transcription factor ERF014 (CsaV3_4G028360), a glutaredoxin-like protein (CsaV3_4G028350), a RING-type E3 ubiquitin transferase (CsaV3_4G028380), and signaling-related genes such as phosphatidylinositol-4-phosphate 5-kinase (CsaV3_4G028400) and two receptor-like kinases (CsaV3_4G028420, CsaV3_4G028440). In contrast, dm4.2 (18.20–18.55 Mb) contained 27 genes, of which 21 were annotated. Several receptor-like kinases have been identified within this region, including CsaV3_4G028770 (PRK4), CsaV3_4G028860 (LRK10L2), and CsaV3_4G028850 (LR10-like RLK). Additional candidates comprised transcriptional regulators such as CsaV3_4G028820 (VOZ1-like) and CsaV3_4G028880 (MADS-box 23-like), as well as enzymatic components, including CsaV3_4G028870 (cytochrome P450). The gene complement in this interval therefore combines kinases, transcription factors, and enzymes involved in lipid and redox metabolisms.
On chromosome 5, dm5.1 spanned 5.74–11.97 Mb and contained 359 genes, of which 271 were annotated. Genes in this region included an N-like resistance protein (CsaV3_5G010200), a cluster of three WRKY transcription factors (CsaV3_5G011060-CsaV3_5G011080), multiple receptor-like kinases such as phytosulfokine receptor 1 (PSKR1), and an ERL1-like LRR-RLK, a mitogen-activated protein kinase, phosphoinositide-modifying enzymes, and vesicle trafficking proteins (sorting nexin, PRA1 family protein, SLY1, and ENTH-domain proteins). The interval also contained cell-wall-related enzymes (subtilisin-like proteases, pectinesterases, exopolygalacturonases, expansin), protease inhibitors, peroxidases, redox-associated proteins, annexins, remorins, and transcription factors from the MYB, bZIP, bHLH, GATA, FAR1-related, AT-hook, and ALFIN-like families. Epigenetic regulators are represented by a DNA methyltransferase, a CLASSY1-like SNF2 protein, and a PHD-type ING factor. Additional genes included RNA-dependent RNA polymerases, TOM1/TOM3 homologs, and a range of transporters (amino acid, potassium, sulfate, auxin efflux carriers, and vacuolar iron transporter VIT1).
In summary, all intervals defined in this study contained multiple candidate genes consistent with plant resistance reactions, including receptor-like kinases, NB-ARC/NLR proteins, transcription factors, and enzymes implicated in redox and signaling pathways. These gene repertoires support the hypothesis that resistance in PI 197085 is polygenic and relies on regulator-rich genomic neighborhoods.

4. Discussion

In this study, we hypothesized that the development of a higher-resolution genetic linkage map would facilitate a more precise localization of resistance loci, enable the detection of additional QTLs, and enhance the identification of candidate genes. Our results confirmed these expectations, as five QTLs were identified across four chromosomes compared to only three loci previously mapped on chromosome 5 [32]. The analysis also pointed to candidate genes within QTL intervals, although these predictions remain speculative due to the still limited resolution of that genetic map.
Downy mildew, caused by the obligate biotroph Pseudoperonospora cubensis, remains one of the most destructive diseases of cucumber, and leads to severe epidemics and substantial yield losses worldwide [1,3,4]. The development of resistant cultivars is the most effective and sustainable strategy for managing this disease, as it provides long-term control while reducing dependence on fungicides [5,17,20]. However, breeding progress is constrained by the high variability and rapid evolution of the pathogen [6,11,14,15,16,76,77], which undermines the durability of resistance and necessitates continuous identification of new sources for this valuable trait.
The cucumber accession PI 197085, previously reported as one of the most PC resistant germplasm sources under Polish field conditions [17,41], was initially studied using a low-density skeleton linkage map, that revealed three candidate loci on chromosome 5 [32]. Subsequent multi-location field trials confirmed the high and stable PC resistance of this accession, thereby providing a strong rationale for constructing a more saturated genetic map to refine the localization of resistance loci.
The map developed in this study spans 798.14 cM with an average inter-marker distance of 5.4 cM, which is consistent with the cytological estimate of 750–1000 cM for cucumber [78], and thus represents a reliable framework for QTL analysis [36,38,79]. The integration of a larger and more diverse set of markers improved the genome coverage, reduced large gaps, and ensured a balanced representation of all seven chromosomes. Importantly, the majority of the markers showed collinearity with the physical positions in the CL9930 v3.0 reference genome, with only a few local inconsistencies. Compared with previously reported SSR-based maps, such as those of Zhang et al. [27] and Innark et al. [35], which exhibited mean intervals exceeding 6–8 cM, the present map offers substantially denser coverage. Although the current density does not yet permit fine mapping, it provides sufficient resolution to detect five QTL for PC resistance across chromosomes 2, 3, 4, and 5, in contrast to the three loci previously identified only on chromosome 5 [32]. On chromosome 5 specifically, the earlier map placed eight markers across 205.7 cM (average inter-marker distance of about 25.71 cM), whereas the present LG contains 42 markers with an average inter-marker distance of 2.26 cM. Moreover, the QTL peaks defined here are typically confined within 5.6–11.2 cM 1-LOD support intervals. Together, these quantitative differences clearly demonstrate the markedly improved positional precision achieved in the present map. Among the detected loci, dm2.1, dm3.1, and dm4.1, and dm4.2, had a moderate effect, whereas dm5.1 had a minor effect. The detection of loci on multiple chromosomes underscores the polygenic architecture of PC resistance in PI 197085, and highlights the complexity of its genetic basis.
The current QTL analysis was performed on the same PI 197085 × PI 175695 F2 population, as utilized in our previous study [32], using a different subset of individuals of comparable size. In both experiments, the PC inoculum originated from field-collected material in Skierniewice, Poland, to represent the same local pathogen population, although it was collected during different seasons. In the present study, we incorporated a significantly refined genetic map. Notably, both evaluations of PC resistance yielded nearly identical population averages (DSI = 5.0 vs. 5.1) with similar segregation across the disease assessment scale, which indicated broadly comparable phenotypic baselines. Accordingly, differences in QTL detection can be attributed to denser marker coverage and improved map resolution. Nevertheless, we cannot entirely exclude contributions from inter-season environmental variations, shifts in inoculum composition or pathogen population structure, or minor differences in phenotyping.
The QTL dm2.1 detected on chromosome 2 in the PI 197085 × PI 175695 F2 population supports the potential involvement of this region in PC resistance. Previous studies have also reported resistance loci on this chromosome, although their positions and relative effects vary depending on the genetic source and mapping approach [30,31,35,37,38,44]. Caldwell et al. [44] mapped a broad QTL in PI 197088, but its effect appeared to be environment dependent and less consistent across locations. Given the wide interval defined by that study, it cannot be excluded that our dm2.1 may at least partially correspond to this locus. More refined analyses were carried out by Wang et al. [31], who resolved two distinct loci, dm2.1 and dm2.2, in a RIL population derived from PI 197088 × ‘Coolgreen’ using genotyping by sequencing (GBS). Similarly, Win et al. [38] identified two loci on chromosome 2 (dm2.1 and dm2.2) in the resistant line TH118FLM, with the major-effect dm2.2 mapped by sequencing of bulked segregants (BSA-seq). These results demonstrate that the occurrence of multiple resistance loci on chromosome 2 is not unique to a single genetic background. In addition, Wang et al. [30] mapped dm2.1 in WI7120 (PI 330628), but it appeared to be unrelated to that detected in PI 197085. On the same chromosome, Innark et al. [35] described a minor QTL (Second14_2) in an F2 population derived from CSL0067 × CSL0139, which further supports the importance of chromosome 2, albeit with variable contributions depending on the genetic source. Importantly, dm2.1 identified by Wang et al. [31], dm2.1 described by Win et al. [38], and Second14_2 from Innark et al. [35] do not appear to correspond to our locus because their reported physical positions are located outside the interval defined for dm2.1 in the PI 197085 × PI 175695 population. However, both dm2.2 reported by Wang et al. [31] and by Win et al. [38] may represent regions overlapping with, or located in close proximity to, the QTL identified in PI 197085. The dm2.1 interval identified in PI 197085 was projected onto the CL9930 v3.0 reference genome [72]; however, its physical span (22.06–22.85 Mb; 127 genes) should be regarded as approximate, given the limited resolution of the current map. Nonetheless, the region harbors numerous defense-related candidates, including an NB-ARC protein, a leucine-rich repeat family member, and receptor-like kinase LYK2, alongside a suite of transcription factors (WRKY, NAC, MYB, TGA7-like) and signaling components such as dynamin GTPase and SNARE proteins. Gene ontology (GO) analysis and functional categorization of genes within the dm2.1 interval revealed enrichment in catalytic and binding activities, particularly those associated with kinase and transcription factor functions. The co-occurrence of multiple receptor-like kinases, NLR-like proteins, transcriptional regulators, and redox enzymes across both intervals further highlights chromosome 2 as a region dense in defense-related genes. This suggests that PC resistance in PI 197085 may rely on the combined action of several partially overlapping determinants, some of which could represent novel allelic variants not previously described in other donor backgrounds.
On chromosome 3, a single QTL, dm3.1, was detected, representing a locus of moderate effect. However, resistance loci on this chromosome have rarely been reported. In PI 197088, Wang et al. [31] identified two QTL (dm3.1 and dm3.2), and Li et al. [36] detected one, none of which appear to colocalize with the interval identified here. Yoshioka et al. [23] also mapped a locus designated dm3.1 in RILs derived from CS-PMR1 × ‘Santou’, which may correspond to our findings. Unfortunately, the lack of shared markers limits direct comparisons, and alignment relies only on the approximate physical positions of the reported QTLs. The physical interval of dm3.1, projected onto the CL9930 v3.0 reference genome, spans 3.22–5.04 Mb and encompasses 199 genes, including 161 functionally annotated ones. A subregion between 3.22 and 3.44 Mb, closely associated with the SSR15419 marker nearest the QTL peak, contains multiple in defense-related genes, including transcription factors (e.g., WRKY), proteasome components, and clusters of subtilisin-like proteases. The extended interval additionally harbors further regulators (MYB, ERF, bHLH), enzymes involved in cell wall modification, and elements of ubiquitin-mediated pathways. Given the moderate effect of dm3.1 and the limited resolution of the present map, PC resistance is unlikely to depend on a single determinant; rather, the region may contain several functionally relevant genes that require further validation.
Two QTLs were detected on chromosome 4 (dm4.1 and dm4.2), which reinforces previous evidence that this chromosome harbors key determinants of PC resistance in cucumber. The dm4.1 interval has been reproducibly identified across several resistant sources, including PI 197088 [31,36,43,44], WI7120 [30], and TH118FLM [38]. In addition, a genome-wide association study of diverse cucumber germplasms [37] identified three associations on chromosome 4 (dmG4.1, dmG4.2, and dmG4.3), although none of these overlapped with the intervals identified in our study. Notably, VandenLangenberg [43] reported a putative QTL on chromosome 4 tightly linked to SSR17911, the same marker that in our study was positioned at 77.62 cM and located directly adjacent to the peak of dm4.1 (77.01 cM). A comparison with earlier studies further suggests that the loci mapped in PI 197085 correspond to or are located in close proximity to the major-effect QTL repeatedly detected in PI 197088 [31], WI7120 [30], and TH118FLM [38]. However, since identical marker positions do not necessarily imply allelic identity, it remains uncertain whether these loci represent the same underlying determinants or distinct allelic variants. This convergence indicates that chromosome 4 contains recurrent PC resistance determinants that are stable across diverse donor backgrounds. Anchoring of flanking markers to the CL9930 v3.0 reference genome that dm4.1 spans approximately 17.71–17.83 Mb and harbors 12 genes (10 annotated), although its physical size is likely larger due to limited marker density in this interval. In contrast, dm4.2 is more precisely delimited to 18.20–18.55 Mb (27 genes; 21 annotated) and contains a dense cluster of defense-related genes. Among these, the receptor-like kinase CsLRK10L2, previously implicated in resistance within the sub-QTL dm4.1.2 by Berg et al. [34] in near-isogenic lines (NILs) derived from PI 197088 × HS279, falls within the dm4.2 interval identified here. In contrast, CsAAP2A, which is associated with dm4.1.3 in that same study, is located outside the intervals detected in PI 197085. The gene composition of these regions further underscores their functional relevance. The compact dm4.1 interval harbors loci with receptor-like kinases, suggesting their potential involvement in membrane-associated signaling processes [80]. The dm4.2 interval, besides the aforementioned CsLRK10L2, comprises additional receptor-like kinases (PRK4), transcription factors such as VOZ1-like and MADS-box 23-like, metabolic enzymes (cytochrome P450, glycosyltransferases) that may participate in cell-wall or small-molecule modification [81,82,83].
Given their close proximity and comparable statistical parameters, dm4.1 and dm4.2 may represent a single QTL that was statistically separated into two peaks due to limited marker density or local recombination suppression. Alternatively, they might correspond to two tightly linked resistance loci that contribute to the same phenotypic effects. Such apparent splitting of a single QTL region is a common artifact of interval mapping in regions with low marker density or clustered resistance-related gene density [84,85,86]. These findings place the PC resistance determinants of PI 197085 within a conserved, regulator-rich segment of chromosome 4 and suggest that the loci identified in our study correspond closely to or lie in proximity to major-effect QTL(s) repeatedly reported in other donor sources. Future work will focus on validating the genetic architecture of this region to determine whether dm4.1 and dm4.2 represent distinct loci or components of a single resistance region.
An additional QTL (dm5.1) was detected on chromosome 5, a region consistently recognized as a resistance hotspot and known to contain the highest number of loci linked to PC resistance across various cucumber germplasm [22,27,28,30,31,32,36,38,43,44,49]. In several of these studies, including those involving PI 197088 [31,36,43,44] and WI7120 [30], major-effect QTLs were mapped to this chromosome. In the present study, which was conducted on the same F2 population as reported by Szczechura et al. [32], only one locus (dm5.1) with a relatively minor effect was detected, in contrast to the three QTLs (DM1, DM2, and DM3) identified previously. This difference primarily reflects the improved structure and resolution of the current linkage map, which includes a greater number of evenly distributed DNA markers and more stringent statistical thresholds for the detection of QTLs. The previous map contained wide intervals with sparse marker coverage, likely causing multiple nearby effects to appear as separate peaks. With improved coverage, most markers aligned with their expected physical positions on the CL9930 v3.0 reference genome, which supports the robustness of the present map and increasing confidence in the localization of PC resistance loci. A comparison with our earlier results suggests that the locus dm5.1 detected here most likely corresponds to the previously reported DM1 [32], as indicated by the presence of the shared marker RAPD OPX06_850 within its confidence interval. Four markers formerly associated with DM2 and DM3 in the earlier study now fall outside the refined dm5.1 interval, thereby reflecting a shift in marker order and improved boundary definition in the updated linkage map. This refinement reduced the number of loci detected on chromosome 5 compared with the earlier analysis but provided a more accurate placement of QTL boundaries. The physical intervals of dm5.1 (approximately 6.0–11.0 Mb) encompass 359 genes, including 271 annotated ones. These include multiple receptor-like kinases, transcription factors, NB-ARC domain proteins, redox enzymes, and cell wall-modifying enzymes typically associated with plant resistance. The discrepancy between the strong effects reported for chromosome 5 in other donor sources and the minor effects observed in PI 197085 suggests that the contribution of this region is background-dependent and possibly influenced by environmental conditions or developmental stages. Validation under multiple environments and growth stages is therefore necessary to clarify the stability and breeding utility of chromosome 5 loci in this genetic background.
The five QTLs identified in PI 197085 exhibit a spectrum of effects, which range from moderate (dm2.1, dm3.1, dm4.1, dm4.2) to minor (dm5.1). This variation highlights the polygenic nature of PC resistance and suggests that breeding strategies should prioritize the integration of multiple loci to achieve durable resistance. Notably, the moderate-effect loci on chromosomes 3 and 4 (dm3.1, dm4.1, and dm4.2) are situated in regions abundant in regulatory elements, which can potentially enhance their stability across diverse environments and genetic backgrounds. Despite the enhanced resolution of the current map, there are several limitations. Although the confidence intervals of the QTLs were narrower than those in previous studies, they still encompassed multiple megabases and included up to hundreds of candidate genes. This constrains the precision of marker-assisted selection and complicates functional validation.
Furthermore, the expression of PC resistance loci may be influenced by environmental conditions, developmental stage, pathogen isolate(s), genetic background, and experimental design, as evidenced by the variable QTL effects reported across studies [23,27,28,29,30,31,32,36,38,46,62]. To address these challenges, future efforts should focus on the following approaches: (1) developing F2:3 families for short-term validation of individual QTL effects under controlled and field conditions, followed by RILs and/or NILs for robust validation and fine mapping; (2) fine mapping using higher-density markers or high-throughput sequencing-based methods to narrow QTL intervals and identify causal genes; (3) conducting multi-environment and multi-isolate trials to evaluate the stability and breeding utility of each PC resistance locus; and (4) employing functional genomics (e.g., transcriptomics and gene editing) to characterize candidate resistance genes within QTL intervals. Collectively, these strategies will accelerate the translation of QTL discovery into practical breeding outcomes and support the development of cucumber cultivars with robust and durable resistance to PC.

5. Conclusions

This study identified five QTLs for resistance to Pseudoperonospora cubensis (PC) in the PI 197085 distributed across four chromosomes (2, 3, 4, and 5). The results confirmed the polygenic nature of resistance with loci exhibiting minor to moderate effects, and highlighted chromosome 4 as a particularly consistent hotspot for PC resistance. The refined genetic map provides improved resolution compared to earlier analyses and establishes a foundation for further verification of these findings, followed by fine-mapping and candidate gene validation.

Supplementary Materials

The following supporting information can be downloaded at: https://www.mdpi.com/article/10.3390/agronomy15112633/s1, Figure S1: Graphical representation of QTLs associated with resistance to Pseudoperonospora cubensis in the PI 197085 × PI 175695 F2 cucumber population; Figure S2: Collinearity between the updated genetic linkage map of the cucumber F2 population (PI 197085 × PI 175695) and the reference genome (CL9930 v3.0); Table S1: List of molecular markers used for genotyping the PI 197085 × PI 175695 F2 cucumber population; Table S2: Summary of phenotypic and genotypic data used for Pseudoperonospora cubensis QTL mapping, Table S3: List of annotated genes located within QTL intervals linked to resistance to Pseudoperonospora cubensis identified in the PI 197085 × PI 175695 F2 cucumber population based on the CL9930 reference genome (v3.0).

Author Contributions

Conceptualization, M.N. (Marzena Nowakowska), W.S., and M.T.; Methodology, W.S., M.N. (Marzena Nowakowska), U.K., and K.N.; Software, M.N. (Marzena Nowakowska), M.T., and W.S.; Formal analysis, M.N. (Marzena Nowakowska), M.N. (Marcin Nowicki), U.K., and M.T.; Investigation, W.S., M.N. (Marzena Nowakowska), U.K., and K.N.; Data curation, M.N. (Marzena Nowakowska), M.T., W.S., and U.K.; Resources, U.K., E.U.K., M.N. (Marzena Nowakowska), and W.S.; Visualization, M.N. (Marzena Nowakowska), K.N., and U.K.; Writing—original draft, M.N. (Marzena Nowakowska), U.K., and W.S.; Writing—review and editing, M.N. (Marzena Nowakowska), M.N. (Marcin Nowicki), W.S., M.T., U.K., K.N., and E.U.K.; Supervision, M.N. (Marzena Nowakowska) and M.T. All authors have read and agreed to the published version of the manuscript.

Funding

This research was funded by the Ministry of Science and Higher Education of Poland, project: “Identification and mapping of cucumber genes conferring resistance to Pseudoperonospora cubensis”, grant number ZHRO/1/2017.

Data Availability Statement

The original contributions presented in this study are included in the Supplementary Materials. Further inquiries can be directed to the corresponding authors.

Acknowledgments

The authors gratefully acknowledge Ewa Matysiak, Paulina Fydrych-Lichman, and Ewa Gołębiewska for their valuable technical assistance during the tests and for conducting the field experiments.

Conflicts of Interest

The authors declare no conflicts of interest.

Abbreviations

The following abbreviations are used in this manuscript:
AEAdditive Effect
BSA-seqBulked Segregant Analysis coupled with Sequencing
CAPSCleaved Amplified Polymorphic Sequence
cMcentiMorgan
CIMComposite Interval Mapping
CuGenDBv2Cucurbit Genomics Database, version 2
DEDominance Effect
DMDowny Mildew
DSIDisease Severity Index
GBSGenotyping-by-Sequencing
GWASGenome-Wide Association Study (GWAS)
InDelInsertion–Deletion polymorphism
ISSRInter-Simple Sequence Repeat
LGLinkage Group
LODLogarithm of odds
MbMegabase(s)
NILNear-Isogenic Line(s)
PCRPolymerase Chain Reaction
RAPDRandom Amplified Polymorphic DNA
RILRecombinant Inbred Line(s)
SNPSingle-Nucleotide Polymorphism
SCARSequence-Characterized Amplified Region
SSRSimple Sequence Repeat (also known as microsatellite marker)
TFTranscription Factor(s)
QTLQuantitative Trait Locus

References

  1. Thomas, C.E. Downy mildew. In Compendium of Cucurbit Diseases; Zitter, T.A., Hopkins, D.L., Thomas, C.E., Eds.; American Phytopathological Society Press: St. Paul, MN, USA, 1996; pp. 25–27. [Google Scholar]
  2. Palti, J.; Cohen, Y. Downy mildew of Cucurbits (Pseudoperonospora Cubensis): The fungus and its hosts, distribution, epidemiology and control. Phytoparasitica 1980, 8, 109–147. [Google Scholar] [CrossRef]
  3. Savory, E.A.; Granke, L.L.; Quesada-Ocampo, L.M.; Varbanova, M.; Hausbeck, M.K.; Day, B. The cucurbit downy mildew pathogen Pseudoperonospora cubensis. Mol. Plant Pathol. 2011, 12, 217–226. [Google Scholar] [CrossRef]
  4. Lebeda, A.; Cohen, Y. Cucurbit downy mildew (Pseudoperonospora cubensis)—Biology, ecology, epidemiology, host-pathogen interaction and control. Eur. J. Plant Pathol. 2011, 129, 157–192. [Google Scholar] [CrossRef]
  5. Cohen, Y.; Van den Langenberg, K.M.; Wehner, T.C.; Ojiambo, P.S.; Hausbeck, M.; Quesada-Ocampo, L.M.; Lebeda, A.; Sierotzki, H.; Gisi, U. Resurgence of Pseudoperonospora cubensis: The causal agent of cucurbit downy mildew. Phytopathology 2015, 105, 998–1012. [Google Scholar] [CrossRef]
  6. Wallace, E.C.; D’Arcangelo, K.N.; Quesada-Ocampo, L.M. Population analyses reveal two host-adapted clades of Pseudoperonospora cubensis, the causal agent of cucurbit downy mildew, on commercial and wild cucurbits. Phytopathology 2020, 110, 1578–1587. [Google Scholar] [CrossRef] [PubMed]
  7. Mirzwa-Mróz, E.; Zieniuk, B.; Yin, Z.; Pawełkowicz, M. Genetic insights and molecular breeding approaches for downy mildew resistance in cucumber (Cucumis sativus L.): Current progress and future prospects. Int. J. Mol. Sci. 2024, 25, 12726. [Google Scholar] [CrossRef]
  8. Thakur, R.P.; Mathur, K. Downy mildews of India. Crop Prot. 2002, 21, 333–345. [Google Scholar] [CrossRef]
  9. Abdelfatah, A.; Mazrou, Y.S.A.; Arafa, R.A.; Makhlouf, A.H.; El-Nagar, A. Control of cucumber downy mildew disease under greenhouse conditions using biocide and organic compounds via induction of the antioxidant defense machinery. Sci. Rep. 2025, 15, 11705. [Google Scholar] [CrossRef]
  10. Cohen, Y.; Rubin, A.E. Mating type and sexual reproduction of Pseudoperonospora cubensis, the downy mildew agent of cucurbits. Eur. J. Plant Pathol. 2012, 132, 577–592. [Google Scholar] [CrossRef]
  11. Cohen, Y.; Rubin, A.E.; Galperin, M. Host preference of mating type in Pseudoperonospora cubensis, the downy mildew causal agent of cucurbits. Plant Dis. 2013, 97, 292. [Google Scholar] [CrossRef]
  12. Rani, R.; Negi, P.; Sharma, S.; Jain, S. Occurrence of oosporic stage of Pseudoperonospora cubensis on cucumber, in Punjab, India: A first report. Crop Prot. 2022, 155, 105939. [Google Scholar] [CrossRef]
  13. Kikway, I.; Keinath, A.P.; Ojiambo, P.S. Field occurrence and overwintering of oospores of Pseudoperonospora cubensis in the Southeastern United States. Phytopathology 2022, 112, 1946–1955. [Google Scholar] [CrossRef]
  14. Runge, F.; Choi, Y.-J.; Thines, M. Phylogenetic investigations in the genus Pseudoperonospora reveal overlooked species and cryptic diversity in the P. cubensis species cluster. Eur. J. Plant Pathol. 2011, 129, 135–146. [Google Scholar] [CrossRef]
  15. Lebeda, A.; Křístková, E.; Sedláková, B. Pathotypes and races of Pseudoperonospora cubensis: Two concepts of virulence differentiation. Plant Pathol. 2024, 73, 2537–2547. [Google Scholar] [CrossRef]
  16. Thomas, A.; Carbone, I.; Choe, K.; Quesada-Ocampo, L.M.; Ojiambo, P.S. Resurgence of cucurbit downy mildew in the United States: Insights from comparative genomic analysis of Pseudoperonospora cubensis. Ecol. Evol. 2017, 7, 6231–6246. [Google Scholar] [CrossRef] [PubMed]
  17. Kozik, E.U.; Klosińska, U.; Call, A.D.; Wehner, T.C. Heritability and genetic variance estimates for resistance to downy mildew in cucumber accession Ames 2354. Crop Sci. 2013, 53, 177–182. [Google Scholar] [CrossRef]
  18. Sun, Z.; Yu, S.; Hu, Y.; Wen, Y. Biological control of the cucumber downy mildew pathogen Pseudoperonospora cubensis. Horticulturae 2022, 8, 410. [Google Scholar] [CrossRef]
  19. Call, A.D.; Criswell, A.D.; Wehner, T.C.; Klosinska, U.; Kozik, E.U. Screening cucumber for resistance to downy mildew caused by Pseudoperonospora cubensis (Berk. and Curt.) Rostov. Crop Sci. 2012, 52, 577–592. [Google Scholar] [CrossRef]
  20. Ojiambo, P.S.; Gent, D.H.; Quesada-Ocampo, L.M.; Hausbeck, M.K.; Holmes, G.J. Epidemiology and population biology of Pseudoperonospora cubensis: A model system for management of downy mildews. Annu. Rev. Phytopathol. 2015, 53, 223–246. [Google Scholar] [CrossRef]
  21. Bai, Z.; Yuan, X.; Cai, R.; Liu, L.; He, H.; Zhou, H.; Pan, J. QTL analysis of downy mildew resistance in cucumber. Prog. Nat. Sci. 2008, 18, 706–710. [Google Scholar]
  22. Pang, X.; Zhou, X.; Wan, H.; Chen, J. QTL mapping of downy mildew resistance in an introgression line derived from interspecific hybridization between cucumber and Cucumis hystrix. J. Phytopathol. 2013, 161, 536–543. [Google Scholar] [CrossRef]
  23. Yoshioka, Y.; Sakata, Y.; Sugiyama, M.; Fukino, N. Identification of quantitative trait loci for downy mildew resistance in cucumber (Cucumis sativus L.). Euphytica 2014, 198, 265–276. [Google Scholar] [CrossRef]
  24. Olfati, J.-A.; Samizadeh, H.; Peyvast, G.-A.; Khodaparast, S.A.; Rabiei, B. Dominant variance has an important role in downy mildew resistance in cucumber. Hortic. Environ. Biotechnol. 2011, 52, 422–426. [Google Scholar] [CrossRef]
  25. Van Vliet, G.J.A.; Meijsing, W.D. Relation in the inheritance of resistance to Pseudoperonospora cubensis Rost. and Sphaerotheca fuliginea Poll. in cucumber (Cucumis sativus L.). Euphytica 1977, 26, 793–796. [Google Scholar] [CrossRef]
  26. van Vliet, G.J.A.; Meysing, W.D. Inheritance of resistance to Pseudoperonospora cubensis Rost. in cucumber (Cucumis sativus L.). Euphytica 1974, 23, 251–255. [Google Scholar] [CrossRef]
  27. Zhang, S.P.; Liu, M.M.; Miao, H.; Zhang, S.Q.; Yang, Y.H.; Xie, B.Y.; Wehner, T.C.; Gu, X.F. Chromosomal mapping and QTL analysis of resistance to downy mildew in Cucumis sativus. Plant Dis. 2013, 97, 245–251. [Google Scholar] [CrossRef]
  28. Zhang, K.; Wang, X.; Zhu, W.; Qin, X.; Xu, J.; Cheng, C.; Lou, Q.; Li, J.; Chen, J. Complete resistance to powdery mildew and partial resistance to downy mildew in a Cucumis hystrix introgression line of cucumber were controlled by a co-localized locus. Theor. Appl. Genet. 2018, 131, 2229–2243. [Google Scholar] [CrossRef]
  29. Wang, Y.; Tan, J.; Wu, Z.; VandenLangenberg, K.; Wehner, T.C.; Wen, C.; Zheng, X.; Owens, K.; Thornton, A.; Bang, H.H.; et al. STAYGREEN, STAY HEALTHY: A loss-of-susceptibility mutation in the STAYGREEN gene provides durable, broad-spectrum disease resistances for over 50 years of US cucumber production. New Phytol. 2019, 221, 415–430. [Google Scholar] [CrossRef] [PubMed]
  30. Wang, Y.; VandenLangenberg, K.; Wehner, T.C.; Kraan, P.A.G.; Suelmann, J.; Zheng, X.; Owens, K.; Weng, Y. QTL mapping for downy mildew resistance in cucumber inbred line WI7120 (PI 330628). Theor. Appl. Genet. 2016, 129, 1493–1505. [Google Scholar] [CrossRef]
  31. Wang, Y.; VandenLangenberg, K.; Wen, C.; Wehner, T.C.; Weng, Y. QTL mapping of downy and powdery mildew resistances in PI 197088 cucumber with genotyping-by-sequencing in RIL population. Theor. Appl. Genet. 2018, 131, 597–611. [Google Scholar] [CrossRef] [PubMed]
  32. Szczechura, W.; Staniaszek, M.; Klosinska, U.; Kozik, E.U. Molecular analysis of new sources of resistance to Pseudoperonospora cubensis (Berk. et Curt.) Rostovzev in cucumber. Russ. J. Genet. 2015, 51, 974–979. [Google Scholar] [CrossRef]
  33. Berg, J.A.; Hermans, F.W.K.; Beenders, F.; Abedinpour, H.; Vriezen, W.H.; Visser, R.G.F.; Bai, Y.; Schouten, H.J. The amino acid permease (AAP) genes CsAAP2A and SlAAP5A/B are required for oomycete susceptibility in cucumber and tomato. Mol. Plant Pathol. 2021, 22, 658–672. [Google Scholar] [CrossRef]
  34. Berg, J.A.; Hermans, F.W.K.; Beenders, F.; Lou, L.; Vriezen, W.H.; Visser, R.G.F.; Bai, Y.; Schouten, H.J. Analysis of QTL DM4.1 for downy mildew resistance in cucumber reveals multiple subQTL: A novel RLK as candidate gene for the most important subQTL. Front. Plant Sci. 2020, 11, 569876. [Google Scholar] [CrossRef] [PubMed]
  35. Innark, P.; Panyanitikoon, H.; Khanobdee, C.; Samipak, S.; Jantasuriyarat, C. QTL identification for downy mildew resistance in cucumber using genetic linkage map based on SSR markers. J. Genet. 2020, 99, 81. [Google Scholar] [CrossRef]
  36. Li, L.; He, H.; Zou, Z.; Li, Y. QTL analysis for downy mildew resistance in cucumber inbred line PI 197088. Plant Dis. 2018, 102, 1240–1245. [Google Scholar] [CrossRef] [PubMed]
  37. Liu, X.; Lu, H.; Liu, P.; Miao, H.; Bai, Y.; Gu, X.; Zhang, S. Identification of novel loci and candidate genes for cucumber downy mildew resistance using GWAS. Plants 2020, 9, 1659. [Google Scholar] [CrossRef] [PubMed]
  38. Win, K.T.; Vegas, J.; Zhang, C.; Song, K.; Lee, S. QTL mapping for downy mildew resistance in cucumber via bulked segregant analysis using next-generation sequencing and conventional methods. Theor. Appl. Genet. 2017, 130, 199–211. [Google Scholar] [CrossRef]
  39. Barnes, W.; Epps, W. An unreported type to resistance to cucumber downy mildew. Plant Dis. Report. 1954, 38, 620. [Google Scholar]
  40. Jenkins, J.M., Jr. Downy mildew resistance in cucumbers. J. Hered. 1942, 33, 35–38. [Google Scholar] [CrossRef]
  41. Kłosińska, U. Genetyczne i Anatomiczne Podstawy Odporności Ogórka na Mączniaka Rzekomego (Pseudoperonospora cubensis Berk. et Curt.). Ph.D. Thesis, National Institute of Horticultural Research, Skierniewice, Poland, 2013. [Google Scholar]
  42. Call, A.D.; Criswell, A.D.; Wehner, T.C.; Ando, K.; Grumet, R. Resistance of cucumber cultivars to a new strain of cucurbit downy mildew. HortScience 2012, 47, 171–178. [Google Scholar] [CrossRef]
  43. VandenLangenberg, K.M. Studies on Downy Mildew Resistance in Cucumber (Cucumis sativus L.). Ph.D. Thesis, North Carolina State University, Raleigh, NC, USA, 2015. [Google Scholar]
  44. Caldwell, D.; Chan, E.; de Vries, J.; Joobeur, T.; King, J.; Reina, A.; Shetty, N. Methods and Compositions for Identifying Downy Mildew Resistant Cucumber Plants. U.S. Patent 8,809,622, 28 April 2011. [Google Scholar]
  45. Hammer, R.S.; Cohen, Y. Non-sikkim cucumber accessions resistant to downy mildew (Pseudoperonospora cubensis). Seeds 2025, 4, 8. [Google Scholar] [CrossRef]
  46. Chen, T.; Katz, D.; Ben Naim, Y.; Hammer, R.; Ben Daniel, B.H.; Rubin, A.E.; Cohen, Y. Isolate-dependent inheritance of resistance against Pseudoperonospora cubensis in cucumber. Agronomy 2020, 10, 1086. [Google Scholar] [CrossRef]
  47. Wehner, T.C.; Shetty, N.V. Downy mildew resistance of the cucumber germplasm collection in North Carolina field tests. Crop Sci. 1997, 37, 1331–1340. [Google Scholar] [CrossRef]
  48. Holmes, G.J.; Ojiambo, P.S.; Hausbeck, M.K.; Quesada-Ocampo, L.; Keinath, A.P. Resurgence of cucurbit downy mildew in the United States: A watershed event for research and extension. Plant Dis. 2015, 99, 428–441. [Google Scholar] [CrossRef]
  49. Ding, G.; Qin, Z.; Zhou, X.; Fan, J. RAPD and SCAR markers linked to downy mildew resistance genes in cucumber. Acta Bot. Boreali-Occident. Sin. 2007, 27, 1747–1751. [Google Scholar]
  50. Sharma, B.A.; Rana, R.S.; Lata, H.; Thakur, A.; Sharma, A. Mapping quantitative trait loci (QTLs) for resistance to downy mildew and powdery mildew in cucumber (Cucumis sativus L.). J. Plant Biochem. Biotechnol. 2025, 1–15. [Google Scholar] [CrossRef]
  51. Zhuo, D.; Zicheng, Z.; Yane, S.; Yahang, L.; Xiaobing, M.; Haonan, C. Molecular genetic basis of resistance to downy mildew in cucumber and melon. J. Plant Pathol. 2024, 106, 499–506. [Google Scholar] [CrossRef]
  52. Huang, S.; Li, R.; Zhang, Z.; Li, L.; Gu, X.; Fan, W.; Lucas, W.J.; Wang, X.; Xie, B.; Ni, P.; et al. The genome of the cucumber, Cucumis sativus L. Nat. Genet. 2009, 41, 1275–1281. [Google Scholar] [CrossRef]
  53. Jenkins, S.F., Jr.; Wehner, T.C. A system for the measurement of foliar diseases of cucumber. Cucurbit Genet. Coop. Rep. 1983, 6, 10–12. [Google Scholar]
  54. R Core Team. R: A Language and Environment for Statistical Computing; R Foundation for Statistical Computing: Vienna, Austria, 2023. [Google Scholar]
  55. Wickham, H. Data analysis. In ggplot2: Elegant Graphics for Data Analysis; Springer International Publishing: Berlin/Heidelberg, Germany, 2016; pp. 189–201. [Google Scholar]
  56. Clarke, E.; Sherrill-Mix, S.; Dawson, C. Ggbeeswarm: Categorical Scatter (Violin Point) Plots; R Package Version 0.7.2. 2023. Available online: https://CRAN.R-project.org/package=ggbeeswarm (accessed on 13 August 2025).
  57. Wilke, C. Cowplot: Streamlined Plot Theme and Plot Annotations for ‘ggplot2’; R Package Version 1.1.3. 2025. Available online: https://github.com/wilkelab/cowplot (accessed on 13 August 2025).
  58. Chiba, N.; Suwabe, K.; Nunome, T.; Hirai, M. Development of microsatellite markers in melon (Cucumis melo L.) and their application to major cucurbit crops. Breed. Sci. 2003, 53, 21–27. [Google Scholar] [CrossRef]
  59. Fukino, N.; Yoshioka, Y.; Kubo, N.; Hirai, M.; Sugiyama, M.; Sakata, Y.; Matsumoto, S. Development of 101 novel SSR markers and construction of an SSR-based genetic linkage map in cucumber (Cucumis sativus L.). Breed. Sci. 2008, 58, 475–483. [Google Scholar] [CrossRef]
  60. Danin-Poleg, Y.; Reis, N.; Tzuri, G.; Katzir, N. Development and characterization of microsatellite markers in Cucumis. Theor. Appl. Genet. 2001, 102, 61–72. [Google Scholar] [CrossRef]
  61. Horejsi, T.; Staub, J.E.; Thomas, C. Linkage of random amplified polymorphic DNA markers to downy mildew resistance in cucumber (Cucumis sativus L.). Euphytica 2000, 115, 105–113. [Google Scholar] [CrossRef]
  62. Tan, J.; Wang, Y.; Dymerski, R.; Wu, Z.; Weng, Y. Sigma factor binding protein 1 (CsSIB1) is a putative candidate of the major-effect QTL dm5.3 for downy mildew resistance in cucumber (Cucumis sativus). Theor. Appl. Genet. 2022, 135, 4197–4215. [Google Scholar] [CrossRef] [PubMed]
  63. Fazio, G.; Staub, J.E.; Chung, S.M. Development and characterization of PCR markers in cucumber. J. Am. Soc. Hortic. Sci. 2002, 127, 545–557. [Google Scholar] [CrossRef]
  64. Dar, A.A.; Mahajan, R.; Lay, P.; Sharma, S. Genetic diversity and population structure of Cucumis sativus L. by using SSR markers. 3 Biotech 2017, 7, 307. [Google Scholar] [CrossRef] [PubMed]
  65. Berg, J.A.; Appiano, M.; Santillán Martínez, M.; Hermans, F.W.K.; Vriezen, W.H.; Visser, R.G.F.; Bai, Y.; Schouten, H.J. A transposable element insertion in the susceptibility gene CsaMLO8 results in hypocotyl resistance to powdery mildew in cucumber. BMC Plant Biol. 2015, 15, 243. [Google Scholar] [CrossRef]
  66. Staub, J.E.; Chung, S.-M.; Fazio, G. Conformity and genetic relatedness estimation in crop species having a narrow genetic base: The case of cucumber (Cucumis sativus L.). Plant Breed. 2005, 124, 44–53. [Google Scholar] [CrossRef]
  67. Wang, Y. Genetic Architecture of Downy Mildew (Pseudoperonospora cubensis) Resistance in Cucumber (Cucumis sativus L.). Ph.D. Thesis, University of Wisconsin, Madison, WI, USA, 2017. [Google Scholar]
  68. Ren, Y.; Zhang, Z.; Liu, J.; Staub, J.E.; Han, Y.; Cheng, Z.; Li, X.; Lu, J.; Miao, H.; Kang, H.; et al. An integrated genetic and cytogenetic map of the cucumber genome. PLoS ONE 2009, 4, e5795. [Google Scholar] [CrossRef]
  69. Kõressaar, T.; Lepamets, M.; Kaplinski, L.; Raime, K.; Andreson, R.; Remm, M. Primer3_masker: Integrating masking of template sequence with primer design software. Bioinformatics 2018, 34, 1937–1938. [Google Scholar] [CrossRef]
  70. Van Ooijen, J. JoinMap®, 4.0. Software for the calculation of genetic linkage maps in experimental populations. Kyazma B.V.: Wageningen, The Netherlands, 2006.
  71. Kosambi, D.D. The estimation of map distances from recombination values. Ann. Eugen. 1944, 12, 172–175. [Google Scholar] [CrossRef]
  72. Li, Q.; Li, H.; Huang, W.; Xu, Y.; Zhou, Q.; Wang, S.; Ruan, J.; Huang, S.; Zhang, Z. A chromosome-scale genome assembly of cucumber (Cucumis sativus L.). GigaScience 2019, 8, giz072. [Google Scholar] [CrossRef] [PubMed]
  73. Wang, S.; Basten, C.; Zeng, Z. Windows QTL Cartographer, 2.5; Department of Statistics, North Carolina State University: Raleigh, NC, USA, 2012.
  74. Wang, Y.; Bo, K.; Gu, X.; Pan, J.; Li, Y.; Chen, J.; Wen, C.; Ren, Z.; Ren, H.; Chen, X.; et al. Molecularly tagged genes and quantitative trait loci in cucumber with recommendations for QTL nomenclature. Hortic. Res. 2020, 7, 3. [Google Scholar] [CrossRef]
  75. Yu, J.; Wu, S.; Sun, H.; Wang, X.; Tang, X.; Guo, S.; Zhang, Z.; Huang, S.; Xu, Y.; Weng, Y.; et al. CuGenDBv2: An updated database for cucurbit genomics. Nucleic Acids Res. 2022, 51, D1457–D1464. [Google Scholar] [CrossRef]
  76. Polat, İ.; Baysal, Ö.; Mercati, F.; Kitner, M.; Cohen, Y.; Lebeda, A.; Carimi, F. Characterization of Pseudoperonospora cubensis isolates from Europe and Asia using ISSR and SRAP molecular markers. Eur. J. Plant Pathol. 2014, 139, 641–653. [Google Scholar] [CrossRef]
  77. Nowicki, M.; Hadziabdic, D.; Trigiano, R.N.; Boggess, S.L.; Kanetis, L.; Wadl, P.A.; Ojiambo, P.S.; Cubeta, M.A.; Spring, O.; Thines, M.; et al. “Jumping Jack”: Genomic microsatellites underscore the distinctiveness of closely related Pseudoperonospora cubensis and Pseudoperonospora humuli and provide new insights into their evolutionary past. Front. Microbiol. 2021, 12, 686759. [Google Scholar] [CrossRef]
  78. Staub, J.E.; Meglic, V. Molecular genetic markers and their legal relevance for cultivar discrimination: A case study in cucumber. HortTechnology 1993, 3, 291–300. [Google Scholar] [CrossRef]
  79. Miao, H.; Zhang, S.; Wang, X.; Zhang, Z.; Li, M.; Mu, S.; Cheng, Z.; Zhang, R.; Huang, S.; Xie, B.; et al. A linkage map of cultivated cucumber (Cucumis sativus L.) with 248 microsatellite marker loci and seven genes for horticulturally important traits. Euphytica 2011, 182, 167–176. [Google Scholar] [CrossRef]
  80. Greeff, C.; Roux, M.; Mundy, J.; Petersen, M. Receptor-like kinase complexes in plant innate immunity. Front. Plant Sci. 2012, 3, 202. [Google Scholar] [CrossRef]
  81. Pandian, B.A.; Sathishraj, R.; Djanaguiraman, M.; Prasad, P.V.V.; Jugulam, M. Role of cytochrome P450 enzymes in plant stress response. Antioxidants 2020, 9, 454. [Google Scholar] [CrossRef] [PubMed]
  82. Narváez-Barragán, D.A.; Tovar-Herrera, O.E.; Guevara-García, A.; Serrano, M.; Martinez-Anaya, C. Mechanisms of plant cell wall surveillance in response to pathogens, cell wall-derived ligands and the effect of expansins to infection resistance or susceptibility. Front. Plant Sci. 2022, 13, 969343. [Google Scholar] [CrossRef] [PubMed]
  83. Chakraborty, P.; Biswas, A.; Dey, S.; Bhattacharjee, T.; Chakrabarty, S. Cytochrome P450 gene families: Role in plant secondary metabolites production and plant defense. J. Xenobiotics 2023, 13, 402–423. [Google Scholar] [CrossRef] [PubMed]
  84. Cheng, W.; Wang, Z.; Xu, F.; Yang, Y.; Fang, J.; Wu, J.; Pan, J.; Wang, Q.; Xu, L. Mapping QTL and identifying candidate genes for resistance to brown stripe in highly allo-autopolyploid modern sugarcane. Horticulturae 2025, 11, 922. [Google Scholar] [CrossRef]
  85. Zhao, Y.; Su, C. Mapping quantitative trait loci for yield-related traits and predicting candidate genes for grain weight in maize. Sci. Rep. 2019, 9, 16112. [Google Scholar] [CrossRef]
  86. Yun, P.; Zhang, C.; Ma, T.; Xia, J.; Zhou, K.; Wang, Y.; Li, Z. Identification of qGL4.1 and qGL4.2, two closely linked QTL controlling grain length in rice. Mol. Breed. 2024, 44, 11. [Google Scholar] [CrossRef] [PubMed]
Figure 1. Integrated map of cucumber resistance loci to Pseudoperonospora cubensis (PC) reported in this study and previous studies (2007–2020). Chromosome layout follows the convention used by Liu et al. [37], based on the Cucumis sativus ‘Chinese Long’ reference genome v2.0 [52]. QTLs for PC resistance detected in this study are shown as colored blocks Agronomy 15 02633 i001, whereas additional QTLs from other linkage mapping studies are also indicated as blocks accompanied by their respective citations in the legend [21,22,23,27,28,30,31,32,35,36,38,43,44,49]. Vertical lines mark the association signals reported by Liu et al. [37] using GWAS. Physical positions are given in Mb.
Agronomy 15 02633 g001
Figure 2. Response of cucumber accessions under natural infection with Pseudoperonospora cubensis in field trials at Skierniewice (NIHR) during 2021–2024. Bars show yearly mean DSI ± SE (n = 3 plots). Disease severity was scored on a 0 to 9 scale (0 = no visible symptoms; 9 = >90% of the infected leaf area).
Agronomy 15 02633 g002
Figure 3. Plants of the resistant accession PI 197085 under natural infection with Pseudoperonospora cubensis in the field. Insets: (top-right)—tiny necrotic spots on the upper leaf surface; (bottom-right)—no sporulation on the lower surface.
Agronomy 15 02633 g003
Figure 4. Comparative field response of cucumber accessions to natural infection by Pseudoperonospora cubensis in field trials at Skierniewice (2024).
Agronomy 15 02633 g004
Figure 5. Distribution of downy mildew disease severity caused by Pseudoperonospora cubensis (PC) in the F2 population derived from PI 197085 × PI 175695. Disease severity was scored on a 0 to 9 scale (0 = no visible symptoms; 9 = >90% of the infected leaf area) 10 days after inoculation with PC. Bars indicate the number of plants in each disease class. The inset boxplot illustrates the distribution of disease scores for the resistant parent PI 197085 (green, DSI = 1.4; n = 20) and susceptible parent PI 175695 (beige; DSI = 8.3; n = 20), evaluated under the same controlled conditions. Boxes indicate interquartile ranges (Q1–Q3), whiskers indicate data ranges, dots represent individual plant scores, and triangles denote mean DSI per parent.
Agronomy 15 02633 g005
Figure 6. Genetic linkage map of the cucumber F2 population derived from PI 197085 × PI 175695, comprising 164 molecular markers assigned to seven linkage groups (LG1-LG7), corresponding to the seven cucumber chromosomes. Orange bars indicate the positions and 1-LOD confidence intervals of the five QTLs associated with resistance to Pseudoperonospora cubensis detected in this study.
Agronomy 15 02633 g006
Table 1. Summary of marker distribution and genetic map characteristics across seven linkage groups in the F2 population derived from the cross PI 197085 (R) × PI 175695 (S).
Linkage GroupCorresponding ChromosomeMarker
Loci
Map Length (cM)Mean Inter-Marker Distance (cM) *
LG111778.624.91
LG2215107.127.65
LG3321173.648.68
LG4416103.246.88
LG554292.822.26
LG6625150.286.26
LG772892.433.42
Total-164798.14-
Average-23.4114.025.43
* Average distance refers to the mean genetic distance between adjacent markers within each linkage group.
Table 2. Summary of quantitative trait loci (QTL) for resistance to Pseudoperonospora cubensis (PC) detected in the F2 population of cucumber derived from PI 197085 × PI 175695.
QTLChrPeak (cM)LOD ValueSignificant Loci1-LOD Support IntervalAEDER2
(%)
Left MarkerLeft
Position
Right MarkerRight
Position
dm2.1299.017.78SSR21276-95.6-101.2−0.8440.12714.7
dm3.1317.019.78SSR15419SSR2025113.9SSR0535521.2−1.081−0.22414.0
dm4.1477.016.60SSR17911-68.2SSR0464979.0−0.823−0.0899.8
dm4.2484.017.14SSR29712, CsDM4-006CsDM15580.4SSR1542088.5−0.877−0.09110.4
dm5.1529.015.01SSR18593SSR1116721.4OPX06_85032.6−0.716−0.2295.5
Positions are given in centimorgans (cM) on the genetic linkage map. LOD = logarithm of odds; R2 = proportion of phenotypic variance explained. Additive (AE) and dominant (DE) effects refer to the contribution of the PI 197085 alleles.
Table 3. Summary of QTL intervals, gene content, and functional categories of selected candidates.
QTLChrInterval (Mb)Total GenesAnnotated GenesRepresentative Functional Categories
dm2.1222.06–22.8512798Transcription factors (WRKY, NAC), receptor-like kinases (incl. LYK2), NLR-like proteins, membrane transporters (ABC, YSL), vesicle trafficking (SNARE), redox/stress enzymes, protein regulation (RING E3, BTB/POZ)
dm3.133.22–5.04199161Transcription factors (WRKY, ERF, MYB, bHLH), vacuolar ion transport), proteasome regulator, subtilisin-like proteases, cell-wall modification (pectin lyases, COBRA-like), ubiquitin-related proteins.
dm4.1417.71–17.831210Ethylene-responsive transcription factor (ERF014), receptor-like kinases (two RLKs), redox/thiol enzymes, and ubiquitin pathway components
dm4.2418.20–18.552721Receptor-like kinases (PRK4, LRK10L2, LR10-like), transcriptional regulators (VOZ1-like, MADS-box 23-like), glycosyltransferases, cytochrome P450s, sterol/brassinosteroid-related enzymes (incl. cytochrome P450), redox/electron-transfer components (NADH–cytochrome b5 reductase)
dm5.155.74–11.97359271Resistance proteins (N-like), receptor-like kinases (PSKR1, ERL1-like, cysteine-rich RLK), diverse transcription factors, vesicle trafficking, cell wall modification, redox enzymes, epigenetic regulators, RNA silencing, transporters
Disclaimer/Publisher’s Note: The statements, opinions and data contained in all publications are solely those of the individual author(s) and contributor(s) and not of MDPI and/or the editor(s). MDPI and/or the editor(s) disclaim responsibility for any injury to people or property resulting from any ideas, methods, instructions or products referred to in the content.