Article

Regional Variation of Water Extractable Carbon and Relationships with Climate Conditions and Land Use Types

1
Department of Environmental Science and Technology, School of Human Settlement and Civil Engineering, Xi’an Jiaotong University, Xi’an 710049, China
2
State Key Laboratory of Loess Science, Institute of Earth Environment, Chinese Academy of Sciences, Xi’an 710061, China
*
Author to whom correspondence should be addressed.
Agronomy 2025, 15(11), 2623; https://doi.org/10.3390/agronomy15112623 (registering DOI)
Submission received: 7 October 2025 / Revised: 11 November 2025 / Accepted: 13 November 2025 / Published: 15 November 2025
(This article belongs to the Section Soil and Plant Nutrition)

Abstract

Water-extractable carbon is thought to originate from labile organic carbon pools and has been used as an active carbon indicator for soil evaluation in numerous studies. This study aims to explore the regional variation patterns of water-extractable organic carbon (WEOC) and the environmental impact factors associated with it. It examines the variability of WEOC under different climatic conditions and land use types, including grasslands and woodlands, thereby enhancing our understanding of WEOC. We measured the WEOC in the surface soil layers (0–10 cm) of woodlands and grasslands in arid and semi-arid regions. Additionally, we analyzed the effects of varying climatic conditions and land use types on WEOC based on data from literature research. WEOC distribution patterns diverged spatially from soil organic carbon (SOC). WEOC fractions decreased with increasing precipitation, and surface soil WEOC accumulation was observed in arid regions. This accumulation was more pronounced in forest-land, resulting in a more marked divergence in WEOC concentrations between woodlands and grasslands in arid regions. We inferred that the inconsistent correlation between WEOC and SOC across regions arises from their distinct distribution patterns along environmental humidity gradients. Owing to the climate sensitivity of WEOC, its surface soil accumulation in arid areas may increase the vulnerability of soil ecosystems, rendering them more susceptible to environmental disturbances. Such susceptibility could drive organic carbon loss and soil quality degradation. These findings hold promise for improving our understanding of WEOC dynamic, and will also give insight into refining soil carbon balance models and soil management strategies to address environmental changes.

1. Introduction

SOC constitutes a critical component of soil and ecosystem management. However, detecting subtle changes in total SOC remains challenging, prompting efforts to utilize SOC subpools as more sensitive indicators of carbon stock dynamics [1]. SOC comprises a heterogeneous mixture [2], containing a substantial proportion of labile organic carbon components [3,4,5]. These components possess distinct stabilities and exhibit differential sensitivities to environmental factors [6,7]. Consequently, ecosystems or soil types with varying labile organic carbon levels may demonstrate divergent responses to climate change, which could alter soil carbon source–sink dynamics [8,9,10,11]. A better understanding of the regional variations and influencing factors of soil active organic carbon fractions is key to accurately assessing soil carbon balance and ecological management in the context of global change.
Dissolved organic carbon is the most active organic carbon component in the soil [12]. WEOC is regarded as potential dissolved organic matter (DOM) and is commonly used to characterize and determine the concentration and flux of DOM [12,13]. Due to the considerable variation in WEOC content across ecosystems [14,15,16], it is commonly used as an indicator for soil quality evaluation [15,17,18,19,20]. The extractable organic carbon is typically extracted using aqueous solutions, including high-ionic-strength aqueous solutions, e.g., K2SO4, CaCl2, KCl or distilled water, at different temperatures [18,21,22,23]. Numerous studies have investigated the composition of WEOC and its responses to land use and management practices based on optical and chemical properties. However, there is still limited discussion regarding the distribution patterns and environmental implications. This knowledge gap hinders precise understanding of soil carbon balance mechanisms.
Due to the heterogeneity and interaction of the soil–environment system [24], the distribution of soil carbon and environmental response processes in nature are complex and varied. Differing responses of soil change are based on unique site attributes, like management, soil type and weather [25]; thus, the changes in extractable organic matter in surface soil at different sites may not be uniform [18]. Research has indicated that environmental factors exert a significant influence on WEOC [26], with marked variability in WEOC extraction efficiencies observed across soil types [13]. Studies demonstrate that dry environments exhibit elevated WEOC content [27], particularly following drought periods or in low-precipitation years [28,29,30]. Even within wetland, the WEOC/TOC content is significantly lower in peatlands compared to wet meadows [31]. This type of change in WEOC diverges from the positive correlation between SOC and precipitation [32,33], implying distinct storage and fluctuation patterns for WEOC in arid versus humid regions. The mechanisms driving these divergent responses remain unresolved, because SOC contains a mixture of carbon compounds with varying cycling rates, which drive turnover and persistence of soil carbon [34]. And the sensitivity of carbon decomposition to soil temperature and moisture is widely recognized as a significant source of uncertainty in predicting soil carbon cycling [6,35,36]. Given differential sensitivity to warming in dry or wet environments [37], such variability may regionally affect soil carbon emissions under projected global climate fluctuations. Systematic quantification of WEOC at regional or biotic community scales, coupled with mechanistic studies of its changes, would enhance spatial extrapolation models and refine predictions of soil carbon–climate feedback.
This study aimed to advance understanding of the regional variation in WEOC under varying climate regimes and land uses, with a focus on grasslands and forests. We hypothesized that climatic aridity or humidity would differentially influence WEOC dynamics under natural in situ conditions, with land use type mediating these effects. To address methodological inconsistencies in extractant selection across studies, this study focused on WEOC extracted with pure water. Due to the lack of comparable databases currently, samples extracted with pure water under room temperature conditions were assumed comparable for cross-study analysis. The measured data from Xi’an was incorporated with the literature data to form a dataset including information on geographic location, vegetation, land use, soil carbon and climate. We compared the regional variations in WEOC across different land use types and climate gradients. While we sought to characterize geographical variations in WEOC–climate relationships, interpretations remain preliminary owing to the dataset limitations. Furthermore, owing to heterogeneity in soil layer thickness across soil types and variability in reported soil depths across studies, soil horizon layers were not used in this study, and we mainly focused the analysis on the 0–10 cm layer.

2. Materials and Methods

2.1. The Databases

The referenced WEOC data were collected from published literature that clearly described research site characteristics, vegetation, experimental design, sample depth, extraction protocols, and data results (Figure 1). Studies reporting organic carbon extracted from natural (non-agricultural) soils using water at 20 °C or ambient room temperature were included. Data were stratified by land use into woodland and grassland categories. Studies with insufficient data were excluded from the analysis, and the surface litter layer was not considered in the topsoil analyses. Although research has primarily focused on forest soils, there have also been some studies on grasslands and wetlands, albeit in smaller quantities. In cases where multiple data results were reported in the literature, the average value was used to represent a specific land use type at a particular site. There was study-quantified C lability using the labile:non-labile C ratio [38]. In this study, we use the WEOC fraction within total SOC as a proxy for C lability. The fraction of WEOC in SOC was calculated to determine the relative concentration of WEOC. Where site-specific climatic data were missing from the literature, mean annual climatic conditions were derived from a publicly accessible global climate database with major locations worldwide [39].

2.2. Sites and Soil Collection

Soil samples were collected from five woodlands and three grasslands in Xi’an, China (107°40′–109°49′ N, 33°42′–34°45′ E). These natural parks are located in different areas of the city, and their environmental conditions have been maintained for at least 20 years. The sample sites were carefully selected to avoid human activity and excessive human interference. The sites were flat, with no obvious topographic changes, and had uniform vegetation. The woodlands primarily consisted of pine, poplar, and ginkgo trees. The grassland mainly comprised Zoysia japonica, Ophiopogon japonicus, and Bermuda grass.
Sampling was conducted monthly from September 2018 to August 2019 to minimize seasonal variability and derive annual averages. At each sampling site, three adjacent parallel sampling points were randomly selected, and soil cores were collected using a 3 cm diameter auger. The soil cores from each site were subdivided into 0–5 cm and 5–10 cm depth increments, homogenized, and combined to form one composite sample per depth increment. In total, 50 composite samples were collected from woodlands and 33 from grasslands. Samples were sealed in sterile Whirl-Pak bags (Nasco, WI, USA), transported on ice and stored at −20 °C until laboratory analysis.

2.3. Soil Processing

Small stones and plant residues were manually removed after the samples were air-dried. The samples were ground with an agate mortar and sieved through a 2 mm sieve. The samples were acidified to remove the inorganic carbon. One part of each sample was dried at 105 °C for 3 h for SOC analysis, and one part was prepared for WEOC extraction. Different drying temperatures might have affected the measurement of SOC due to stimulated microbial activity or chemical processes [41,42]. This could lead to an underestimation of SOC, resulting in an overestimation of WEOC fraction. Due to the lack of estimates for SOC loss during the sample drying process in the literature data, this study did not consider the differences and uncertainties in SOC measurements caused by drying temperature. WEOC was extracted according to the method described by Ghani et al. [43]. We optimized the extraction conditions by considering the low background SOC content in the study area and the large sample mass for extraction. Deionized water (200 mL) was added to 50 g of each sample, which was then shaken and incubated in a 20 °C water bath for 60 min. The supernatant was filtered through a 0.45 μm cellulose nitrate membrane (Whatman, MI, USA) filter after centrifugation at 4000 rpm. The extract was freeze-dried for 48 h to remove the water. The prepared samples were determined using elementary C analysis with combustion at 980 °C in a Vario EL III analyzer (Elementar, Frankfurt, Germany). Approximately 20 mg of each prepared sample was weighed in tin vessels and automatically loaded into the combustion oven at 980 °C. The CO2 gas formed was measured using a thermal conductivity detector (TCD). The standard deviations were less than 0.4%, both for the working standards and duplicate samples. The sample analysis was performed at the Institute of Earth Environment, Chinese Academy of Sciences.

2.4. Data Analysis

The carbon content of the extract was converted to WEOC concentration in the soil based on the sample mass. One-way analysis of variance was used to analyze the differences in soil carbon between the 0–5 and 5–10 cm depths. Normality of SOC and WEOC was evaluated using the Kolmogorov–Smirnov and Shapiro–Wilk test, respectively. Subsequent correlation analyses employed Pearson or Spearman methods, depending on data distribution. The relationships between SOC and WEOC fractions were examined using linear regression. Statistical analysis of the data was conducted using R software (4.2.2).
To evaluate climatic controls on WEOC distribution, soils were categorized into classes. In the study, the climate condition grouping is not strictly based on the thresholds of the global climate classification; it is simply grouped according to mean annual temperature (MAT) and mean annual precipitation (MAP) of tropical, subtropical and temperate regions. Three MAT classes (0–10 °C, 10–20 °C, 20–30 °C) and four MAP classes (0–500 mm, 500–1000 mm, 1000–2000 mm, and >2000 mm) were categorized. This stratification enabled systematic analysis of WEOC variability across the hydrothermal gradient.

3. Results

3.1. Differences in WEOC Between Woodland and Grassland Land Use Types

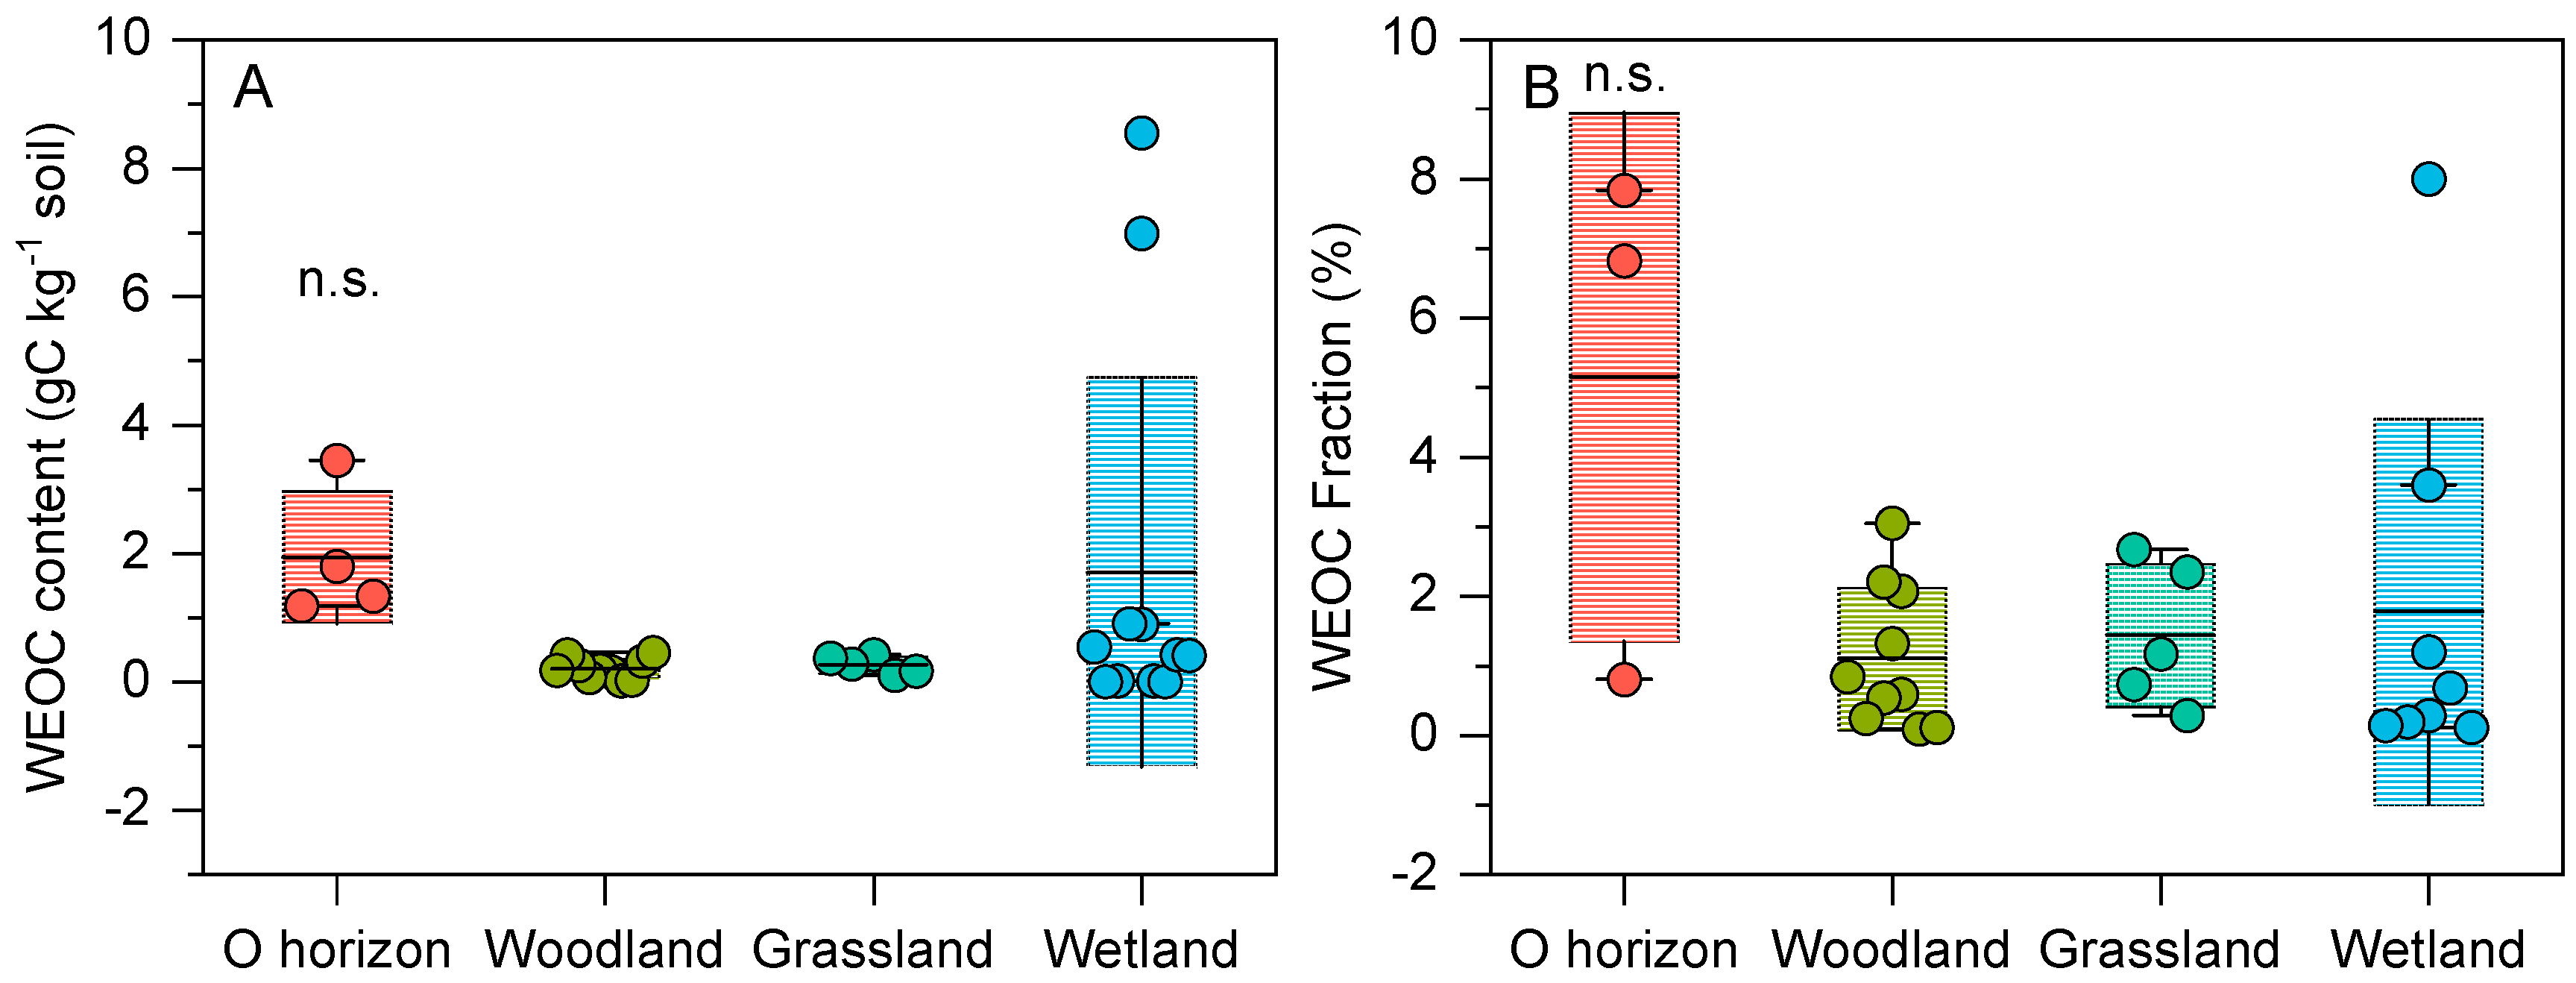
Analysis of literature-derived data revealed marginally higher WEOC content in grassland surface soil (0–10 cm; 0.11–0.43 gC kg−1 soil) compared to woodlands (0.01–0.45 gC kg−1 soil), though the difference was not significant. In forest ecosystems, WEOC content in the O horizon (organic layer) was relatively high, ranging from 1.18 to 3.45 gC kg−1 soil. However, no significant differences were observed when comparing with woodlands, grasslands, or wetlands (Figure 2A). Overall, WEOC fractions in the O horizons in woodlands were the highest, accounting for approximately 5.15%. The average WEOC fraction in woodlands was lower than that in grasslands and wetlands, though without statistical significance (Figure 2B). Owing to dataset constraints, correlation analyses between WEOC and SOC were restricted to forest data (no significant correlation).
Regional variation patterns of WEOC fractions showed moderate negative correlations with the precipitation-to-temperature (P/T) ratio (ρ = −0.53). WEOC fractions exhibited progressive declines with increasing precipitation across temperate regions gradients. For instance, in temperate grasslands, WEOC fractions decreased by 52.6% in humid regions (MAP > 2000 mm) compared to relatively drier regions (500–1000 mm) (Online Resource 2). Under the same climatic conditions, with a MAT of 10–20 °C and a MAP of 500–1000 mm, WEOC fractions in woodlands were 23.95% lower than those in grasslands.

3.2. WEOC of Xi’an Nature Park

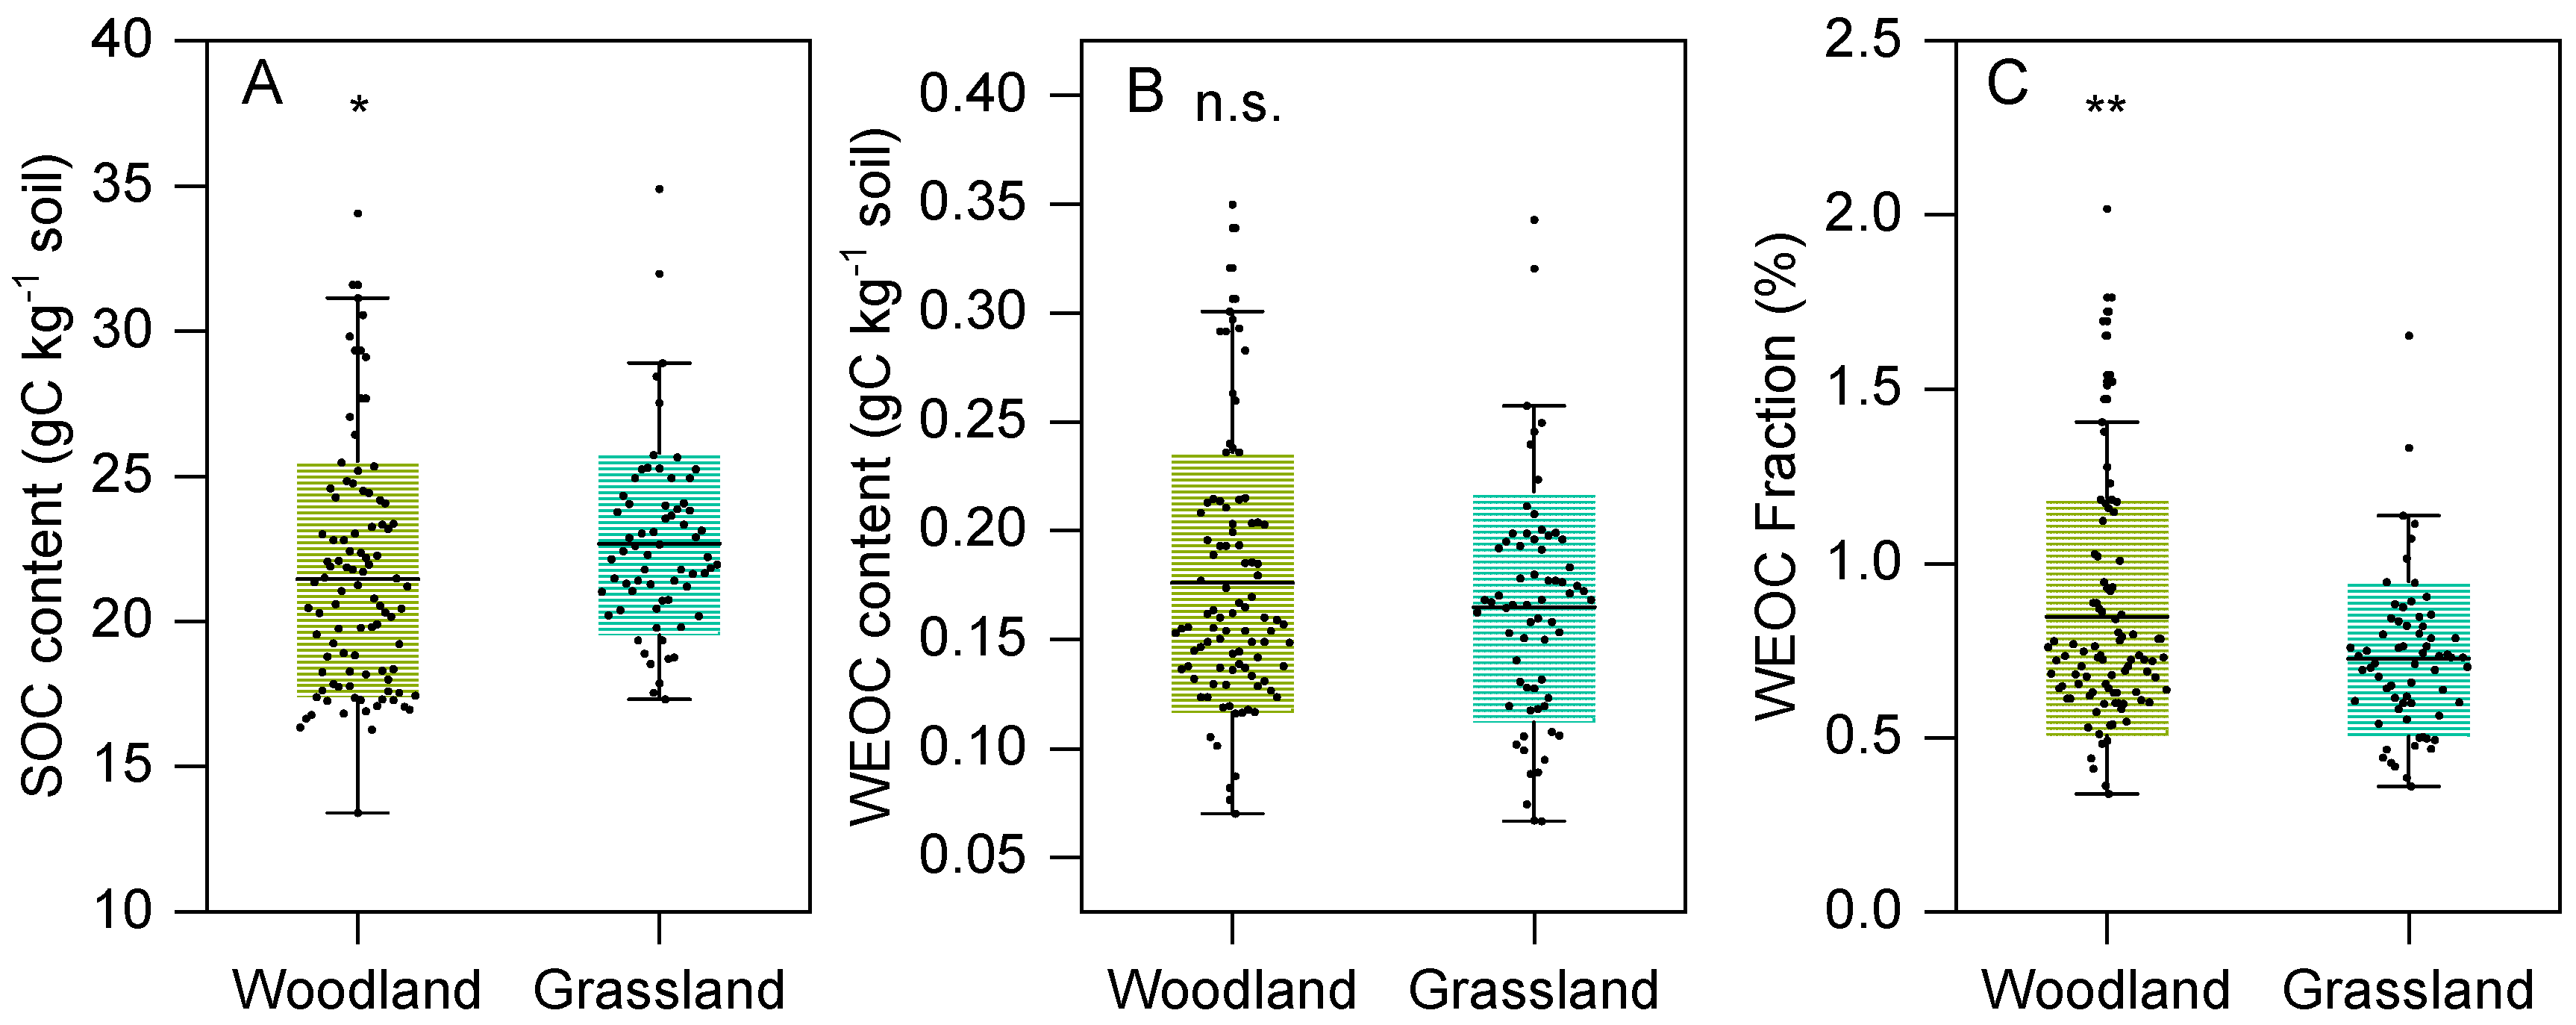
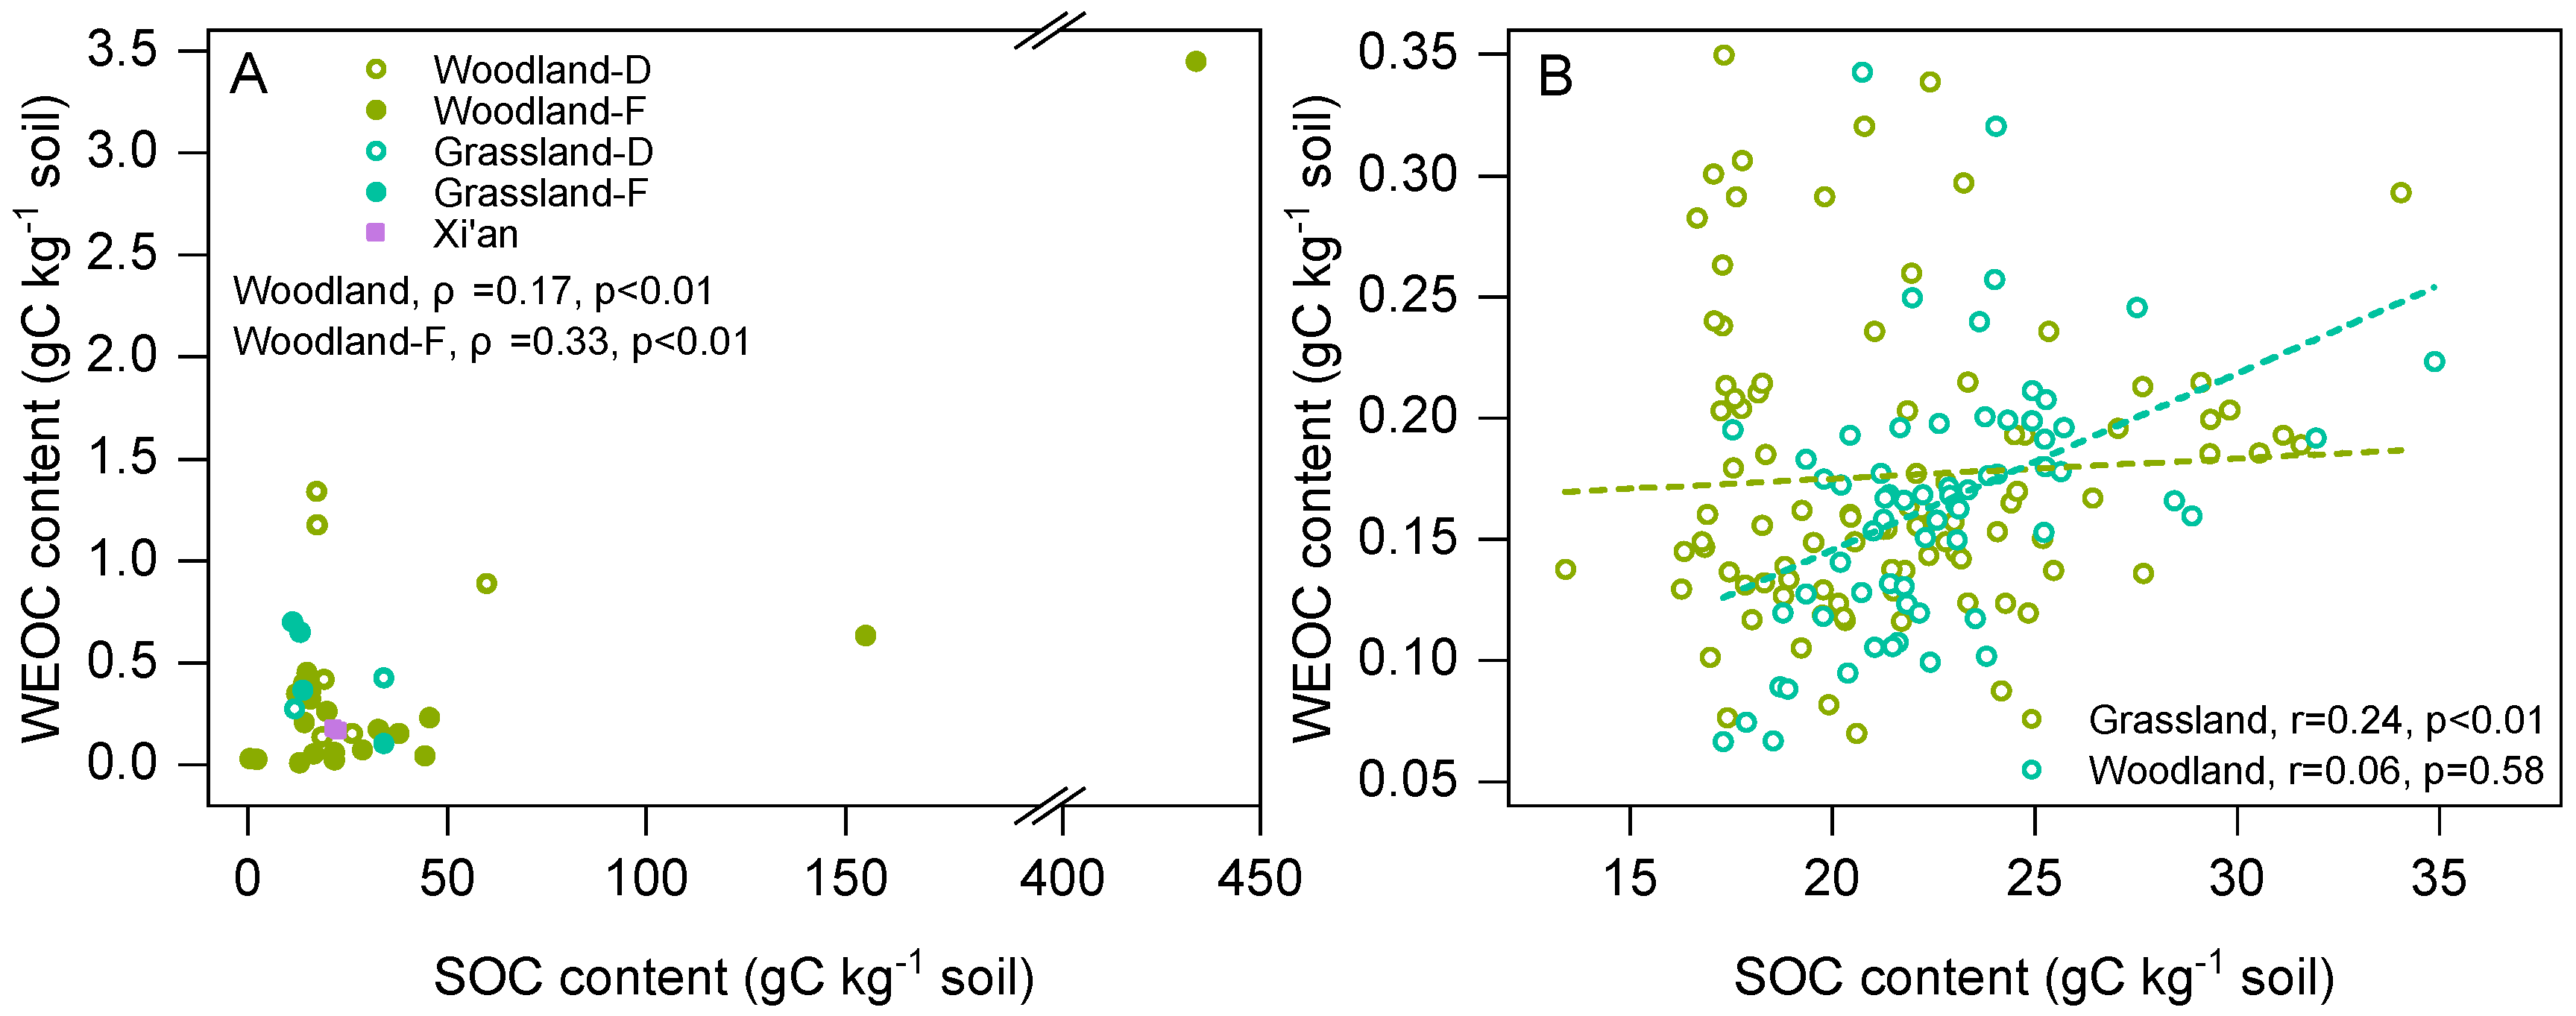
Surface soils (0–10 cm) in Xi’an grasslands exhibited significantly higher SOC content compared to woodlands (p < 0.05), whereas WEOC contents was lower in grasslands (Figure 3). No significant correlation was observed between WEOC and SOC in either ecosystem (|r| ≤ 0.3; Figure 4). Despite comparable WEOC contents between land use types, the WEOC fraction was significantly higher in woodlands (0.85%) compared to grasslands (0.73%) (p < 0.01).

4. Discussion

4.1. Influence of Climatic Conditions on WEOC

No correlation was observed between WEOC and SOC in Xi’an in both woodlands and grasslands (Figure 4). Spearman’s correlation analysis of literature-derived data for woodlands also did not reveal any significant correlation. This is different from the previous studies reporting positive WEOC–SOC correlation in other regions [14,27,44]. We inferred it is because WEOC was obtained by extracting dissolved organic matter from the soil using aqueous solutions. Therefore, the inconsistency in the correlation between WEOC and SOC may be related to regional differences in environmental conditions, especially the impact of humidity differences.
There remains a lack of consensus on whether environmental humidity will affect WEOC. There are studies that indicated the significant differences in WEOC content among sampling points with varying soil water conditions. Some studies found that relatively dry soil environments tend to have lower WEOC, like lower WEOC in arid areas or locations far from water, than in those closer to water or humid areas [37,44,45]. And in a study on red pine plantations, a decrease in WEOC levels when rain exclusion was implemented was observed [46]. While other studies have also observed opposite changing relationship between WEOC and soil moisture. For example, Lu et al. [47] discovered a negative correlation between WEOC and soil moisture in alpine grasslands in northern Tibet. A study conducted by Kalisz et al. [48] on grassland areas within peatlands found drainage contributed to the increase in hot water-extractable C. A study on high arctic soils under tundra vegetation conducted by Szymański’s group [27] revealed that in surface horizons of soils covered with wet moss, they contained the lowest proportion of WEOC to total SOC; although Cincotta et al. [49] found no significant difference in the WEOC between riparian soils and hillslope soils within a forest. Collectively, these studies suggest that surface soil WEOC is influenced by environmental humidity, though the directionality of this relationship remains inconsistent.
Global soil moisture is generally positively correlated with precipitation [50]. In this study, annual climatic averages were used to represent aridity or humidity gradients to further analyze the impact of environmental humidity on WEOC distribution. When stratifying WEOC by MAT and MAP, a progressive decline in WEOC fractions was observed with increasing precipitation across both cold and temperate regions (Online Resource 2). However, it is important to note that the dataset was limited, and the relationship was not particularly strong. In temperate regions, the WEOC fraction reduced by 52.6% in humid grassland (MAP > 2000 mm), compared with relatively drier grassland (Online Resource 2). This distribution contrasts sharply with SOC dynamics, which typically show strong positive correlations with precipitation [32], particularly in surface layers of the soil [33]. Intriguingly, we observed a moderate negative correlation between WEOC fraction and the precipitation-to-temperature (P/T) ratio (ρ = −0.53) in the 10 cm surface layers. The moderate negative correlation in horizontal space is consistent with the reports on high WEOC in arid environments. We inferred that it may be due to the different distribution patterns of WEOC and SOC on the environmental humidity gradient, which leads to inconsistent correlation between the two in different regions.
No significant correlation was observed between WEOC and soil moisture in Xi’an. However, the combination of a low P/T ratio and a relatively high WEOC fraction aligns with the moderately negative correlation identified between WEOC fraction and P/T ratios in horizontal spatial analyses. The absence of local-scale correlations may arise from the limited rainfall in the study area. Drought and low rainfall may inhibit the migration and transformation of WEOC into deeper layers, leading to the accumulation of WEOC in the soil of upper layer, owing to the influence of evaporation. Root exudates and soil microbial biomass would increase significantly in arid environments [51,52]. When extraction process leads to the death of soil microorganisms and a reduction in organic chemical conversion [53], it may cause the co-accumulation of these additional plant- and microbial-derived WEOC components. The significant accumulation of 13C in extractable organic carbon also indicated that dead microorganisms made a substantial contribution [51]. Consequently, although there may not be a significant difference in the total carbon content between arid and normal soils, a higher extractable organic carbon content in arid soils could be observed [21,22]. Our meta-analysis of literature data (P/T range: 35.24–228.58) classified Xi’an (P/T = 39.31) at the arid margin of humid gradients. Unlike forest datasets showing no significant difference in WEOC between top 5 cm and upper 5–10 cm, Xi’an exhibited significantly higher WEOC contents in the top 5 cm of woodlands and grasslands (p < 0.05). This suggests that aridity-driven surface accumulation modifies WEOC dynamics relative to humid environments. The relatively higher WEOC levels during low-rainfall years [30], along with the minimal differences in WEOC fraction compared to WEOC content among wetland, woodland, and grassland systems in surface soil (with no significant differences) (Figure 2), further indicate that humid environments do not necessarily result in an increased WEOC fraction.

4.2. Influence of Land Use Type on WEOC

Land use type, whether woodlands or grasslands, can influence WEOC content. On average, WEOC fractions in the 10 cm surface layers were lower in woodlands than in grasslands (Figure 2B). This may be related to the systematic characteristics of woodlands and grasslands. Woodlands typically have a layer of vegetation residue covering the soil, whereas grasslands contribute a significant amount of carbon input through root systems. Root carbon plays a crucial role in SOC accumulation [54]. Despite woody plants possessing greater root mass and density than herbaceous plants, their underground transport of assimilated carbon is lower [55]. Furthermore, root exudation rates decline with plant age [56], potentially exacerbating this contrast. The higher alkyl-C/O-alkyl-C ratio found in forest soils, in contrast to grassland soils, suggests a greater presence of recalcitrant substances in forest SOC and a reduction in labile organic carbon [57,58]. Analysis of the literature data indicated that WEOC fractions in grasslands are only marginally higher than that in woodlands, and the difference is not significant.
Contrary to literature data, the WEOC fraction in woodlands at Xi’an Natural Park was significantly higher than in grasslands (Figure 3C), which may be linked to the region’s arid climatic conditions. Compared to humid systems, vegetation in arid environments exhibits greater underground biomass allocation. Root hydraulic redistribution in trees enhances water retention in upper soil layers during dry periods [59], and facilitate upward moisture transport, enabling hydrologic translocation of labile organic carbon to surface horizons. Consequently, despite comparable soil moisture levels between woodlands and grasslands in Xi’an, WEOC fractions were markedly elevated in woodlands (p < 0.01). This aligns with findings from the arid Loess Plateau regions north of Xi’an, where Wang et al. [60] reported higher K2SO4-extracted carbon in woodlands. Conversely, in the humid southern Qinling Mountains, Zhang et al. [6] observed greater KCl-extracted carbon in grasslands. These contrasting WEOC dynamics indicated distinct patterns between arid and humid regions. Furthermore, the rates of increase in WEOC in woodlands were slower, and seasonal fluctuations in the upper 5–10 cm layer were less pronounced (coefficient of variation, CVwoodland = 0.16, CVgrassland = 0.23; no significant difference), indicating greater stability in woodlands during seasonal droughts. We inferred that the intense evaporation and root-mediated hydraulic redistribution in arid environments jointly promote surface WEOC accumulation in forest soil via upward moisture flux, resulting in better stability and greater differences from grassland.

5. Conclusions

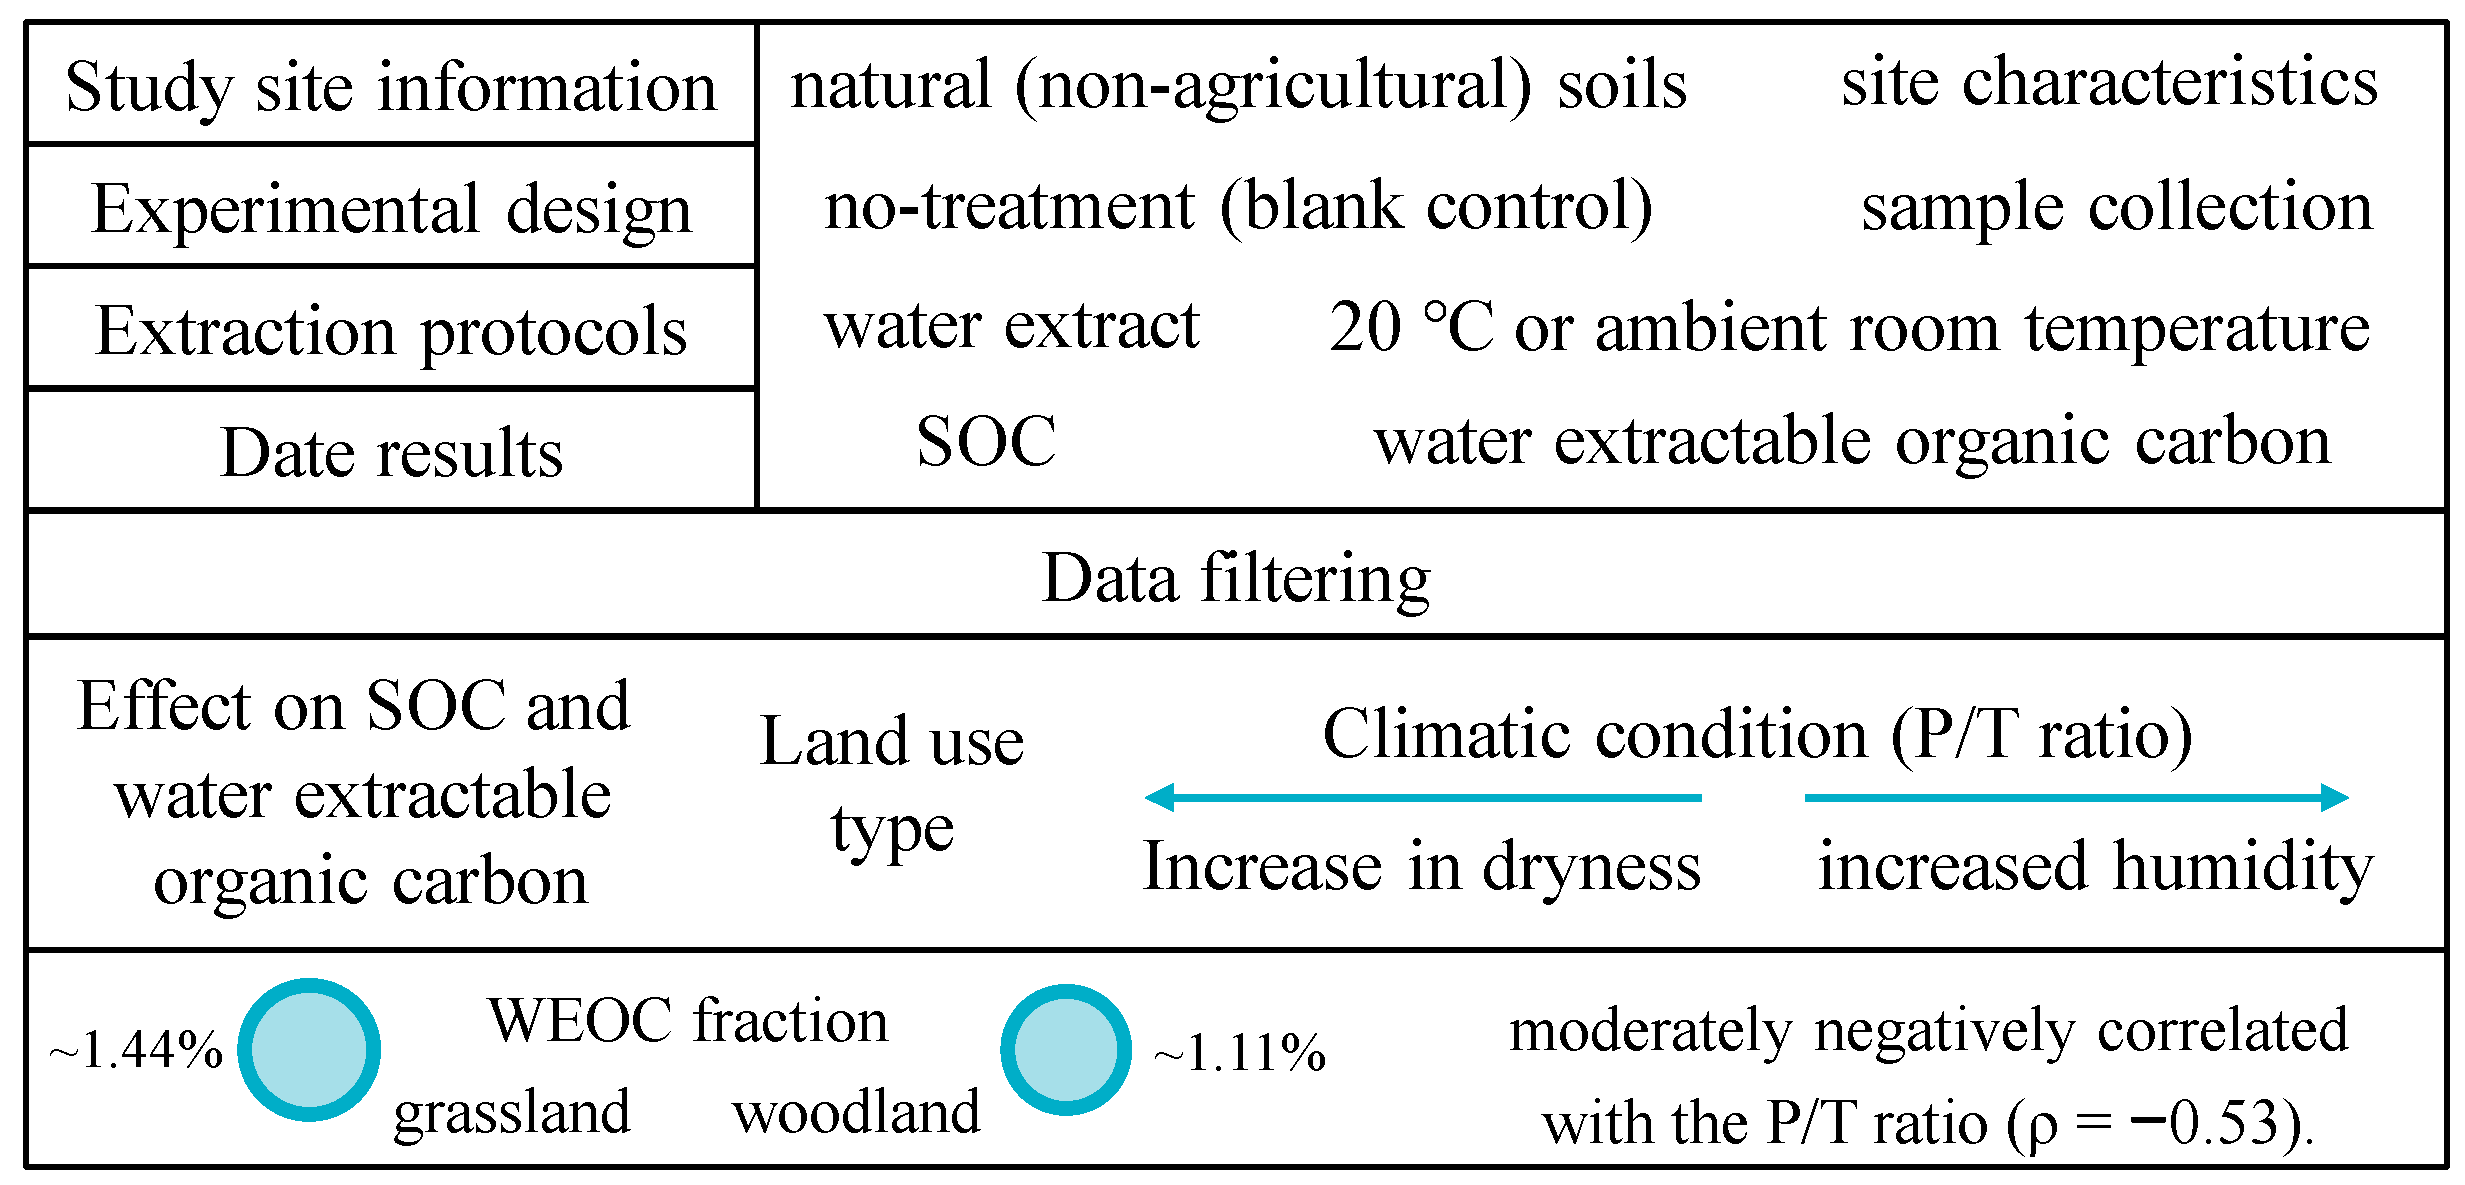
WEOC is influenced by several factors, including climate, vegetation, and sample preparation methods (Figure 5). Our analysis suggested that, on a broader scale, spatial variation in WEOC is more influenced by climate than vegetation, though this relationship exhibits regional variability. Specifically, the WEOC fraction was observed to decrease gradually as precipitation increases. In arid environments, elevated WEOC fractions may accumulate in surface soils, with pronounced accumulation observed in woodland ecosystems. Such accumulation could heighten the vulnerability of soil ecosystems in these regions, rendering them more susceptible to environmental disturbances and thereby potentially driving organic carbon loss and soil quality degradation. The information about WEOC in this study may contribute to a better understanding of its significance as a soil quality indicator, improve soil carbon models, and help determine effective ecological management strategies.

Author Contributions

Conceptualization: F.Z.; methodology: F.Z.; validation: F.Z.; investigation: Y.Z. and C.G.; data curation: X.Z.; writing—original draft preparation: F.Z.; writing—review and editing: F.Z.; visualization: Z.W.; funding acquisition: Z.W. All authors have read and agreed to the published version of the manuscript.

Funding

This research was funded by the National Natural Science Foundation of China (42173019, 42573010).

Data Availability Statement

The data presented in this study are openly available at https://data.mendeley.com/datasets/42xjwzs8tk/3 [doi: 10.17632/42xjwzs8tk.3], accessed on 1 Novermber 2025.

Acknowledgments

The authors are thankful to the Key laboratory of Aerosol Chemistry and Physics, Chinese Academy of Sciences for technical help, and would like to thank the anonymous reviewers of this paper.

Conflicts of Interest

The authors declare no conflicts of interest. The funders had no role in the design of the study; in the collection, analyses, or interpretation of the data; in the writing of the manuscript; or in the decision to publish the results.

References

  1. Poeplau, C.; Don, A.; Six, J.; Kaiser, M.; Benbi, D.; Chenu, C.; Cotrufo, M.F.; Derrien, D.; Gioacchini, P.; Grand, S.; et al. Isolating organic carbon fractions with varying turnover areas in temperature agricultural soils—A comprehensive method comparison. Soil Biol. Biochem. 2018, 125, 10–26. [Google Scholar] [CrossRef]
  2. Kelleher, B.P.; Simpson, A.J. Humic substances in soils: Are they really chemically distinct? Environ. Sci. Technol. 2006, 40, 4605–4611. [Google Scholar] [CrossRef]
  3. Fissore, C.; Giardina, C.P.; Kolka, R.K. Reduced substrate supply limits the temperature response of soil organic carbon decomposition. Soil Biol. Biochem. 2013, 67, 306–311. [Google Scholar] [CrossRef]
  4. Sarkhot, D.V.; Grunwald, S.; Ge, Y.; Morgan, C.L.S. Comparison and detection of total and available soil carbon fractions using visible/near infrared diffuse relfectance spectroscopy. Geoderma 2011, 164, 22–32. [Google Scholar] [CrossRef]
  5. Schmidt, M.W.I.; Torn, M.S.; Abiven, S.; Dittmar, T.; Guggenberger, G.; Janssens, I.A.; Kleber, M.; Kögel-Knabner, I.; Lehmann, J.; Manning, D.A.C.; et al. Persistence of soil organic matter as an ecosystem property. Nature 2011, 478, 49–56. [Google Scholar] [CrossRef] [PubMed]
  6. Conant, R.T.; Drijber, R.A.; Haddix, M.L.; Parton, W.J.; Paul, E.A.; Plante, A.F.; Six, J.; Steinweg, J.M. Sensitivity of organic matter decomposition to warming varies with its quality. Glob. Chang Biol. 2008, 14, 868–877. [Google Scholar] [CrossRef]
  7. Witzgall, K.; Vidal, A.; Schubert, D.I.; Höschen, C.; Schweizer, S.A.; Buegger, F.; Pouteau, V.; Chenu, C.; Mueller, C.W. Particulate organic matter as a functional soil component for persistent soil organic carbon. Nat. Commun. 2021, 12, 4115. [Google Scholar] [CrossRef]
  8. Díaz-Martínez, P.; Maestre, F.T.; Moreno-Jiménez, E.; Delgado-Baquerizo, M.; Eldridge, D.J.; Saiz, H.; Gross, N.; Le Bagousse-Pinguet, Y.; Gozalo, B.; Ochoa, V.; et al. Vulnerability of mineral-associated soil organic carbon to climate across global drylands. Nat. Clim. Change 2024, 14, 976–982. [Google Scholar] [CrossRef]
  9. Jílková, V.; Jandová, K.; Kukla, J.; Cajthaml, T. Soil organic carbon content decreases in both surface and subsoil mineral horizons by simulated future increases in labile carbon inputs in a temperate Coniferous forest. Ecosystems 2021, 24, 2028–2041. [Google Scholar] [CrossRef]
  10. Mueller, C.W.; Rethemeyer, J.; Kao-Kniffin, J.; Löppmann, S.; Hinkel, K.M.; Bockheim, J. Large amounts of labile organic carbon in permafrost soils of northern Alaska. Glob. Chang. Biol. 2015, 21, 2804–2817. [Google Scholar] [CrossRef] [PubMed]
  11. Numa, K.B.; Robinson, J.M.; Arcus, V.I.; Schipper, L.A. Separating the temperature response of soil respiration derived from soil organic matter and added labile carbon compounds. Geodrema 2021, 400, 115128. [Google Scholar] [CrossRef]
  12. Zsolnay, A. Dissolved humus in soil waters. In Humic Substances in Terrestrial Ecosystems; Elsevier: Amsterdam, The Netherlands, 1996; pp. 171–223. [Google Scholar] [CrossRef]
  13. Guigue, J.; Mathieu, O.; Lévêque, J.; Mounier, S.; Laffont, R.; Maron, P.A. A comparison of extraction procedures for water-extractable organic matter in soils. Eur. J. Soil Sci. 2014, 65, 520–530. [Google Scholar] [CrossRef]
  14. Harrison-Kirk, T.; Beare, M.H.; Meenken, E.D.; Condron, L.M. Soil organic matter and texture affect responses to dry/wet cycles: Changes in soil organic matter fractions and relationships with C and N mineralisation. Soil Biol. Biochem. 2014, 74, 50–60. [Google Scholar] [CrossRef]
  15. Silva, S.F.; Spaccini, R.; Mazzei, P.; Rezende, C.E.; Canellas, L.P. Changes in water-extractable organic matter in tropical forest and agricultural soils as detected by the DRIFT spectroscopy technique. Land Degrad. Dev. 2021, 32, 4755–4767. [Google Scholar] [CrossRef]
  16. Zhang, J.; Peng, C.; Xue, W.; Yang, B.; Yang, Z.; Niu, S.; Zhu, Q.; Wang, M. Dynamics of soil water extractable organic carbon and inorganic nitrogen and their environmental controls in mountain forest and meadow ecosystems in China. Catena 2020, 187, 104338. [Google Scholar] [CrossRef]
  17. Bartos, A.; Szymański, W.; Klimek, M. Impact of conventional agriculture on the concentration and quality of water-extractable organic matter (WEOM) in the surface horizons of Retisols―A case study from the Carpathian Foothills in Poland. Soil Till. Res. 2020, 204, 104750. [Google Scholar] [CrossRef]
  18. Halvorson, J.J.; Hansen, A.M.; Stewart, C.E. Patterns of water-extractable soil organic matter in the US Great Plains: Insights from the Haas Soil Archive. Agrosys. Geosci. Env. 2025, 8, e70060. [Google Scholar] [CrossRef]
  19. Landgraf, D.; Leinweber, P.; Makeschin, F. Cold and hot water-extractable organic matter as indicators of litter decomposition in forest soils. J. Plant Nutr. Soil Sci. 2006, 169, 76–82. [Google Scholar] [CrossRef]
  20. Schmidt, M.P.; Martínez, C.E. The influence of tillage on dissolved organic matter dynamics in a Mid-Atlantic agroecosystem. Geoderma 2019, 344, 63–73. [Google Scholar] [CrossRef]
  21. Canarini, A.; Schmidt, H.; Fuchslueger, L.; Martin, V.; Herbold, C.W.; Zezula, D.; Gündler, P.; Hasibeder, R.; Jecmenica, M.; Bahn, M.; et al. Ecological memory of recurrent drought modifies soil processes via changes in soil microbial community. Nat. Commun. 2021, 12, 5308. [Google Scholar] [CrossRef] [PubMed]
  22. Singh, S.; Mayes, M.A.; Shekoofa, A.; Kivlin, S.N.; Bansal, S.; Jagadamma, S. Soil organic carbon cycling in response to simulated soil moisture variation under field conditions. Sci. Rep. 2021, 11, 10841. [Google Scholar] [CrossRef]
  23. Sun, H.Y.; Koal, P.; Gerl, G.; Schroll, R.; Joergensen, R.G.; Munch, J.C. Response of water extractable organic matter and its fluorescence fractions to organic farming and tree species in poplar and robinia-based alley cropping agroforestry systems. Geoderma 2017, 290, 83–90. [Google Scholar] [CrossRef]
  24. Lehmann, J.; Hansel, C.M.; Kaiser, C.; Kleber, M.; Maher, K.; Manzoni, S.; Nunan, N.; Reichstein, M.; Schimel, J.P.; Torn, M.S.; et al. Persistence of soil organic carbon caused by functional complexity. Nat. Geosci. 2020, 13, 529–534. [Google Scholar] [CrossRef]
  25. Liebig, M.A.; Calderon, F.J.; Clemensen, A.K.; Durso, L.; Duttenhefner, J.L.; Eberly, J.O.; Halvorson, J.J.; Jin, V.L.; Mankin, K.; Margenot, A.J.; et al. Long-term soil change in the US Great Plains: An evaluation of the Haas Soil Archive. Agrosys. Geosci. Environ. 2024, 7, e20502. [Google Scholar] [CrossRef]
  26. Chantigny, M.H. Dissolved and water-extractable organic matter in soils: A review on the influence of land use and management practices. Geoderma 2003, 113, 357–380. [Google Scholar] [CrossRef]
  27. Szymański, W. Quantity and chemistry of water-extractable organic matter in surface horizons of Arctic soils under different types of tundra vegetation—A case study from the Fuglebergsletta coastal plain (SW Spitsbergen). Geoderma 2017, 305, 30–39. [Google Scholar] [CrossRef]
  28. Chittleborough, D.J.; Smettem, K.R.J.; Cotsaris, E.; Leaney, F.W. Seasonal changes in pathways of dissolved organic carbon through a hillslope soil (Xeralf) with contrasting texture. Soil Res. 1992, 30, 465–476. [Google Scholar] [CrossRef]
  29. Schiedung, H.; Bornemann, L.; Welp, G. Seasonal variability of soil organic carbon fractions under arable land. Pedosphere 2017, 27, 380–386. [Google Scholar] [CrossRef]
  30. Zsolnay, A.; Görlitz, H. Water extractable organic matter in arable soils: Effects of drought and long-term fertilization. Soil Biol. Biochem. 1994, 26, 1257–1261. [Google Scholar] [CrossRef]
  31. Grasset, C.; Rodriguez, C.; Delolme, C.; Marmonier, P.; Bornette, G. Can soil organic carbon fractions be used as functional indicators of wetlands? Wetlands 2017, 37, 1195–1205. [Google Scholar] [CrossRef]
  32. Doetterl, S.; Stevens, A.; Six, J.; Merckx, R.; Oost, K.V.; Pinto, M.C.; Casanova-Katny, A.; Muñoz, C.; Boudin, M.; Venegas, E.Z.; et al. Soil carbon storage controlled by interactions between geochemistry and climate. Nat. Geosci. 2015, 31, 780–783. [Google Scholar] [CrossRef]
  33. Jobbágy, E.G.; Jackson, R.B. The vertical distribution of soil organic carbon and its relation to climate and vegetation. Ecol. Appl. 2000, 10, 423–436. [Google Scholar] [CrossRef]
  34. Grant, K.E.; Repasch, M.N.; Finstad, K.M.; Kerr, J.D.; Marple, M.; Larson, C.J.; Broek, T.A.B.; Pett-Ridge, J.; McFarlane, K.J. Diverse organic carbon dynamics captured by radiocarbon analysis of distinct compound classes in a grassland soil. Biogeosciences 2024, 21, 4395–4411. [Google Scholar] [CrossRef]
  35. Craine, J.M.; Fierer, N.; McLauchlan, K.K. Widespread coupling between the rate and temperature sensitivity of organic matter decay. Nat. Geosci. 2010, 3, 854–857. [Google Scholar] [CrossRef]
  36. Todd-Brown, K.E.O.; Randerson, J.T.; Post, W.M.; Hoffman, F.M.; Tarnocai, C.; Schuur, E.A.G.; Allison, S.D. Causes of variation in soil carbon simulation from CMIP5 Earth system models and comparison with observations. Biogeosciences 2013, 10, 1717–1736. [Google Scholar] [CrossRef]
  37. Delarue, F.; Laggoun-Défarge, F.; Buttler, A.; Gogo, S.; Jassey, V.E.J.; Disnar, J. Effects of short-term ecosystem experimental warming on water-extractable organic matter in an ombrotrophic Sphagnum peatland (Le Forbonnet, France). Org. Geochem. 2011, 42, 1016–1024. [Google Scholar] [CrossRef]
  38. Blair, G.J.; Lefroy, R.D.B.; Lisle, L. Soil carbon fractions based on their degree of oxidation, and the development of a carbon management index for agricultural systems. Aust. J. Agric. Res. 1995, 46, 1459–1466. [Google Scholar] [CrossRef]
  39. Laura, Z.; Pierre, K.; Felix, W.; Lars, B. ClimateCharts.net—An interactive climate analysis web platform. Int. J. Digit. Earth 2020, 14, 338–356. [Google Scholar] [CrossRef]
  40. Lembrechts, J.J.; Hoogen, J.; Aalto, J.; Ashcroft, M.B.; De Frenne, P.; Kemppinen, J.; Kopecký, M.; Luoto, M.; Maclean, I.M.D.; Crowther, T.W.; et al. Global maps of soil temperature. Glob. Change Biol. 2022, 28, 3110–3144. [Google Scholar] [CrossRef] [PubMed]
  41. Dottmann, U.; Kraft, N.N.; Rech, R.; Heidkamp, A.; Tiemeyer, B. Analysis of peat soil organic carbon, total nitrogen, soil water content and basal respiration: Is there a ‘best’ drying temperature? Geoderma 2021, 403, 115231. [Google Scholar] [CrossRef]
  42. Even, R.J.; Machmuller, M.B.; Lavallee, J.M.; Zelikova, T.J.; Cotrufo, M.F. Large errors in soil carbon measurements attributed to inconsistent sample processing. Soil 2025, 11, 17–34. [Google Scholar] [CrossRef]
  43. Ghani, A.; Dexter, M.; Perrott, K.W. Hot-water extractable carbon in soils: A sensitive measurement for determining impacts of fertilisation, grazing and cultivation. Soil Biol. Biochem. 2003, 35, 1231–1243. [Google Scholar] [CrossRef]
  44. Shen, Y.; Zhao, Q.; Feng, Y.; Wang, L.; Lu, H.; She, X.; Ruan, H. Variations characteristics of soil active organic carbon along a soil moisture gradient in a riparian zone of Taihu Lake. Chin. J. Ecol. 2011, 30, 1119–1124. (In Chinese) [Google Scholar] [CrossRef]
  45. Tao, S.; Lin, B. Water soluble organic carbon and its measurement in soil and sediment. Water Res. 2000, 34, 1751–1755. [Google Scholar] [CrossRef]
  46. Cronan, C.S.; Lakshman, S.; Patterson, H.H. Effects of disturbance and soil amendments on dissolved organic carbon and organic acidity in red pine forest floors. J. Environ. Qual. 1992, 21, 457–463. [Google Scholar] [CrossRef]
  47. Lu, X.; Fan, J.; Yan, Y.; Wang, X. Soil water soluble organic carbon under three alpine grassland types in Northern Tibet, China. Afr. J. Agr. Res. 2011, 6, 2066–2071. [Google Scholar] [CrossRef]
  48. Kalisz, B.; Lachacz, A.; Glazewski, R. Effects of peat drainage on labile organic carbon and water repellency in NE Poland. Turk. J. Agric. For. 2015, 39, 20–27. [Google Scholar] [CrossRef]
  49. Cincotta, M.M.; Perdrial, J.N.; Shavitz, A.; Libenson, A.; Landsman-Gerjoi, M.; Perdrial, N.; Armfield, J.; Adler, T.; Shanley, J.B. Soil aggregates as a source of dissolved organic carbon to streams: An experimental study on the effect of solution chemistry on water extractable carbon. Front. Environ. Sci. 2019, 7, 172. [Google Scholar] [CrossRef]
  50. Sehler, R.; Li, J.; Reager, J.T.; Ye, H. Investigating relationship between soil moisture and precipitation globally using remote sensing observations. J. Contemp. Wat. Res. Ed. 2019, 168, 106–118. [Google Scholar] [CrossRef]
  51. Fuchslueger, L.; Bahn, M.; Fritz, K.; Hasibeder, R.; Richter, A. Experimental drought reduces the transfer of recently fixed plant carbon to soil microbes and alters the bacterial community composition in a mountain meadow. New Phytol. 2014, 201, 916–927. [Google Scholar] [CrossRef]
  52. Preece, C.; Farré-Armengol, G.; Llusià, J.; Peñuelas, J. Thirsty tree roots exude more carbon. Tree Physiol. 2018, 38, 690–695. [Google Scholar] [CrossRef]
  53. Camenzind, T.; Mason-Jones, K.; Mansour, I.; Rillig, M.C.; Lehmann, J. Formation of necromass-derived soil organic carbon determined by microbial death pathways. Nat. Geosci. 2023, 16, 115–122. [Google Scholar] [CrossRef]
  54. Kong, A.Y.Y.; Six, J. Tracing root vs. residue carbon into soils from conventional and alternative cropping systems. Soil Sci. Soc. Am. J. 2010, 74, 1201–1210. [Google Scholar] [CrossRef]
  55. Kuzyakov, Y.; Domanski, G. Carbon input by plants into the soil. Rev. J. Plant Nutr. Soil Sci. 2000, 163, 421–431. [Google Scholar] [CrossRef]
  56. Pausch, J.; Kuzyakov, Y. Carbon input by roots into the soils: Quantification of rhizodeposition from root to ecosystem scale. Glob. Chang. Biol. 2018, 24, 1–12. [Google Scholar] [CrossRef]
  57. Bahadori, M.; Chen, C.; Lewis, S.; Lewis, S.; Boyd, S.; Rashti, M.R.; Esfandbod, M.; Garzon-Garcia, A.; Zwieten, L.V.; Kuzyakov, Y. Soil organic matter formation is controlled by the chemistry and bioavailability of organic carbon inputs across different land uses. Sci. Total. Environ. 2021, 770, 145307. [Google Scholar] [CrossRef] [PubMed]
  58. Shiau, Y.; Chen, J.; Chung, T.; Tian, G.; Chiu, C. 13C NMR spectroscopy characterization of particle-size fractionated soil organic carbon in subalpine forest and grassland ecosystems. Bot. Stud. 2017, 58, 23. [Google Scholar] [CrossRef]
  59. Brooks, J.R.; Meinzer, F.C.; Coulombe, R.; Gregg, J. Hydraulic redistribution of soil water during summer drought in two contrasting Pacific Northwest coniferous forests. Tree Physiol. 2002, 22, 1107–1117. [Google Scholar] [CrossRef] [PubMed]
  60. Wang, B.; Liu, D.; Yang, J.; Zhu, Z.; Darboux, F.; Jiao, J.; An, S. Effects of forest floor characteristics on soil labile carbon as varied by topography and vegetation type in the Chinese Loess Plateau. Catena 2021, 196, 104825. [Google Scholar] [CrossRef]
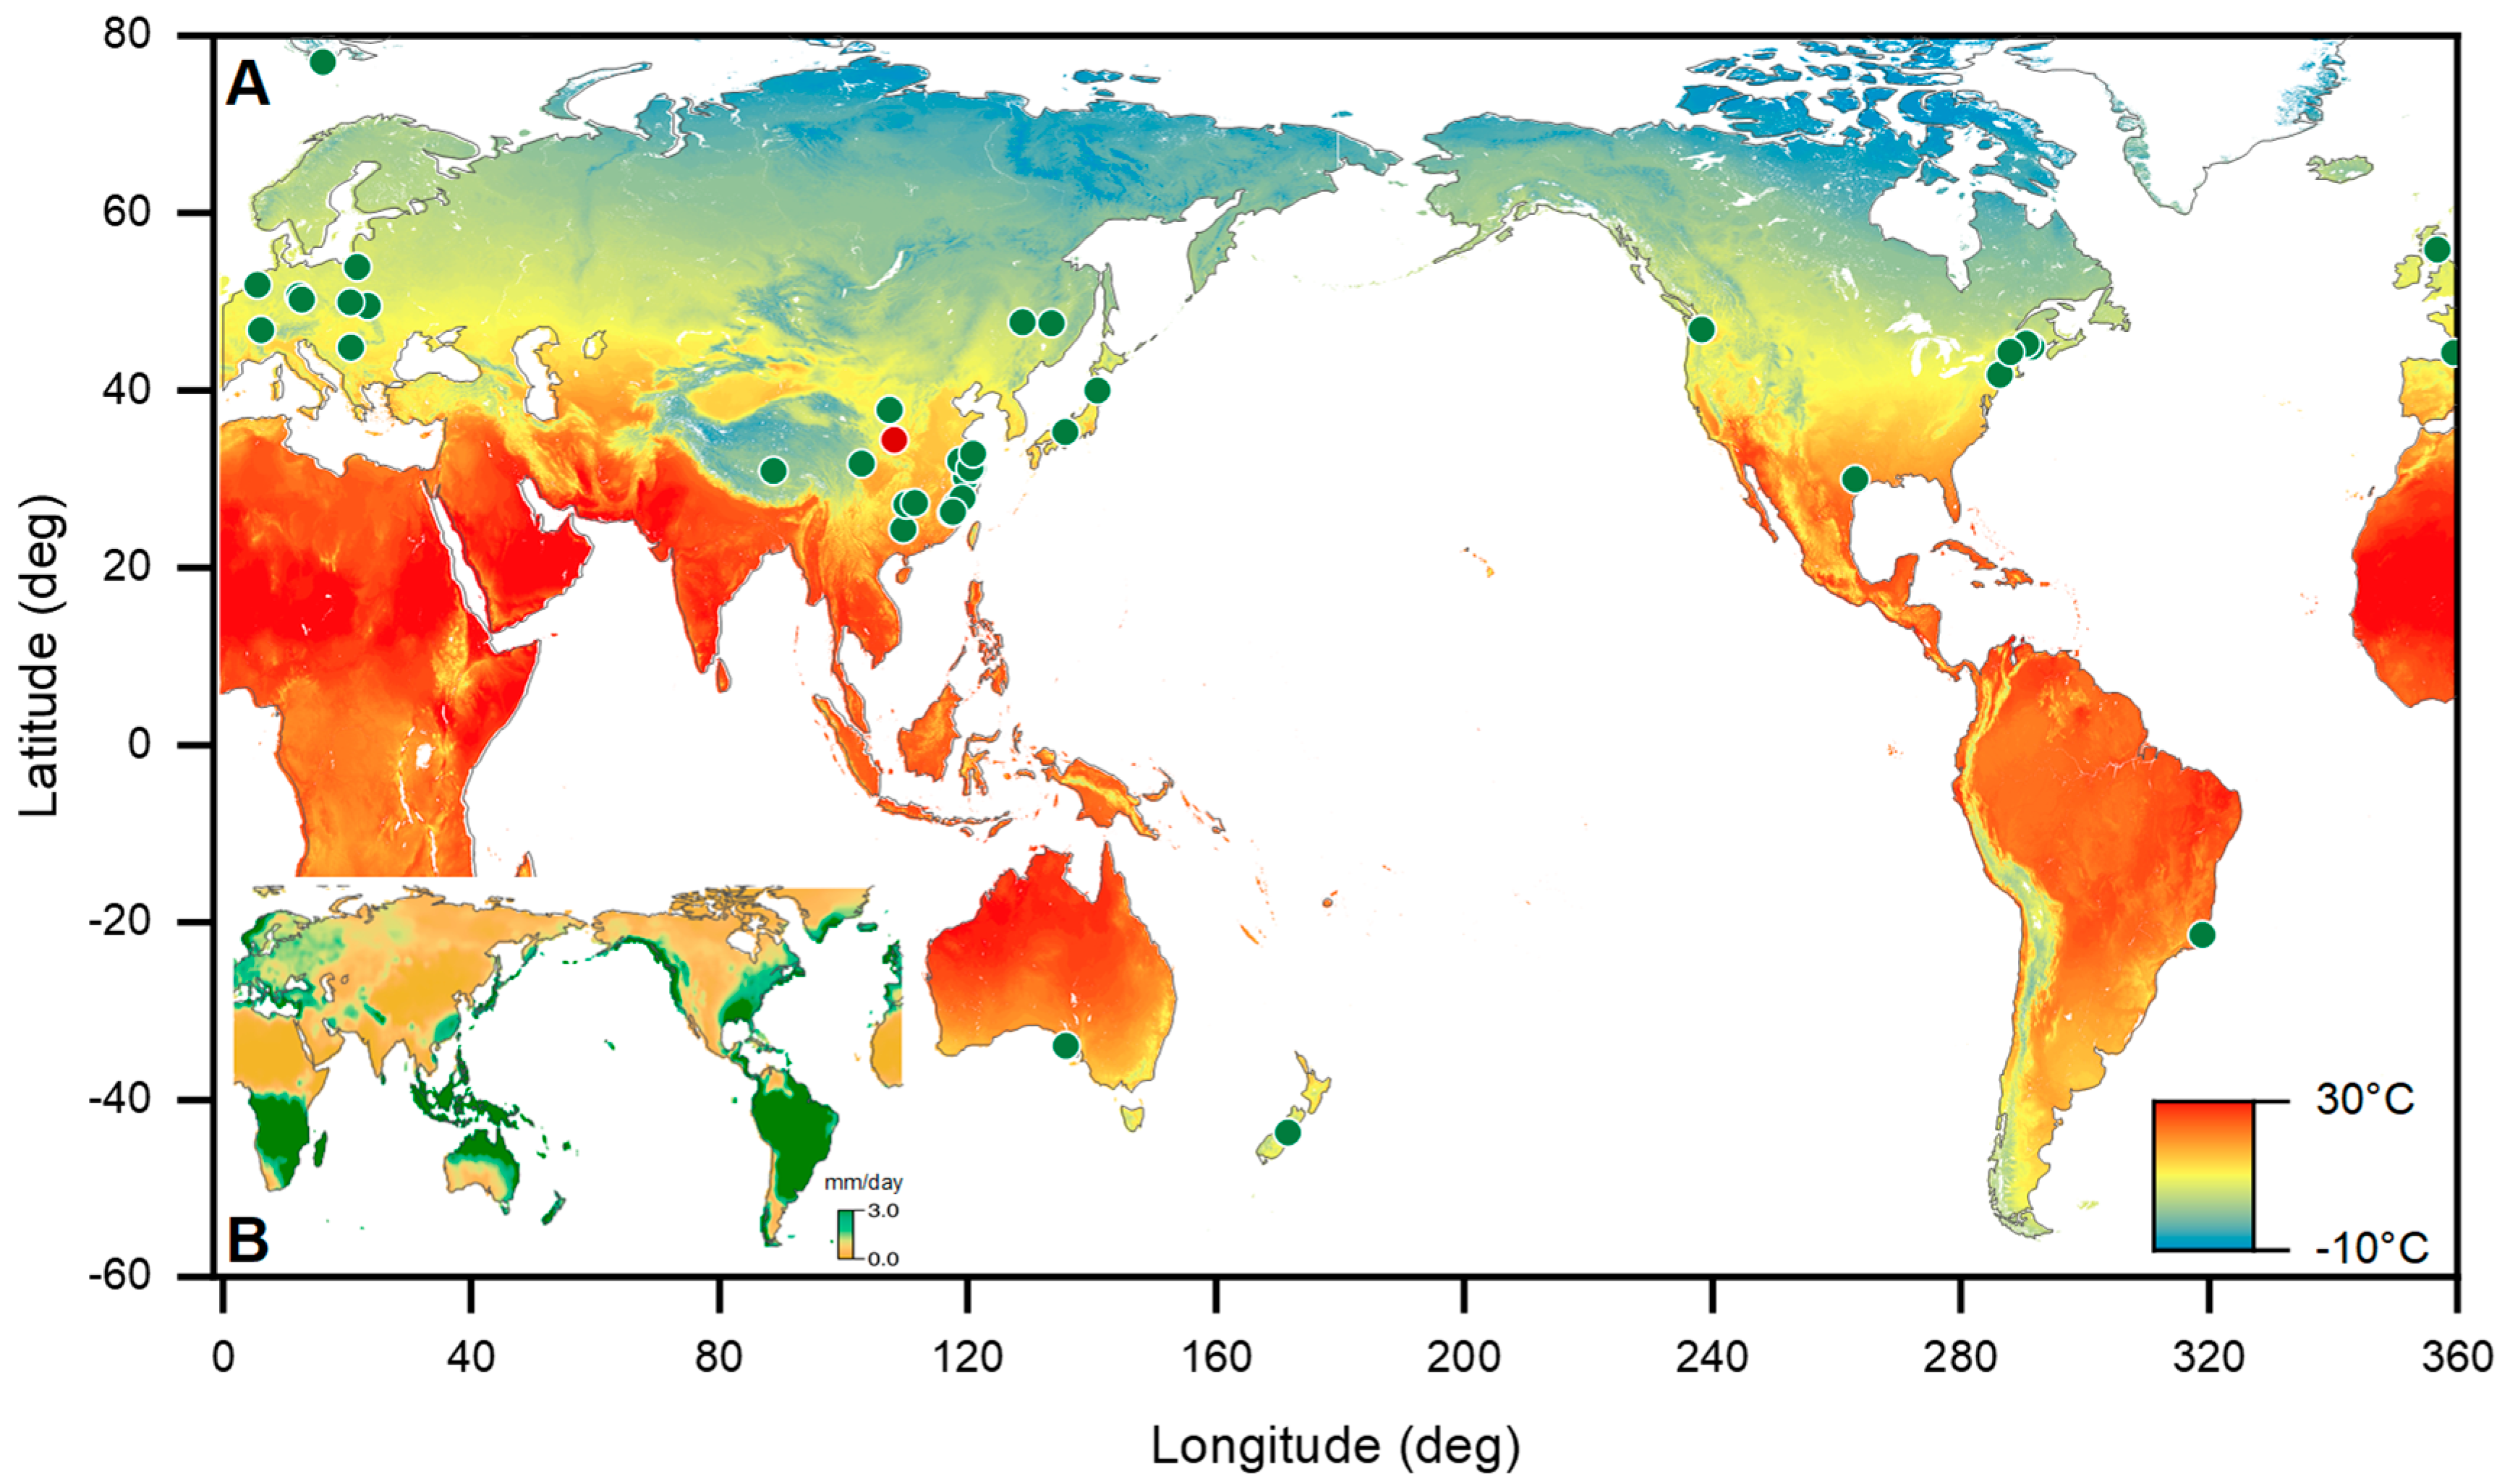
Figure 1. Distribution of the data sites from reported studies. (A) The base map is derived from the global map of soil temperature ([40], annual mean temperature). The green scatter points indicate literature data sites, and the red dots denote the location of Xi’an, China. (B) Global long-term mean precipitation distribution https://psl.noaa.gov/data/gridded/data.precl.html (accessed on 1 November 2025). The relevant information of the studies is given in Online Resource 1.
Agronomy 15 02623 g001
Figure 2. Carbon content in the surface soil from publicly reported studies. (A) WEOC content in the O horizon of woodlands and in the 0–10 cm depth interval for woodlands, grasslands, and wetlands. (B) The proportion of WEOC in corresponding horizons and land use types. The red, green, cyan and blue dots indicate O horizon, Woodland, Grassland and Wetland respectively. The boxes represent the mean values along with the ±1σ standard deviation range, and the whiskers extend to the upper and lower data points that are within 1.5 times the interquartile range; n.s., non-significant (p > 0.05). The relevant data are given in Online Resource 3.
Agronomy 15 02623 g002
Figure 3. Surface soil carbon content metrics from Xi’an Natural Park. (A) SOC content at a depth of 0–10 cm. (B) WEOC content at a depth of 0–10 cm. (C) The proportion of WEOC at a depth of 0–10 cm. The boxes represent the mean values along with the ±1σ standard deviation range, and the whiskers extend to the upper and lower data points that are within 1.5 times the interquartile range; n.s., non-significant (p > 0.05); * p < 0.05; ** p < 0.01.
Agronomy 15 02623 g003
Figure 4. Relationship between WEOC and SOC in surface soils (0–10 cm). (A) WEOC and SOC contents from literature reports. (B) WEOC and SOC contents measured in Xi’an. There is no significant correlation between surface soil WEOC and SOC. D: dry sample extraction; F: wet/fresh sample extraction.
Agronomy 15 02623 g004
Figure 5. Various WEOC fractions in land use type and climatic conditions. The soil carbon data was grouped based on the data filtering procedure. The regional variation in the WEOC fraction suggested the influence of land use types and climatic conditions.
Agronomy 15 02623 g005
Disclaimer/Publisher’s Note: The statements, opinions and data contained in all publications are solely those of the individual author(s) and contributor(s) and not of MDPI and/or the editor(s). MDPI and/or the editor(s) disclaim responsibility for any injury to people or property resulting from any ideas, methods, instructions or products referred to in the content.