Abstract
Yellow rust (YR), caused by Puccinia striiformis f. sp. tritici (Pst), is a global disease infecting wheat that seriously affects the yield and the quality of grains. Wheat breeding line C855 is immune to the mixed Pst isolates CYR32 + CYR33 + CYR34 under field conditions. To identify the Yr-loci carried by C855, in this study, an F2 population derived from the crossing of C855 with Yannong 999, a YR-sensitive cultivar, was established, and the infection type (IT) of each F2 individual was estimated. The correlation analysis results show that YR resistance was significantly positively correlated with grain weight and grain size. Using a 120K single-nucleotide polymorphism (SNP) array, the F2 population was genotyped, and a high-density genetic map covering 21 wheat chromosomes and consisting of 5362 SNP markers was built. Then, five Yr-QTLs on chromosomes 1B, 2A, 2B, and 2D were identified. Of these, the QTL on chromosome 2A, temporarily named QYr.sxau-2A.1, is a major-effect QTL explaining 15.62% of the phenotypic variance. One PCR-based marker SSR2A-14 for QYr.sxau-2A.1 was developed, and the C855 allele of SSR2A-14 corresponded to the stronger Yr resistance. QYr.sxau-2A.1, located in the 228.02~241.58 Mbp physical interval, is different from all the known Yr loci on chromosomes 2A. Within the interval, there are 30 annotated genes, including a nucleotide-binding site and a leucine-rich repeat (NBS-LRR)-encoding gene with the linkage marker NRM2A-16 of QYr.sxau-2A.1. Our results reveal a novel major-effect QYr.sxau-2A.1, which provided resistance to YR and is a molecular marker for wheat breeding.
1. Introduction
As a major food crop with the widest distribution and the largest planting area in the world, common wheat (Triticum aestivum L.) is faced with many diseases throughout its growth process [1]. Yellow rust (YR), also known as stripe rust, is a global disease infecting wheat and is caused by Puccinia striiformis f. sp. tritici (Pst), which can be transmitted by wind, including high-altitude air flows [2]. When conditions are suitable, the pathogen produces a large number of spores covering the leaves and hindering photosynthesis. In serious cases, these spores infect the leaf sheaths, stems, and even spikes, except leaves [2,3]. This process destroys the chlorophyll necessary for photosynthesis and consumes a large amount of the nutrients accumulated by the plants, which seriously affects their normal development, the crop yield, and the quality of the grains produced. The decrease in thousand-grain weight (TGW) is one of the main changes affecting wheat infected with Pst, causing serious yield reduction [4,5]. Descriptions of wheat yellow rust began appearing as early as the end of the 19th century [6]. This disease occurs year-round in every wheat-producing region of the world. According to historical epidemic patterns and pathogen genetics, the global distribution of wheat yellow rust can be delineated into several major epidemic regions, these being South and East Asia, Europe and Africa, North and South America, and Oceania [7]. In China, which belongs to the South and East Asia region, YR occurs in all of the main wheat production areas such as Shandong and Henan provinces, and YR outbreaks have caused wheat yield losses of 25~40% [8].
Breeding and promoting varieties resistant to YR has become an important goal in wheat genetics, for the achievement of which the identification of Yr-relevant genes is a prerequisite [3]. So far, researchers have discovered 86 officially named Yr genes (Yr1~Yr86) and numerous temporarily named Yr genes from wheat-related species, landraces, and cultivars [9,10,11]. These genes can be classified into all-stage resistance (ASR) and adult-plant resistance (APR) according to their resistance characteristics. ASR genes, such as Yr84 [12] and Yr85 [13], usually show resistance to the same Pst isolate at both the seedling and adult stages, while APR genes, including Yr80 [14] and Yr86 [15], are typically characterized by susceptibility at the seedling stage and resistance at the adult stage. Many Yr genes have been confirmed to encode nucleotide-binding site and leucine-rich repeat (NBS-LRR) proteins by map-based cloning [7,16]. Moreover, RNA sequencing (RNA-seq) has also been applied in mining YR-responsive genes. Comparing the transcriptomes of Pst-infected leaves from two soft spring wheat cultivars (cv.), resistant cv. Louise and susceptible cv. Penawawa, 3366 differentially expressed genes (DEGs) were identified, and stress-related pathways including mitogen-activated protein kinase (MAPK) and oxidation-reduction were upregulated in the resistant host background [17]. Similarly, 16,295 DEGs were identified in two Pst-infected semi-winter wheat landraces, resistant Baikemai-11 and susceptible Batangxiaomai [18]. Furthermore, the RNA-seq results of leaves after inoculation revealed 1395 Pst-induced DEGs in cv. Xiaoyan 6 [19] and more than 8233 Pst-induced DEGs in cv. Anmai 1350 [20]. The above-mentioned YR-related genes provide abundant resistance sources for improvements to wheat resistance.
However, Pst’s frequent variation and, thereby, the continuous emergence and prevalence of new virulent isolates, have led to the gradual loss of resistance of Yr genes carried by the selected wheat varieties, which has brought about severe challenges in wheat production [5]. For example, in China, the emergence of a new isolate in 1965, Chinese Yellow Rust 18 (CYR18), caused the loss of efficacy of Yr1; the prevalence of CYR29 in 1985 caused the invalidity of Yr9; and the emergence of CYR32 in 1991 led to the lapsing of Yr3 and Yr4 carried by cv. Fan 6 and its derivatives [21,22]. In 2008, CYR34 was first detected in Sichuan province on the cultivar Chuanmai 42. This isolate is considered more aggressive than previous ones and has overcome several isolate-specific Yr resistance genes, particularly Yr24/Yr26 [23,24,25]. Therefore, it is necessary to extensively explore the disease resistance loci and broaden the genetic background of varieties in order to cultivate broad-spectrum and durable wheat varieties with disease resistance.
C855 is a YR-resistant breeding line developed in our laboratory, which is immune to the virulent isolates CYR32, CYR33, and CYR34. Here, genetic populations were constructed by the cross of C855 and a susceptible cv. Yannong 999 (YN999). The resistance loci carried by C855 were mapped in combination with phenotypic and genotypic population data, and their diagnostic markers were obtained, providing a resistance source and molecular marker for wheat breeding.
2. Materials and Methods
2.1. Plant Materials and Growing Environment
The wheat-resistant breeding line C855 (BC1F5 of YN999/TAI8047) was bred by the College of Agronomy of Shanxi Agricultural University, and the sensitive cv. Yannong 999 (YN999) line was bred by the Yantai Academy of Agricultural Sciences. C855 and YN999 were crossed to generate an F2 population with 125 individual plants, and only 75 F2:3 lines were derived from them, because some F2 plants were heavily infected and failed to produce seeds.
All the plant materials were planted in the experimental field of Sichuan Academy of Agricultural Sciences in Chengdu in 2023 and 2024. For both the F2 individuals and F2:3 lines, 10 seeds were planted in a row 1.5 m in length, with plant spacing of approximately 15 cm. cv. Taichung 29 (TC29) was used as a susceptible control and planted in 10 lines, while cv. Chuanyu 12 (CY12) was planted around the plots as an inducing material.
2.2. Phenotyping
In mid-January of each year, the mixed isolates CYR32 + CYR33 + CYR34 were inoculated in the penultimate leaf of inducer CM12. After the susceptible control TC29 was fully infected from late March to early April, the infection type (IT) of each plant after inoculation was investigated using a 0–9 IT scale [26]. Briefly, plants with IT 0–3 were considered resistant; IT 4–6 were intermediate; and IT 7–9 were susceptible. The YN999 × C855 population was harvested in May. After threshing and drying, grain trait indexes, including thousand-grain weight (TGW), grain length (GL), grain width (GW), and grain diameter (GD), were determined using the TPKZ-3 intelligent seed test and analysis system (Top Cloud-Agri Technology Co., Ltd., Hangzhou, China). For the F2:3 lines, each phenotype was identified in 10 plants per line, and their averages were numerated and recorded for further analysis.
2.3. Genotyping and QTL Mapping
Genomic DNA was extracted from the leaves of the YN999 × C855 F2 population and their parents at the seedling stage, before inoculation testing, and then genotyped by a 120K-4HWA SNP-chip containing 121,019 markers (Tcuni Inc., Chengdu, China). By following our previous method [27], parent polymorphic SNP markers with fewer than 20% missing values and precise positioning information on the Chinese Spring genome (version 1.0) were screened and used to construct linkage groups with the BIN and MAP programs of IciMapping (version 4.0). Then, QTL analysis was integrated with IT data of the F2 population and performed using the Kosambi function of the BIP program of the IciMapping (version 4.0), setting threshold value of the logarithm of the odds as 2.5.
2.4. Diagnostic Marker Developing
PCR-based markers for Yr-QTL were developed as described previously [28]. First, SSR loci within the target genome segment were searched by SSRHunter (version 1.3) software, and specific primers were designed for these loci (Table 1). Afterward, primer pairs were used to amplify the genomic DNA of C855 and YN999, and then the markers with parental polymorphism in the F2 population were screened for genotyping. The amplification conditions were as follows: 95 °C for 15 s, 36 cycles of 95 °C for 15 s, 58 °C for 15 s, and then 72 °C for 15 s. Polyacrylamide gel electrophoresis was used to differentiate the PCR products. In addition, a set of NBS-related microsatellite (NRM) markers [29] located on chromosome 2A was also used to integrate into QTL. Finally, the SSR markers were integrated into the QTL map. The marker whose alleles exhibited the most significant phenotypic difference was selected as the diagnostic marker. Then, the diagnostic marker was used to assess the target QTL in the genetic population and wheat germplasm, for which the DNA solution of a set of wheat germplasms comprising 114 accessions, including 63 landraces and 51 modern cultivars, was used (Table S2) [30].

Table 1.
Developed QTL-linked SSR markers in this study.
2.5. Expression Pattern of Annotated Genes Within QTL
The publicly available RNA-seq data [31] involving wheat flag leaves after inoculation of the Pst isolate CYR31 at 0, 24, 48, and 72 h were downloaded from the National Center for Biotechnology Information (NCBI) database with the accession number PRJNA243835 (http://www.ncbi.nlm.nih.gov/sra/, accessed on 1 May 2024). To visualize expression patterns, we compared high-confidence annotated genes within the QTL with assembled genes, extracting their FPKM values at different time points after inoculation to generate a heatmap. The FPKM values were derived from clean reads processed according to our previous method [32], which involved filtering raw data for low-quality reads (adapters, >10% poly-N, quality score < 30) and mapping to the Chinese Spring genome (RefSeq v1.0; http://wheat-urgi.versailles.inra.fr/, accessed on 20 May 2024). Gene expression was calculated using the standard FPKM formula: FPKM = cDNA Fragments/(Mapped Fragments (Millions) × Transcript Length (kb)).
2.6. Statistical Analysis
Student’s t test is used to analyze the significance of differences between two sets of data, and p < 0.05 was considered a significant difference, while p < 0.01 was considered an extremely significant difference.
3. Results
3.1. Phenotypic Differences Among Parents
Under field conditions, C855 was immune to the mixed Pst isolates CYR32 + CYR33 + CYR34 (IT = 0), and no spores were observed on its leaves, while the leaves of YN999 plants were parasitized by a large number of spores and were susceptible to the mixed isolates (IT = 8) (Figure 1). After harvest, there were significant differences in grain weight and grain size between C855 and YN999. The TGW of C855 was 46.97 g, while that of YN999 was only 19.91 g (p = 0.0004). The length, width, and diameter of C855 grains were also significantly higher than those of YN999, and the corresponding p values were 0.0002, 0.0003, and 0.0001, respectively (Table 2).
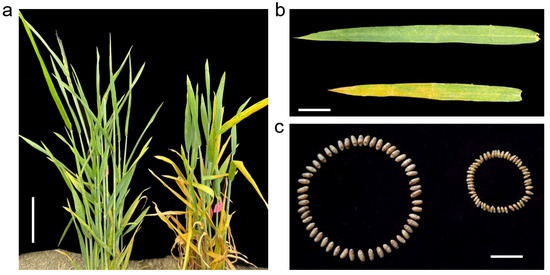
Figure 1.
Phenotype of parents inoculated with mixed Pst isolates CYR32 + CYR33 + CYR34 in field environment. (a) Plants of C855 (left) and YN999 (right). Bar = 10 cm. (b) Flag leaves of C855 (upper) and YN999 (lower). Bar = 5 cm. (c) Grains of C855 (left) and YN999 (right). Bar = 1 cm.

Table 2.
Assessment of phenotypes for YN999 × C855 F2 population and the parents.
3.2. Resistance Segregation in YN999 × C855 F2 Population
The seeds of the YN999 × C855 F2 population were sown in the field, and 125 seeds were germinated and then grown into plants. The results of the inoculation identification showed that, among these 125 F2 individuals, there were 7 plants with IT = 0, 23 plants with IT = 1, 1 plant with IT = 3, 6 plants with IT = 6, 16 plants with IT = 7, 31 plants with IT = 8, 41 plants with IT = 9, and no plant with IT = 2, 4, or 5 (Figure 2a). The numbers of resistant and susceptible plants were 31 and 88, respectively. Due to the utilization of mixed Pst isolates for identification, we did not use the ratio of resistant and susceptible plants to speculate on the number of loci controlling resistance.
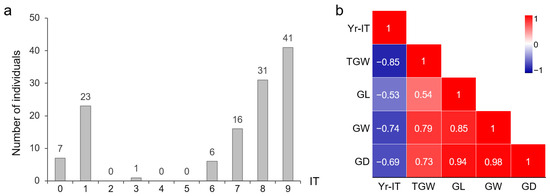
Figure 2.
Phenotype of YN999 × C855 F2 population. (a) Infectious type of individuals after inoculation. (b) Correlation analysis of resistance phenotype with grain weight and grain size. Red represents positive correlation, while blue represents negative correlation.
The grain traits of individual F2 plants were also separated and exhibited transgressive segregation (Table 1). The degree of grain type dispersion (CV = 0.11~0.17) was lower than TGW (CV = 0.39). Correlation analysis showed that there was a positive correlation among grain phenotypes, while the IT was significantly negatively correlated with TGW and grain size, suggesting that the stronger the resistance of a plant to YR, the larger the grain size and the higher the grain weight (Figure 2b).
3.3. Mapping for YR-Resistant Loci
The 120K chip, which contained high-density SNP markers evenly distributed on 21 chromosomes of wheat, was used to construct a molecular map of the YN999 × C855 F2 population (Figure 3a). The genotyping results showed that 13,117 markers were polymorphic between the parents, and the five most distributed chromosomes were chromosomes 2A (2373), 3B (2357), 5B (1903), 3A (1721), and 2B (1338) (Figure 3b). Finally, a linkage map of the population was constructed using 5362 SNP markers. Combined with the phenotypic data, five YR-resistant loci were identified on four chromosomes, these being QYr.sxau-1B, QYr.sxau-2A.1, QYr.sxau-2A.2, QYr.sxau-2B, and QYr.sxau-2D. Of these, QYr.sxau-2A.1, which came from the parent C855, displayed the greatest resistance effect, with 15.62% of the phenotypic variance explained (PVE) (Table 3).
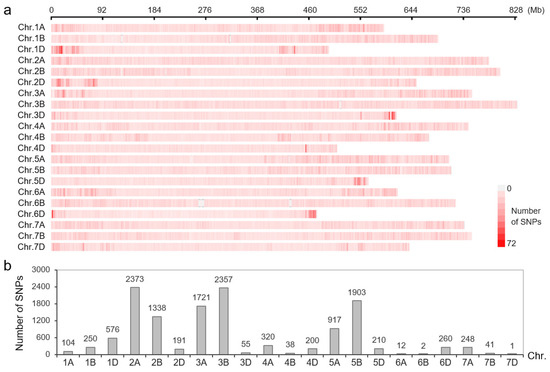
Figure 3.
Distribution of SNP markers on wheat chromosomes. (a) SNPs on 120K-4HWA chip. (b) SNP markers showing polymorphism between parents C855 and YN999.

Table 3.
Mapping for YR-resistant loci in YN999 × C855 F2 population.
3.4. Verification of QYr.sxau-2A.1
QYr.sxau-2A.1 was mapped to a 13.56 Mbp physical interval flanked by SNP markers 2A228025139 and 2A241581399 (Table 2). We randomly designed SSR primer pairs within the genome segment, and additionally selected a set of NBS-related microsatellite (NRM) markers [29] located on chromosome 2A to verify the mapping results. Finally, four pairs of SSR primers, including SSR2A-11, SSR2A-14, SSR2A-17, and SSR2A-20, as well as one NRM marker NRM2A-16, which closed to NBS-LRR gene TraesCS2A02G225000, showed polymorphisms between C855 and YN999, and were then integrated into the QYr.sxau-2A.1 map by amplifying the YN999 × C855 F2 population. The marker under the peak was 2A236725760 (Figure 4).
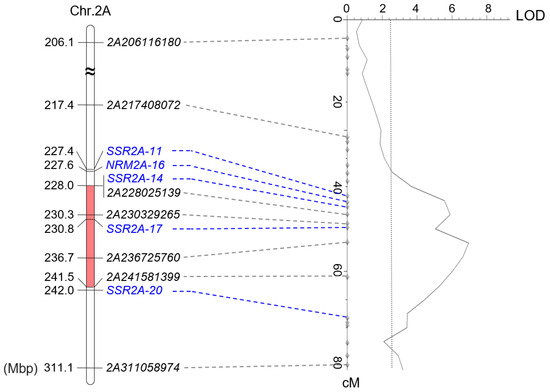
Figure 4.
Genomic map (left) and genetic map (right) of QYr.sxau-2A.1. QTL was remapped by integrating with five developed SSR markers marked in blue. Red boxes represent QYr.sxau-2A.1 region.
We analyzed the genotypes, with the exception of the heterozygotes of linked markers. For all the markers, the C855 allele of QYr.sxau-2A.1 corresponded to the lower IT scale, while the NY999 allele of QYr.sxau-2A.1 corresponded to the higher IT scale. The phenotypic differences between the two alleles of SSR2A-14 (p = 2.4 × 10⁻⁷) within the QTL were more significant than those of markers SSR2A-11 (p = 0.0032), SSR2A-17 (p = 0.0008), SSR2A-20 (p = 0.0027), and NRM2A-16 (p = 0.0001) (Figure 5). Hence, SSR2A-14 was used as the diagnostic marker for allelic variation in QYr.sxau-2A.1.
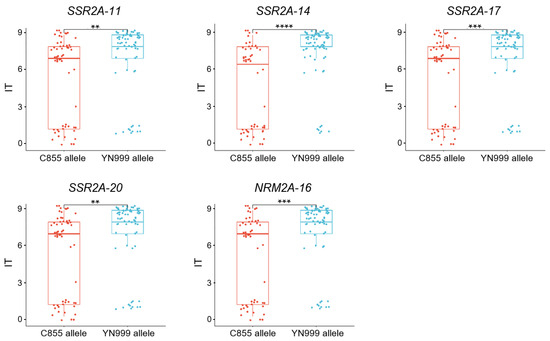
Figure 5.
Significant differences analysis in homozygous genotypes of the five PCR-markers of QYr.sxau-2A.1 in YN999 × C855 F2 population. Red and blue represent C855 allele and YN999 allele of marker, respectively. ** indicates p < 0.01, *** indicates p < 0.001, and **** indicates p < 0.0001.
3.5. Assessment of the Two Alleles of QYr.sxau-2A.1
We further examined the effect of QYr.sxau-2A.1 in YN999 × C855 F2:3 lines. The results of inoculation showed that the F2:3 lines exhibited resistance, susceptibility, or the separation of resistance and susceptibility to mixed Pst isolates (Figure 6a). The average IT value in each line was calculated, respectively. The subsequent statistical results showed that, as expected, the F2:3 lines carrying the homozygous QYr.sxau-2A.1 C855 allele had a lower IT scale (p = 6.0 × 10⁻⁷) and a higher TGW (p = 6.0 × 10⁻⁶) than those carrying the homozygous YN999 allele, indicating that the C855 allele of QYr.sxau-2A.1 was helpful in improving plant disease resistance and maintaining a stable yield (Figure 6b). In addition, we also used diagnostic markers to detect the distribution of the two alleles of QYr.sxau-2A.1 in wheat germplasm and found that the distribution frequency of the C855 allele was significantly lower than that of the YN999 allele, meaning that it exhibits great application potential (Figure 6c).
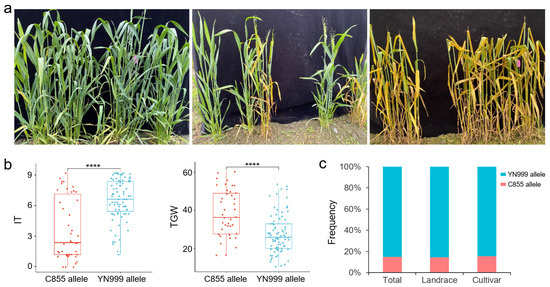
Figure 6.
Assessment of QYr.sxau-2A.1. (a) Plant phenotype of YN999 × C855 F2:3 lines inoculated with mixed Pst isolates, including resistant (left), separation (middle), and susceptive (right). (b) Significant differences analysis in IT and TGW between the two alleles of QYr.sxau-2A.1 in YN999 × C855 F2:3 lines. **** indicates p < 0.0001. (c) Distribution frequency of the two alleles of QYr.sxau-2A.1 in 114 varieties, including 62 landraces and 52 cultivars.
3.6. Annotated Genes Within QYr.sxau-2A.1
There were 30 high-confidence genes in the QYr.sxau-2A.1 interval (chr.2A:228025139-241581399) according to the annotation of coding sequences in the Chinese Spring genome database (RefSeq v1.1) (Table S1). Based on published data [31], 11 annotated genes were not expressed in wheat flag leaves at the seedling stage, and 6 of the remaining 19 expressed genes were highly responsive to Pst infection, including TraesCS2A02G226300 encoding Flowing LOCUS C EXPRESSOR-LIKE 1 (TaFLL1), TraesCS2A02G226800 encoding peptidylprolyl isomerase (TaPPI), TraesCS2A02G227500 encoding 60S ribosomal protein L15 (TaRPL15), TraesCS2A02G225300 encoding ATP-dependent Lon protease (TaLON), TraesCS2A02G225200 encoding adenosine 5′-phosphosulfate reductase-like protein (TaAPRL), and TraesCS2A02G225000 encoding NBS-LRR protein (TaNLR) with the linkage marker NRM2A-16 of QYr.sxau-2A.1 (Figure 7).
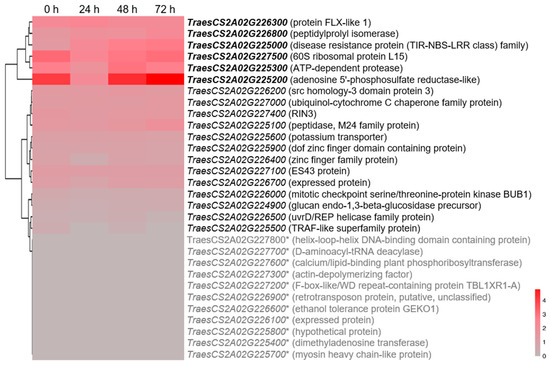
Figure 7.
Expression patterns of 30 annotated genes within QYr.sxau-2A.1 region in flag leaf of wheat inoculated with Pst isolate CYR31. Unexpressed genes are marked by asterisks, and highly expressed genes are displayed in bold. From gray to red, the FPKM value goes from low to high.
4. Discussion
4.1. QYr.sxau-2A.1 Is a Novel Yr Locus
In this study, a major locus for resistance to YR was identified from the 228.02~241.58 Mbp interval of the short arm of wheat chromosome 2A. At present, six officially named Yr genes have been identified on wheat chromosome 2A, including Yr1, Yr32, and Yr86 on the long arm [15,33,34,35], and Yr17, Yr56, and Yr69 on the short arm [13,36,37]. Of these, Yr17 was located at the terminal of the short arm [37]; Yr56 was located between the markers Xgwm512 and Xbarc212, corresponding to the physical 12.16~15.83 Mbp interval [36]; and Yr69 was located in the 2.05~14.82 Mbp interval between markers Xmag3807 and X2AS33 [13]. The physical locations of the above genes and QYr.sxau-2A.1 are different. In addition, some Yr-QTLs have also been reported on the short arm of chromosome 2A—such as QYr.sicau-2AS (7.89 Mbp) between markers AX-111557864 and AX-111015252 [38]; QYr.lrdc-2A.1 (20.45 Mbp), linked with marker VPM [39]; QYr.cim-2AS (32.35 Mbp) between markers 1,208,841 and 978,751 [40]; QYr.hebau-2AS (41.45 Mbp) between markers AX-111018125 and AX-110099691 [41]; and QYrsn.nwafu-2AS.2 (328.25 Mbp) between markers AX-108857922 and AX-111730999 [42]—which were not in the same position as QYr.sxau-2A.1. Therefore, QYr.sxau-2A.1 should be a new locus for YR resistance.
4.2. Prediction of Candidate Genes for QYr.sxau-2A.1
There were 30 high-confidence genes in the QYr.sxau-2A.1 interval according to the annotation of the Chinese Spring genome, six of which, including TaRPL15, TaAPRL, TaFLL1, TaPPI, TaLON, and TaNLR, showed higher transcription levels in flag leaves after inoculation with the Pst isolate CYR31. Of these, TaRPL15 and TaAPRL might regulate basic physiological and biochemical reactions, because ribosomal protein components L15 and APRase-like were involved in the regulation of protein synthesis [43] and the sulfate assimilation pathway [44], respectively. TaFLL1 belonged to the FLX family that controls the vernalization and flowering of plants and contains FLX and FLL1~4 [45], of which, FLL3 participated in the regulation process of the Colletotrichum falcatum pathogen in sugarcane [46]. TaPPI encodes PPIase with a function in protein folding by accelerating the cis–trans isomerization of proline peptide bonds. Apart from protein folding, PPIases is involved in a variety of cellular processes such as intracellular signaling, heat shock responses, and pathogen–host interactions [47]. In bacteria, ATP-dependent proteases function in physiological regulation and environmental stress response, and belong to four known prokaryotic families: ClpP (operating with ATP-binding subunits ClpA, ClpB, or ClpX), Lon, HslUV, and FtsH. The gene TaLON encoded Lon-type ATP-dependent protease in our study. In rice, the Lon-interacting proteins were confirmed to be involved in the pathogenic regulation pathway mediated by the ATP-dependent Lon protease MAP1 in Magnaporthe oryzae, suggesting an effective approach for the inhibition of rice blast disease by perturbing that pathway [48]. TaNLR encoded the NBS-LRR protein, which was also the coding product of several cloned Yr genes like Yr5, Yr6, and YrTD121 [7,16]. Moreover, the linkage marker NRM2A-16 of QYr.sxau-2A.1 was located at about 7861 bp upstream of the TaNLR start codon. Therefore, compared with other annotated genes, TaNLR is more likely to be the candidate gene for QYr.sxau-2A.1.
4.3. QYr.sxau-2A.1 Can Be Used for Wheat Breeding
YR occurs in all of the main wheat-producing areas in China, and it seriously affects wheat’s yield-related traits, especially grain weight [4,5,8]. As a key region where Pst can both overwinter and oversummer, Sichuan province offers more conducive environmental conditions for the pathogen than most other provinces, making it one of the main areas in China from which virulent isolates originate, and the ideal place for identifying the disease resistance of wheat germplasm [5]. For example, YN999 is a high-yield wheat cv. approved by the National Crop Variety Approval Committee of China (Approval No. 2016012). In the field environment in Yantai, Shandong province, the TGW of YN999 reached up to 56.4 g [49]. However, in our field environment in Chengdu, Sichuan province, YN999 was severely susceptible to the mixed Pst isolates, and its TGW decreased to 19.91 g. Meanwhile, breeding line C855, which carries the major-effect QTL QYr.sxau-2A.1, showed great resistance to YR, with a TGW of 46.97 g. Moreover, there was a significant positive correlation between YR resistance and TGW in the YN999 × C855 F2 population and the derived F2:3 lines. Therefore, C855 can be used for the resistance improvement in wheat varieties. We have developed a PCR-based diagnostic marker SSR2A-14 for the major-effect QTL QYr.sxau-2A.1, which can be used for molecular-assisted selection in breeding processes.
5. Conclusions
This study clarified the Yr loci carried by wheat breeding line C855 and obtained closely linked molecular markers. One major-effect QTL, QYr.sxau-2A.1, was detected in the genomic interval 228.02~241.58 Mbp of the short arm of chromosome 2A, with a PVE of 15.62%. There were 30 high-confidence genes in the interval. QYr.sxau-2A.1 was positively correlated with TGW. One PCR-based diagnostic marker, SSR2A-14 for QYr.sxau-2A.1, was developed for application in wheat molecular breeding.
Supplementary Materials
The following supporting information can be downloaded at: https://www.mdpi.com/article/10.3390/agronomy15112511/s1, Table S1: The 30 high-confidence genes in the QYr.sxau-2A.1 interval, Table S2: 114 wheat germplasms used in this study.
Author Contributions
Conceptualization, L.Q.; formal analysis, H.G. and L.W. (Liujie Wang); methodology, X.B.; software, L.W. (Lijuan Wu); validation, S.Z.; investigation, Z.Y., E.Y. and L.W. (Liujie Wang); resources, Z.C. and X.Z.; data curation, H.G. and X.L.; writing—original draft preparation, L.Q.; writing—review and editing, X.L.; project administration, L.Q. and X.L. All authors have read and agreed to the published version of the manuscript.
Funding
This work was supported by the Construction Project of National Key Laboratory of Organic Dryland Agriculture (Preparatory) (Z135050009017-2-5), the National Key R&D Program Project (2023YFD1201002), the Shanxi Province Key R&D Program Project (202302140601002-1), and the S&T Development Foundation of Central Guides Local Government Project (YDZJSX2022C009).
Data Availability Statement
Data are contained within the article and Supplementary Materials.
Conflicts of Interest
The authors declare no conflicts of interest.
References
- Hellemans, T.; Landschoot, S.; Dewitte, K.; Van Bockstaele, F.; Vermeir, P.; Eeckhout, M.; Haesaert, G. Impact of Crop Husbandry Practices and Environmental Conditions on Wheat Composition and Quality: A Review. J. Agric. Food Chem. 2018, 66, 2491–2509. [Google Scholar] [CrossRef]
- Bouvet, L.; Holdgate, S.; James, L.; Thomas, J.; Mackay, I.J.; Cockram, J. The Evolving Battle Between Yellow Rust and Wheat: Implications for Global Food Security. Theor. Appl. Genet. 2022, 135, 741–753. [Google Scholar] [CrossRef]
- Schwessinger, B. Fundamental Wheat Stripe Rust Research in the 21st Century. New Phytol. 2017, 213, 1625–1631. [Google Scholar] [CrossRef] [PubMed]
- Kaur, S.; Kaur, J.; Mavi, G.S.; Dhillon, G.S.; Sharma, A.; Singh, R.; Devi, U.; Chhuneja, P. Pyramiding of High Grain Weight with Stripe Rust and Leaf Rust Resistance in Elite Indian Wheat Cultivar Using a Combination of Marker Assisted and Phenotypic Selection. Front. Genet. 2020, 11, 593426. [Google Scholar] [CrossRef] [PubMed]
- Zhou, X.; Fang, T.; Li, K.; Huang, K.; Ma, C.; Zhang, M.; Li, X.; Yang, S.; Ren, R.; Zhang, P. Yield Losses Associated with Different Levels of Stripe Rust Resistance of Commercial Wheat Cultivars in China. Phytopathology 2022, 112, 1244–1254. [Google Scholar] [CrossRef] [PubMed]
- Hovmller, M.S.; Henriksen, K.E. Application of Pathogen Surveys, Disease Nurseries and Varietal Resistance Characteristics in an IPM Approach for the Control of Wheat Yellow Rust. Eur. J. Plant Pathol. 2008, 121, 377–385. [Google Scholar] [CrossRef]
- Wu, J.; Ma, S.; Niu, J.; Sun, W.; Dong, H.; Zheng, S.; Zhao, J.; Liu, S.; Yu, R.; Li, Y.; et al. Genomics-driven Discovery of Superior Alleles and Genes for Yellow Rust Resistance in Wheat. Nat. Genet. 2025, 57, 2017–2027. [Google Scholar] [CrossRef]
- Chen, X. Pathogens Which Threaten Food Security: Puccinia striiformis, the Wheat Stripe Rust Pathogen. Food Secur. 2020, 12, 239–251. [Google Scholar] [CrossRef]
- Mcintosh, R.A.; Dubcovsky, J.; Rogers, W.J.; Xia, X.C.; Raupp, W.J. Catalogue of Gene Symbols for Wheat: 2021 Supplement. Annu. Wheat Newsl. 2021, 67, 104–113. [Google Scholar]
- Klymiuk, V.; Chawla, H.S.; Wiebe, K.; Ens, J.; Fatiukha, A.; Govta, L.; Fahima, T.; Pozniak, C.J. Discovery of Stripe Rust Resistance with Incomplete Dominance in Wild Emmer Wheat Using Bulked Segregant Analysis Sequencing. Commun. Biol. 2022, 5, 826. [Google Scholar] [CrossRef]
- Liu, Z.Y.; Zhang, H.Z.; Bai, B.; Li, J.; Huang, L.; Xu, Z.B.; Chen, Y.X.; Liu, X.; Cao, T.J.; Li, M.M.; et al. Current Status and Strategies for Utilization of Stripe Rust Resistance Genes in Wheat Breeding Program of China. Sci. Agric. Sin. 2024, 57, 34–51. [Google Scholar]
- Klymiuk, V.; Wiebe, K.; Chawla, H.S.; Ens, J.; Subramaniam, R.; Pozniak, C.J. Coordinated Function of Paired NLRs Confers Yr84-Mediated Stripe Rust Resistance in Wheat. Nat. Genet. 2025, 57, 1535–1542. [Google Scholar] [CrossRef]
- Feng, J.; Yao, F.; Wang, M.; See, D.R.; Chen, X. Molecular Mapping of Yr85 and Comparison with Other Genes for Resistance to Stripe Rust on Wheat Chromosome 1B. Plant Dis. 2023, 107, 3585–3591. [Google Scholar] [CrossRef] [PubMed]
- Li, H.; Bariana, H.; Singh, D.; Zhang, L.Q.; Dillon, S.; Whan, A.; Bansal, U.; Ayliffe, M. A Durum Wheat Adult Plant Stripe Rust Resistance QTL and Its Relationship with The Bread Wheat Yr80 Locus. Theor. Appl. Genet. 2020, 133, 3049–3066. [Google Scholar] [CrossRef] [PubMed]
- Zhu, Z.; Cao, Q.; Han, D.; Wu, J.; Wu, L.; Tong, J.; Xu, X.; Yan, J.; Zhang, Y.; Xu, K.; et al. Molecular Characterization and Validation of Adult-Plant Stripe Rust Resistance Gene Yr86 in Chinese Wheat Cultivar Zhongmai 895. Theor. Appl. Genet. 2023, 136, 142. [Google Scholar] [CrossRef] [PubMed]
- Hu, Y.; Li, M.; Li, Y.; Du, L.; Xie, R.; Ni, F.; Xia, C.; Wang, K.; Huang, Y.; Xu, B.; et al. A Head-to-Head NLR Gene Pair from Wild Emmer Confers Stripe Rust Resistance in Wheat. Nat. Genet. 2025, 57, 1543–1552. [Google Scholar] [CrossRef]
- Nazarov, T.; Liu, Y.; Chen, X.; See, D.R. Molecular Mechanisms of the Stripe Rust Interaction with Resistant and Susceptible Wheat Genotypes. Int. J. Mol. Sci. 2024, 25, 2930. [Google Scholar] [CrossRef]
- Qiao, L.; Gao, X.; Jia, Z.; Liu, X.; Wang, H.; Kong, Y.; Qin, P.; Yang, B. Identification of Adult Resistant Genes to Stripe Rust in Wheat from Southwestern China Based on GWAS and WGCNA Analysis. Plant Cell Rep. 2024, 43, 67. [Google Scholar] [CrossRef]
- Tao, F.; Wang, J.; Guo, Z.; Hu, J.; Xu, X.; Yang, J.; Chen, X.; Hu, X. Transcriptomic Analysis Reveal the Molecular Mechanisms of Wheat Higher-Temperature Seedling-Plant Resistance to Puccinia striiformis f. sp. tritici. Front. Plant Sci. 2018, 9, 240. [Google Scholar] [CrossRef]
- Gao, F.; Zhu, J.; Xue, X.; Chen, H.; Nong, X.; Yang, C.; Shen, W.; Gan, P. Transcriptome Analysis Reveals Mechanisms of Stripe Rust Response in Wheat Cultivar Anmai1350. Int. J. Mol. Sci. 2025, 26, 5538. [Google Scholar] [CrossRef]
- Zeng, Q.; Zhao, J.; Wu, J.; Zhan, G.; Han, D.; Kang, Z. Wheat Stripe Rust and Integration of Sustainable Control Strategies in China. Front. Agric. Sci. Eng. 2022, 1, 37–51. [Google Scholar] [CrossRef]
- Zhao, J.; Kang, Z. Fighting Wheat Rusts in China: A Look Back and into the Future. Phytopathol. Res. 2023, 5, 6. [Google Scholar] [CrossRef]
- Wu, J.; Wang, X.; Chen, N.; Yu, R.; Yu, S.; Wang, Q.; Huang, S.; Wang, H.; Singh, R.P.; Bhavani, S.; et al. Association Analysis Identifies New Loci for Resistance to Chinese Yr26-Virulent Races of the Stripe Rust Pathogen in a Diverse Panel of Wheat Germplasm. Plant Dis. 2020, 104, 1751–1762. [Google Scholar] [CrossRef]
- Liu, N.; Lei, Y.; Zhang, M.; Zheng, W.M.; Shi, Y.C.; Qi, X.B.; Chen, H.B.; Zhou, Y.; Gong, G.S. Latent Infection of Powdery Mildew on Volunteer Wheat in Sichuan Province, China. Plant Dis. 2019, 103, 1084–1091. [Google Scholar] [CrossRef]
- McIntosh, R.; Mu, J.; Han, D.; Kang, Z. Wheat Stripe Rust Resistance Gene Yr24/Yr26: A Retrospective Review. Crop J. 2018, 4, 321–329. [Google Scholar] [CrossRef]
- Chen, J.; Zhang, L.; Liu, Y.; Shen, X.; Guo, Y.; Ma, X.; Zhang, X.; Li, X.; Cheng, T.; Wen, H.; et al. RNA-Seq-Based WGCNA and Association Analysis Reveal the Key Regulatory Module and Genes Responding to Salt Stress in Wheat Roots. Plants 2024, 13, 274. [Google Scholar] [CrossRef] [PubMed]
- Line, R.F.; Qayoum, A. Virulence, Aggressiveness, Evolution, and Distribution of Races of Puccinia striiformis (the Cause of Stripe Rust of Wheat) in North America 1968–87; Technical Bulletin Number 1788; United States Department of Agriculture: Washington, DC, USA, 1992.
- Qiao, L.; Li, T.; Liu, S.; Zhang, X.; Fan, M.; Zhang, X.; Li, X.; Yang, Z.; Jia, J.; Qiao, L.; et al. Ali-A1 and TPL1 Proteins Interactively Modulate Awn Development in Wheat. Crop J. 2025, 13, 468–479. [Google Scholar] [CrossRef]
- Qiao, L.; Zhang, X.; Li, X.; Zhang, L.; Zheng, J.; Chang, Z. Development of NBS-Related Microsatellite (NRM) Markers in Hexaploid Wheat. Euphytica 2017, 213, 256. [Google Scholar] [CrossRef]
- Qiao, L.; Zhang, X.; Li, X.; Yang, Z.; Li, R.; Jia, J.; Yan, L.; Chang, Z. Genetic Incorporation of Genes for the Optimal Plant Architecture in Common Wheat. Mol. Breed. 2022, 42, 66. [Google Scholar] [CrossRef]
- Zhang, H.; Yang, Y.; Wang, C.; Liu, M.; Li, H.; Fu, Y.; Wang, Y.; Nie, Y.; Liu, X.; Ji, W. Large-Scale Transcriptome Comparison Reveals Distinct Gene Activations in Wheat Responding to Stripe Rust and Powdery Mildew. BMC Genom. 2014, 15, 898. [Google Scholar] [CrossRef]
- Qiao, L.; Li, Y.; Wang, L.; Gu, C.; Luo, S.; Li, X.; Yan, J.; Lu, C.; Chang, Z.; Gao, W.; et al. Identification of Salt-Stress-Responding Genes by Weighted Gene Correlation Network Analysis and Association Analysis in Wheat Leaves. Plants 2024, 13, 2642. [Google Scholar] [CrossRef]
- Bariana, H.S.; McIntosh, R.A. Cytogenetic Studies in Wheat. XV. Location of Rust Resistance Genes in VPM1 and Their Genetic Linkage with Other Disease Resistance Genes in Chromosome 2A. Genome 1993, 36, 476–482. [Google Scholar] [CrossRef]
- Eriksen, L.; Afshari, F.; Christiansen, M.J.; McIntosh, R.A.; Jahoor, A.; Wellings, C.R. Yr32 for Resistance to Stripe (Yellow) Rust Present in the Wheat Cultivar Carstens V. Theor. Appl. Genet. 2004, 108, 567–575. [Google Scholar] [CrossRef] [PubMed]
- Bansal, U.K.; Hayden, M.J.; Keller, B.; Wellings, C.R.; Park, R.F.; Bariana, H.S. Relationship Between Wheat Rust Resistance Genes Yr1 and Sr48 and a Microsatellite Marker. Plant Pathol. 2009, 58, 1039–1043. [Google Scholar] [CrossRef]
- Feng, J.; Wang, M.; See, D.R.; Chao, S.; Zheng, Y.; Chen, X. Characterization of Novel Gene Yr79 and Four Additional Quantitative Trait Loci for All-Stage and High-Temperature Adult-Plant Resistance to Stripe Rust in Spring Wheat PI 182103. Phytopathology 2018, 108, 737–747. [Google Scholar] [CrossRef] [PubMed]
- Milus, E.A.; Lee, K.D.; Brown-Guedira, G. Characterization of Stripe Rust Resistance in Wheat Lines with Resistance Gene Yr17 and Implications for Evaluating Resistance and Virulence. Phytopathology 2015, 105, 1123–1130. [Google Scholar] [CrossRef]
- Wang, Y.; Hu, Y.; Gong, F.; Jin, Y.; Xia, Y.; He, Y.; Jiang, Y.; Zhou, Q.; He, J.; Feng, L.; et al. Identification and Mapping of QTL for Stripe Rust Resistance in the Chinese Wheat Cultivar Shumai126. Plant Dis. 2022, 106, 1278–1285. [Google Scholar] [CrossRef]
- Farzand, M.; Dhariwal, R.; Hiebert, C.W.; Spaner, D.; Randhawa, H.S. QTL Mapping for Adult Plant Field Resistance to Stripe Rust in the AAC Cameron/P2711 Spring Wheat Population. Crop Sci. 2022, 62, 1088–1106. [Google Scholar] [CrossRef]
- Liu, D.; Yuan, C.; Singh, R.P.; Randhawa, M.S.; Bhavani, S.; Kumar, U.; Huerta-Espino, J.; Lagudah, E.; Lan, C. Stripe Rust and Leaf Rust Resistance in CIMMYT Wheat Line “Mucuy” is Conferred by Combinations of Race-Specific and Adult-Plant Resistance Loci. Front. Plant Sci. 2022, 13, 880138. [Google Scholar] [CrossRef]
- Gebrewahid, T.W.; Zhang, P.; Zhou, Y.; Yan, X.; Xia, X.; He, Z.; Liu, D.; Li, Z. QTL Mapping of Adult Plant Resistance to Stripe Rust and Leaf Rust in a Fuyu3/Zhengzhou 5389 Wheat Population. Crop J. 2020, 8, 655–665. [Google Scholar] [CrossRef]
- Huang, S.; Liu, S.; Zhang, Y.; Xie, Y.; Wang, X.; Jiao, H.; Wu, S.; Zeng, Q.; Wang, Q.; Singh, R.P.; et al. Genome-Wide Wheat 55K SNP-Based Mapping of Stripe Rust Resistance Loci in Wheat Cultivar Shaannong 33 and Their Alleles Frequencies in Current Chinese Wheat Cultivars and Breeding Lines. Plant Dis. 2021, 105, 1048–1156. [Google Scholar] [CrossRef] [PubMed]
- Thompson, M.D.; Jacks, C.M.; Lenvik, T.R.; Gantt, J.S. Characterization of Rps17, Rp19 and Rpl15: Three Nucleus-Encoded Plastid Ribosomal Protein Genes. Plant Mol. Biol. 1992, 18, 931–944. [Google Scholar] [CrossRef] [PubMed]
- Kopriva, S.; Koprivova, A. Plant Adenosine 5′-Phosphosulphate Reductase: The Past, the Present, and the Future. J. Exp. Bot. 2004, 55, 1775–1783. [Google Scholar] [CrossRef] [PubMed]
- Lee, J.; Amasino, R.M. Two FLX Family Members are Non-Redundantly Required to Establish the Vernalization Requirement in Arabidopsis. Nat. Commun. 2013, 4, 2186. [Google Scholar] [CrossRef]
- Nandakumar, M.; Malathi, P.; Sundar, A.R.; Rajadurai, C.P.; Philip, M.; Viswanathan, R. Role of MiRNAs in the Host-Pathogen Interaction Between Sugarcane and Colletotrichum falcatum, the Red Rot Pathogen. Plant Cell Rep. 2021, 40, 851–870. [Google Scholar] [CrossRef]
- Vasudevan, D.; Gopalan, G.; Kumar, A.; Garcia, V.J.; Luan, S.; Swaminathan, K. Plant Immunophilins: A Review of Their Structure-Function Relationship. Biochim. Biophys. Acta 2015, 1850, 2145–2158. [Google Scholar] [CrossRef]
- Cui, X.; Wei, Y.; Wang, Y.H.; Li, J.; Wong, F.L.; Zheng, Y.J.; Yan, H.; Liu, S.S.; Liu, J.L.; Jia, B.L.; et al. Proteins Interacting with Mitochondrial ATP-Dependent Lon Protease (MAP1) in Magnaporthe oryzae are Involved in Rice Blast Disease. Mol. Plant Pathol. 2015, 16, 847–859. [Google Scholar] [CrossRef]
- Xiao, L.; Jin, Y.; Liu, W.; Liu, J.; Song, H.; Li, D.; Zheng, J.; Wang, D.; Yin, Y.; Liu, Y.; et al. Genetic Basis Analysis of Key Loci in 23 Yannong Series Wheat Cultivars/Lines. Front. Plant Sci. 2022, 13, 1037027. [Google Scholar] [CrossRef]
Disclaimer/Publisher’s Note: The statements, opinions and data contained in all publications are solely those of the individual author(s) and contributor(s) and not of MDPI and/or the editor(s). MDPI and/or the editor(s) disclaim responsibility for any injury to people or property resulting from any ideas, methods, instructions or products referred to in the content. |
© 2025 by the authors. Licensee MDPI, Basel, Switzerland. This article is an open access article distributed under the terms and conditions of the Creative Commons Attribution (CC BY) license (https://creativecommons.org/licenses/by/4.0/).