Article

Probabilistic Assessment of Crop Yield Loss Under Drought and Global Warming in the Canadian Prairies

1
Prairie Adaptations Research Collaborative, University of Regina, Regina, SK S4S 0A2, Canada
2
Department of Statistics, Lorestan University, Khorramabad 6815144316, Iran
*
Author to whom correspondence should be addressed.
Agronomy 2025, 15(11), 2484; https://doi.org/10.3390/agronomy15112484
Submission received: 25 September 2025 / Revised: 21 October 2025 / Accepted: 22 October 2025 / Published: 25 October 2025
(This article belongs to the Special Issue Agroclimatology and Crop Production: Adapting to Climate Change)

Abstract

This study assessed the vulnerability of canola, spring wheat, and barley yields in the Canadian Prairies to drought stress under future climate scenarios, integrating DSSAT crop models with NEX-GDDP CMIP6 projections and probabilistic copula analysis. The DSSAT simulations reproduced historical yields with high accuracy (d > 0.7, nRMSE < 15–20%), confirming its applicability for Prairie agroecosystems. Results indicate distinct crop-specific sensitivities to warming: barley showed relative resilience with modest yield gains (~10%) at 1.5–2 °C of global warming (GW), wheat exhibited heterogeneous responses with early minor gains (~1%) followed by declines (~8%) beyond 3 °C of GW, and canola displayed consistent and substantial losses (20–37%) even under moderate warming. Spatial analysis highlighted relatively stable regions in northern Alberta, central Saskatchewan, and southern Manitoba (Gray and Black soil zones), while the southern and southwestern Prairie areas (Brown and Black-Brown zones) showed the greatest yield declines. Copula-based analysis further revealed that canola is most vulnerable to dry conditions, with yield exceedance probabilities falling from 62% (wet years) to ~25–28% (dry years) under GW. These findings underscore that Prairie crop production faces increasingly heterogeneous risks, with canola emerging as the most climate-sensitive crop. Targeted adaptation strategies such as stress-tolerant cultivars, shifting cropping zones, and improved water management will be essential to mitigate projected drought impacts and sustain Prairie agricultural productivity.

1. Introduction

Drought is a common and gradually intensifying natural hazard characterized by insufficient precipitation, leading to decreased streamflow and soil moisture [1,2,3]. It is the dominant climate risk for the Canadian Prairies Provinces of Alberta, Saskatchewan, and Manitoba. These provinces have heavy reliance on agriculture, accounting for roughly 51% of Canada’s total agricultural production, with canola being the most valuable crop, contributing over $29.9 billion annually to the national economy and supporting 207,000 jobs across the supply chain [4]. Thus, any impacts on the region’s agricultural production would be a significant challenge for the entire country. Climate change is expected to exacerbate these risks, with Prairie temperatures already rising by 1.7 °C (1948–2016) and projected to increase by 2–6 °C by 2100, depending on emission scenarios [5]. Such conditions could intensify drought frequency and severity, further endangering an agricultural sector that contributed $26.3 billion to the GDP and employed over 115,500 people in 2021 [6]. Therefore, long-term changes to climate variables or an increased frequency of extreme weather events such as droughts may result in devastating losses to cropping systems. The Prairies’ vital role in Canada’s economy and food security justifies an analysis of future drought patterns and their impact on agricultural productivity and food supply.
Drought is commonly categorized into four major types: meteorological, agricultural, hydrological, and socioeconomic [7]. In recent years, studies have assessed the potential impact of climate change on crops in different regions of the world, using different indicators depending on drought types [8,9,10]. Although earlier studies provided useful insights into drought impacts on agriculture, most relied on deterministic approaches that describe average yield responses to drought. For instance, Li et al. (2009) [8] applied a deterministic correlation-based framework to assess drought risk for global crop production, which primarily described mean relationships between yield and drought indices. Their results emphasized the growing drought hazard but did not explicitly address the nonlinear and uncertain interactions among climatic drivers, highlighting the need for probabilistic approaches to better capture compound climate–yield variability. Such methods, however, do not adequately reflect the inherent variability and uncertainty of climate systems or crop performance, and may therefore oversimplify the true risks to agricultural productivity. Stochastic and probabilistic frameworks better capture this complexity. By incorporating uncertainty in climate inputs, these approaches provide a more comprehensive understanding of drought-related yield risks [11]. In this context, copula methods have gained prominence in multivariate analyses [12,13,14]. Copulas are particularly effective because they allow for flexible modeling of nonlinear and asymmetric dependencies between variables such as crop yields and drought indices without relying on restrictive assumptions. This makes them well-suited for assessing complex interactions that traditional correlation-based methods may fail to capture [11,14].
Generally, few studies have examined the impacts of drought on crop production using the copula method. Ribeiro et al. (2019) [11] examined agricultural drought using a copula model for two major rainfed cereals in the Iberian Peninsula (wheat and barley) during the period 1986–2016. The results showed that yield anomalies and drought conditions tend to jointly produce extremely low values, with barley being particularly vulnerable. Different copula models represent varying joint risks across crops, with drought severity correlating to increased crop loss risk. Li et al. (2022) [12] investigated the vulnerability of maize to drought stress in three provinces of Northeast China and quantified the drought thresholds that cause different levels of maize yield loss using a Copula-Bayesian conditional probability bivariate model. They found that drought thresholds for yield losses (30%, 40%, and 50%) varied across provinces. Over time, drought sensitivity increased, requiring worse conditions to trigger the same yield loss. Reduced precipitation and higher evapotranspiration drove these shifts, highlighting growing risks for maize.
A significant limitation that remains unaddressed in these studies is the failure to incorporate climate change projections to simulate how drought conditions may impact crop loss. While our previous study [15] evaluated the impacts of climate change on Prairie crop yields using DSSAT simulations under CMIP6 time-slice scenarios, the present work advances this line of research by adopting a more risk-oriented framework. Specifically, we apply the global warming level (GWL) approach, which links crop responses to global warming thresholds (1.5, 2, and 3 °C above the historical baseline) rather than to calendar-based periods, thereby providing insights that are more directly connected to international climate targets. In addition, we integrate a probabilistic copula-based method to quantify joint drought–yield risks, explicitly capturing nonlinear dependencies and lower-tail behavior that deterministic averages overlook. By incorporating Prairie soil zones as a basis for regional variability, this study also highlights geographic differences in drought sensitivity and crop vulnerability. Together, these innovations distinguish the current research from our earlier publication by moving from deterministic yield projections toward a probabilistic, spatially explicit assessment of climate-induced crop loss. Hence, the purpose of this research is to analyze the probability of canola, spring wheat and barley yield losses to drought conditions using a copula-based framework in the Prairie Provinces of Canada. The Decision Support System for Agro-technology Transfer (DSSAT) crop modelling platform [16] considers factors such as cultivar genetics, soil moisture, soil carbon, nitrogen content, and agricultural practices to simulate crop production at any given location [17]. The DSSAT model was utilized with NEX-GDDP climate model data based on the SSP 8.5 greenhouse gas emission scenario. The primary objectives of this study are twofold: (1) to assess the susceptibility of canola, spring wheat and barley yield to drought stress based on global warming scenarios-increases of 1.5, 2 and 3 °C relative to a historical baseline (1985–2014) and (2) to quantify the dynamic nature of drought thresholds leading to canola, spring wheat and barley yield response.

2. Materials and Methods

2.1. Study Area

The present study focused on the 468 Census Subdivisions (CSDs) of the Canadian Prairie provinces—Alberta (AB), Saskatchewan (SK), and Manitoba (MB), which are located between −120 to −90 degrees longitude and 45 to 65 degrees latitude (Figure 1). CSDs were used because they provide an appropriate administrative and statistical scale for regional agricultural assessment, offering consistent boundaries for linking crop yield, soil, and climate data while excluding non-agricultural northern areas. The climate is marked by extremes, with cold winters (January averaging −16 °C) and short, hot summers (July averaging 17 °C). Precipitation and temperature exhibit spatial gradients, decreasing toward the southwest and northeast, respectively [18]. The ecosystems of the Prairie Ecozone are highly influenced by precipitation, which averages 454 mm annually— significantly lower than Canada’s national average [19].
Seasonal precipitation distribution is uneven, with one-third falling as snow and the majority as rain during the growing season [20]. Ecologically diverse, the region encompasses agricultural lands, grasslands, and boreal forests. Hydrologically, it features extensive non-contributing areas. Snowmelt generates roughly 80% of Prairie streamflow, as much of the warm-season precipitation is lost to infiltration and evapotranspiration [20]. The region’s soils are predominantly Chernozemic, varying from brown to black and grey along a gradient, which influences agricultural practices and soil health [21]. The Prairie Ecozone has over 70% of Canadian agricultural land, and climate changes have been identified as the primary stressor affecting farming productivity [22,23]. Key crops, such as wheat, barley, canola, peas, and lentils, have high water demands, particularly during their early growth stages, making the region vulnerable to drought [24].

2.2. Decision Support System for Agrotechnology Transfer

This study employed the DSSAT software suite (v4.8.0) to simulate the growth and yield of spring wheat (AC Barrie), barley (AC Lacombe), and canola (InVigor 5440) under varying environmental and management conditions. DSSAT integrates weather, soil, and management data to dynamically represent crop responses to climate, nutrient, and water stresses. The CERES-Wheat, CERES-Barley, and CROPGRO-Canola modules compute phenology using growing degree days (GDD), biomass accumulation from intercepted radiation, and yield formation influenced by leaf area, plant architecture, and stress factors.
Cultivar-specific genetic coefficients were calibrated using long-term field data from Swift Current (wheat), Breton (barley), and Brandon (canola). Parameters were sequentially optimized, beginning with phenology (e.g., flowering, maturity), followed by yield components. The Generalized Likelihood Uncertainty Estimation (GLUE) method was applied, with PHINT further refined using GenCalc for improved accuracy [25]. Model performance was validated against indepequationendent experimental years using statistical indices, including the index of agreement (d) [26], modeling efficiency (EF) [27,28], and normalized RMSE (nRMSE):
n R M S E = i = 1 n ( S i M i ) 2 n / M ¯ × 100  
E F = 1 i = 1 n S i M i 2 / i = 1 n ( M i M ¯ ) 2
d = 1 i = 1 n S i M i 2 / i = 1 n ( S i M ¯ + M i M ¯ ) 2
where S i and M i are the i th model-simulated and measured values, respectively, n is the number of data pairs of simulated and measured values, and M ¯ is the average of the measured values.

2.3. NEX-GDDP-CMIP6

The NASA Earth Exchange Global Daily Downscaled Projections for CMIP6 (NEX-GDDP-CMIP6) were derived from the new generation of state-of-the-art GCM simulations that comprise the Coupled Model Intercomparison Project Phase 6 (CMIP6). NEX-GDDP-CMIP6 provides an extensive collection of statistically downscaled climate scenarios on a global scale, covering a historical period from 1950 to 2014 and future projections from 2015 to 2100 under the SSP1-2.6 (low emission), SSP2-4.5 (medium emission), and SSP5-8.5 (high emission) scenarios [29]. The Bias-Correction Spatial Disaggregation (BCSD) technique [30,31] was adopted to generate these datasets, addressing the need for more refined resolutions in climate research and effectively bridging the gap between coarse-scale outputs and the demand for finer-grained data [31]. Table 1 provides information on these NEX-GDDP-CMIP6 model datasets.
Our analysis of drought indices and crop yield using the DSSAT model is based on 21 simulations from the NEX-GDDP-CMIP6 ensemble at 0.22°, which is ~25 km spatial resolution and using the SSP8.5 emission scenario to define the global warming levels of 1.5, 2, 3 °C and 4 °C, as shown in Table 2.

2.4. Drought Indices

We used the Standardized Precipitation Evapotranspiration Index (SPEI) as a meteorological drought index during the growing season (from May to August). The SPEI proposed by Vicente-Serrano et al. (2010) [33] calculates the index value using the difference (D) between monthly precipitation (P) and potential evapotranspiration (PET) for each month ( i ) and then uses the inverse standard normal distribution to transfer the cumulative probability density functions to the drought index value. The most commonly used PET calculation methods include the Penman-Monteith [34], Thornthwaite [35], and Hargreaves [36] equations. We selected the Penman-Monteith model to estimate PET. Positive/negative values of the SPEI indicate wet/dry conditions, so that continuously negative SPEI values define a drought period based on intensity, severity, magnitude and duration [37].
D i = P i P E T i
This index considers the influence of precipitation and temperature on drought, combining the advantages of other meteorological drought indices, such as PDSI and SPI [38].
The probability density function (pdf) (f(x)) of the three-parameter log-logistic distribution variable is defined by Equation (3):
f x = β α x y α [ 1 + x y α ) ] 2
where α, β and y are the scale, shape and origin parameters, respectively, which are obtained using the L-moment procedure for D values in the range (y > D > ∞). Therefore, the PDF of the D series is given by the following equation:
F x = 1 + ( α x y ) β 1
The estimated drought event is classified as shown in Table 1. In this study, the 3-month time scale is used to characterize drought events for SPEI [39]. Generally, these meteorological drought index classifications, ranging from negative to positive values, are shown in Table 3.

2.5. Copula-Based Model

One of the important issues in statistical analysis is describing the complex dependence structure among the variables under investigation. A copula is a type of multivariate distribution function characterized by margins that follow a uniform distribution within the unit interval. According to Sklar’s theorem [40], there is a distinct copula that accurately represents the dependency relationships among continuous random variables. A copula is a function that links the multivariate distribution function to its one-dimensional marginal distribution functions [41]. For example, if X 1 and X 2 are two random variables with distribution function F X 1 x 1 and F X 2 x 2 , respectively, the bivariate distribution function F X 1 , X 2 x 1 , x 2 can be obtained using F X 1 , X 2 x 1 , x 2   =   C u ,   v , where u   =   F X 1 x 1 , v   =   F X 2 x 2 and function C . , . is the copula function. In fact, by having the marginal distributions of X and Y variables, the joint distribution of these two variables can be determined using the copula function. Joint distributions are important because they can be used to access conditional distributions of variables. By having conditional distributions, it is possible to observe the changes in one variable, assuming the value of another variable is known. The basic theorem in copula theory that guarantees the existence of the copula function C is Sklar’s theorem. In the following, we state the exact definition of the copula and the Sklar theorem for the case where we have d variables.
Definition 1.
(Copula function) Let   X = X 1 , ,   X d   R d   be a random vector. Let   F X x   be the cumulative distribution function (CDF) of   X , i.e.,   F X X 1 x 1 ,   ,   X d x d . Further, we denote   F 1 , ,   F d   to be the marginal CDF of   X 1 , , X d . A copula is a function   C :   0,1 d 0,1   with the following properties:
  • For any   j = 1 , ,   d ,   C 1 , ,   1 ,   u j , 1 ,   , 1 = u j .
  • C u C v   if   u v , where   u v   means that   u j v j   for all   j = 1 , ,   d .
  • C   is   d -increasing, i.e., for any box   a ,   b 0,1 d   with non-empty volume,   C a ,   b > 0 .
Theorem 1.
(Sklar’s theorem) For a random vector   X   =   X 1 , , X d   with CDF   F   and univariate marginal CDFs   F 1 , ,   F d , there exists a copula   C   such that
F x 1 , , x d   =   C F 1 x 1 , , F d x d .
If   X   is continuous, then such a copula   C   is unique.
In this study, we employed copula functions to estimate the potential responses of annual crop yields to drought indices.
Moreover, we used three bivariate copula families (Table 4) for fitting the joint probability distribution between a drought index (x) and crop yields (y). Thus, according to Sklar’s theorem:
F X Y X , Y = C [ F X X , F Y Y ]
The conditional probability of crop yield dropping exceeding a certain amount ( Y > y ) under a given drought event ( X   =   x ) can be represented as follows:
P ( Y > y X = x ) = 1 F Y X y x
where F Y X ( y x ) is the conditional distribution function. The conditional probability density function of F Y X ( y x ) is expressed as follows [42,43]:
F Y X y x =   C F X x , F Y y . f Y y
where c is the probability density function (PDF) of the continuous copula function and f Y y is the PDF of the marginal distribution for crop yield. The probability of crop yield exceeding a certain amount (i.e.,   F Y X Y > y X = x ) can be estimated as the area under F Y X y x for Y > y .
In this study, we used the SPEI and observed crop yield for the period 1984 to 2022 to build a probabilistic modeling framework for estimating yield loss risk for each copula. To be spatially consistent with observation-based analysis, the gridded crop model simulations were aggregated to RM. To determine the most appropriate copula function for each pairing of drought indicators and crop yields, we utilized the parametric bootstrapping goodness-of-fit test as described by Genest and Rémillard (2008) [44] and Sadegh et al. (2017) [45]. Additional information regarding the test statistics and the copula selection process can be found in the Multivariate Copula Analysis Toolbox (MvCAT) referenced by Sadegh et al. (2017). Among the various copulas evaluated, the most suitable option produces the lowest test statistic (S) and the highest p-value is considered [45]. Because the effective growing season varies slightly across the Prairies (e.g., an earlier start in parts of Alberta), we adopted a uniform May–August window to ensure cross-provincial comparability in the drought–yield analysis. In a sensitivity check for Alberta using an April–July window, SPEI and the resulting drought–yield relationships were nearly identical; therefore, we retained May–August as a standardized window.

3. Results

3.1. DSSAT Model Calibration and Validation

Table 5 shows the calibration and validation statistics for the DSSAT modelling of crop yield for Canadian prairie conditions (i.e., soil, weather and crop management practices data). We used the DSSAT-CERES-Wheat, DSSAT-CERES-Barley and CSM-CROPGRO-Canola models for calibration and validation. The d-values for the calibration and validation periods for all crops exceeded the threshold of 0.7, indicating high accuracy. Additionally, EF shows values greater than or equal to 0, while nRMSE falls within the range of 15% to 30% for DSSAT-CERES-Wheat and less than 15% for DSSAT-CERES-Barley and CSM-CROPGRO-Canola, which indicates a remarkable similarity between the observed and simulated spring wheat yields.

3.2. Impacts of Future Climate Change on Crop Yield

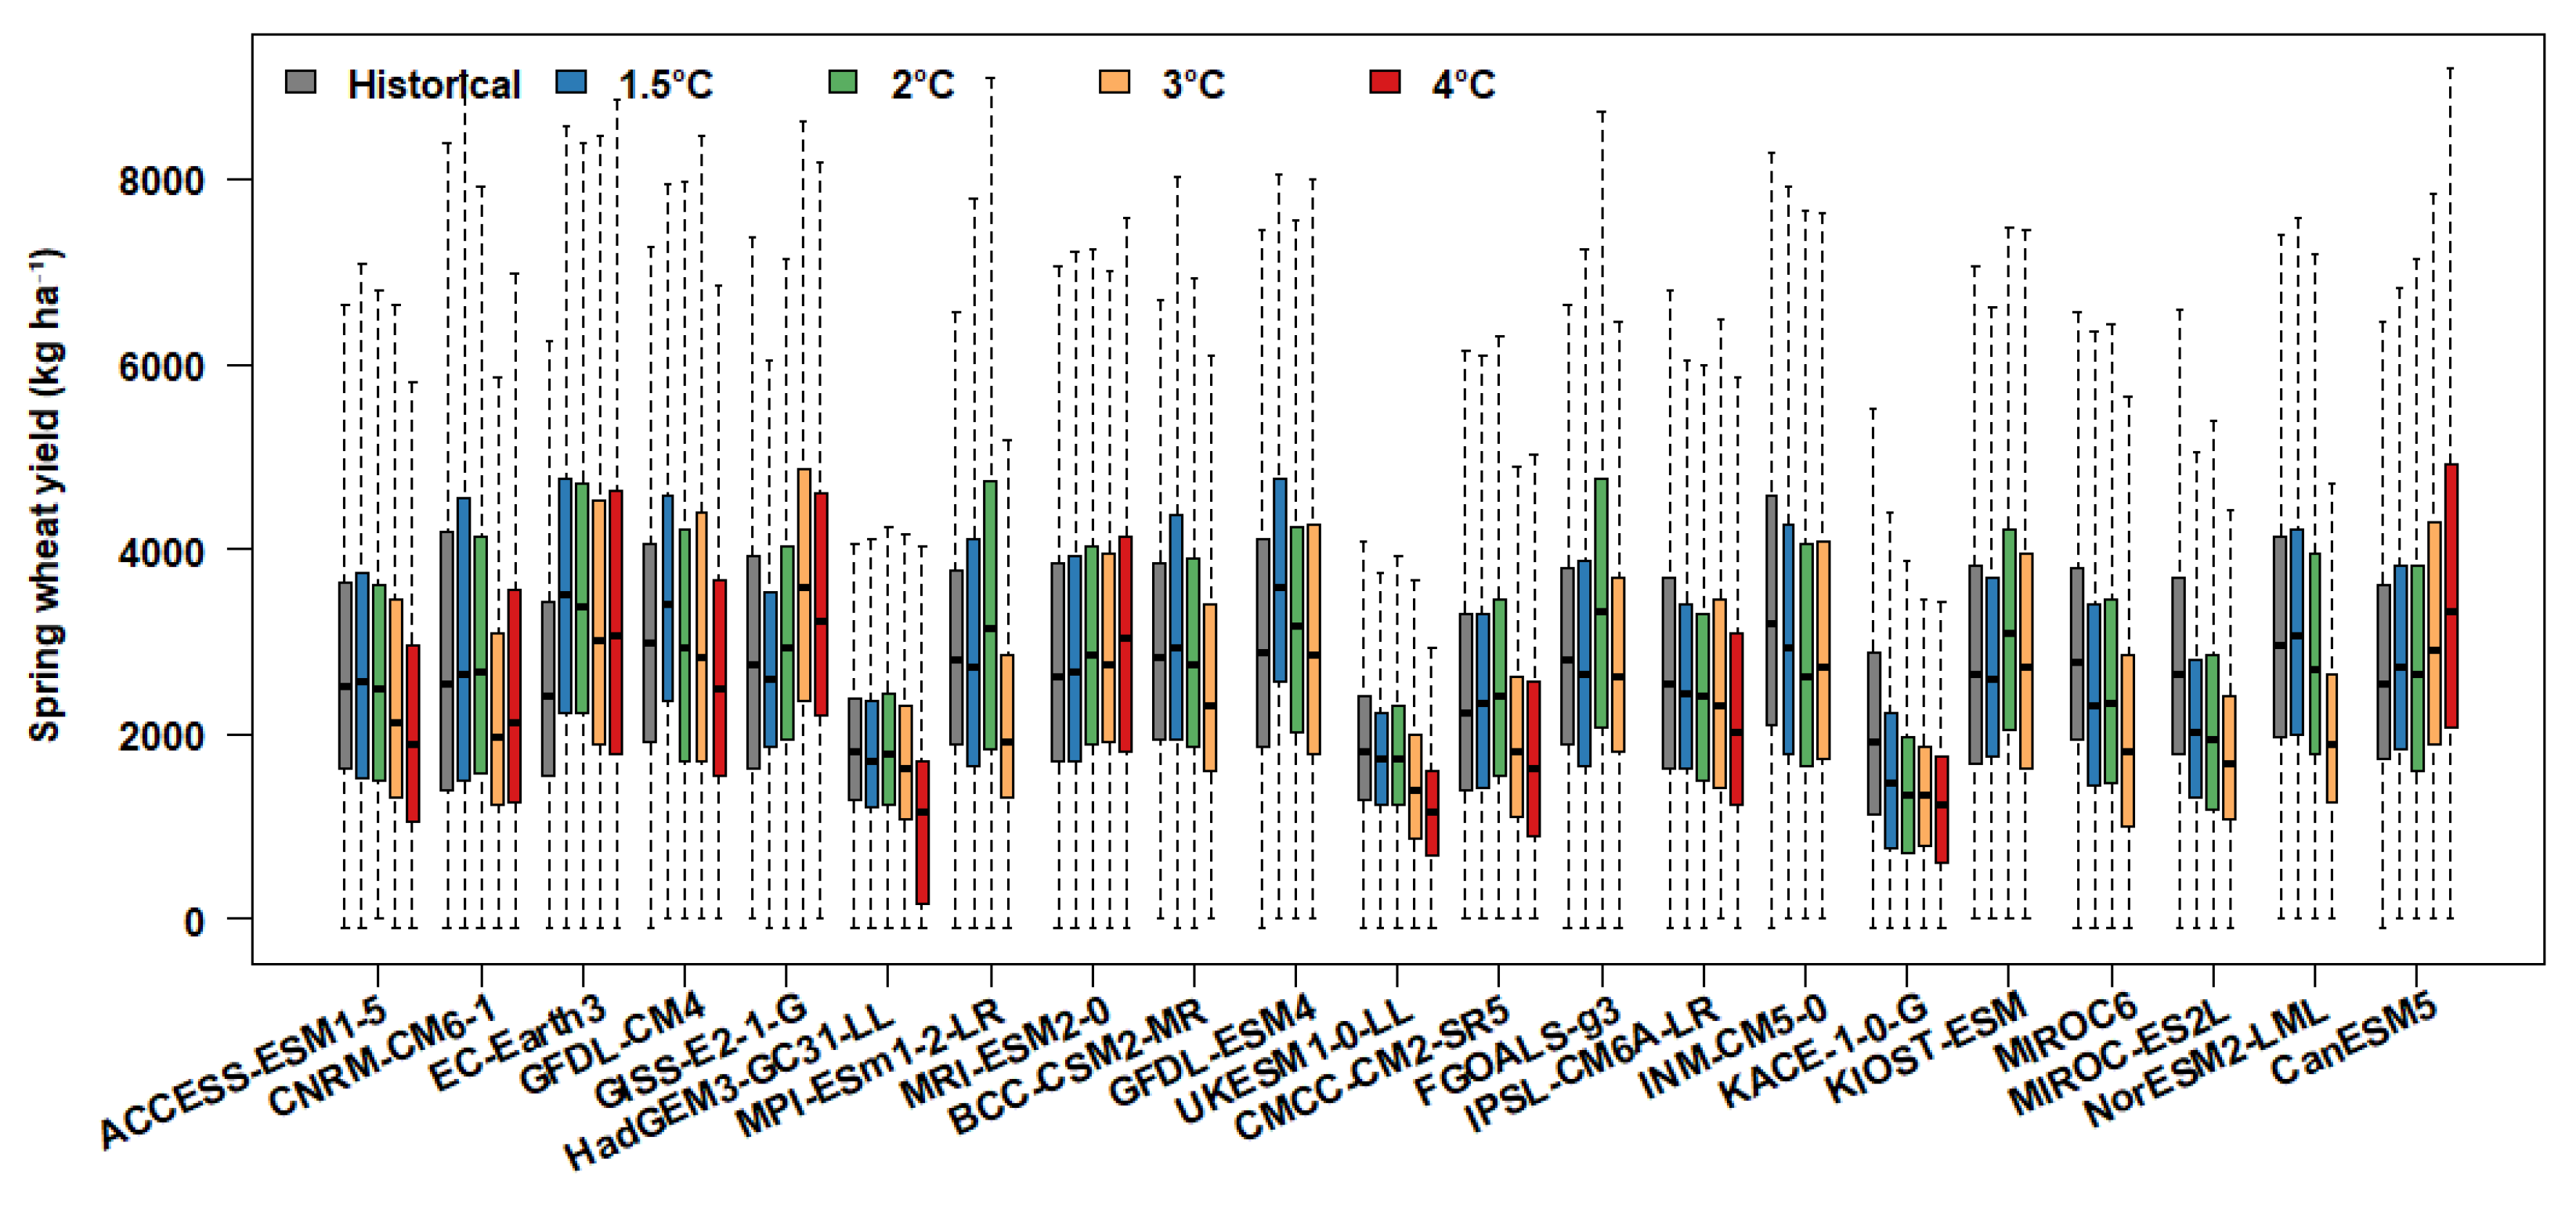
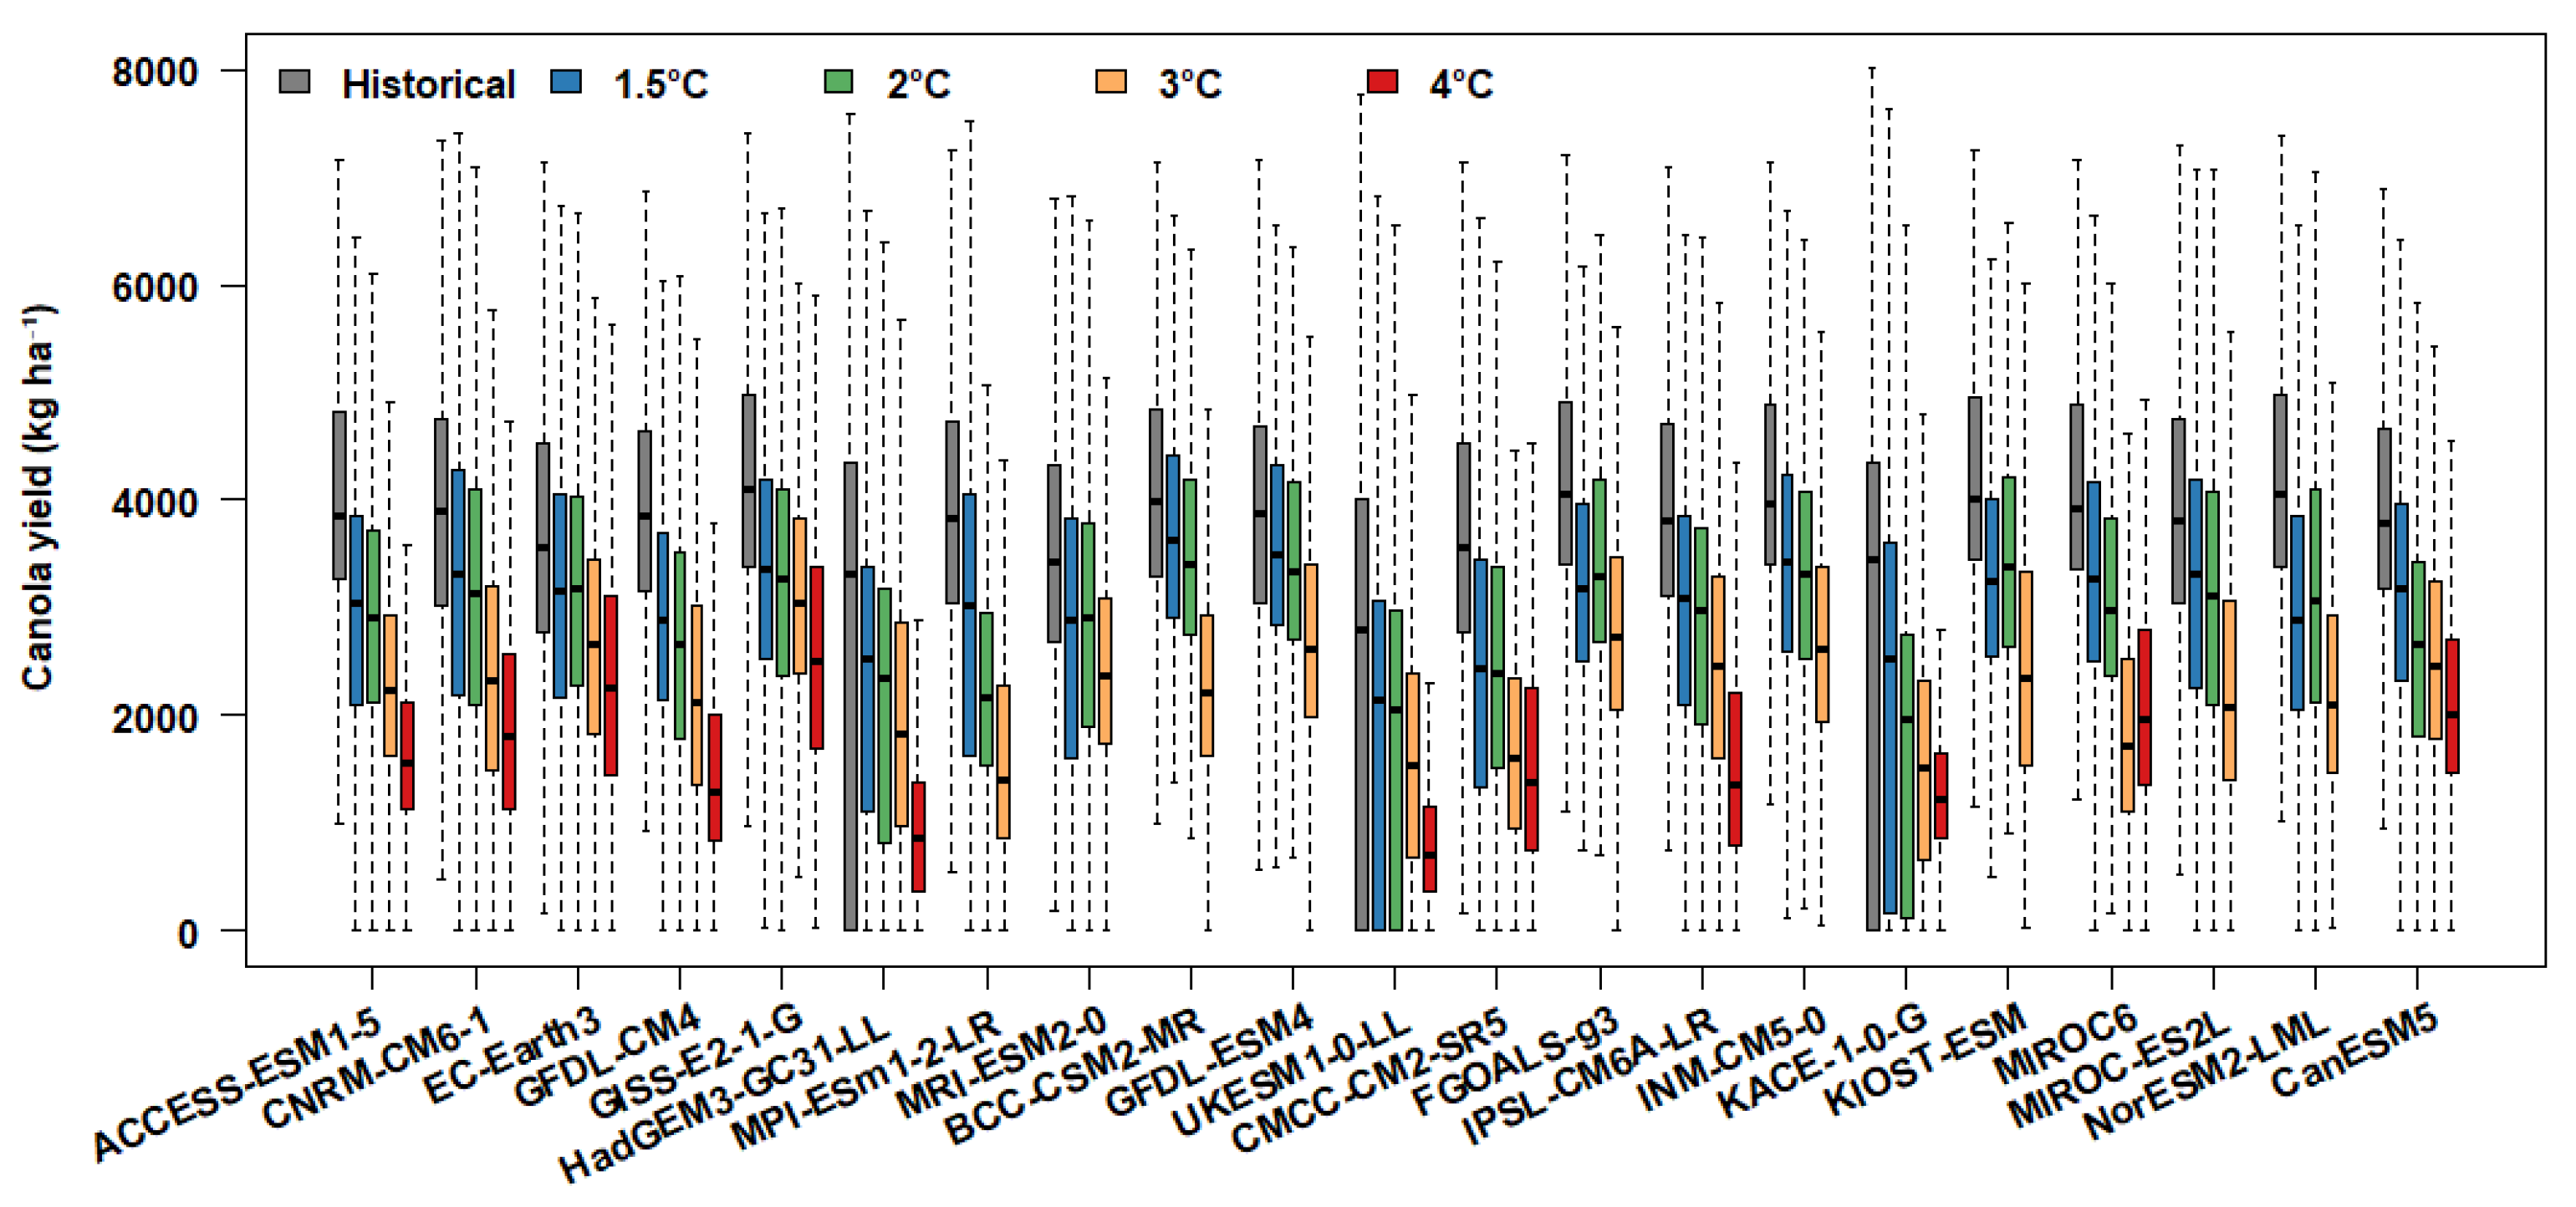
Figure 2, Figure 3 and Figure 4 summarize results for the DSSAT modelling of spring wheat, barley and canola across the prairie agricultural zone (468 CSDs). The boxplots illustrate distinct shifts in yield distributions across warming levels and GCMs. Spring wheat shows mixed responses so that several models (e.g., ACCESS-ESM1-5, EC-Earth3, MPI-ESM1-2-LR) maintain yields at 1.5 °C of warming, while more substantial declines emerge beyond 2 °C, particularly under HadGEM3-GC31-LL and IPSL-CM6A-LR. Canola yields exhibit the steepest and most consistent reductions, with most GCMs projecting substantial downward shifts, especially at 3 °C and 4 °C of GW. By contrast, barley demonstrates relatively greater resilience, with several models (e.g., GFDL-ESM4, BCC-CSM2-MR, NorESM2-LMM) indicating modest increases or stable yields even under moderate to high levels of warming. However, interquartile ranges widen with warming across all crops, suggesting increased variability and uncertainty in yield outcomes.
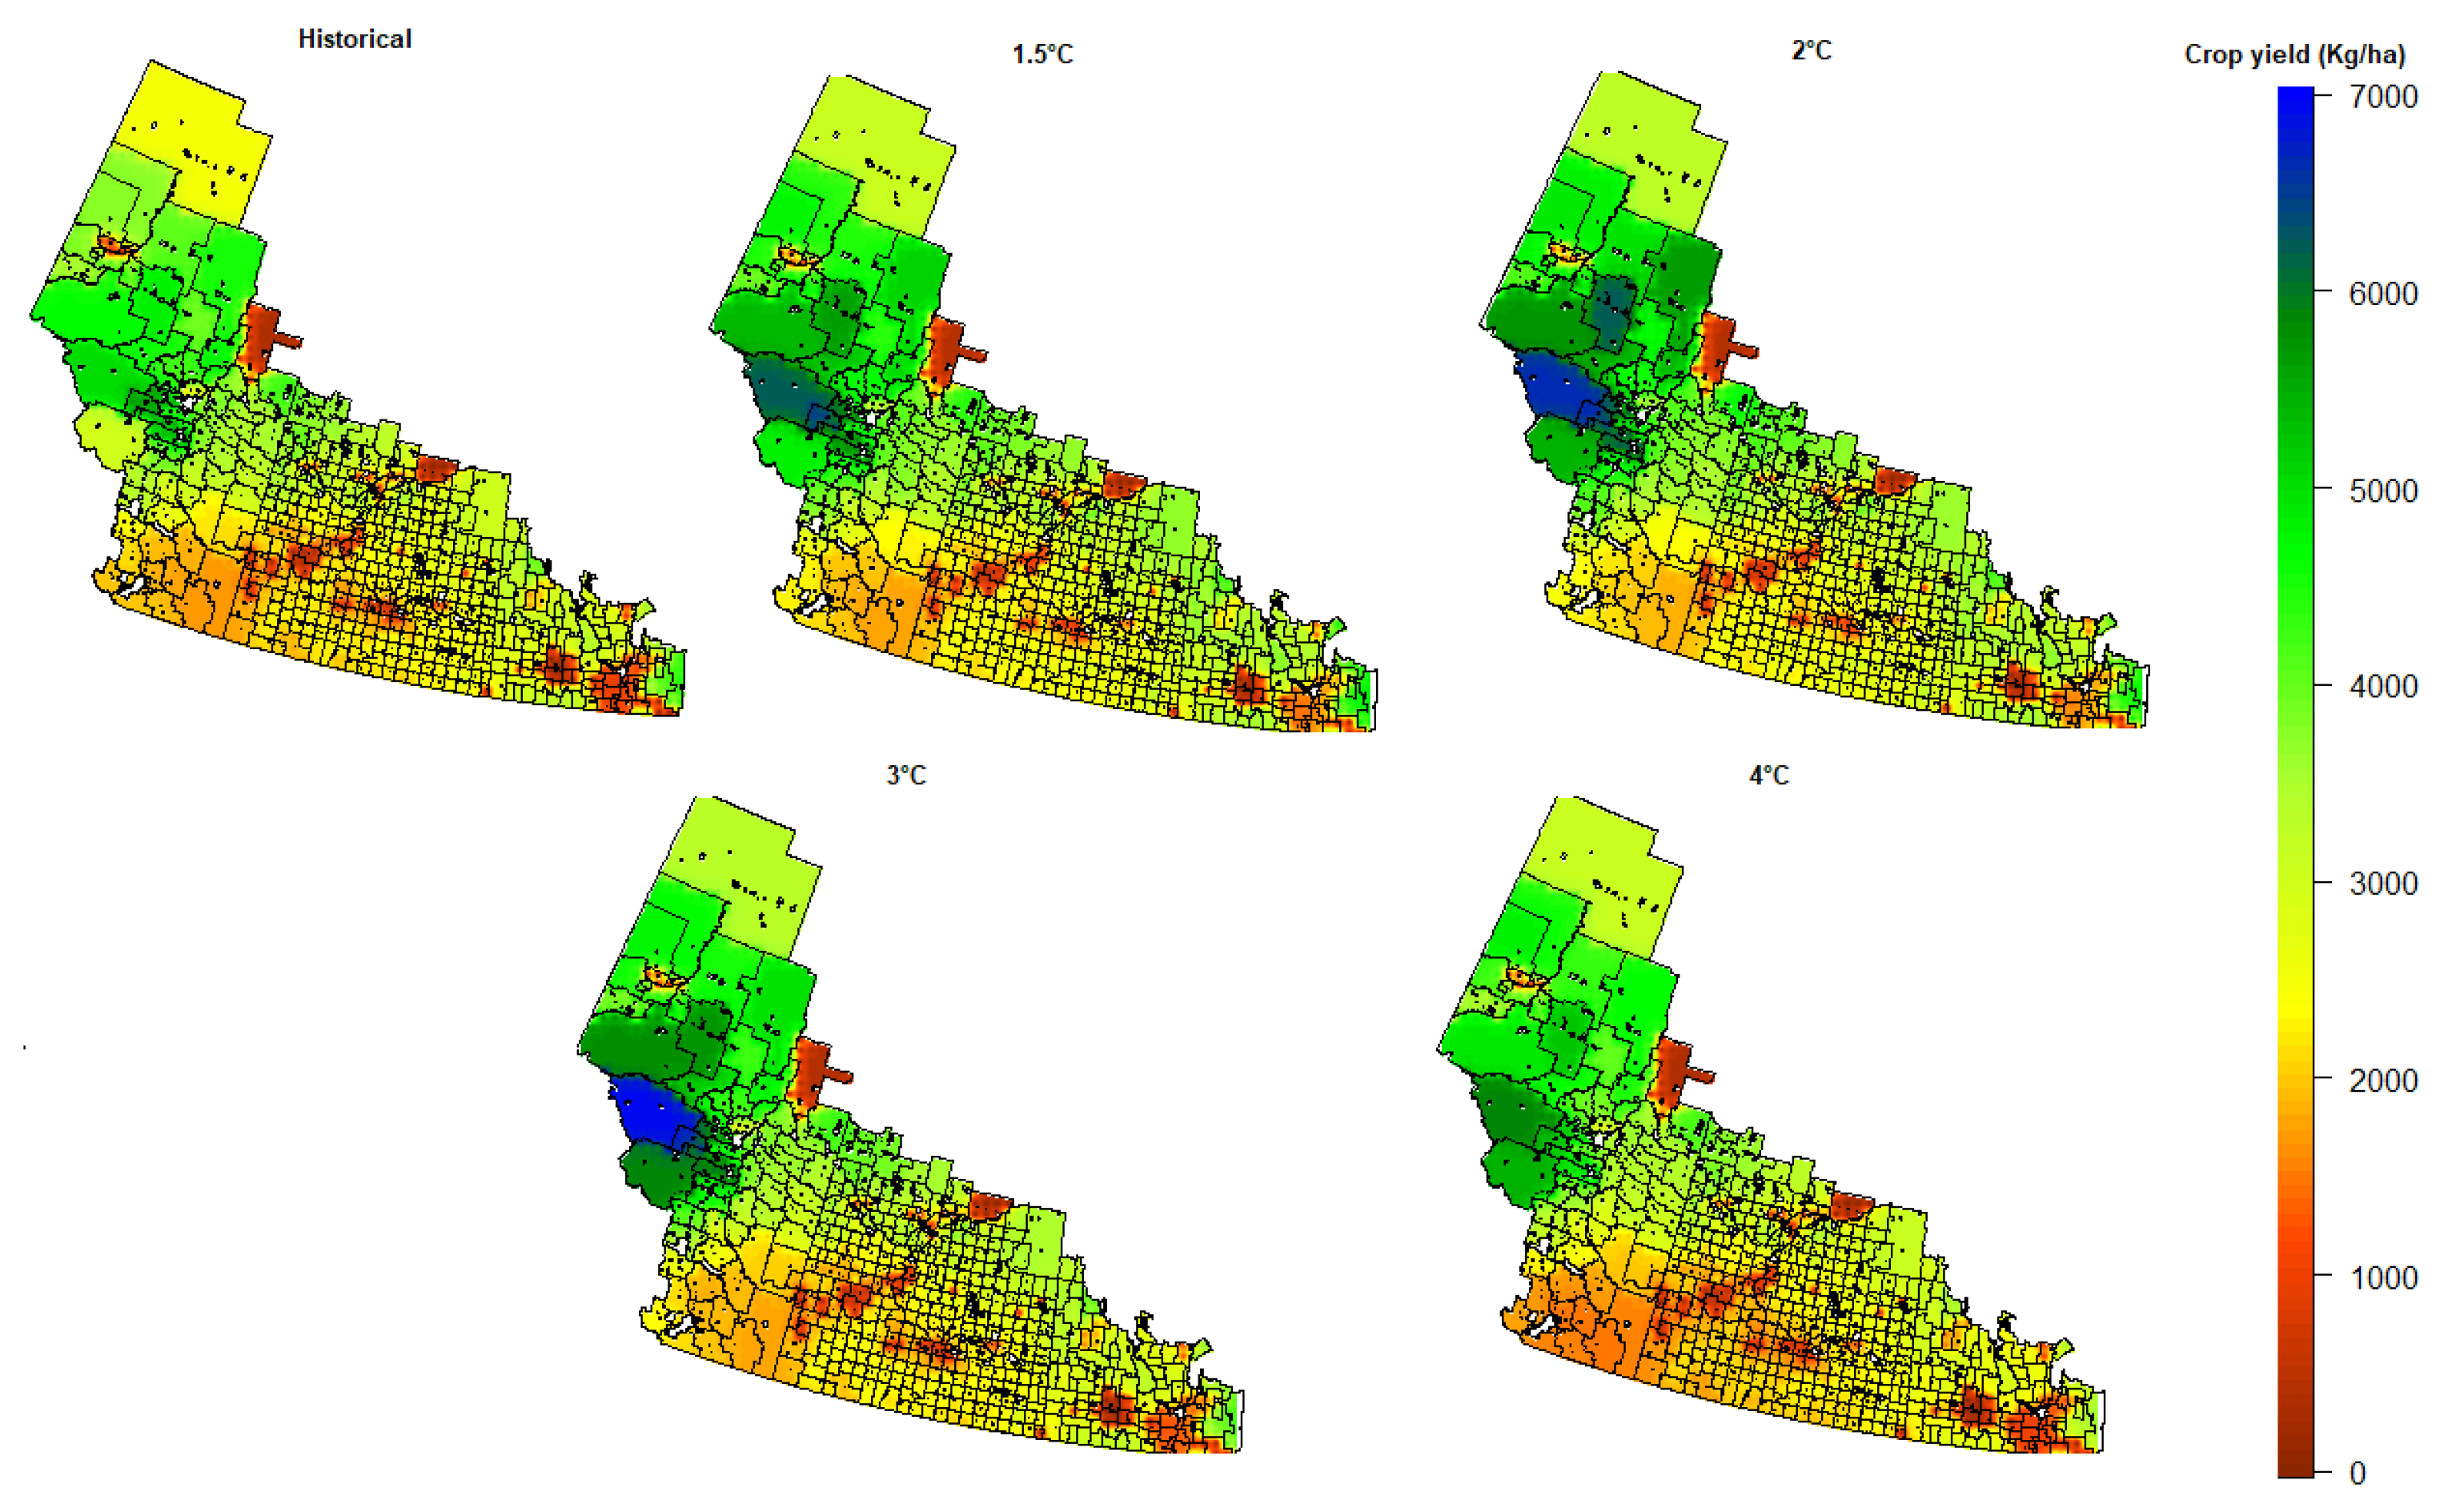
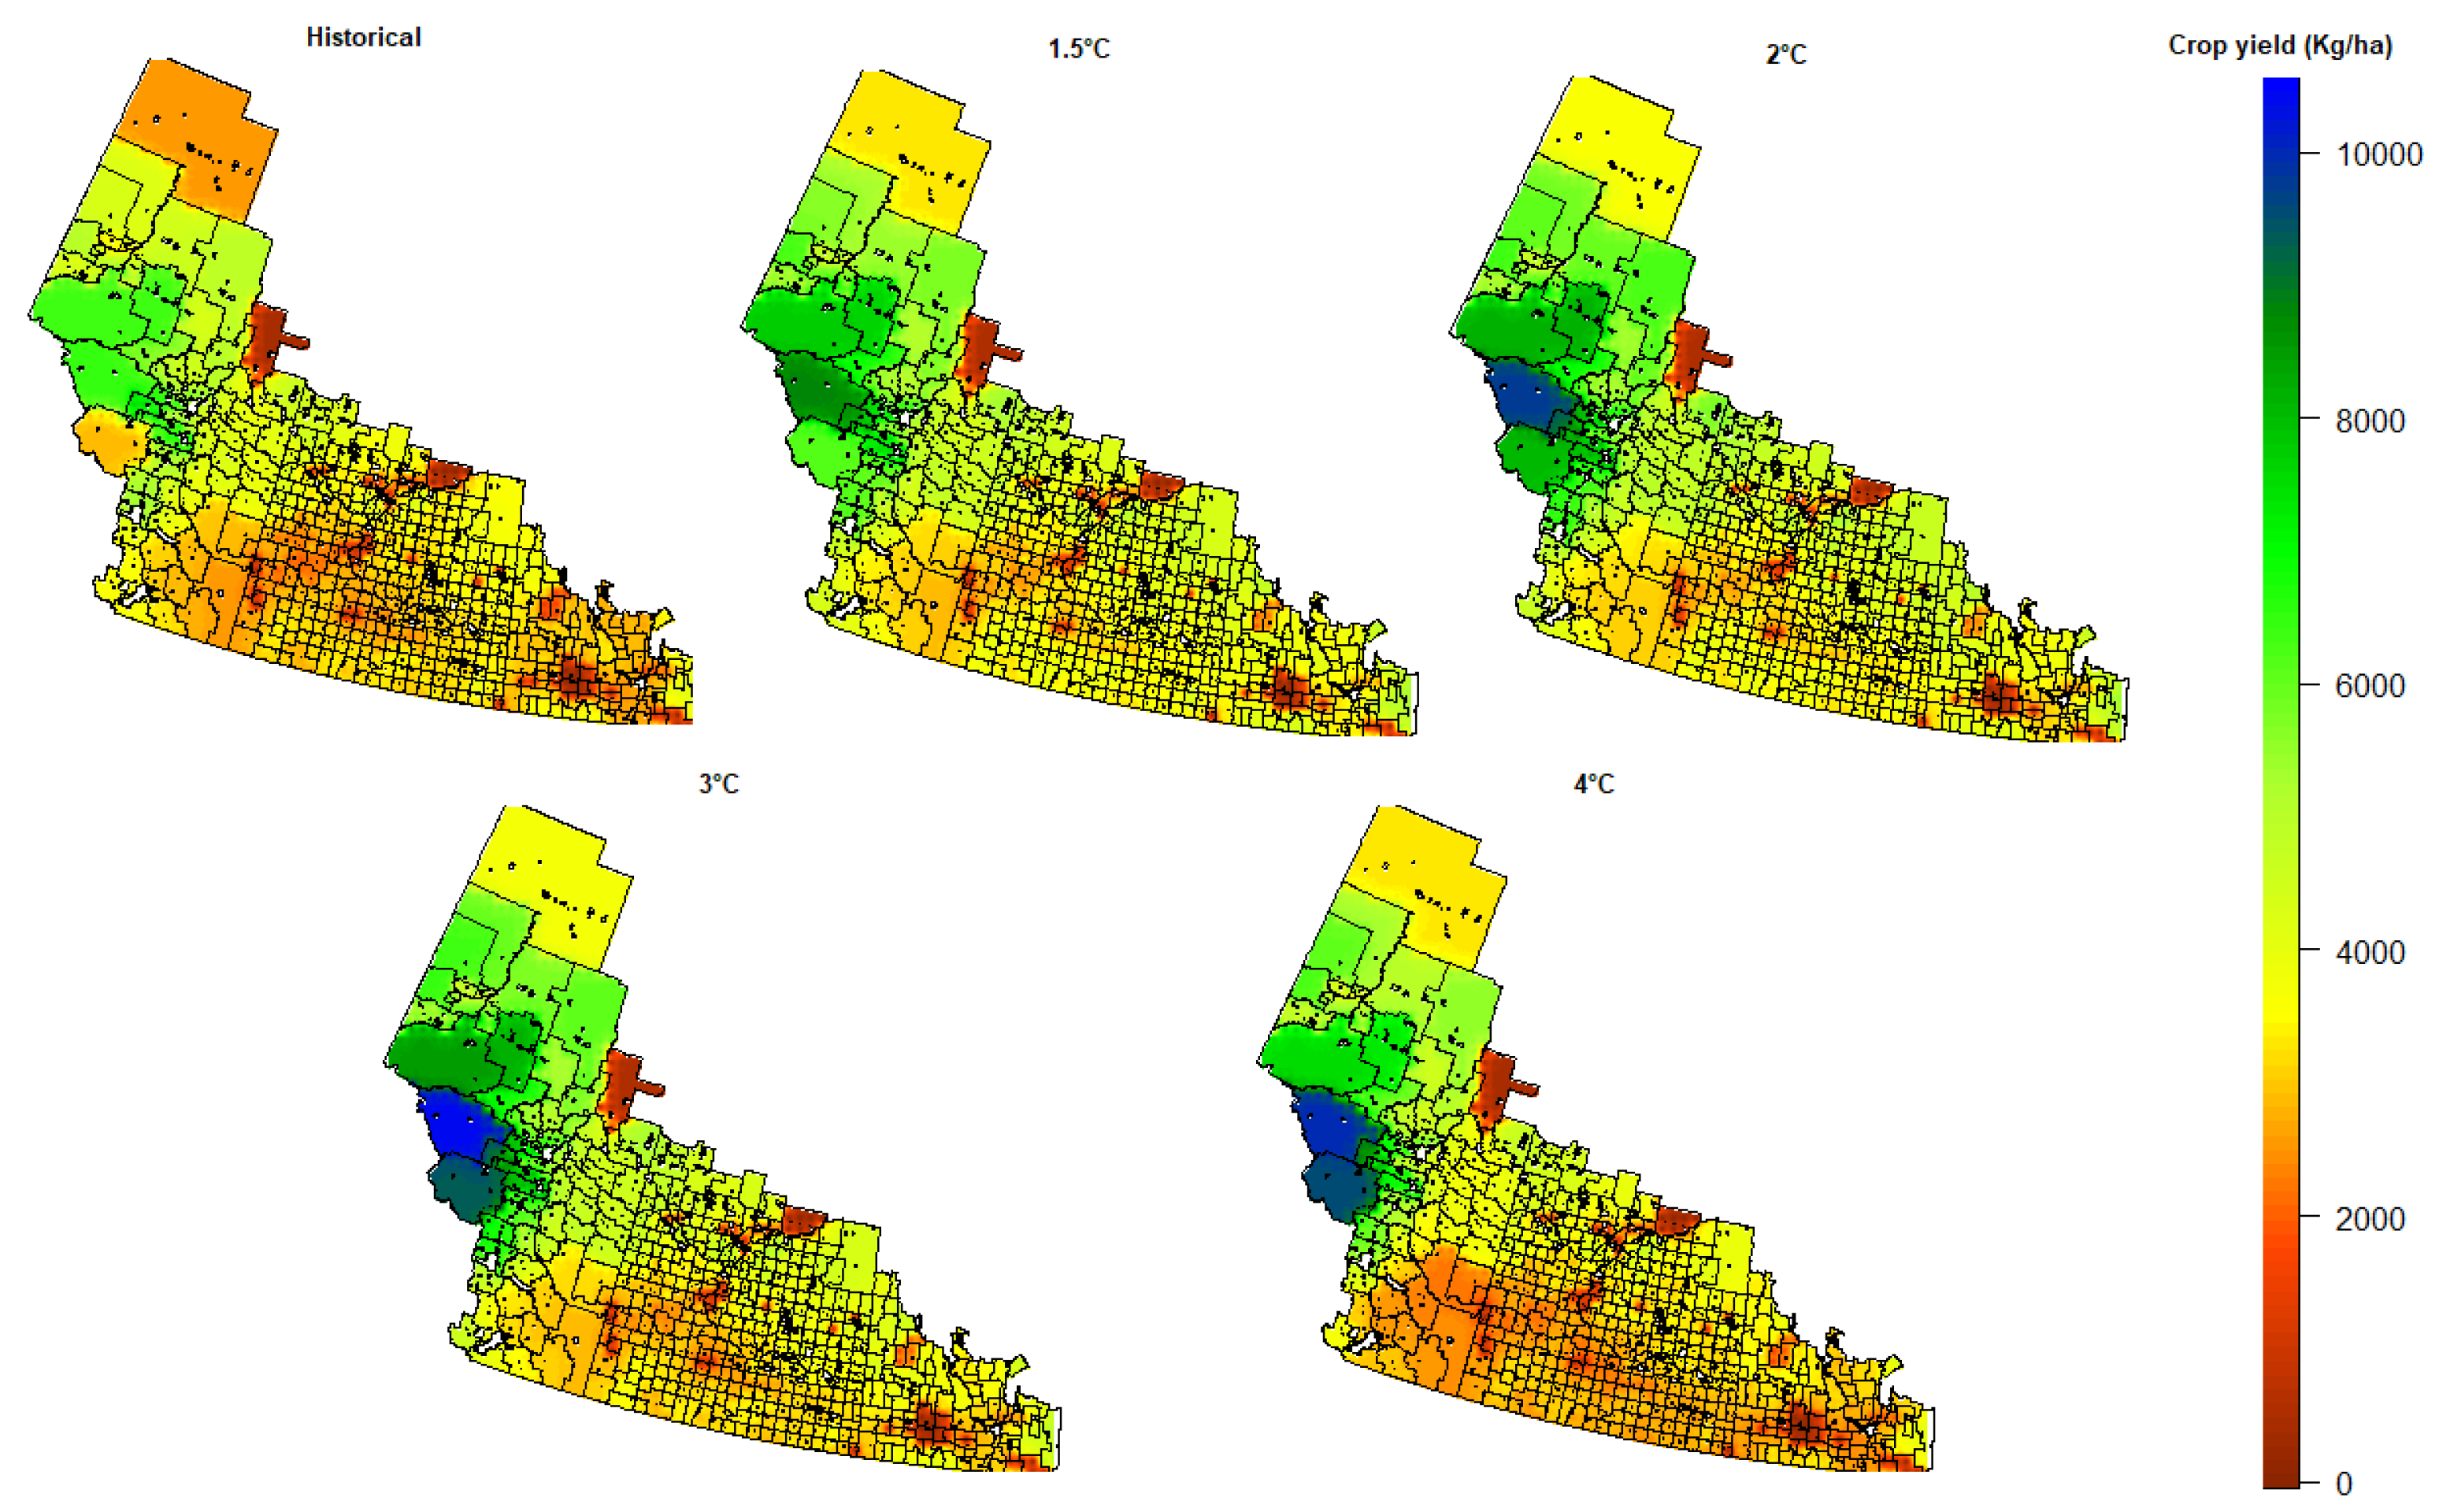
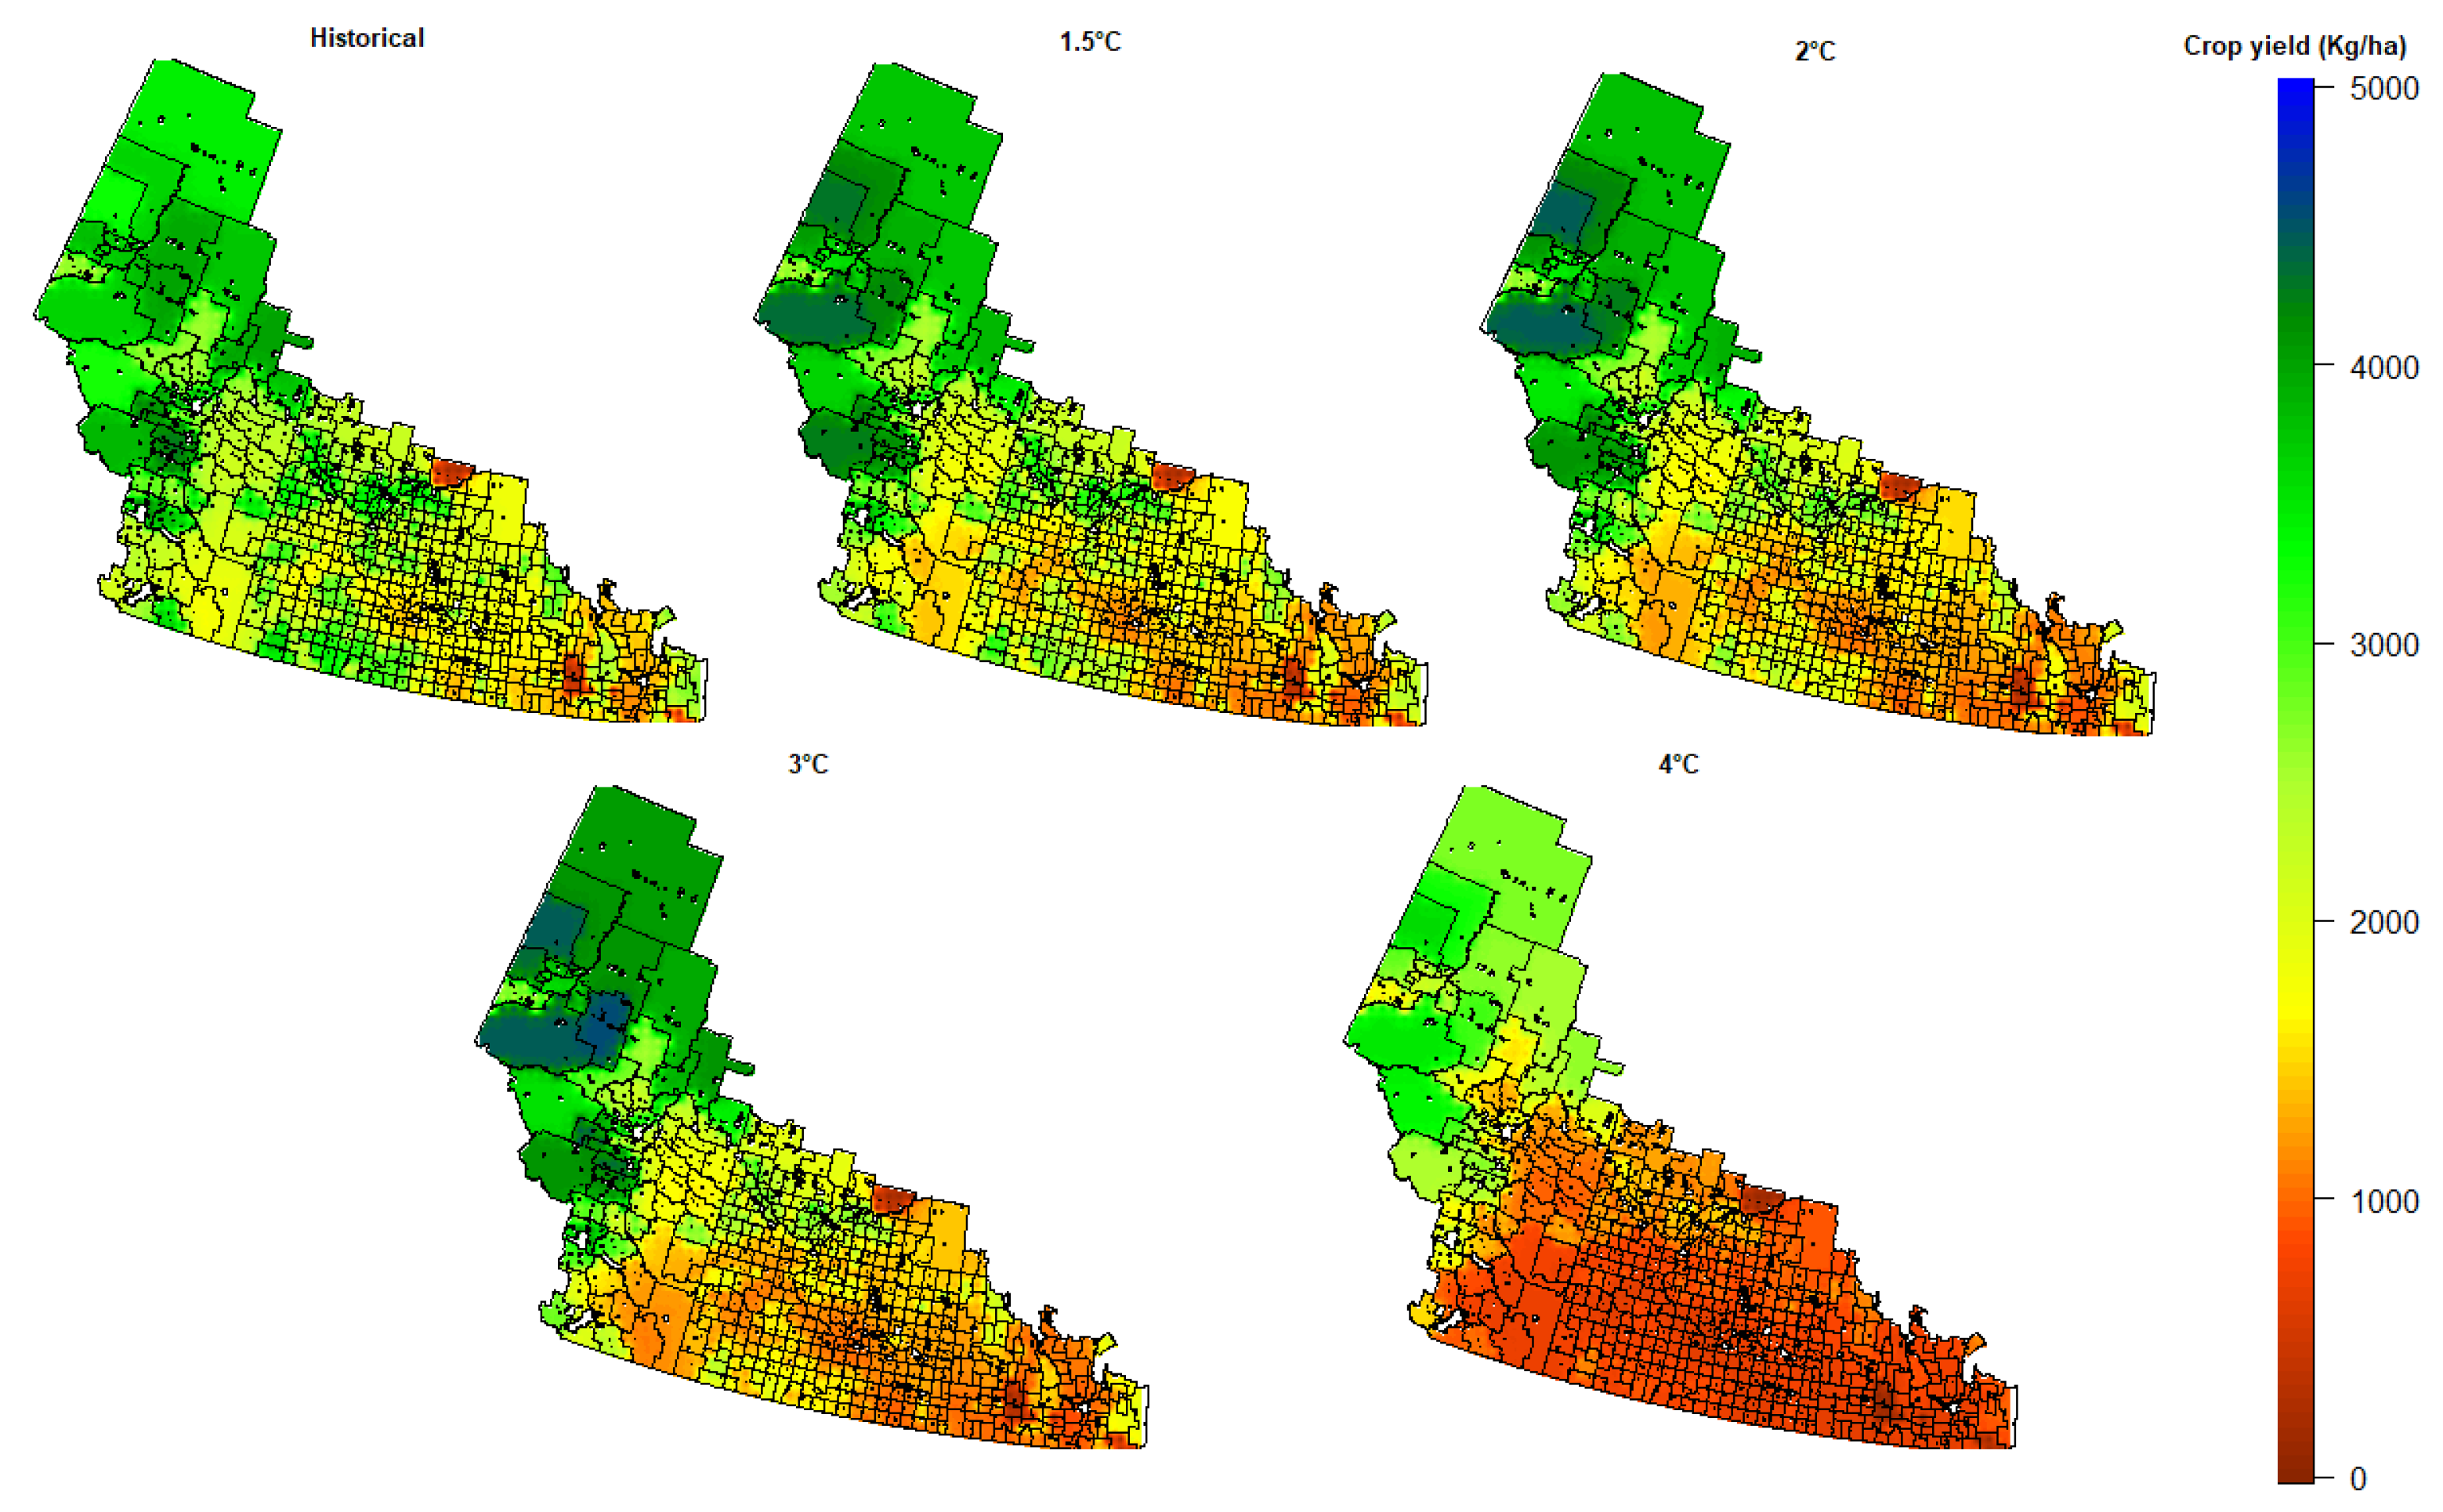
Figure 5, Figure 6 and Figure 7 are maps showing the spatial distribution of ensemble-median barley, wheat and canola yields. The spatial distribution of crop yields under historical and warming scenarios highlights clear geographic patterns of vulnerability and resilience across the Prairie provinces. For barley, yields are generally higher in the northern and central zones under historical and 1.5–2 °C of warming, with only modest reductions appearing under 3 °C and 4 °C, particularly in the southern drier regions. Wheat shows more mixed outcomes: northern zones maintain relatively stable or even improved yields at 1.5–2 °C, while southern and southwestern areas exhibit substantial declines beyond 3 °C. In contrast, canola demonstrates sharp and spatially widespread declines, with losses already evident at 1.5 °C and intensifying toward 4 °C, especially in the southern and southeastern growing regions. Across all crops, the expansion of low-yield zones (orange to red colors) under higher warming illustrates increasing risk to Prairie agriculture.
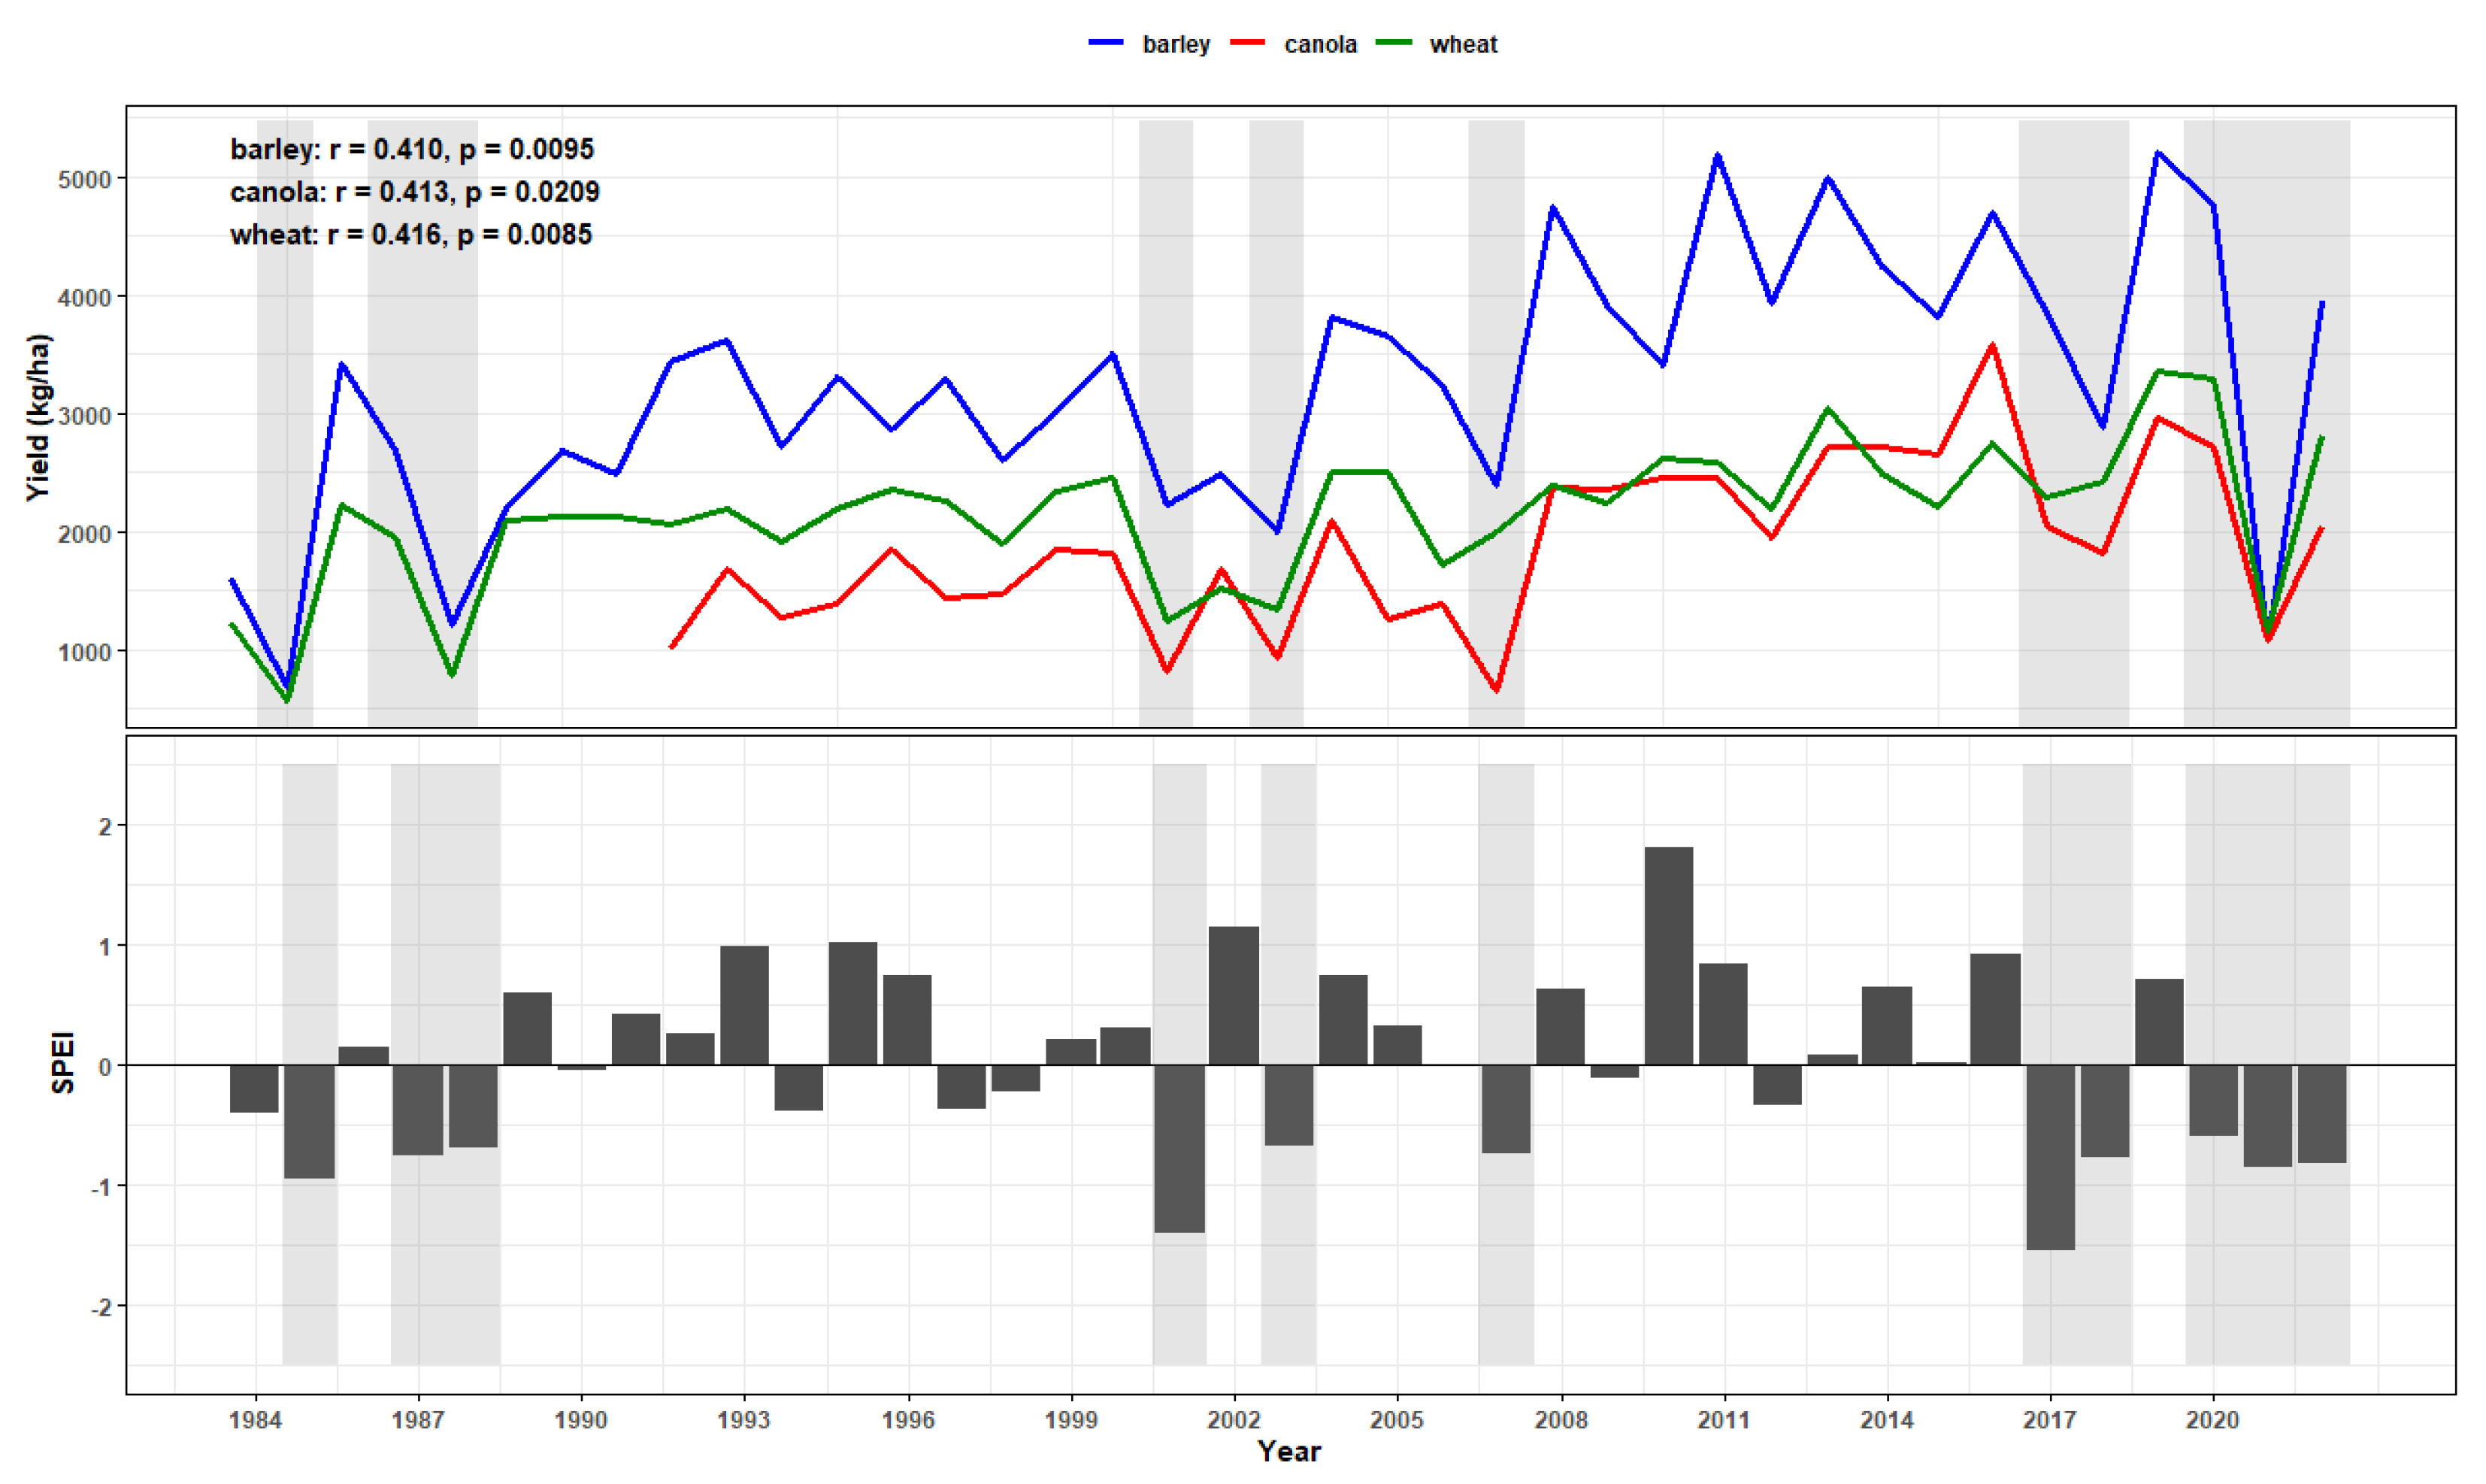
In this study, we analyzed long-term crop yield trends for barley, canola, and wheat in relation to drought variability using SPEI. The results show that all three crops exhibit statistically significant positive correlations between annual yield and climatic moisture availability, demonstrating consistent yield reductions during drought years. Notably, barley yield showed the greatest interannual variability, peaking over 5000 kg/ha in favorable years but dropping sharply during drought episodes. Canola also displayed considerable sensitivity, with distinct yield declines frequently associated with SPEI values below −0.5, indicating moderate to severe drought stress (highlighted in the gray-shaded regions in Figure 8). These drought periods, including those around 2002, 2017, and 2021, coincided with sharp yield reductions across all crops, confirming that drought remains a dominant limiting factor in crop productivity.
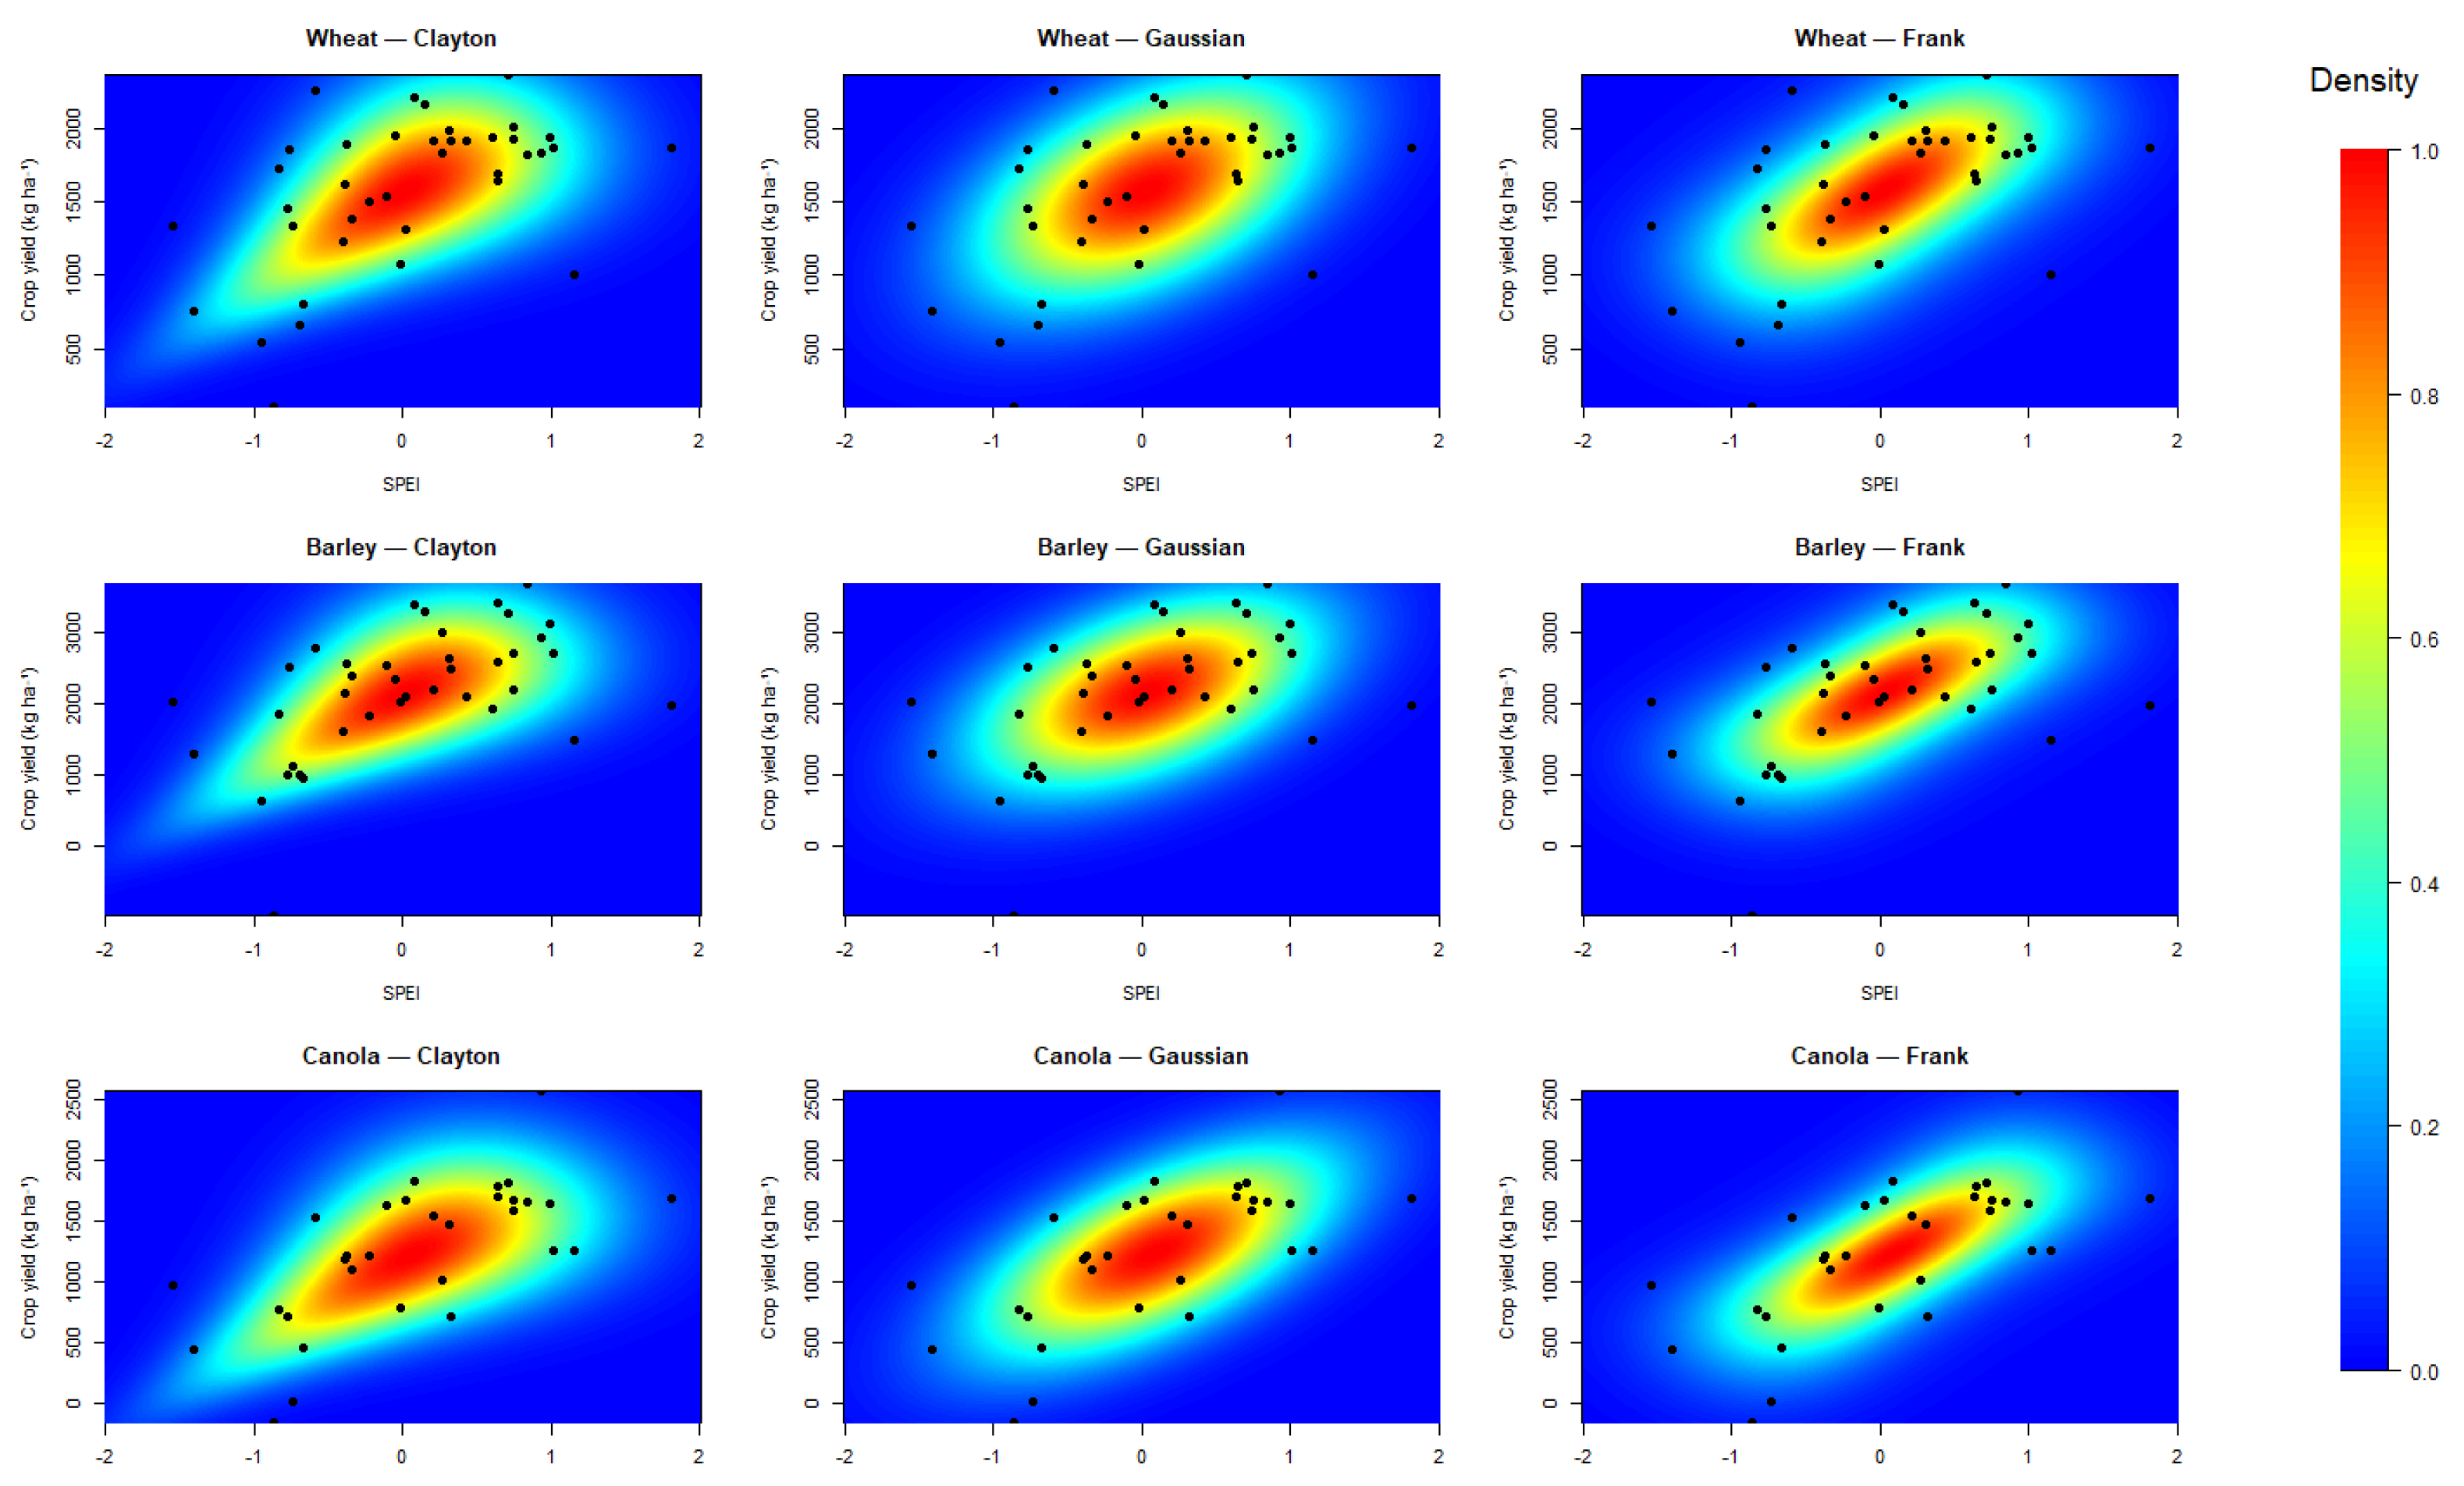
Figure 9 illustrates the joint probability distribution between SPEI and detrended crop yields for wheat, barley, and canola, modeled using three different copulas: Clayton, Gaussian, and Frank. Each panel shows the estimated density surface (color-coded from low [blue] to high [red] density) alongside the actual observed yield-SPEI pairs (black dots). Using the programming language Stan, these copula-based models were fitted via Bayesian inference, and the marginal distributions were normalized to standardize crop yield anomalies. Across all nine panels, the majority of observed data points fall within high-density regions, indicating that the joint distributions accurately capture the dependency structure between SPEI and crop yield. Notably, the Clayton copula appears to better accommodate lower tail dependence, which is especially relevant in drought scenarios. Meanwhile, the Gaussian and Frank copulas perform well in representing symmetric and moderate dependencies.
We assessed the performance of Clayton, Gaussian, and Frank copulas in modeling the joint distribution between SPEI and crop yields for wheat, barley, and canola (Table 6). For wheat, the Frank copula exhibited the best fit, with the lowest S statistic (0.002) and highest p-value (0.950), indicating excellent agreement with the empirical dependence structure. Similarly, Clayton performed best for barley (S = 0.013, p = 0.878), while for canola, the Frank copula again outperformed the others (S = 0.001, p = 0.970), suggesting consistent lower-tail dependence between drought severity and yield reduction in these crops. Although the Gaussian copula showed a comparatively weaker fit across all crops (with p-values below 0.45), all models produced statistically acceptable fits (p > 0.16), supporting the use of copula-based methods for probabilistic yield modeling.
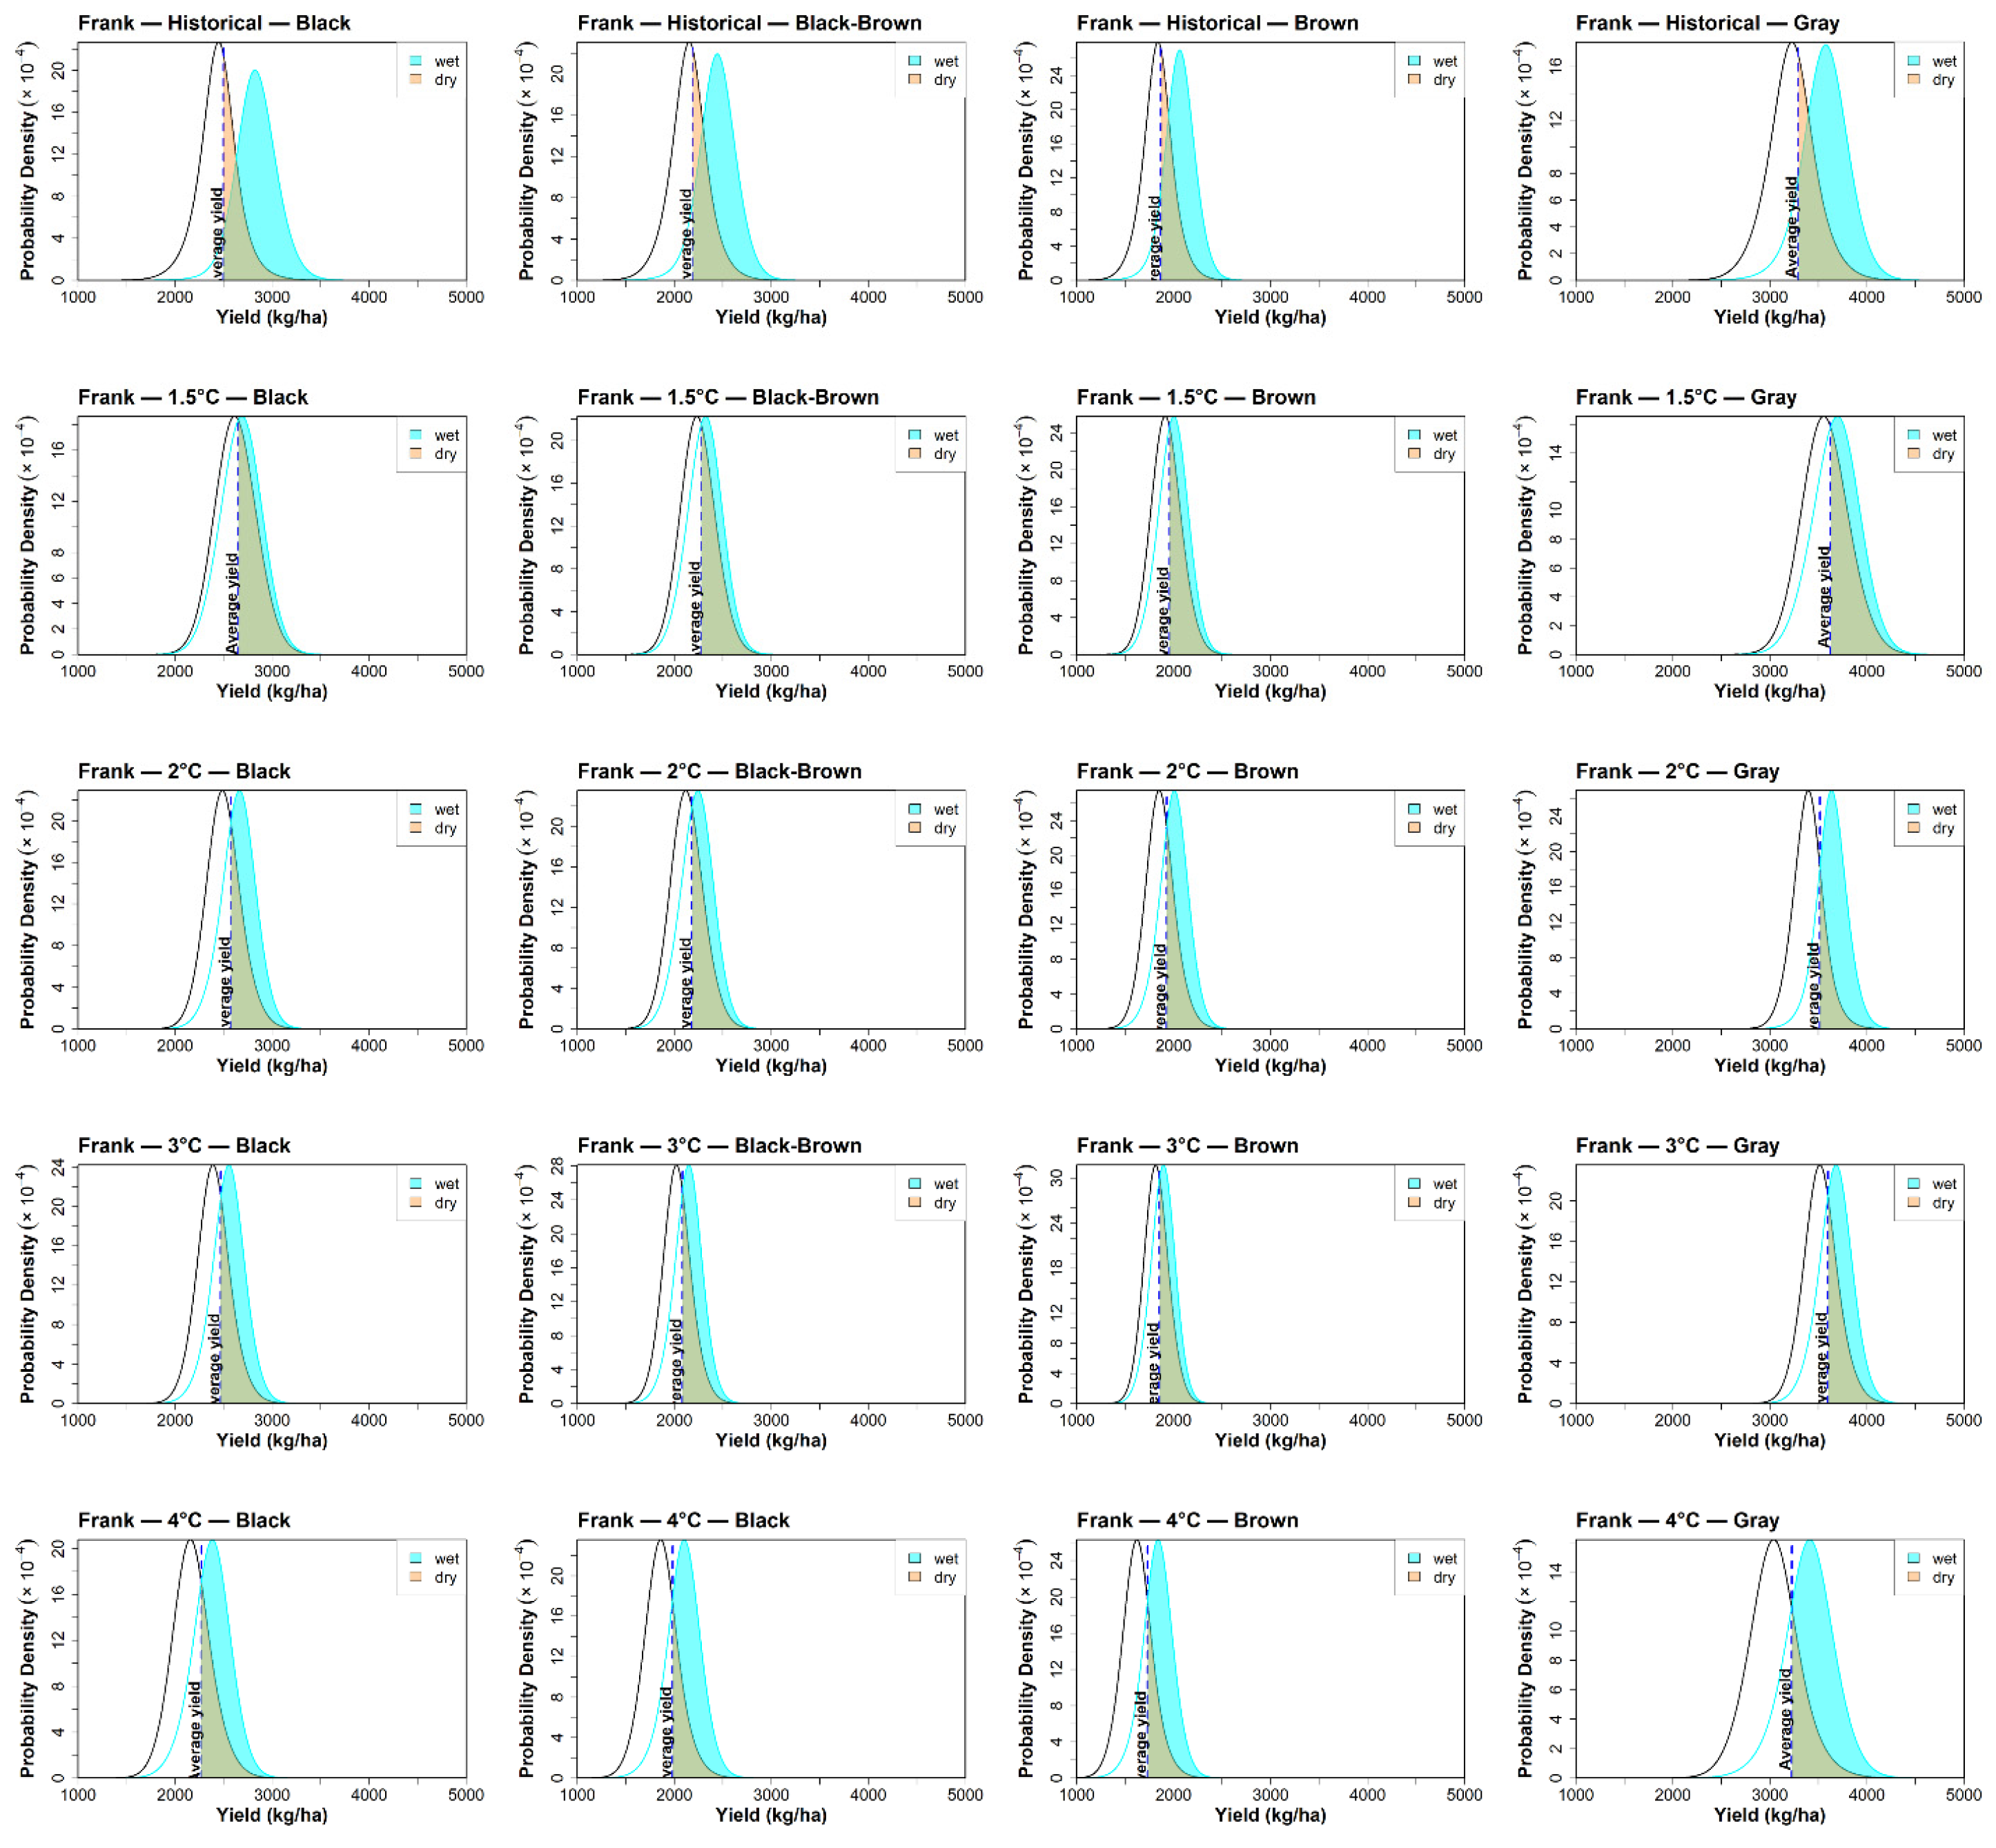
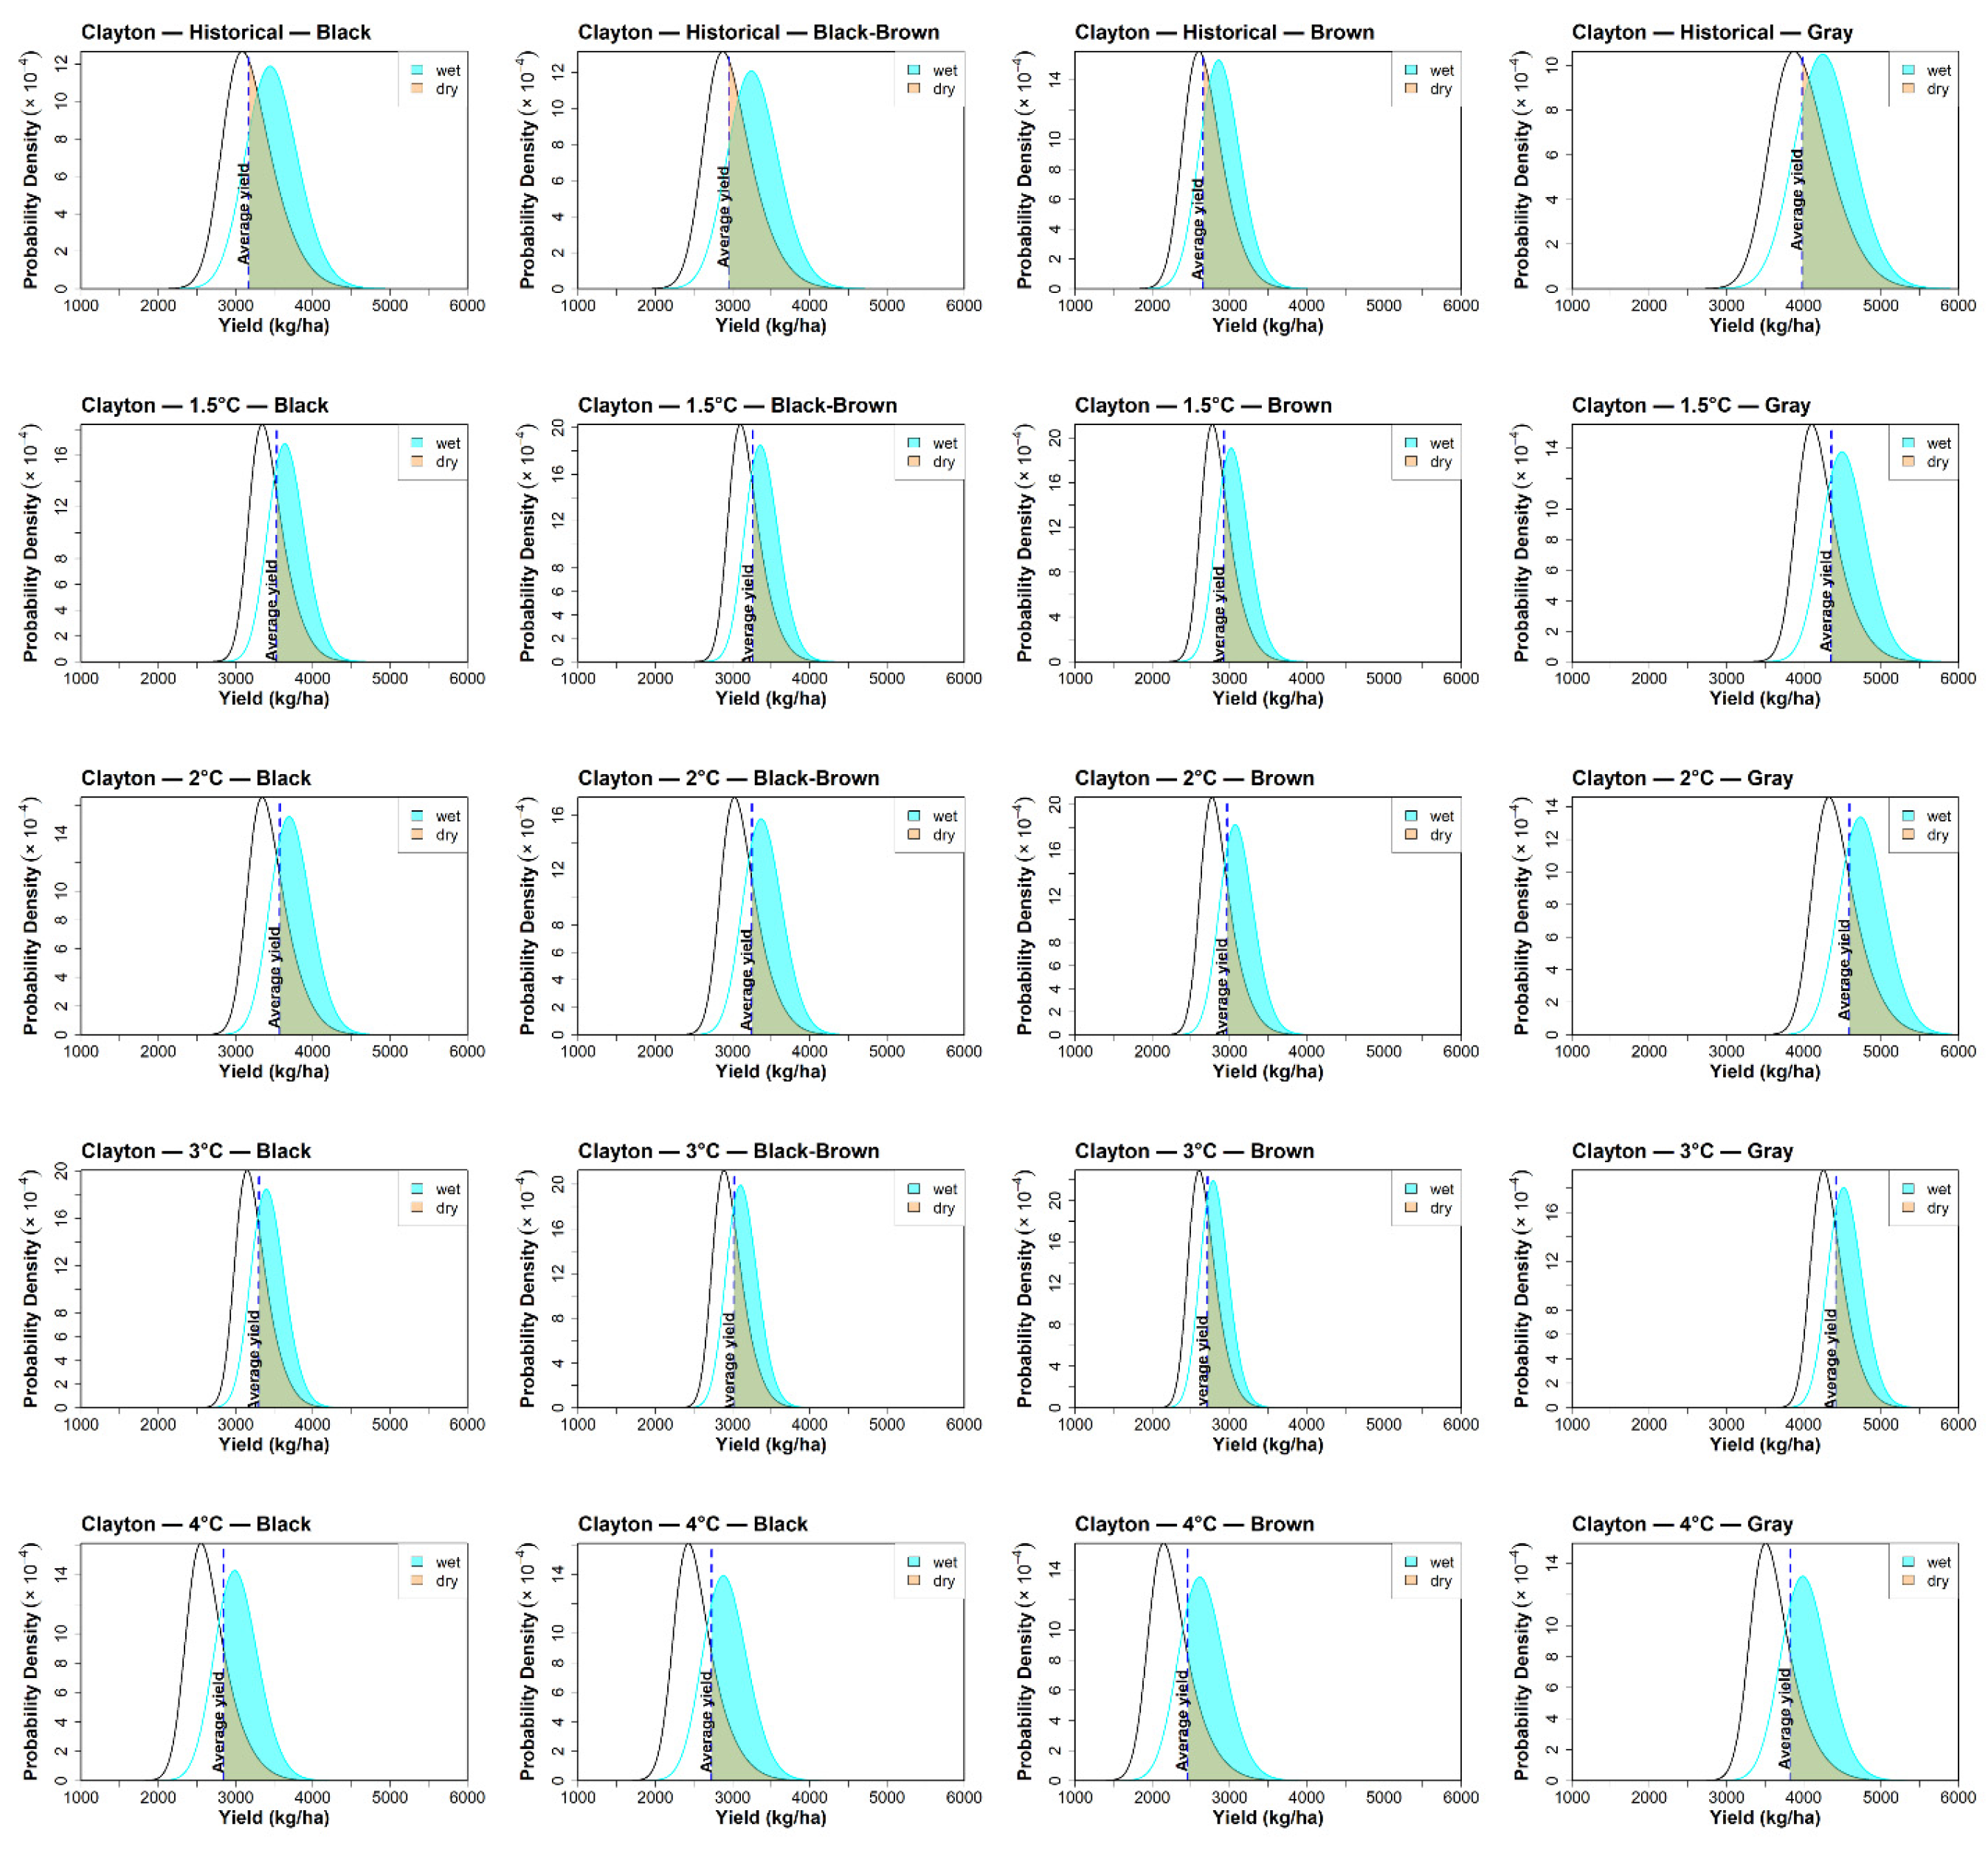
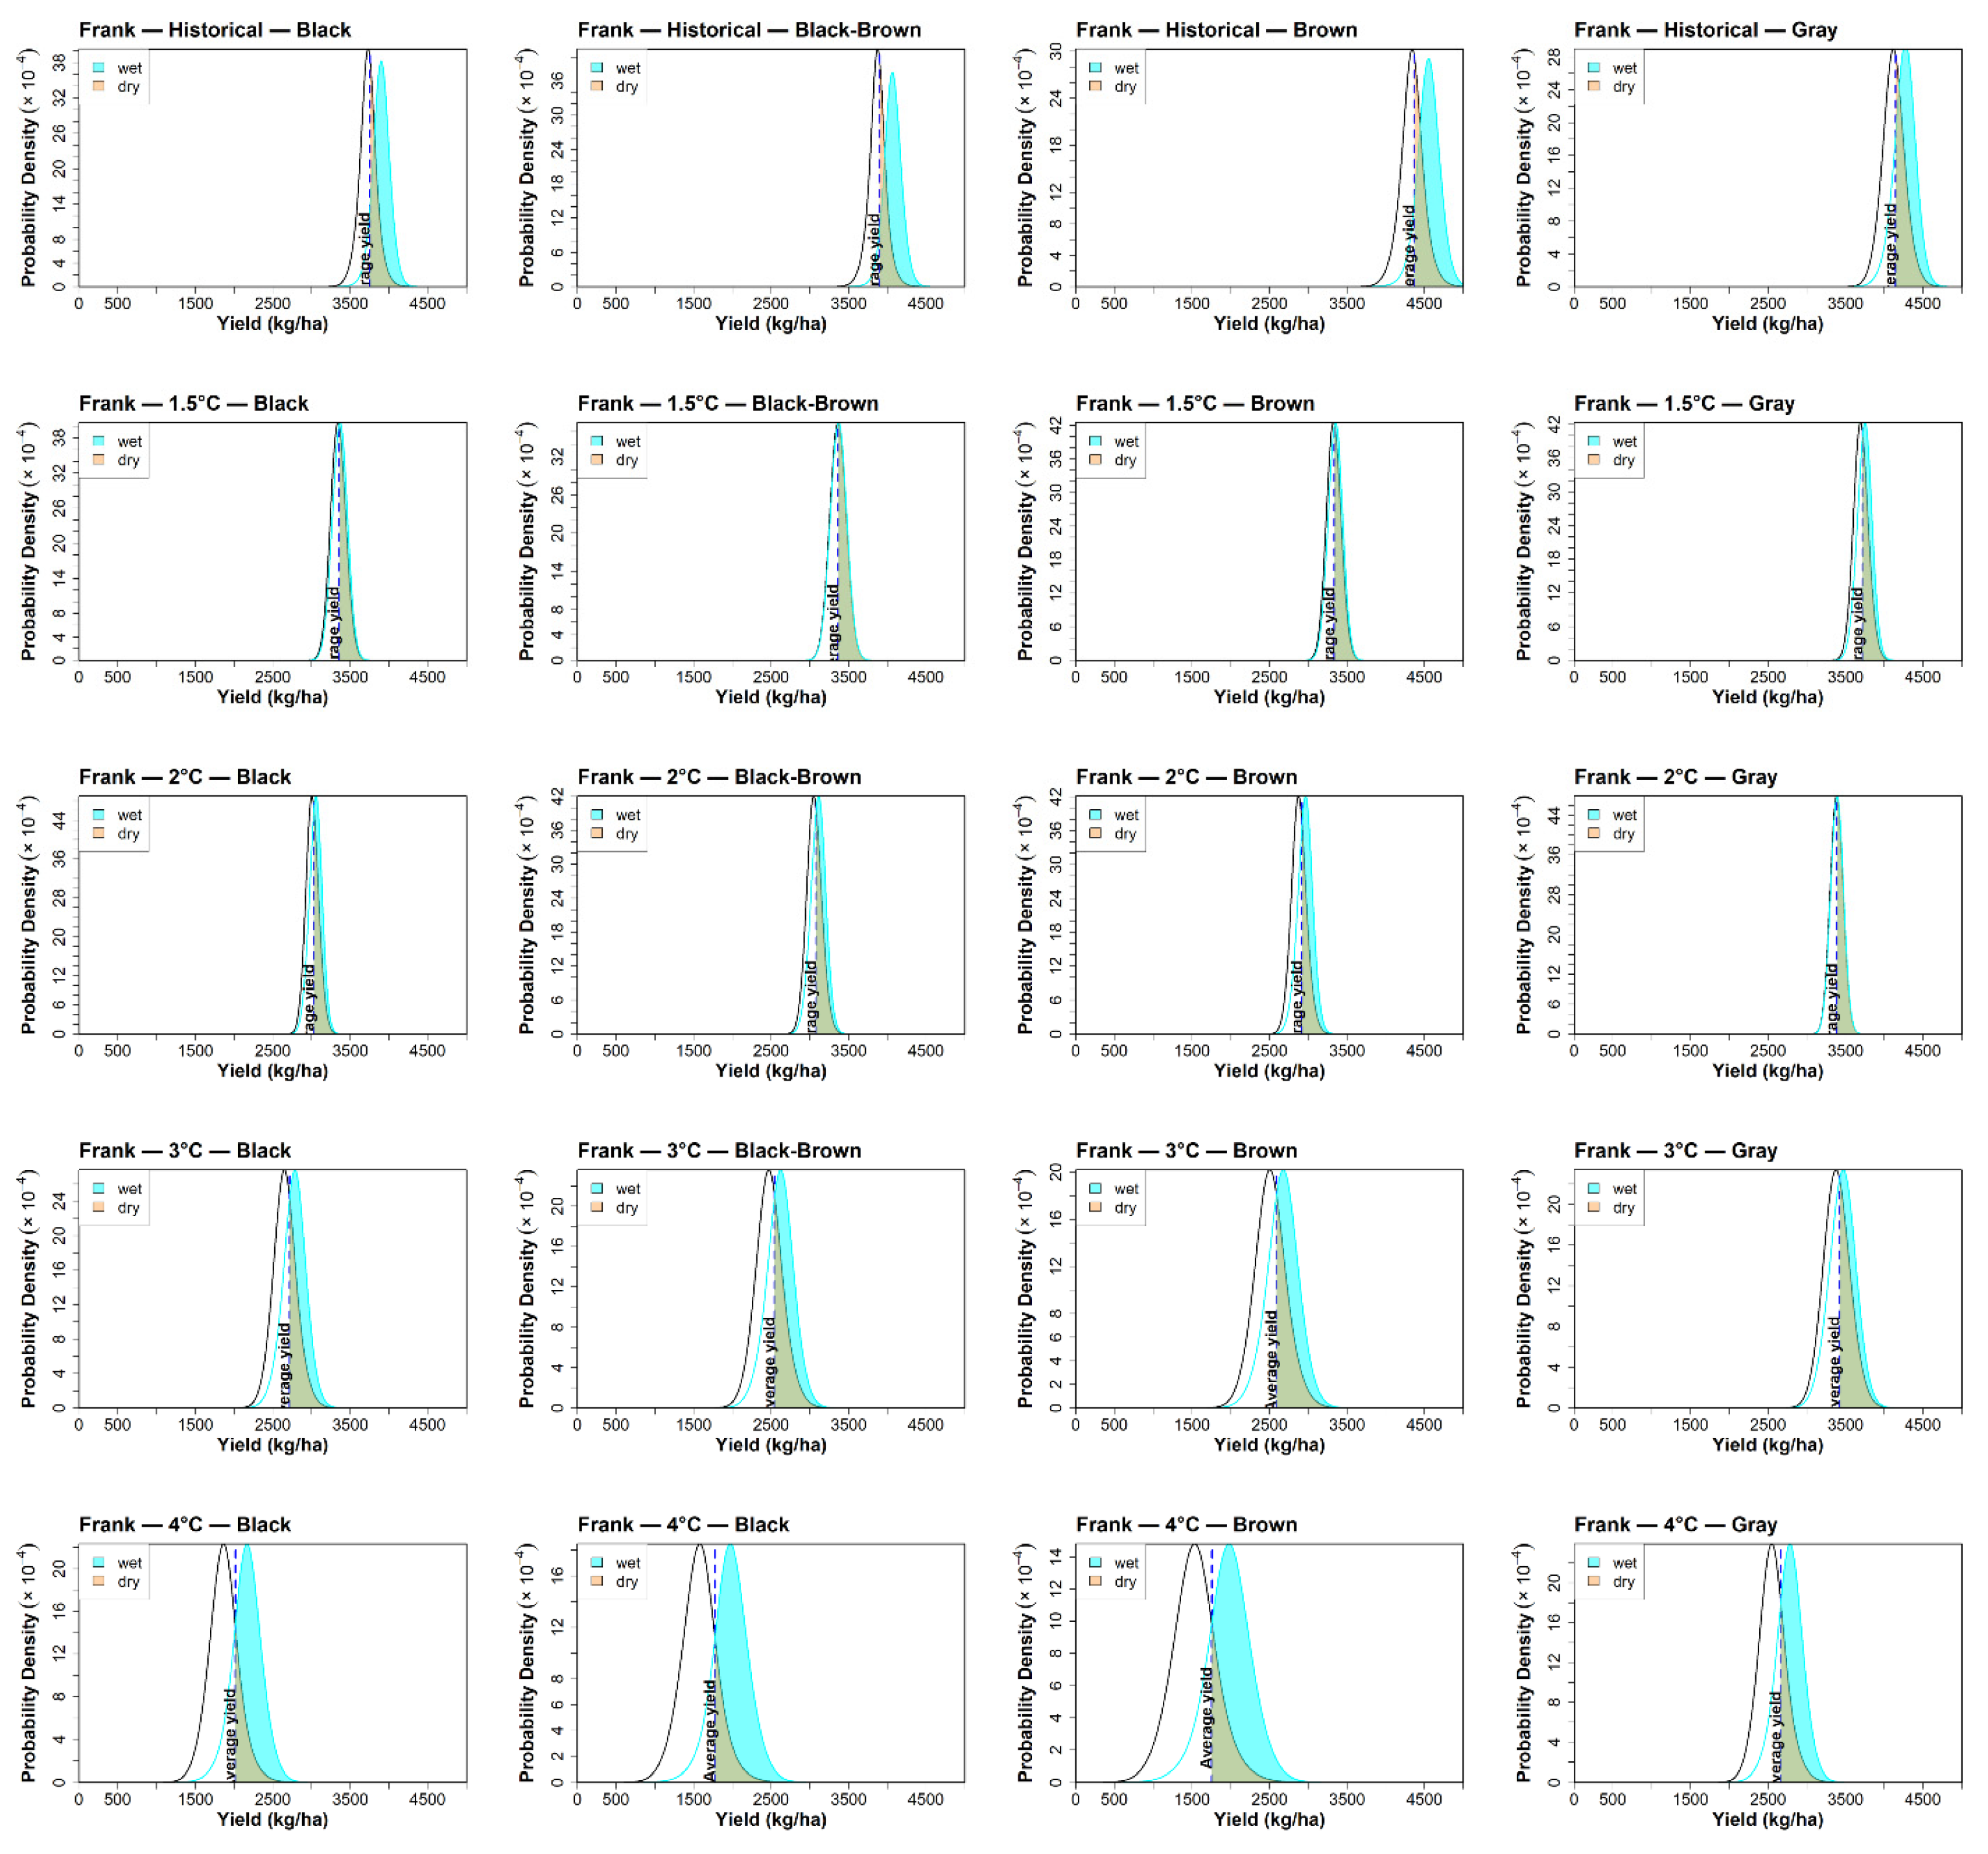
The conditional probability distributions highlight distinct responses across crops, warming levels, and soil zones. For wheat modeled with the Frank copula (Figure 10), historical exceedance probabilities favored wet conditions (about 70% wet vs. 30% dry in Black soils). However, as warming increased, the balance between wet and dry shifted. At 1.5 °C and 2 °C, the wet exceedance advantage narrowed (e.g., 54–55% wet vs. 45–46% dry across most zones), indicating greater vulnerability of wheat yields to dry conditions. By 3 °C and 4 °C, Gray soils maintained a relatively better performance under wet conditions (around 60% wet vs. 40% dry), while Black-Brown and Brown soils approached near-equal probabilities. For barley under the Clayton copula (Figure 11), historical exceedance probabilities of yields above the mean were consistently higher under wet conditions (around 62–63%) compared to dry conditions (37–38%). This contrast became sharper under warming, particularly at 1.5 °C, where wet years in the Black zone showed exceedance probabilities of more than 70%, while the probability under dry conditions fell below 30%. Similar patterns were observed across Brown, Black-Brown, and Gray zones, with Gray soils often exhibiting the highest average yields but also showing vulnerability when shifting from wet to dry conditions. Canola displayed the steepest changes (Figure 12). Under historical conditions, the probability of exceeding the mean yield reached about 62% in wet conditions but dropped to roughly 38% in dry years. Projections revealed sharper declines: at 1.5 °C and 2 °C, wet probabilities hovered near 72–78%, but dry probabilities dropped as low as 25–28%. This shows that future dry conditions for canola are more damaging compared to wheat and barley. At 4 °C warming, wet exceedance probabilities fell further (65%) with dry conditions still below 35%, highlighting a consistent reduction in production resilience.
In this study, we utilized DSSAT-CERES-Wheat, DSSAT-CERES-Barley, and CSM-CROPGRO-Canola models to simulate and evaluate the growth of cultivars AC Barrie (spring wheat), AC Lacombe (barley), and InVigor 5440 (canola). The statistical evaluation indicates that DSSAT reproduced Prairie crop yields with satisfactory accuracy, though performance varied among crops. High d-values (>0.7) across all cases confirm robust agreement between observed and simulated yields, while relatively low nRMSE values (<15%) demonstrate strong model fidelity under Prairie conditions. Huffman et al. (2015) [46] demonstrated that DSSAT accurately simulated wheat yields across the Canadian prairies, while Hoogenboom et al. (2019) [47] highlighted the model’s global reliability across cereals, and Ewert et al. (2015) [48] confirmed its strong performance in capturing crop growth dynamics under diverse environments.
We incorporated 21 model projections to simulate crop yield under the effect of climate change in terms of global warming levels (GWL). These results emphasize important crop-specific and warming-level differences in climate risk. The consistent decline in canola yields across nearly all models reflects its higher vulnerability to heat and water stress, which intensifies beyond a 2 °C increase in mean global temperature. Wheat outcomes are more heterogeneous; while some models (ACCESS-ESM1-5, MPI-ESM1-2-LR) project modest yield stability, others, such as HadGEM3-GC31-LL and IPSL-CM6A-LR show sharp declines, highlighting sensitivity to crop–climate interactions and model uncertainty. Barley appears comparatively more stable, with several SSPs sustaining yields or even suggesting gains at intermediate warming levels, likely due to its wider tolerance to temperature and moisture variation. Barley exhibits moderate resilience, with yields increasing by ~10% at 1.5–2 °C of GW before gains taper to ~4% at 3 °C. This aligns with its tolerance to Prairie temperature and moisture variability. In contrast, canola shows steep and consistent reductions, with yields dropping by over 20% even at 1.5 °C and approaching a decrease of 37% at 3 °C of GW, confirming its high sensitivity to warming. Wheat lies between these extremes: small gains (~1%) under 1.5–2 °C are quickly offset by losses approaching −8% by 3 °C. In fact, the results indicated that canola emerges as the most at risk under all warming scenarios, barley retains partial stability with limited benefits under low to moderate warming, while wheat transitions from marginal improvement to decline.
These results highlight the urgent need for targeted adaptation strategies, particularly for canola, to sustain Prairie agricultural productivity under future climate change. Zare et al. (2025) [15] demonstrated that barley yields are projected to increase by ~11.6% in the near future, tapering to ~4.4% in the far future, while spring wheat shows modest early gains (~7%) before declining (~17%), and canola consistently declines under all warming scenarios. Similarly, Qian (2018) [49] found that canola yields are particularly vulnerable to high temperature and water stress across Canadian growing regions. The spatial projections reveal that the impacts of warming are not uniform but strongly modulated by geography and crop type. Barley maintains relative stability in northern and central zones, benefiting from cooler climates and moisture availability, which likely explains the ~10% yield gains observed at lower warming levels. However, even barley’s resilience diminishes at 3–4 °C GWLs as southern areas increasingly transition into low-yield zones. Wheat demonstrates intermediate sensitivity, with production stability in cooler northern areas but steep losses in southern regions, particularly at a GWL of 3 °C and beyond, aligning with the −8% average reduction. Canola emerges as the most climate-sensitive crop, with steep and spatially extensive reductions across nearly all zones, consistent with the 20–37% declines estimated in the boxplot analysis. Its high vulnerability is likely due to heat and moisture stress during flowering and pod filling, making southern Prairie zones particularly unsuitable under warming. The increasing geographic spread of low-yield zones for canola suggests that adaptation strategies such as shifting planting zones northward, adopting heat and drought-tolerant varieties, or altering crop rotations will be essential to sustain its production. Qian et al. (2016) [50] and Mardian et al. (2024) [24] reported stable wheat yields in cooler northern districts but significant losses in southern Saskatchewan and Alberta as warming exceeds 2–3 °C, highlighting strong geographic contrasts in vulnerability.
The copula-based analysis reveals distinct patterns in the dependence structure between climatic drought (as measured by SPEI) and crop yield responses, with notable variation across crops and copula types. The Frank copula provided the best overall fit for wheat and canola, as evidenced by the lowest S statistics and highest p-values, indicating its strength in capturing moderate, symmetric dependencies typical of these crop–climate relationships. In contrast, the Clayton copula excelled in modeling barley yield, likely due to its ability to capture strong lower-tail dependence—an essential feature when evaluating drought-related yield losses. These results highlight that tail dependence plays a crucial role in characterizing drought risk, particularly for crops like barley that exhibit abrupt declines during dry conditions. The ability of the Clayton copula to capture this asymmetric behavior supports its use in agricultural drought impact studies, particularly under more extreme scenarios. Interestingly, while the Gaussian copula underperformed in most cases—especially for canola and wheat—its statistical fit remained acceptable (p > 0.16), highlighting that even simpler dependency structures may still offer meaningful insight in less extreme environments or under average conditions. Nevertheless, the Gaussian model’s limitations in capturing tail behavior underscore the need for more flexible copulas when assessing risk under future climate variability. From a risk management perspective, these findings highlight the importance of crop-specific modelling approaches, as a single copula model may not effectively capture the dependence structure across different crops. Moreover, the accurate representation of lower-tail dependence is particularly important for informing probabilistic yield forecasting, drought preparedness strategies, and insurance scheme design in regions like the Canadian Prairies, where climate extremes are becoming more frequent. Mohamed et al. (2024) [51] showed that copulas capture asymmetric dependence between climate extremes and impacts far better than linear correlation, underscoring the importance of tail behavior. Li et al. (2022) [12] and Khaledi-Alamdari et al. (2023) [52] found that the Clayton copula is particularly well suited for drought–yield analysis in semi-arid regions, consistent with our finding for barley. Moreover, Schmitt et al. (2024) [53] and Li et al. (2023) [54] reported that flexible copulas with strong tail properties substantially improve the prediction of yield losses under drought stress.
The shifts in conditional yield distributions under wet and dry conditions underscore the growing vulnerability of Prairie crops to climate extremes, particularly under projected warming scenarios. Among the three crops analyzed, canola emerges as the most sensitive, showing the steepest declines in exceedance probabilities under dry conditions. Under historical conditions, about 62% of years exceeded the mean yield during wet periods, but this dropped to just 38% in dry years. As warming intensifies to 1.5 °C and 2 °C, wet-year probabilities climb to 72–78%, while dry-year exceedance probabilities fall as low as 25–28%, signaling a widening yield gap and reduced resilience. This reflects canola’s physiological sensitivity to both heat and moisture stress during flowering and pod filling—critical phases highly exposed to climatic anomalies. Wheat exhibits a more gradual erosion of resilience. Historically, Black soils showed a favorable 70% exceedance probability in wet years, compared to 30% in dry years. However, under 1.5 °C and 2 °C scenarios, this advantage shrinks to 54–55% (wet) vs. 45–46% (dry) across most zones. By 3 °C and 4 °C, dry-year probabilities in Brown and Black-Brown soils nearly equal those of wet years, highlighting a rising exposure to drought-driven yield losses and diminishing benefits from wet conditions. This increasing overlap suggests that warming not only reduces overall productivity but also eliminates the buffer typically provided by favorable moisture years. In contrast, barley maintains relatively higher resilience, particularly in Black soils, where wet-year exceedance probabilities remain above 70% even under 1.5 °C warming, while dry-year probabilities fall below 30%. Historical differences were already marked (62–63% wet vs. 37–38% dry), and this contrast becomes sharper under moderate warming. Barley’s early maturity and shorter growing season likely reduce its exposure to late-season heat and drought, helping to preserve productivity margins where moisture is adequate. However, resilience weakens in Gray and Brown soils, where warming exacerbates the yield gap beyond 2 °C. Soil zone effects further modulate these crop-specific vulnerabilities. Gray soils, typically found in the cooler northern Prairies, offer the strongest performance buffer under wet years, especially for wheat and barley, due to higher organic matter and moisture-holding capacity. Notably, Gray soils under 3–4 °C warming still maintain wet exceedance probabilities around 60%, outperforming Brown and Black-Brown soils. Black soils across central regions sustain moderate resilience due to their balanced texture and fertility. In contrast, Brown and Black-Brown soils—dominant in the southern and drier Prairies—exhibit the sharpest declines in exceedance probabilities under dry conditions, with some zones approaching or dropping below 30% in canola and wheat yields by 2 °C of warming. Coarser soil texture, reduced organic content, and limited water retention capacity amplify exposure to climatic stress. Qian et al. (2018) [49] and Lychuk et al. (2021) [55] confirmed that soil zone properties strongly influence canola and wheat responses.
These findings underscore the need for proactive climate adaptation in Prairie agriculture. As warming levels exceeding 1.5 °C, traditional cropping systems—especially in the southern Brown and Black-Brown zones—may no longer offer the yield stability once expected, particularly for canola and wheat. Water stress and yield volatility are likely to intensify, requiring a shift toward more resilient crop–soil pairings, expanded use of climate-resilient cultivars, and investments in water management practices. The relative stability observed in the northern Gray and central Black zones (covering northern Alberta, central Saskatchewan, and southern Manitoba) suggests that these regions could serve as emerging refugia for Prairie agriculture under moderate warming. These cooler and more humid zones consistently sustained higher barley and wheat yields, making them potential focal areas for adaptation, such as shifting or diversifying cropping systems. Policymakers, producers, and researchers must work together to anticipate these transitions and design tailored solutions that sustain both productivity and economic viability under a warming Prairie climate.

4. Conclusions

This research demonstrates that probabilistic modeling frameworks combining DSSAT crop simulations with copula analysis provide valuable insights into crop–climate interactions under drought conditions. Among the three crops, canola consistently emerged as the most sensitive, with yield losses exceeding 20% even under modest warming scenarios. Wheat showed intermediate responses, with outcomes strongly dependent on geography, while barley displayed relative resilience, maintaining stability or modest gains at lower warming levels. Spatial analyses further underscored that Prairie agricultural vulnerability is both crop- and zone-specific. The most significant risks occur when moisture-sensitive crops such as canola are grown in Brown and Black-Brown soils under 2–3 °C of global warming, where the distinction between wet and dry years nearly disappears. Conversely, shorter-season and more stress-tolerant crops such as barley grown in Black soils, or wheat and barley in Gray soils, sustain higher resilience and maintain a stronger wet-year advantage. The copula-based probabilistic analysis confirmed these crop-specific patterns, showing that canola experienced the steepest declines in exceedance probabilities under dry conditions, while barley retained stronger resilience margins. These results emphasize that tail dependence is critical for quantifying drought risk and demonstrate that not all crop–soil–climate combinations have the same vulnerability under future warming. Generally, these findings highlight that Prairie agriculture faces increasingly heterogeneous risks, requiring targeted, zone-specific adaptation strategies. Breeding for stress tolerance, adapting to shifting cropping zones, and enhancing soil and water management will be crucial to sustain agricultural productivity and economic viability in the face of increasingly extreme climate conditions.

Author Contributions

Conceptualization, M.Z. and D.S.; methodology, M.Z. and Z.N.; software, M.Z.; validation, M.Z. and Z.N.; formal analysis, M.Z.; investigation, M.Z., D.S. and Z.N.; data curation, D.S.; writing—original draft, M.Z.; writing—review and editing, M.Z., D.S. and Z.N.; visualization, M.Z. and Z.N.; supervision, D.S.; project administration, D.S.; funding acquisition, D.S.; copula modeling and statistical interpretation, A.R. All authors have read and agreed to the published version of the manuscript.

Funding

This research was funded by the RBC Tech for Nature program, South West Terminal, and by the Prairie Adaptations Research Collaborative, University of Regina.

Data Availability Statement

The data presented in this study are available on request from the corresponding author due to their large size (more than 20 T) and institutional storage restrictions. The data include DSSAT model simulations and CMIP6-derived climate projections used in this research.

Acknowledgments

The research documented in this paper benefited from a collaboration with the Canadian Water Network (CWN). Staff of the CWN established a project technical advisory committee. We received expert advice during several committee meetings.

Conflicts of Interest

The authors declare that they have no conflicts of interest.

References

  1. Aadhar, S.; Mishra, V. High-resolution near real-time drought monitoring in South Asia. Sci. Data 2017, 4, 170145. [Google Scholar] [CrossRef]
  2. AghaKouchak, A.; Farahmand, A.; Melton, F.S.; Teixeira, J.; Anderson, M.C.; Wardlow, B.D.; Hain, C.R. Remote sensing of drought: Progress, challenges and opportunities. Rev. Geophys. 2015, 53, 452–480. [Google Scholar] [CrossRef]
  3. Dai, A. Drought under global warming: A review. Wiley Interdiscip. Rev. Clim. Chang. 2011, 2, 45–65. [Google Scholar] [CrossRef]
  4. Canadian Canola Growers Association. Canola: Growing Canadian Prosperity. Available online: https://www.ccga.ca/advocacy/priorities (accessed on 19 April 2022).
  5. Zhang, X.; Flato, G.; Cannon, A.; Wan, H.; Wang, X.; Rong, R.; Fyfe, J.; Li, G.; Kharin, V.V. Changes in Temperature and Precipitation Across Canada; Chapter 4; Canada’s Changing Climate Report; Government of Canada: Ottawa, ON, Canada, 2019; Available online: https://natural-resources.canada.ca/ (accessed on 20 October 2025).
  6. Agriculture and Agri-Food Canada. Statistical Overview of the Canadian Agriculture Industry 2021; Agriculture and Agri-Food Canada: Ottawa, ON, Canada, 2021; Available online: https://agriculture.canada.ca/ (accessed on 20 October 2025).
  7. Heim, R.R., Jr. A review of twentieth-century drought indices used in the United States. Bull. Am. Meteorol. Soc. 2002, 83, 1149–1166. [Google Scholar] [CrossRef]
  8. Li, Y.; Ye, W.; Wang, M.; Yan, X. Climate change and drought: A risk assessment of crop production in China. Agric. Ecosyst. Environ. 2009, 134, 341–347. [Google Scholar] [CrossRef]
  9. Wakatsuki, H.; Ju, H.; Nelson, G.C.; Farrell, A.D.; Deryng, D.; Meza, F.; Hasegawa, T. Research trends and gaps in climate change impacts and adaptation potentials in major crops. Curr. Opin. Environ. Sustain. 2023, 61, 101249. [Google Scholar] [CrossRef]
  10. Leng, G.; Hall, J. Crop yield sensitivity of global major agricultural countries to droughts and the projected changes in the future. Sci. Total Environ. 2019, 654, 811–821. [Google Scholar] [CrossRef] [PubMed]
  11. Ribeiro, A.F.S.; Russo, A.; Gouveia, C.M.; Páscoa, P. Copula-based agricultural drought risk of rainfed cropping systems. Agric. Water Manag. 2019, 223, 105689. [Google Scholar] [CrossRef]
  12. Li, P.; Huang, Q.; Huang, S.; Leng, G.; Peng, J.; Wang, H.; Fang, W. Various maize yield losses and their dynamics triggered by drought thresholds based on Copula-Bayesian conditional probabilities. Agric. Water Manag. 2022, 261, 107391. [Google Scholar] [CrossRef]
  13. Wu, H.; Su, X.; Singh, V.P.; Feng, K.; Niu, J. Agricultural drought prediction based on conditional distributions of vine copulas. Water Resour. Res. 2021, 57, e2021WR029562. [Google Scholar] [CrossRef]
  14. Madadgar, S.; AghaKouchak, A.; Farahmand, A.; Davis, S.J. Probabilistic estimates of drought impacts on agricultural production. Geophys. Res. Lett. 2017, 44, 7799–7807. [Google Scholar] [CrossRef]
  15. Zare, M.; Sauchyn, D.; Noorisameleh, Z. Barley, Canola and Spring Wheat Yield Throughout the Canadian Prairies under the Effect of Climate Change. Climate 2025, 13, 179. [Google Scholar] [CrossRef]
  16. Jones, J.W.; Hoogenboom, G.; Porter, C.H.; Boote, K.J.; Batchelor, W.D.; Hunt, L.A.; Wilkens, P.W.; Singh, U.; Gijsman, A.J.; Ritchie, J.T. The DSSAT cropping system model. Eur. J. Agron. 2003, 18, 235–265. [Google Scholar] [CrossRef]
  17. El-Mahroug, S.E.; Suleiman, A.A.; Zoubi, M.M.; Al-Omari, S.; Abu-Afifeh, Q.Y.; Al-Jawaldeh, H.F.; Alta’any, Y.A.; Al-Nawaiseh, T.M.F.; Obeidat, N.; Alsoud, S.H.; et al. Predictive modeling of climate-driven crop yield variability using DSSAT towards sustainable agriculture. AgriEngineering 2025, 7, 156. [Google Scholar] [CrossRef]
  18. Hanesiak, J.M.; Stewart, R.E.; Bonsal, B.R.; Harder, P. Characterization and summary of the 1999–2005 Canadian Prairie drought. Atmos.–Ocean 2011, 49, 421–452. [Google Scholar] [CrossRef]
  19. McGinn, S.M. Weather and climate patterns in Canada’s prairie grasslands. Arthropods Can. Grassl. 2010, 1, 105–119. [Google Scholar]
  20. Bailey, W.G.; Oke, T.R.; Rouse, W.R. The Surface Climates of Canada; McGill–Queen’s University Press: Montreal-Kingston, QC, Canada, 1997; Available online: https://www.mqup.ca/ (accessed on 20 October 2025).
  21. Gregorich, E.G.; Anderson, D.W. Effects of cultivation and erosion on soils of four toposequences in the Canadian prairies. Geoderma 1985, 36, 343–354. [Google Scholar] [CrossRef]
  22. Statistics Canada. Estimated Areas, Yield, Production, Average Farm Price and Total Farm Value of Principal Field Crops, in Metric and Imperial Units; Table 32-10-0359-01; Statistics Canada: Ottawa, ON, Canada, 2019; Available online: https://www150.statcan.gc.ca/ (accessed on 12 June 2024).
  23. Wheaton, E.; Kulshreshtha, S.; Wittrock, V.; Koshida, G. Dry times: Hard lessons from the Canadian drought of 2001 and 2002. Can. Geogr. 2008, 52, 241–262. [Google Scholar] [CrossRef]
  24. Mardian, J.; Champagne, C.; Bonsal, B.; Daneshfar, B.; Berg, A. From drought hazard to risk: A spring wheat vulnerability assessment in the Canadian Prairies. Agric. For. Meteorol. 2024, 353, 110056. [Google Scholar] [CrossRef]
  25. Sattar, F. Spring wheat cultivar coefficients: GenCalc vs GLUE. Asian J. Emerg. Res. 2020, 2, 17–18. [Google Scholar] [CrossRef]
  26. Willmott, C.J. Some comments on the evaluation of model performance. Bull. Am. Meteorol. Soc. 1982, 63, 1309–1313. [Google Scholar] [CrossRef]
  27. Loague, K.; Freeze, R.A. A comparison of rainfall–runoff modeling techniques: Event-based simulation using measured parameter values. Water Resour. Res. 1985, 21, 229–248. [Google Scholar] [CrossRef]
  28. Cinkus, G.; Mazzilli, N.; Jourde, H.; Wunsch, A.; Liesch, T.; Ravbar, N.; Chen, Z.; Goldscheider, N. When best is the enemy of good—Critical evaluation of performance criteria in hydrological models. Hydrol. Earth Syst. Sci. 2023, 27, 2397–2411. [Google Scholar] [CrossRef]
  29. O’Neill, B.C.; Kriegler, E.; Riahi, K.; Ebi, K.L.; Hallegatte, S.; Carter, T.R.; Mathur, R.; van Vuuren, D.P. The Scenario Model Intercomparison Project (ScenarioMIP) for CMIP6. Geosci. Model Dev. 2016, 9, 3461–3482. [Google Scholar] [CrossRef]
  30. Thrasher, B.; Maurer, E.P.; McKellar, C.; Duffy, P.B. Bias correcting climate model simulated daily temperature extremes with quantile mapping. Hydrol. Earth Syst. Sci. 2012, 16, 3309–3314. [Google Scholar] [CrossRef]
  31. Thrasher, B.; Wang, W.; Michaelis, A.; Melton, F.; Lee, T.; Nemani, R. NASA global daily downscaled projections, CMIP6. Sci. Data 2022, 9, 262. [Google Scholar] [CrossRef]
  32. Hauser, M.; Engelbrecht, F.; Fischer, E.M. Transient Global Warming Levels for CMIP5 and CMIP6; Zenodo: Geneva, Switzerland, 2021; Available online: https://zenodo.org/records/7390473 (accessed on 20 October 2025).
  33. Vicente-Serrano, S.M.; Beguería, S.; López-Moreno, J.I. A multiscalar drought index sensitive to global warming: The standardized precipitation evapotranspiration index (SPEI). J. Clim. 2010, 23, 1696–1718. [Google Scholar] [CrossRef]
  34. Penman, H.L. Natural Evaporation from Open Water, Bare Soil and Grass. Proc. R. Soc. Lond. A Math. Phys. Sci. 1948, 193, 120–145. Available online: https://www.jstor.org/stable/98151 (accessed on 20 October 2025).
  35. Thornthwaite, C.W. An approach toward a rational classification of climate. Geogr. Rev. 1948, 38, 55–94. [Google Scholar] [CrossRef]
  36. Hargreaves, G.H.; Samani, Z.A. Estimating potential evapotranspiration. J. Irrig. Drain. Eng. 1982, 108, 223–230. [Google Scholar] [CrossRef]
  37. Byakatonda, J.; Parida, B.P.; Kenabatho, P.K.; Moalafhi, D.B. Modeling dryness severity using artificial neural network at the Okavango Delta, Botswana. Glob. Nest J. 2016, 18, 463–481. [Google Scholar] [CrossRef]
  38. Paulo, A.A.; Rosa, R.D.; Pereira, L.S. Climate trends and behaviour of drought indices based on precipitation and evapotranspiration in Portugal. Nat. Hazards Earth Syst. Sci. 2012, 12, 1481–1491. [Google Scholar] [CrossRef]
  39. Xu, K.; Yang, D.; Yang, H.; Li, Z.; Qin, Y.; Shen, Y. Spatio-temporal variation of drought in China during 1961–2012: A climatic perspective. J. Hydrol. 2015, 526, 253–264. [Google Scholar] [CrossRef]
  40. Sklar, A. Fonctions de répartition à n dimensions et leurs marges. Publ. Inst. Stat. Univ. Paris 1959, 8, 229–231. [Google Scholar]
  41. Nelsen, R.B. An Introduction to Copulas, 2nd ed.; Springer: New York, NY, USA, 2006. [Google Scholar]
  42. Madadgar, S.; Moradkhani, H. A Bayesian framework for probabilistic seasonal drought forecasting. J. Hydrol. 2013, 14, 1685–1705. [Google Scholar] [CrossRef]
  43. Mazdiyasni, O.; AghaKouchak, A. Substantial increase in concurrent droughts and heatwaves in the United States. Proc. Natl. Acad. Sci. USA 2015, 112, 11484–11489. [Google Scholar] [CrossRef]
  44. Genest, C.; Rémillard, B. Validity of the parametric bootstrap for goodness-of-fit testing in semiparametric models. Ann. Inst. Stat. Math. 2008, 60, 1–23. [Google Scholar] [CrossRef]
  45. Sadegh, M.; Ragno, E.; AghaKouchak, A. Multivariate Copula Analysis Toolbox (MvCAT): Describing dependence and underlying uncertainty using a Bayesian framework. Water Resour. Res. 2017, 53, 5166–5183. [Google Scholar] [CrossRef]
  46. Huffman, T.; Qian, B.; De Jong, R.; Liu, J.; Wang, H.; McConkey, B.; Brierley, T.; Yang, J. Upscaling modelled crop yields to regional scale: A case study using DSSAT for spring wheat on the Canadian Prairies. Can. J. Soil Sci. 2015, 95, 49–61. [Google Scholar] [CrossRef]
  47. Hoogenboom, G.; Tsuji, G.Y.; Hoogenboom, G.; Hunt, L.A.; Thornton, P.K.; Wilkens, P.W.; Imamura, D.T.; Bowen, W.T.; Singh, U. Decision Support System for Agrotechnology Transfer (DSSAT) Version 4.7.5; DSSAT Foundation: Gainesville, FL, USA, 2019; Available online: https://DSSAT.net (accessed on 20 October 2025).
  48. Ewert, F.; Rötter, R.P.; Bindi, M.; Webber, H.; Trnka, M.; Kersebaum, K.C.; Olesen, J.; van Ittersum, M.; Janssen, S.; Rivington, M.; et al. Crop modelling for integrated assessment of risk to food production from climate change. Environ. Model. Softw. 2015, 72, 287–303. [Google Scholar] [CrossRef]
  49. Qian, B.; He, J.; Song, C.; Wang, H.; Jing, Q.; Hoogenboom, G.; Drury, C.; Yang, J.; He, P.; Zhou, W. Simulated canola yield responses to climate change and adaptation in Canada. Agron. J. 2018, 110, 1331–1344. [Google Scholar] [CrossRef]
  50. Qian, B.; De Jong, R.; Huffman, T.; Wang, H.; Yang, J. Projecting yield changes of spring wheat under future climate scenarios on the Canadian Prairies. Theor. Appl. Climatol. 2016, 123, 651–669. [Google Scholar] [CrossRef]
  51. Mohamed, I.; Najafi, M.R.; Joe, P.; Brimelow, J. Multivariate analysis of compound hail, wind and rainfall extremes in Alberta’s hail alley. Weather Clim. Extremes 2024, 46, 100718. [Google Scholar] [CrossRef]
  52. Khaledi-Alamdari, M.; Majnooni-Heris, A.; Fakheri-Fard, A.; Russo, A. Probabilistic climate risk assessment in rainfed wheat yield: Copula approach using water requirement satisfaction index. Agric. Water Manag. 2023, 289, 108542. [Google Scholar] [CrossRef]
  53. Schmitt, J.; Offermann, F.; Ribeiro, A.F.S.; Finger, R. Drought risk management in agriculture: A copula perspective on crop diversification. Agric. Econ. 2024, 55, 823–847. [Google Scholar] [CrossRef]
  54. Li, M.; Wang, G.; Zong, S.; Chai, X. Copula-based assessment and regionalization of drought risk in China. Int. J. Environ. Res. Public Health 2023, 20, 4074. [Google Scholar] [CrossRef]
  55. Lychuk, T.E.; Moulin, A.P.; Lemke, R.L.; Izaurralde, R.C.; Johnson, E.N.; Olfert, O.O.; Brandt, S.A. Modelling the effects of climate change, agricultural inputs, cropping diversity, and soil on wheat and canola yields at a long-term Prairie site. Agric. Syst. 2021, 252, 106850. [Google Scholar] [CrossRef]
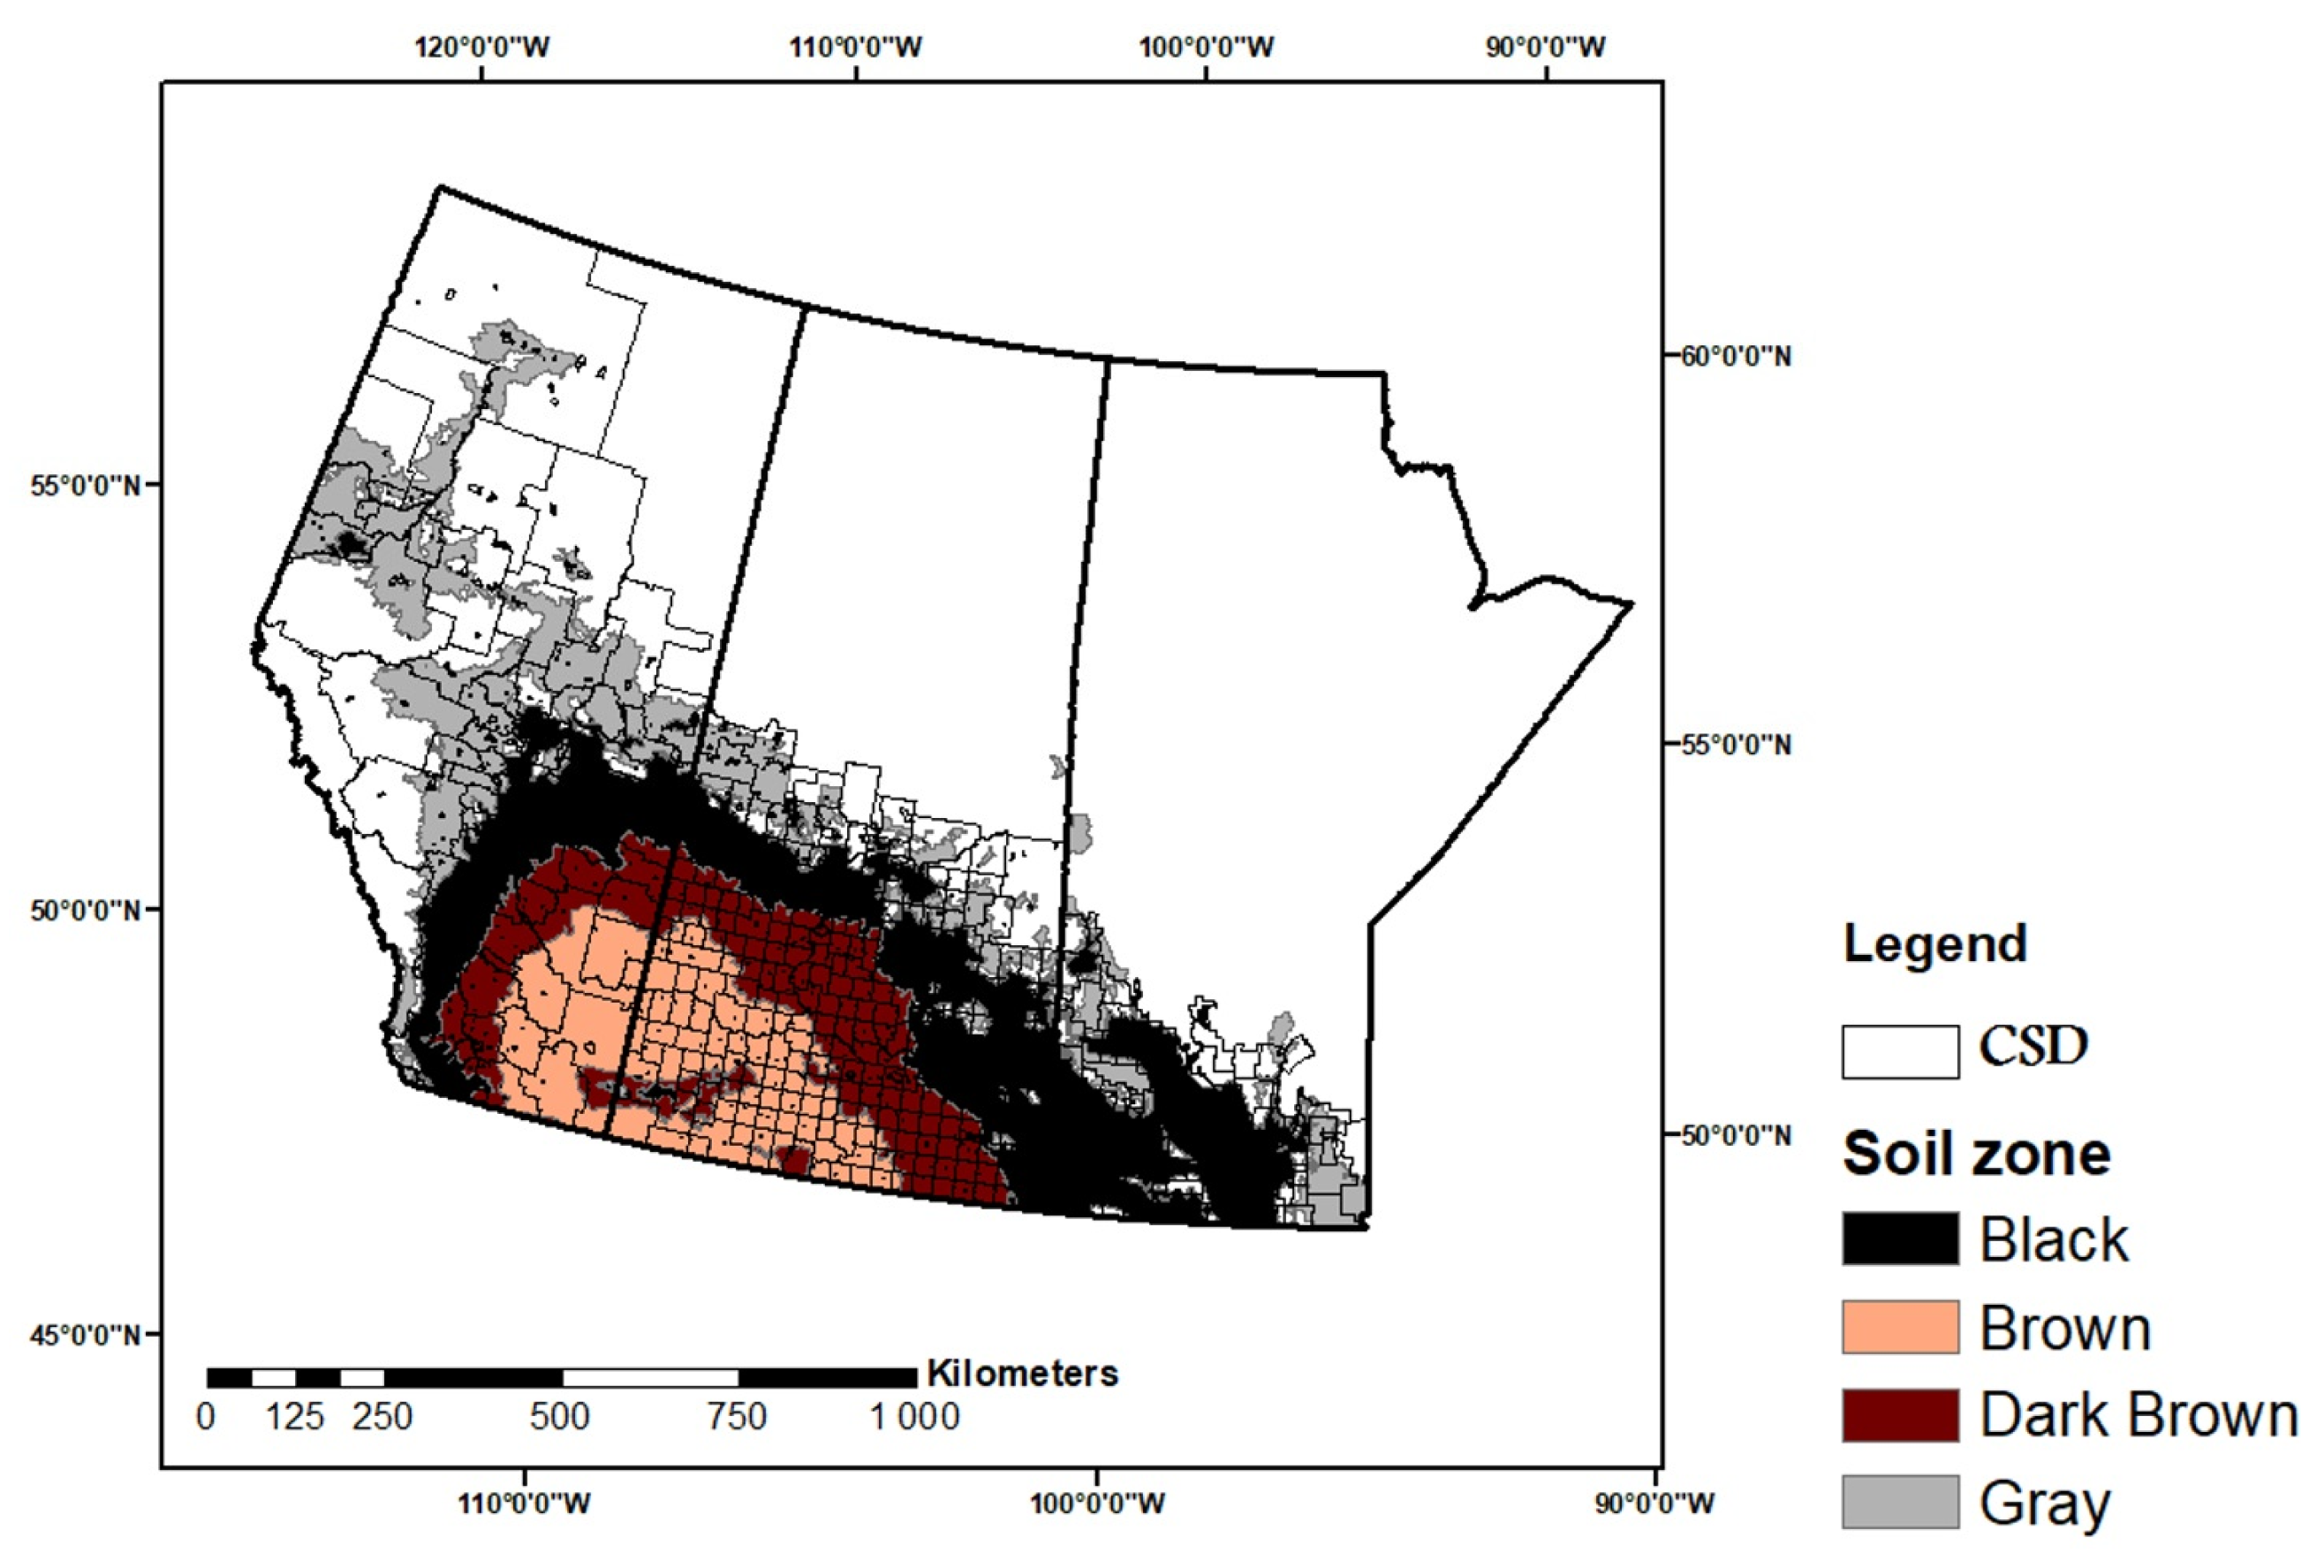
Figure 1. 468 CSD types in the Canadian Prairie provinces along with Chernozemic Soil Zones.
Agronomy 15 02484 g001
Figure 2. The amount of spring wheat production for the historical and global warming levels.
Agronomy 15 02484 g002
Figure 3. The amount of canola production for the historical and global warming levels.
Agronomy 15 02484 g003
Figure 4. The amount of barley production for the historical and global warming levels.
Agronomy 15 02484 g004
Figure 5. Ensemble median of barley yield in the prairie agricultural zone during historical and global warming levels.
Agronomy 15 02484 g005
Figure 6. The geographic distribution of median projected wheat yield in the prairie agricultural zone for historical and global warming levels.
Agronomy 15 02484 g006
Figure 7. Ensemble median of Canola yield in the prairie agricultural zone during historical and global warming levels.
Agronomy 15 02484 g007
Figure 8. Temporal changes in annual wheat, barley and canola yield and growing season SPEI during 1984–2022. The correlation coefficient (r) and statistical significance (p-value) are given.
Agronomy 15 02484 g008
Figure 9. Joint distribution function fitted for canola yield and SPEI by three models of Clayton, Gaussian and Frank. The background colors represent the probability densities.
Agronomy 15 02484 g009
Figure 10. Conditional probability distributions of Frank detrended wheat yields under dry (orange) and wet (cyan) conditions across soil zones (Black, Black–Brown, Brown, and Gray) during historical and global warming levels. The greenish areas correspond to dry conditions, but their color appears altered due to the overlay and transparency effects between the two distributions.
Agronomy 15 02484 g010
Figure 11. Conditional probability distributions of Clayton detrended barley yields under dry (orange) and wet (cyan) conditions across soil zones (Black, Black–Brown, Brown, and Gray) during historical and global warming levels. The greenish areas correspond to dry conditions, but their color appears altered due to the overlay and transparency effects between the two distributions.
Agronomy 15 02484 g011
Figure 12. Conditional probability distributions of Frank detrended canola yields under dry (orange) and wet (cyan) conditions across soil zones (Black, Black–Brown, Brown, and Gray) during historical and global warming levels. The greenish areas correspond to dry conditions, but their color appears altered due to the overlay and transparency effects between the two distribu-tions.4. Discussion.
Agronomy 15 02484 g012
Table 1. Information on NEX-GDDP-CMIP6 climate models.
No.ModelInstitution/Country
1ACCESS-ESM1-5CSIRO, Australia
2BCC-CSM2-MRBeijing Climate Center, China
3CanESM5Canadian Centre for Climate Modelling, Canada
4CNRM-CM6-1National Center of Meteorological Research, France
5CMCC-CM2-SR5Euro-Mediterranean Centre, Italy
6EC-Earth3EC-Earth Consortium, Sweden
7FGOALS-g3Chinese Academy of Sciences, China
8GFDL-CM4NOAA Geophysical Fluid Dynamics Lab, USA
9GFDL-ESM4NOAA Geophysical Fluid Dynamics Lab, USA
10GISS-E2-1-GGoddard Institute for Space Studies, USA
11HadGEM3-GC31-LLMet Office, Hadley Centre, UK
12INM-CM5-0Institute for Numerical Mathematics, Russia
13IPSL-CM6A-LRInstitute Pierre-Simon Laplace, France
14KACE-1-0-GKorea Meteorological Administration, South Korea
15KIOST-ESMKorea Institute of Ocean Science & Technology, South Korea
16MIROC6JAMSTEC, Japan
17MIROC-ES2LJAMSTEC, Japan
18MPI-ESM1-2-LRMax Planck Institute for Meteorology, Germany
19MRI-ESM2-0Meteorological Research Institute, Japan
20NorESM2-LMNorwegian Climate Centre, Norway
21UKESM1-0-LLMet Office, Hadley Centre, UK
Table 2. The corresponding time for CMIP6 GCMs to reach different levels of temperature increase thresholds relative to the historical period under SSP585 [32].
GCMs Model1.5 °C2.0 °C3.0 °C4.0 °C
ACCESS-ESM1-52018–20372030–20492051–20702069–2088
BCC-CSM2-MR2021–20402034–20532056–2075
CanESM52003–20222013–20322031–20502045–2064
CNRM-CM6-12019–20382031–20502049–20682063–2082
CMCC-CM2-SR52012–20312024–20432043–20622060–2079
EC-Earth32015–20342026–20452048–20672064–2083
FGOALS-g32020–20392038–20572065–2084
GFDL-CM42020–20392032–20512050–20692070–2089
GFDL-ESM42030–20492043–20622066–2085
GISS-E2-1-G2012–20312020–20392047–20662069–2088
HadGEM3-GC31-LL2011–20302021–20402038–20572054–2073
INM-CM5-02021–20402037–20562065–2084
IPSL-CM6A-LR2009–20282025–20442041–20602057–2076
KACE-1-0-G2005–20242014–20332034–20532053–2072
KIOST-ESM2008–20272029–20482055–2074
MIROC62031–20502044–20632067–2086
MIROC-ES2L2025–20442038–20572061–2080
MPI-ESM1-2-LR2025–20442039–20582062–2081
MRI-ESM2-02017–20362029–20482055–20742074–2093
NorESM2-LM2033–20522047–20662068–2087
UKESM1-0-LL2014–20332022–20412037–20562051–2070
Table 3. Thresholds of SPEI for wet and dry periods.
SPEI ValueClass
Greater than 2.00Extremely wet
1.50 to 1.99Severely wet
1.00 to 1.49Moderately wet
0.50 to 0.99Slightly wet
−0.49 to 0.49Near normal
−0.99 to −0.50Mild dry
−1.49 to −1.00Moderately dry
−1.99 to −1.5Severely dry
Less than −2.00Extremely dry
Table 4. Copula families and the mathematical descriptions.
CopulaMathematical DescriptionParameter Range
Gaussian C u 1 , u 2 = 1 u 2 1 u 1 1 2 π 1 ρ 2 e x p x 1 2 + x 2 2 2 ρ x 1 x 2 2 1 ρ 2 d x 1 d x 2
u 1 = x 1 u 2 = ( x 2 )

ρ : Linear correlation coefficient

: Standard normal cumulative distribution function
1 ρ 1
Clayton C u 1 , u 2 = u 1 θ + u 2 θ 1 1 θ
θ : Measure of dependency between   u 1   and   u 2
θ 1 , 0
Frank C u 1 , u 2 = 1 θ l n ( ( e θ u 1 1 ) ( e θ u 2 1 ) e θ 1 )
θ : Measure of dependency between   u 1   and   u 2  
θ 0
Table 5. Statistical performance evaluation of the DSSAT model for the crop yields.
CropPeriodYear Yield   ( k g   h a 1 ) Statistical Performance
ObservationSimulationdEFnRMSE
Wheat CERESCalibration1992–2010208923160.730.1720.15
Validation2011–2022254825730.850.318.5
BarleyCalibration2000–2011300933580.770.2519.9
Validation2012–2019350435460.850.577.2
CanolaCalibration1992–2010198020980.80.0313.6
Validation2011–2022256423090.810.114.1
Table 6. Results of the bootstrapping goodness-of-fit test for different copulas fitted to the SPEI and canola yield.
CropCopulaSp-Value
WheatClayton0.0360.89
Gaussian0.4280.321
Frank0.0020.95
BarleyClayton0.0130.878
Gaussian0.9190.169
Frank0.2470.569
CanolaClayton0.0490.83
Gaussian0.4870.447
Frank0.0010.97
Disclaimer/Publisher’s Note: The statements, opinions and data contained in all publications are solely those of the individual author(s) and contributor(s) and not of MDPI and/or the editor(s). MDPI and/or the editor(s) disclaim responsibility for any injury to people or property resulting from any ideas, methods, instructions or products referred to in the content.