Article

Optimizing Vents Opening Configurations and Orientations for Effective Natural Ventilation in Sustainable Greenhouses: A Case Study

by
Ibrahim M. Al-Helal
1,*,
Abdullah A. Alsadon
2,
Abdullah A. Ibrahim
2 and
Mohamed R. Shady
1
1
Department of Agricultural Engineering, College of Food and Agriculture Sciences, King Saud University, P.O. Box 2460, Riyadh 11451, Saudi Arabia
2
Department of Plant Production, College of Food and Agriculture Sciences, King Saud University, P.O. Box 2460, Riyadh 11451, Saudi Arabia
*
Author to whom correspondence should be addressed.
Agronomy 2025, 15(11), 2454; https://doi.org/10.3390/agronomy15112454 (registering DOI)
Submission received: 27 August 2025 / Revised: 19 October 2025 / Accepted: 21 October 2025 / Published: 22 October 2025

Abstract

For sustainable greenhouse design, natural ventilation is a vital component; it depends on the local climate. Therefore, optimizing the greenhouse orientation and vent opening configuration is a critical issue that needs to be addressed for a specific location (e.g., the central region of Saudia Arabia). Experiments were conducted in winter, in a curved-roof, single-span, N-S oriented greenhouse that includes roof and side-wall vents. Five different vent opening arrangements were examined. The outside and inside greenhouse environmental parameters were measured, and the ventilation rate (kg·s−1) and the number of air exchanges per hour (Na) were estimated for each opening case using a modified energy balance equation. The results showed that the common wind directions are N-S and NW-SE. For effective ventilation, greenhouses should be oriented in the E-W or NE-SW directions. Opening the side-wall vents exhibited the highest wind-driven ventilation rate that is essential to control temperature and humidity at the crop level, while only opening the roof vents is not recommended. In the central region of Saudi Arabia, natural ventilation is sufficient for operating greenhouses ( N ¯ a > 30). Opening the roof and side-wall vents (combined wind and buoyancy effects) is the most efficient as long as the greenhouse axis is aligned perpendicular to the wind direction. Such information is essential for sustainable greenhouse management in an arid environment.

1. Introduction

In the arid environment (extremely hot and dry weather, with intensive solar irradiance) such as in Saudi Arabia, it is difficult to grow crops, especially vegetables, in the open fields; therefore, greenhouses are used to create an optimal environment for plant growth by controlling the microclimatic conditions [1]. Ventilation of greenhouses is an essential microclimatic parameter that needs to be adjusted for better crop growth. In general, ventilation is used for providing adequate microclimatic conditions by removing excess humidity and accumulated heat energy from the greenhouse [2]. Recently, most greenhouse ventilation studies have focused on the use of natural ventilation, instead of mechanical, to reduce electric energy consumption by greenhouses [1,2]. In the summer seasons of arid regions, natural ventilation is not appropriate. It replaces the inside greenhouse air with the outside hot air too; therefore, an evaporative cooling system is commonly used to effectively reduce the inside greenhouse air temperature to the appropriate levels [3]. However, in the mild seasons (e.g., winter months), the natural ventilation may be an acceptable, low-cost technique; it may provide an adequate environment for crop growth in the greenhouses, and the operating cost would be reduced [3,4]. Natural ventilation depends on the wind force and its direction, and the temperature difference in air between the inside and outside of the greenhouse. Therefore, natural ventilation is driven by the combined effects of wind and buoyancy forces. This combination may offer, in most cases, an energy-efficient alternative to mechanical ventilation systems. However, the effectiveness of natural ventilation depends on several factors including structural design (that can be controlled such as greenhouse orientation, vents areas and arrangement) and climatic conditions such as the airflow dynamics, ambient air temperature and relative humidity, and radiation intensity (that cannot be controlled in most cases) [4,5].
Specifically, the wind-driven natural ventilation depends on the wind pressure differences between the windward and leeward sides of the greenhouse that create airflow into the greenhouse via its vents. This mainly depends on the number of vents, vent placement, and their opening area in the greenhouse and their opening configuration [5]. Accordingly, the wind direction and the location and the size of vents determine the volume of air exchange rates. In addition, greenhouse orientation is essential in determining the rate of ventilation; for example, aligning the greenhouse to prevailing wind directions enhances airflow efficiency [6]. Buoyancy-driven ventilation (the stack effect), caused by temperature-induced air density differences, drives warm air upward and out through the roof vents while cooler air enters through the lower openings. This mechanism is particularly effective in (i) the tall structures (increasing the height difference between inlet and outlet vents enhances buoyancy-driven airflow) and (ii) the hot climates (thermal gradients are naturally higher, boosting the stack effect) [4,7]. Under real conditions, wind and buoyancy forces often act together to induce natural ventilation. Therefore, understanding their interaction and interplay is essential for optimizing ventilation rate and enhancing its effectiveness. Because the efficiency of natural ventilation depends on the local climatic conditions (the geographic location of the greenhouse), therefore, optimizing the vent’s openings and greenhouse orientation is essential to enhance wind-driven ventilation. For example, in Mediterranean climates, the combined side walls and roof ventilators significantly enhanced ventilation rate, reduced internal temperatures and improved humidity control [3,4,5,6].
A survey of the previous literature revealed that studies to optimize the vents’ opening configurations for maximizing ventilation rate and to achieve optimum microclimatic conditions for crop growth in the desert of arid climate, such as in the central region of Saudi Arabia, are still missing, and more related information is essentially required for greenhouse growers and designers. Therefore, this study aimed to explore the wind directions commonly existing in this region, the optimum greenhouse orientation, and the most efficient vent opening configuration. An experimental, planted greenhouse was used; it includes side-walls and roof ventilators. Five configurations of vent openings were applied to explore the most efficient arrangement that can provide the highest ventilation rate. However, airflow characteristics and their effects on the crop growth behavior and CO2 and humidity levels in the greenhouse are beyond the scope of this study. Results of this study would be useful for growers, greenhouse designers, and researchers by providing sufficient information for operating efficient, low-cost, environmentally friendly, and sustainable greenhouses in the central region of the Arabian Peninsula.

2. Materials and Methods

2.1. Experimental Set-Up and Vents Opening Configurations

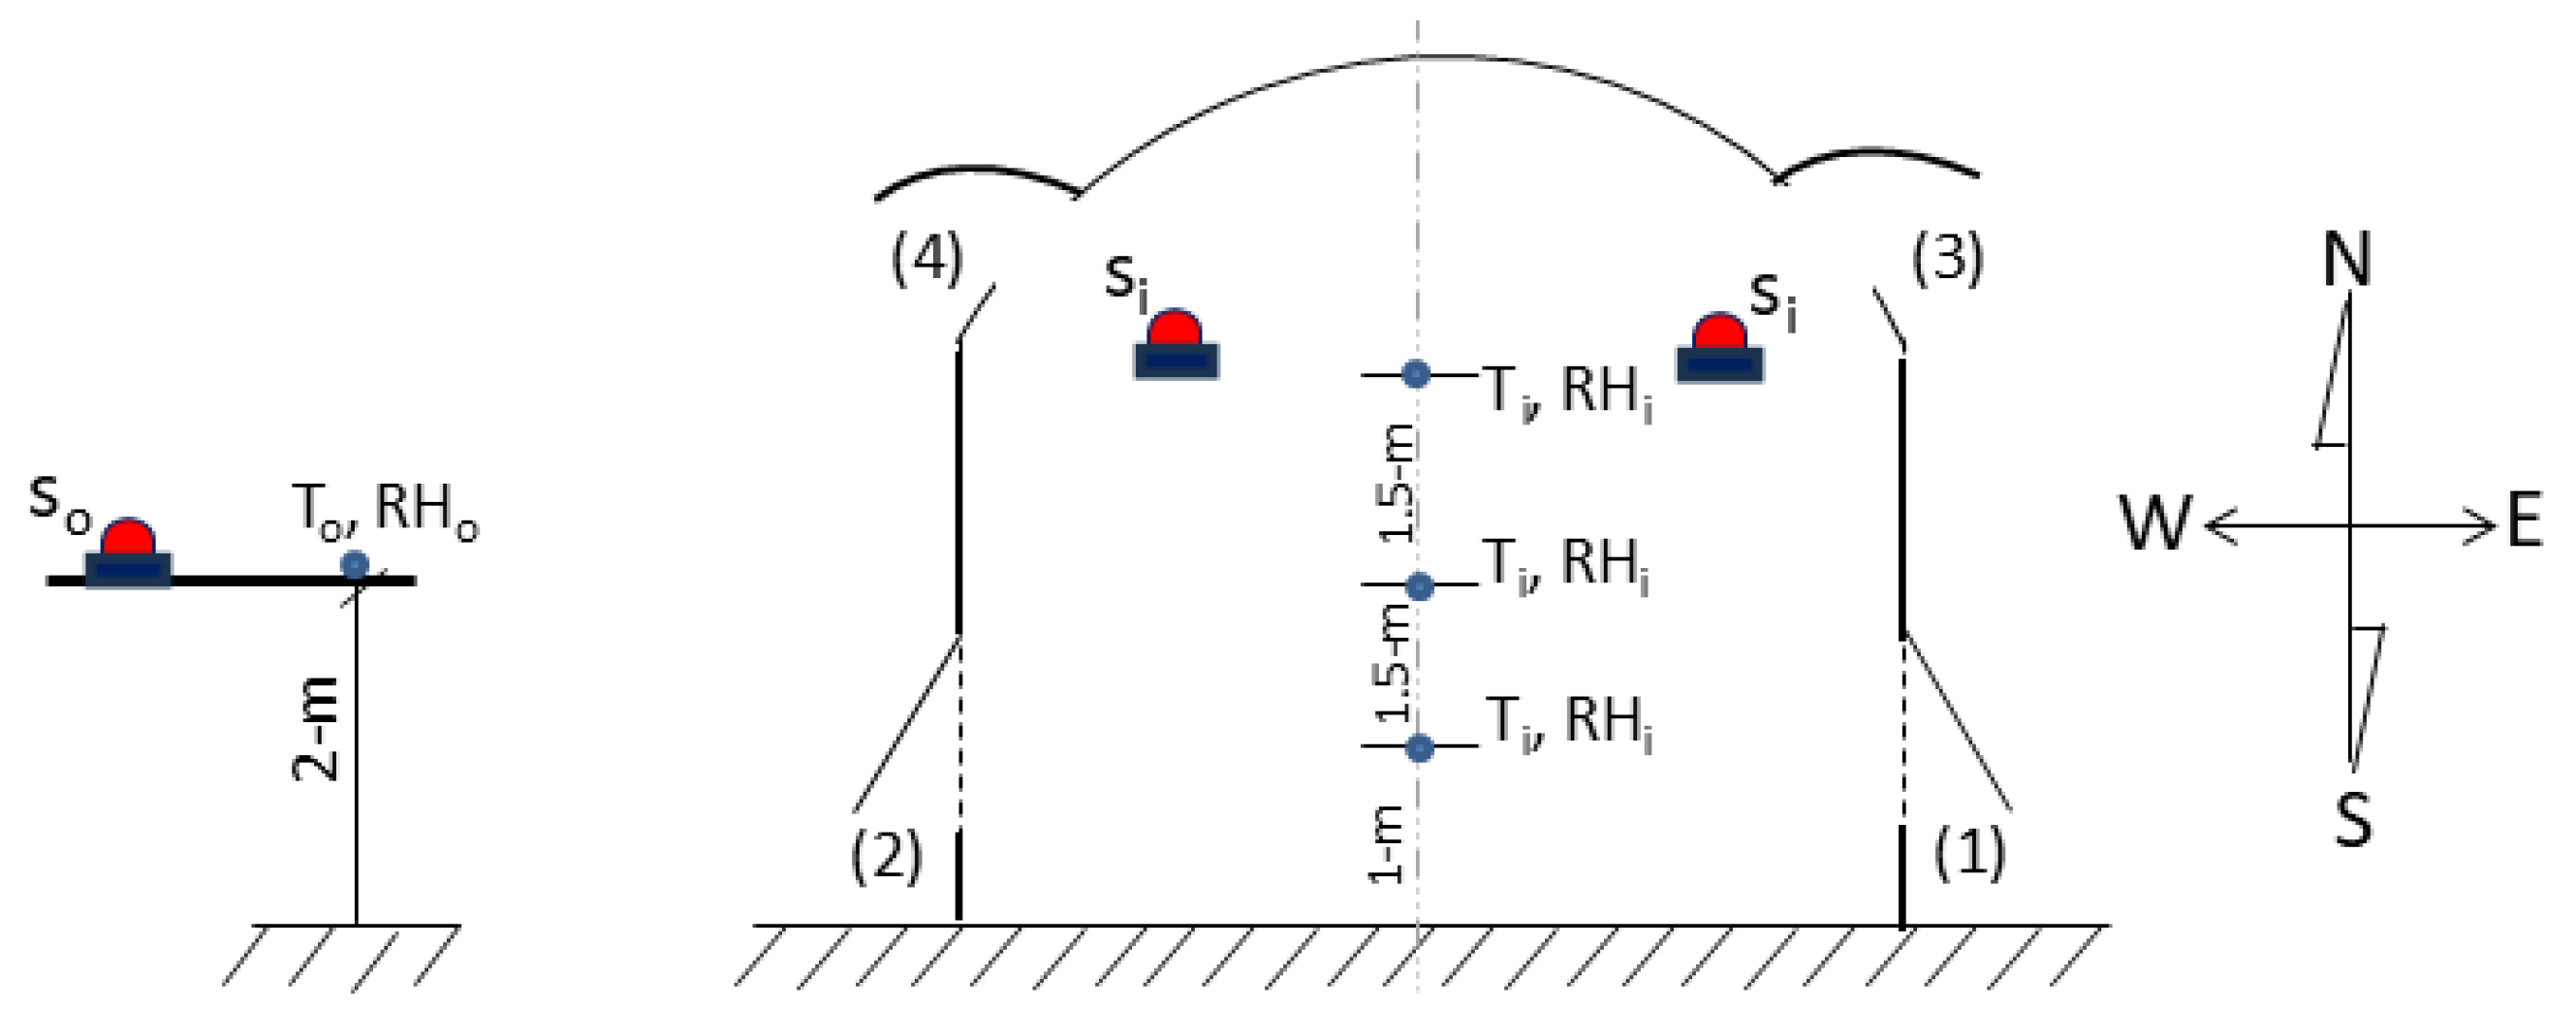
The experiment was conducted in a curved-roof greenhouse, with a floor area of 160 m2 (8 m × 20 m), covered with a double-layer, hollow-channeled, polycarbonate sheet of 8.15 mm thickness. The eaves and ridges heights are 4 m and 6.5 m, respectively, and the cover-to-floor surface area (ψ) was estimated to be 2.76 (Figure 1). The greenhouse was oriented in the north–south (N-S) direction in the Agricultural Research and Experiment Station, Agriculture Engineering Department, King Saud University (Riyadh, Saudi Arabia, 46°47′ E, longitude and 24°39′ N, latitude), and planted with a mature tomato crop. The radiative properties of the polycarbonate cover of the greenhouse were measured and reported in [8] to be as follows: the transmittance to global solar radiation (200–2500 nm) is 70%, to the photosynthetically active radiation (PAR: 400–700 nm) is 71%, and to the IR-thermal radiation (2500–12,500 nm) is 1%. The greenhouse was naturally ventilated using two identical roof ventilators (vents 3 and 4), and two identical side-wall ventilators (vents 1 and 2) as illustrated in Figure 1. The opening area of each roof vent is 20.9 m2, and that of each side-wall vent is 22.8 m2. The vents’ opening configurations were arranged into five cases to cover all the possible airflow directions as illustrated in Figure 1. The case-I: opening the side-wall vents (vents 1 and 2), and closing the roof vents (vents 3 and 4); the case-II: opening the roof vents (vents 3 and 4) and closing the side-walls (vents 1 and 2); the case-III: opening the vents 1 and 4, and closing the vents 2 and 3; the case-IV: opening the vents 2 and 3 and closing 1 and 4; the case-V: opening the side-walls and roof ventilators (the vents 1, 2, 3, and 4) as illustrated in Figure 1.

2.2. Measuring the Required Parameters

In mild seasons, natural ventilation may be able to provide an optimal microclimate for crop growth. Therefore, the experiments were conducted on clear sunny winter days in the period from 15 to 30 December 2024; three consecutive days for each opening configuration of vents (Figure 1). The measured parameters were as follows: (i) The inside air temperature and relative humidity (Ti and RHi) were recorded vertically at the center of the greenhouse in three locations (at 1, 2.5, and 4 m above the floor surface (Figure 2), and the average values were obtained to represent Ti and RHi. The outside temperature and relative humidity (To and RHo) were recorded outside the greenhouse, at 2 m height above the floor, and at a distance of 4 m from the greenhouse. The air temperature and relative humidity inside and outside the greenhouse were measured using combined temperature-humidity-data-logger sensors (OM-EL-USB2-LCD, Omega Inc., Norwalk, CT, USA). The sensors have a maximum error of ±0.5 °C and ±3% for the air temperature and relative humidity, respectively; a working temperature range of −35 to +80 °C and a relative humidity range of 0 to 100%. The sensors were protected against the solar and thermal radiation effects and have been calibrated before use by the supplier. (ii) The inside and outside global solar radiation flux (Si and So) were measured using CMP3 pyranometers (Kipp and Zonen, Sterling, VA, USA), having a time response of 18 µs, a maximum error of ±1%, a sensitivity of 5–20 µV W−1·m−2, a working temperature range of −40 to +80 °C, and a wavelength range of 300 to 2800 nm. Two pyranometers for measuring Si were placed at 4 m above the floor at two locations in the greenhouse (Figure 2), and the average value was obtained to represent Si. A pyranometer to measure So was mounted outside the greenhouse at 2 m height above the ground level (Figure 2). The radiation sensors have been calibrated before use by the supplier. The wind speed values (Vw in m·s−1) and their directions were measured using wind sonic anemometer (Option-1, Gill Instruments Limited, Lymington, UK), installed over a building, near the greenhouse, 6 m above the ground floor. This just to show the magnitude and direction of the free wind stream, as a meteorological parameter, and its effect on the ventilation rate of a greenhouse having different vent opening configurations. However, measuring the wind speed at the vent opening was excluded because the airflow pattern and the characteristic behavior of air movement through the greenhouse vents are beyond the scope of this study. The wind speed sensor records eight directions of wind (i.e., N, E-W, N-E, E, S-E, S, S-W, and N-W), and the wind speed range of 0 to 60 m·s−1. All the measured parameters were recorded every 1 min, averaged every 10 min, and saved in a data logger (CR23X Micrologger, Campbell Scientific, Inc., Logan, UT, USA).

2.3. Determination of the Ventilation Rate

The ventilation rate can be estimated by using either measuring methods [9,10,11,12], aerodynamic models [13,14,15], or energy balance models applied to the greenhouse air [2,16,17,18,19]. The aerodynamic models depend on two critical dimensionless coefficients (i.e., the discharge coefficient and the wind coefficient). These coefficients are usually determined by in situ measurements (as the measuring methods) and they differ from one greenhouse to another, and depend on the vents’ design, greenhouse location, orientation, and the meteorological parameters outside the greenhouse. On the other hand, ventilation rate can be estimated by applying the sensible heat balance to the greenhouse air [17]. This method requires a determination of the fraction of solar energy used for evaporation in the greenhouse. This fraction depends on the plant and soil characteristics and is difficult to determine correctly, especially when the greenhouse includes an evaporative cooling system in summer [20]. The earliest popular formula used by Mihara (1983) to estimate the natural ventilation rate is based on a fundamental energy balance applied to the greenhouse air under the steady-state condition during the daytime [18]. This formula has been modified by Abdel-Ghany et al. [19] to include the most accurate expression for the overall heat loss coefficient (U) of the greenhouse cover. The U factor has been developed based on the transmitted solar radiation flux into the greenhouse (Si), the thermal radiation outside and inside the greenhouse, and the convective and radiative heat transfer modes on the inside and outside surfaces of the cover [21]. Then, the ventilation rate of moist air exchange through the greenhouse envelope is given by
m ˙ a = S i ψ U T i T o / h i h o
where m ˙ a is the ventilation rate of moist air (kg·s−1·m−2 [floor area]); Si is the average solar radiation flux transmitted into the greenhouse (W·m−2); ψ is the cover to floor surface area ratio (Ac/Af); U is the cover overall heat loss coefficient (W·m−2·°C−1); Ti is the mean dry bulb temperature of air inside the greenhouse (°C); To is the dry bulb temperature of the outside air (°C); and (hiho) is the specific enthalpy difference in the moist air between inside and outside the greenhouse (J·kg−1). The U value strongly depended on the environmental conditions inside and outside the greenhouse regardless of the covering material [21]. Therefore, the U factor can be used under the steady- or unsteady-state conditions (i.e., neglecting or considering the thermal mass of the covering material). Detailed analysis of the U factor under unsteady-state conditions for a naturally ventilated greenhouse under different environmental conditions is reported in [19,21], in which the value of U mainly depended on the wind speed outside the greenhouse (Vw) and the temperature difference between inside and outside (TiTo). However, the relative humidity of air in the greenhouse has no significant effect [21]. Three-dimensional analysis was applied to the results reported in [21] using the Table Curve-3D package (Ver-4.0, SYSTAT). The U factor was correlated as a function of Vw in m·s−1 and (TiTo) in °C with a coefficient of determination (R2) of 0.92 and reported by [19] in the form:
U = E x p 1.108 V w 0.5 0.0895 × ln V w 0.359 + 753 × 10 6 ( T i T o ) 2
The specific enthalpy of the moist air (kJ·kg−1) inside and outside the greenhouse (hi and ho) can be approximated as a function of the dry bulb temperature (T), and the absolute humidity (ω), inside and outside the greenhouse as [22] by
h = 1.007 T 0.026 + ω 2501 + 1.84 T , T   in ° C
Using the measured relative humidity (RHi and RHo) and dry bulb temperatures inside and outside the greenhouse (Ti and To), the corresponding absolute humidity (ω) can be easily estimated by using the psychometric chart or simplified correlations reported in [22]. Once the value of m ˙ a was determined, the number of greenhouse air changes per hour (Na) can be determined as
N a = m ˙ a × 3600 / ( V g ρ a )
where ρ a is the density of moist air in the greenhouse, and Vg is the greenhouse volume (m3).

3. Results and Discussion

For each vent opening configuration (case-I to case-IV), the measurements were taken for 3 consecutive days (15 days in total). The results showed that the time courses of the measured meteorological conditions (To, RHo, So, and Vw) were nearly similar during the 15 days of experiments. The transmitted solar radiation flux into the greenhouse (Si) is the most important parameter that affects the inside air temperature and humidity (Ti and RHi) and the natural ventilation rate as well. Figure 3 illustrates the transmitted solar radiation fluxes (Si) taken for two consecutive days for each opening case. The diurnal variations in Si through the different days of measurements were almost similar (Figure 3). Therefore, for simplicity, the results of one day (24 h) was selected for each case (case-I to case-IV) to be presented in the upcoming results.

3.1. Wind Characterization

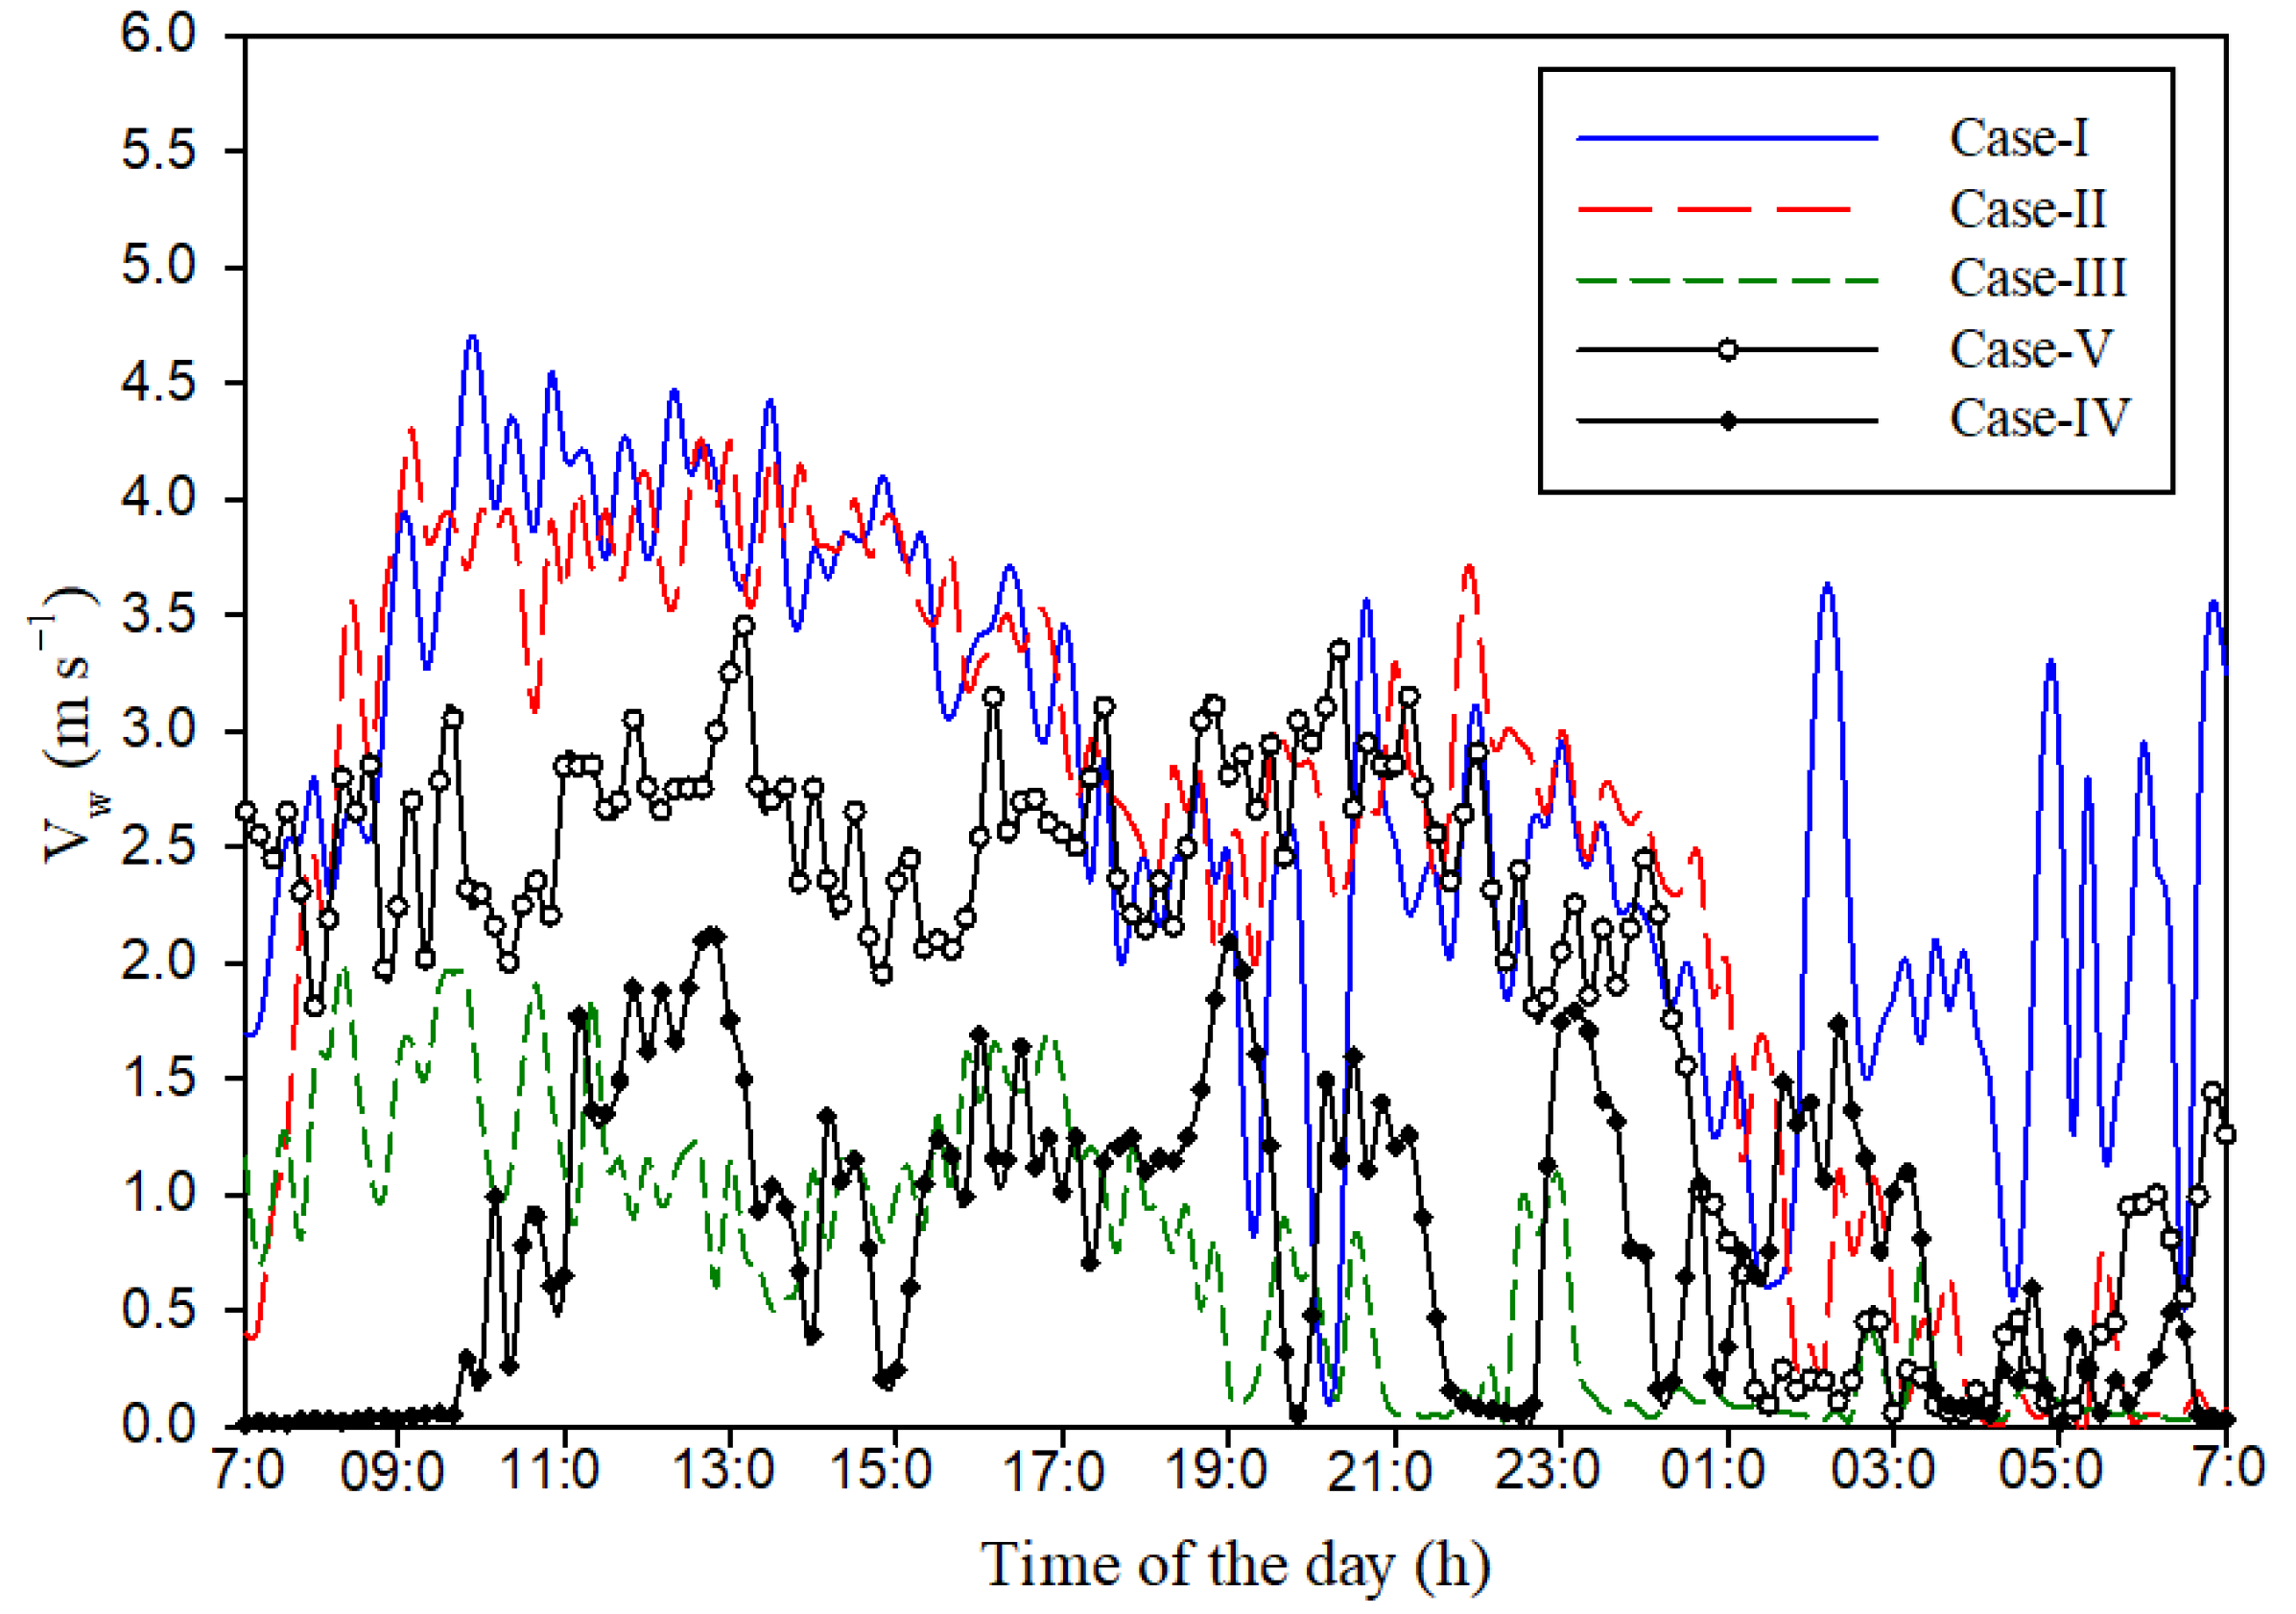
Diurnal variation in the wind speeds (Vw) for the selected five days (one day for each opening case) is illustrated in Figure 4. The highest wind speed was recorded when the side-wall vents were opened (the case-I), followed by the case-II (the roof vents were opened). For more clarification, a simple statistical analysis was applied to the data in Figure 4 and the results for each opening case are summarized in Table 1. This includes the daily mean of wind speed ( V ¯ w ), standard deviation (STD), and standard error (STE). The highest V ¯ w value was recorded when the side-wall vents were opened (case-I), while the lowest was recorded when one roof and one side-wall vent were opened (case-III). The highest daily variation in Vw was observed when the roof vents were opened (case-II, STD = 1.37); while the lowest was when one roof and one side-wall vent were opened (case-III, STD = 0.58).
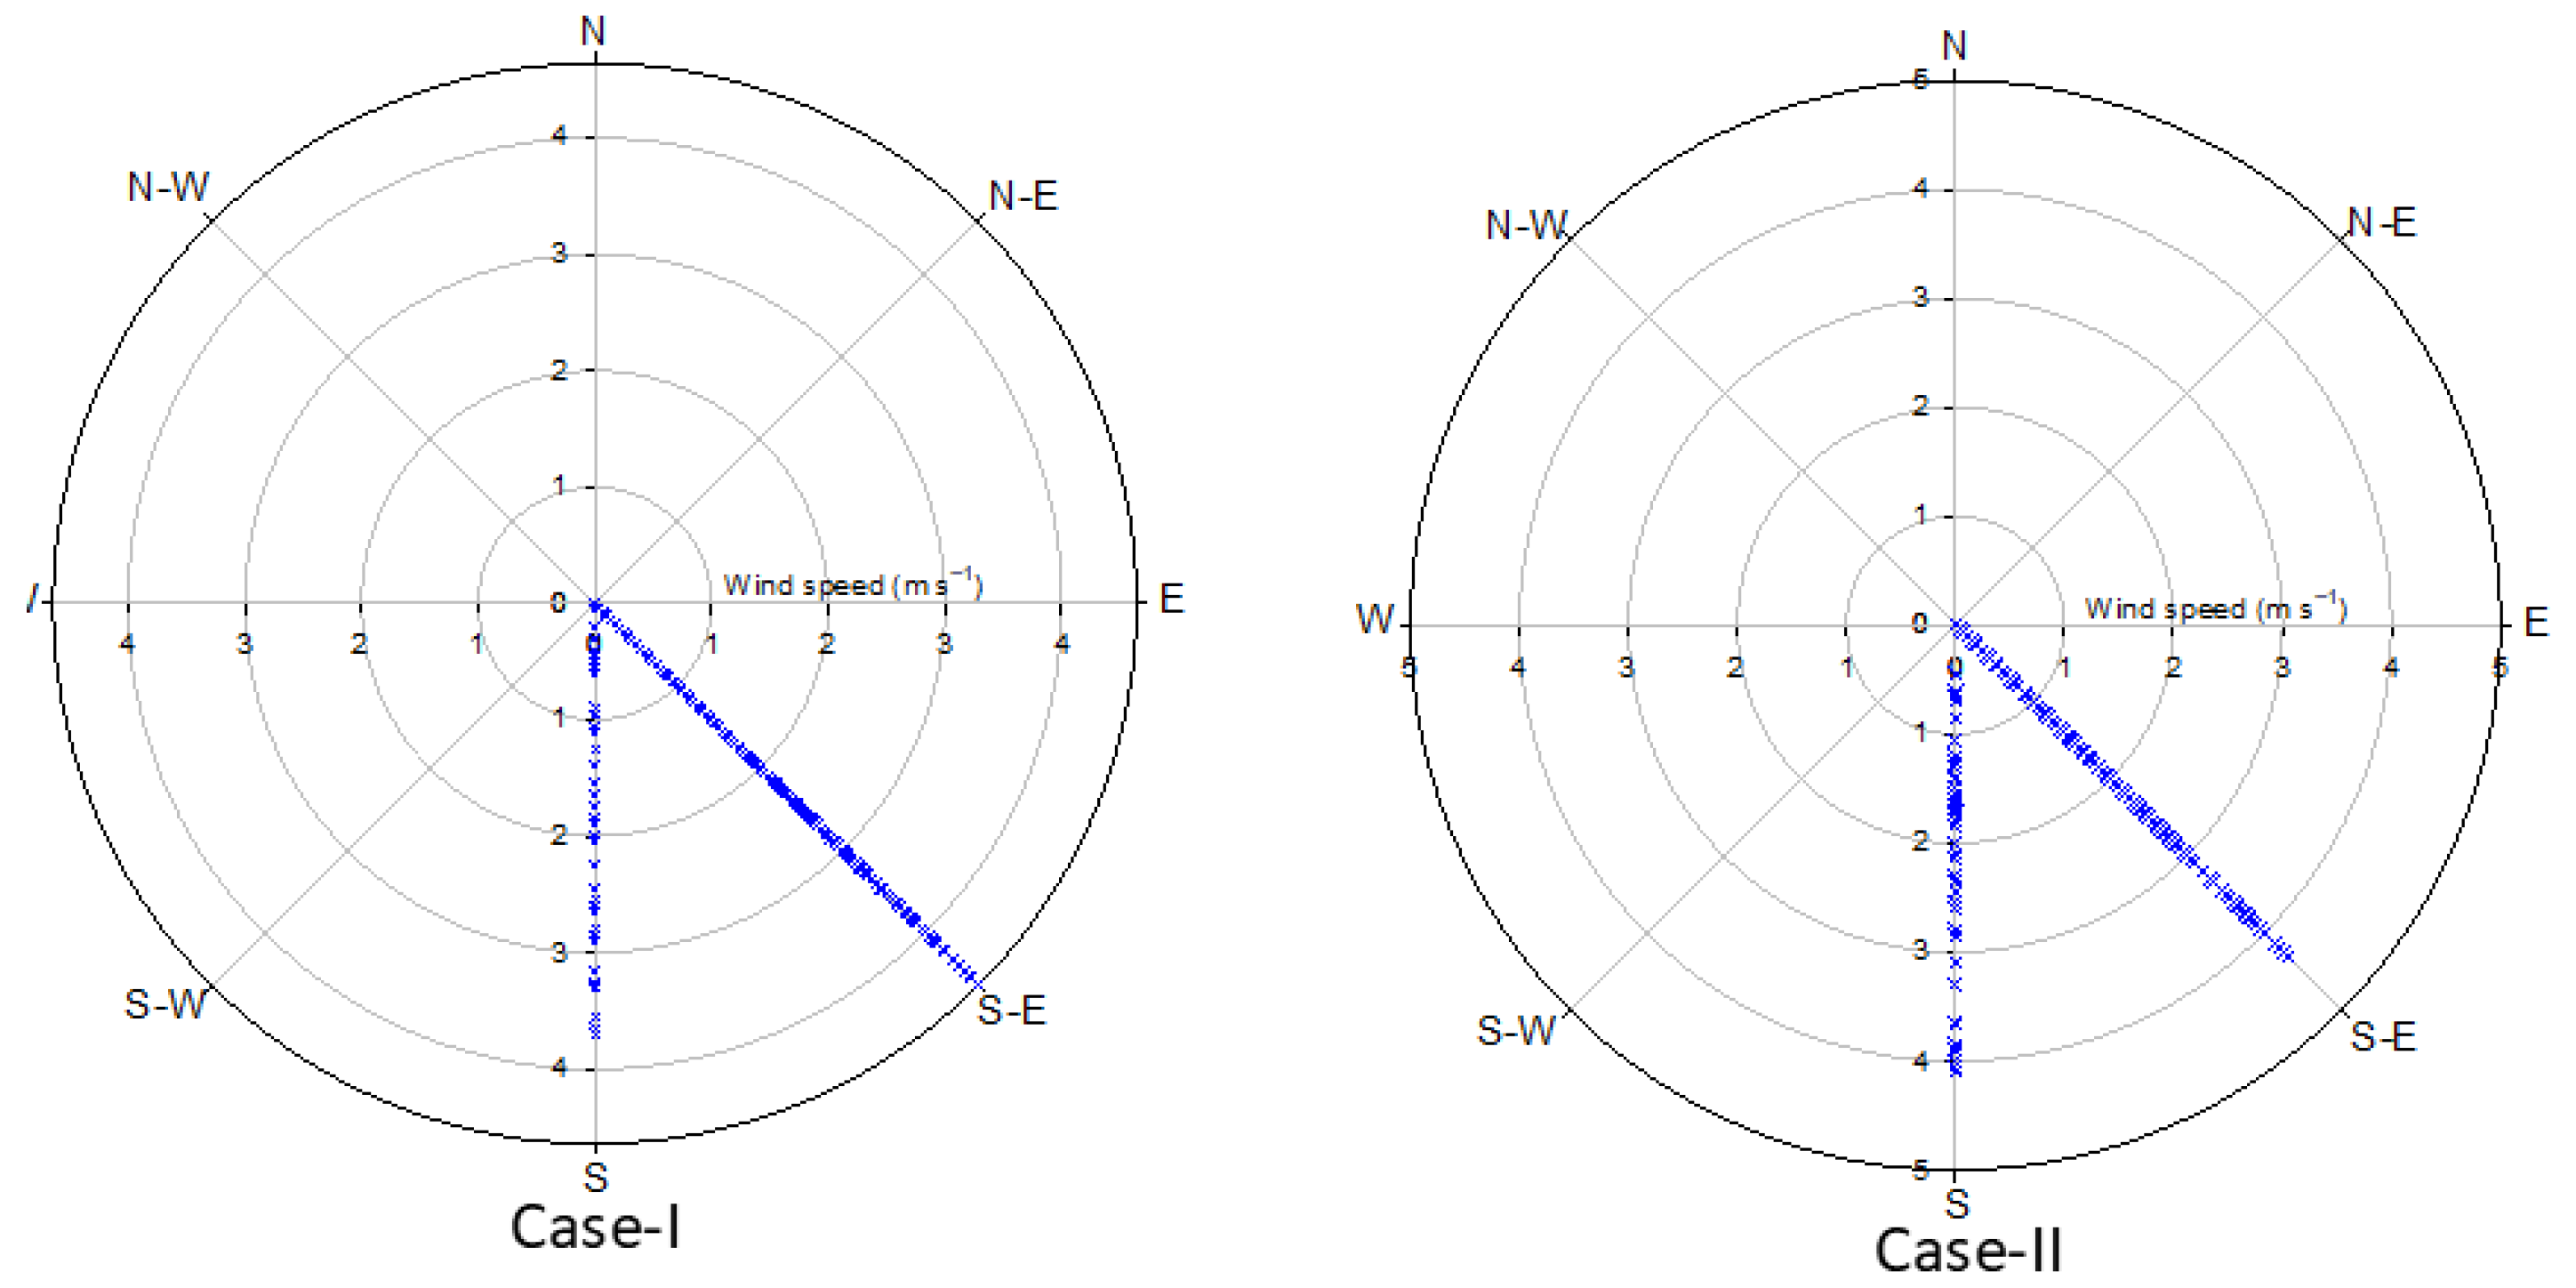
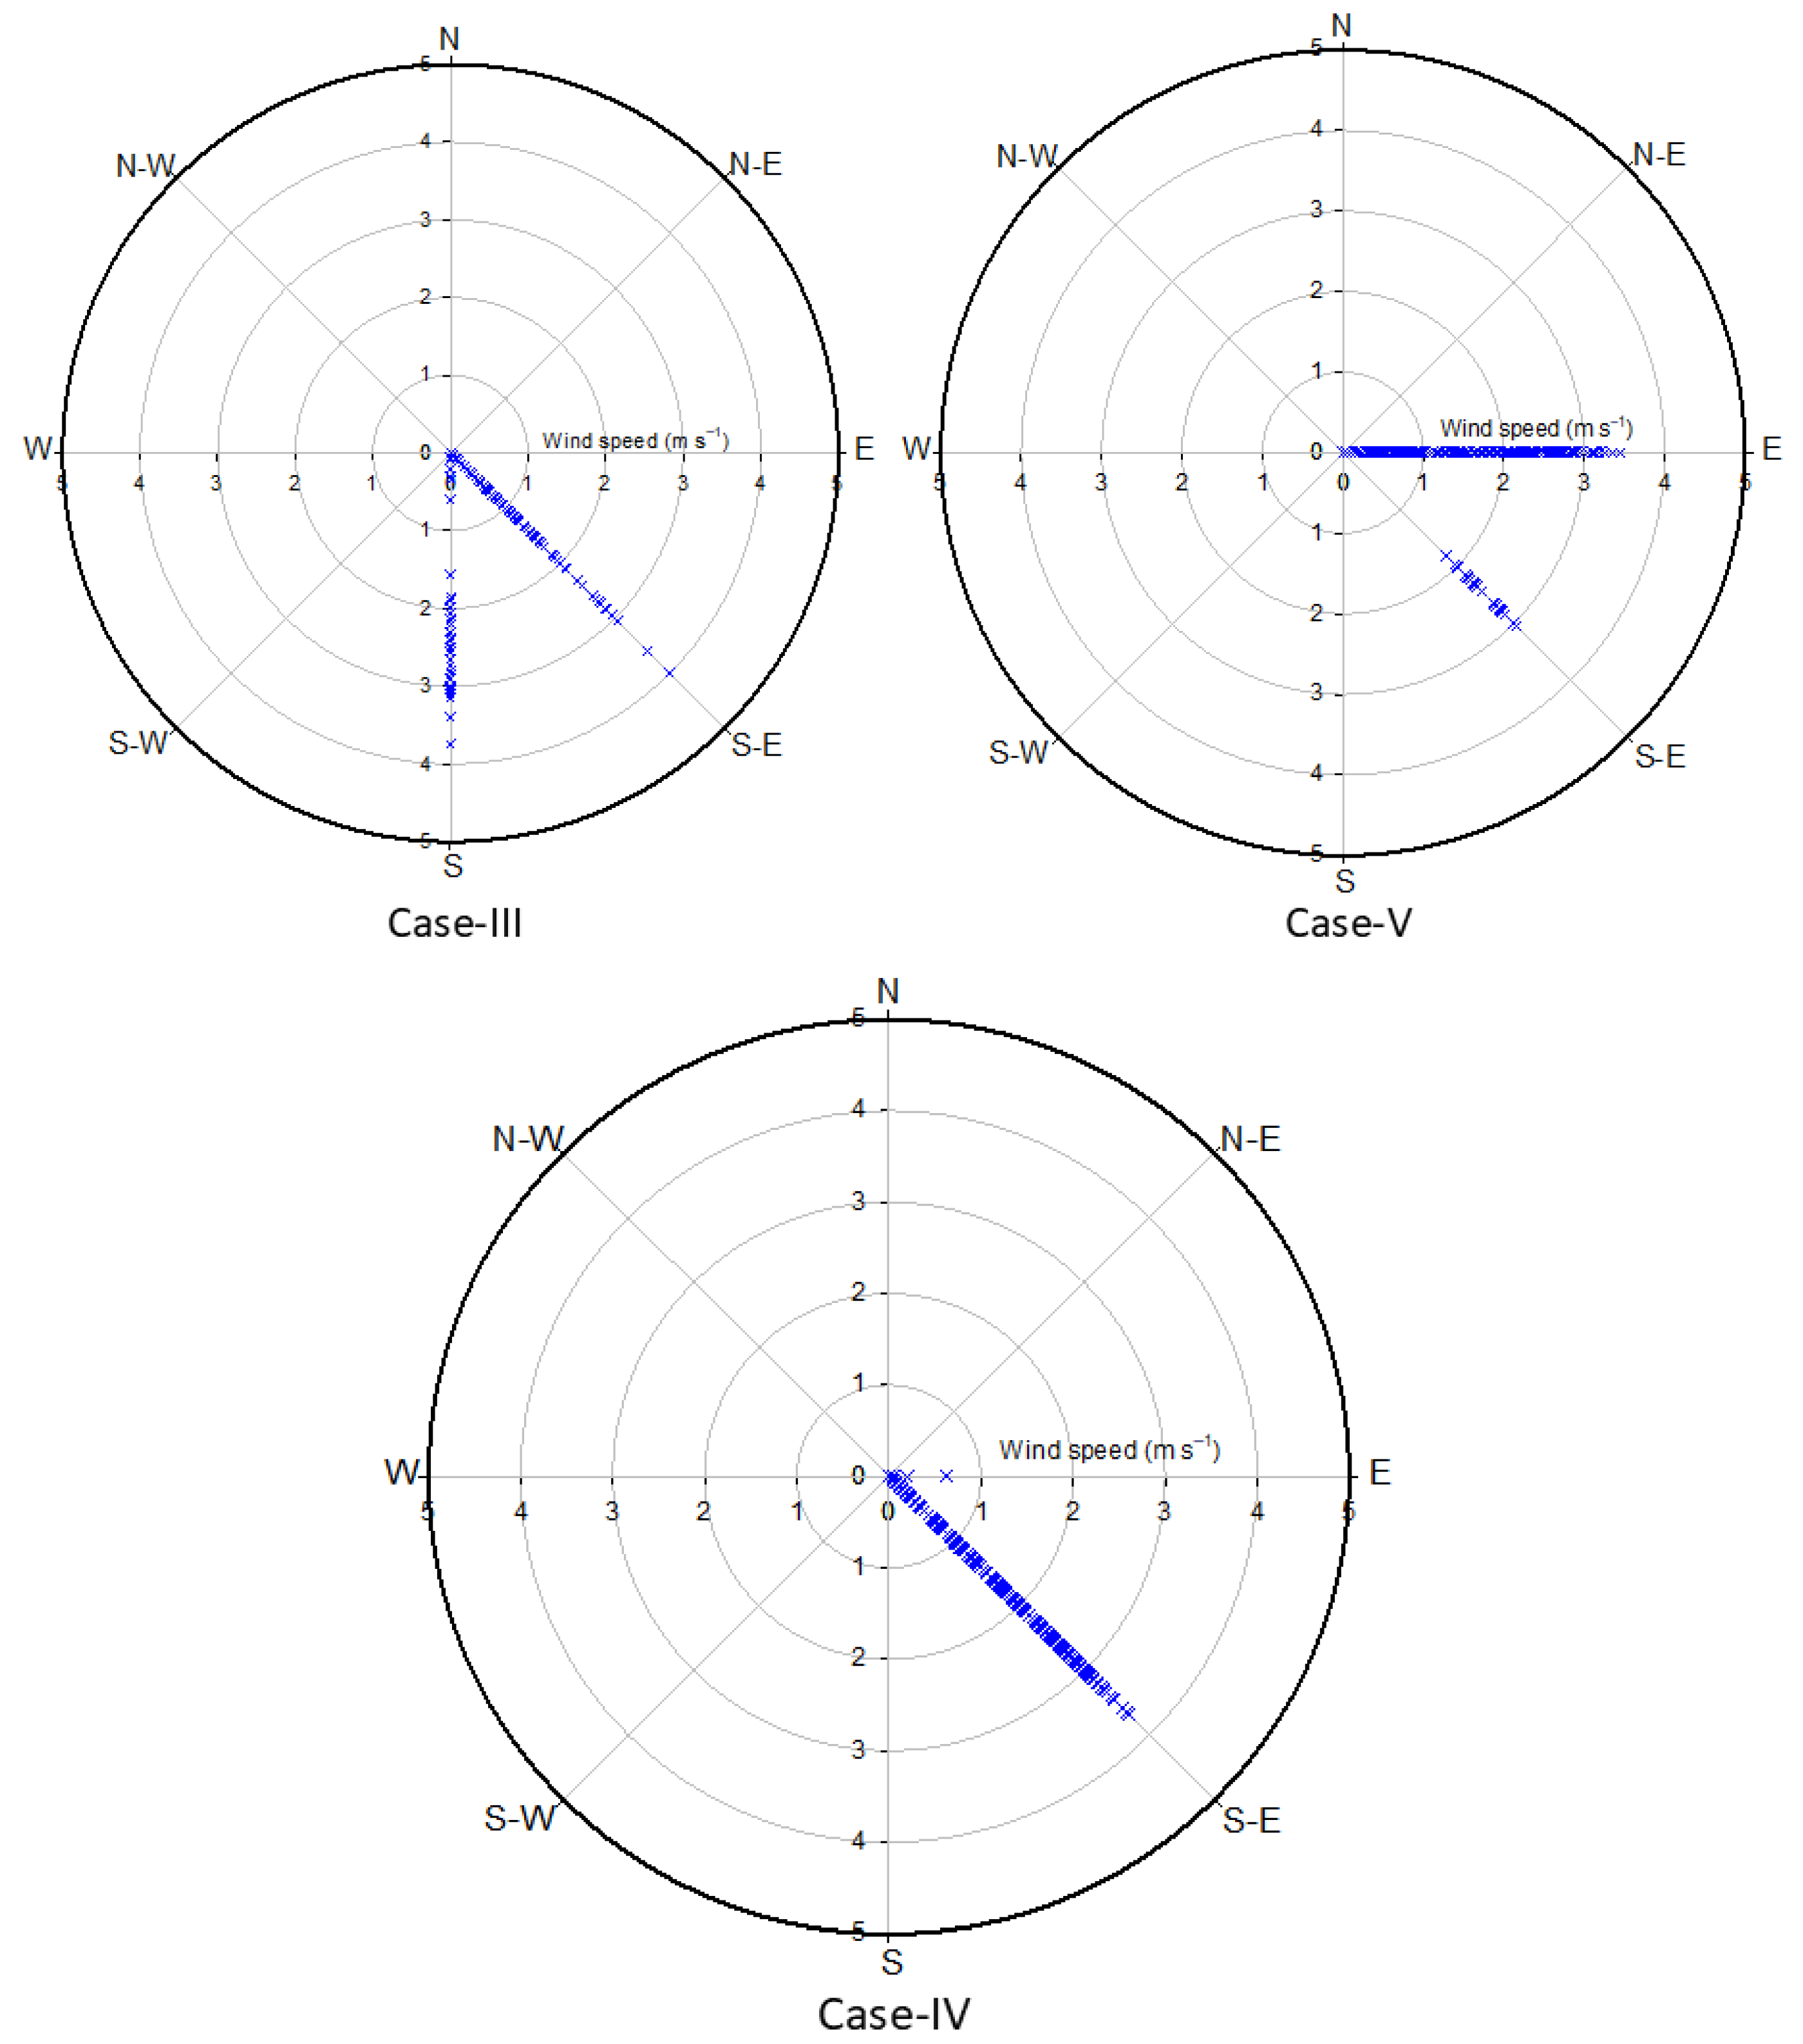
Wind speed and direction cannot be controlled (i.e., meteorological parameters), and the magnitude of wind speed alone is meaningless when studying the ventilation rate of a greenhouse; therefore, it should be allocated with the wind direction relative to the greenhouse orientation and vent opening configuration. Accordingly, this study explored the wind speed and direction during the 15 days of experiment as illustrated in Figure 5. The wind directions depicted in Figure 5 are common for most of the year and months in the central region of Saudi Arabia, not only during the experiment. To confirm this claim, data of wind speed and its direction for four consecutive months (November 2024–February 2025) could be collected from a meteorological station in the KSU campus, and are depicted in Figure 6. Based on Figure 6, the wind directions are mainly in the north and south directions (N-S or S-N), and sometimes in the NW and SE directions. This was also illustrated in the cases-I, II, III, and IV (Figure 5). It is uncommon (rarely) to be from the west to east direction (W-E) as in the case-V (Figure 5) and emphasized in Figure 6. Accordingly, orienting the greenhouse in the N-S direction is not appropriate, because the wind direction is, in common, parallel to the vent opening. To enhance the ventilation effectiveness, the wind direction should be perpendicular to the vent opening, and the greenhouse should be oriented in the E-W direction or in the NE-SW direction as illustrated in Figure 5 and Figure 6. In general, the greenhouse should be oriented perpendicular to the prevailing wind direction to enhance the natural ventilation effectiveness.

3.2. Parameters Controlling Ventilation

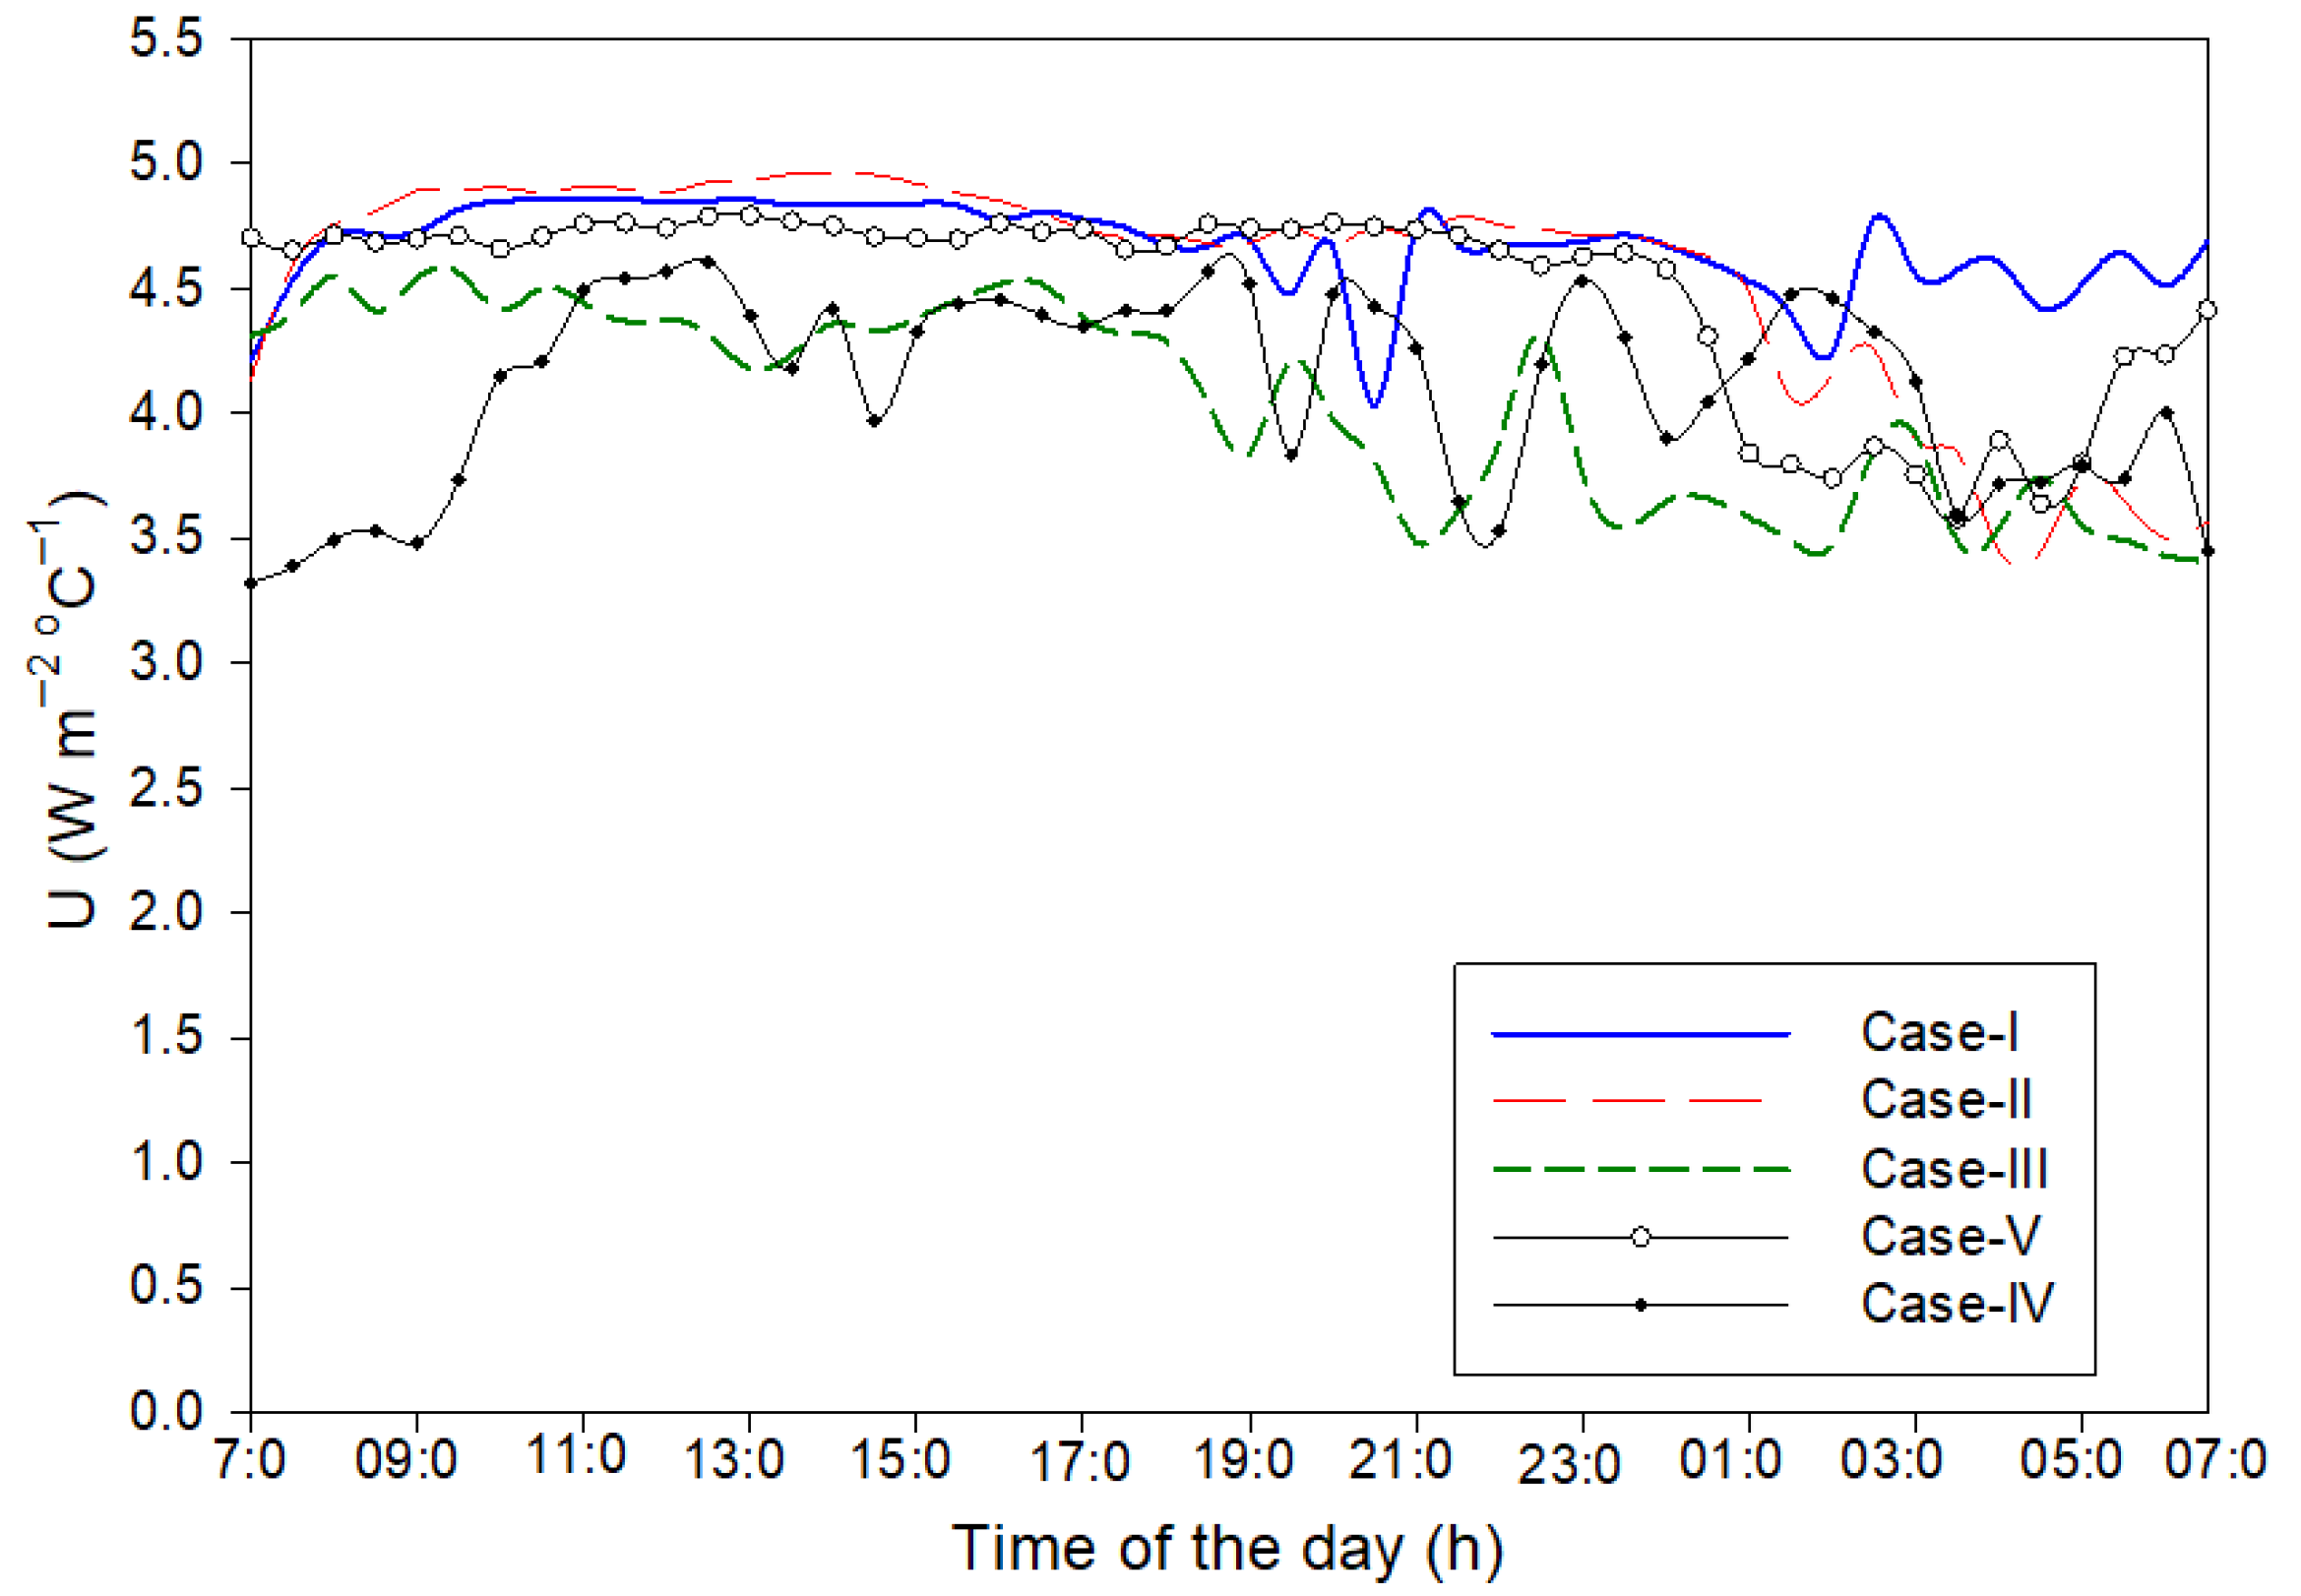
According to Equation (1), the natural ventilation rate is driven by the transmitted solar radiation (Si) as seen in Figure 3, and depends mainly on the enthalpy difference between inside and outside the greenhouse (hiho), air temperature difference (TiTo), and the overall heat losses coefficient (U). In general, the factor U depends on the convective heat transfer coefficients on the inner and outer surface of the greenhouse cover and the conductive-radiative resistance of the covering material. According to [21], the U factor depends mainly on the wind speed (Vw) and the air temperature difference (TiTo) as in Equation (2). Figure 7 illustrates the time course of the U values, estimated, using Equation (2), for the five selected days (one day for each opening configuration, case-I to case-IV). The U value in Figure 7 changes from 3.5 to 5 (W·m−2·°C−1) according to the diurnal variation in Vw, To and Ti. It is more representative to use the U value resulted from Equation (2) instead of using it as a constant value in the previous studies [23,24,25,26] that may lead to large errors in the estimation of the greenhouse ventilation rate or any other thermal analysis.
Using the enthalpy difference (hi-ho) in Equation (1) is more convenient than the form of sensible heat balance used in previous studies [17,23,24,25,26]. The enthalpy of air (Equation (3)) includes the thermal energy content of water vapor inside or outside the greenhouse in addition to the sensible heat content of the dry air. For the same 5 days selected in Figure 4 and Figure 7, the diurnal variation in (hi-ho) is illustrated in Figure 8 for the five opening configurations (case-I to case-IV). Based on Equation (1), the low enthalpy difference is usually allocated with a higher ventilation rate (opening the side-wall vents, case-I in Figure 8). Opening the two roof vents together (case-II in Figure 8) showed the highest enthalpy difference and, consequently, would be allocated with the lowest ventilation rate.
In general, the buoyancy-driven ventilation (the stack effect) induced by the vertical density differences in the greenhouse air causes the warmer air to rise up and exit through the roof vents, while cooler air should enter the greenhouse through lower side-wall openings. Therefore, closing the side-wall vents and opening the roof vents would only deteriorate the stack effect and the buoyancy-driven ventilation as well (case-II, Figure 9). Moreover, opening the roof vents at the level of the hot air inside the greenhouse will also deteriorate the wind-driven mechanism and allow only the air diffusion mechanism to exchange air through the greenhouse roof vents. Accordingly, opening the side-wall vents is more efficient in enhancing the ventilation rate than the roof vents. For an efficient ventilation rate, the side-wall and roof vents should be opened and aligning the greenhouse perpendicular to the wind direction; this is to enhance both wind-driven and buoyancy-driven ventilation. The negative values of (hi-ho) in Figure 8 around sunrise and sunset times are the result of the inside greenhouse air temperature being lower than outside during the early morning and late afternoon.

3.3. The Estimated Ventilation Rate

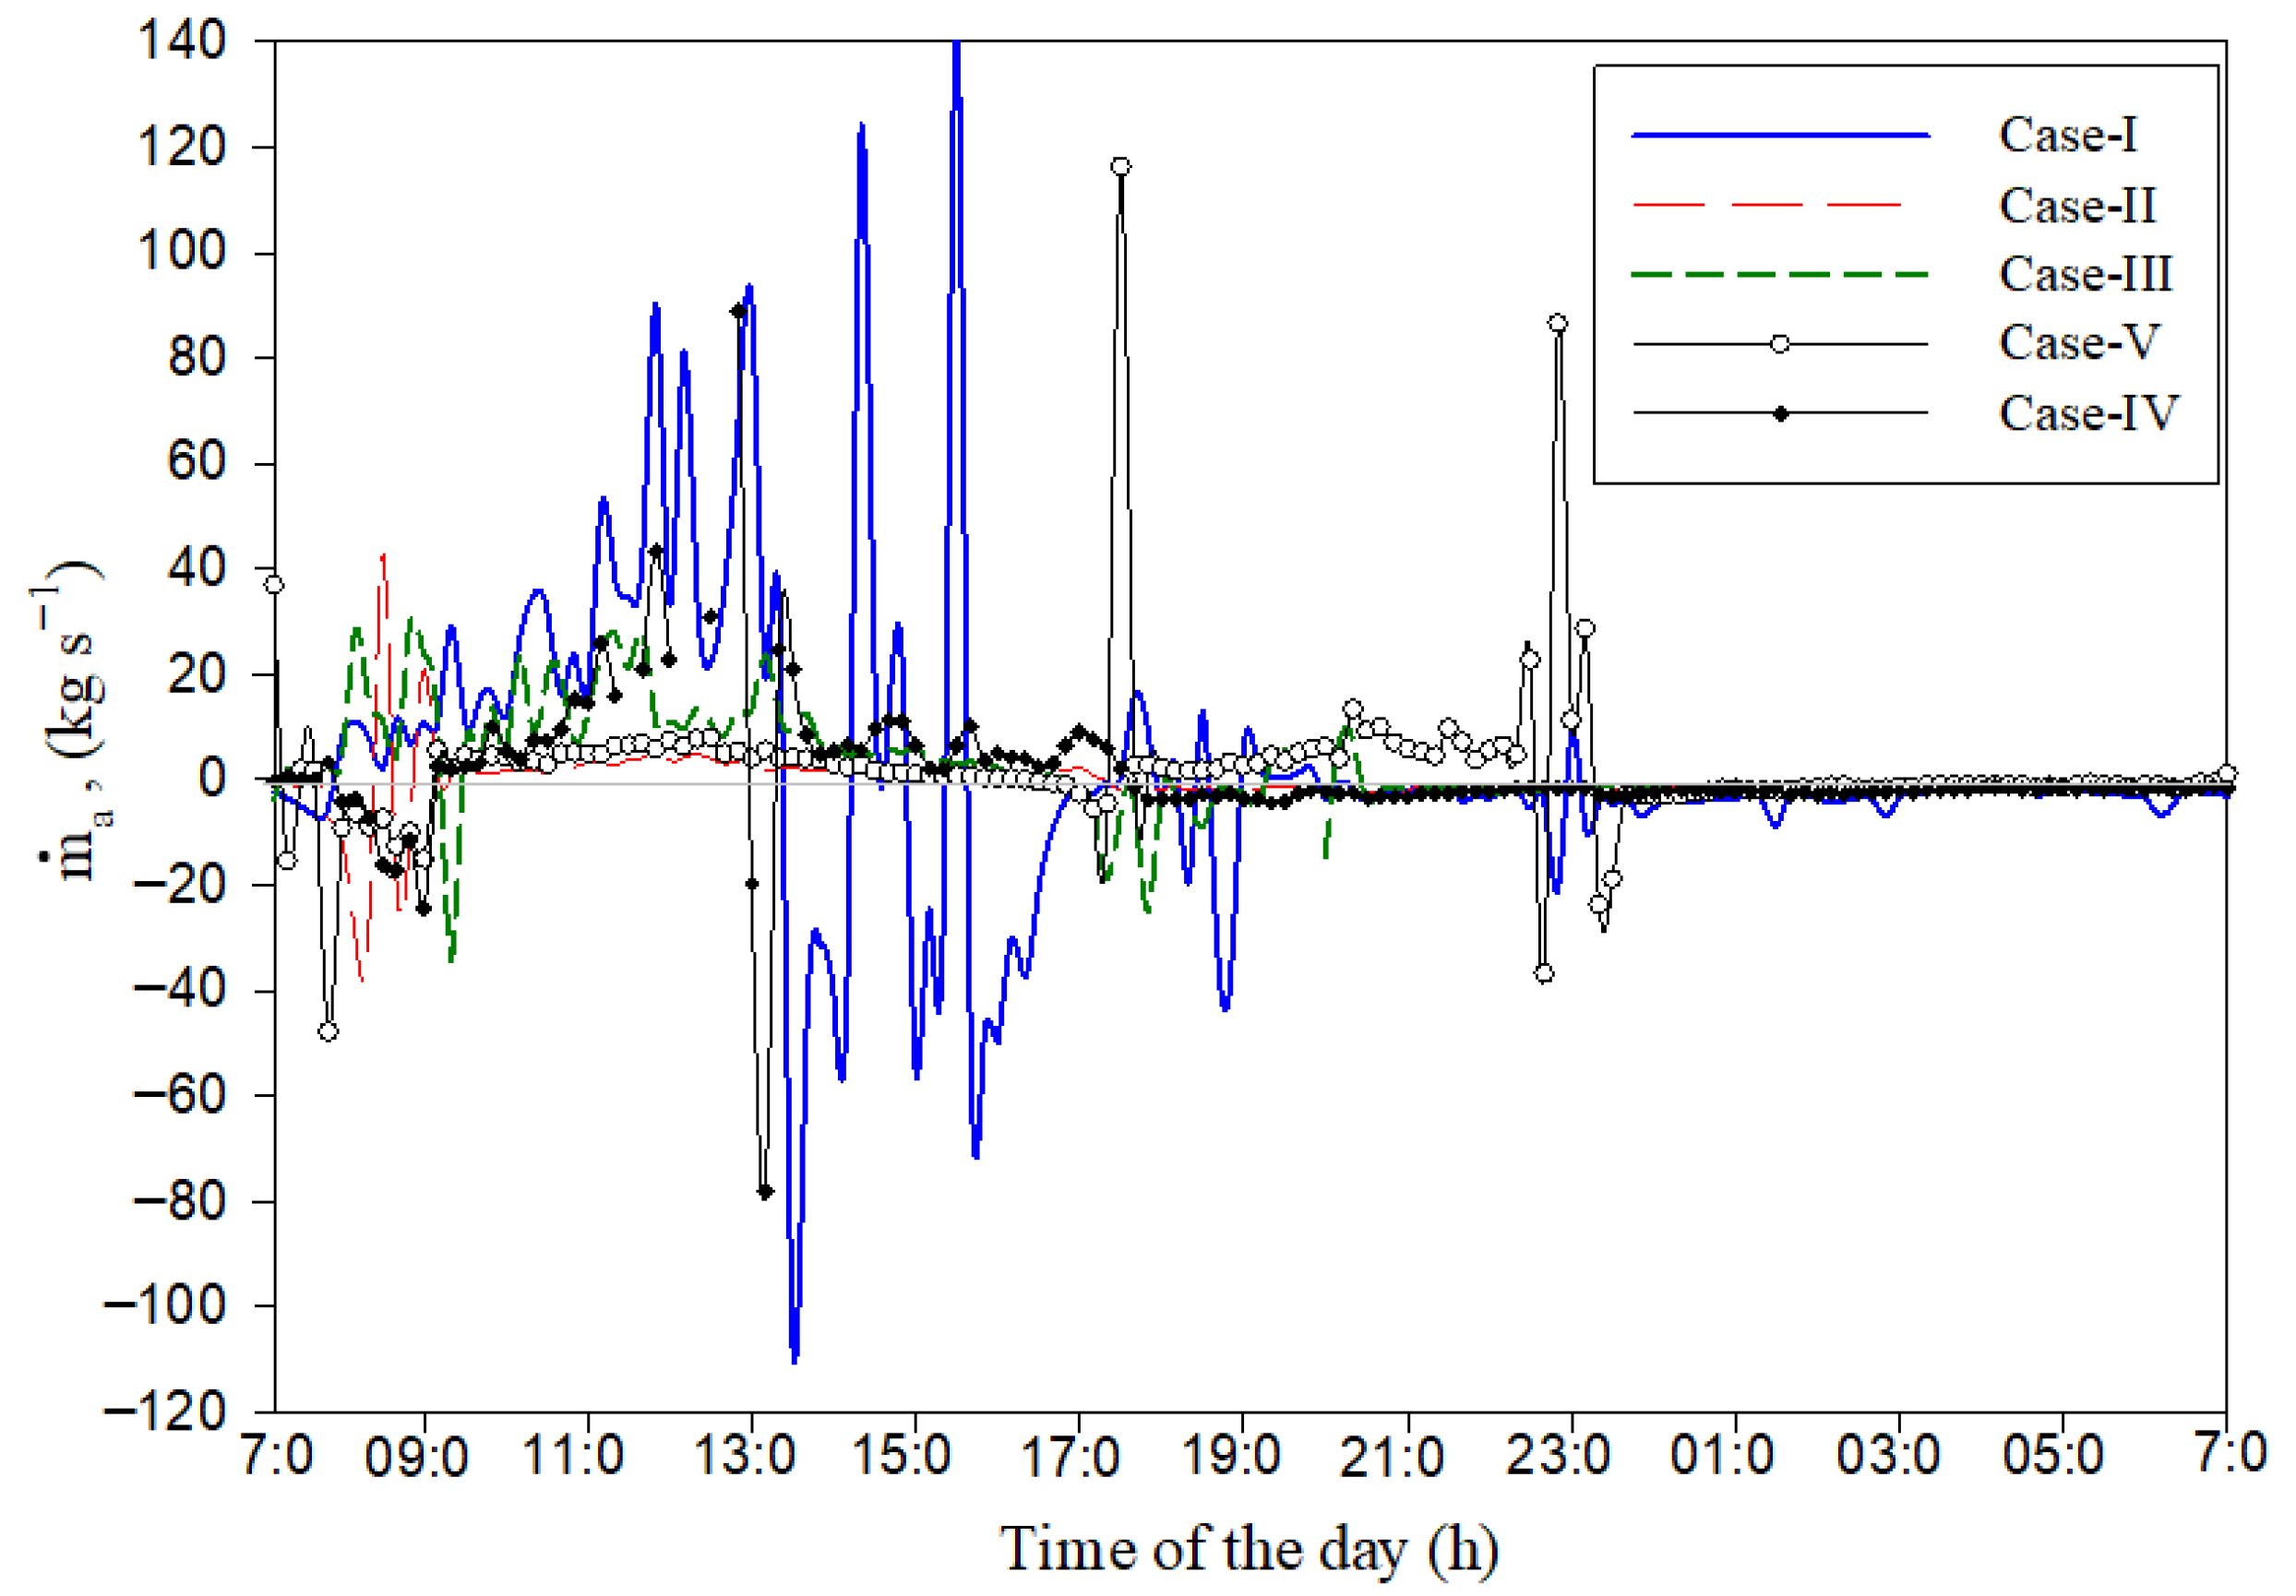
As we have mentioned previously, in the hot summer seasons of arid regions, natural ventilation is not enough for greenhouses to remove heat accumulation; it should be replaced with mechanical ventilation with evaporative cooling and shading [27]. Therefore, the experiment of this study was conducted in the winter season to examine the possibility of using natural ventilation alone, in winter months, for low-cost sustainable greenhouse operation. Figure 9 illustrates the natural ventilation rate ( m ˙ a ) estimated using Equation (1) in kg of air per second. The negative values of m ˙ a in Figure 9 represent the opposite direction of airflow when the inside air temperature (Ti) is lower than that of the outside air (To). In the naturally ventilated greenhouses, in winter season, it is common for Ti to be lower than To in the morning and afternoon, and sometimes during the nighttime. In this case, the warm air enters the greenhouse from the roof (the upper) vents, and the cold air exits from the side-wall (the lower) vents. However, when Ti is higher than To (during most of the daytime), the inside warm air exits the greenhouse from the upper vents and the cold air enters from the side-wall (lower) vents.
These mechanisms make the two directions of airflow and the negative and positive values of the estimated m ˙ a in Figure 9. The results of m ˙ a in Figure 9 are in accordance with the results in Figure 8 and have emphasized four facts: (i) opening the side-wall vents significantly enhances the wind-driven ventilation rate at the crop level and is very useful for plant growth behavior (case-I), (ii) opening the roof vents alone is not recommended (case-II), (iii) opening the roof and side-wall vents in opposite directions (case-III and case-V) would be effective if the greenhouse was aligned longitudinally perpendicular to the wind direction, and (v) opening all the side-wall and roof vents (case-IV) would be more efficient if the greenhouse was aligned properly to prevailing wind directions. Moreover, most of the existing greenhouses in the study region are CO2 enriched and depend on the ambient CO2 levels because they are used mainly for growing vegetable crops. Therefore, opening the side-walls and roof vents is strongly recommended.
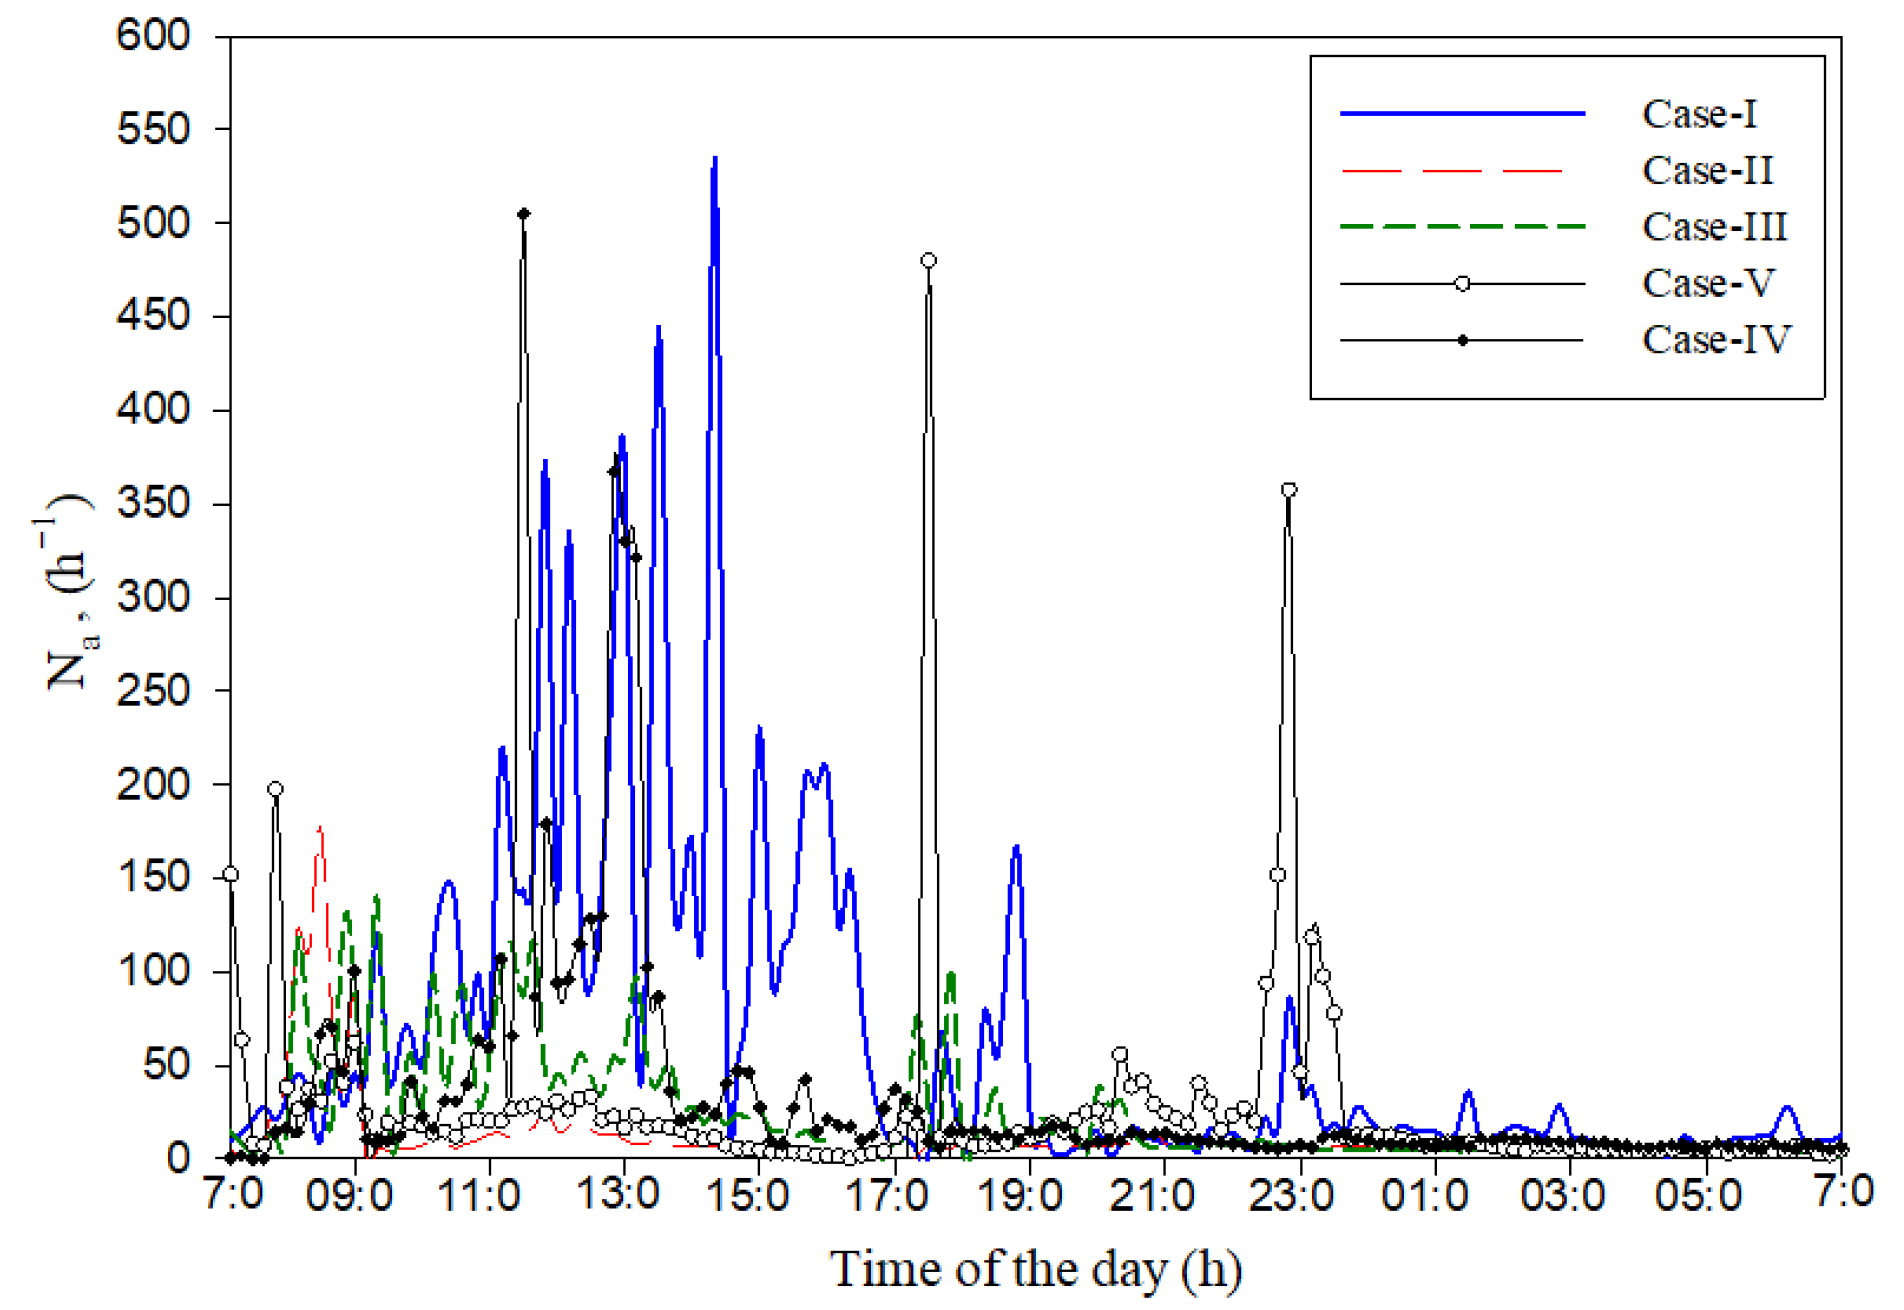
The number of air exchange rates per hour (Na) is commonly used to represent the required ventilation level for greenhouses; it depends on several parameters (e.g., the crop type, climate conditions, and ventilation method). Based on the literature, a minimum rate of 30 (h−1) is able to maintain CO2 levels for photosynthesis and prevent humidity buildup in the greenhouses. An optimum range of Na from 60 to 90 (h−1) is common for most crops, ensuring proper temperature control, humidity regulation, and CO2 availability in the greenhouse for better crop growth [28]. However, in hot climates, a maximum rate of 180 (h−1) is required to prevent overheating in the greenhouse [29]. The values of Na estimated, using Equation (4), for the selected five days for the five cases of vent opening are depicted in Figure 10.
A simple statistical analysis was applied to the data in Figure 10, and the results of each opening case (i.e., the mean value of the number of air exchange ( N a ¯ ) , standard deviation (STD), and standard error (STE) are summarized in Table 2.
For the five opening cases, the level of Na (in Figure 10) is higher during the daytime than nighttime for all opening cases because, during the daytime, ventilation is driven by the combination of the buoyancy and wind effects; however, during nighttime, ventilation is driven mainly by the wind effect. Based on Table 2, opening the side-wall vents (case-I) in the crop level exhibited the maximum ventilation rate ( N a ¯ = 63.7 h−1) that is essential for better crop growth. Opening all vents (case-IV) also exhibited the optimum ventilation rate ( N a ¯ > 30 h−1). In addition, opening one roof and one side-wall vent (case-III and V) is a promising method if the greenhouse was oriented properly to enhance ventilation rates. The airflow in the greenhouse is steadier in the cases-III and V, (STD = 30.2 and 55.5, respectively) comparing to the cases-I and IV (STD = 90.15 and 67.2, respectively). Opening the roof vents alone (case-II) is not recommended at all, because the two roof vents are in the hot air level; this deteriorates the buoyancy and wind effects. Even though in case-IV, all the side-wall and roof vents were opened, the value of N a ¯ was 33.2 (h−1) comparing with 63.7 (h−1) when only the side-wall vents were opened (case-I); this is mainly attributed to the lower wind speed ( V ¯ w = 0.8 m·s−1) compared with 2.7 m·s−1 of case-I (Table 1 and Table 2).

3.4. Quantification of Ventilation Regime

Over the three days measured for each opening case, the ventilation rate ( m ˙ a in kg·s−1) was quantified into three regimes according to the criteria reported in several greenhouse ventilation studies [30]. Based on the free wind stream velocities (Vw), the criteria are three categories: if [Vw ≤ 1 m·s−1], buoyancy is a substantial driver; if [1 < Vw ≤ 2 m·s−1], there is a combined regime of wind and buoyancy effect; and if [Vw > 2 m·s−1], the wind effect is dominant. Table 3 summarized this quantification (the contribution percent).
Even though the wind speed level was low ( V ¯ w = 0.8 m·s−1, case-IV) opening the side-walls and roof ventilators deteriorated the buoyancy effect (contributed by 3.8%). In all cases of opening arrangements, the contribution of wind effect was dominant except in case-V. In this case, roof and side-wall vents were opened and both were not facing the wind direction (see Figure 1 and Figure 6). In general, opening roof and side-wall ventilators would make the effect of wind force and buoyancy effect comparable if the greenhouse was properly oriented.

4. Conclusions and Recommendation

For sustainable low-cost greenhouse operation, natural ventilation can replace the energy-consuming mechanical ventilation in the central region of Saudi Arabia. For this purpose, experiments were conducted in a curved-roof, N-S oriented greenhouse that includes two roof vents and two side-wall vents. Five different opening configurations were examined to find the best opening arrangement that enhances the ventilation rate. Based on the results of this study, the following points could be drawn:
  • Opening the side-wall vents is essential, exhibiting the highest ventilation rate; however, opening the roof vents alone is not recommended for greenhouse ventilation.
  • Opening the roof and side-wall vents (in opposite directions) is effective if the greenhouse is properly oriented to make the vent opening perpendicular to the wind direction.
  • According to the common wind direction in the central region of Saudi Arabia, the greenhouse should be oriented in the E-W or in the NE-SW directions.
  • In winter seasons, natural ventilation for greenhouses is sufficient and can effectively replace the energy-consuming mechanical ventilation. However, in the summer, shading and evaporative cooling is required because ventilation replaces the inside greenhouse air with the outside hot air.
Future research is needed for optimizing greenhouse design, shape, and covering materials, and exploring hybrid ventilation systems by integrating renewable energy resources and smart materials to enhance the efficiency of natural ventilation in arid climates. Expansions of this study should include different locations in the Arabian Peninsula, aiming to provide operational protocol for the greenhouse ventilation schedule in an arid environment.

Author Contributions

Conceptualization, I.M.A.-H. and A.A.A.; methodology, I.M.A.-H., A.A.A. and A.A.I.; software, M.R.S. and I.M.A.-H.; validation, I.M.A.-H., A.A.A., M.R.S. and A.A.I.; formal analysis, A.A.A., A.A.I. and I.M.A.-H.; investigation, I.M.A.-H., M.R.S. and A.A.A.; resources, I.M.A.-H., A.A.A., A.A.I. and M.R.S.; data curation, I.M.A.-H., A.A.A., M.R.S. and A.A.I.; writing—original draft, I.M.A.-H. and A.A.A.; writing—review and editing, I.M.A.-H., A.A.A., A.A.I. and M.R.S.; visualization, I.M.A.-H. and A.A.A.; supervision, I.M.A.-H. and A.A.A.; project administration, I.M.A.-H. All authors have read and agreed to the published version of the manuscript.

Funding

This research received no external funding.

Data Availability Statement

Data would be available upon request.

Acknowledgments

The authors would like to express their gratitude to the Ongoing Research Funding program, (ORF-2025-1394), King Saud University, Riyadh, Saudi Arabia for providing funding support for this research.

Conflicts of Interest

The authors declare no conflicts of interest.

Abbreviations

AcSurface area of the greenhouse cover, m2
AfSurface area of the greenhouse floor, m2
hiEnthalpy of the inside greenhouse air, kJ·kg−1
hoenthalpy of the outside greenhouse air, kJ·kg−1
m ˙ a Ventilation mass flow rate, kg·s−1
NaNumber of air exchange rate, h−1
N a ¯ Mean value of Na
SiSolar radiation flux in the greenhouse, W·m−2
SoSolar radiation flux outside the greenhouse, W·m−2
TiTemperature of air in the greenhouse, °C
ToTemperature of air outside the greenhouse, °C
UOverall heat transmission coefficient, W·m−2·°C−1
VgVolume of air in the greenhouse, m3
VwWind speed, m·s−1
V ¯ w Daily average of wind speed, m·s−1
ρaDensity of air, kg·m−3
ψCover to floor area ratio,
ωAbsolute humidity of air, kg of water vapor/kg dry air

References

  1. Alsadon, A.A.; Al-Helal, I.M.; Ibrahim, A.; Abdel-Ghany, A.M.; Al-Zaharani, S.; Ashour, T. The effects of plastic greenhouse covering on cucumber (Cucumis sativus L.) growth. Ecol. Eng. 2016, 87, 305–312. [Google Scholar] [CrossRef]
  2. Al-Helal, I.M.; Waheeb, S.A.; Shady, M.R.; Abdel-Ghany, A.M. Modified thermal model to predict the natural ventilation of greenhouses. Energy Build. 2015, 99, 1–8. [Google Scholar] [CrossRef]
  3. Al-Ajlouni, M. Natural ventilation in greenhouses: Principles, design, and applications. J. Agric. Eng. 2020, 13, 58–72. [Google Scholar]
  4. Raji, B.A.; Lal, S. Natural ventilation and its application in hot climates. Renew. Energy Rev. 2019, 8, 120–132. [Google Scholar]
  5. Jafari, A.; Tavakol, A. Design and optimization of natural ventilation systems for greenhouses. Energy Build. 2018, 166, 71–82. [Google Scholar]
  6. Pereira, L.S.; Rivas, R. Greenhouse climate control in hot regions. Agric. Sys. 2017, 152, 58–75. [Google Scholar]
  7. Boulard, T.; Baille, A. Modelling and measurement of greenhouse ventilation. Agric. For. Meteorol. 1995, 75, 33–51. [Google Scholar]
  8. Abdel-Ghany, A.M.; Picuno, P.; Al-Helal, I.M.; Alsadon, A.A.; Ibrahim, A.; Shady, M.R. Radiometric characterization, solar and thermal radiation in a greenhouse as affected by shading configuration in an arid climate. Energies 2015, 8, 13928–13937. [Google Scholar] [CrossRef]
  9. Parra, J.P.; Baeza, E.; Montero, J.I.; Bailey, B.J. Natural ventilation of Parral greenhouses. Boisyst. Eng. 2004, 87, 355–366. [Google Scholar] [CrossRef]
  10. Katsoulas, N.; Bartzanas, T.; Boulard, T.; Mermier, M.; Kittas, C. Effect of vent openings and insect screens on greenhouse ventilation. Biosyst. Eng. 2006, 93, 427–436. [Google Scholar] [CrossRef]
  11. Samer, M.; Ammon, C.; Loebsin, C.; Fiedler, M.; Berg, W.; Sanftleben, P.; Brunsch, R. Moisture balance and tracer gas technique for ventilation rates measurements and greenhouse gases and ammonia emissions quantification in naturally ventilated buildings. Build Environ. 2012, 50, 10–20. [Google Scholar] [CrossRef]
  12. Cui, S.; Cohen, M.; Stabat, P.; Marchio, D. CO2 tracer gas concentration decay method for measuring air change rate. Build. Environ. 2015, 84, 162–169. [Google Scholar] [CrossRef]
  13. Kittas, C.; Bartzanas, T. Greenhouse microclimate and dehumidification effectiveness under different ventilator configurations. Build Environ. 2007, 42, 3774–3784. [Google Scholar] [CrossRef]
  14. Montero, J.I.; Anton, A.; Muñoz, P. Discharge coefficients of greenhouse windows with insect-proof screens. Biosyst. Eng. 2001, 81, 399–407. [Google Scholar] [CrossRef]
  15. Fatnassi, H.; Boulard, T.; Poncet, C. Optimization of greenhouse insect-proof screens with computational fluid dynamics. Biosyst. Eng. 2006, 93, 301–312. [Google Scholar] [CrossRef]
  16. Teitel, M. Greenhouse ventilation: Theory and practice. Acta Hortic. 2017, 1170, 243–248. [Google Scholar]
  17. Seginer, I. Alternative design formulae for the ventilation rate of greenhouses. J. Agric. Eng. Res. 1997, 68, 355–365. [Google Scholar] [CrossRef]
  18. Mihara, Y. Fundamental and Practice of Greenhouse Design, 1st ed.; Yokendo Inc.: Tokyo, Japan, 1983; pp. 160–169. (In Japanese) [Google Scholar]
  19. Abdel-Ghany, A.M. Energy balance equation for natural ventilation of greenhouses under unsteady–state conditions. Middle-East J. Sci. Res. 2011, 10, 286–293. [Google Scholar]
  20. Al-Helal, I.M.; Abdel-Ghany, A.M. Energy Partition and conversion of solar and thermal radiation into sensible and latent heat in a greenhouse under arid conditions. Energy Build. 2011, 43, 1740–1747. [Google Scholar] [CrossRef]
  21. Abdel-Ghany, A.M.; Kozai, T. On the determination of the overall heat transmission coefficient and soil heat flux for a fog-cooled, naturally ventilated greenhouse: Analysis of radiation and convection heat transfer. Energy Conver. Manag. 2006, 47, 2612–2628. [Google Scholar] [CrossRef]
  22. Abdel-Ghany, A.M.; Goto, E.; Kozai, T. Evaporation characteristics in a naturally ventilated, fog-cooled greenhouse. Renew. Energy 2006, 31, 2207–2226. [Google Scholar] [CrossRef]
  23. Georgios, K.S. Temperature control and energy conservation in a plastic greenhouse. J. Agric. Eng. Res. 2001, 80, 251–259. [Google Scholar]
  24. Swinkels, G.L.A.M.; Sonneveld, P.J.; Bot, G.P.A. Improvement of greenhouse insulation with restricted transmission loss through zigzag covering material. J. Agric. Eng. Res. 2001, 79, 91–97. [Google Scholar] [CrossRef]
  25. Nijskens, J.; Deltour, J.; Coutisse, S.; Nisen, A. Heat transfer through covering materials of greenhouses. Agric. For. Meteorol. 1984, 33, 193–214. [Google Scholar] [CrossRef]
  26. Zhang, Y.; Gauthier, L.; de Halleux, D.; Dansereau, B.; Gosselin, A. Effect of covering materials on energy consumption and greenhouse microclimate. Agric. For. Meteorol. 1996, 82, 227–244. [Google Scholar] [CrossRef]
  27. Ahemd, H.A.; Al-Faraj, A.A.; Abdel-Ghany, A.M. Shading greenhouses to improve the microclimate, energy and water saving in hot regions: A review. Sci. Hortic. 2016, 201, 36–45. [Google Scholar] [CrossRef]
  28. Baytorun, A.N.; Üstün, S.; Akyüz, A.; Önder, D. Determination of ventilation openings ratio in greenhouses under mediterranean climate conditions. Turkish J. Agric. Food Sci. Tech. 2017, 5, 409–415. [Google Scholar] [CrossRef]
  29. Li, Y.; Zhao, S.; Dai, A.; Zhang, J.; Fan, Z.; Ding, T. Study on the natural ventilation model of a single-span plastic greenhouse in a high-altitude area. Agronomy 2024, 14, 2166. [Google Scholar] [CrossRef]
  30. Kim, H.-K. Evaluating the ventilation performance of single-span plastic greenhouses with continuous screened side openings. Agronomy 2024, 14, 1447. [Google Scholar] [CrossRef]
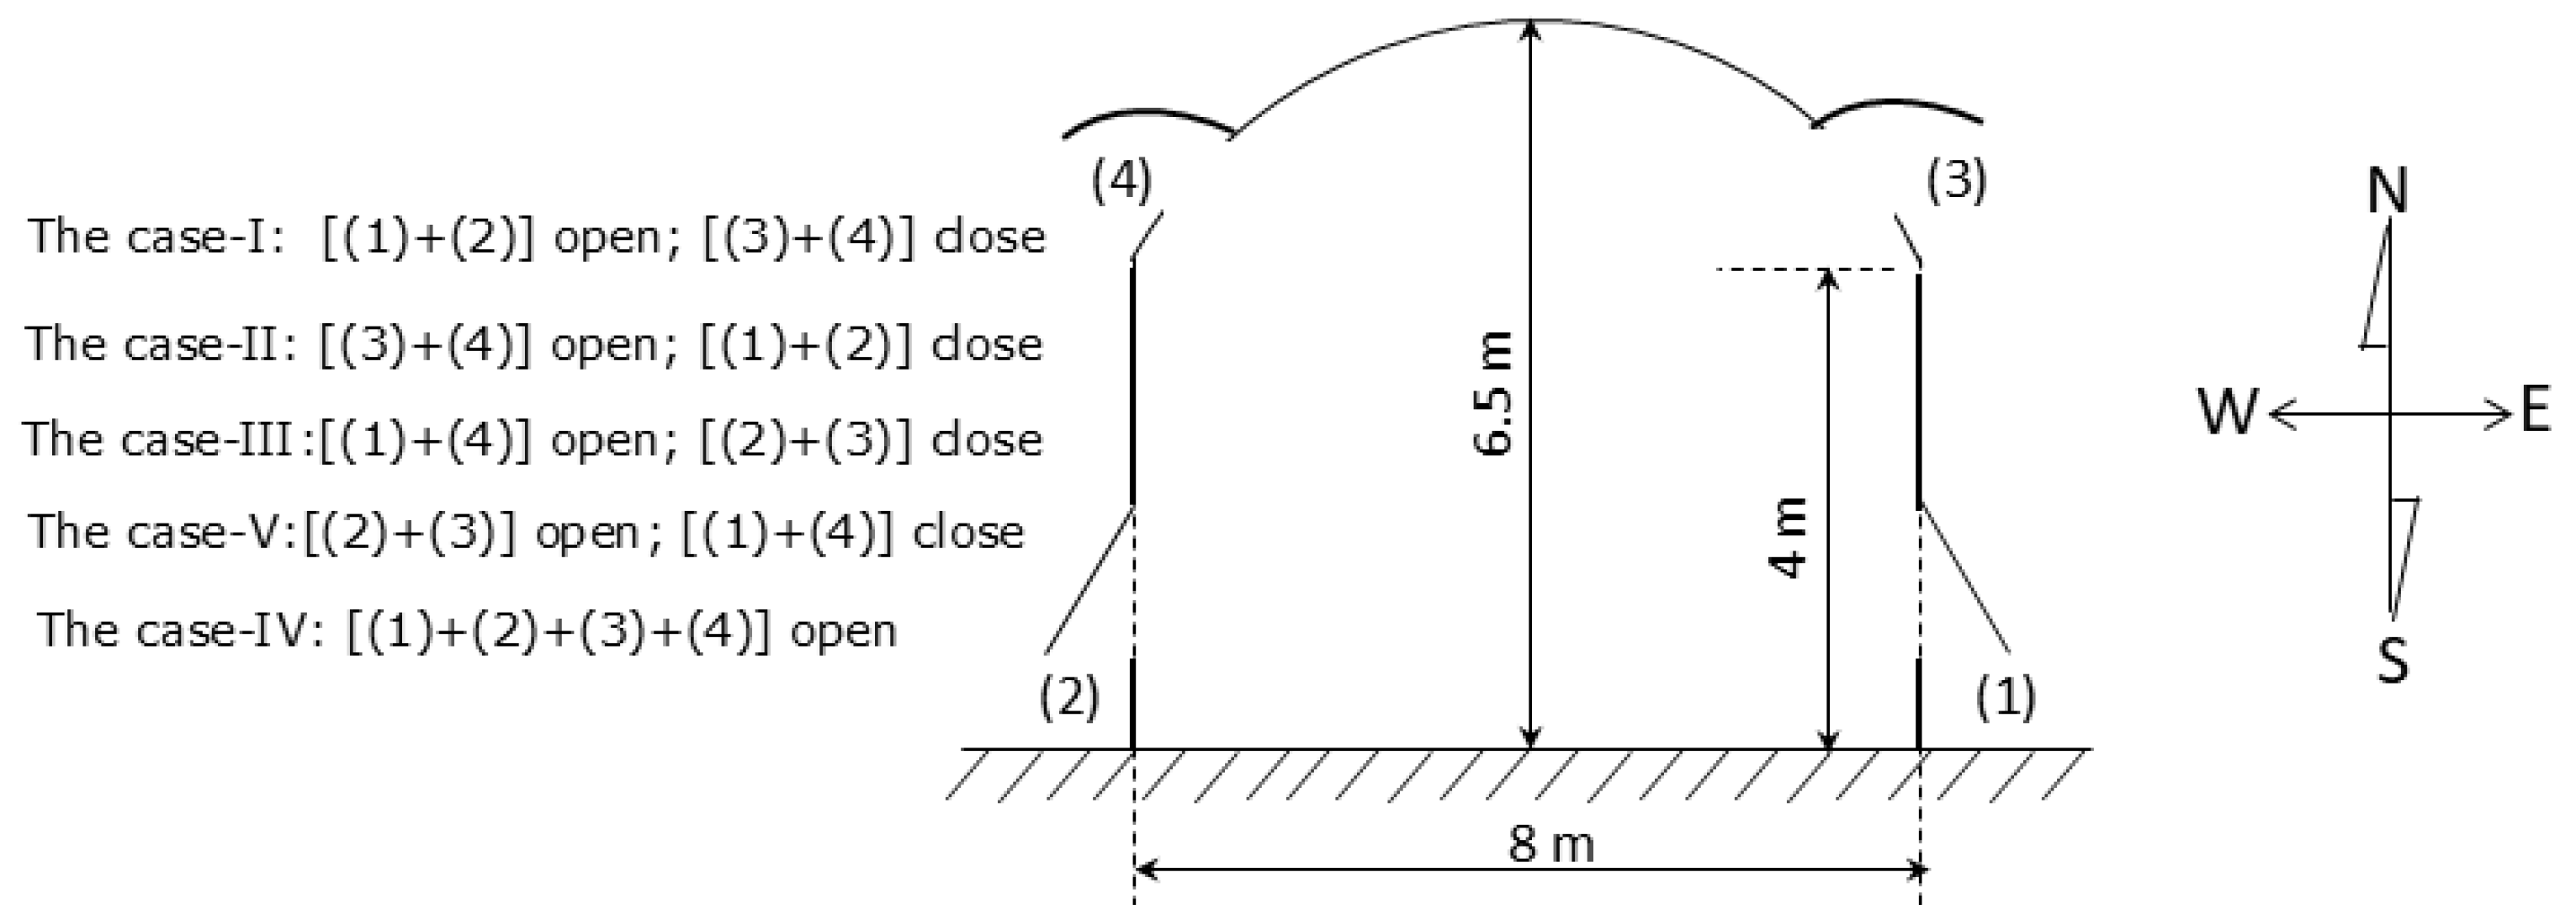
Figure 1. Schematic diagram showing the greenhouse with its ventilators used in the study.
Agronomy 15 02454 g001
Figure 2. Schematic diagram of the greenhouse showing the locations of sensors used to measure the required parameters (locations of T and RH sensors, and radiation sensors).
Agronomy 15 02454 g002
Figure 3. Diurnal variation in the transmitted solar radiation flux (Si) into the greenhouse during two consecutive days were selected for each opening configuration (case-I to case-IV).
Agronomy 15 02454 g003
Figure 4. Time courses of the wind speed during a selected five days (one day for each opening configuration case).
Agronomy 15 02454 g004
Figure 5. Polar plots representing the wind speeds and directions during the 15 days of experiment, (3 consecutive days for each opening configuration).
Agronomy 15 02454 g005aAgronomy 15 02454 g005b
Figure 6. Polar plot representing the wind speeds and directions for 4 months (November 2024–February 2025), could be obtained from a meteorological station at KSU campus.
Agronomy 15 02454 g006
Figure 7. Diurnal variation in the overall heat losses coefficient (U) estimated for the five selected days (one day for each opening configuration) using Equation (2).
Agronomy 15 02454 g007
Figure 8. Diurnal variation in the enthalpy difference (hi-ho) between inside and outside the greenhouse, estimated for the five selected days (one day for each opening case).
Agronomy 15 02454 g008
Figure 9. Diurnal variation in the ventilation rate ( m ˙ a ) in kg·s−1 estimated from Equation (1) for the five opening cases.
Agronomy 15 02454 g009
Figure 10. Diurnal variation in number of air exchange rate, Na (h−1) estimated from Equation (4) for the five opening cases.
Agronomy 15 02454 g010
Table 1. Descriptive statistics of wind speeds illustrated in Figure 4 for the five days of the experiment.
Case-ICase-IICase-IIICase-VCase-IV
V ¯ w (m·s−1)2.72.40.691.960.8
STD1.041.370.581.010.623
STE0.0870.110.0490.0840.052
Table 2. Statistical analysis for the data in Figure 10 showing N a ¯ , STD, and STE of each opening configuration.
Case-ICase-IICase-IIICase-VCase-IV
N a ¯ (h−1)63.711.223.826.233.2
STD90.1521.730.255.567.2
STE7.51.82.54.65.6
Table 3. Quantification of the ventilation rate ( m ˙ a ) into three regimes for different opening cases.
Opening
Cases
Buoyancy-Driven, %
(Vw ≤ 1 m·s−1)
Combined Regime, %
(1 < Vw ≤ 2 m·s−1)
Wind-Driven, %
(Vw > 2 m·s−1)
V ¯ w (m·s−1)
Case-I1814.567.52.7
Case-II23.719.556.82.4
Case-III24.77.667.60.69
Case-V43.328.828.51.96
Case-IV3.836600.8
Disclaimer/Publisher’s Note: The statements, opinions and data contained in all publications are solely those of the individual author(s) and contributor(s) and not of MDPI and/or the editor(s). MDPI and/or the editor(s) disclaim responsibility for any injury to people or property resulting from any ideas, methods, instructions or products referred to in the content.