1. Introduction
Cereal crops, including wheat and barley, are essential for global food security, providing a significant portion of the calories and nutrients consumed worldwide [
1]. Their productivity is increasingly threatened by environmental stressors such as drought and nitrogen limitations. Drought stress, in particular, restricts water availability, leading to reduced stomatal conductance, impaired photosynthesis, and diminished crop yields [
2]. Similarly, nitrogen deficiency affects plant growth, while excessive nitrogen application can reduce water use efficiency and increase production costs [
3]. Understanding the physiological responses of cereal crops to these stressors is critical for developing strategies to enhance their resilience and ensure sustainable agricultural practices.
Nitrogen plays a significant role in influencing crop water use efficiency and evapotranspiration (ET). Nitrogen fertilization can affect root biomass and canopy development, which in turn impacts ET. Studies have demonstrated that nitrogen levels can modify stomatal conductance and photosynthetic rate, influencing the water use efficiency of crops like maize and wheat. While high nitrogen supply levels can enhance growth and yield, excessive nitrogen can lead to increased water consumption and reduced water use efficiency [
4].
Drought stress significantly impacts cereal crop ET and respiration. Under drought conditions, crops show reduced stomatal conductance, limiting transpiration and affecting the overall water balance. This stress leads to a decrease in leaf area and root growth, further reducing ET. Drought stress can also cause a decline in xylem hydraulic conductivity, impairing water transport to leaves and reducing photosynthesis. Additionally, drought stress increases the vapor pressure deficit (VPD), exacerbating the reduction in transpiration and affecting the plant’s ability to utilize water efficiently [
2,
5]. This occurs because the drought-induced stomatal closure limits water loss, overriding the typical effect of VPD on increasing transpiration [
6].
Evapotranspiration (ET) and respiration are key physiological processes that reflect a plant’s water use efficiency and metabolic activity under stress conditions [
7]. Plant temperature (T
plant) and the Normalized Difference Water Index (NDWI) are valuable proxies for assessing these processes, as they provide insights into plant water status and thermal regulation. High-throughput plant phenotyping technologies, including infrared (IR) imaging and VNIR-SWIR hyperspectral imaging, offer powerful tools for monitoring these traits across diverse environmental conditions [
8]. By integrating these technologies, researchers can unravel the complex interactions between environmental stressors and crop physiology, enabling the identification of stress-resilient genotypes.
Light intensity, along with drought and nitrogen availability, drives the diurnal patterns of evapotranspiration (ET) and respiration in plants by regulating stomatal opening and photosynthesis [
9]. As light increases from sunrise to midday, stomata open, boosting photosynthesis and transpiration, leading to peak ET rates. Under water scarcity, stomata may partially close to conserve moisture, reducing ET [
10]. In the late afternoon and evening, as light decreases, stomata close, photosynthesis slows, and ET declines. At night, with no light, photosynthesis halts, but respiration continues as plants metabolize stored sugars [
11].
In the context of assessing cereal crops’ phenotypic responses to drought and nitrogen stress, the Normalized Difference Water Index (NDWI) is a valuable tool for monitoring plant water content and stress levels [
12]. This index helps evaluate the water content in vegetation, crucial for understanding the impact of drought stress on crops. In addition to NDWI, phenotypic responses under varying nitrogen levels and drought conditions can be further elucidated through T
plant plots, representing plant temperature under different conditions [
13,
14].
To address these challenges, advanced phenotyping techniques have been used to assess critical plant traits related to growth, photosynthesis, and stress tolerance [
7]. High-throughput phenotyping technologies, such as RGB imaging, infrared (IR) imaging, and visible near-infrared–shortwave infrared (VNIR-SWIR) hyperspectral imaging, are employed to accurately measure desired traits in crops across diverse environments [
15]. Controlled environmental conditions, such as precision watering, can be used along with these technologies to study plant responses to specific water regimes [
16]. These techniques enable the prediction of physiological and biochemical traits related to growth, maturation, and senescence during critical growth periods under multivariable climatic conditions [
17].
This study focuses on the responses of two wheat cultivars (Videodur [DU] and Sensas [SW]) and two barley cultivars (Tiroler Imperial [SG1] and Amidala [SG2]) to varying levels of drought and nitrogen (N25 and N130) stress conditions. Specifically, under drought stress, nitrogen levels influence the plant’s physiological responses, including stomatal conductance and evaporative cooling, which in turn affect T
plant [
18]. For instance, higher nitrogen levels (N130) may enhance growth and plant development, potentially increasing water consumption and supporting evaporative cooling, while lower nitrogen levels (N25) might limit these effects [
19]. These dynamics are reflected in the T
plant measurements and drought conditions for wheat (DU, SW) and barley (SG1, SG2) cultivars. The role of the Normalized Difference Water Index (NDWI) in monitoring and evaluating plant water content and stress levels will be examined, along with its integration into phenotyping approaches. Using VNIR-SWIR hyperspectral and IR imaging, the research examines the dynamics of ET and respiration as functions of T
plant under varying light intensities, NDWI and humidity [
20]. The study targets early reproductive to full maturity stages when stress impacts are most pronounced and aims to evaluate the potential of NDWI and T
plant as predictive metrics for effectively predicting evapotranspiration and respiration patterns. By leveraging regression models and temporal analyses, the research provides valuable insights into the physiological mechanisms underlying drought and nitrogen stress responses, with implications for breeding programs and sustainable crop management strategies.
2. Materials and Methods
2.1. Crop Material and Experimental Sampling
Seed grains of Durum wheat cultivar Videodur (DU), spring wheat cultivar Sensas (SW) and spring barley varieties Tiroler Imperial (SG1) and Amidala (SG2) were obtained from AGES GmbH, Spargelfeldstrasse, Vienna. Germination rates for Videodur were found to be 89% and 96% for Sensas, Tiroler Imperial and Amidala, respectively. Seven 50-L bags of Plagron ProMix substrate were placed on a tarpaulin and mixed homogeneously using a shovel. Each pot was filled with 1.7 kg of substrate, equivalent to about 8 L compressed by hand to 4 L. Afterwards, 20 grains were sown per pot, with 10 grains arranged in a circle on the outer edge, 8 grains in a circle on the inside, and 2 grains in the centre of the pot. Twelve pots of each variety were sown, and ten plants were singled out per pot (1 plant in the centre, 4 plants in a circle around it, 5 plants in a circle outside the edge of the pot) in the 2-leaf stage. The 48 pots were divided according to the factorial design into 4 genotypes × 2 N rates × 2 water levels × 3 replicates.
In this study, two nitrogen treatments were applied: nitrogen-limited (N25) at 25 kg N/ha and nitrogen-sufficient (N130) at 130 kg N/ha. For the N25 treatment, each pot received 6.072 g of Ensin and 1.052 g of DC-45, while the N130 treatment obtained 30.245 g of Ensin and 1.052 g of DC-45 per pot. Ensin contains two nitrification inhibitors: 1,2,4-triazole (TZ) and dicyandiamide (DCD). It is manufactured by Duslo a.s. in Šaľa, Slovakia, and SKW Piesteritz in Wittenberg, Germany. DC-45 is another nitrification inhibitor used in fertilizers to slow the conversion of ammonia to nitrate, enhancing nitrogen use efficiency and reducing nitrogen losses from the soil. It is supplied by Agrana Beteiligungs-AG, Vienna, Austria. Micronutrients were administered by mixing 25 L of water with 25 caps (~10 mL/cap) of micronutrient fertilizer, which was evenly distributed using a watering can. Irrigation was managed with two drippers per pot to ensure even distribution. The greenhouse climate was controlled with a maximum temperature of 18 °C during the day and 15 °C at night.
The factorial experiment included 4 cultivars (two wheat cultivars: DU and SW, and two barley cultivars: SG1 and SG2), two nitrogen rates (N25 and N130), and two water levels (D0: no drought, D1: drought stress), with 3 replicates per treatment. The four cultivars were analysed together to compare their responses under similar environmental conditions, and genetic differences between wheat and barley were followed as “species × treatment” interaction.
2.2. Phenotyping Measurements
During the early reproductive to late maturity stage, spanning three weeks, the plants were transferred to the phenotyping facility at Vienna Biocenter Core Facility (VBCF), and various imaging and measurement techniques were performed:
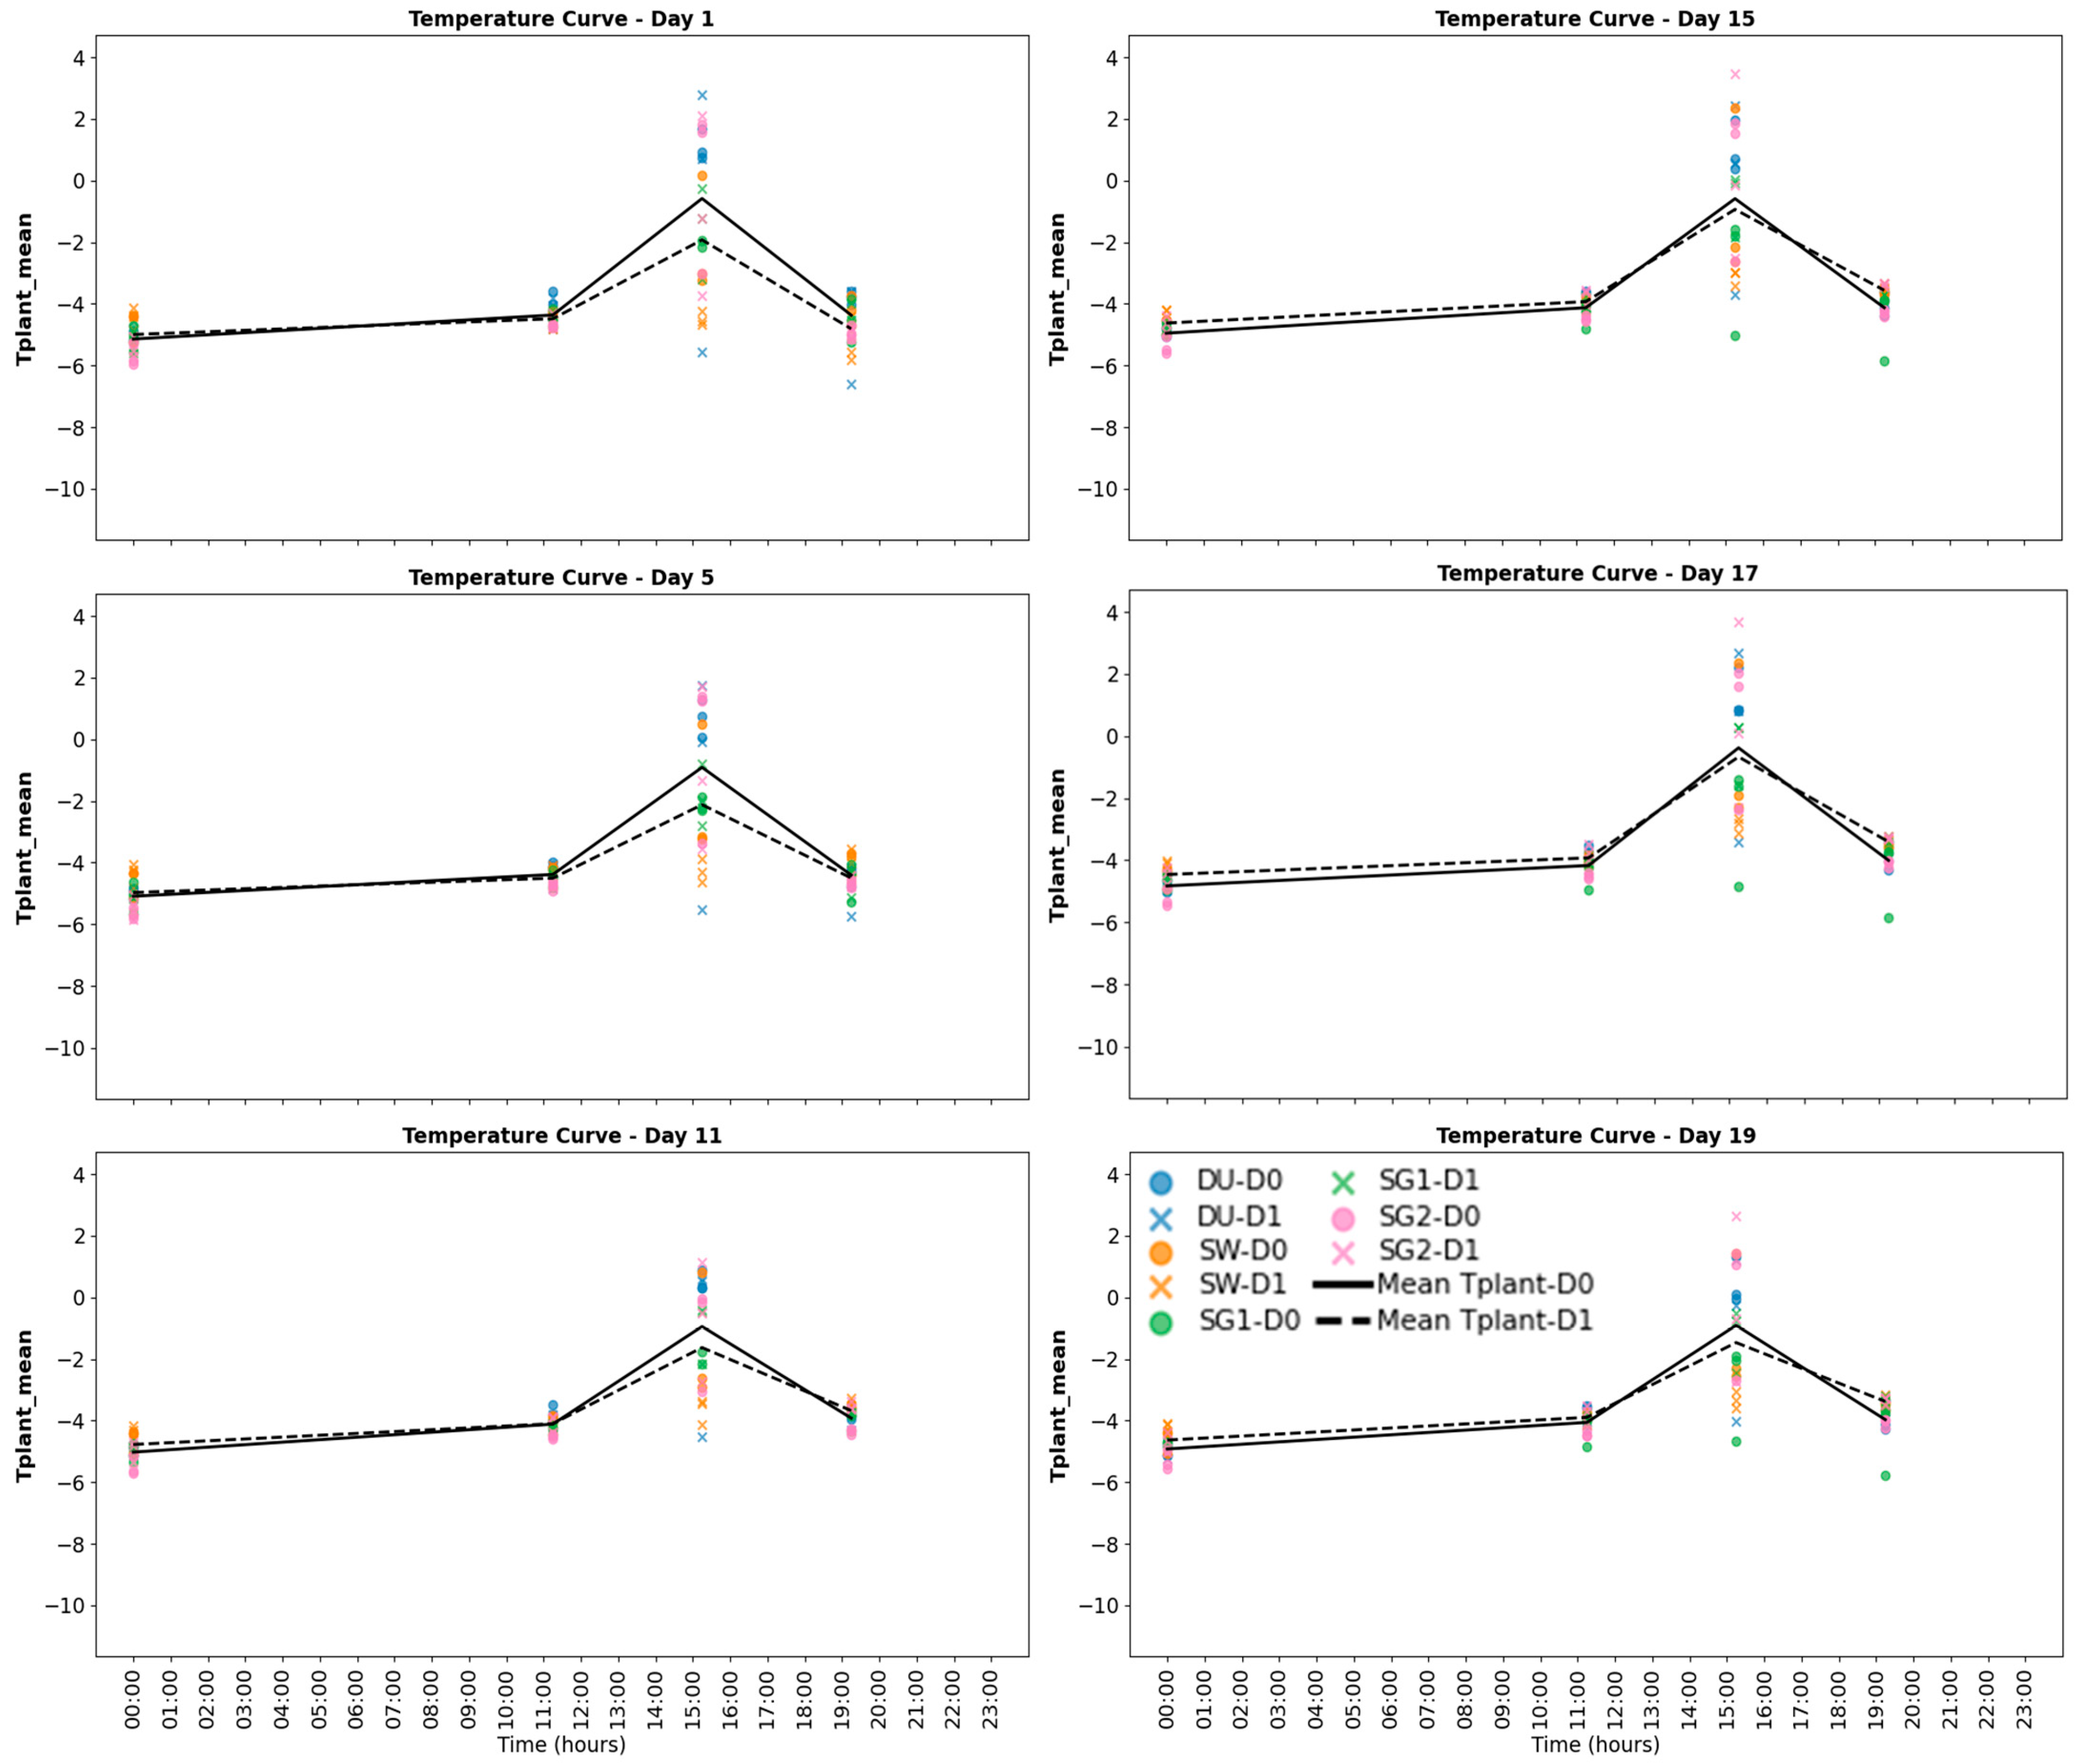
Infrared (IR)-based thermal imaging was conducted four times per day, with photosynthetic photon flux density (PPFD) set at 0 µmol photons m−2 s−1 (00:00 h), 150 µmol photons m−2 s−1 (11:15 h), 800 µmol photons m−2 s−1 (15:15 h), and 500 µmol photons m−2 s−1 (19:15 h) to reflect the diurnal cycle.
VNIR-SWIR hyperspectral wavelength range data were integrated, normalized, and analysed from measurements taken at a PPFD of 800 µmol photons m−2 s−1.
Soil moisture content (SC) was monitored using automated watering based on weight, as described by [
21,
22]. ET_balance (evapotranspiration balance) was calculated as the difference between the weight of the pot after watering and the initial weight in grams (g). Respiration is calculated as the mean value of the T
plant or the weight (g) as a proxy.
2.3. Abiotic Stress and Multivariate Climate
For a two-factorial experiment, out of twelve pots per variety, six were nitrogen-limited (25 kg N/ha) and six were nitrogen-sufficient (130 kg N/ha). Half of the pots in each nitrogen condition were subjected to drought stress treatment, while the other half were not. Thus, three replicates were available per treatment. Days of phenotyping were split into two microclimatic conditions (temperature and light) at the high-throughput phenotyping facility, VBCF, as described in [
23].
2.4. Identifying Water Content in Vegetation and Soil
The Normalized Difference Water Index (NDWI) is a valuable tool for remote sensing applications, particularly for monitoring and identifying water content in vegetation and soil [
12,
13].
NDWI values were calculated using the formula:
where R
NIR is the reflectance in the near-infrared band (typically around 860 nm) and R
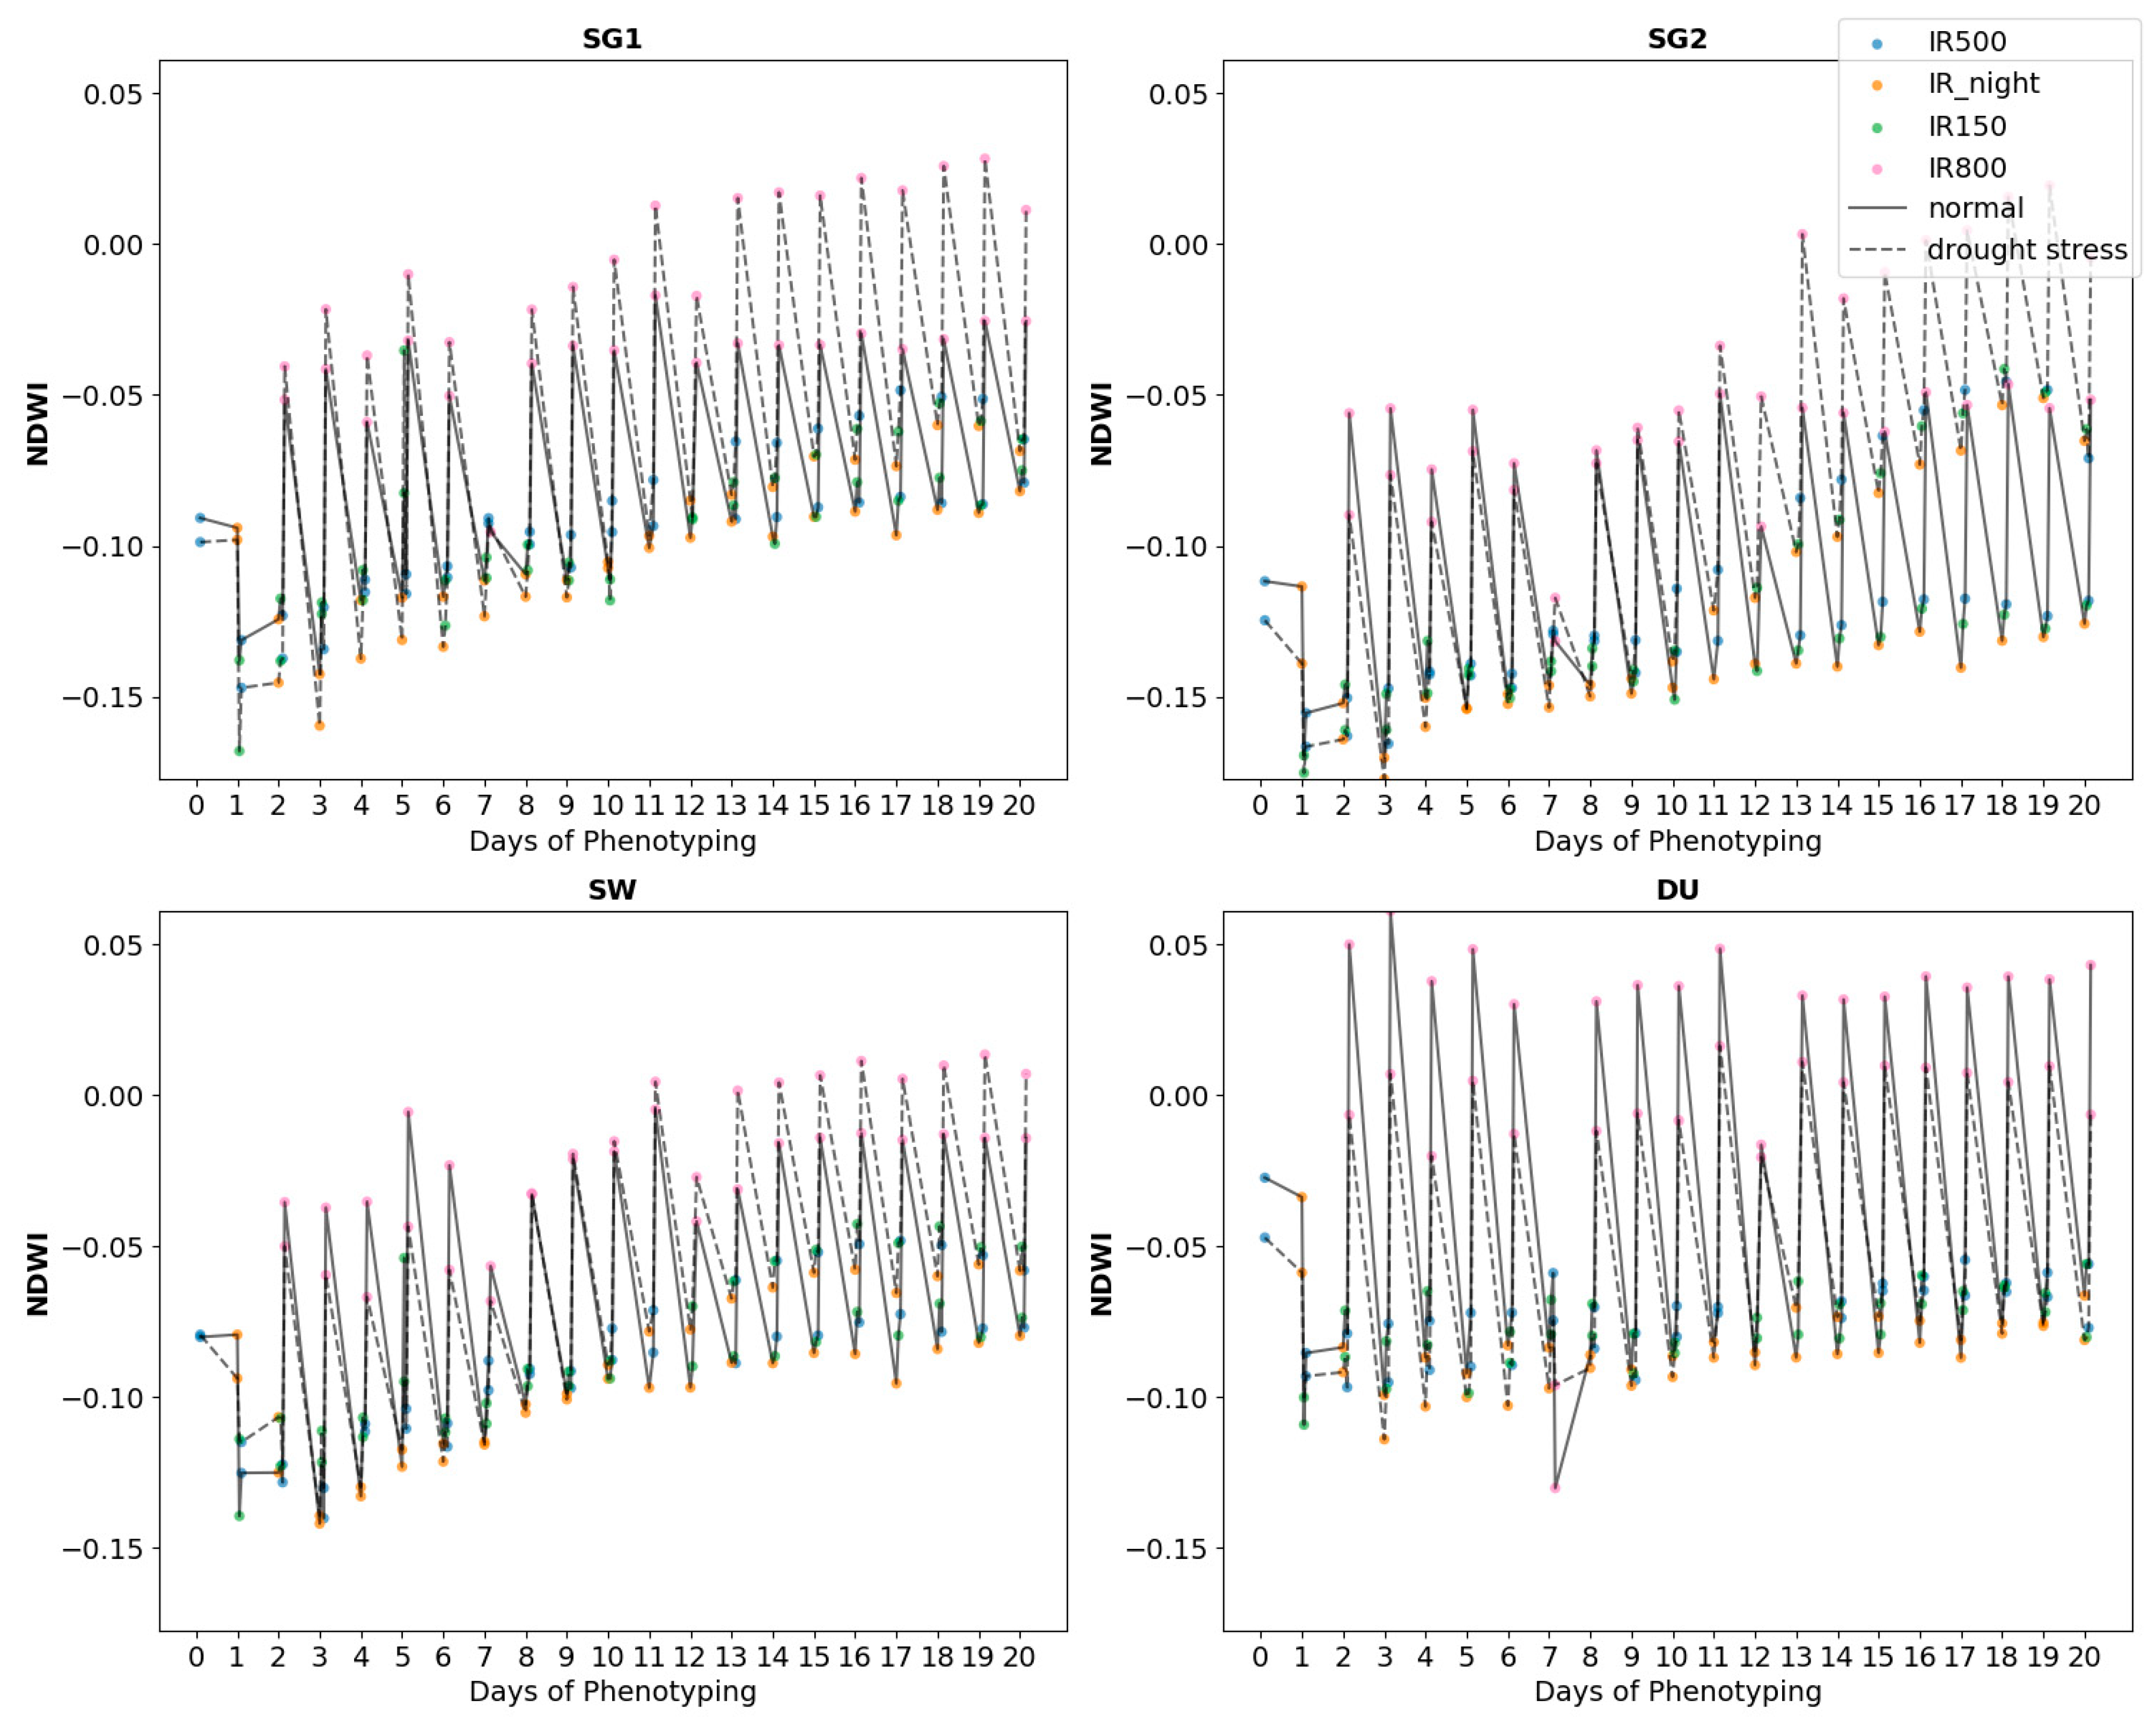
SWIR is the reflectance in the short-wave infrared band (typically around 1640 nm), respectively (
Figure 1).
2.5. Thermography (Tplant)
Infrared (IR) thermal imaging was performed from side-view rotations at 0° and 180° to capture comprehensive temperature profiles of individual pots, as described in [
14,
24]. Measurements of plant temperature (T
plant) were taken under four light intensity conditions: 0 μE (dark), 150 µE, 500 µE, and 800 µE, capturing the average temperature of crop plants across three biological replicates per treatment [
25] (
Figure 2). Each replicate consisted of 10 plant seedlings grown in individual pots. Data normalization ensured consistency across treatments and light conditions, and outliers were removed to improve data reliability. The evaporative cooling effect was quantified by calculating the cooled area based on pixel color differences between the ambient probe and background temperatures, following the methodology of [
5]. These measurements provided critical insights into the effects of nitrogen and drought stress on plant temperature and evaporative cooling dynamics.
2.6. Evapotranspiration and Respiration Estimation
The dataset comprised measurements of NDWI and T
plant across four cereal crop cultivars (wheat: DU, SW; barley: SG1, SG2) under two drought stress treatments (D0: no drought, D1: drought stress) and four light intensity conditions (night/dark, 150 µE, 500 µE and 800 µE, similar to outdoor light regime diurnally). Measurements were taken during the phenotyping period, covering critical growth stages of the crop life cycle (
Figure 1 and
Figure 2). Evapotranspiration (ET) was estimated using a simplified energy balance model as a function of NDWI, T
plant, light intensity, and humidity [
26]. Multiple linear regression models were developed to predict ET and respiration as functions of NDWI, T
plant, under different light intensities [
27]. The regression model for ET was:
where β
0, β
1, β
2 and β
3 represent regression coefficients and ϵ represents the error term in the regression model. To implement the above evapotranspiration (ET) model, Python script was modified using GPT-4.0 (OpenAI) tool. Night-time T
plant measurements were used to infer respiration rates, providing insights into metabolic activity under different stress conditions [
28].
2.7. Statistics
Statistical analyses of data were carried out using IBM SPSS Statistics software (IBM Corp. IBM SPSS Statistics for Windows, Version 27.0. Released 2020. Armonk, NY, USA) and python software (Jupyter Notebook 6.5.4, Anaconda Navigator). To detect any outliers for each species, z-scores were calculated, and no data points fell outside the range of +3 and −3 standard deviations from the mean of the dataset. Correlation analysis was performed to examine the relationships between ET, respiration, NDWI, and Tplant under each treatment and light condition. Multiple linear regression models were developed to predict ET and respiration as functions of NDWI, Tplant, and light intensity. Interaction terms were included to capture the combined effects of these variables under drought and nitrogen stress. Scatter plots and line plots were generated to visualize the relationships between NDWI, Tplant, ET, and respiration.
The replicates (3 per treatment) were not part of the factorial structure but were included to ensure statistical reliability and account for biological variability. The factorial model was based on the four genotypes, two nitrogen rates, and two drought stress levels, with replicates used to calculate mean values and assess variability within each treatment group.
3. Results
3.1. Evapotranspiration (ET) and Respiration
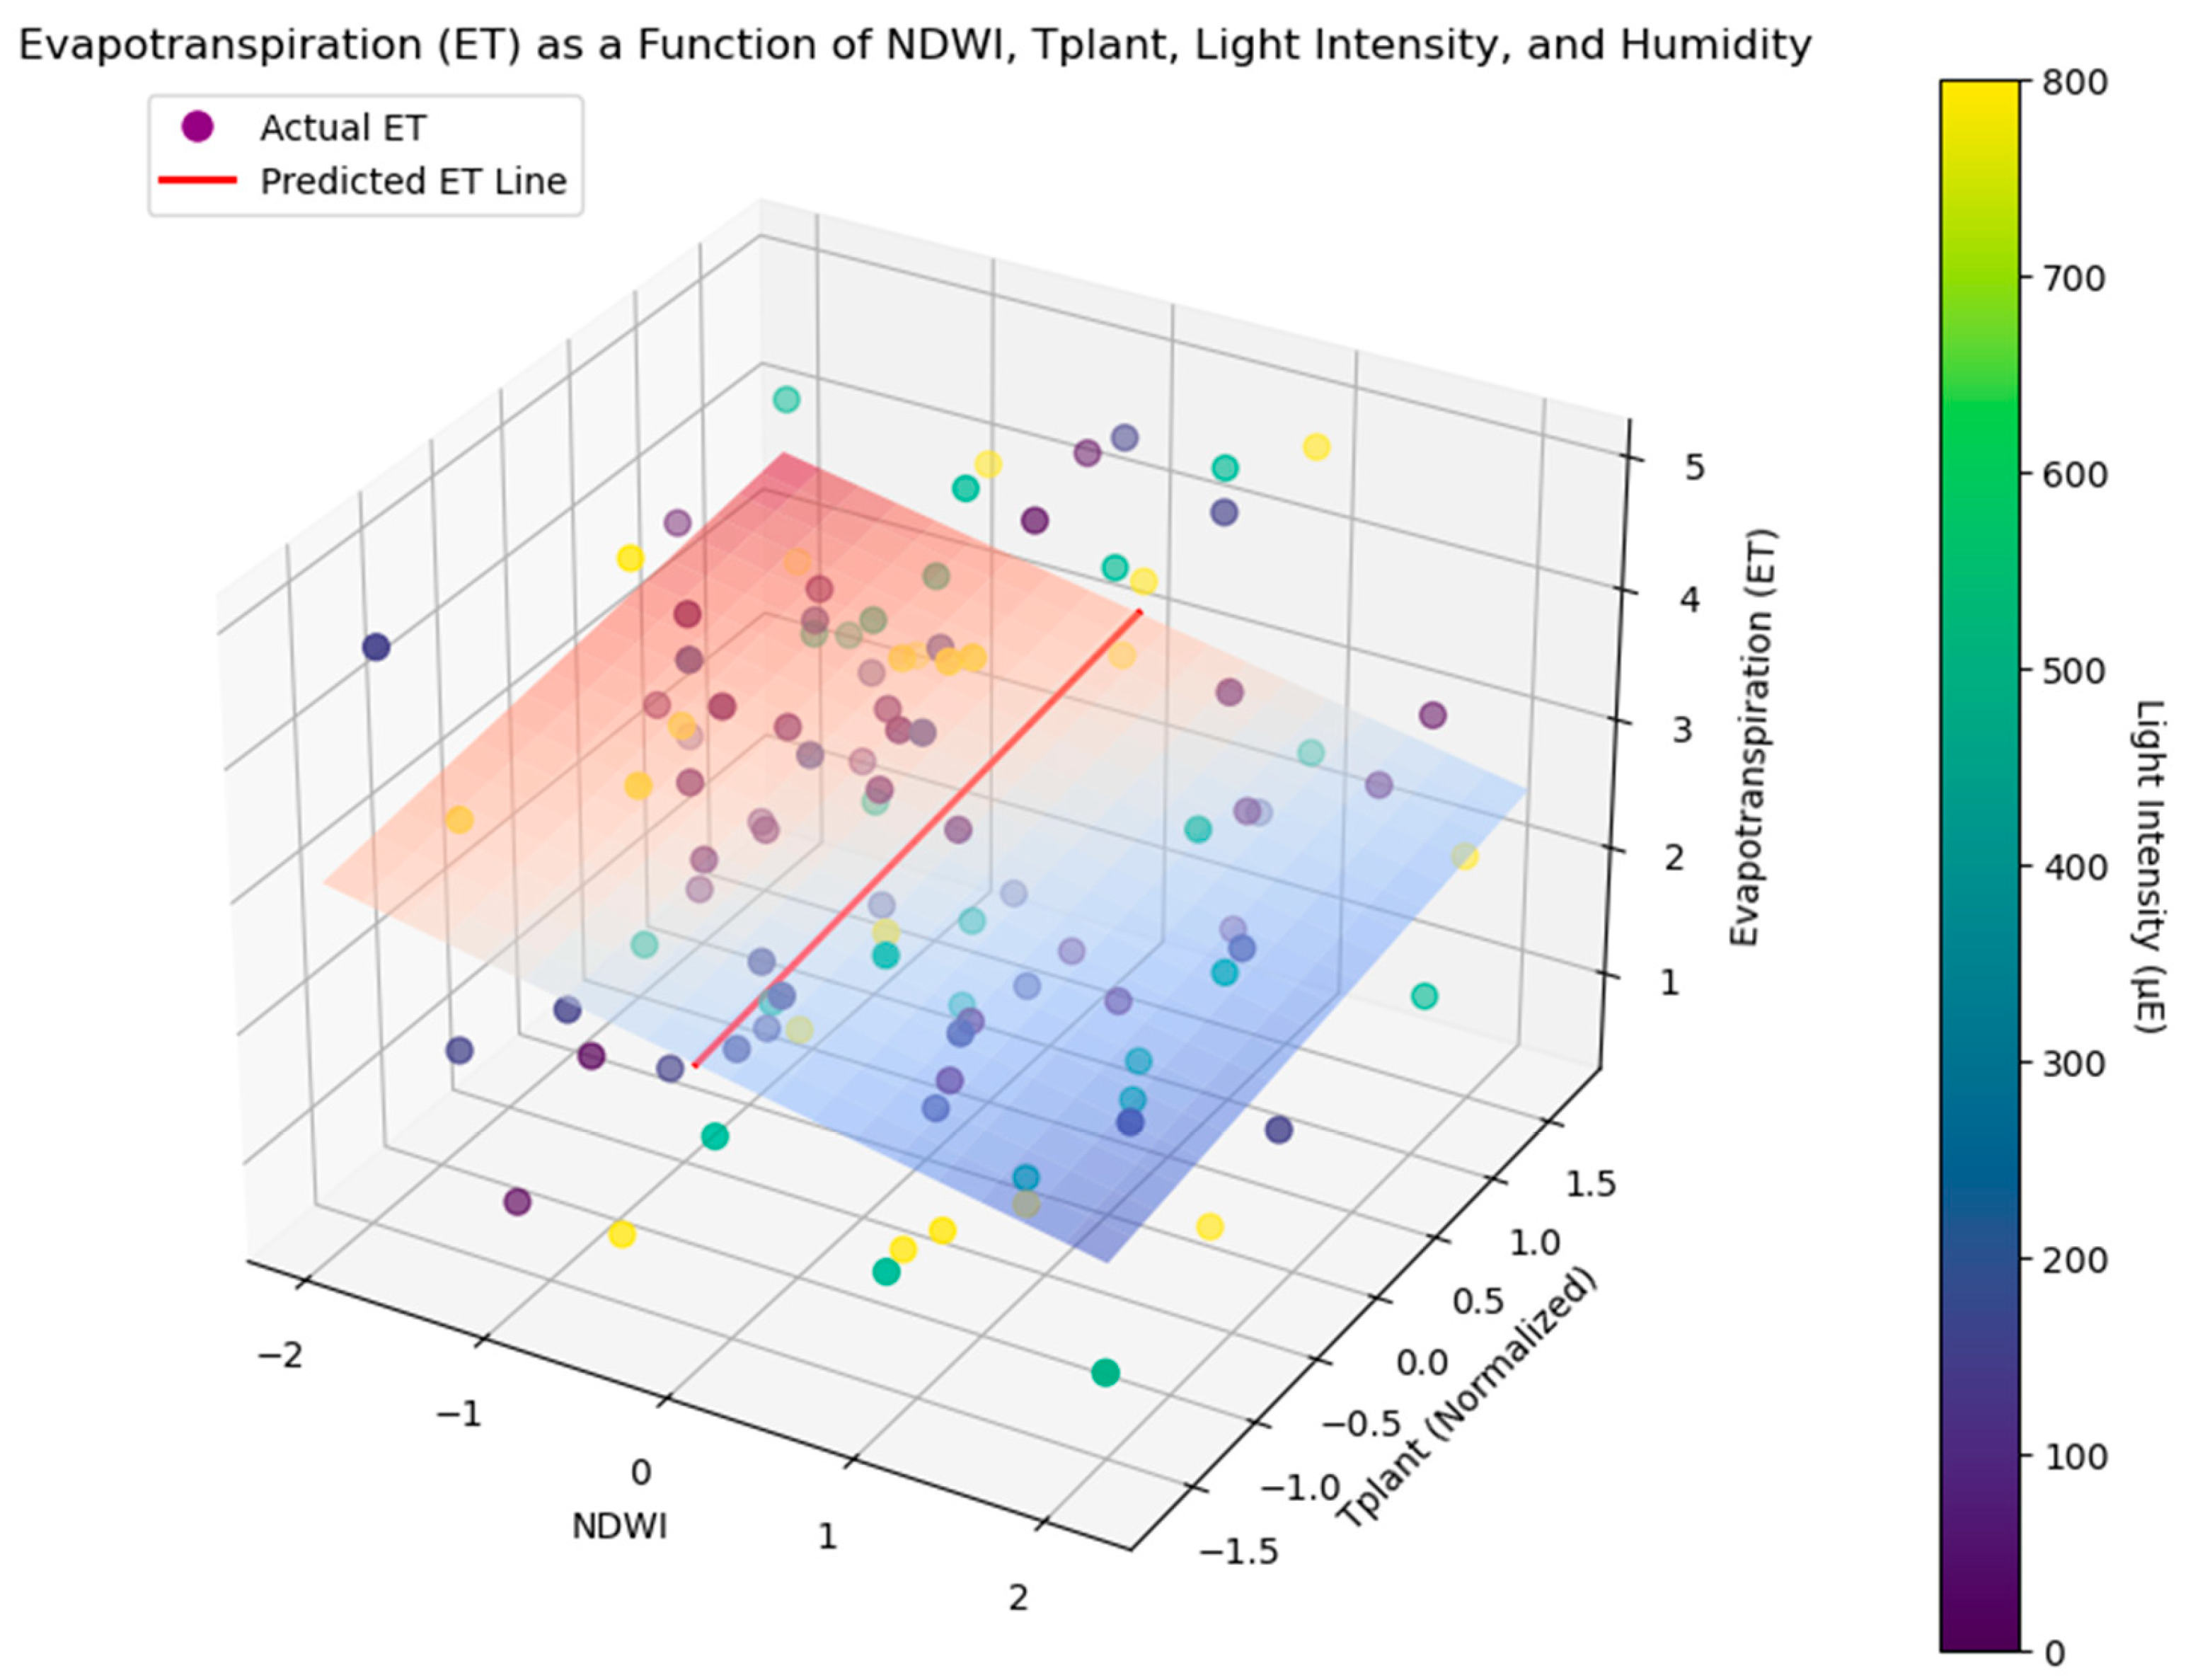
ET was estimated as a function of NDWI, T
plant, light intensity, and humidity using a simplified energy balance model. Correlation analysis revealed significant relationships between ET and NDWI/T
plant under varying light conditions and drought treatments (
Figure 3). Under no drought (D0), ET showed a strong positive correlation with NDWI (r = 0.81,
p < 0.01) and a moderate negative correlation with T
plant (r = −0.48,
p < 0.05). In drought conditions (D1), the correlation between ET and NDWI weakened (r = 0.55,
p < 0.05), while the negative correlation with T
plant became stronger (r = −0.65,
p < 0.01). Light intensity amplified these effects, with the strongest correlations observed under high light conditions (T
plant measured at 800 µE) (
Figure 2). Night-time T
plant measurements (dark) were used to infer respiration rates. Respiration was positively correlated with T
plant across all treatments, with stronger correlations under drought stress (D1: r = 0.71,
p < 0.01) compared to no drought (D0: r = 0.57,
p < 0.05). NDWI showed a weaker but significant negative correlation with respiration under drought stress (r = −0.43,
p < 0.05), suggesting reduced water content in the plant impacts metabolic activity (
Figure S1).
The multiple regression model explained 74% of the variance in ET (R2 = 0.74, p < 0.001), with NDWI and light intensity being the most significant predictors. Interaction terms revealed that the combined effects of NDWI and Tplant were more pronounced under drought stress, particularly at higher light intensities. For respiration, a similar regression model showed that Tplant was the dominant predictor, explaining 67% of the variance (R2 = 0.67, p < 0.001). Interaction effects indicated that the relationship between Tplant and respiration was modulated by drought stress, with higher respiration rates observed under drought (D1) conditions.
3.2. Crop-Specific Analysis
Separate analyses for wheat (DU, SW) and barley (SG1, SG2) cultivars highlighted genetic differences in their responses to drought and light conditions. Wheat cultivars exhibited higher Tplant values under drought stress, particularly at high light intensities (800 µE), with DU showing the highest Tplant (mean: 30.3 °C), indicating greater sensitivity to drought stress. Barley cultivars, on the other hand, maintained lower Tplant values under similar conditions, with SG2 showing the lowest Tplant (mean: 27.6 °C). NDWI values were consistently higher in barley cultivars, indicating better water retention compared to wheat. Cultivar-specific differences were observed, but less pronounced than the broader species-level trends.
Temporal trends revealed dynamic changes in NDWI, Tplant, ET, and respiration over the phenotyping period. At the beginning of the observation period, NDWI was high across all cultivars, indicating sufficient water content. However, as drought stress intensified, NDWI declined more sharply in wheat than in barley. Tplant increased steadily over time, with the most significant rise observed during the reproductive stage under D1 conditions. Correlations between ET and NDWI were strongest during the vegetative stage, while correlations between respiration and Tplant peaked during grain filling.
Line plots of NDWI, T
plant, ET, and respiration over the phenotyping period provided insights into grain filling stages when stress responses were most significant. For example, NDWI declined sharply during the reproductive stage under drought conditions (D1), coinciding with a rise in T
plant and a drop in ET (
Figure 3). Scatter plots show a negative linear relationship between T
plant and ET under drought stress, particularly at high light intensities (
Figure S1). The integration of NDWI and T
plant measurements through high-throughput phenotyping platforms offers a robust approach for monitoring crop-specific stress responses. For instance, wheat cultivar DU demonstrated higher T
plant and lower NDWI under drought stress, indicating reduced transpiration efficiency and greater sensitivity to water deficit. Barley cultivars, especially SG2, maintained higher NDWI and lower T
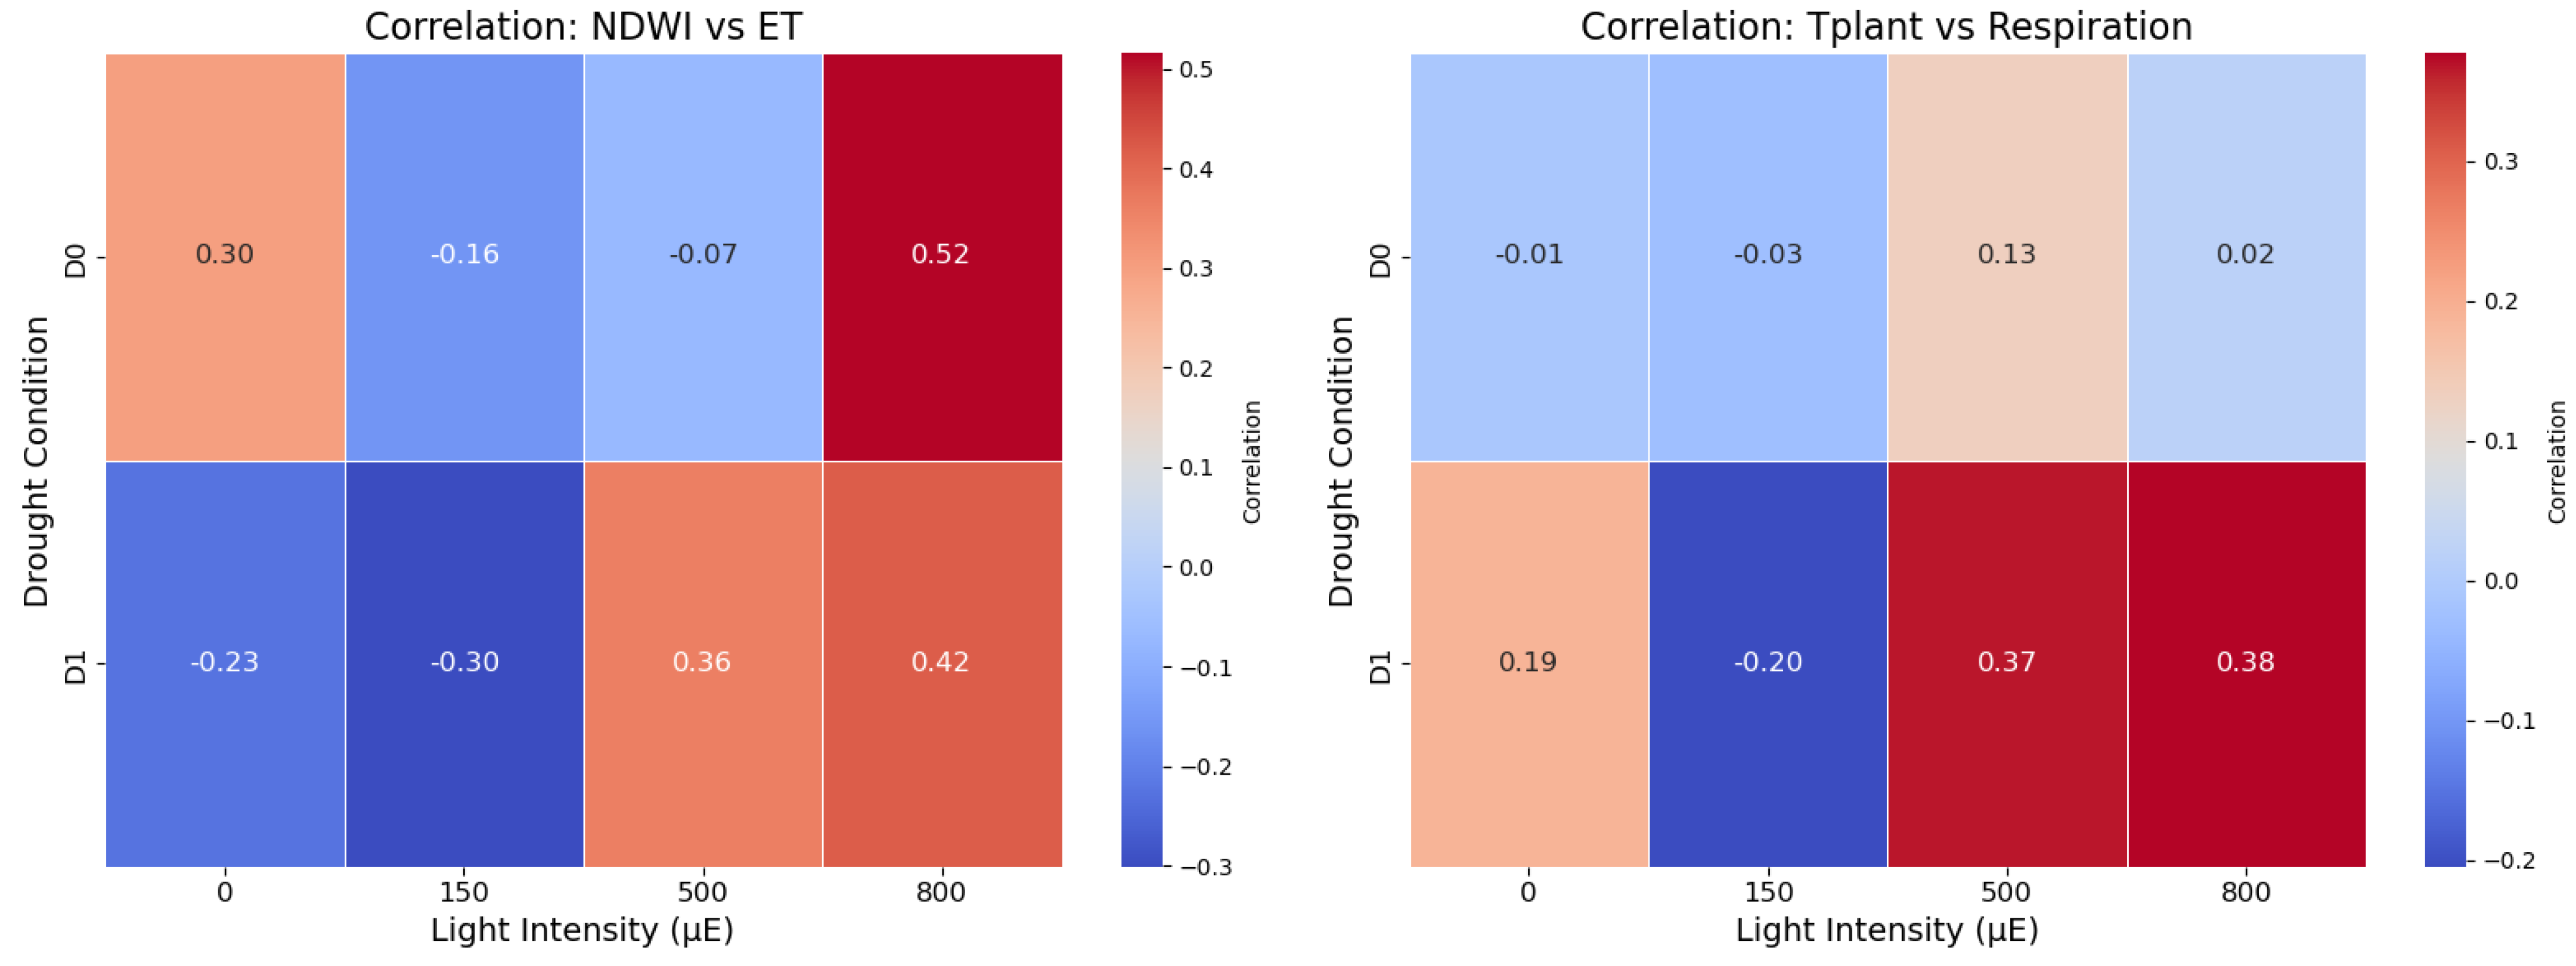
plant, reflecting superior water retention and thermal regulation. These crop-specific differences underscore the potential of barley as a more drought-resilient cereal, with implications for targeted breeding programs aimed at improving stress resilience. Heatmaps of correlation coefficients across treatments and light conditions highlighted the differential impacts of drought and light on ET and respiration (
Figure 4). Strong positive correlations between NDWI and ET at higher light intensities under D0 indicate simultaneous increases in NDWI and ET, while the NDWI-ET relationship weakens under drought stress (D1). At midday to afternoon high light intensities, moderate correlations between T
plant and respiration were observed under D1 conditions, whereas no significant correlations were found under well-watered D0 conditions.
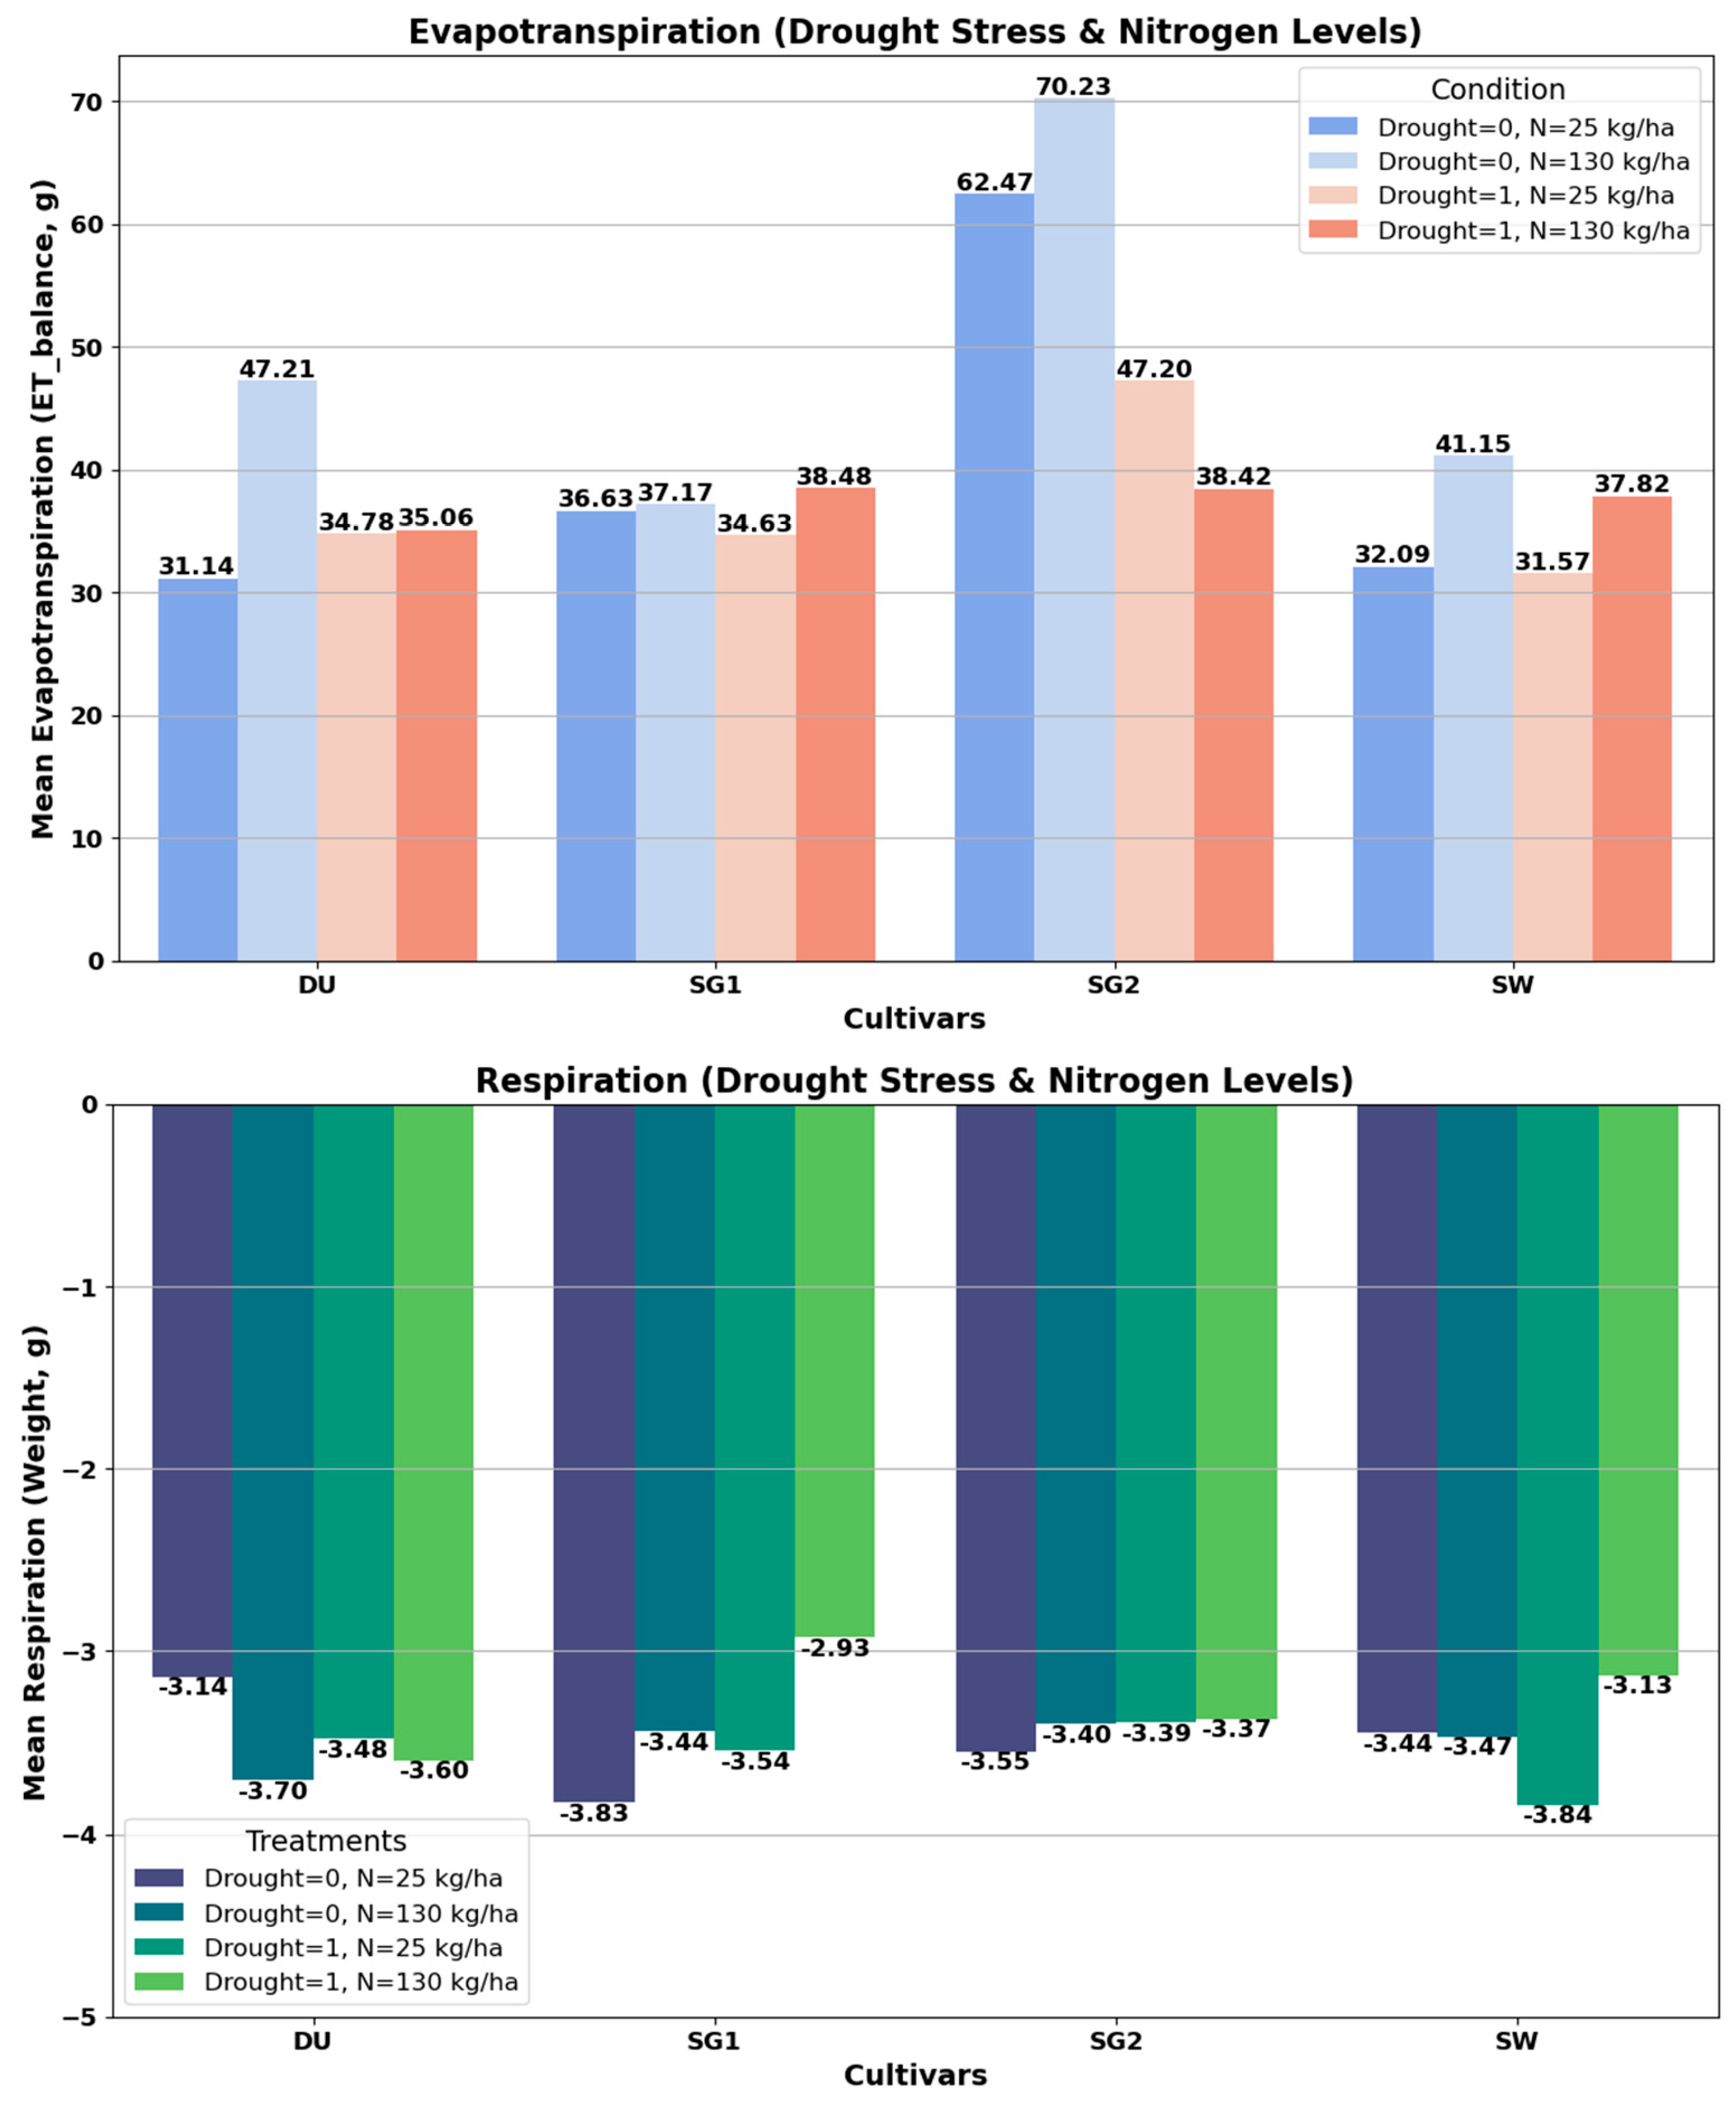
Real-time ET measurements provide cultivar-specific water loss patterns under drought and nitrogen treatments, effectively capturing the immediate physiological responses of wheat and barley cultivars (
Figure 5). Barley cultivars SG1 and SG2 exhibit reduced evapotranspiration under drought stress, indicating higher water use efficiency. They maintain relatively higher respiration rates under drought stress, reflecting better stress tolerance. Wheat cultivars DU and SW show increased evapotranspiration with higher nitrogen levels (N130 kg/ha), promoting growth and water uptake. They exhibit lower stress tolerance as indicated by their lower respiration rates under drought stress.
4. Discussion
This study provides a detailed analysis of evapotranspiration (ET) and respiration patterns in wheat (DU, SW) and barley (SG1, SG2) cultivars under varying drought stress and light intensity conditions, leveraging high-throughput plant phenotyping and infrared (IR) imaging. The results highlight the complex interplay between NDWI, Tplant, ET, and respiration, offering valuable insights into the physiological responses of cereal crops to environmental stressors. The effects of nitrogen rates (N25 and N130) on evapotranspiration (ET), respiration, and related physiological traits were also evaluated. However, no significant differences were observed in NDWI, Tplant, or ET between the nitrogen-limited (N25) and nitrogen-sufficient (N130) treatments under either drought (D1) or non-drought (D0) conditions. This suggests that nitrogen availability did not substantially influence the stress responses of the wheat and barley cultivars under the experimental conditions. These findings highlight that the observed physiological responses were primarily driven by drought stress and light intensity rather than nitrogen levels. Future studies could explore whether different nitrogen application strategies or rates might yield more pronounced effects under varying environmental conditions.
4.1. Influence of Drought Stress on NDWI and Tplant
The observed decline in NDWI under drought stress (D1) reflects reduced water content in the crop canopy, consistent with previous studies that link NDWI to plant water status [
12]. Wheat cultivars, particularly DU, exhibited a sharper decline in NDWI, suggesting a greater sensitivity to water deficit. This aligns with the higher T
plant values observed in wheat under drought conditions, indicating reduced stomatal conductance and transpiration efficiency. Barley cultivars, especially SG2, maintained higher NDWI values and lower T
plant, suggesting better water retention and thermal regulation under stress. These findings emphasize the genetic trait characteristics of wheat and barley in their drought response mechanisms, with barley demonstrating robust physiological response to water deficit [
29,
30].
4.2. Evapotranspiration Patterns and Correlations
The strong positive correlation between ET and NDWI under no drought conditions (D0) highlights the role of canopy water content in driving transpiration. However, this relationship weakened under drought stress (D1), likely due to reduced stomatal conductance and limited water availability. The negative correlation between ET and Tplant, which became more pronounced under D1, further supports the role of stomatal closure in reducing transpiration and increasing leaf temperature. These findings are consistent with the energy balance model, where reduced transpiration leads to less evaporative cooling and higher Tplant.
Light intensity amplified these effects, with the strongest correlations observed under high light conditions (D: 800 µE). This suggests that light-driven photosynthetic activity and stomatal behavior play a critical role in modulating ET under stress. The regression model for ET, which explained 74% of the variance, highlights the combined influence of NDWI, Tplant, and light intensity on transpiration dynamics. The inclusion of interaction terms further revealed that the effects of NDWI and Tplant on ET are more pronounced under drought stress, emphasizing the need to consider environmental and physiological interactions in crop stress studies.
4.3. Respiration Dynamics and Night-Time Tplant
Night-time T
plant measurements provided valuable insights into respiration dynamics, with higher T
plant values correlating with increased respiration rates. This relationship was stronger under drought stress (D1), suggesting that water deficit intensifies metabolic activity, likely due to increased energy demands for stress adaptation [
31]. The weaker but significant negative correlation between NDWI and respiration under D1 indicates that reduced water content in the canopy impacts metabolic processes, potentially limiting the availability of substrates for respiration [
28].
The regression model for respiration, which explained 67% of the variance, identified T
plant as the dominant predictor, highlighting the critical role of plant temperature in regulating metabolic activity [
31]. The interaction effects between T
plant and drought stress further underscore the complex physiological adjustments that occur under water deficit, with higher respiration rates reflecting the increased energy costs of maintaining cellular homeostasis and repairing stress-induced cellular damage.
4.4. Genetic Differences Between Wheat and Barley
The crop-specific analysis revealed significant genetic differences in the responses of wheat and barley cultivars to drought and light conditions. Wheat cultivars, particularly DU, exhibited higher Tplant values under drought stress, indicating a greater sensitivity to water deficit and reduced transpiration efficiency. Barley cultivars, especially SG2, maintained lower Tplant values and higher NDWI, reflecting better water retention and thermal regulation. Barley matures earlier and primarily relies on drought avoidance strategies, enabling it to conserve water and maintain physiological stability under stress. These differences highlight the potential of barley as a more drought-tolerant crop, with implications for breeding programs aimed at improving stress resilience in cereal crops.
4.5. Temporal Trends and Critical Growth Stages
The temporal analysis provided valuable insights into the dynamic changes in NDWI, T
plant, ET, and respiration over the phenotyping period. The sharp decline in NDWI during the reproductive stage under drought stress coincided with a significant rise in T
plant and a drop in ET, indicating a critical period of vulnerability to water deficit during grain filling [
32]. These findings emphasize the importance of targeting specific growth stages for stress mitigation strategies, such as irrigation scheduling and nutrient management. The strong correlations between ET and NDWI during the vegetative stage and between respiration and T
plant during the reproductive stage highlight the shifting physiological priorities of crops over their life cycle. These temporal patterns underscore the need for stage-specific interventions to optimize water use efficiency and maintain metabolic balance under stress.
4.6. Implications for High-Throughput Phenotyping and Crop Management
The integration of NDWI and Tplant measurements through high-throughput plant phenotyping (HTPP) platforms offers a powerful approach for monitoring crop stress responses and identifying drought-tolerant genotypes. The strong correlations between these variables and key physiological processes, such as ET and respiration, demonstrate their utility as proxies for assessing plant water status and metabolic activity. The use of regression models, including interaction terms, further enhances the predictive power of these metrics, providing a robust framework for stress phenotyping and eventually crop management. The genetic traits observed in wheat and barley cultivars highlight the potential for targeted breeding programs to enhance stress resilience in cereal crops. Traits such as higher NDWI and lower Tplant, which demonstrate better performance under drought stress, could serve as valuable targets for improving water use efficiency and thermal regulation in these crops.
The comparison between real-time evapotranspiration (ET) measurements using a balance during precision watering (
Figure 5) and the predictive capabilities of trait indices NDWI and T
plant (
Figure 3) validates the integration of direct and modeled approaches for crop stress phenotyping. Real-time ET measurements provide immediate and cultivar-specific water loss patterns under varying drought and nitrogen treatments, capturing the physiological responses of crops. On the other hand, the predictive capabilities of NDWI and T
plant, as shown in
Figure 3, highlight their strong correlations with ET and their utility as proxies for assessing plant water status and thermal regulation. This integration validates the use of both direct measurements and predictive modeling to enhance the accuracy and applicability of stress phenotyping in cereal crops.
5. Conclusions
This study demonstrates the utility of HTPP and IR imaging for unraveling the complex interactions between NDWI, Tplant, ET, and respiration in cereal crops under drought and nitrogen stress. By integrating NDWI and Tplant measurements, we demonstrated their strong correlations with evapotranspiration (ET) and respiration, with regression models explaining 74% of ET variance and 67% of respiration variance. These metrics provide valuable proxies for assessing plant water status and metabolic activity. Wheat cultivars exhibited greater sensitivity to drought stress, with higher Tplant and lower NDWI values, while barley cultivars, particularly SG2, showed superior water retention and thermal regulation, as evidenced by consistently higher NDWI values and lower Tplant under drought conditions. Temporal analysis identified critical growth stages, such as the reproductive phase, where stress impacts were most pronounced, emphasizing the need for stage-specific interventions to mitigate stress effects. These findings underscore the utility of NDWI and Tplant in stress phenotyping and their potential for guiding breeding programs to develop drought-resilient cultivars. Future research should expand the scope to include additional genotypes, stress scenarios, and advanced modelling approaches to further enhance the predictive power and applicability of these metrics in sustainable crop management.
