Article

A New and Improved YOLO Model for Individual Litchi Crown Detection with High-Resolution Satellite RGB Images

1
Institute of Geographic Sciences and Natural Resources Research, State Key Laboratory of Resources and Environment Information System, Chinese Academy of Sciences, Beijing 100101, China
2
School of Geography and Information Engineering, China University of Geosciences, Wuhan 430078, China
3
Jiangsu Center for Collaborative Innovation in Geographic Information Resource Development and Application, Nanjing 210023, China
4
Institute of Agricultural Economics and Information, Guangdong Academy of Agricultural Sciences, Guangzhou 510640, China
*
Author to whom correspondence should be addressed.
Agronomy 2025, 15(10), 2439; https://doi.org/10.3390/agronomy15102439
Submission received: 26 August 2025 / Revised: 1 October 2025 / Accepted: 15 October 2025 / Published: 21 October 2025
(This article belongs to the Section Precision and Digital Agriculture)

Abstract

The accurate detection of individual litchi crowns is important for precision management and yield estimation. This study aims to improve the YOLOv8n model for accurate detection of litchi crowns in high-resolution satellite images. For this purpose, three typical litchi orchards were selected for this study. High-resolution satellite RGB images of these orchards were collected, and individual crowns were visually interpreted. On the basis of these data, this study first improved the YOLOv8 model by fusing a priori knowledge with the task alignment learning (TAL) module, implementing efficient local attention (ELA), and employing a receptive field block (RFB) module, resulting in an improved model called the CAR-YOLO model. An ablation experiment was subsequently used to analyze the effects of the above strategies on the improvement of YOLOv8n model. Finally, the proposed CAR-YOLO model was compared with Fast-RCNN, YOLOv5n, YOLOv8n, YOLOv10n and YOLO v11n. The results showed that all of the improvement strategies used in this study enhanced the performance of the original model. Among all of the models, the CAR-YOLO model exhibited the best performance in terms of litchi crown detection, with AP50 values varying from 0.7069 to 0.8121 and F1 scores varying from 0.6908 to 0.7761 for different orchards. The other models resulted in AP50 values ranging from 0.4860 to 0.7895 and F1 score values ranging from 0.5265 to 0.7628. As demonstrated by these results, this study provides useful support for the precise management and planting inventory of litchi.

1. Introduction

Litchi is an important fruit grown in tropical and subtropical regions of Asia, as well as the Americas and Africa [1]. China is the largest grower of litchi. In China, fresh litchi sales, processed products, and related derivatives have established a diversified industrial chain. It has further driven the development of ecotourism and cold-chain logistics, promoting the regional economy [2]. The implementation of precision agriculture technologies in litchi management has been demonstrated to substantially increase operational efficiency and optimize profits for farmers. In this context, accurate detection of individual litchi crowns is very important. It supports the precise spraying of pesticides and fertilization to achieve cost savings and environmentally sustainable practices as well as yield estimation to create suitable marketing plans.
There are two main methods for individual tree crown mapping, the ground survey method and the remote sensing method. Although the ground survey method is accurate, it requires intensive labor and time, making it unsuitable for large-scale and seamless mapping. Conversely, remote sensing technology offers spatial seamlessness and synchronized large-area monitoring capabilities. It is particularly valuable for rapid crown mapping assisting in precision agriculture management [3]. Low-altitude unmanned aerial vehicles (UAVs) have been increasingly used to extract the morphological parameters of trees, due to their flexibility and high spatial resolution [4]. However, this technique is only suitable for small-scale crown mapping (e.g., individual plantations). It is difficult to apply to crown mapping at the county or provincial level, because of issues related to data acquisition efficiency and air traffic control. However, tree crowns can be identified in high-resolution satellite images (e.g., WorldView-2). High-resolution satellite images can be used to realize individual crown mapping at different scales such as individual orchards, counties and provinces [5]. Thus, it is very important to develop individual crown detection models for litchi trees on the basis of high-resolution satellite images.
With respect to individual tree crown detection, there are two main methods, the traditional image segmentation method and the machine learning method. Traditional methods involve applying threshold-based segmentation, clustering-based segmentation, or edge detection techniques to detect individual tree crowns using their color, texture, and edge features. This approach includes methods such as valley following [6], region growing [7], and watershed segmentation [8]. These methods have the advantage of being computationally efficient. However, they are sensitive to image noise, shadows and other factors. Therefore, these techniques cannot obtain highly accurate results when there is noise in the image or when the crowns overlap with each other [9]. The machine learning methods can be further categorized into traditional machine learning methods and deep learning methods. The traditional machine learning method typically involves image color enhancement, feature extraction, and model training [10]. The commonly used models include random forest [11] and support vector machines [12]. Compared with traditional image segmentation methods, the advantage of machine learning methods is that they can automatically learn and extract tree crown features and are more robust under noisy conditions. However, due to the shallow network structure, they are limited in terms of describing complex nonlinear relationships, resulting in low performance in complex application scenarios. By employing deep convolutional neural networks, deep learning methods can automatically learn the multiscale features of an image to achieve accurate detection of tree crowns. They are robust under complex conditions [13]. Therefore, in recent years, the deep learning-based tree crown detection method has become the predominant approach in the current research.
The deep learning-based tree crown extraction methods primarily include the semantic segmentation method and the object detection method. The semantic segmentation method requires pixel-level classification [14] and relies on high-resolution imagery and precise boundary annotations. Thus, when tree canopies overlap, the accuracy of the sematic segmentation method significantly decreases [15]. Since the spatial resolution of satellite images is not very high and that litchi crowns often overlap with each other, the semantic method is not the best choice for litchi crown detection. The object detection method involves identifying the tree crown through the use of the minimum outer rectangle of the canopy by employing a bounding box [16]. Compared with the semantic segmentation method, the object detection method can handle lower-resolution images and simplified annotations. Therefore, the object detection method was considered in this study when performing litchi crown detection based on satellite images.
The methods for object detection can be classified into two main types, two-stage methods and single-stage methods [10]. Two-stage methods first generate candidate regions and then perform classification and bounding box regression on the candidate regions. Commonly used two-stage methods include the Faster R-CNN model [17] and the Mask-RCNN model [18]. One-stage methods perform object classification and bounding box regression directly on the image without generating candidate regions. The commonly used single-stage methods include the SSD [19], RetinaNet [20], and YOLO series models [21]. Compared with the two-stage method, the single-stage method has a significant advantage in terms of its detection speed [22]. Notably, YOLO series models have previously been used in tree crown detection. Wang et al. [15] modified YOLO and then used it to successfully realize the automated detection of dead trees in forests. Xiong et al. [16] successfully realized the automatic detection of fruit tree crowns with YOLOv5. However, for individual tree crown detection, especially considering lichi tree crown detection, the existing methods still experience a series of problems. They include ambiguous label assignment problem when trees overlap with each other [23], problem in identifying the center of the canopy, and insufficient multiscale learning problem when the crown size varies significantly across different growth stages [24]. Overcoming these limitations is crucial for improving individual litchi crown detection accuracy.
To address these challenges, this study aims to improve the YOLOv8n model for individual litchi crown detection using high-resolution satellite imagery, supporting litchi precision management and inventory. The specific objectives of this study are as follows: (1) to propose the CAR-YOLO model for detecting individual litchi crowns by using a priori knowledge, attention modules, and multiscale analysis by improving the YOLOv8n model; and (2) to identify the best model for individual litchi crown detection by comparing the designed CAR-YOLO model with the commonly used YOLO series models and Faster R-CNN model. Regarding the organization of the article, the Materials and methods section describe the study area, sample preparation, new proposed method, ablation experiment and methods comparison experiment; the Results and Analysis section describes the results of ablation experiment and methods comparison experiment; the Discussion section outlines the main findings of this study, its potential application and limitation.

2. Materials and Methods

2.1. Study Area

Zengcheng district (23°05′–23°37′N, 113°29′–114°00′E) in Guangzhou city is located in southern-central Guangdong Province, China. It is one of the main production areas for litchi in China and is known as the “Hometown of Litchi” [25]. The region is in the subtropical monsoon climate zone and experiences an annual average temperature of 21.6 °C, an annual precipitation of 1869 mm, and more than 340 frost-free days annually. The soil is dominated by reddish soil with a high organic matter content and a pH ranging from 5.0–6.5, providing optimal conditions for litchi growth [26]. The region has nearly 11,500 hm2 of litchi [27]. In this study, three representative litchi orchards in the region were selected for designing a model to detect individual litchi tree crowns (Figure 1). They were Sanzhen orchard, Mingzhu orchard, and Litchi cultural expo orchard. For Mingzhu orchard, the tree crowns severely overlap with each other and are irregularly distributed in space, while the tree crowns in the Litchi cultural expo orchard slightly overlap with each other and are distributed more regularly in space. The Sanzhen orchard contains two different regions. One region includes severely overlapping tree crowns, and in the other, the crowns are more separated but are more varied in size. The three orchards are representative for litchi tree grown under different soil and microenvironment conditions within the study area.

2.2. Dataset Collection and Production

2.2.1. High-Resolution Satellite Imagery

The high-resolution satellite RGB images were collected from Esri World Imagery (https://livingatlas.arcgis.com/wayback, accessed on 14 October 2025), which provides global multiscale imagery services through the 1–20-level pyramid tiles. The imagery includes Maxar series products such as the Vivid Premium product which covers key cities with a 0.15 m spatial resolution, the Vivid Advanced product which covers over 1000 cities with a 0.3 m spatial resolution, and the Vivid Standard product which covers global primary regions with a 1.2–0.6 m spatial resolution. The WorldView-2 satellite images from the Vivid Advanced product (20-level tile, 0.3 m resolution) on 14 April 2022, were downloaded and used in this study.

2.2.2. Visually Interpreted Data

The RGB images for individual orchards were first obtained by cropping the above collected high-resolution images to within the boundaries of three orchards. The image of each orchard was subsequently clipped using a 128 × 128 sliding window with a 30% overlap rate. This process generated 248, 162, and 162 image blocks for the Sanzhen orchard, Litchi cultural expo orchard and Mingzhu orchard, respectively. Finally, by using the ArcGIS software (ESRI, Redlands, CA, USA), individual litchi crowns were labeled by using the rectangular box tool with visual interpretation. During this process, to ensure the reliability of the annotations, two experienced interpreters independently labeled the bounding boxes for each litchi crown. Discrepancies between their annotations were discussed and reconciled to produce a unified set of labels. In addition, by employing the code developed in this study, the labeled results were then converted into the formats that can be recognized by YOLO-series models and the Faster R-CNN model.

2.3. New Model for Individual Crown Detection

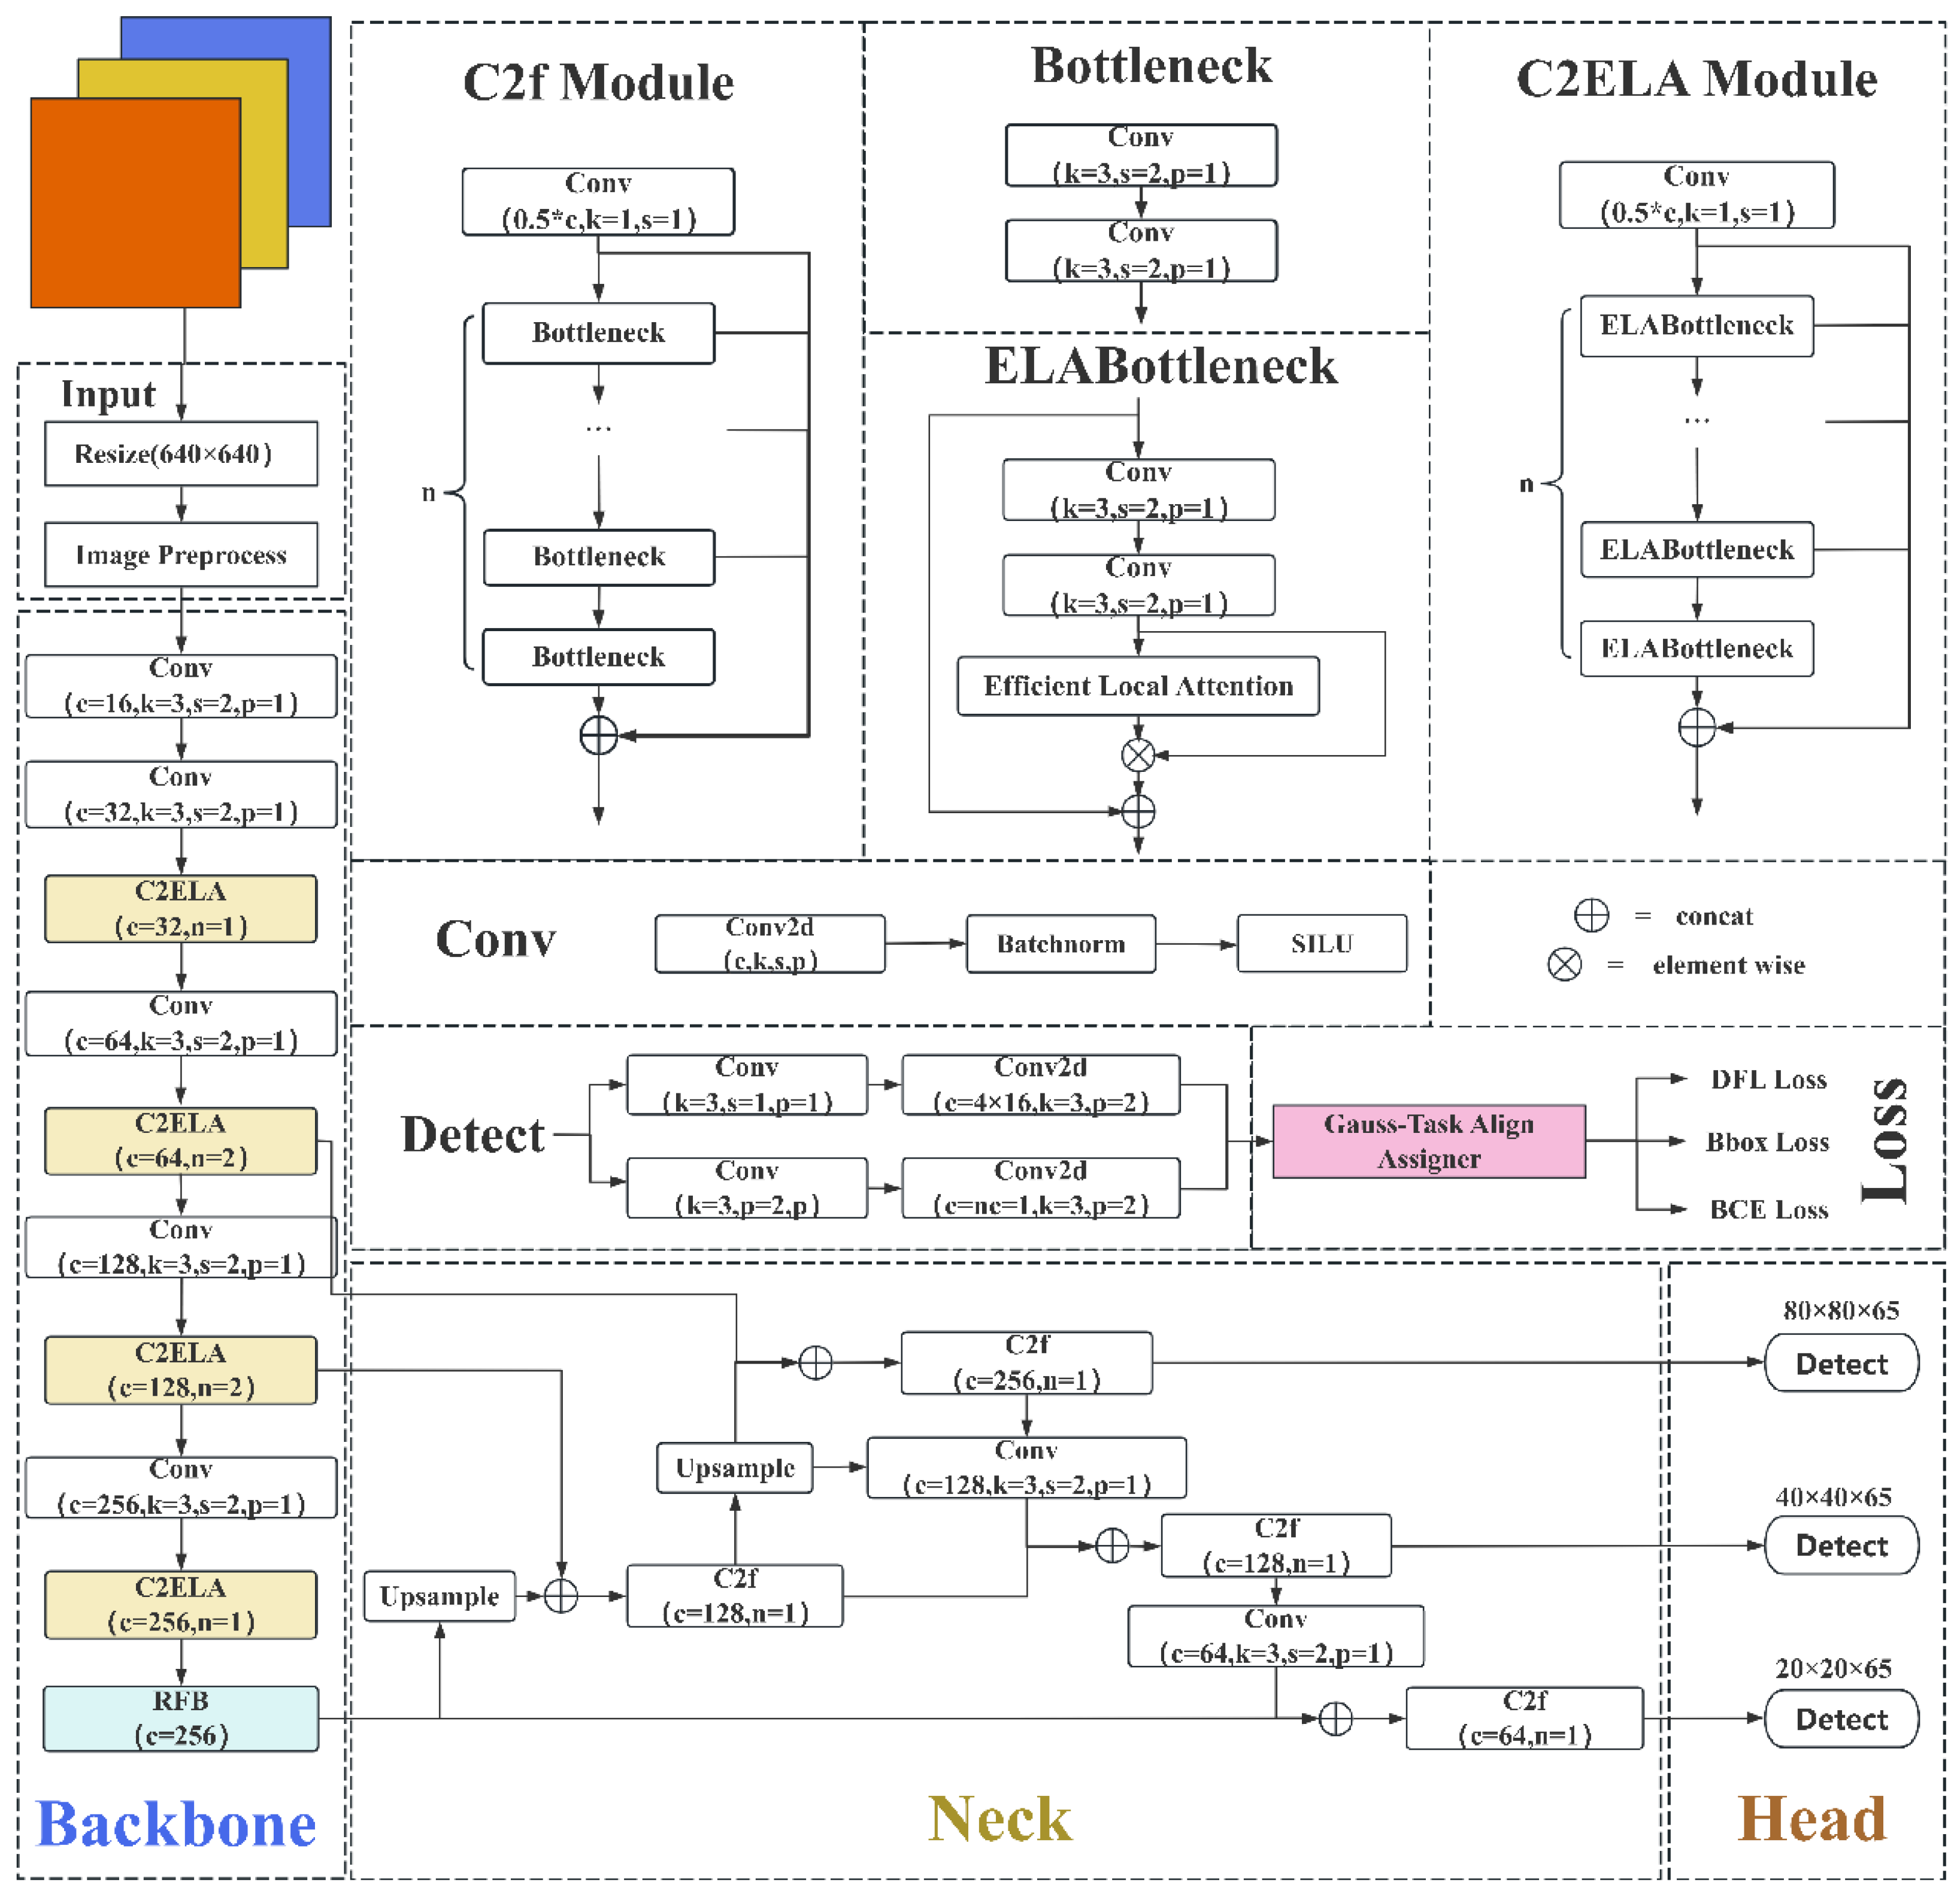
To address the problems related to the existing YOLO models, this study improved the YOLOv8n model using the strategies as follows: (1) fusing a priori knowledge with the task alignment learning (TAL) module to decrease the ambiguity of samples when tree crowns overlap; (2) implementing an efficient location attention (ELA) module to improve the center detection accuracy; (3) using receptive field block (RFB) modules with multiscale receptive fields to effectively detect crowns of different sizes. The improved YOLO model is named the CAR-YOLO model in this study. Figure 2 depicts its primary structure, which includes the backbone, neck and head. Compared with the original YOLOv8n model, the frame boxes highlighted in color in Figure 2 are improved in this study.

2.3.1. Fusing a Priori Knowledge with the TAL to Decrease Sample Ambiguity

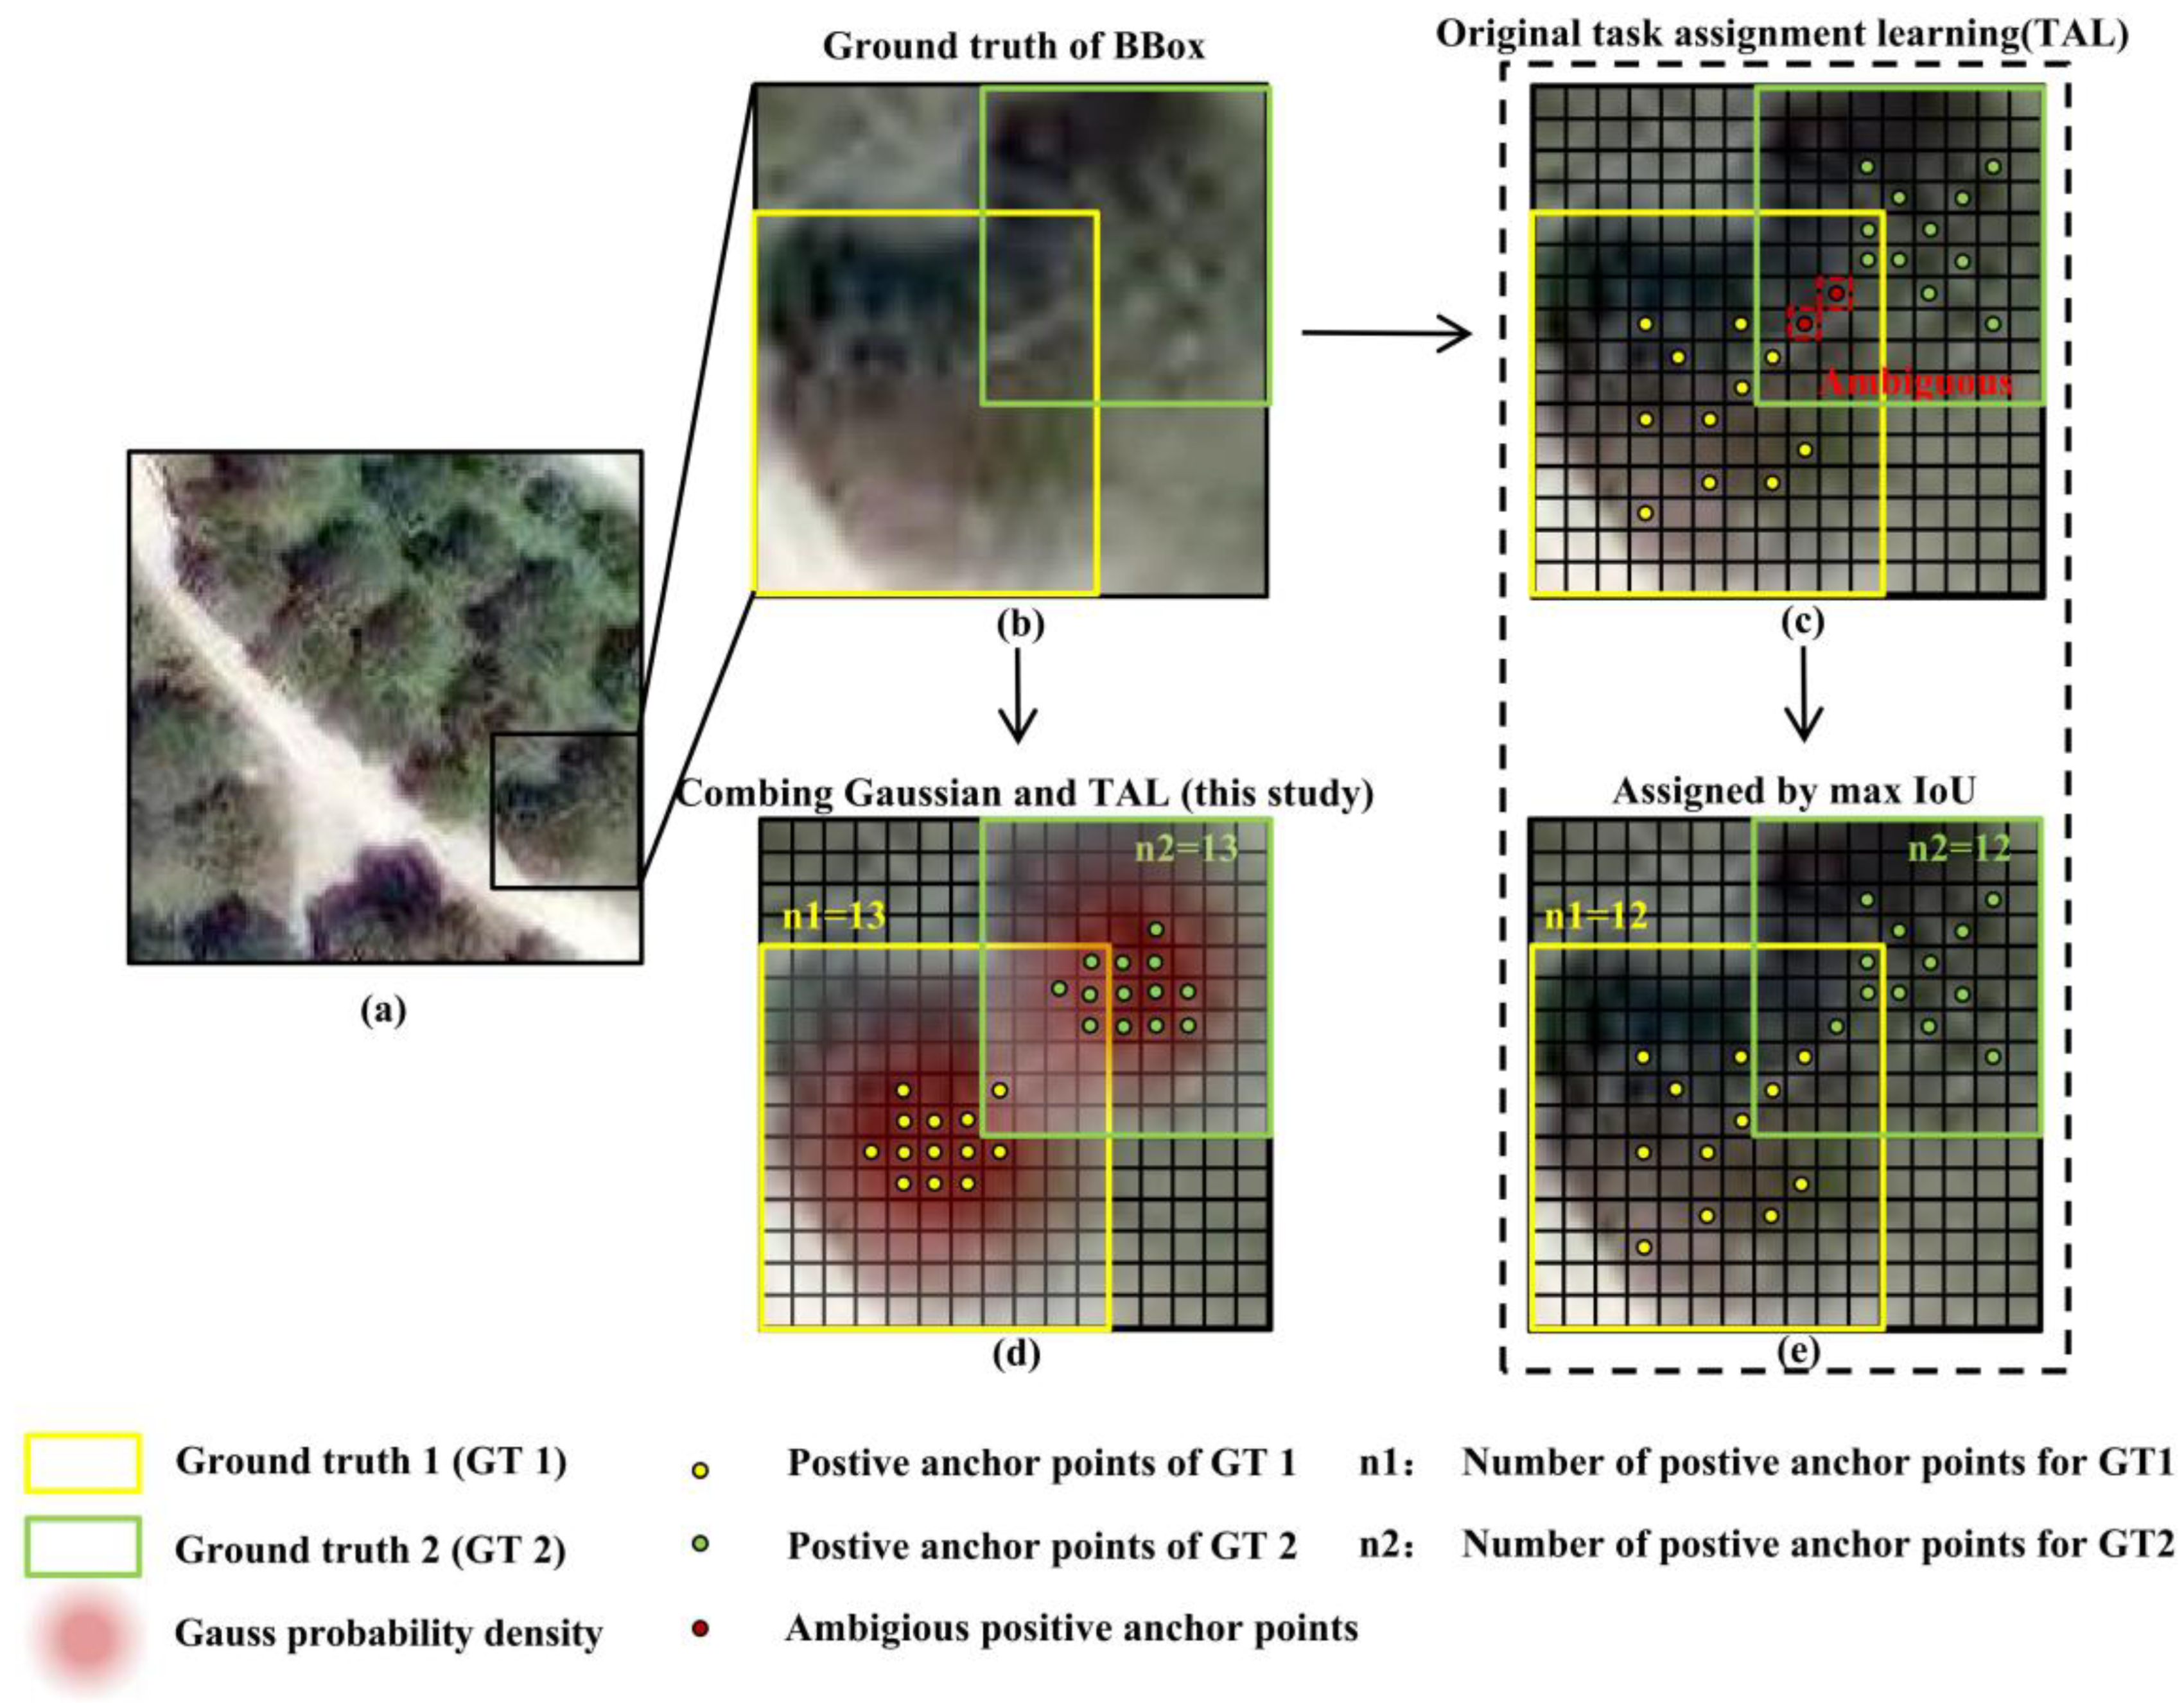
YOLOv8n uses an anchor-free object detection strategy that directly predicts the offsets from the anchor point to the four edges of the object box to generate the prediction anchor box. Its detection head adopts a decoupled design to separate the classification and regression tasks [28]. When calculating the loss function, the TAL method is used to identify high-quality positive samples that have balanced optimal results for classification and regression tasks [29], and the identified positive samples are subsequently used to train the model. During this process, the strategy evaluates samples by constructing an integrated evaluation indicator called the task alignment score, which is calculated using Equation (1). The top n optimal samples (n = 13 in this study) were selected as positive samples. When a sample matches multiple ground truth boxes, it becomes an ambiguous sample. In Figure 3c, the anchor points in red indicate the samples that were simultaneously selected as the top n optimal samples for both the green and yellow ground truth. These samples are considered ambiguous samples. In such cases, the original YOLOv8n model forcibly assigns ambiguous samples to a single ground truth box based on the maximum intersection-over-union (IoU) values. This approach leads to a reduction in the number of positive training samples for other ground truths, as shown in Figure 3e, resulting in model optimization instability [23,30]. This issue becomes very serious when tree crowns of different sizes overlap with each other. The number of positive samples for small tree crowns can be significantly reduced. To solve this problem, this study introduces a priori knowledge into the formula of the task alignment score. It has been demonstrated that tree crowns appear roundish in satellite orthorectified images, and their projection curves are similar to the Gaussian distribution [31,32]. Therefore, the distance from the candidate anchor point to the center of the ground truth box should conform to the Gaussian distribution. On the basis of the above analysis, this study introduces a Gaussian probability density function to the task alignment score to ensure that the selected positive samples are closer to the center of the ground truth box. This technique can effectively reduce the proportion of ambiguous samples (Figure 3d). The improved calculation of the task alignment score, which incorporates Gaussian distribution weights, is shown in Equation (2).
S i = S c l s i α × S I o U i β
where S i represents the task alignment score of the i-th candidate positive box sample for the ground truth, which is used to measure the consistency of the classification and regression tasks (with values ranging from [0,1]); S c l s i is the normalized confidence level of the classification output, which indicates the probability that the predicted box belongs to the target category; S I o U i denotes the intersection over union ratio of the predicted box to the ground truth box; and α and β are hyperparameters. The default settings are α = 1.0 and β = 6.0, as these values can control the weight balance of the classification and regression tasks.
S G i = S i × k r 2 π × e d i 2 k 2 2 r 2
where SGi is the fused Gaussian distribution-weighted task alignment score for the i-th candidate anchor, r denotes the maximum value in length and width of the ground truth box, k is a tunable hyperparameter that governs the anchor weight distribution (empirically configured as k = 0.5 in this study), and di quantifies the distance between the i-th candidate anchor point and the centroid of the ground truth box.

2.3.2. Introducing the ELA Modular to Improve the Center Detection Accuracy

The C2f modular serves as the fundamental component of YOLOv8n. It uses a gradient shunt connection to enrich the information obtained from the feature extraction network while maintaining a light weight [33]. To improve the crown center detection accuracy, this study introduces the ELA modular in the bottleneck modular of C2f into the backbone network. The implementation of the attention mechanism in the bottleneck can optimize the feature propagation pathways and avoid information degradation, which has been documented to be an effective strategy [34]. The structure of the ELA modular is shown in Figure 4. It first performs x-axis global average pooling and y-axis global average pooling on the feature maps to capture the significant features distributed in the horizontal and vertical directions. Then, it concatenates the outputs of the above procedure and uses a 1 × 1 convolution with sigmoid activation to generate a spatial attention weight map. Finally, the enhancement of the feature map is achieved by the Hadamard product to ensure that the network focuses on the region in which the responses are significant in both the x-axis and y-axis directions [35]. This region is considered as the potential center of the tree crown. The ELA module enhances the network of the backbone to extract the center features.

2.3.3. Using the RFB Modular to Increase the Detection Accuracy of Tree Crown

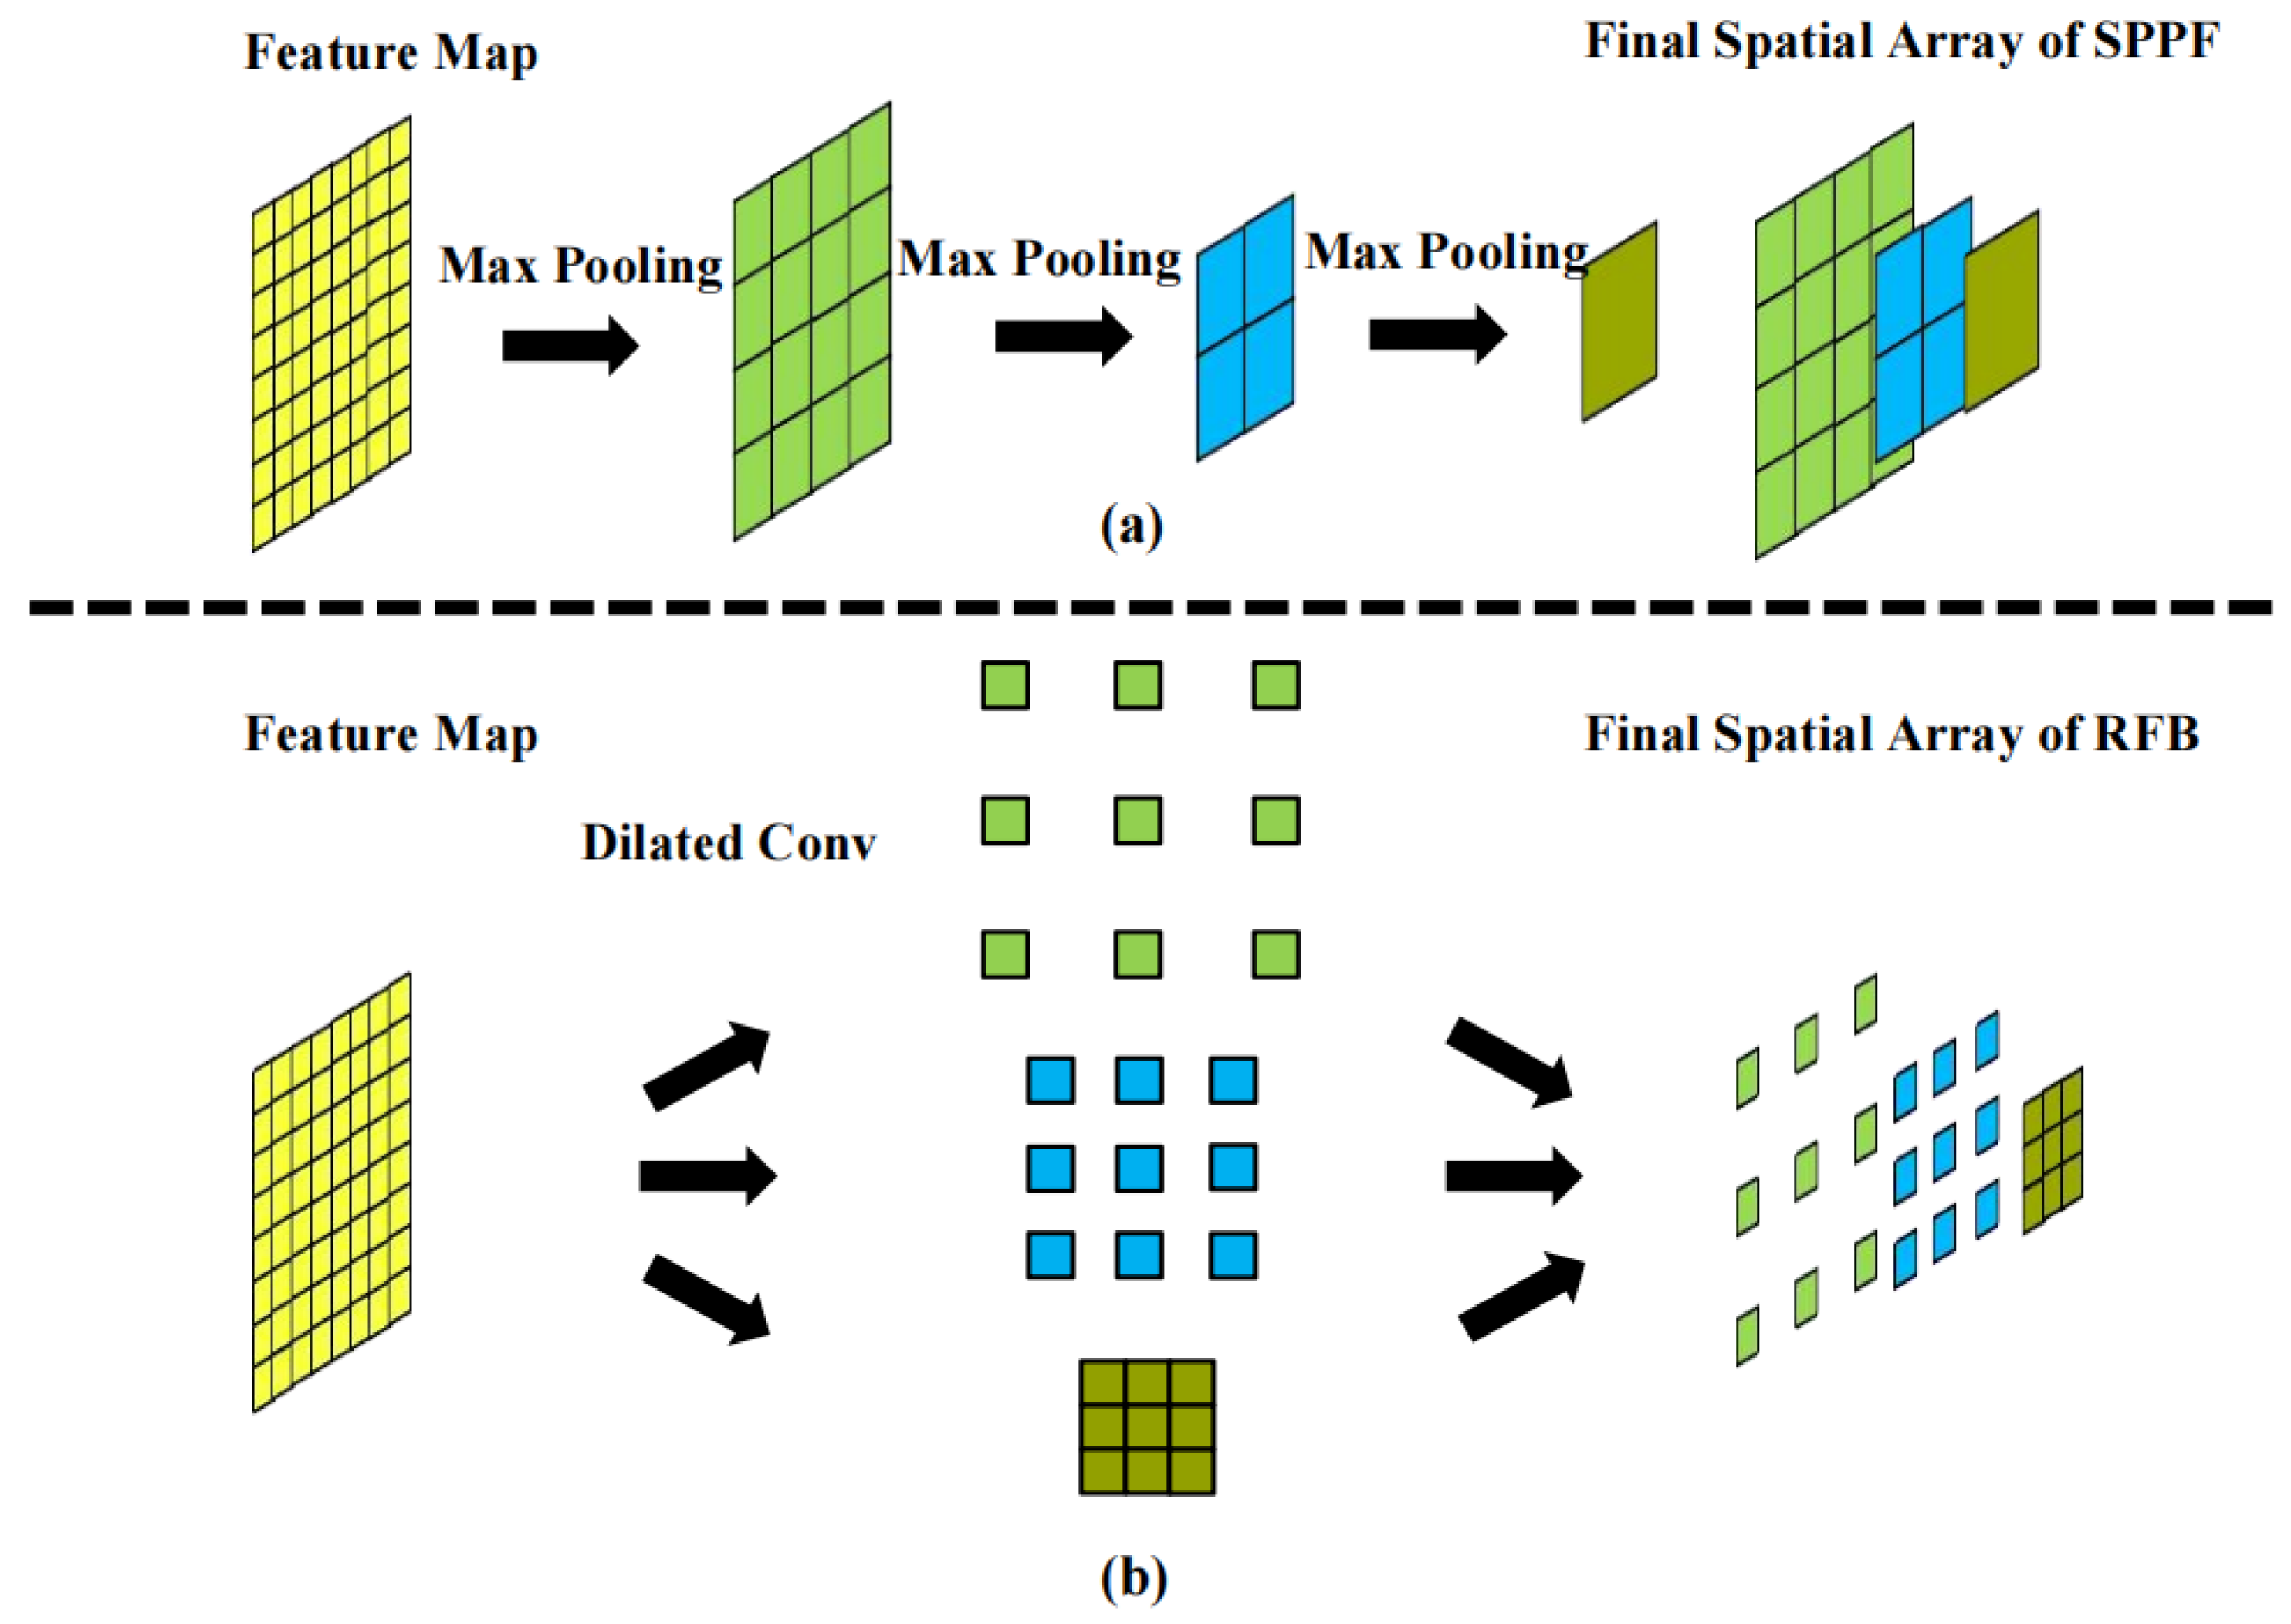
When identifying litchi tree crowns, notable variation in the crown size is typically found across trees of differing ages. To detect objects of different sizes, the spatial pyramid pooling-fast (SPPF) module is used in the original YOLOv8n model. However, due to its fixed multiscale pooling structure, it has a limited ability to dynamically adapt the preset pooling layers for highly variable crown sizes, resulting in feature loss. This phenomenon becomes severe for small-sized objects or densely overlapping objects [36]. In contrast, the RFB modular can adaptively capture multiscale contextual information by a biological visual system inspired by multibranch dilated convolutions, where the multiscale information is extracted by using different convolution kernels with varying dilation rates (Figure 5). Therefore, this study replaces the SPPF modular with the RFB module to improve the model’s ability to accurately detect litchi tree crowns of different sizes.

2.4. Data Analysis Methods

Ablation experiment and comparison experiment were conducted to evaluate the effectiveness of proposed model in this study. During the process, data collected from Sanzhen orchard, Litchi cultural expo orchard, and Mingzhu orchard were treated as three different datasets in this study, to minimize the problem that the results often depend on the dataset and to limit the risk of overfitting. It like a cross-validation process. Each of the above datasets was randomly divided into training, validation, and test datasets at a ratio of 4:1:1. The training and validation datasets were used for model calibration, whereas the test dataset was used to evaluate the model performance. In addition, to increase the diversity of training samples and limit overfitting, data augmentation was performed during model training based on the training samples, through image splitting, random rotation, color alteration, and stitching. It was performed through the corresponding module of the YOLO series model and Faster R-CNN. The computational infrastructure comprised an Intel Xeon Platinum 8481C CPU (16 vCPUs) and an NVIDIA GeForce RTX 4090D GPU (24 GB VRAM), operating within a PyTorch 2.3.0 framework with a Python 3.12 interpreter and a CUDA 12.1 acceleration framework on the Ubuntu 22.04 system.

2.4.1. Ablation Experiment

A total of eight experimental scenarios were designed, only the fusion of a priori knowledge with the TAL, introducing only the ELA module, using only the RFB module, combining any two of the above improvement methods, combining all three of the above improvement methods, and the original YOLOv8n model (baseline). For each scenario, the models were trained on the training and validation datasets and evaluated on the test datasets. To train the model, the SGD optimizer was used with an initial learning rate of 3 × 10⁻⁵; the batch size was set to 16, and the number of training epochs was set to 200. Notably, the original 128 × 128 image was expanded to 640 × 640 via the adaptive module to satisfy the input image size requirements of the models.

2.4.2. Comparison Experiment

Faster R-CNN is a representative two-stage object detection method, and it has been widely used for individual tree crown detection. Thus, this method was selected for comparison with our proposed CAR-YOLO model. In addition, besides YOLO v8n, there are many other types of models in the YOLO family. YOLOv5n, YOLOv8n, YOLOv10n and YOLO 11n were also selected for comparison, considering the novelty of these models and their frequency of use in other studies. Like the CAR-YOLO model, the above selected YOLO series models were also trained with the SGD optimizer with an initial learning rate of 3 × 10⁻⁵, a batch size of 16, and 200 training epochs, while Faster R-CNN was trained with an SGD optimizer with an initial learning rate of 3 × 10⁻⁵, a batch size of 16 and 800 training epochs. Notably, as the input image size requirement for Faster R-CNN is 800 × 800, the original image blocks were expanded to satisfy the requirement via the adaptive module.

2.4.3. Model Evaluation

This study evaluated the model in terms of both the model detection accuracy and computational efficiency. The model detection accuracy was evaluated in terms of the precision, recall, F1 score, and AP50 [24,37], which were calculated as shown in Equations (3)–(6). The computational efficiency was evaluated according to the number of model parameters.
Precision = T P T P + F P
Recall = T P T P + F N
F 1 = 2 × Precision × Recall Precision + Recall
where TP represents the number of detection boxes in which the litchi crown was correctly detected, FP is the number of detection boxes in which the litchi crown was incorrectly detected, and FN is the number of missed detections in the litchi crown.
A P 50 = 0 1 p r d r  
where r is the recall value and p(r) is the precision value when the recall is r. AP50 represents the average precision when the IoU threshold is 0.5.

3. Results

3.1. Statistical Analysis Results for Individual Litchi Crowns from Different Orchards

The statistical analysis results for the tree crowns from different litchi orchards are shown in Table 1. The Sanzhen orchard has the highest tree planting density, with 1.89 plants/100 m2. In addition, the width of the crown ranges from 5.28 to 131.18 m2, with a mean value of 25.32 m2 and a standard deviation value of 11.79 m2, and the canopy coverage is 47.97%. The planting density for the Mingzhu orchard is the second highest at 1.72 plants/100 m2. The width of the crown ranges from 3.73 to 211.66 m2, with a mean value of 31.14 m2 and a standard deviation value of 15.91 m2, and the canopy coverage is 53.43%. The Litchi cultural expo orchard has the lowest tree planting density, with 1.65 plants/100 m2, and the width of the crown ranges from 4.34 to 74.65 m2, with a mean value of 27.21 m2 and a standard deviation value of 11.52 m2. The canopy coverage is 44.91%. These results reveal large differences in tree crowns among different orchards, representing various litchi plantation scenarios and therefore forming robust datasets for evaluating different crown detection models.

3.2. Results of the Ablation Experiment

To enhance the ability of the proposed method to detect individual crowns, the YOLOv8n model was improved by fusing a priori information into the TAL module, implementing the ELA into the C2f module, and using the RFB instead of the SPPF in the backbone network. An ablation experiment was conducted to validate the effectiveness of these strategies, and the results are shown in Table 2. On the different datasets, the original model resulted in precision values between 0.6682 and 0.7844, recall values between 0.6683 and 0.7434, AP50 values between 0.6792 and 0.7895, and F1 score values between 0.6683 and 0.7628. When adopting only the fusion of a priori information with the TAL module, the model performance improved with precision values between 0.7150 and 0.7878, recall values between 0.6345 and 0.7665, AP50 values between 0.6975 and 0.8042, and F1 score values between 0.6724 and 0.7732 on the various datasets. When adopting only the ELA, the model performance also improved with precision values between 0.7110 and 0.8071, recall values between 0.6411 and 0.7599, AP50 values between 0.7015 and 0.8111, and F1 score values between 0.6743 and 0.7828 on the different datasets. Finally, when the only improvement involved replacing the SPPF module with the RFB, the model performance again improved with precision values between 0.7120 and 0.7920, recall values between 0.6478 and 0.7778, AP50 values between 0.6968 and 0.8179, and F1 score values between 0.6784 and 0.7834 on the different datasets. In summary, regardless of which dataset was used, each strategy consistently improved the model performance compared with the original model.
In addition, combining any two strategies can also enhance the model performance with precision values between 0.6969 and 0.7978, recall values between 0.6502 and 0.7577, AP50 values between 0.6842 and 0.8127, and F1 score values between 0.6728 and 0.7706 on the different datasets. Furthermore, when the model was improved using all three strategies to form the CAR-YOLO model, the model achieved the best performance with precision values between 0.7067 and 0.8003, recall values between 0.6755 and 0.7673, AP50 values between 0.7069 and 0.8121, and F1 score values between 0.6908 and 0.7761 on the various datasets.

3.3. Results of the Comparison Experiment

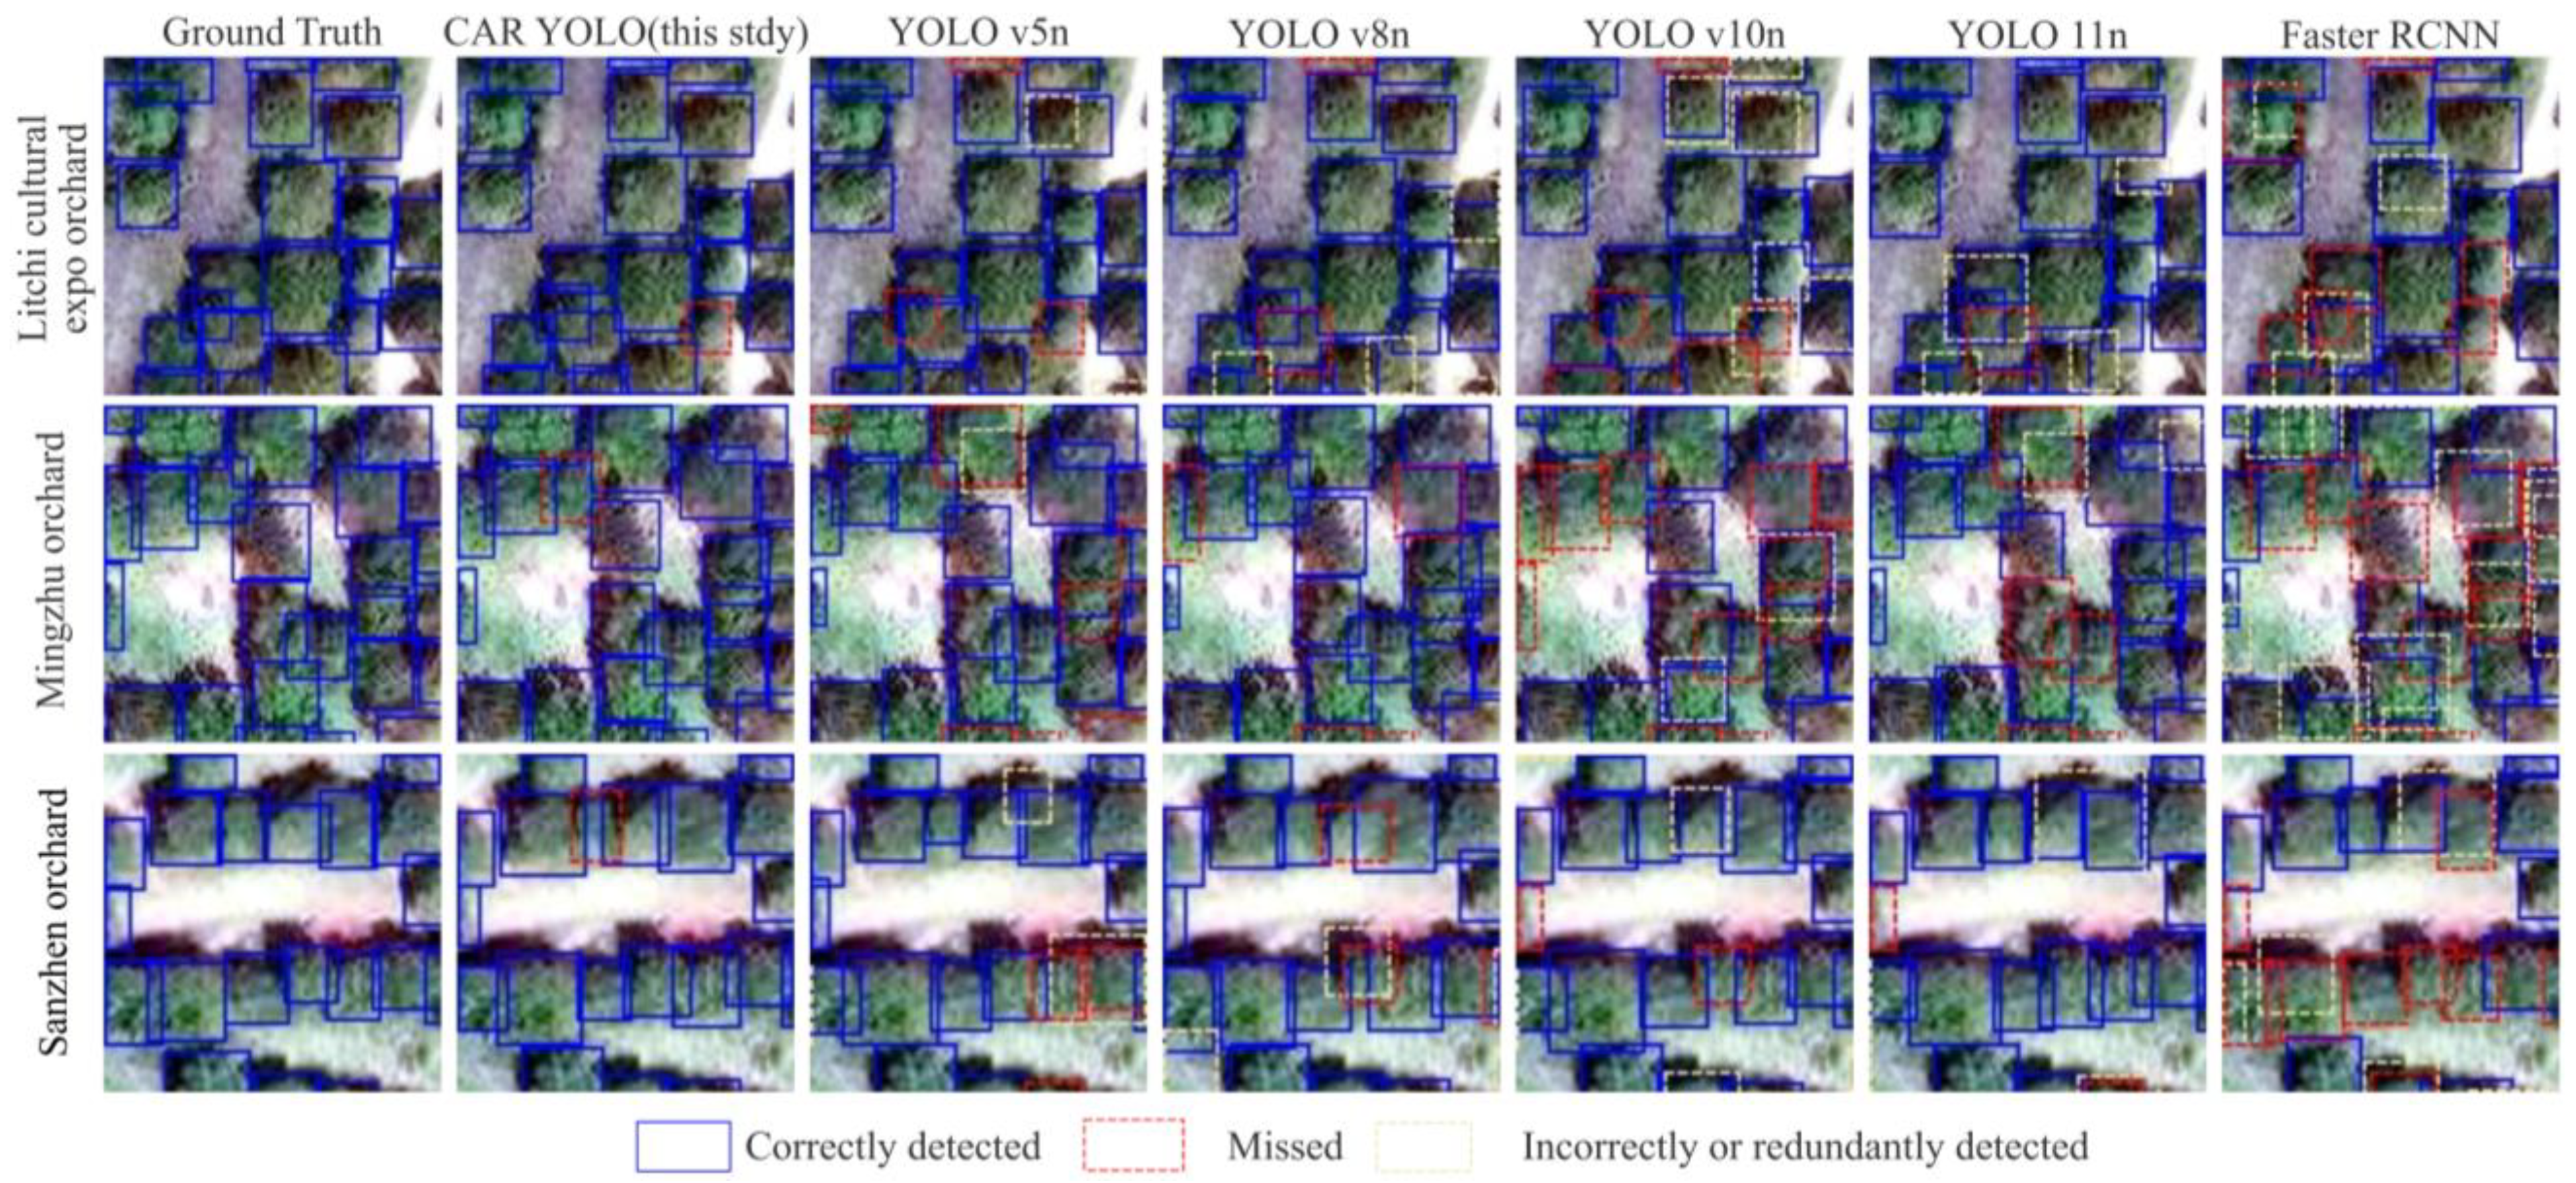
A visual example of the use of different models to detect individual crowns is shown in Figure 6. The CAR-YOLO model yielded the best results, with the highest number of correctly detected crowns and the lowest number of missed and incorrectly detected crowns. The Faster R-CNN and YOLOv10n models yielded the worst results, with the lowest number of detected crowns and the highest number of missed and incorrectly detected crowns. Finally, moderate results were obtained from the YOLOv5n, YOLOv8n, and YOLOv11n models, with both correctly detected crowns and missed and incorrectly detected crowns at moderate levels.
The performances of the different models in terms of detecting tree crowns are shown in Figure 7. When considering the prediction accuracy, the newly proposed CAR-YOLO model achieves the best results on the different datasets with precision values between 0.7067 and 0.8003, recall values between 0.6755 and 0.7673, AP50 values between 0.7069 and 0.8121, and F1 score values between 0.6908 and 0.7761. The results also show that Faster R-CNN and YOLOv10n exhibited the worst performance with precision values between 0.5538 and 0.7005, recall values between 0.5018 and 0.6900, AP50 values between 0.4860 and 0.7029, and F1 score values between 0.5265 and 0.6634, while YOLOv5n, YOLOv8n and YOLOv11n produced moderate performance with precision values between 0.6647 and 0.7844, recall values between 0.6441 and 0.7638, AP50 values between 0.6467 and 0.7895, and F1 score values between 0.6350 and 0.7628 on all of the datasets. In terms of the computational efficiency, the Fast-RCNN has the largest number of parameters with a size of 62.7 MB and the lowest computational efficiency, while in this study, YOLO v5n, YOLOv8n, YOLO v10n, YOLOv11n and CAR-YOLO have relatively similar numbers of parameters with sizes between 1.9 MB and 2.8 MB. The computational efficiencies of these models are also similar.

4. Discussion

4.1. Improvement of YOLOv8n

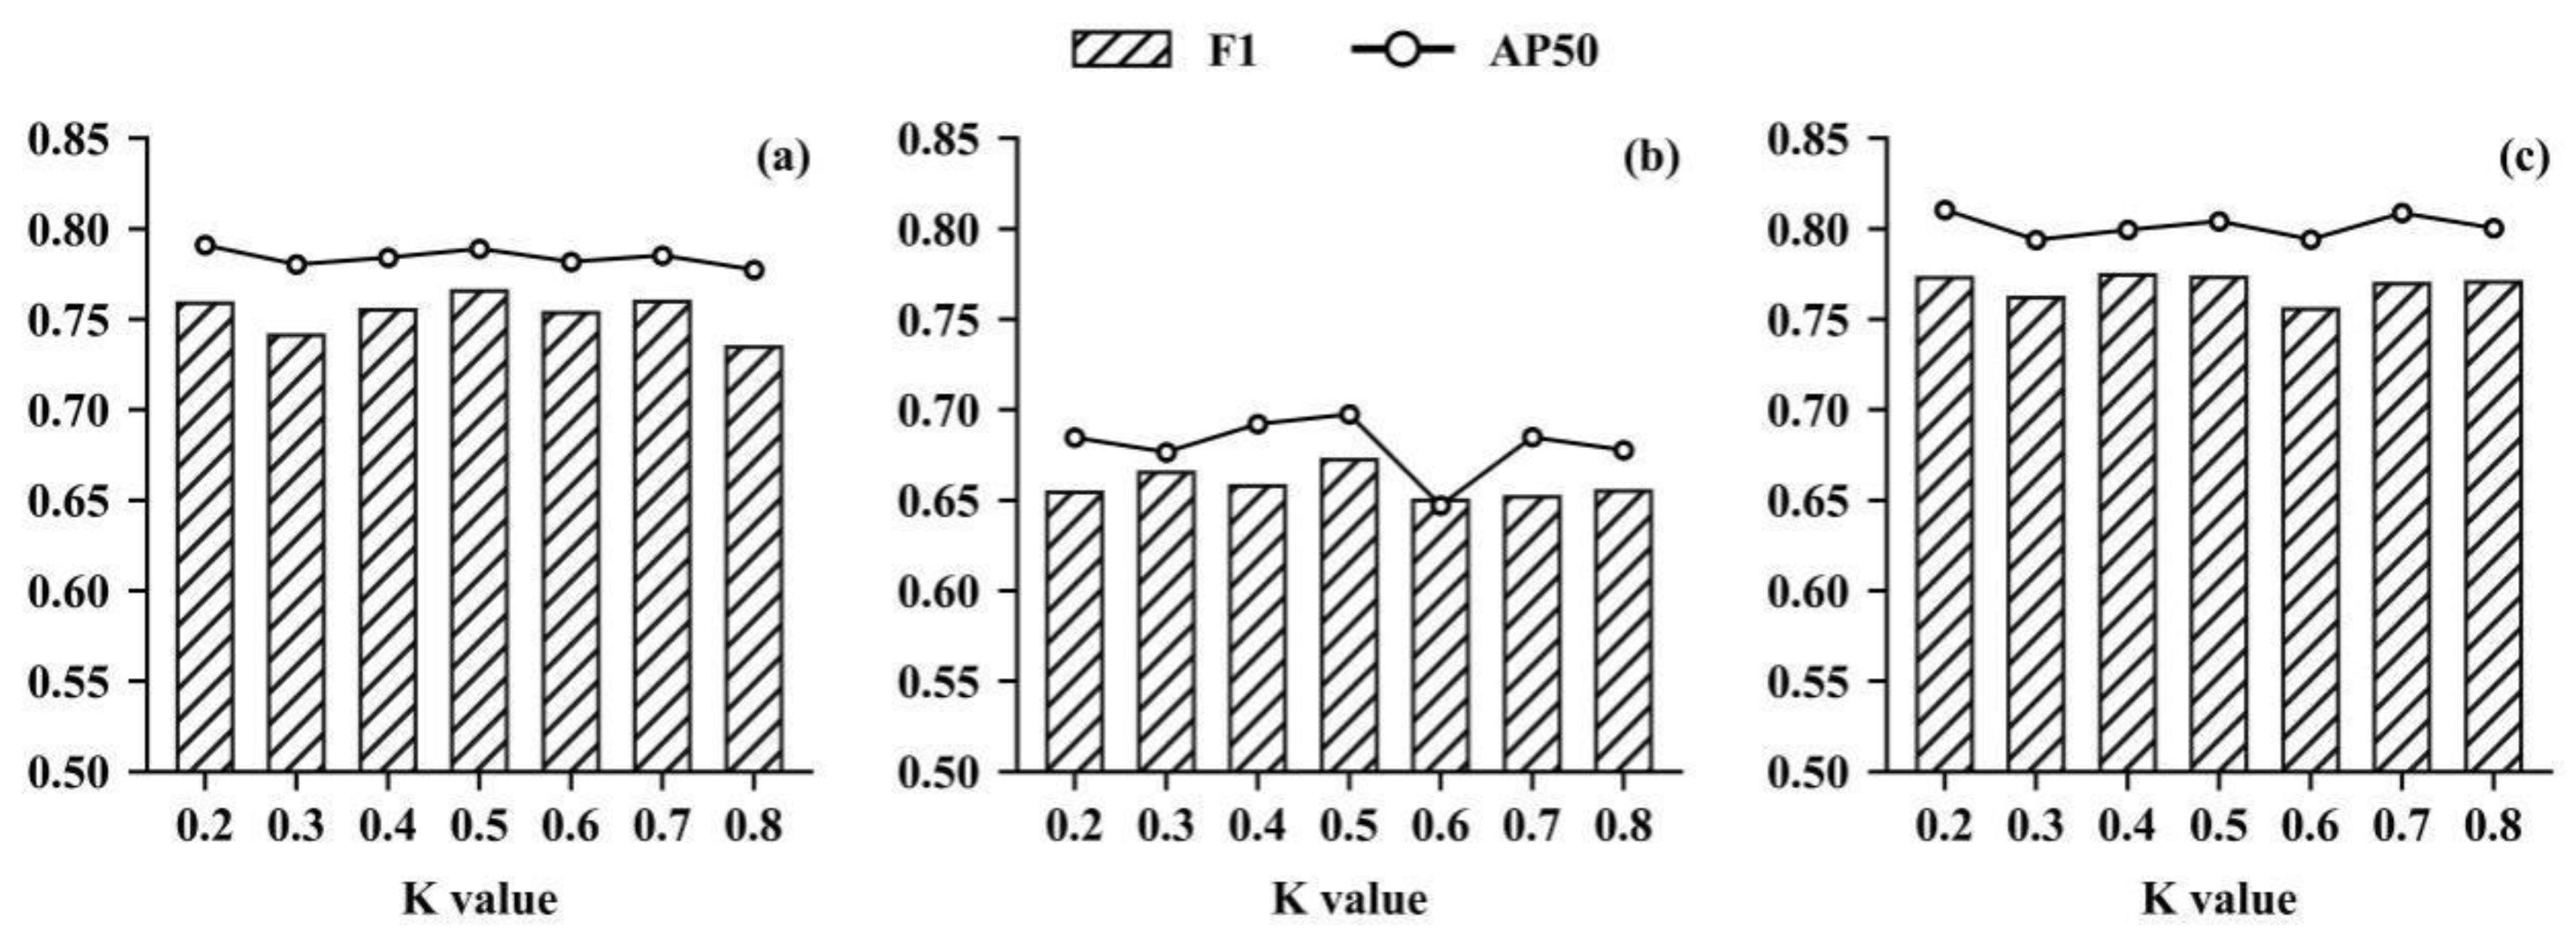
On the basis of the RGB images acquired by UAVs, Cheng et al. [31] first used the Otsu method to extract vegetation and then utilized a Gaussian distribution function to detect the individual crowns of apple and cherry trees in each planting row. However, this method is only suitable for situations in which fruit trees are planted in straight lines and in which there is no other vegetation. In litchi orchards, trees are often nonlinearly planted, and other vegetation types, such as grass, are present. Thus, this method is not suitable for individual crown detection in litchi orchards. The YOLOv8n model enables the detection of litchi crowns with arbitrary spatial distributions, but it has ambiguous label assignment problem when the crowns overlap [30]. In terms of object detection, ambiguous samples can be reduced by using strategies such as a priori knowledge [23,38]. Thus, to address the above limitation, a Gaussian distribution function was incorporated into the TAL module of YOLOv8n to help it select positive samples. Testing on three different datasets revealed that the strategy efficiently enhances the model performance. In addition, when the Gaussian distribution function is used, a parameter k is used. to obtain the optimal value of k, a sensitivity analysis was conducted on datasets from three different orchards, and the results are shown in Figure 8. The optimal value of k was determined to be 0.5 by analyzing the change in the detection accuracy according to its value.
To increase the detection accuracy of the isolation switch state in a power system, Chen et al. [39] implemented the ELA module in the neck of the YOLOv8n module. However, there are no similar studies regarding individual tree crown detection. Unlike the previous studies, we implemented the ELA modular within the backbone of YOLOv8n. The improved model for individual tree crown detection was then tested on three different litchi datasets, showing good performance. Finally, by replacing the SPPF modular with the RFB, Xue et al. [34] enhanced the ability of YOLOv5 to detect tea leaves. However, no study has used this strategy to increase the accuracy of individual tree crown detection when employing the YOLO method. In this study, the SPPF modular in the original YOLOv8n model was replaced with the RFB module, and a test on three different litchi datasets demonstrated that the model performance was improved for individual tree crown detection.
Fusing the Gaussian distribution to the TAL enforces constraints on the detection boxes, implementing the ELA enhances the ability of the model to identify object centers, and using the RFB improves the ability of the model to extract multiscale information. Their functions are complementary. Thus, the CAR-YOLO model was designed in this study by combining the above three strategies to obtain the optimal detection ability.

4.2. Optimal Individual Litchi Tree Crown Detection Model

As a representative two-stage object detection method, Faster-RCNN is widely used for individual tree crown detection [3]. However, its number of parameters is significantly larger than those of the YOLO series models and the proposed CAR-YOLO model presented in this study. Therefore, it has the lowest computational efficiency compared with the other models. In terms of accuracy, Faster-RCNN and YOLOv10n were the worst models for tree crown detection. Furthermore, Figure 7 shows that Faster-RCNN suffers from duplicate detection and missed detection problems. It is because Faster-RCNN uses a dense candidate detection box-based algorithm, and high thresholds of confidence and nonmaximal suppression (NMS) are needed to control the number of detection boxes. This mechanism causes the performance of the model to be largely influenced by the preset sizes, aspect ratios, number of anchor boxes, and density of reference points [40]. In this study, the disadvantage of this algorithm is amplified by the diverse scales and dense distribution of objects, resulting in significantly lower AP50 and F1 scores. YOLOv10n uses a one-to-one matching strategy for detection. This design eliminates the NMS step and significantly increases the computational efficiency [41]. However, in this study, we found that this strategy induces suppression detection in adjacent crowns, resulting in a high rate of missed detection in areas with high crown density (Figure 6). In addition, YOLOv10n adopts depthwise separable convolution and structural optimization to achieve a lightweight model. Thus, it has only 1.9 MB of parameters. However, this apparent advantage leads to decreased performance in information extraction under complex backgrounds. When considering the performance of YOLOv5n, YOLOv8n and YOLOv11n, they achieved moderate accuracy. These models were developed by the same team, named Ultralytics [42]. All of them use a one-to-many matching strategy that is suitable for intensive object detection scenarios. Therefore, they performed better than YOLOv10n. However, they have problems such as ambiguous sample assignment and weak center detection ability. Compared with the above models, the CAR-YOLO model proposed in this study can be regarded as the optimal individual litchi tree crown detection model due to its introduction of a priori knowledge and ELA which improve the object center detection ability, and the RFB which improves the model’s multiscale object detection ability.

4.3. Potential Applications and Limitations

Considering the application of the proposed CAR-YOLO model, it can be used in surveys of the number and yield of litchi at the county, provincial, and even national scales. During this process, high-resolution satellite images of the study area should be obtained first. Then, the number of litchi trees can be automatically extracted by using the CAR-YOLO model and boundary data from the orchard. Finally, based on the production of a single litchi tree, yield estimation can be performed. This information can be used to support policy making and resource scheduling to ensure the reasonable pricing of the market and limiting loss during the transportation of fresh fruit. In terms of precision management, the CAR-YOLO model can also be used to automatically detect tree crowns from high-resolution images to aid in the precise spraying of pesticides and fertilization. In addition, although this study tested only the ability of the CAR-YOLO model to detect individual litchi crowns, it has the potential to detect the crowns of other fruit trees or to detect individual tree crowns in forests to assist in forest inventory processes. Furthermore, in addition to satellite images, the model has the potential to be applied to UAV images.
However, this study has several shortcomings. First, this study only tested the CAR-YOLO model in terms of litchi crown detection in the Zengcheng area, and the applicability of the model to other fruits and areas needs to be further verified. For further studies, data from other regions with different climates, management practices or planting structures will be collected, and transfer learning and domain adaptation methods will be applied to make sure that the model in this study can be used in other regions. Second, the effect of the image resolution on model performance was not explored. For further studies, images with different resolutions will be collected or simulated. Then, different spatial resolution scenarios can be designed to analyze their effect on the performance of the CAR-YOLO model. Third, for precision management, the operational window is very short as it needs to consider the weather condition and crop growth stage. Thus, it requires canopy extraction models to be both accurate and fast. Considering that the YOLO-series model and Faster R-CNN are lightweight models with fast characters, this research primarily compares these two kinds of models. Given the transformer-based models is another state-of-the-art method, the model proposed in this study will be compared with them in feature work. Finally, this study proposed an improved YOLOv8n model structure for detection litchi tree crown. However, during model training, we did not consider the effects of seasonal variations, noise in image. These factors may reduce detection accuracy. For future studies, multisource images from different seasons and weather conditions will be acquired and used to train the proposed model further, to make sure that the model can be used in more variable conditions. In addition, to apply the model on imagery with larger scales, a sliding-window inference strategy is needed combined with the proposed model.

5. Conclusions

In this study, three representative litchi orchards were selected, and their high-resolution satellite RGB imagery was acquired. Then, individual crown labeling was performed via visual interpretation on the acquired images. On the basis of these data, to address the problems experienced by the YOLOv8n model in litchi crown detection, such as ambiguous label assignment, weak detection ability for canopy centers and cross-scale learning difficulties, this study adopted a priori knowledge, the ELA model and the RFB model to improve and form a new model named CAR-YOLO. Ablation experiments and model comparison experiments were conducted to analyze the effectiveness of the improved strategies. The results on three independent test datasets demonstrated that all of the improvement strategies enhanced the ability of the model to detect individual crowns. Among all of the models, the CAR-YOLO model achieved optimal results, with AP50 values between 0.7069 and 0.8121 and F1 score values between 0.6908 and 0.7761; the YOLOv5n, YOLOv8n and YOLOv11n models obtained moderate results, with AP50 values between 0.6467 and 0.7895 and F1 score values between 0.6350 and 0.7628; and the Fast-RCNN and YOLOv10n models exhibited the worst performance, with AP50 values between 0.4860 and 0.7029 and F1 score values between 0.5265 and 0.6634. This study can provide technical support for litchi planting inventories, yield estimations, and precision management. Furthermore, the proposed model also has the potential to be applied to detect other fruit tree crowns and assist in the forest inventory process.

Author Contributions

Data analysis, methodology, and writing—original draft, T.X.; conceptualization, review and editing, and supervision, P.C.; review and editing, X.L. All authors have read and agreed to the published version of the manuscript.

Funding

This work was supported by the National Research and Development Plan of China (2024YFE0197900), the Innovation Project of LREIS (KPI009) and the Rural Vitalization Strategy Special Fund of Guangdong Province (2025TS-2-5).

Data Availability Statement

The data presented in this study can be request from the corresponding author.

Conflicts of Interest

The authors declare no conflicts of interest.

References

  1. Xie, J.; Jing, T.; Chen, B.; Peng, J.; Zhang, X.; He, P.; Xiao, A.; Lyu, S.; Li, J. Method for segmentation of litchi branches based on the improved DeepLabv3+. Agronomy 2022, 12, 2812. [Google Scholar] [CrossRef]
  2. Li, B.; Lu, H.; Wei, X.; Guan, S.; Zhang, Z.; Zhou, X.; Luo, Y. An improved rotating box detection model for litchi detection in natural dense orchards. Agronomy 2024, 14, 95. [Google Scholar] [CrossRef]
  3. Zhao, H.; Morgenroth, J.; Pearse, G. A systematic review of individual tree crown detection and delineation with convolutional neural networks (CNN). Curr. For. Rep. 2023, 9, 149–170. [Google Scholar] [CrossRef]
  4. Pu, R. Mapping tree species using advanced remote sensing technologies: A state-of-the-art review and perspective. J. Remote Sens. 2021, 2021, 9812624. [Google Scholar] [CrossRef]
  5. Zhang, C.; Marzougui, A.; Sankaran, S. High-resolution satellite imagery applications in crop phenotyping: An overview. Comput. Electron. Agric. 2020, 175, 105584. [Google Scholar] [CrossRef]
  6. Leckie, D.G.; Gougeon, F.A.; Walsworth, N. Stand delineation and composition estimation using semi-automated individual tree crown analysis. Remote Sens. Environ. 2003, 85, 355–369. [Google Scholar] [CrossRef]
  7. Bunting, P.; Lucas, R. The delineation of tree crowns in Australian mixed species forests using hyperspectral compact airborne spectrographic imager (CASI) data. Remote Sens. Environ. 2006, 101, 230–248. [Google Scholar] [CrossRef]
  8. Jing, L.; Hu, B.; Noland, T.; Li, J. An individual tree crown delineation method based on multi-scale segmentation of imagery. ISPRS J. Photogramm. Remote Sens. 2012, 70, 88–98. [Google Scholar] [CrossRef]
  9. Xu, X.; Zhou, Z.; Tang, Y.; Qu, Y. Individual tree crown detection from high spatial resolution imagery using a revised local maximum filtering. Remote Sens. Environ. 2021, 258, 112397. [Google Scholar] [CrossRef]
  10. Zheng, J.; Yuan, S.; Li, W.; Fu, H.; Yu, L.; Huang, J. A review of individual tree crown detection and delineation from optical remote sensing images. arXiv 2024, arXiv:2310.13481. [Google Scholar]
  11. Roth, S.I.; Leiterer, R.; Volpi, M.; Celio, E.; Schaepman, M.E.; Joerg, P.C. Automated detection of individual clove trees for yield quantification in northeastern Madagascar based on multi-spectral satellite data. Remote Sens. Environ. 2019, 221, 144–156. [Google Scholar] [CrossRef]
  12. Wang, Y.; Zhu, X.; Wu, B. Automatic detection of individual oil palm trees from UAV images using HOG features and an SVM classifier. Int. J. Remote Sens. 2019, 40, 7356–7370. [Google Scholar] [CrossRef]
  13. Weinstein, B.G.; Marconi, S.; Bohlman, S.; Zare, A.; White, E. Individual tree-crown detection in RGB imagery using self-supervised deep learning neural networks. Remote Sens. 2020, 11, 1309. [Google Scholar] [CrossRef]
  14. Mo, J.; Lan, Y.; Yang, D.; Wen, F.; Qiu, H.; Chen, X.; Deng, X. Deep learning-based instance segmentation method of litchi canopy from UAV-acquired images. Remote Sens. 2021, 13, 3919. [Google Scholar] [CrossRef]
  15. Wang, X.; Wang, X.; Zhao, Q.; Jiang, P.; Zheng, Y.; Yuan, L.; Yuan, P. LDS-YOLO: A lightweight small object detection method for dead trees from shelter forest. Comput. Electron. Agric. 2022, 198, 107035. [Google Scholar] [CrossRef]
  16. Xiong, Y.; Zhao, Q.; Jiang, P.; Zheng, Y.; Yuan, L.; Yuan, P. Detecting and mapping individual fruit trees in complex natural environments via UAV remote sensing and optimized YOLOv5. IEEE J. Sel. Top. Appl. Earth Obs. Remote Sens. 2024, 17, 7554–7576. [Google Scholar] [CrossRef]
  17. Ren, S.; He, K.; Girshick, R.; Sun, J. Faster R-CNN: Towards real-time object detection with region proposal networks. Adv. Neural Inf. Process. Syst. 2015, 28, 91–99. [Google Scholar] [CrossRef]
  18. He, K.; Gkioxari, G.; Dollár, P.; Girshick, R. Mask R-CNN. In Proceedings of the IEEE International Conference on Computer Vision (ICCV), Venice, Italy, 22–29 October 2017; pp. 2961–2969. [Google Scholar] [CrossRef]
  19. Liu, W.; Anguelov, D.; Erhan, D.; Szegedy, C.; Reed, S.; Fu, C.-Y.; Berg, A.C. SSD: Single shot multibox detector. In Proceedings of the European Conference on Computer Vision (ECCV), Amsterdam, The Netherlands, 11–14 October 2016; pp. 21–37. [Google Scholar]
  20. Wang, Y.; Wang, C.; Zhang, H.; Dong, Y.; Wei, S. Automatic ship detection based on RetinaNet using multi-resolution Gaofen-3 imagery. Remote Sens. 2019, 11, 531. [Google Scholar] [CrossRef]
  21. Vijayakumar, A.; Vairavasundaram, S. YOLO-based object detection models: A review and its applications. Multimed. Tools Appl. 2024, 83, 83535–83574. [Google Scholar] [CrossRef]
  22. Zheng, J.; Fu, H.; Li, W.; Wu, W.; Yu, L.; Yuan, S.; Tao, T.K.W.; Pang, T.K.; Kanniah, K.D. Growing status observation for oil palm trees using unmanned aerial vehicle (UAV) images. ISPRS J. Photogramm. Remote Sens. 2021, 173, 95–121. [Google Scholar] [CrossRef]
  23. Ge, Z.; Liu, S.; Li, Z.; Yoshie, O.; Sun, J. OTA: Optimal transport assignment for object detection. In Proceedings of the IEEE/CVF Conference on Computer Vision and Pattern Recognition (CVPR), Nashville, TN, USA, 20–25 June 2021; pp. 303–312. [Google Scholar]
  24. Lee, S.S.; Lim, L.G.; Palaiahnakote, S.; Cheong, J.X.; Lock, S.M.; Ayub, M.N. Oil palm tree detection in UAV imagery using an enhanced RetinaNet. Comput. Electron. Agric. 2024, 227, 109530. [Google Scholar] [CrossRef]
  25. Liu, X.; Lei, B.; Chen, P.; Zhou, C. Study on remote sensing monitoring and spatial variation of litchi under different management modes. Guangdong Agric. Sci. 2022, 49, 145–154. [Google Scholar]
  26. Gong, J.; Liu, Y.; Chen, W. Land suitability evaluation for development using a matter-element model: A case study in Zengcheng, Guangzhou, China. Land Use Policy 2012, 29, 464–472. [Google Scholar] [CrossRef]
  27. Zhao, F.; Huang, M. Exploring the non-use value of important agricultural heritage system: Case of Lingnan Litchi cultivation system (Zengcheng) in Guangdong, China. Sustainability 2020, 12, 3638. [Google Scholar] [CrossRef]
  28. Li, C.; Li, L.; Jiang, H.; Weng, K.; Geng, Y.; Li, L.; Ke, Z.; Li, Q.; Cheng, M.; Nie, W.; et al. YOLOv6: A single-stage object detection framework for industrial applications. arXiv 2022, arXiv:2209.02976. [Google Scholar] [CrossRef]
  29. Feng, C.; Zhong, Y.; Gao, Y.; Scott, M.R.; Huang, W. TOOD: Task-aligned one-stage object detection. In Proceedings of the IEEE/CVF International Conference on Computer Vision (ICCV), Montreal, QC, Canada, 10–17 October 2021; pp. 3490–3499. [Google Scholar]
  30. Cao, Y.; Chen, K.; Loy, C.C.; Lin, D. Prime sample attention in object detection. In Proceedings of the IEEE/CVF Conference on Computer Vision and Pattern Recognition (CVPR), Seattle, WA, USA, 13–19 June 2020; pp. 11583–11591. [Google Scholar]
  31. Cheng, Z.; Qi, L.; Cheng, Y.; Wu, Y.; Zhang, H. Interlacing orchard canopy separation and assessment using UAV images. Remote Sens. 2020, 12, 767. [Google Scholar] [CrossRef]
  32. Tong, F.; Zhang, Y. Individual tree crown delineation in high resolution aerial RGB imagery using StarDist-based model. Remote Sens. Environ. 2025, 319, 114618. [Google Scholar] [CrossRef]
  33. Wang, G.; Chen, Y.; An, P.; Hong, H.; Hu, J.; Huang, T. UAV-YOLOv8: A small-object-detection model based on improved YOLOv8 for UAV aerial photography scenarios. Sensors 2023, 23, 7190. [Google Scholar] [CrossRef]
  34. Xue, Z.; Xu, R.; Bai, D.; Lin, H. YOLO-tea: A tea disease detection model improved by YOLOv5. Forests 2023, 14, 415. [Google Scholar] [CrossRef]
  35. Xu, W.; Wan, Y. ELA: Efficient local attention for deep convolutional neural networks. arXiv 2024, arXiv:2403.01123. [Google Scholar] [CrossRef]
  36. Liu, S.; Huang, D. Receptive field block net for accurate and fast object detection. In Proceedings of the European Conference on Computer Vision (ECCV), Munich, Germany, 8–14 September 2018; pp. 385–400. [Google Scholar]
  37. Chen, P.; Xia, T.; Yang, G. A new strategy for weed detection in maize fields. Eur. J. Agron. 2024, 159, 127289. [Google Scholar] [CrossRef]
  38. Zhu, B.; Wang, J.; Zhang, J.; Zong, F.; Liu, S.; Li, Z.; Sun, J. AutoAssign: Differentiable label assignment for dense object detection. arXiv 2020, arXiv:2007.03496. [Google Scholar] [CrossRef]
  39. Chen, H.; Su, L.; Shu, R.; Li, T.; Yin, F. EMB-YOLO: A lightweight object detection algorithm for isolation switch state detection. Appl. Sci. 2024, 14, 9779. [Google Scholar] [CrossRef]
  40. Sun, P.; Zhang, R.; Jiang, Y.; Kong, T.; Xu, C.; Zhan, W.; Luo, P. Sparse R-CNN: End-to-end object detection with learnable proposals. In Proceedings of the IEEE/CVF Conference on Computer Vision and Pattern Recognition (CVPR), Nashville, TN, USA, 20–25 June 2021; pp. 14454–14463. [Google Scholar]
  41. Wang, A.; Chen, H.; Liu, L.; Chen, K.; Lin, Z.; Han, J.; Ding, G. YOLOv10: Real-time end-to-end object detection. Adv. Neural Inf. Process. Syst. 2024, 37, 107984–108011. [Google Scholar]
  42. Khanam, R.; Hussain, M. YOLOv11: An overview of the key architectural enhancements. arXiv 2024, arXiv:2410.17725. [Google Scholar] [CrossRef]
Figure 1. Spatial location of the study area. (a) Zengcheng District; (b) Litchi cultural expo orchard; (c) Sanzhen orchard; and (d) Mingzhu orchard.
Agronomy 15 02439 g001
Figure 2. Structure of the proposed CAR-YOLO model and its improvements over the original YOLOv8n (the frame boxes highlighted in color are improved).
Agronomy 15 02439 g002
Figure 3. Effect of decreasing sample ambiguity before and after using a priori knowledge with task assignment learning (TAL). (a) RGB image; (b) boundary box (BBbox) of two overlapped litchi trees; (c) original TAL method had ambiguous samples which matches both ground truth boxes; (d) modify TAL by combing a prior information had no ambiguous samples; (e) original TAL forcibly assigns ambiguous samples to a single ground truth box based on the maximum intersection-over-union (IoU) values, leading to a reduction in the number of positive training samples for other ground truths.
Agronomy 15 02439 g003
Figure 4. Structure of the efficient location attention (ELA) module.
Agronomy 15 02439 g004
Figure 5. Difference between Spatial pyramid pooling-fast (SPPF) (a) and receptive field block (RFB) (b).
Agronomy 15 02439 g005
Figure 6. A visual example for the performance of different models in terms of detecting litchi tree crowns.
Agronomy 15 02439 g006
Figure 7. Performance of the different models in terms of detecting litchi tree crowns.
Agronomy 15 02439 g007
Figure 8. Sensitivity analysis of parameter k in terms of the performance of the proposed CAR-YOLO model. (a) Dataset from the Litchi cultural expo orchard; (b) dataset from the Mingzhu orchard; and (c) dataset from the Sanzhen orchard.
Agronomy 15 02439 g008
Table 1. Statistical analysis results for individual crowns from different litchi orchards.
OrchardCountIndividual Tree CrownsCoverage
(%)
Density
(Trees/100 m2)
Max.
(m2)
Min.
(m2)
Mean
(m2)
Std. (m2)
Litchi cultural expo orchard176474.654.3427.2111.5244.911.65
Sanzhen orchard3131131.185.2825.3211.7947.971.89
Mingzhu orchard1850211.663.7331.1415.9153.431.72
Table 2. Results of the ablation experiments under different scenarios.
DatasetsImprovement StrategyEvaluation Indicator
G-TALC2ELARFBPrecisionRecallAP50F1
Litchi cultural expo orchardOriginal model0.77530.74340.77830.7590
0.78780.74470.78900.7657
0.79550.73350.79690.7632
0.79200.72850.79690.7589
0.74990.74220.78460.7460
0.79780.73970.80770.7677
0.79050.75180.80870.7706
0.80030.72370.80800.7601
Mingzhu orchardOriginal model0.66820.66830.67920.6683
0.71500.63450.69750.6724
0.71100.64110.70150.6743
0.71200.64780.69680.6784
0.69690.65020.68420.6728
0.70240.65140.69260.6759
0.70800.65620.69390.6811
0.70670.67550.70690.6908
Sanzhen orchardOriginal model0.78440.74230.78950.7628
0.78000.76650.80420.7732
0.80710.75990.81110.7828
0.78910.77780.81790.7834
0.77480.75400.81270.7643
0.78410.75400.80940.7688
0.77640.75770.81020.7669
0.78500.76730.81210.7761
√ indicates that the corresponding improvement strategy was adopted; G-TAL represents that a priori knowledge was used; C2ELA means that an efficient location attention module was used; and RFB indicates that a receptive field block module was used.
Disclaimer/Publisher’s Note: The statements, opinions and data contained in all publications are solely those of the individual author(s) and contributor(s) and not of MDPI and/or the editor(s). MDPI and/or the editor(s) disclaim responsibility for any injury to people or property resulting from any ideas, methods, instructions or products referred to in the content.