Article

Assessment of the Plant Growth-Promoting Potential of Three Pseudomonas and Pantoea Isolates to Promote Pepper Growth

1
Department of Plant Protection, College of Agriculture and Food, Qassim University, Buraydah 51452, Saudi Arabia
2
Department of Plant Production, College of Agriculture and Food, Qassim University, Buraydah 51452, Saudi Arabia
3
Department of Horticulture, University of Khartoum, Khartoum North, Shambat 13314, Sudan
4
Department of Environment and Natural Resources, College of Agriculture and Food, Qassim University, Buraydah 51452, Saudi Arabia
5
Soil Fertility and Microbiology Department, Desert Research Center (DRC), Cairo 11753, Egypt
*
Author to whom correspondence should be addressed.
Agronomy 2025, 15(10), 2419; https://doi.org/10.3390/agronomy15102419
Submission received: 9 September 2025 / Revised: 12 October 2025 / Accepted: 15 October 2025 / Published: 18 October 2025

Abstract

Plant growth-promoting bacteria (PGPB) have a wide range of applications in agriculture and environmental management. They act as biostimulants and biofertilizers to enhance crop quality and yields in a more sustainable way. The present research aimed at isolating three active strains from the arid rhizosphere soil to act as biofertilizer. The plant growth-promoting features were evaluated in vitro and their implementation on pepper growth and yield were assessed and measured. Regarding IAA and ammonia production, the three designated isolates (P21, P22-1 and P58) showed patterns of high IAA production, producing 154.47 µg/mL, 155.03 µg/mL, and 188.65 µg/mL, respectively. Furthermore, considerable amounts of ammonia were detected in the supernatant of peptone water medium after 72 h of growth. Isolate P21 produced the maximum amount and generated 17.38 μmol/mL, whereas both P22-1 and P58 displayed lower amounts (15.47 and 15.92, respectively), without significant differences. P-solubilization efficacy calculated 18.7% (isolate P21), 64% (isolate P22-2), and 54% (isolate P58) when compared with un-inoculated medium. The molecular identification by 16S rRNA displayed that the three isolates belonged to Pseudomonas alkylphenolica strain P21 (PX257452), Pantoea agglomerans strain P22-1 (PX257453), and Pantoea brenneri strain P58 (PX257454). Applying the selected strains with sweet pepper in the presence of rock phosphate (RP) was assessed under greenhouse conditions. Three treatments (adding bacterial suspension at 0, 10 and 20 days after transplanting) from P21, P22-1, and P58 strains revealed that P21(3), P21(2), P22-1(3), and P58(3) treatments are considered the most promising treatments related to plant height, root length, leaf area, number of leaves per plant, leaf P-uptake, and stem P-uptake in addition to total plant P-uptake. In addition, the PCA biplot showed that MSP (mono-super phosphate), P22-1(3), and P58(3) are closely associated with high phosphorus uptake, indicating their effectiveness in enhancing phosphorus absorption by solubilizing insoluble forms. Eventually, PGPB will help the environment by improving soil fertility and structure, decreasing the need for toxic chemical fertilizers, and improving ecosystem health overall.

1. Introduction

Plant growth-promoting rhizobacteria (PGPR) are helpful soil microorganisms that live in plant roots and improve plant health and growth in several ways. This is accomplished by providing nutrients (such as phosphate, potassium, and nitrogen) to plants, generating plant hormones, enhancing nutrient absorption, and protecting against infections by manufacturing antibiotics or inducing resistance [1,2,3]. PGPR are thought to be a sustainable substitute for chemical fertilizers and can aid plants in surviving environmental stressors. They have the ability to fix nitrogen from the atmosphere and solubilize phosphorus, potassium and other minerals so that plants can absorb them. PGPR generate plant hormones (phytohormones) that promote root growth, such as increased root branching and hair creation, which increases overall nutrient and water intake [3,4,5,6].
They safeguard plants from diseases by competing for limited nutrition, creating antibacterial and other antifungal chemicals to inhibit pathogen activity, and triggering a plant’s defensive systems, making uninfected portions of the plant more resistant to infections (Inducing Systemic Resistance) [2,4,7,8,9]. They are utilized in sustainable agriculture as biofertilizers to organically deliver nutrients and increase soil fertility [10,11]; biocontrol agents are used to manage plant diseases while reducing the demand for conventional pesticides [9,12,13,14,15,16,17]. Furthermore, they are used in stress management to enhance plant resistance to unfavorable environmental circumstances [18,19,20,21,22,23,24,25,26].
Phosphate (P) deficit in soil can have a significant impact on pepper plants since it is essential for root growth, photosynthetic energy transfer, and fruit and flower production. Small leaves, chlorotic or purple-tinged foliage, stunted development, and poor fruit production are all signs of a deficiency [27]. Sweet pepper (Capsicum annuum L.) is considered one of the world’s most essential and popular vegetables based on its health benefits. Sweet pepper is commonly grown intensively in greenhouses and is considered a significant agricultural crop for both organic and conventional farmers. Bell or sweet is grown in most countries around the world and, together with tomatoes and cucumbers, it is one of the three main commercial vegetable crops cultivated in Saudi Arabia [28,29]. The total greenhouse area for sweet pepper production in 2020 was 702.6 hectares, producing 68,186.10 tons [30]. It is a key greenhouse cash crop mostly planted for sale in markets for fresh vegetables because of its delicious flavor, rich ascorbic acid, and mineral abundance. [31]. Sweet pepper fruit is a great source of essential nutrients, such as minerals (including calcium and iron), carotenoids, vitamins A, C, and E, and other secondary plant substances [32]. Its consumption is increasing and may represent an important source of vitamins for the world population as a vitamin-rich vegetable and a leader in provitamin A (carotene) and vitamin C content [33,34]. Furthermore, pepper also has a lot of potassium, sodium, phosphorus, iron, and magnesium salts, and is high in vitamins P, B1, and B2 [35].
Chemical fertilizers are commonly used in order to improve soil fertility and provide plants with the nutrients they need to produce more fruitful harvests. However, unfavorable weather conditions and/or excessive fertilizer usage can contaminate soils, surface water, groundwater, and the environment with dangerous substances [36,37,38]. The importance of organic farming has risen in recent years to protect the environment and public health. Adding plant growth-promoting rhizobacteria to the soil has many benefits. By colonizing the rhizosphere or plant tissues, these bacteria create biofilms that enhance nutrient cycling, boost nutrient bioavailability, and activate defense mechanisms in plants. PGPB provides a sustainable substitute for chemical inputs by using less fertilizer and pesticides and increasing crop output and soil health [39,40].
The use of biofertilizers enhances root elongation, root and shoot dry weight, stem diameter, and yield. Additionally, biofertilizers have considerable favorable benefits on vegetative development, including shoot dry weight, shoot fresh weight, shoot length, fresh and dry root weights, and root length; yield of pepper plants was reported and documented [41,42,43,44,45]. Furthermore, the free living PGPR has been employed to deliver critical nutrients to plants, which has increased the growth and development of vegetables, thereby, increasing leaf chlorophyll content in sweet pepper [46,47]. Pepper plants benefit from plant growth-promoting Bacteria (PGPB) because they fix nitrogen, solubilize phosphate, produce plant hormones including IAA, and produce antifungal chemicals that help prevent disease. Numerous bacterial species, such as Serratia, Arthrobacter, Pseudomonas, and Bacillus, can stimulate pepper growth. Utilizing these advantageous microorganisms can increase the height, biomass, leaf area, and production of pepper plants, particularly in low-fertility soils or under stressful circumstances such as drought and heat [48,49]. This study aimed to perform the following: (1) Isolate a new species from the rhizosphere area of an arid region as a plant growth-promoting bacteria (PGPB); (2) Identify the promising isolates by the 16S rRNA at the molecular level; (3) Evaluate their characteristics as a plant growth-promoting bacteria in vitro; (4) Apply the promising isolates under greenhouse conditions in vivo with pepper plants; (5) Assess the correlation between the measured traits.

2. Materials and Methods

2.1. Bacterial Isolation and Culture Conditions

Three bacterial isolates (P58, P21, and P22-1) were isolated with other bacteria (approximately 58 isolates) from the rhizosphere arid soil of Alfalfa crop growing in the Agricultural Research and Experimental Station (26°17′46.7″ N, 43°47′12.3″ E—Qassim University) in Qassim region, Saudi Arabia, according to the serial-dilution method [50] using nutrient agar (NA) medium. These isolates are maintained and regularly grown on/in nutrient agar/broth for 1–2 days at 30 °C. In addition, they were chosen from other isolated bacteria for the current research work based on their lab activity and features as biofertilizers.

2.2. PGP Features In Vitro

The selected isolates were evaluated for their plant growth-promoting activities in-lab. Nutrient broth (NB) medium containing 0.2% L-tryptophan was used to quantify the indole acetic acid (IAA) and its derivatives production by growing each strain (100 µL from overnight growing culture with an optical density (OD600) of 0.8 was used to inoculate 25 mL medium) for 7 days in an incubator shaker at 30 °C and 170 rpm. Samples (one millimeter) were withdrawn at 1, 2, 3, 4, and 7 days and stored at −20 °C. According to Gang et al. [51], IAA was measured by mixing 100 µL from culture filtrates (centrifugated at 10,000 rpm for 5 min) with 100 µL from Salkowaski reagent (35% HClO4 and 0.5 M FeCl3) and incubated for 30 min at room temperature in the dark to develop a pink color. The developed color intensity was assessed spectrophotometrically at 530 nm (using a microplate reader, EPOCH2TS, BioTek, Winooski, VT, USA) in the presence of a standard curve from IAA and uninoculated NB medium. Moreover, the fermented broth (25 mL) of P58 culture grown in NB, supported with 0.2% L-tryptophan at 30 °C and 170 rpm for 72 h, was filtered using filter paper (Whatman No.1) and a 0.45 µm syringe filter. HPLC-FLD analysis was applied with the following conditions: 1220 infinity HPLC (Agilent, Santa Clara, CA, USA), Column (C8, 250 mm × 4.6), excitation 282 nm and Emission 360 nm, Gradient elution consists of (A) acetonitrile 60%, (B) water 40% (PH of 3.8), for 25 min. A total of 20 µL of the sample was injected for IAA detection.
Regarding phosphate solubilization, each isolate with fresh growth on the NA medium was inoculated on NBRIP agar [52] and clear zones around growing colonies were followed and indicated as positive in phosphate solubilization. The efficiency in P-solubilization was evaluated in NBRIP-liquid medium (100 µL from overnight growing culture with an optical density (OD600) of 0.8 was used to inoculate 25 mL medium) at days 1, 2, 3, 4, and 7; then, the absorbance was monitored in a microplate reader at 420 nm, and a drop in absorption values indicated P-solubilization [53].
Ammonia production by the three isolates was assessed by growing each one in peptone water medium (100 µL from overnight growing culture with an optical density (OD600) of 0.8 was used to inoculate 25 mL medium) for 3 days at 30 °C and 170 rpm. One volume (20 µL) from the culture supernatant (centrifugated for 5 min at 10,000 rpm) was mixed with 180 µL from Nessler’s reagent in a 96-well plate reader. The development of a yellow–brown color indicated the excellent outcome of ammonia formation. A spectrophotometer (EPOCH2TS, BioTek, Winooski, VT, USA) was used to detect ammonia production at 450 nm, using a standard curve of 0.1–20 μmol/mL from ammonium sulfate [54].

2.3. Bacterial Identification and Phylogenetic Tree

The total DNA was extracted from the growing bacterial cells as described by Cook and Meyers [55]. The 16S rRNA region was amplified through PCR using DreamTaq PCR Master Mixes (Cat. No. K1081, ThermoFisher Scientific, Waltham, MA, USA). ssThe general primers (27F, 5′ AGAGTTTGATCATGGCTCAG 3′ -and 1492R, 5′ TACGGTTACCTTGTTACGACTT 3′) were implemented and the generated products were detected by electrophoresis and sequenced by Macrogen company (Seoul, Republic of Korea). The obtained sequences were assembled by BioEdit software (v7.2) and submitted to GenBank for accession numbers. The sequences were deposited under the following accession numbers: PX257452, PX257453, and PX257454. The designated sequences were subjected to phylogenetic tree construction by MEGA 11 software [56] according to the following parameters: Tamura–Nei model with nearest-neighbor interchange (NNI), bootstrap method, and Maximum Likelihood.

2.4. Plant Experiment on Pepper

The greenhouse experiment was conducted at the experimental demonstration farm (latitude 26–27° N, longitude 44–45° E, altitude 725 m above sea level), College of Agriculture and Food, Qassim University, Saudi Arabia. The effects of the three-isolated PGPR as biofertilizers in the presence of rock phosphate were examined with respect to phosphate solubilization and pepper plant vegetative development. Table 1 displays the properties of the water and soil utilized in the experiment.
Pepper was fertilized in recommended doses of NPK as mineral fertilizers as follows: 240 kg N/ha as 520 kg urea (46% N), 240 kg K2O/ha as 480 kg potassium sulfate (48% K2O), and 70 kg P2O5/ha as 240 kg rock phosphate (29% P2O5) or 378 kg mono superphosphate (18.5% P2O5) as control treatment. Mono-super phosphate and rock phosphate were added to pepper pots once before transplanting, while four equal amounts of urea and potassium sulfate were added (before transplantation, as well as after 2, 4, and 6 weeks later).
Eleven fertilization treatments (each treatment contained three replicates with twelve seedlings in each replicate) were applied with pepper plant and involved rock phosphate (RP, T1) as a negative control, mono-super phosphate (MSP, T2) as a positive control, and RP + strain P58 (P58 added once, T3), RP + P58 (P58 added twice, T4), RP + strain P58 (P58 added thrice, T5), RP + strain P21 (P21 added once, T6), RP + strain P21 (P21 added twice, T7), RP + strain P21 (P21 added thrice, T8), RP + strain P22-1 (P22-1 added once, T9), RP + strain P22-1 (P22-1 added twice, T10), and RP + strain P22-1 (P22-1 added thrice, T11) were implemented at 0, 10, and 20 days from transplanting to evaluate the number of added inoculums on pepper growth parameters, respectively. Each pot’s soil was treated with rock phosphate and mono-super phosphate (30 cm long by 30 cm diameter filled with 20.7 kg of sandy soil) before transplanting at a rate of 4.8g of MSP and 7.5 g of RP. The bacterial inoculum was prepared by growing each isolate (one mL from stock culture) in 200 mL NB medium for 48 h at 30 °C and 170 rpm. Then, glucose sugar (2%) was added to the inoculum as a primary carbon source.
The seedlings of pepper hybrid cultivar were purchased from the Saudi United Fertilizers Company (Jeddah, Saudi Arabia). Then, using a fully randomized block design with three replicates, the seedlings were moved into pots within the greenhouse. The average temperatures as an optimum temperature for pepper growth at day and night in greenhouses were 26/19 ± 1 °C, relative humidity of 75 ± 2%, and photosynthetic active radiation (PAR) flux density reached 400 μmol m−2 s−1, respectively, as documented by Al-Harbi et al. [29].

2.5. Plant Traits Measurements

After 30 DAT (days after transplanting) and 45 DAT, growth and morphology characteristics of pepper seedlings were investigated and recorded. Hypocotyl length (cm) from the basal part to cotyledonary node, shoot length (cm) from the basal part to apical point, and first internode length (cm) between the cotyledonary node and the first true leaf were assessed and recorded. Additionally, stem diameter at 1 cm below the cotyledonary node by a digital caliper, root length (RL, cm), and leaf area per plant (LA, cm2) using a processing technique (ImageJ software, 1.54g) were evaluated and cited. Number of leaves per plant, fresh weight of shoots (gm), and dry weight (gm) after 72 h of drying at 70 °C using an electronic balance were recorded. Moreover, leaf dry matter percentage (leaf DM), stem dry matter percentage (stem DM), and root dry matter percentage (root DM) were assessed and determined. Seedling index = (stem diameter/shoot length) × plant dry weight was calculated and chlorophyll was measured by SPAD. Otherwise, the methods of Hunt et al. [60] and Evans [61] were used to estimate the relative growth rate (RGR) (mg g−1 d−1) by applying the following equation:
RGR   = L n   W 2   L n   W 1 T 2   T 1 ( m g g 1 d 1 )
Ln: logarithm of the natural base, W1: dry weight of the plant at the beginning of the period T1. W2: dry weight of the plant at the end of period T2. W1 and W2 are the total DW (mg/plant).
On the other hand, net assimilation rate (NAR) (mg cm−2 d−1) was quantified by the following equation as mentioned by Evans [61] and Hunt et al. [60].
NAR = W 2 W 1 T 2 T 1 × L n   L A 2 L n   L A L A 2   L A 1 ( m g c m 2 d 1 )
where W1: the plant dry weight at the beginning of period T1. W2: reflects the plant dry weight at the beginning of period T2. LA1: the plant leaf area at the beginning of period T1. Ln: logarithm of the natural base. LA2: leaf area of the plant at the beginning of period T2.

2.6. Statistical Analysis, PCA and Heatmap

Duncan’s multiple range test was used for statistical analysis in order to compare the means at the significant level (p < 0.05) [62]. A linear mixed model was used in which bacteria isolates were regarded as random factors, while concentrations were considered as fixed factors. In order to confirm that the variables were normal, the Shapiro–Wilk test was used prior to principal component analysis (PCA). Also, Bartlett’s sphericity test as well as the Kaiser–Meyer–Olkin (KMO) test were used. The PCA was performed using XLSTAT software version 2019 [63]. A heatmap (HM) was executed to define the relationships between various plant traits and treatments by XLSTAT software.

3. Results

3.1. Assessment of Bacterial PGP In Vitro

Under the optimum lab conditions, the three isolates were evaluated for their IAA, its derivatives, and production. Isolate P21 displayed gradually increasing increments in IAA yield and reached the maximum production (154.47 µg/mL) after 7 days from incubation in NB medium supplied with L-tryptophane (Figure 1). In addition, isolate P22-1 generated the uppermost value of IAA (155.03 µg/mL) after 3 days, whereas the superior production from isolate P58 was seen after 2 days of incubation and recorded as 188.65 µg/mL, then started to decrease without significant differences.
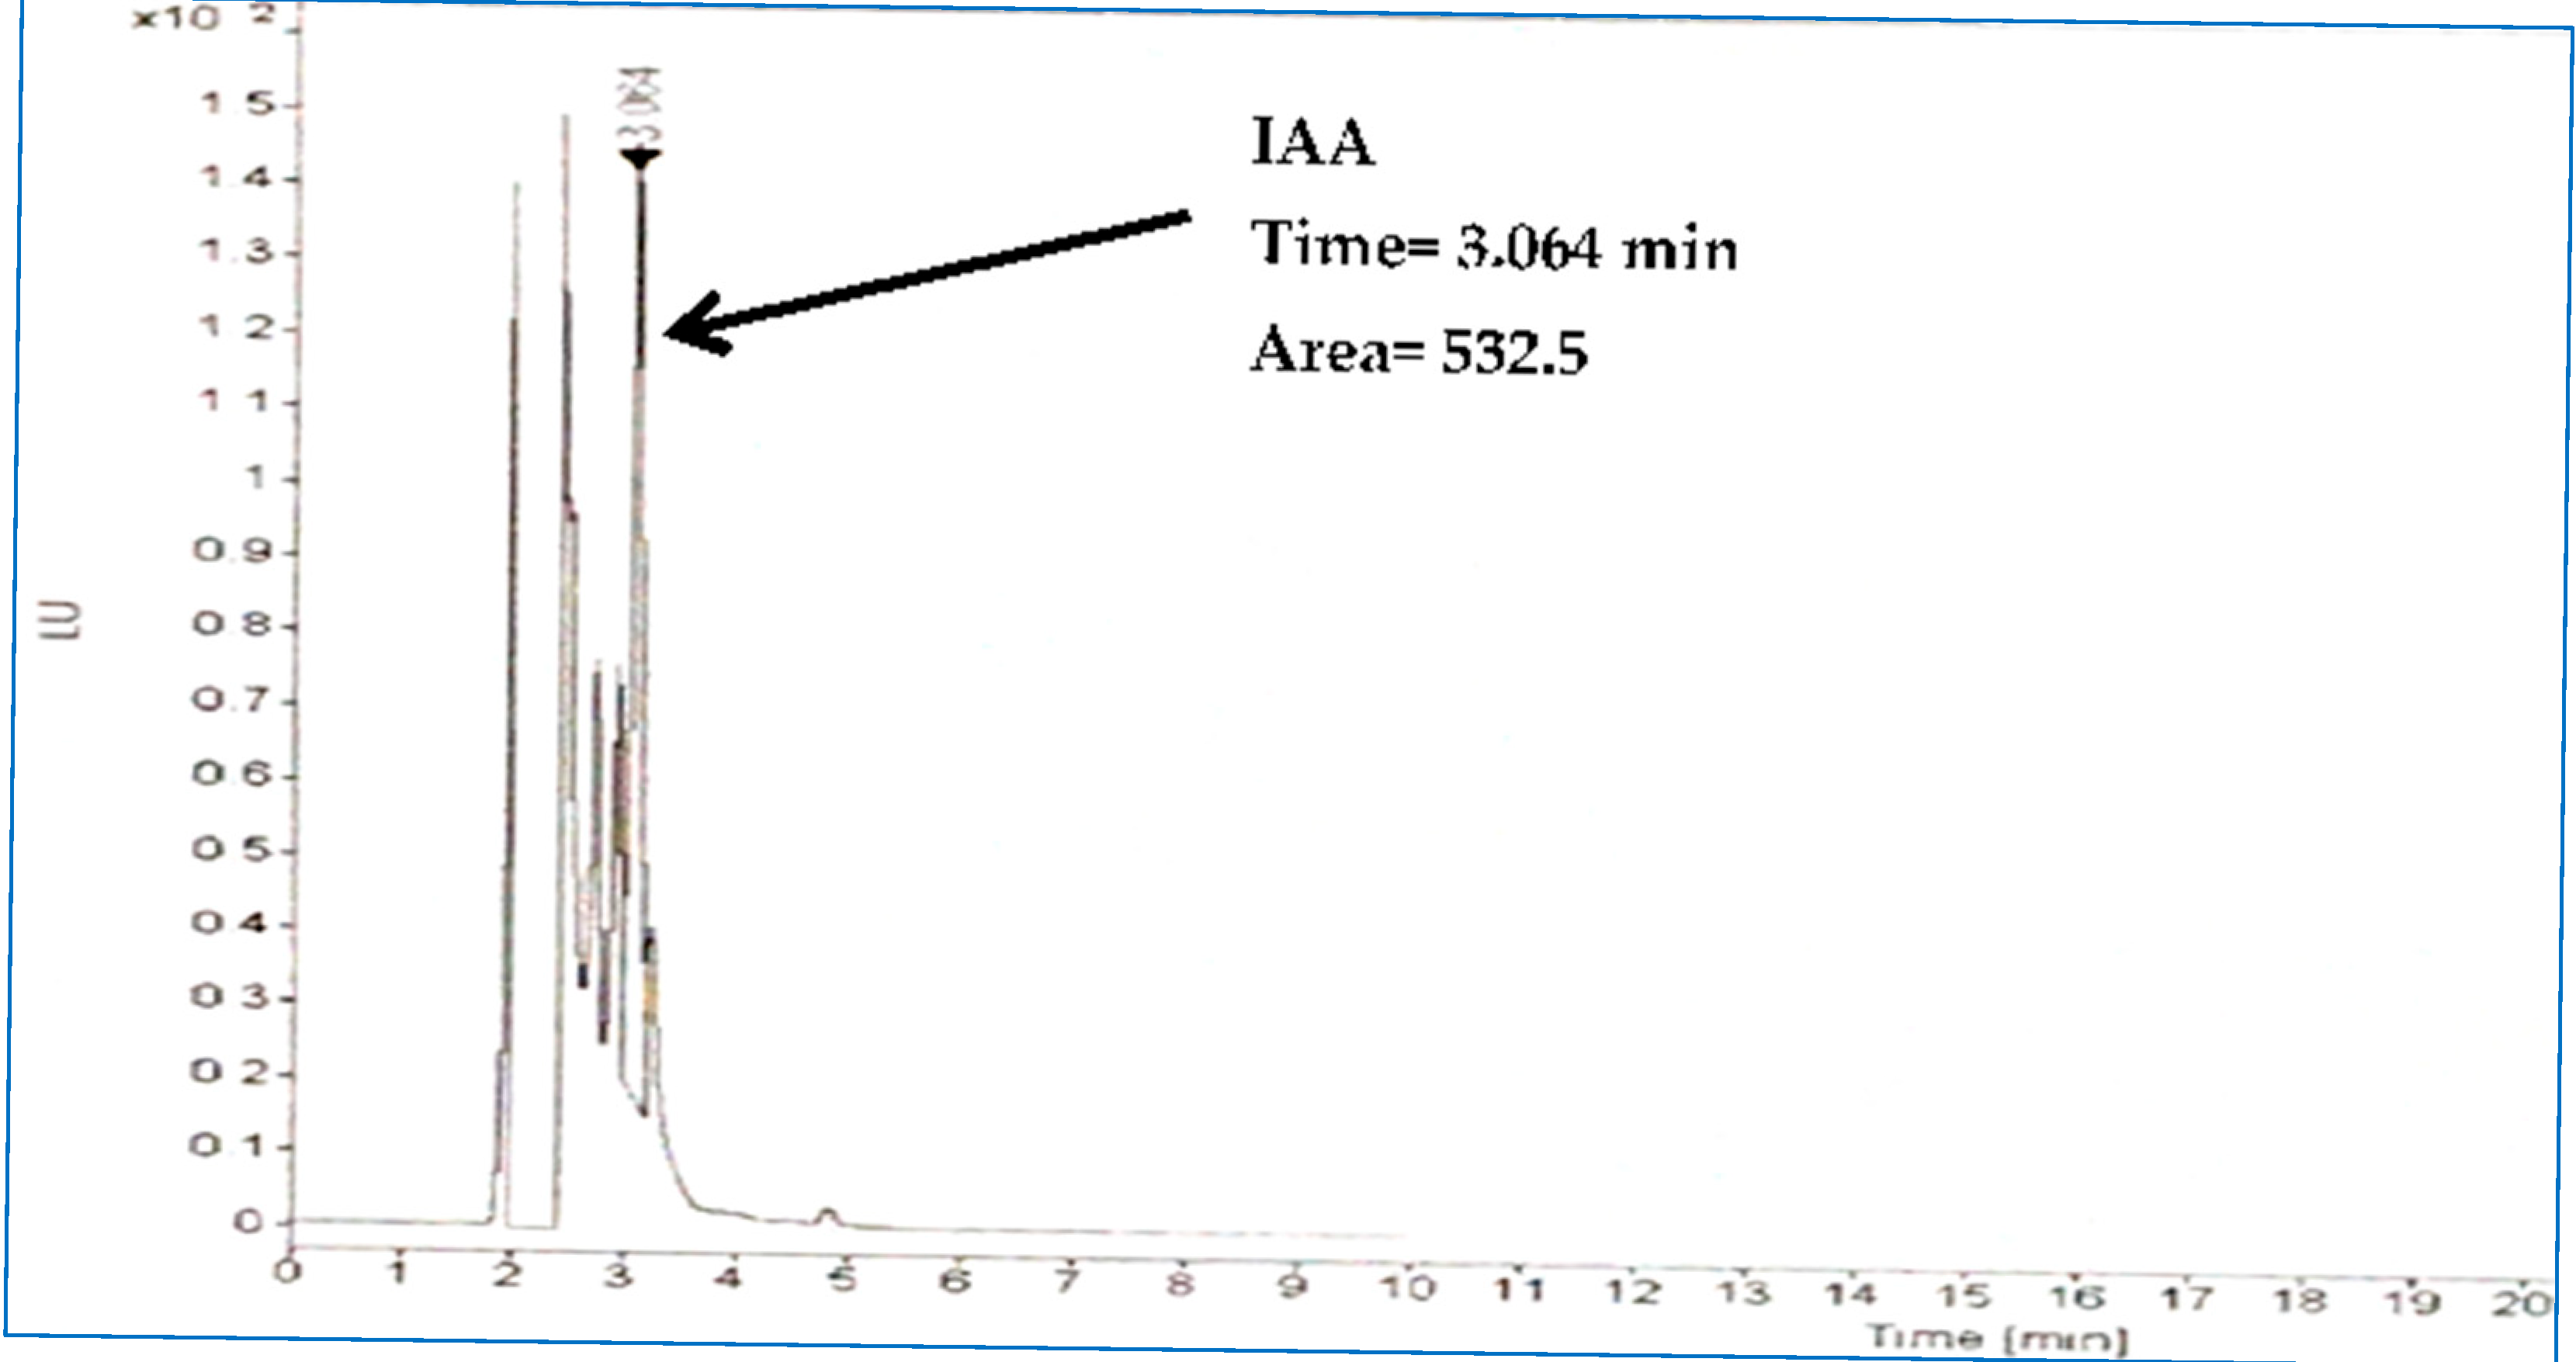
The growing filtrate of P58 isolate (the highest IAA producer) was extracted and subjected to HPLC analysis to detect IAA presence. At a retention time of 3.06 min, a significant peak with an area of 532.5 was found in the filtrate reflecting IAA production (Figure 2). This peak is similar to the standard peak run from the synthetic IAA.
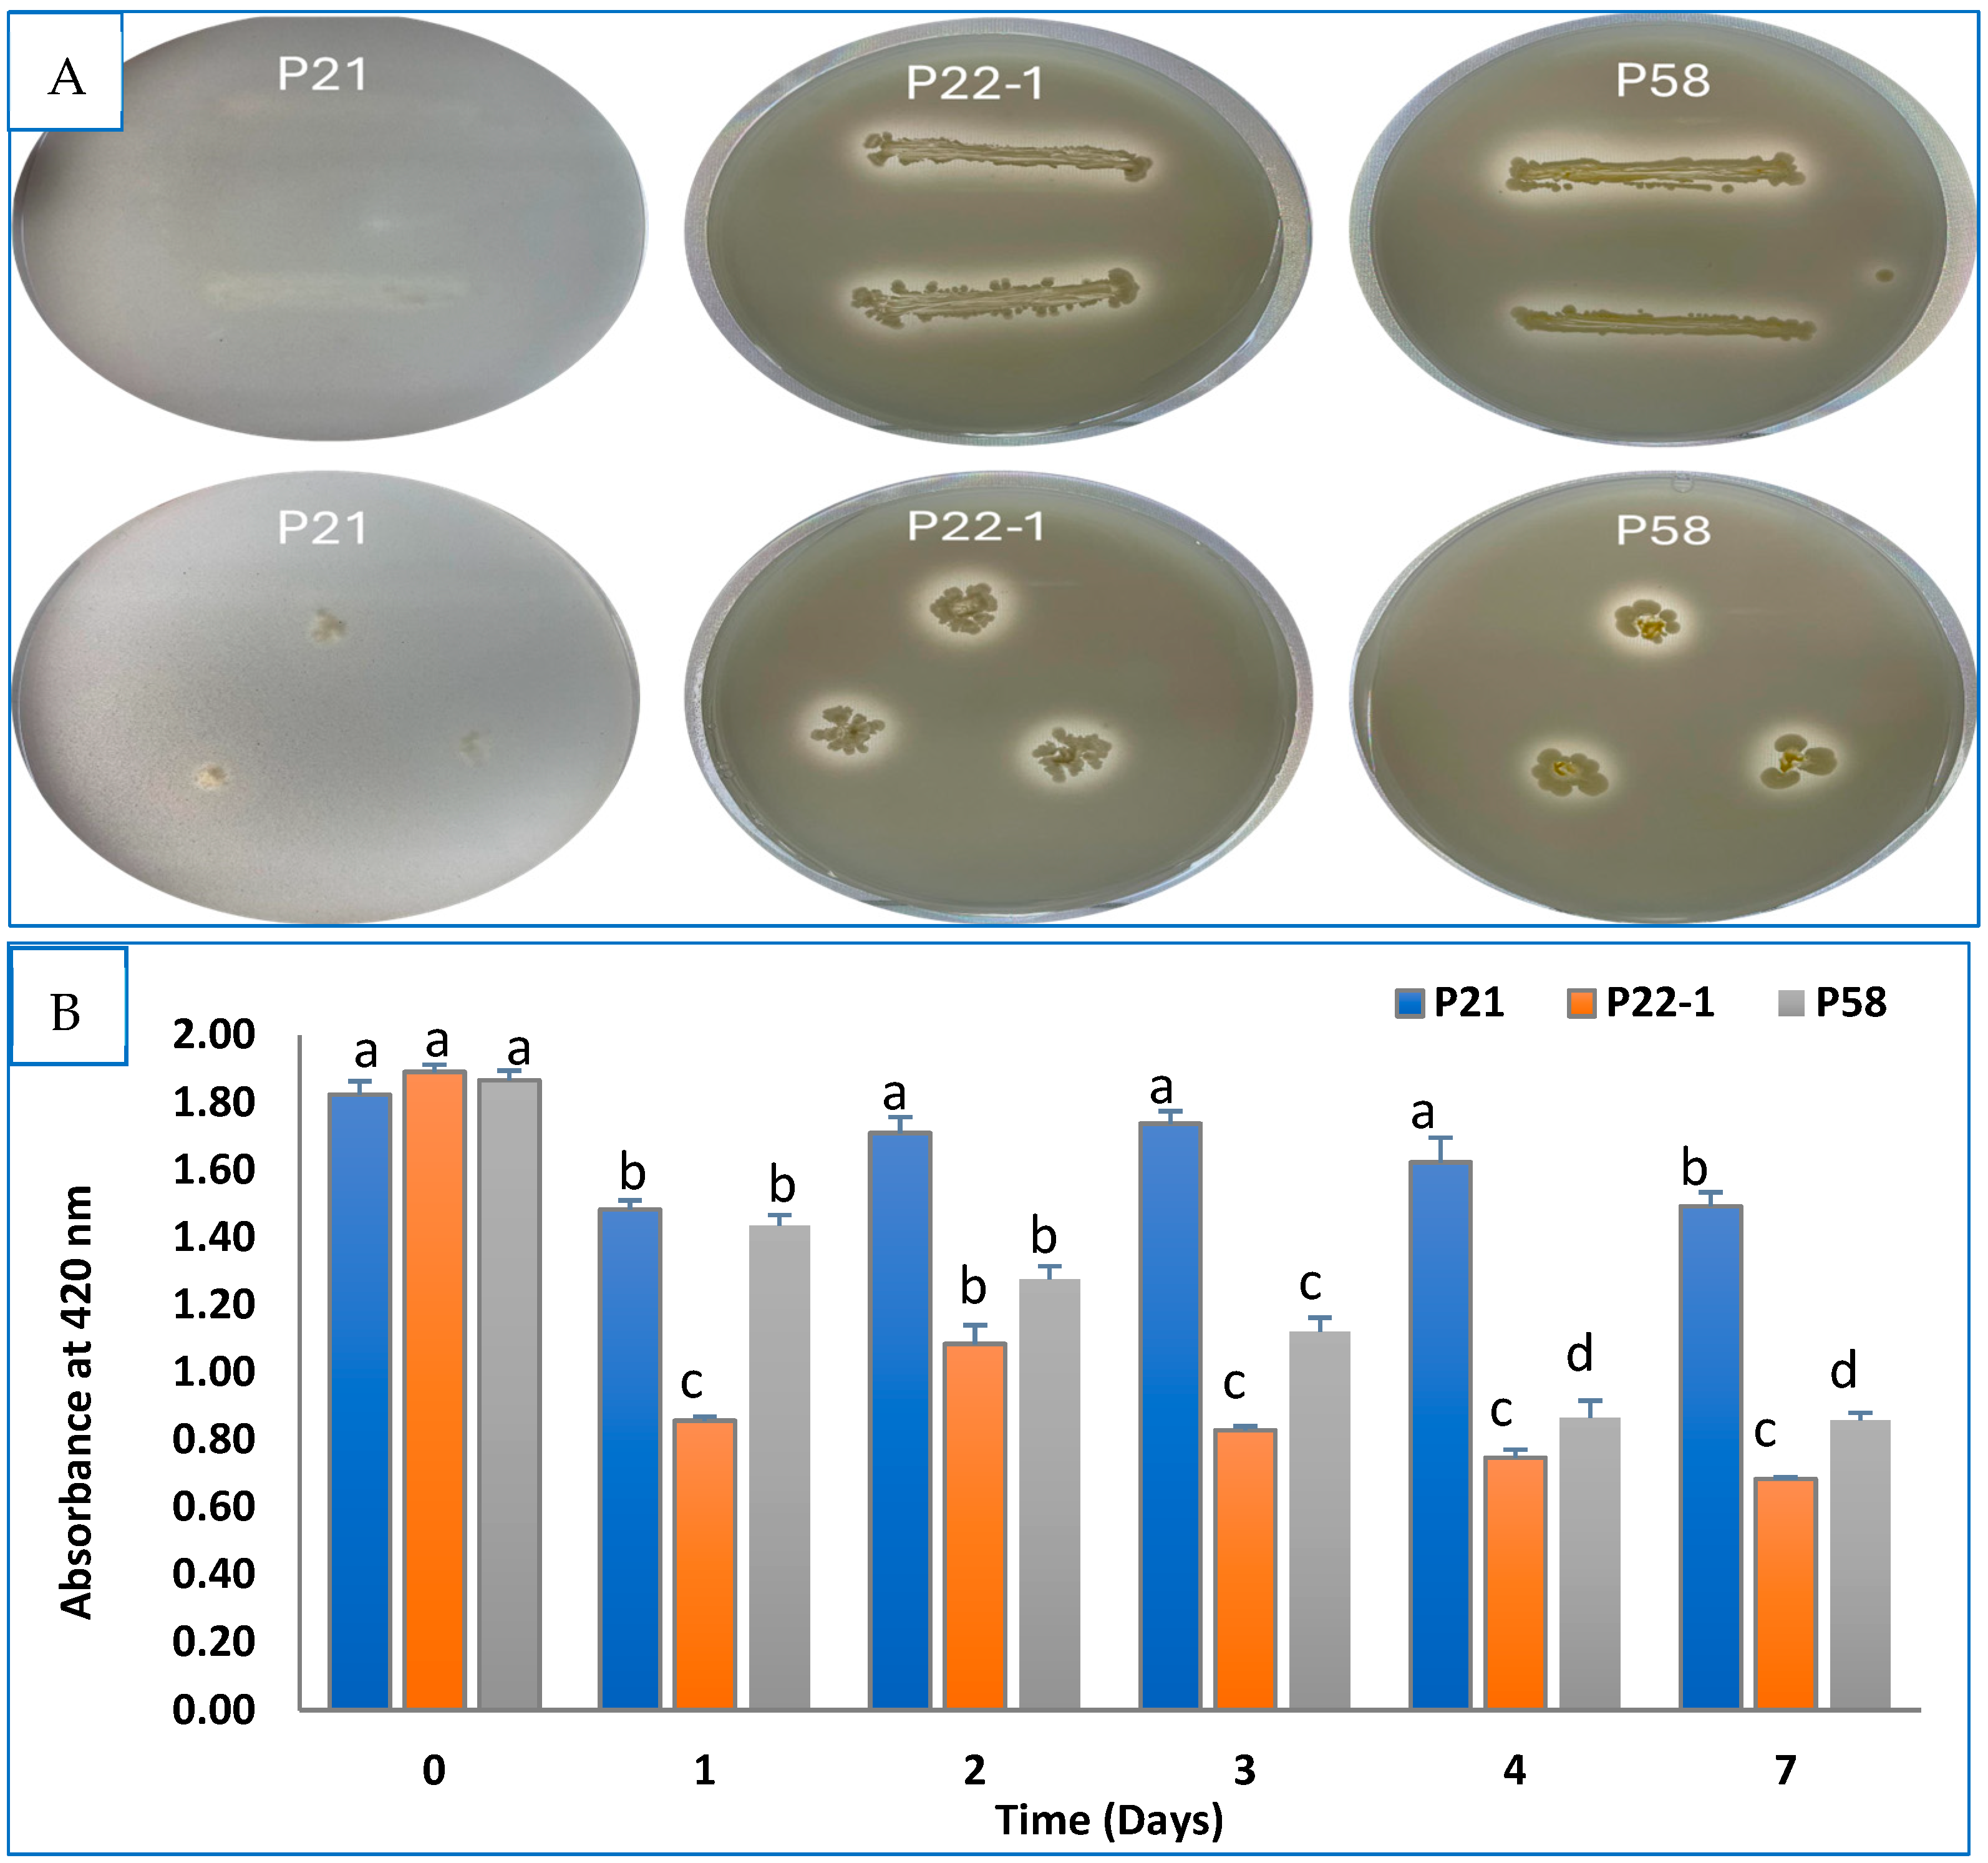
Regarding P-solubilization, the ability of the three isolates to dissolve inorganic phosphate was investigated by qualitative and quantitative methods. Two isolates (P22-1 and P58) were cultured on NBRIP agar medium and showed a clear halo zone around the growing cells (Figure 3A), reflecting their phosphate-solubilizing activity. Otherwise, isolate P21 showed low dissolving ability coupled with a faint halo around the growing cells. Furthermore, for solubilization efficiency, isolate P21 exhibited minimum efficiency (18.7%) after 24 h (Figure 3B), whereas isolate P22-1 revealed maximum P-activity with simultaneous efficiency of 64% after 7 days. Moreover, isolate P58 had efficacy measured at 54% when compared with un-inoculated medium.
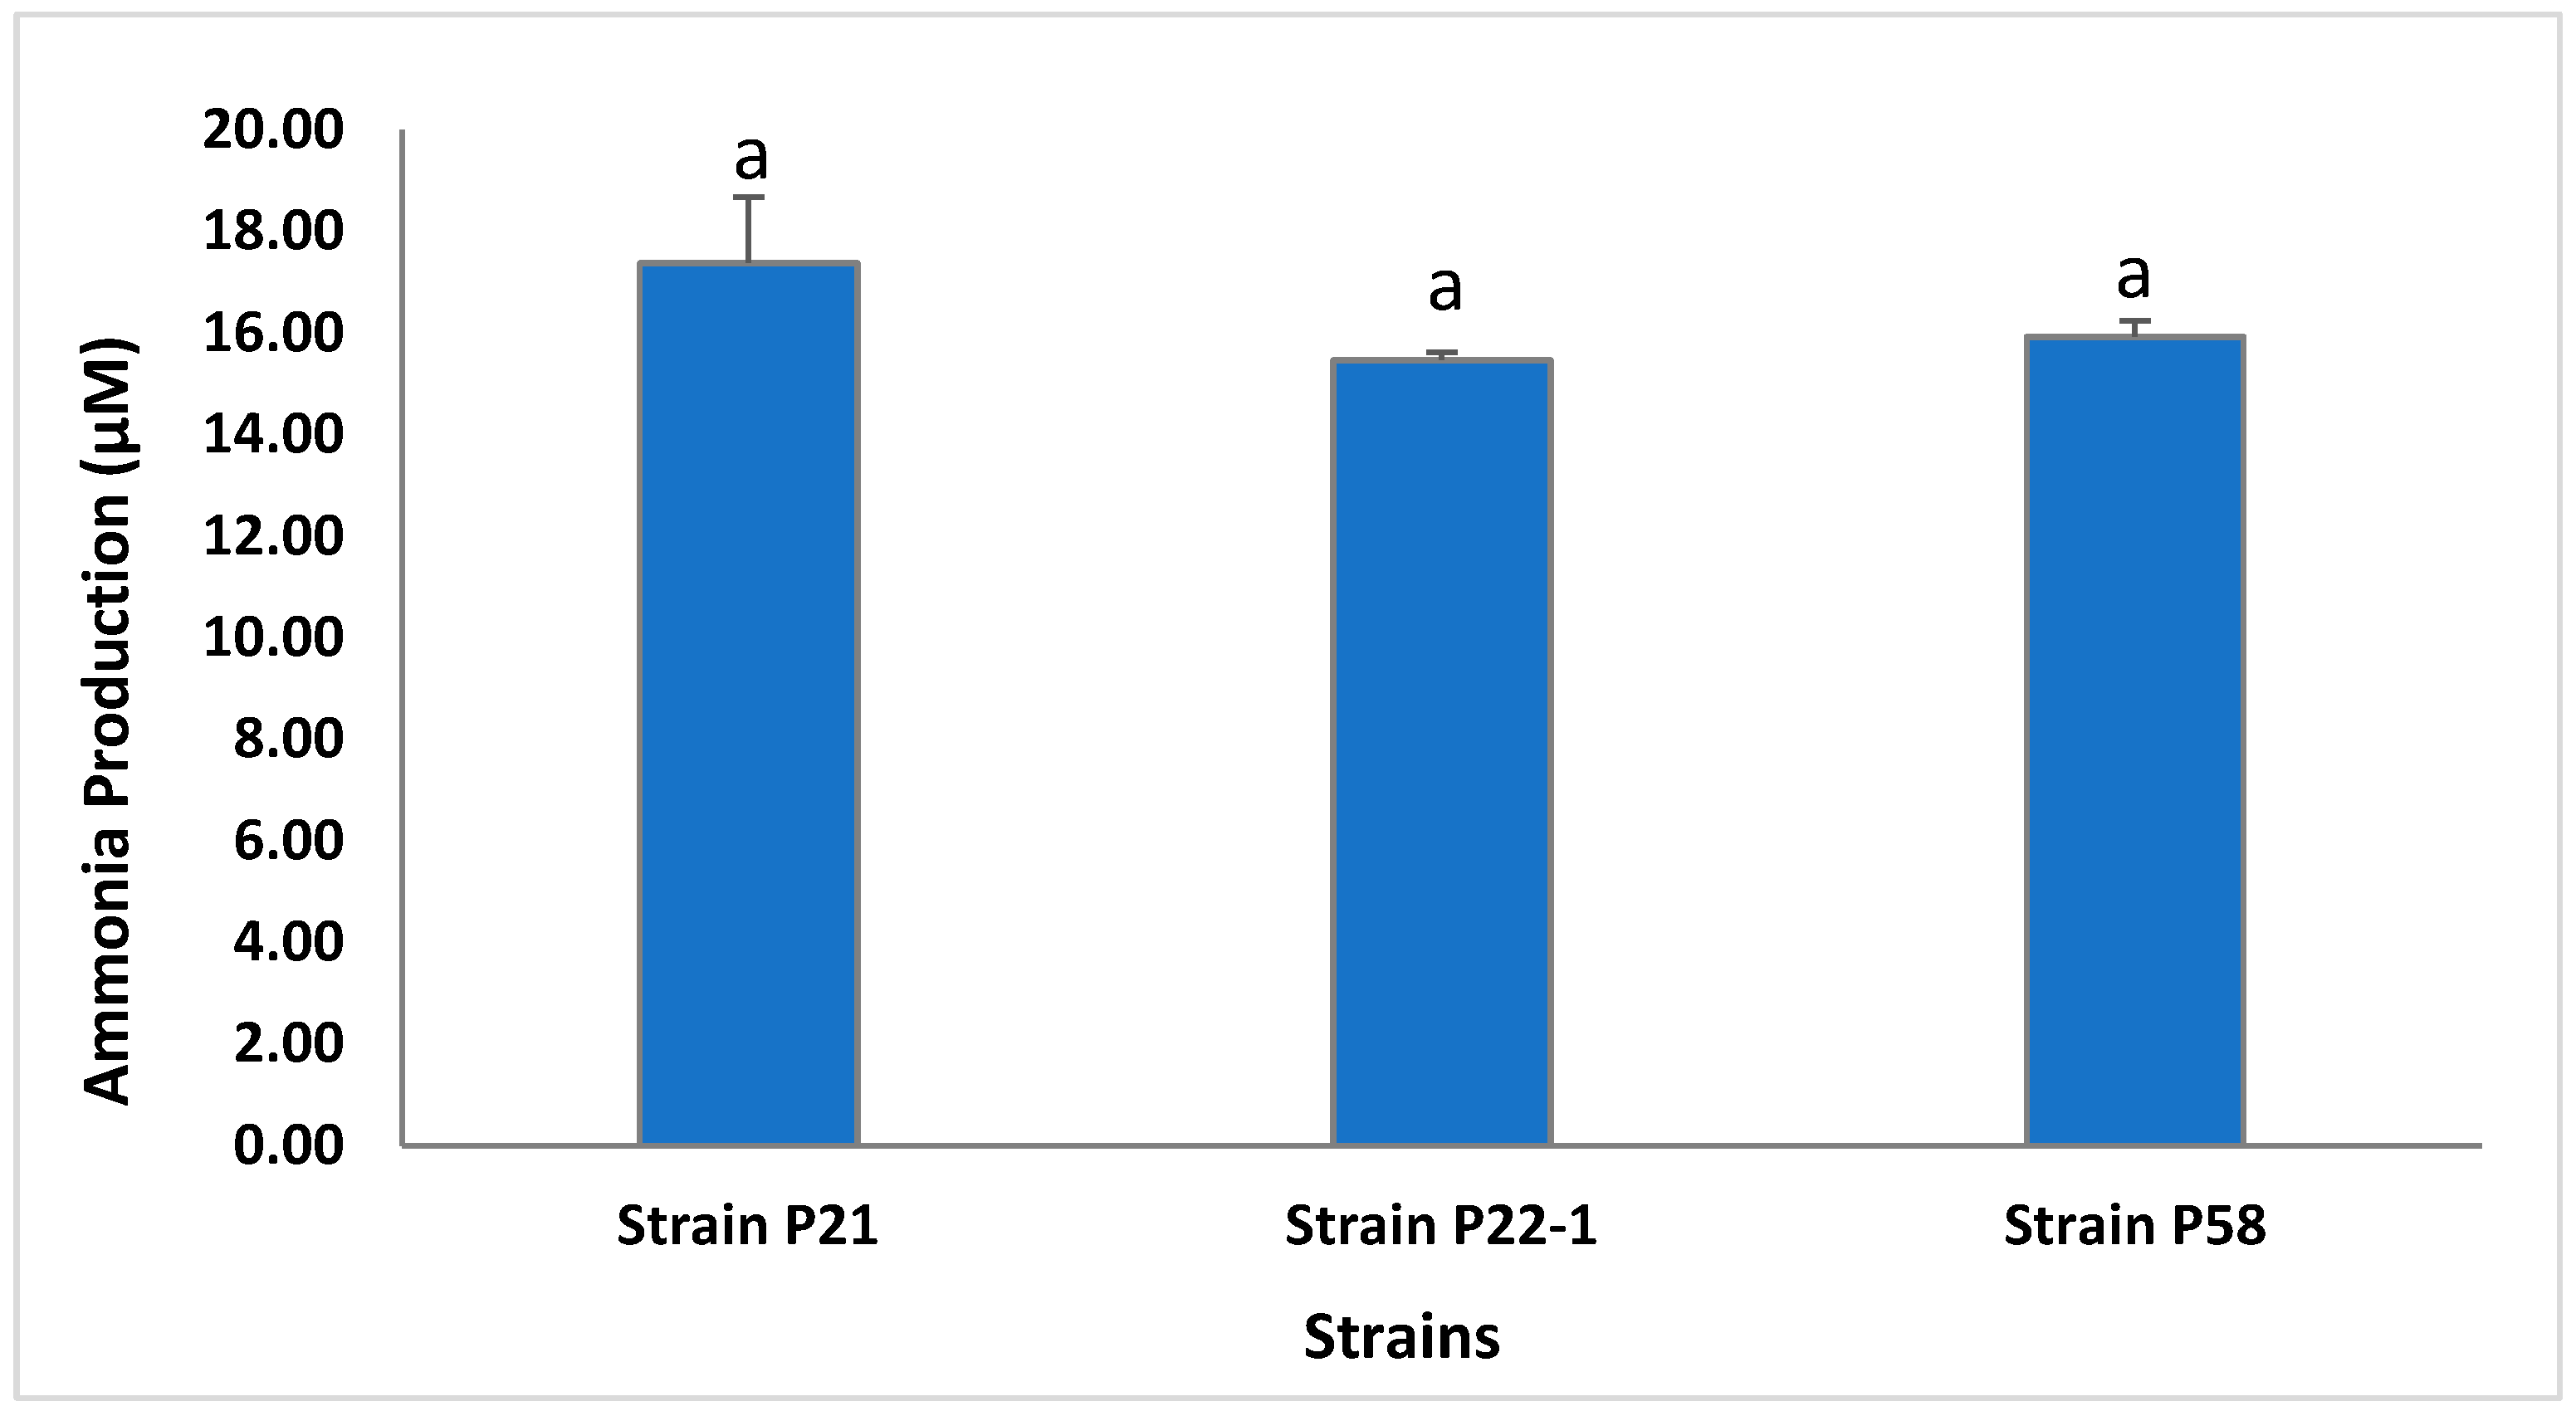
The evaluated isolates were subjected to ammonia production assessment by growing in peptone water medium for 72 h. Isolate P21 produced the maximum amount of ammonia and generated 17.38 μmol/mL, whereas both P22-1 and P58 displayed lower amounts (15.47 and 15.92, respectively) without significant differences (Figure 4).

3.2. 16S rRNA Identification and Molecular Phylogentic Tree

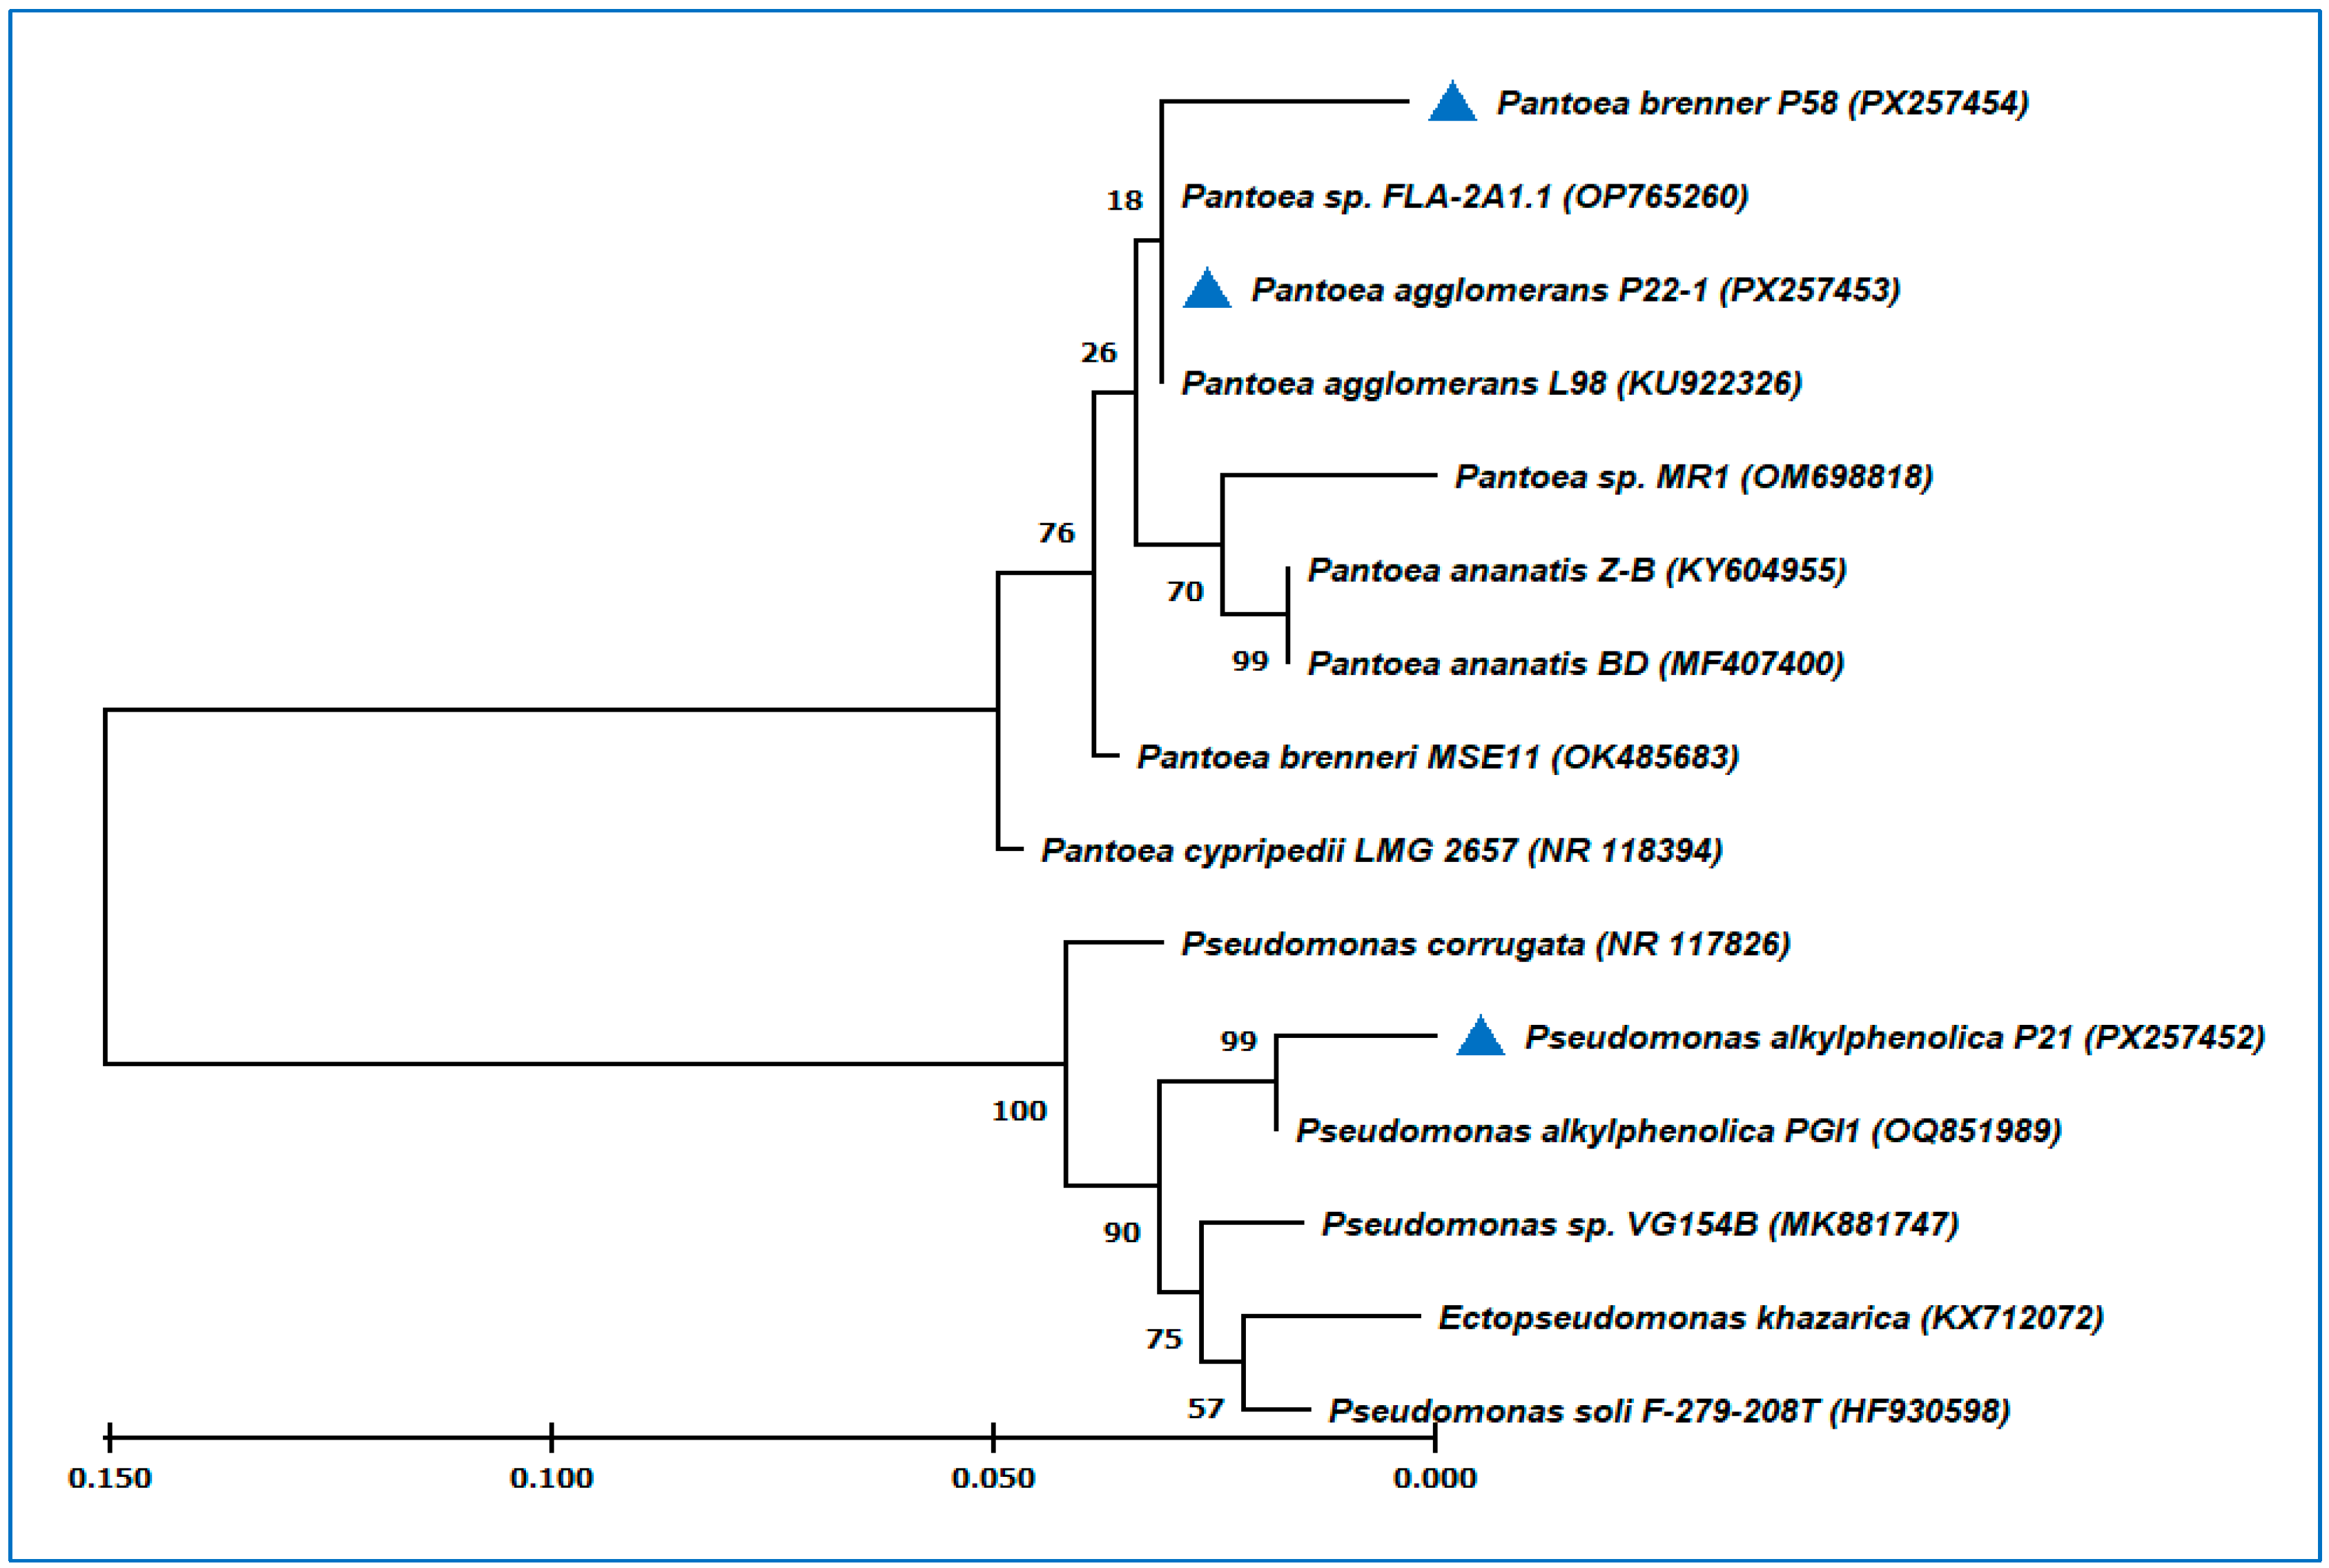
The generated sequences from the 16S rRNA region were blasted with similar sequences at GenBank (https://www.ncbi.nlm.nih.gov/). Isolate P21 showed identities reached 97.67% with Pseudomonas alkylphenolica strain PGI1. In addition, isolate P22-1 presented a high degree of relatedness measuring 100% with Pantoea agglomerans strain L98, whereas isolate P58 exhibited lower identities and belonged to the genus Pantoea and produced a value of 95.62% homology with Pantoea brenneri strain MSE11. The constructed phylogenetic tree, applying the Maximum Likelihood method and Tamura–Nei model, revealed two distinct clusters (Figure 5). The first cluster involved the two identified strains (Pantoea agglomerans strain P22-1 (PX257453) and Pantoea brenneri strain P58 (PX257454)) which align with all involved strains from Pantoea genus. Furthermore, the second cluster had Pseudomonas alkylphenolica strain P21 (PX257452) with other incorporated strains from the genus Pseudomonas.

3.3. Pepper Traits Evaluation

3.3.1. Vegetative Growth Traits

The three strains with three times of adding inoculums (at 0, 10, and 20 days from transplanting) were evaluated for their potential ability to improve the vegetative growth traits of sweet pepper such as height of the plant, leaves number per plant, root length, root dry matter (DM%), leaf DM%, stem DM%, and seeding index. The evaluated traits showed a wide range of variations at 30 and 45 DAT (Table 2). Strain P21(3) showed the best and most significant values for plant height at both 30 DAT (41.34% increase) and 45 DAT (with ≈74% improvement), respectively, when compared with the positive control (MSP). With regard to number of leaves per plant, P22-1(3) produced the highest significant numbers at 30 DAT with an increase reaching 29.2%, while P21(2) and P21(3) showed the highest numbers of leaves at 45 DAT with 59.4% and 58.9% improvement against the positive control, respectively. For root length, MSP produced the lowest and significant negative values, especially at the 45 DAT of assessment, while the topmost values were recorded for P21(1) and P21(3) at the two times of assessment (20.7% and 63.3% over than the MSP control), respectively. On the other hand, no significant differentiations were detected in leaf dry matter percentages at 30 DAT, whereas at 45 DAT, RP showed the greatest significant value (13.21). Concerning the stem dry matter percentage (DM%), P58(2) and MSP had the maximum and significant values at 30 DAT, whereas P22-1(2), P21(3), and RP presented the uppermost and significant values at 45 DAT. Meanwhile, root DM% improvement was detected in MSP treatment at both DATs. In general, P21(2) and P21(3) are considered the most promising treatments related to plant height, number of leaves per plant, root length, and stem DM %.
The data related to leaf area (cm2), chlorophyll (SPAD), seeding index, stem diameter below cotyledons (cm), hypocotyl length (cm), and first internode length (cm) at 30 DAT and 45 DAT are illustrated in Table 3. The P21(3) and P22-1(1) treatments exhibited superior and significant positive leaf areas (with 22.3% and 153% increases) at 30 and 45 DAT, respectively. Regarding the chlorophyll content (SPAD) after both dates, positive and significant effects were obtained by P58(3) and P58(2) with percentages recorded as 29.6% and 36.8%, respectively, while MSP exhibited the lowest values at both dates. For seeding index, P22-1(2) and P22-1(3) manifested the most positive superfat (35% and 190.5%) at 30 and 45 DATs, respectively, whereas P58(1) gave minimal values at both measurement dates. On the other hand, the stem diameter below cotyledons produced the highest positive values under the treatments P21(3) and P22(3) at the evaluated two dates. The topmost positive values of hypocotyl length were obtained by P58(2) at 30 DAT and P58(3) at 45 DAT. The same trend was observed in the first internode length; P58(2) and P58(3) revealed the top positive values at the two assessed dates.
The data related to net assimilation rate (NAR) (mg cm2 d−1) and relative growth rate (mg g−1 day−1) are presented in Table 4. The P22-1(3) treatment presented the highest positive value of net assimilation rate, being 107.4% higher than MSP; meanwhile, P58 (2) displayed the least value (0.14 mg cm2 d−1). Furthermore, the relative growth rate (RGR) manifested no significant differences among most of the treatments. However, the positive highest values (0.06 mg g−1 day−1) were assigned to P22-1(3) and P21(3), respectively, whereas the lowest value was obtained by P58(2) treatment.

3.3.2. Plant Phosphorus Contents

The results highlight the significant role of PGPB in enhancing phosphorus uptake and utilization, offering valuable insights into sustainable phosphorus management strategies. Leaf P-uptake is a critical indicator of phosphorus availability and its translocation to above-ground plant parts. The highest leaf P-uptake was observed in P58 (3) with enhancement counted at 16.2%, followed by P22-1(2) (15.1%) (Table 5). These results suggest that multiple applications of PGPB strains, particularly P58 and P22-1, significantly enhance leaf phosphorus availability and uptake. In contrast, the lowest leaf P-uptake was recorded in the RP treatment (15.1 mg/plant), indicating that unprocessed rock phosphate is less effective in supplying phosphorus to plants. Stem P-uptake reflects the translocation of phosphorus to structural plant parts. The highest stem P-uptake was observed in P21(3) (14.3% upper than the control), followed by P21(2) (13%). This indicates that PGPB strains, particularly P21, enhance phosphorus translocation to stems. The MSP treatment also showed high stem P-uptake (22.3 mg/plant), confirming the effectiveness of soluble phosphate fertilizers. In contrast, the lowest stem P-uptake was recorded in the RP treatment (17.6 mg/plant), further emphasizing the limitations of unprocessed rock phosphate. Root P-uptake is a key indicator of phosphorus absorption efficiency. The highest root P-uptake was observed in P58(3) (19.7 mg/plant), followed by MSP (19.4 mg/plant) and P22-1(3) (17.0 mg/plant). This demonstrates that PGPB strains, particularly P58, enhance phosphorus absorption in roots. Total P-uptake reflects the plant’s overall phosphorus utilization efficiency. The highest total P-uptake was observed in P58(3) (64.0 mg/plant with 5.3% higher than MSP), followed by MSP (60.8 mg/plant) and P22-1(3) (60.0 mg/plant). This highlights the effectiveness of PGPB strains, particularly P58 and P22-1, in enhancing total phosphorus uptake. The RP treatment showed the lowest total P-uptake (49.2 mg/plant), confirming its inefficiency as a phosphorus source.

3.4. Principal Component Analysis (PCA)

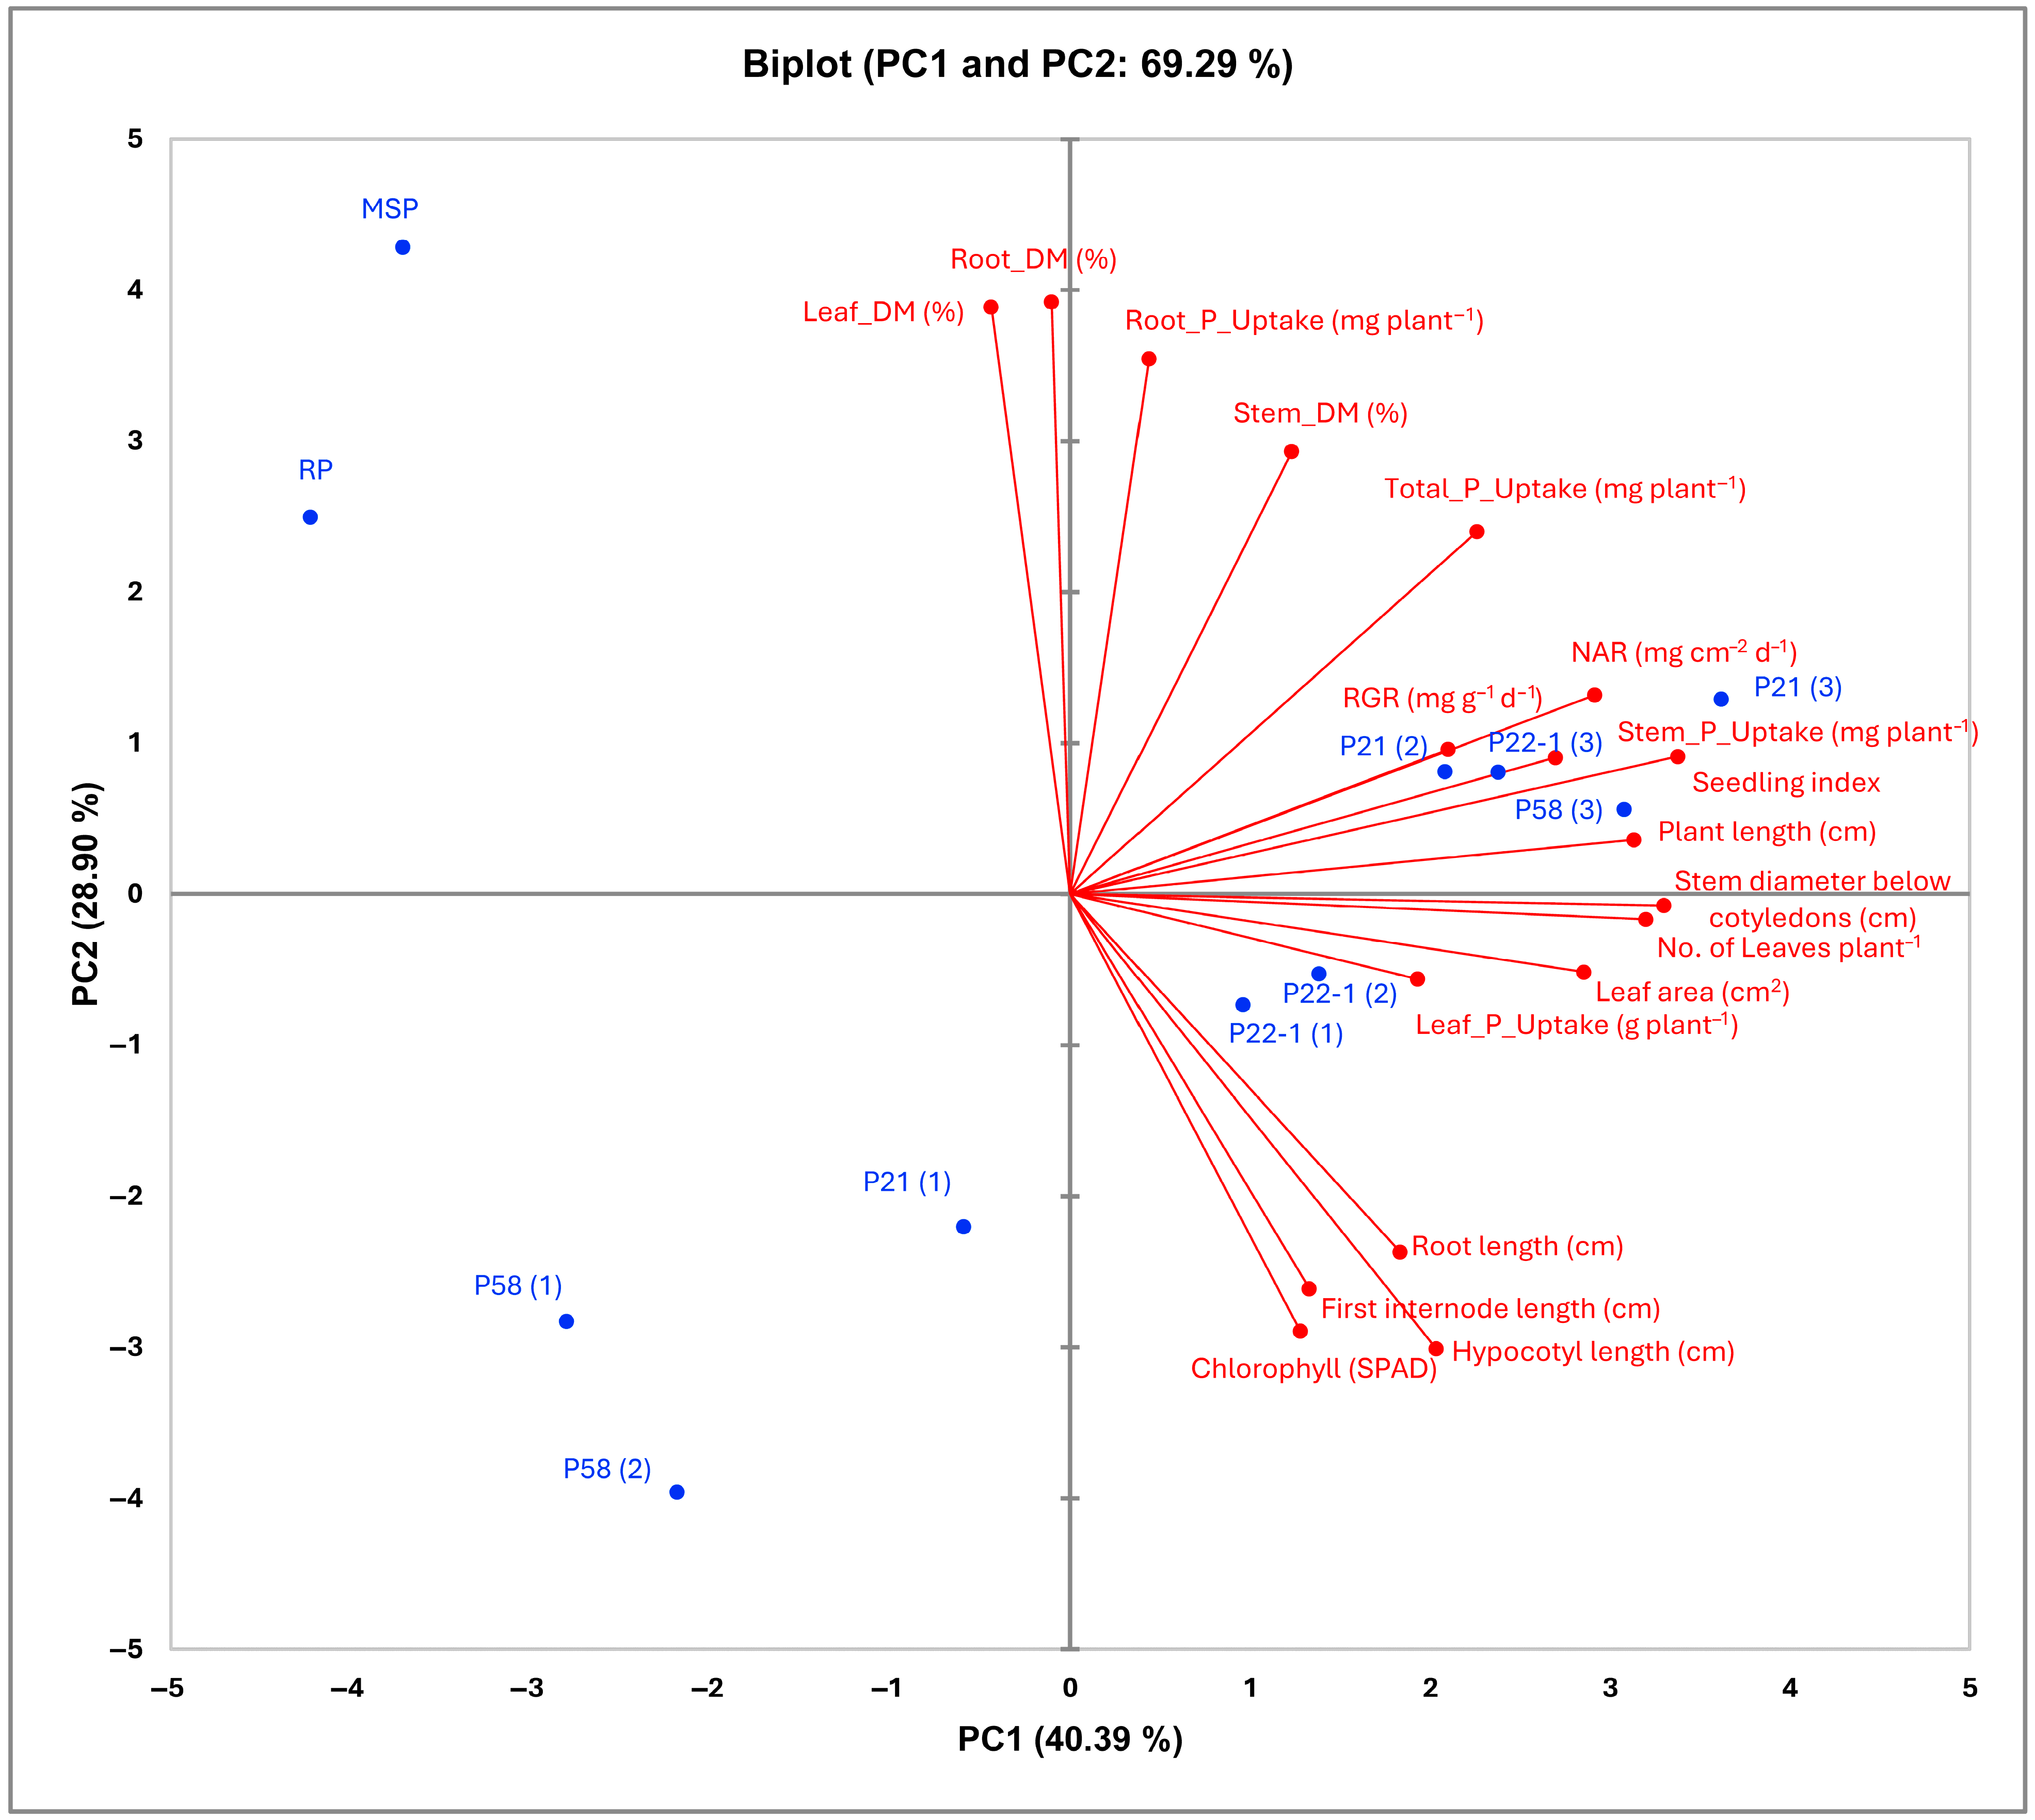
The principal component (PC) biplot provides a detailed visualization of the relationships between various plant traits and treatments, including rock phosphate (RP), mono-super phosphate (MSP), and three strains of plant growth-promoting bacteria (PGPB), P58, P21, and P22-1, with three inoculation times. The first two components of the PCAs account for 69.29% of the total variance (PC1: 40.39%, PC2: 28.90%). A strong and positive association was detected among traits such as root P-uptake, stem_DM %, total P-uptake, RGR, NAR, stem P-uptake, leaf P-uptake, seedling index, plant length, leaf area, no. of leaves, and stem diameter (Figure 6). Furthermore, the P21(2), P21(3), P22-1(1), P22-1(2), P22-1(3), and P58(3) were located on the PC1 positive side in correlation with all evaluated traits except leaf DM% and root DM%, whereas treatments such as P58(1), P58(2), and P21(1) were found on the negative side of both PC1 and PC2, reflecting a negative association with the evaluated traits.

3.5. Trait Associations and Clustering

The heatmap offers a comprehensive visualization of the relationships between various plant traits and treatments, including rock phosphate (RP), mono-super phosphate (MSP), and the three applied strains: P58, P21, and P22-1 (Figure 7). It revealed a strong positive correlation between P21(2), P21(3), P22-1(3), and P58(3) treatments and traits such as total P-uptake, root P-uptake, and leaf_DW%, stem_DW%, and root_DW%, indicating their interconnected role in phosphorus absorption and utilization in addition to contribution to dry matter accumulation. In addition, no. of leaves, seedling index, plant length, stem diameter leaf area, NAR, and RGR clustered together, reflecting their strong positive association.

4. Discussion

The commercialization of PGPB-based biofertilizers and biostimulants has accelerated significantly in recent years. Globally, governments, scientists, and private sector companies have established significant investments in the development of microbial technology to deal with problems like soil erosion, food security, and climate change [64,65].
PGPB are a broad category of microorganisms that play essential roles in sustainable agriculture by direct and indirect mechanisms. Along with the synthesis of phytohormones, direct methods include the absorption of nutrients by nitrogen fixation, potassium and phosphate solubilization, and siderophore-mediated iron uptake. To maximize nitrogenase activity, nitrogen-fixing species such as Rhizobium, Azotobacter, and Azospirillum transform atmospheric N2 into ammonium and frequently form symbiosomes in legume nodules. Conversely, PGPB’s indirect processes include preventing detrimental impacts on plant health or blocking certain diseases [65,66,67].
Three isolated strains, identified as Pseudomonas alkylphenolica strain P21 (PX257452), Pantoea agglomerans strain P22-1 (PX257453), and Pantoea brenneri strain P58 (PX257454), were evaluated in-lab and applied in the field. They manifested promising production of IAA and ammonia coupled with clear P-solubilization activity. Strains P58, P22-1, and P21 exhibited patterns of IAA production counted as 188.65, 155.03, and 154.47 µg/mL after 2, 3, and 7 days from incubation in NB medium, respectively. These strains showed vital amounts of ammonia with values of 15.92, 15.47, and 17.38 µM, with the same previous sequence. Rehan et al. [11] applied four strains as a PGPB with tomato under greenhouse conditions. Out of these strains, one strain was identified as Pseudomonas plecoglossicida strain P24 that produced about 101.94 µg/mL after 4 days of incubation, whereas Oliveira et al. [68] characterized two Pseudomonas bacteria for their ability to produce plant growth-promoting substances. They found that Pseudomonas putida and Pseudomonas sp. were able to produce IAA with values of 125 and 90 µg mL−1, respectively. Furthermore, Hyder et al. [69] isolated about 12 isolates from the rhizosphere of chili peppers and tested them as PGPB and as bio-control against Phytophthora capsica. In order to improve the plant development characteristics of chili peppers, all of the studied bacterial strains (especially Pseudomonas putida) displayed a great capacity to create IAA. Additionally, compared to the untreated control treatment, fresh shoot and root weight in addition to dry shoot and root weight enhanced dramatically. Ganesh et al. [70] isolated twenty-four isolate from the roots and rhizosphere of the survived snowbrush. Two isolates, CK-40 and CK-20, produced the highest amount of IAA with 41.06 and 32.09 µg/mL, respectively, whereas CK-3, CK-50, and CK-54 isolates produced a large amount of ammonia which reached more than 100 µg/mL. In addition, twenty-seven isolates (out of 118 isolates) produced IAA in the range of 2.15 to 26.47 μg/mL, and the isolated GAC-118 (identified as Bacillus sp.) was considered the highest producer (26.47 μg/mL) [71]. Noreen et al. [72] found that Pseudomonas sp. AvH-4 and Pseudomonas alcaliphila AvR-2 had maximum IAA production after 64 h (72.3 μg/mL) and 56 h (32.4 μg/mL), respectively, whereas P. aeruginosa As-17 expressed 106 μg/mL after 80 h. Furthermore, strain CSV86T (designated as Pseudomonas bharatica) produced the topmost IAA (64 µg/mL) in LB medium. Strain PP4 (Pseudomonas sp. PP4) revealed significant and higher ammonia production (65 µg/mL), followed by strain C5pp (Pseudomonas sp. C5pp) [73].
Evaluating the growth and P-uptake traits in sweet pepper plants in the presence of PGPR, rock phosphate (RP), and mono-super phosphate (MSP) exhibited significant and positive effects. Based on the results presented here, the most promising treatments were P21(3), P21(2), P22-1(3), and P58(3) in terms of plant height, leaf area, number of leaves per plant, root length, stem P-uptake, leaf P-uptake, and total plant P-uptake. These findings are consistent with previously published reports by Mirik et al. [74] who reported that biofertilizer application increased the stem diameter, root elongation, root and shoot dry weight, and yield of chili pepper. The results of the current study are also in line with that mentioned by Sahoo et al. [41], Kumar et al. [42], Hariyono et al. [43], Camacho-Rodríguez et al. [44], and Sini et al. [45], who reported the positive and significant effects of biofertilizers on the vegetative growth of sweet pepper plants. Additionally, biofertilizers have been reported to increase leaf chlorophyll content in sweet pepper [46]. According to Phares et al. [75] and Kaur et al. [76], phosphate-solubilizing bacteria (PSB) are a crucial part of sustainable agriculture because they increase phosphate availability by mineralizing the insoluble portion of inorganic phosphate. They found that when potatoes and maize were treated with Bacillus, Pseudomonas, and Arthrobacter bacteria, there was a significant increase in the plant growth parameters, phosphorus (P) content, and soil-accessible P. The increase in vegetative growth traits when using rock phosphate or rock phosphate with biofertilizers could be due to increased soil fertility, which may aid in the plant’s ability to absorb nutrients such as phosphorous, potassium, and others.
The study underlines the important role of PGPB in enhancing phosphorus uptake and utilization in plants. These findings align with studies demonstrating that PGPB solubilizes insoluble phosphorus forms, making them available for plant uptake [77,78]. Additionally, PGPB improves root phosphorus absorption from the soil and increases the phosphorus content in plant roots and shoots [79]. Furthermore, PGPB improves phosphorus mobility within plants [80]. Finally, results are consistent with studies showing that PGPB significantly improves phosphorus use efficiency and crop productivity [81,82]. The obtained data declares that multiple applications of PGPB (e.g., three additions) were more effective than single or double applications, indicating the importance of sustained microbial activity throughout the growing period. These findings have important implications for sustainable agriculture, as they highlight the potential of PGPB to reduce reliance on chemical phosphorus fertilizers while improving phosphorus use efficiency. Phosphate-solubilizing bacteria (PSB) have the potential to introduce available phosphate by solubilization from insoluble forms to the plants, hence increasing crop yields while maintaining environmental sustainability [83,84].
The PCA biplot shows that MSP, P22-1(3), and P58(3) are closely associated with high phosphorus uptake, indicating their effectiveness in enhancing phosphorus absorption by solubilizing insoluble forms [79]. In contrast, RP shows limited efficacy without microbial intervention [6]. Treatments like P21(1) and P22-1(1) are associated with higher RGR and NAR, highlighting their role in promoting growth rates through improved nutrient availability and root development. Previously, Rehan et al. found that at 45 DAT in tomato, the first two PCA components accounted for 71.99% of the variation (PCA1 = 50.81% and PCA2 = 21.18%), and the PGPR enhanced the tomato plants’ vegetative growth characteristics by improving nutrient availability, P-solubilization, IAA production, and siderophore synthesis [11]. The biplot underscores the effectiveness of PGPB, particularly P58 and P22-1, in enhancing phosphorus uptake, dry matter accumulation, and growth rates, with multiple applications proving more effective than single applications. For sustainable agriculture, it is recommended to adopt PGPB inoculation and optimize application frequency to improve soil health and nutrient availability [85].
The heatmap highlights that MSP and P58(3) are strongly associated with high phosphorus uptake, demonstrating their effectiveness in enhancing phosphorus availability by solubilizing insoluble forms, while RP shows minimal association, underscoring its limited efficacy without microbial intervention. Additionally, P58(2) and P22(3) are linked to increased dry matter accumulation, likely due to improved nutrient uptake and physiological efficiency mediated by PGPB. Treatments like P21(1) and P22(1) are closely associated with RGR and NAR, indicating their role in promoting growth rates, while P58(3) and P22(3) enhance photosynthetic efficiency, as evidenced by higher chlorophyll (SPAD) values. These findings underscore the effectiveness of PGPB in improving phosphorus uptake, dry matter accumulation, and growth rates, with multiple applications proving more effective than single applications [47]. For sustainable agriculture, it isz recommended to adopt PGPB inoculation, optimize application frequency, and integrate PGPB with organic amendments to enhance soil health and nutrient availability [81,86,87]. There was a positive and substantial correlation between Streptomyces inoculation and plant P, relative growth rate (RGR), soil P level, leaf area, root length, plant height, number of leaves, fruit fresh weight, fruit number, fruit diameter, and fruit length [10].

5. Conclusions

PGPB are microorganisms that colonize soil or roots and help plants absorb nutrients in a better way, produce more phytohormones, withstand stress better, and fight off infections. Three isolated strains from arid soil reflected patterns of IAA, ammonia production, and P-solubilization. The maximum production of IAA was seen in P58 bacterium (188.65 µg/mL), whereas strain P21 (Pseudomonas alkylphenolica P21) showed an exceedingly large amount of ammonia (17.38 μmol/mL). The P58 (3) and P22-1 (3) treatments emerged as promising strategies for sustainable phosphorus management, warranting further research into their long-term effects on soil health and crop productivity under varying environmental conditions.

Author Contributions

Conceptualization, A.F.O., N.M.A., M.R. and A.H.A.A.; methodology, M.R., A.F.O., N.M.A. and A.H.A.A.; software, M.R. and N.M.A.; formal analysis, N.M.A. and A.M.A.; investigation, M.R., A.M.A., A.F.O., N.M.A., A.A.-T. and A.H.A.A.; writing—original draft preparation, A.H.A.A., M.R. and N.M.A.; project administration, A.A.-T. and A.F.O.; funding acquisition, A.A.-T.; writing—review and editing, M.R. and A.H.A.A. All authors have read and agreed to the published version of the manuscript.

Funding

This research was funded by the Deputyship for Research and Innovation, Ministry of Education, Saudi Arabia, through project number (Qu-IF-1-1-1).

Data Availability Statement

The raw data supporting the conclusions of this article will be made available by the authors on request.

Acknowledgments

The authors extend their appreciation to the Deputyship for Research and Innovation, the Ministry of Education, Saudi Arabia, for funding this research. The authors also thank Qassim University for its technical support.

Conflicts of Interest

The authors declare no conflicts of interest.

References

  1. de Andrade, L.A.; Santos, C.H.B.; Frezarin, E.T.; Sales, L.R.; Rigobelo, E.C. Plant Growth-Promoting Rhizobacteria for Sustainable Agricultural Production. Microorganisms 2023, 11, 1088. [Google Scholar] [CrossRef]
  2. Grobelak, A.; Napora, A.; Kacprzak, M. Using Plant Growth-Promoting Rhizobacteria (PGPR) to Improve Plant Growth. Ecol. Eng. 2015, 84, 22–28. [Google Scholar] [CrossRef]
  3. Basu, A.; Prasad, P.; Das, S.N.; Kalam, S.; Sayyed, R.Z.; Reddy, M.S.; El Enshasy, H. Plant Growth Promoting Rhizobacteria (PGPR) as Green Bioinoculants: Recent Developments, Constraints, and Prospects. Sustainability 2021, 13, 1140. [Google Scholar] [CrossRef]
  4. Vacheron, J.; Desbrosses, G.; Bouffaud, M.-L.; Touraine, B.; Moënne-Loccoz, Y.; Muller, D.; Legendre, L.; Wisniewski-Dyé, F.; Prigent-Combaret, C. Plant Growth-Promoting Rhizobacteria and Root System Functioning. Front. Plant Sci. 2013, 4, 356. [Google Scholar] [CrossRef]
  5. Omar, A.F.; Rehan, M.; Al-turki, A. Synergistic Effects of Plant Growth Promoting Rhizobacteria in Improvement the Crop Production and Sustainable Agriculture. Fresenius Environ. Bull. 2022, 31, 10563–10574. [Google Scholar]
  6. Al-Turki, A.; Murali, M.; Omar, A.F.; Rehan, M.; Sayyed, R.Z. Recent Advances in PGPR-Mediated Resilience toward Interactive Effects of Drought and Salt Stress in Plants. Front. Microbiol. 2023, 14, 1214845. [Google Scholar] [CrossRef]
  7. Gupta, K.; Dubey, N.K.; Singh, S.P.; Kheni, J.K.; Gupta, S.; Varshney, A. Plant Growth-Promoting Rhizobacteria (PGPR): Current and Future Prospects for Crop Improvement. In Current Trends in Microbial Biotechnology for Sustainable Agriculture; Yadav, A.N., Singh, J., Singh, C., Yadav, N., Eds.; Springer: Singapore, 2021; pp. 203–226. ISBN 978-981-15-6949-4. [Google Scholar]
  8. Tripathi, A.; Pandey, V.K.; Jain, D.; Singh, G.; Brar, N.S.; Taufeeq, A.; Pandey, I.; Dash, K.K.; Samrot, A.V.; Rustagi, S. An Updated Review on Significance of PGPR-Induced Plant Signalling and Stress Management in Advancing Sustainable Agriculture. J. Agric. Food Res. 2024, 16, 101169. [Google Scholar] [CrossRef]
  9. Beneduzi, A.; Ambrosini, A.; Passaglia, L.M.P. Plant Growth-Promoting Rhizobacteria (PGPR): Their Potential as Antagonists and Biocontrol Agents. Genet. Mol. Biol. 2012, 35, 1044–1051. [Google Scholar] [CrossRef] [PubMed]
  10. Omar, A.F.; Abdelmageed, A.H.A.; Al-Turki, A.; Abdelhameid, N.M.; Sayyed, R.Z.; Rehan, M. Exploring the Plant Growth-Promotion of Four Streptomyces Strains from Rhizosphere Soil to Enhance Cucumber Growth and Yield. Plants 2022, 11, 3316. [Google Scholar] [CrossRef] [PubMed]
  11. Rehan, M.; Al-Turki, A.; Abdelmageed, A.H.A.; Abdelhameid, N.M.; Omar, A.F. Performance of Plant-Growth-Promoting Rhizobacteria (PGPR) Isolated from Sandy Soil on Growth of Tomato (Solanum lycopersicum L.). Plants 2023, 12, 1588. [Google Scholar] [CrossRef] [PubMed]
  12. Subedi, P.; Gattoni, K.; Liu, W.; Lawrence, K.S.; Park, S.-W. Current Utility of Plant Growth-Promoting Rhizobacteria as Biological Control Agents towards Plant-Parasitic Nematodes. Plants 2020, 9, 1167. [Google Scholar] [CrossRef]
  13. Rezaee Danesh, Y.; Pellegrini, M.; Akköprü, A.; Farda, B.; Boyno, G.; Djebaili, R. Chapter 7-Plant Growth–Promoting Rhizobacteria: Their Potential as Biological Control Agents in Sustainable Agriculture. In Sustainable Agricultural Practices; Kumar, A., White, J.F., Singh, J., Eds.; Plant and Soil Microbiome; Academic Press: Cambridge, MA, USA, 2024; pp. 145–159. ISBN 978-0-443-19150-3. [Google Scholar]
  14. El-Saadony, M.T.; Saad, A.M.; Soliman, S.M.; Salem, H.M.; Ahmed, A.I.; Mahmood, M.; El-Tahan, A.M.; Ebrahim, A.A.M.; Abd El-Mageed, T.A.; Negm, S.H.; et al. Plant Growth-Promoting Microorganisms as Biocontrol Agents of Plant Diseases: Mechanisms, Challenges and Future Perspectives. Front. Plant Sci. 2022, 13, 923880. [Google Scholar] [CrossRef]
  15. Danish, M.; Shahid, M.; Altaf, M.; Tyagi, A.; Ali, S. Plant Growth-Promoting Rhizobacteria and Biocontrol Agents Triggered Plant Defence Responses against Phytopathogenic Fungi and Improved Rice Growth. Physiol. Mol. Plant Pathol. 2024, 133, 102337. [Google Scholar] [CrossRef]
  16. Heo, A.Y.; Koo, Y.M.; Choi, H.W. Biological Control Activity of Plant Growth Promoting Rhizobacteria Burkholderia Contaminans AY001 against Tomato Fusarium Wilt and Bacterial Speck Diseases. Biology 2022, 11, 619. [Google Scholar] [CrossRef]
  17. Aioub, A.A.A.; Elesawy, A.E.; Ammar, E.E. Plant Growth Promoting Rhizobacteria (PGPR) and Their Role in Plant-Parasitic Nematodes Control: A Fresh Look at an Old Issue. J. Plant Dis. Prot. 2022, 129, 1305–1321. [Google Scholar] [CrossRef]
  18. Chieb, M.; Gachomo, E.W. The Role of Plant Growth Promoting Rhizobacteria in Plant Drought Stress Responses. BMC Plant Biol. 2023, 23, 407. [Google Scholar] [CrossRef] [PubMed]
  19. Liu, K.; Deng, F.; Zeng, F.; Chen, Z.-H.; Qin, Y.; Chen, G. Plant Growth-Promoting Rhizobacteria Improve Drought Tolerance of Crops: A Review. Plant Growth Regul. 2025, 105, 567–581. [Google Scholar] [CrossRef]
  20. Balci, M.; Arikan-Abdulveli, B.; Yildiztugay, E.; Ozfidan-Konakci, C.; Uysal, A. An Effective Sustainable Strategy: Plant Growth Promoting Rhizobacteria (PGPR), Bacillus Atrophaeus, in Maize Plants against Challenging Environments. J. Environ. Chem. Eng. 2025, 13, 116778. [Google Scholar] [CrossRef]
  21. Kumar, R.; Swapnil, P.; Meena, M.; Selpair, S.; Yadav, B.G. Plant Growth-Promoting Rhizobacteria (PGPR): Approaches to Alleviate Abiotic Stresses for Enhancement of Growth and Development of Medicinal Plants. Sustainability 2022, 14, 5514. [Google Scholar] [CrossRef]
  22. Kumawat, K.C.; Sharma, B.; Nagpal, S.; Kumar, A.; Tiwari, S.; Nair, R.M. Plant Growth-Promoting Rhizobacteria: Salt Stress Alleviators to Improve Crop Productivity for Sustainable Agriculture Development. Front. Plant Sci. 2023, 13, 1101862. [Google Scholar] [CrossRef]
  23. Etesami, H.; Maheshwari, D.K. Use of Plant Growth Promoting Rhizobacteria (PGPRs) with Multiple Plant Growth Promoting Traits in Stress Agriculture: Action Mechanisms and Future Prospects. Ecotoxicol. Environ. Saf. 2018, 156, 225–246. [Google Scholar] [CrossRef]
  24. Ahmad, H.M.; Fiaz, S.; Hafeez, S.; Zahra, S.; Shah, A.N.; Gul, B.; Aziz, O.; Mahmood-Ur-Rahman; Fakhar, A.; Rafique, M.; et al. Plant Growth-Promoting Rhizobacteria Eliminate the Effect of Drought Stress in Plants: A Review. Front. Plant Sci. 2022, 13, 875774. [Google Scholar] [CrossRef]
  25. Beshah, A.; Muleta, D.; Legese, G.; Assefa, F. Exploring Stress-Tolerant Plant Growth-Promoting Rhizobacteria from Groundnut Rhizosphere Soil in Semi-Arid Regions of Ethiopia. Plant Signal Behav. 2024, 19, 2365574. [Google Scholar] [CrossRef]
  26. Khawula, S.; Daniel, A.I.; Nyawo, N.; Ndlazi, K.; Sibiya, S.; Ntshalintshali, S.; Nzuza, G.; Gokul, A.; Keyster, M.; Klein, A.; et al. Optimizing Plant Resilience with Growth-Promoting Rhizobacteria under Abiotic and Biotic Stress Conditions. Plant Stress. 2025, 17, 100949. [Google Scholar] [CrossRef]
  27. Chen, Q.-B.; Sun, X.-Y.; Zheng, M.-Y.; Liu, Y.-N.; Zhang, J.-X.; Zhou, Q.-F.; Pei, D.-L.; Liu, D.-M.; Chen, Y.-W.; Gao, H.; et al. Transcription Factor CaPHR3 Enhances Phosphate Starvation Tolerance by Up-Regulating the Expression of the CaPHT1;4 Phosphate Transporter Gene in Pepper. Int. J. Biol. Macromol. 2025, 292, 139315. [Google Scholar] [CrossRef]
  28. Werner, J. Capsaicinoids—Properties and Mechanisms of Pro-Health Action. In Analytical Methods in the Determination of Bioactive Compounds and Elements in Food; Jeszka-Skowron, M., Zgoła-Grześkowiak, A., Grześkowiak, T., Ramakrishna, A., Eds.; Springer International Publishing: Cham, Germany, 2021; pp. 193–225. ISBN 978-3-030-61879-7. [Google Scholar]
  29. Al-Harbi, A.R.; Obadi, A.; Al-Omran, A.M.; Abdel-Razzak, H. Sweet Peppers Yield and Quality as Affected by Biochar and Compost as Soil Amendments under Partial Root Irrigation. J. Saudi Soc. Agric. Sci. 2020, 19, 452–460. [Google Scholar] [CrossRef]
  30. Ministry of Environment, Water and Agriculture. Statistical Yearbook; UN iLibrary: Riyadh, Saudi Arabia, 2020. [Google Scholar]
  31. Kumar, R.; Kumari, P.; Kumar, S. Effect of Irrigation Levels and Frequencies on Yield, Quality and Water Use Efficiency of Capsicum Grown under Protected Conditions. Int. J. Bio-Resour. Stress Manag. 2016, 7, 1290–1296. [Google Scholar] [CrossRef]
  32. Marín, A.; Ferreres, F.; Tomás-Barberán, F.A.; Gil, M.I. Characterization and Quantitation of Antioxidant Constituents of Sweet Pepper (Capsicum annuum L.). J. Agric. Food Chem. 2004, 52, 3861–3869. [Google Scholar] [CrossRef]
  33. Igbokwe, G.; Aniakor, G.C.; Anagonye, C.O. Determination of β–Carotene & Vitamin C Content of Fresh Green Pepper (Capsicum annnum), Fresh Red Pepper (Capsicum annum) and Fresh Tomatoes (Solanumly copersicum) Fruits. Biosci. 2013, 1, 89–93. [Google Scholar]
  34. Mohd Hassan, N.; Yusof, N.A.; Yahaya, A.F.; Mohd Rozali, N.N.; Othman, R. Carotenoids of Capsicum Fruits: Pigment Profile and Health-Promoting Functional Attributes. Antioxidants 2019, 8, 469. [Google Scholar] [CrossRef]
  35. Palevitch, D.; Craker, L.E. Nutritional and Medical Importance of Red Pepper (Capsicum spp.). J. Herbs Spices Med. Plants 1996, 3, 55–83. [Google Scholar] [CrossRef]
  36. Bisht, N.; Chauhan, P.S. Excessive and Disproportionate Use of Chemicals Cause Soil Contamination and Nutritional Stress. In Soil Contamination; Larramendy, M.L., Soloneski, S., Eds.; IntechOpen: Rijeka, Croatia, 2020. [Google Scholar]
  37. Chandini, K.; Ravendra, K.; Prakash, O. The Impact of Chemical Fertilizers on Our Environment and Ecosystem. In Research Trends in Environmental Sciences; Bhumi Publishing: Maharashtra, India, 2019; pp. 69–86. ISBN 978-93-5335-062-8. [Google Scholar]
  38. Shanmugavel, D.; Rusyn, I.; Solorza-Feria, O.; Kamaraj, S.-K. Sustainable SMART Fertilizers in Agriculture Systems: A Review on Fundamentals to in-Field Applications. Sci. Total Environ. 2023, 904, 166729. [Google Scholar] [CrossRef]
  39. Khoso, M.A.; Wagan, S.; Alam, I.; Hussain, A.; Ali, Q.; Saha, S.; Poudel, T.R.; Manghwar, H.; Liu, F. Impact of Plant Growth-Promoting Rhizobacteria (PGPR) on Plant Nutrition and Root Characteristics: Current Perspective. Plant Stress 2024, 11, 100341. [Google Scholar] [CrossRef]
  40. Kumar, S.; Diksha; Sindhu, S.S.; Kumar, R. Biofertilizers: An Ecofriendly Technology for Nutrient Recycling and Environmental Sustainability. Curr. Res. Microb. Sci. 2022, 3, 100094. [Google Scholar] [CrossRef]
  41. Sahoo, D.; Sahoo, N.R.; Paramjita, D. Effect of Biofertilisers on Yield and Quality of Sweet Pepper (Capsicum annuum cv. Grossum L.). Indian Soc. Coastal Agric. Res. 2017, 35, 15–20. [Google Scholar]
  42. Kumar, R.; Singh, S.K.; Kumar, N.; Kant Verma, A.; Singh, K. Effect of Biofertilizers on Growth, Yield and Quality of Chilli (Capsicum annuum L.). Pharma Innov. J. 2021, 10, 451–454. [Google Scholar]
  43. Hariyono, D.; Ali, F.Y.; Nugroho, A. Increasing the Growth and Development of Chili-Pepper under Three Different Shading Condition in Response to Biofertilizers Application. Agrivita 2021, 43, 198–208. [Google Scholar] [CrossRef]
  44. Camacho-Rodríguez, M.; José Almaraz-Suárez, J.; Vázquez-Vázquez, C.; Angulo-Castro, A.; Ríos-Vega, M.E.; González-Mancilla, A. Effect of Plant Growth-Promoting Rhizobacteria on the Growth and Yield of Jalapeño Pepper. Rev. Mex. De Cienc. Agrícolas 2022, 13, 185–196. [Google Scholar]
  45. Nejati Sini, H.; Barzegar, R.; Soodaee Mashaee, S.; Ghasemi Ghahsare, M.; Mousavi-Fard, S.; Mozafarian, M. Effects of Biofertilizer on the Production of Bell Pepper (Capsicum annuum L.) in Greenhouse. J. Agric. Food Res. 2024, 16, 101060. [Google Scholar] [CrossRef]
  46. Tahmasebi, A.; Mirzaalian Dastjerdi, A.; Jamali, B. Microbial-Based Biological Treatments Improved the Nutritional, Nutraceutical and Functional Properties of Greenhouse Sweet Pepper (Capsicum annuum L.). Front. Sustain. Food Syst. 2023, 7, 1145972. [Google Scholar] [CrossRef]
  47. Zaidi, A.; Ahmad, E.; Khan, M.S.; Saif, S.; Rizvi, A. Role of Plant Growth Promoting Rhizobacteria in Sustainable Production of Vegetables: Current Perspective. Sci. Hortic. 2015, 193, 231–239. [Google Scholar] [CrossRef]
  48. Lau, E.T.; Tani, A.; Khew, C.Y.; Chua, Y.Q.; Hwang, S.S. Plant Growth-Promoting Bacteria as Potential Bio-Inoculants and Biocontrol Agents to Promote Black Pepper Plant Cultivation. Microbiol. Res. 2020, 240, 126549. [Google Scholar] [CrossRef]
  49. González-Mancilla, A.; Almaraz-Suárez, J.J.; Ferrera-Cerrato, R.; del Pilar Rodríguez-Guzmán, M.; Taboada-Gaytán, O.R. Photosynthetic Activity and Growth of Poblano Pepper Biofertilized with Plant Growth Promoting Rhizobacteria and Arbuscular Mycorrhizal Fungi. Curr. Res. Microb. Sci. 2024, 7, 100269. [Google Scholar] [CrossRef]
  50. Al-Dhabaan, F.A.M.; Bakhali, A.H. Analysis of the Bacterial Strains Using Biolog Plates in the Contaminated Soil from Riyadh Community. Saudi J. Biol. Sci. 2017, 24, 901–906. [Google Scholar] [CrossRef]
  51. Gang, S.; Sharma, S.; Saraf, M.; Buck, M.; Schumacher, J. Analysis of Indole-3-Acetic Acid (IAA) Production in Klebsiellaby LC-MS/MS and the Salkowski Method. Bio Protoc. 2019, 9, e3230. [Google Scholar] [CrossRef]
  52. Nautiyal, C.S. An Efficient Microbiological Growth Medium for Screening Phosphate Solubilizing Microorganisms. FEMS Microbiol. Lett. 1999, 170, 265–270. [Google Scholar] [CrossRef]
  53. Manullang, W.; Chuang, H. Streptomyces sp. Mitigates Abiotic Stress Response and Promotes Plant Growth. J. Plant Prot. Res. 2020, 60, 263–274. [Google Scholar] [CrossRef]
  54. Chaudhary, T.; Gera, R.; Shukla, P. Deciphering the Potential of Rhizobium Pusense MB-17a, a Plant Growth-Promoting Root Endophyte, and Functional Annotation of the Genes Involved in the Metabolic Pathway. Front. Bioeng. Biotechnol. 2021, 8, 617034. [Google Scholar] [CrossRef]
  55. Cook, A.E.; Meyers, P.R. Rapid Identification of Filamentous Actinomycetes to the Genus Level Using Genus-Specific 16S RRNA Gene Restriction Fragment Patterns. Int. J. Syst. Evol. Microbiol. 2003, 53, 1907–1915. [Google Scholar] [CrossRef]
  56. Tamura, K.; Stecher, G.; Kumar, S. MEGA11: Molecular Evolutionary Genetics Analysis Version 11. Mol. Biol. Evol. 2021, 38, 3022–3027. [Google Scholar] [CrossRef]
  57. Jackson, M.L.R. Soil Chemical Analysis; Prentice-Hall: Hoboken, NJ, USA, 1964. [Google Scholar]
  58. Page, A.L. Methods of Soil Analysis. Part 2. Chemical and Microbiological Properties; John Wiley & Sons: Hoboken, NJ, USA, 1982. [Google Scholar]
  59. Klute, A.; Dirksen, C. Hydraulic Conductivity and Diffusivity: Laboratory Methods. In Methods of Soil Analysis; SSSA Book Series; John Wiley & Sons: Hoboken, NJ, USA, 1986; pp. 687–734. ISBN 9780891188643. [Google Scholar]
  60. Hunt, R.; Causton, D.R.; Shipley, B.; Askew, A.P. A Modern Tool for Classical Plant Growth Analysis. Ann. Bot. 2002, 90, 485–488. [Google Scholar] [CrossRef]
  61. Evans, G.C. The Quantitative Analysis of Plant Growth; Univ of California Press: Oakland, CA, USA, 1972; Volume 1, ISBN 0520094328. [Google Scholar]
  62. Khiddir, S.M. A Statistical Approach in the Use of Parametric Systems Applied to the FAO Framework for Land Evaluation; Ghent University: Ghent, Belgium, 1986. [Google Scholar]
  63. Addinsoft XLSTAT. Statistical and Data Analysis Solution; Addinsoft XLSTAT: New York, NY, USA, 2019. [Google Scholar]
  64. Joshi, S.K.; Gauraha, A.K. Global Biofertilizer Market: Emerging Trends and Opportunities. Trends Appl. Microbiol. Sustain. Econ. 2022, 689–697. [Google Scholar]
  65. Etesami, H. The Dual Nature of Plant Growth-Promoting Bacteria: Benefits, Risks, and Pathways to Sustainable Deployment. Curr. Res. Microb. Sci. 2025, 9, 100421. [Google Scholar] [CrossRef]
  66. Olanrewaju, O.S.; Glick, B.R.; Babalola, O.O. Mechanisms of Action of Plant Growth Promoting Bacteria. World J. Microbiol. Biotechnol. 2017, 33, 197. [Google Scholar] [CrossRef]
  67. Ajijah, N.; Fiodor, A.; Pandey, A.K.; Rana, A.; Pranaw, K. Plant Growth-Promoting Bacteria (PGPB) with Biofilm-Forming Ability: A Multifaceted Agent for Sustainable Agriculture. Diversity 2023, 15, 112. [Google Scholar] [CrossRef]
  68. de Oliveira, D.A.; Ferreira, S.d.C.; Carrera, D.L.R.; Serrao, C.P.; Callegari, D.M.; Barros, N.L.F.; Coelho, F.M.; Souza, C.R.B. Characterization of Pseudomonas Bacteria of Piper tuberculatum Regarding the Production of Potentially Bio-Stimulating Compounds for Plant Growth. Acta Amazon. 2021, 51, 10–19. [Google Scholar] [CrossRef]
  69. Hyder, S.; Gondal, A.S.; Rizvi, Z.F.; Ahmad, R.; Alam, M.M.; Hannan, A.; Ahmed, W.; Fatima, N.; Inam-ul-Haq, M. Characterization of Native Plant Growth Promoting Rhizobacteria and Their Anti-Oomycete Potential against Phytophthora Capsici Affecting Chilli Pepper (Capsicum annum L.). Sci. Rep. 2020, 10, 13859. [Google Scholar] [CrossRef]
  70. Ganesh, J.; Hewitt, K.; Devkota, A.R.; Wilson, T.; Kaundal, A. IAA-Producing Plant Growth Promoting Rhizobacteria from Ceanothus Velutinus Enhance Cutting Propagation Efficiency and Arabidopsis Biomass. Front. Plant Sci. 2024, 15, 1374877. [Google Scholar] [CrossRef]
  71. Lata, D.L.; Abdie, O.; Rezene, Y. IAA-Producing Bacteria from the Rhizosphere of Chickpea (Cicer arietinum L.): Isolation, Characterization, and Their Effects on Plant Growth Performance. Heliyon 2024, 10, e39702. [Google Scholar] [CrossRef]
  72. Noreen, S.; Ali, B.; Hasnain, S. Growth Promotion of Vigna mungo (L.) by Pseudomonas spp. Exhibiting Auxin Production and ACC-Deaminase Activity. Ann. Microbiol. 2012, 62, 411–417. [Google Scholar] [CrossRef]
  73. Papade, S.E.; Mohapatra, B.; Phale, P.S. Pseudomonas and Acinetobacter Spp. Capable of Metabolizing Aromatics Displays Multifarious Plant Growth Promoting Traits: Insights on Strategizing Consortium-Based Application to Agro-Ecosystems. Environ. Technol. Innov. 2024, 36, 103786. [Google Scholar] [CrossRef]
  74. Mirik, M.; Aysan, Y.; Cinar, O. Biological Control of Bacterial Spot Disease of Pepper with Bacillus Strains. Turk. J. Agric. For. 2008, 32, 381–390. [Google Scholar]
  75. Phares, C.A.; Amoakwah, E.; Danquah, A.; Afrifa, A.; Beyaw, L.R.; Frimpong, K.A. Biochar and NPK Fertilizer Co-Applied with Plant Growth Promoting Bacteria (PGPB) Enhanced Maize Grain Yield and Nutrient Use Efficiency of Inorganic Fertilizer. J. Agric. Food Res. 2022, 10, 100434. [Google Scholar] [CrossRef]
  76. Kaur, M.; Vyas, P.; Rahi, P.; Sharma, S. Chlorpyrifos- and Carbofuran-Tolerant Phosphate-Solubilising Arthrobacter Oxydans and Bacillus Flexus Improved Growth and Phosphorus Content in Potato in Pesticide-Amended Soils. Potato Res. 2022, 65, 213–231. [Google Scholar] [CrossRef]
  77. Cheng, Y.; Narayanan, M.; Shi, X.; Chen, X.; Li, Z.; Ma, Y. Phosphate-Solubilizing Bacteria: Their Agroecological Function and Optimistic Application for Enhancing Agro-Productivity. Sci. Total Environ. 2023, 901, 166468. [Google Scholar] [CrossRef]
  78. Sharma, S.B.; Sayyed, R.Z.; Trivedi, M.H.; Gobi, T.A. Phosphate Solubilizing Microbes: Sustainable Approach for Managing Phosphorus Deficiency in Agricultural Soils. Springerplus 2013, 2, 587. [Google Scholar] [CrossRef]
  79. Richardson, A.E.; Barea, J.M.; McNeill, A.M.; Prigent-Combaret, C. Acquisition of Phosphorus and Nitrogen in the Rhizosphere and Plant Growth Promotion by Microorganisms. Plant Soil 2009, 321, 305–339. [Google Scholar] [CrossRef]
  80. Mma, Y.; Mfm, E. Biofertilizers and Their Role in Management of Plant Parasitic Nematodes. A Review. E3 J. Biotechnol. Pharm. Res. 2014, 5, 1–6. [Google Scholar]
  81. Zaidi, A.; Khan, M.; Ahemad, M.; Oves, M. Plant Growth Promotion by Phosphate Solubilizing Bacteria. Acta Microbiol. Immunol. Hung. 2009, 56, 263–284. [Google Scholar] [CrossRef]
  82. Mohamed, A.E.; Nessim, M.G.; Abou-el-seoud, I.I.; Darwish, K.M.; Shamseldin, A. Isolation and Selection of Highly Effective Phosphate Solubilizing Bacterial Strains to Promote Wheat Growth in Egyptian Calcareous Soils. Bull. Natl. Res. Cent. 2019, 43, 203. [Google Scholar] [CrossRef]
  83. da Silva, A.M.; da Cruz Paula Neves, P.; Costa, S.S.; Silva, A.; Schneider, M.P.C.; das Graças, D.A.; da Silva, J.K.; Baraúna, R.A. Assessment of Plant-Growth Promoting Potential of Bacteria Isolated from Amazonian Black Pepper Roots. J. Soil. Sci. Plant Nutr. 2024, 24, 2825–2837. [Google Scholar] [CrossRef]
  84. Bachtiar, T.; Syahputra, A.R.; Citraresmini, A.; Nurjayati, R.; Hidawati, H.; Rachmawati, V.; Mulyono, A. Performances of Phosphate-Solubilizing Microorganisms on Soil Chemical Properties under Different Soil Characteristics: A Meta-Analysis. J. Degrad. Min. Lands Manag. 2024, 11, 6351–6366. [Google Scholar] [CrossRef]
  85. Yagmur, B.; Gunes, A. Evaluation of the Effects of Plant Growth Promoting Rhizobacteria (PGPR) on Yield and Quality Parameters of Tomato Plants in Organic Agriculture by Principal Component Analysis (PCA). Gesunde Pflanz. 2021, 73, 219–228. [Google Scholar] [CrossRef]
  86. Vinci, G.; Cozzolino, V.; Mazzei, P.; Monda, H.; Savy, D.; Drosos, M.; Piccolo, A. Effects of Bacillus Amyloliquefaciens and Different Phosphorus Sources on Maize Plants as Revealed by NMR and GC-MS Based Metabolomics. Plant Soil 2018, 429, 437–450. [Google Scholar] [CrossRef]
  87. Abdelsattar, A.M.; El-Esawi, M.A.; Elsayed, A.; Heikal, Y.M. Comparison between Bacterial Bio-Formulations and Gibberellic Acid Effects on Stevia Rebaudiana Growth and Production of Steviol Glycosides through Regulating Their Encoding Genes. Sci. Rep. 2024, 14, 24130. [Google Scholar] [CrossRef]
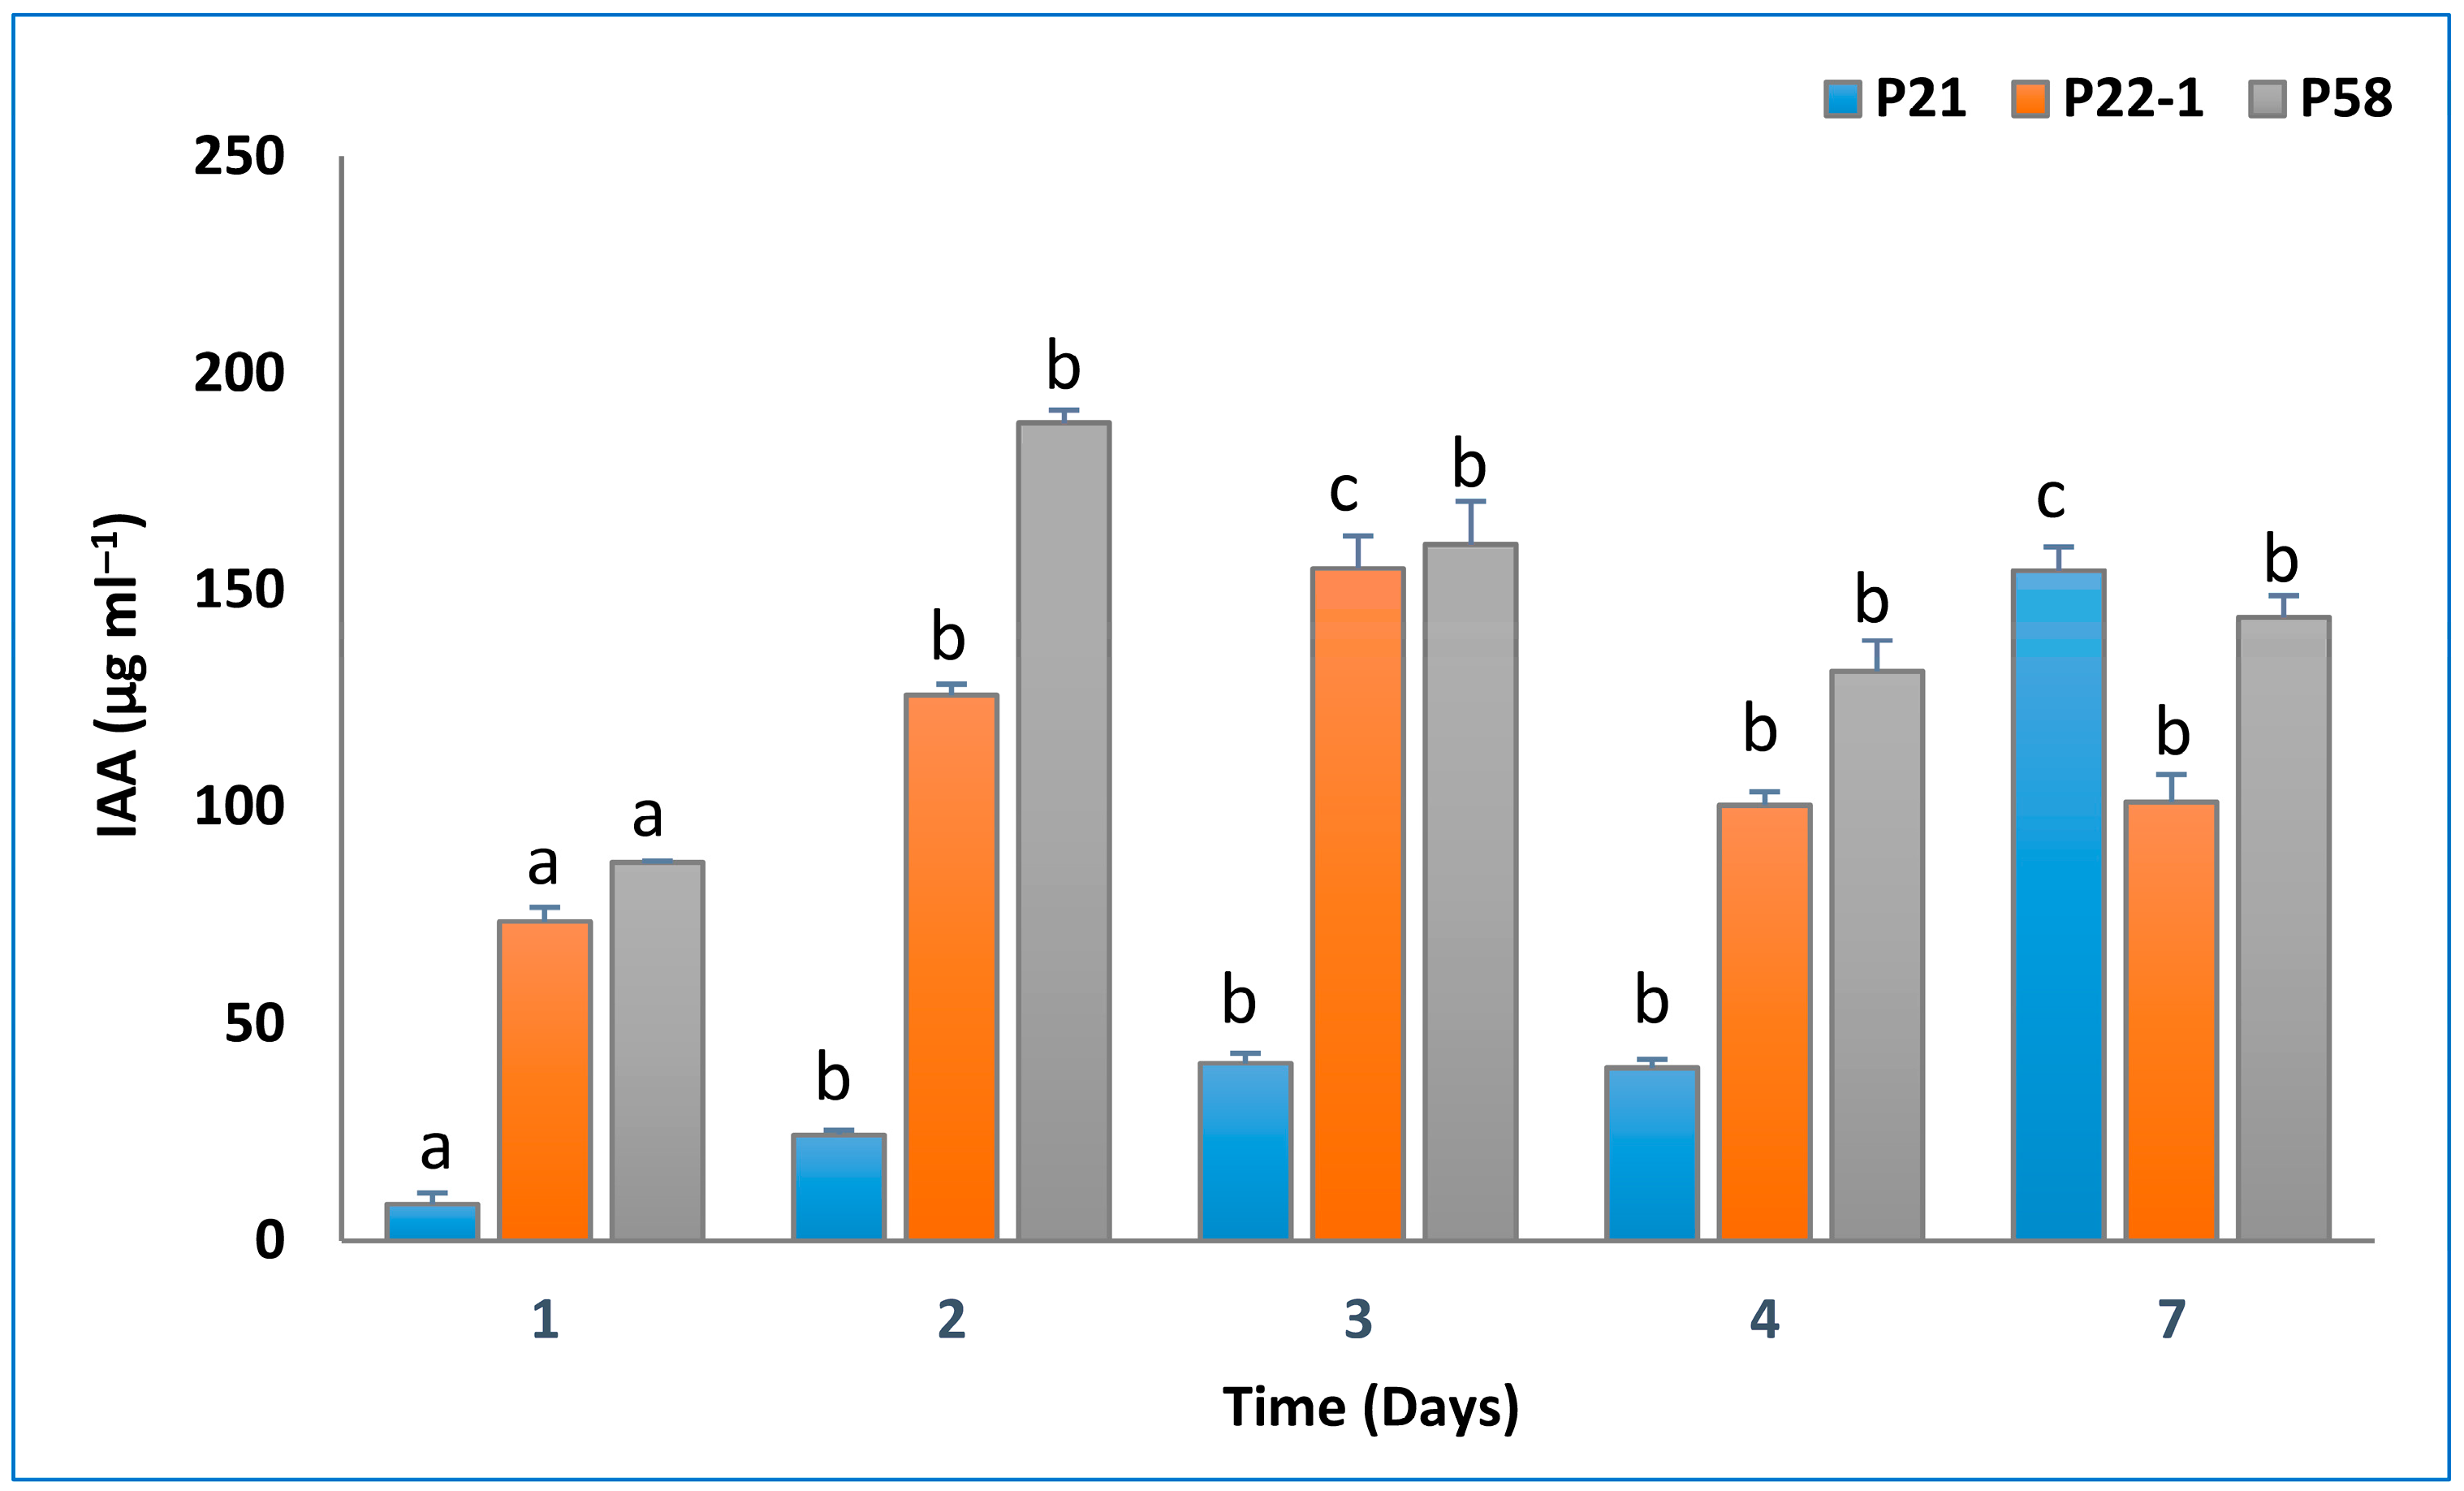
Figure 1. IAA production by three isolates (P21, P22-1, and P58), grown in NB medium supplemented with 0.2% L-tryptophan up to 7 days. All values represent the mean of three replicates, and bars sharing different letters indicate significant differences (p < 0.05).
Agronomy 15 02419 g001
Figure 2. HPLC-FLD analysis detecting IAA in the P58 filtrate after 72 h; LU = Luminescence Unit.
Agronomy 15 02419 g002
Figure 3. Phosphate solubilization by three isolates (P21, P22-1, and P58) grown on/in NBRIP medium. (A) The three isolates (P21, P22-1, and P58) on NBRIP agar medium with halo zones. (B) The P-solubilization activity in NBRIP liquid medium as a decrease in the absorbance at 420 nm. Error bars represent the standard deviation generated from the mean of three replicates. Different letters on the top of each bar reflect significant differences (p < 0.05).
Agronomy 15 02419 g003
Figure 4. Ammonia production after 72 h incubation in peptone water broth. All values reflect the mean of three replicates, and the same letter above the columns reflects non-significant differences.
Agronomy 15 02419 g004
Figure 5. The phylogenetic tree of the three strains (P21, P22-1, and P58) based on the 16S rRNA sequences, Tamura–Nei model, and the Maximum Likelihood method.
Agronomy 15 02419 g005
Figure 6. PC biplot exploring the relationship between the assessed traits under treatments of rock phosphate and three strains with three treatments as plant growth-promoting agents. Mono-super phosphate (MSP), rock phosphate (RP), P58(1) (inoculum added once), P58(2) (inoculum added twice), P58(3) (inoculum added thrice), P21(1) (inoculum added once), P21(2) (inoculum added twice), P21(3) (inoculum added thrice), P22-1(1) (inoculum added once), P22-1(2) (inoculum added twice), and P22-1(3) (inoculum added thrice). These inoculums were implemented at 0, 10, and 20 days from transplanting. Root dry matter percentage (root DM%), stem dry matter percentage (stem DM%), leaf dry matter percentage (leaf DM%), relative growth rate (RGR), and net assimilation rate (NAR).
Agronomy 15 02419 g006
Figure 7. Heatmap correlation between the evaluated traits and appropriate treatments from the three strains (P58, P21, and P22-1) coupled with rock phosphate. Mono-super phosphate (MSP), rock phosphate (RP), P58(1) (inoculum added once), P58(2) (inoculum added twice), P58(3) (inoculum added thrice), P21(1) (inoculum added once), P21(2) (inoculum added twice), P21(3) (inoculum added thrice), P22-1(1) (inoculum added once), P22-1(2) (inoculum added twice), and P22-1(3) (inoculum added thrice). These inoculums were implemented at 0, 10, and 20 days from transplanting. Relative growth rate (RGR), net assimilation rate (NAR), root dry matter percentage (root DM%), stem dry matter percentage (stem DM%), and leaf dry matter percentage (leaf DM%).
Agronomy 15 02419 g007
Table 1. The soil and water physical and chemical properties used for the current study.
PropertiesValue
SoilWater
Physical Properties
Sand (%)94.6-
Silt (%)3.2-
Clay (%)2.2-
TextureSand-
Chemical Properties
1 pH7.847.25
2 EC (dS m−1)1.120.93
3 Nutrients (mg kg−1)
Total N165-
Available P1.13-
Available K69.039.0
4 Soluble Ions (meq L−1)
1-Soluble Anions (meq L−1)
Cl7.87.0
HCO31− + CO32−2.41.3
2-Soluble Cations (meq L−1)
Na+7.76.9
Ca2+3.21.8
Mg2+1.00.9
1 pH was measured in (1: 2.5) soil suspension using a pH meter (Jenway, model 3310). 2 EC (dSm−1) was calculated in the saturated soil paste extract using an EC-meter type (ELE, model 470) [57]. 3 Total-N was determined by micro-Kjeldahl method; available-P was measured by the method of Olsen; Available-K extracted by 1 N NH4OAc at pH 7 and determined at flame photometer. 4 A flame photometer was used to measure sodium and potassium in accordance with the procedure described by Page et al. [58] while EDTA solution was used to measure the soluble cations and anions in saturated soil paste extract for calcium, magnesium, carbonate and bicarbonate, and chloride by titrating with silver nitrate and hydrochloric acid, respectively. Soil particle size distribution was carried out using the hydrometer method [59].
Table 2. Effects of PGPB (biofertilizer), organic (rock phosphate), and chemical (mono-super phosphate) treatments on a few vegetative growth traits of sweet pepper plants grown in a greenhouse after 30 and 45 days after transplanting (DAT), including plant height (cm), number of leaves per plant−1, root length (cm), leaf DM%, stem DM%, and root DM%.
TreatmentsPlant Height
(cm)
No. of Leaves Plant−1Root Length
(cm)
Leaf DM
(%)
Stem DM
(%)
Root DM
(%)
30DAT45DAT30DAT45DAT30DAT45DAT30DAT45DAT30DAT45DAT30DAT45DAT
RP46.00 ± 4.36 bc52.00 ± 7.21 def48.0 ± 14.1 bc63.0 ± 13.9 b15.23 ± 1.37 a17.00 ± 2.65 c13.78 ± 0.32 a13.21 ± 0.62 a12.29 ± 0.71 bcd13.56 ± 0.26 a21.41 ± 2.08 ab16.55 ± 0.99 ab
MSP40.33 ± 7.02 cd48.67 ± 8.14 ef51.3 ± 1.2 abc64.0 ± 22.3 b14.83 ± 0.76 a16.33 ± 1.15 c13.82 ± 0.94 a12.75 ± 1.24 ab13.69 ± 0.49 a13.08 ± 1.71 ab23.03 ± 8.43 a17.62 ± 1.22 a
P58(1)32.67 ± 0.58 d44.67 ± 5.03 f36.7 ± 11.0 c73.3 ± 7.6 ab17.33 ± 3.21 a18.67 ± 2.08 bc12.94 ± 1.03 a10.62 ± 1.19 c11.83 ± 0.369 d10.24 ± 1.47 c18.06 ± 3.94 abc7.80 ± 2.60 f
P58(2)41.33 ± 9.07 bc56.33 ± 2.08 cde55.3 ± 11.0 ab78.7 ± 20.6 ab16.00 ± 1.00 a22.67 ± 6.43 abc13.68 ± 0.84 a10.17 ± 1.63 c13.76 ± 0.21 a11.42 ± 1.00 bc18.64 ± 4.56 abc8.87 ± 0.78 ef
P58(3)46.00 ± 1.73 bc67.00 ± 11.36 bc53.7 ± 7.6 ab94.7 ± 2.1 ab16.97 ± 0.90 a25.33 ± 0.58 ab14.20 ± 0.69 a11.86 ± 0.54 abc13.10 ± 0.58 ab12.90 ± 1.13 ab16.07 ± 1.70 bc14.22 ± 2.82 abc
P21(1)46.33 ± 2.08 bc60.67 ± 2.31 bcd55.3 ± 5.1 ab73.3 ± 18.8 ab17.90 ± 1.01 a26.67 ± 1.15 a13.97 ± 0.66 a10.70 ± 0.28 c12.98 ± 0.46 abc12.35 ± 1.20 ab20.37 ± 3.60 abc10.08 ± 1.99 def
P21(2)56.67 ± 4.16 a68.67 ± 1.53 b54.7 ± 10.0 ab102.0 ± 12.0 a18.13 ± 2.58 a20.67 ± 4.51 abc13.18 ± 0.58 a11.69 ± 1.57 abc13.06 ± 0.30 ab13.27 ± 0.03 ab16.77 ± 0.53 abc13.56 ± 2.31 bcd
P21(3)57.00 ± 5.57 a84.67 ± 7.57 a54.3 ± 7.0 ab101.7 ± 30.7 a18.60 ± 1.22 a20.33 ± 0.58 abc13.87 ± 0.67 a11.68 ± 0.57 abc12.18 ± 0.71 cd13.58 ± 0.94 a18.08 ± 1.33 abc12.08 ± 0.29 cde
P22-1(1)45.67 ± 2.89 bc65.00 ± 1.73 bc48.0 ± 6.1 bc80.7 ± 7.4 ab16.00 ± 1.73 a22.67 ± 5.51 abc13.17 ± 0.73 a10.90 ± 0.43 bc12.12 ± 0.41 d12.67 ± 0.79 ab14.45 ± 1.77 c12.67 ± 1.33 bcde
P22-1(2)47.33 ± 3.06 bc71.67 ± 4.93 b60.7 ± 5.0 ab79.7 ± 16.3 ab17.43 ± 3.02 a21.33 ± 1.15 abc13.46 ± 0.88 a11.87 ± 1.25 abc12.10 ± 0.17 d13.69 ± 0.96 a15.20 ± 0.98 bc13.52 ± 3.72 bcd
P22-1(3)50.00 ± 2.65 ab63.00 ± 2.65 bc66.3 ± 2.1 a87.0 ± 15.6 ab16.33 ± 3.21 a21.00 ± 5.20 abc14.31 ± 1.01 a11.82 ± 0.48 abc11.63 ± 0.35 d12.28 ± 0.64 ab14.87 ± 1.06 bc14.01 ± 2.62 abcd
Mono-super phosphate (MSP, T1), rock phosphate (RP, T2), RP + P58(1) (T3), RP + P58(2) (T4), RP + P58(3) (T5) and RP + P21(1) (T6), RP + P21(2) (T7), RP + P21(3) (T8), RP + P22-1(1) (T9), RP + P22-1(2) (T10), RP + P22-1(3) (T11), dry matter (DM), DAT = days after transplanting. Values followed by the different letter(s) within each column significantly differ according to Duncan’s multiple range test at the 5% level. Data were presented as mean of triplicates ± standard deviation.
Table 3. Effects of organic (rock phosphate), chemical (mono-super phosphate), and PGPB (biofertilizer) treatments on some vegetative growth traits [leaf area (cm2), chlorophyll (SPAD), seedling index, stem diameter below cotyledons (cm), hypocotyl length (cm), and first internode length (cm)] of growing sweet pepper plants under greenhouse conditions after 30 and 45 days after transplanting (DAT).
TreatmentsLeaf Area (cm2)Chlorophyll (SPAD)Seedling IndexStem Diameter Below Cotyledons (cm)Hypocotyl Length (cm)First Internode Length (cm)
30DAT45DAT30DAT45DAT30DAT45DAT30DAT45DAT30DAT45DAT30DAT45DAT
RP1239.7 ± 347 ab1914.7 ± 182 cd58.5 ± 7.04 ab70.1 ± 8.55 ab0.16 ± 0.07 bc0.27 ± 0.08 d0.73 ± 0.15 ab0.93 ± 0.15 c1.63 ± 0.55 bc1.00 ± 0.00 c2.07 ± 0.12 b2.60 ± 0.53 cd
MSP1237.7 ± 147 ab1464.0 ± 140 d50.6 ± 3.59 b57.5 ± 9.88 b0.20 ± 0.03 abc0.21 ± 0.04 d0.80 ± 0.17 ab0.67 ± 0.21 d2.77 ± 0.25 ab1.00 ± 0.00 c2.56 ± 0.40 ab2.40 ± 0.53 d
P58(1)916.3 ± 236 b1632.5 ± 156 cd53.7 ± 2.47 ab68.4 ± 7.15 ab0.11 ± 0.05 c0.23 ± 0.06 d0.63 ± 0.20 b0.87 ± 0.06 cd1.10 ± 0.17 c2.67 ± 0.58 ab2.53 ± 0.90 ab3.33 ± 0.58 abc
P58(2)1431.7 ± 402 a1976.7 ± 188 c57.9 ± 8.77 ab78.6 ± 10.44 a0.25 ± 0.11 ab0.25 ± 0.07 d0.80 ± 0.10 ab0.90 ± 0.17 cd3.10 ± 1.65 a2.33 ± 0.58 ab3.57 ± 1.24 a3.50 ± 0.50 ab
P58(3)1311.3 ± 103 ab2748.5 ± 262 b65.6 ± 11.30 a69.4 ± 10.55 ab0.22 ± 0.04 ab0.51 ± 0.09 ab0.83 ± 0.06 ab1.27 ± 0.23 ab2.47 ± 0.42 ab2.87 ± 0.23 a3.40 ± 0.40 a3.60 ± 0.17 a
P21(1)1341.7 ± 149 ab2994.0 ± 286 b61.5 ± 7.65 ab75.4 ± 4.03 a0.19 ± 0.01 abc0.34 ± 0.04 abc0.77 ± 0.06 ab1.00 ± 0.00 bc2.87 ± 0.90 ab2.33 ± 0.58 ab2.87 ± 0.23 ab2.83 ± 0.58 abcd
P21(2)1389.7 ± 61 a2900.0 ± 277 b58.9 ± 7.48 ab73.5 ± 9.81 ab0.23 ± 0.03 ab0.47 ± 0.13 abc0.90 ± 0.10 a1.20 ± 0.10 ab2.23 ± 0.25 abc2.33 ± 0.58 ab3.50 ± 0.00 a2.70 ± 0.17 bcd
P21(3)1514.0 ± 99 a3147.7 ± 300 b53.4 ± 0.21 ab71.4 ± 3.51 ab0.22 ± 0.05 ab0.48 ± 0.02 abc0.92 ± 0.03 a1.30 ± 0.10 a2.17 ± 0.29 abc2.07 ± 0.06 b2.83 ± 0.29 ab3.00 ± 0.00 abcd
P22-1(1)1356.0 ± 312 ab3704.0 ± 482 a59.1 ± 5.40 ab70.3 ± 7.16 ab0.21 ± 0.05 ab0.47 ± 0.08 abc0.77 ± 0.15 ab1.20 ± 0.10 ab2.53 ± 0.50 ab2.37 ± 0.35 ab3.07 ± 1.01 ab2.83 ± 0.29 abcd
P22-1(2)1494.7 ± 126 a3260.7 ± 311 ab59.2 ± 7.57 ab75.3 ± 12.09 a0.27 ± 0.06 a0.44 ± 0.13 bc0.90 ± 0.10 a1.23 ± 0.21 ab2.07 ± 0.86 abc2.43 ± 0.40 ab2.77 ± 0.32 ab3.27 ± 0.46 abc
P22-1(3)1346.7 ± 251 ab2866.5 ± 273 b62.5 ± 2.40 ab73.9 ± 5.15 ab0.21 ± 0.03 ab0.61 ± 0.07 a0.90 ± 0.10 a1.37 ± 0.06 a2.80 ± 0.52 ab2.03 ± 0.06 b2.53 ± 0.15 ab3.30 ± 0.52 abc
Mono-super phosphate (MSP, T1), rock phosphate (RP, T2), RP + P58(1) (T3), RP + P58(2) (T4), RP + P58(3) (T5) and RP + P21(1) (T6), RP + P21(2) (T7), RP + P21(3) (T8), RP + P22-1(1) (T9), RP + P22-1(2) (T10), RP + P22-1(3) (T11), DAT = days after transplanting. Values followed by the different letters within each column are significantly differ according to Duncan’s multiple range test at the 5% level. Each value is the average of three replicates. Data were presented as mean of triplicates ± standard deviation.
Table 4. Effects of PGPB (biofertilizer), organic (rock phosphate), and chemical (mono-super phosphate) treatments on a few vegetative growth parameters in sweet pepper plants grown in greenhouses, including relative growth rate (mg g−1 day−1) and net assimilation rate (mg cm−2 day−1).
TreatmentsNet Assimilation Rate
(NAR) (mg cm2 d−1)
Relative Growth Rate
(RGR) (mg g−1 d−1)
RP0.25 ± 0.16 cd0.03 ± 0.02 ab
MSP0.27 ± 0.02 bcd0.04 ± 0.01 ab
P58(1)0.33 ± 0.18 abcd0.05 ± 0.03 a
P58(2)0.14 ± 0.11 d0.02 ± 0.02 b
P58(3)0.51 ± 0.22 abc0.05 ± 0.02 a
P21(1)0.30 ± 0.08 abcd0.04 ± 0.01 ab
P21(2)0.41 ± 0.16 abc0.04 ±0.02 ab
P21(3)0.54 ± 0.15 ab0.06 ± 0.01 a
P22-1(1)0.37 ± 0.07 abcd0.05 ± 0.01 ab
P22-1(2)0.32 ± 0.18 abcd0.04 ± 0.02 ab
P22-1(3)0.56 ± 0.07 a0.06 ± 0.01 a
Mono-super phosphate (MSP, T1), rock phosphate (RP, T2), RP + P58(1) (T3), RP + P58(2) (T4), RP + P58(3) (T5) and RP + P21(1) (T6), RP + P21(2) (T7), RP + P21(3) (T8), RP + P22-1(1) (T9), RP + P22-1(2) (T10), RP + P22-1(3) (T11). Values followed by the different letters within each column are significantly differ according to Duncan’s multiple range test at the 5% level. Data were presented as mean of triplicates ± standard deviation.
Table 5. Effect of phosphorus fertilizers and biofertilizer treatments on plant leaf, stem, and root phosphorus concentrations.
TreatmentP-Uptake (mg plant−1)
LeafStemRootTotal Uptake
RP15.1 ± 0.08 e17.6 ± 0.05 e16.6 ± 0.12 abc49.2 ± 0.19 d
MSP19.2 ± 0.22 abcd22.3 ± 0.33 abcd19.4 ± 0.17 ab60.8 ± 0.72 ab
P58(1)19.6 ± 0.26 abcd18.7 ± 0.30 de12.0 ± 0.42 cde50.3 ± 0.90 cd
P58(2)19.7 ± 0.29 abcd20.5 ± 0.14 cde10.2 ± 0.07 e50.4 ± 0.41 cd
P58(3)22.3 ± 0.14 a22.0 ± 0.23 abcd19.7 ± 0.35 a64.0 ± 0.25 a
P21(1)16.7 ± 0.07 de22.3 ± 0.25 abcd11.6 ± 0.24 de50.6 ± 0.54 cd
P21(2)19.8 ± 0.24 abcd25.2 ± 0.05 ab14.8 ± 0.22 bcde59.8 ± 0.41 abc
P21(3)18.7 ± 0.12 bcd25.6 ± 0.23 a15.6 ± 0.06 abcd59.9 ± 0.38 abc
P22-1(1)18.6 ± 0.04 cd22.8 ± 0.15 abc12.0 ± 0.11 cde53.4 ± 0.12 bcd
P22-1(2)22.1 ± 0.19 ab21.4 ± 0.11 bcd11.8 ± 0.31 de55.3 ± 0.53 abcd
P22-1(3)20.4 ± 0.12 abc22.7 ± 0.16 abc17.0 ± 0.35 ab60.0 ± 0.62 abc
According to Duncan’s multiple range test, values in each column that are followed by the same letters did not differ substantially at the 5% level. Three replicates are averaged to produce each value. Mono phosphate (MSP), rock phosphate (RP). Data were presented as mean of triplicates ± standard deviation.
Disclaimer/Publisher’s Note: The statements, opinions and data contained in all publications are solely those of the individual author(s) and contributor(s) and not of MDPI and/or the editor(s). MDPI and/or the editor(s) disclaim responsibility for any injury to people or property resulting from any ideas, methods, instructions or products referred to in the content.