Article

Assessing the Synergy of Spring Strip Tillage and Straw Mulching to Mitigate Soil Degradation and Enhance Productivity in Black Soils

1
Faculty of Agronomy, Inner Mongolia Agricultural University, Hohhot 010019, China
2
Arongqi Agricultural Development Center Affiliation, Arongqi 162750, China
*
Author to whom correspondence should be addressed.
These authors contributed equally to this work.
Agronomy 2025, 15(6), 1415; https://doi.org/10.3390/agronomy15061415 (registering DOI)
Submission received: 30 April 2025 / Revised: 5 June 2025 / Accepted: 6 June 2025 / Published: 9 June 2025

Abstract

:
To address the critical challenges of wind erosion mitigation and sustainable soil management in the fragile agroecosystem of the black soil region in the foothills of the Daxing’anling Mountains, this study evaluated five tillage practices—conventional ridge tillage (CP), no tillage with straw removal (NT), no tillage with straw mulching (R+NT), autumn strip tillage with straw mulching (R+STA), and spring strip tillage with straw mulching (R+STS)—across two landforms: gently sloped uplands and flat depressions. The results demonstrated that R+STS achieved superior performance across both landscapes, exhibiting a 42.99% reduction in the wind erosion rate, a 48.88% decrease in soil sediment discharge, and a 52.26% reduction in the soil creep amount compared to CP. These improvements were mechanistically linked to the enhanced surface microtopography (aerodynamic roughness increased by 1.8–2.3 fold) and optimized straw coverage (68–72%). R+STS also enhanced the topsoil fertility, increasing the total nitrogen (TN), soil organic carbon (SOC), alkaline nitrogen (AN), available phosphorus (AP), and rapidly available potassium (AK) by 22.07%, 12.94%, 14.92%, 32.94%, and 9.52%, respectively. Furthermore, it improved maize emergence and its yield by 10.04% and 9.99% compared to R+NT. Mantel tests and SEM revealed strong negative correlations between erosion and nutrients, identifying nitrogen availability as the key yield driver. R+STS offers a sustainable strategy for erosion control and productivity improvement in the black soil region.

1. Introduction

The black soils along the foothills of the Daxing’anling Mountains, characterized by abundant organic matter content and inherently high fertility, support high maize productivity and serve as a critical stabilizer for China’s grain production [1,2]. The region’s terrain, primarily consisting of gently sloped uplands (Mangangdi) and flat depressions (Dianzidi), experiences concentrated rainfall in July and August, frequent spring droughts leading to low soil moisture content, and seasonal variations in wind speed, with stronger winds in spring and weaker winds in winter [3,4], which contribute to significant soil wind erosion during the spring. The traditional farming practices along the Daxing’anling Mountains’ foothills, primarily involving straw removal, plow tillage, and rotary tillage, have led to severe soil erosion, resulting in the thinning of the cultivated layer, a decline in soil fertility, and the significant degradation of the black soil [5]. Statistical data reveal that nearly 30% of the cultivated land in Northeast China’s black soil region experiences soil and water erosion, with the black soil layer thickness degraded to approximately 5 cm in severely affected zones [6,7].
The Northeast China Black Soil Conservation White Paper (2020), released by the Chinese Academy of Sciences in July 2021, explicitly states that, over the past six decades, the soil organic matter content in the cultivated black soil layer has declined by one-third across the region, with reductions reaching 50% in severely affected areas, accompanied by an average loss of over 20 cm in the black soil thickness [8]. The accelerating degradation of the cultivated land quality in the black soil region poses a severe threat to national food security and the sustainable utilization of these fertile soils—a critical concern that has garnered significant national attention. Therefore, while ensuring grain production, mitigating the degradation of the cultivated land quality and reducing farmland erosion in the black soil region have become significant issues that demand immediate resolution.
Research by Liang et al. [9] demonstrates that conservation tillage practices, primarily characterized by straw mulching, stubble retention, no till, and reduced tillage, have positive effects on agricultural productivity and environmental protection when compared to conventional tillage practices dominated by plowing and rotary tillage. These practices effectively protect farmland and mitigate soil wind erosion [9,10,11]. Crop straw is rich in essential nutrient elements, serving as a vital fertilizer source in agricultural production [12]. Crop straw incorporation increases the plant-derived organic matter input, enhancing the soil organic carbon, total nitrogen, and available nutrient content, which is crucial for soil quality assessment [13,14,15].
Numerous studies have demonstrated that no tillage with straw mulching effectively controls soil erosion and enhances soil stabilization through the dual mechanism of surface coverage by crop residues and stubble, combined with a reduced frequency and intensity of mechanical tillage [16,17]. However, in the foothills of the Daxing’anling Mountains—characterized by cold, arid conditions and frequent spring droughts—conventional no tillage with straw mulching, while effective in reducing soil erosion and enhancing the soil nutrient content, also lowers the soil temperatures, thereby slowing the early growth of maize and leading to other problems. Previous studies conducted by this group have shown that strip tillage with straw mulching effectively addresses issues such as low soil temperatures during sowing, poor sowing quality, and severe seedling shortage, which are common in no-tillage systems with straw mulching [18].
However, to the best of our knowledge, no research has yet examined the combined effects of strip tillage with straw mulching on both soil erosion control and soil fertility enhancement, either domestically or internationally. In summary, this study aimed to identify the erosion-reducing, fertility-enhancing, and yield-increasing effects and mechanisms of straw mulching with strip tillage, providing a theoretical basis for the protection of black soil resources and improvements in grain productivity in the foothill region of the Daxing’anling Mountains.

2. Materials and Methods

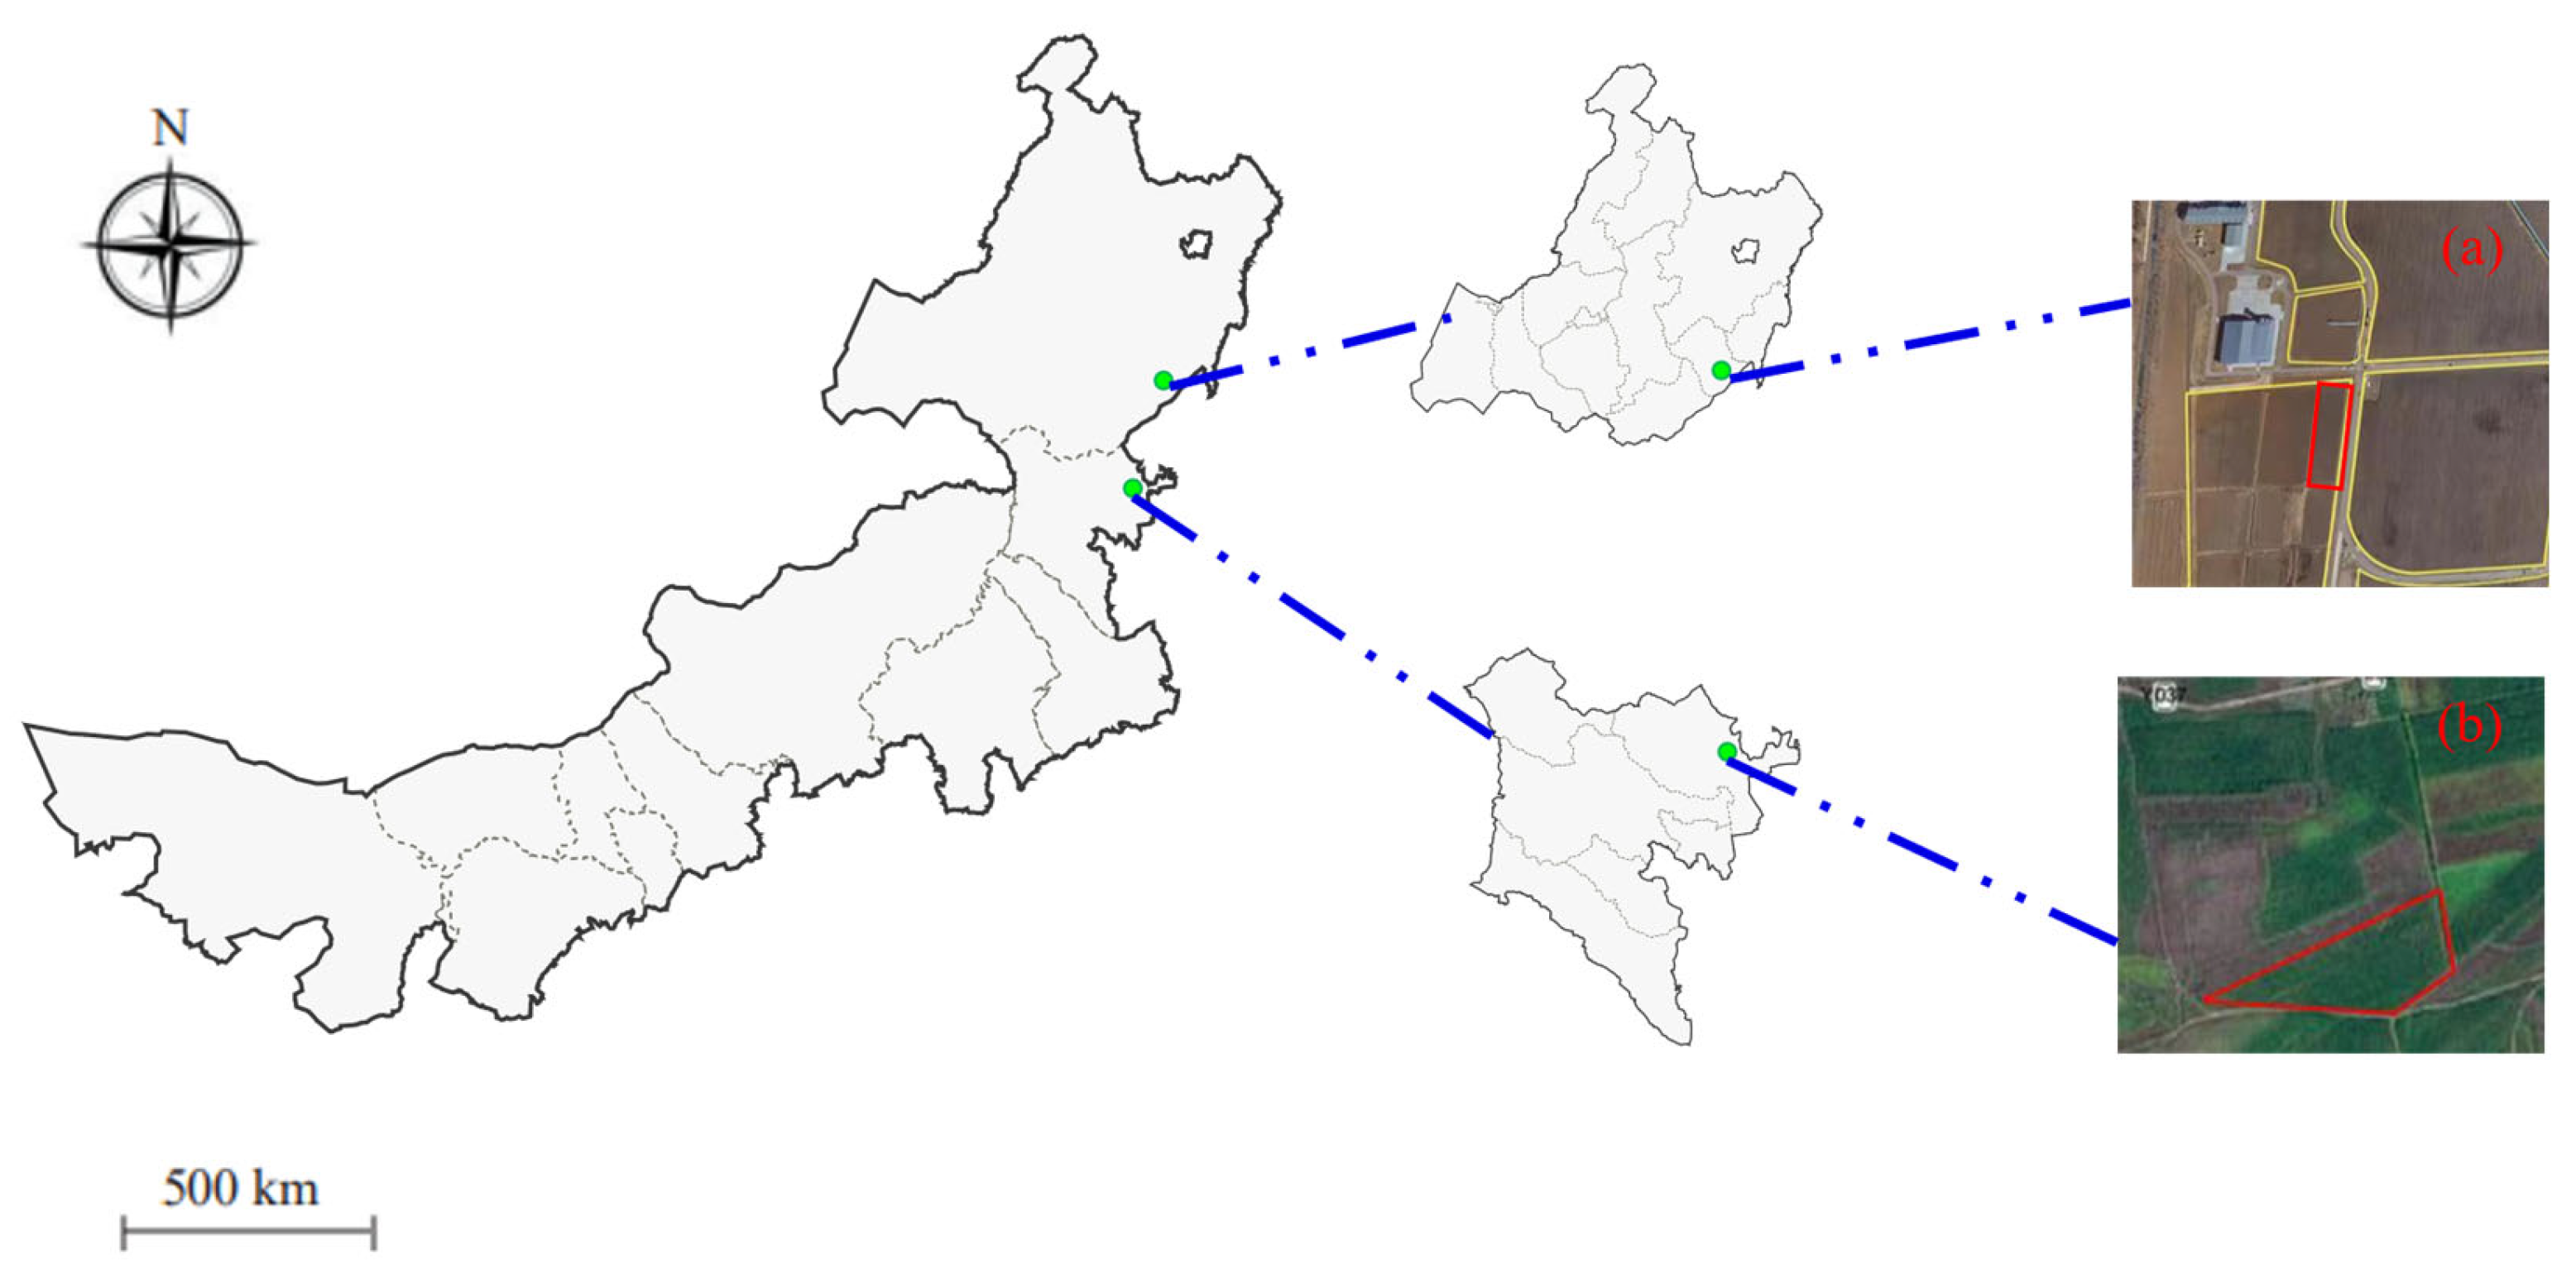
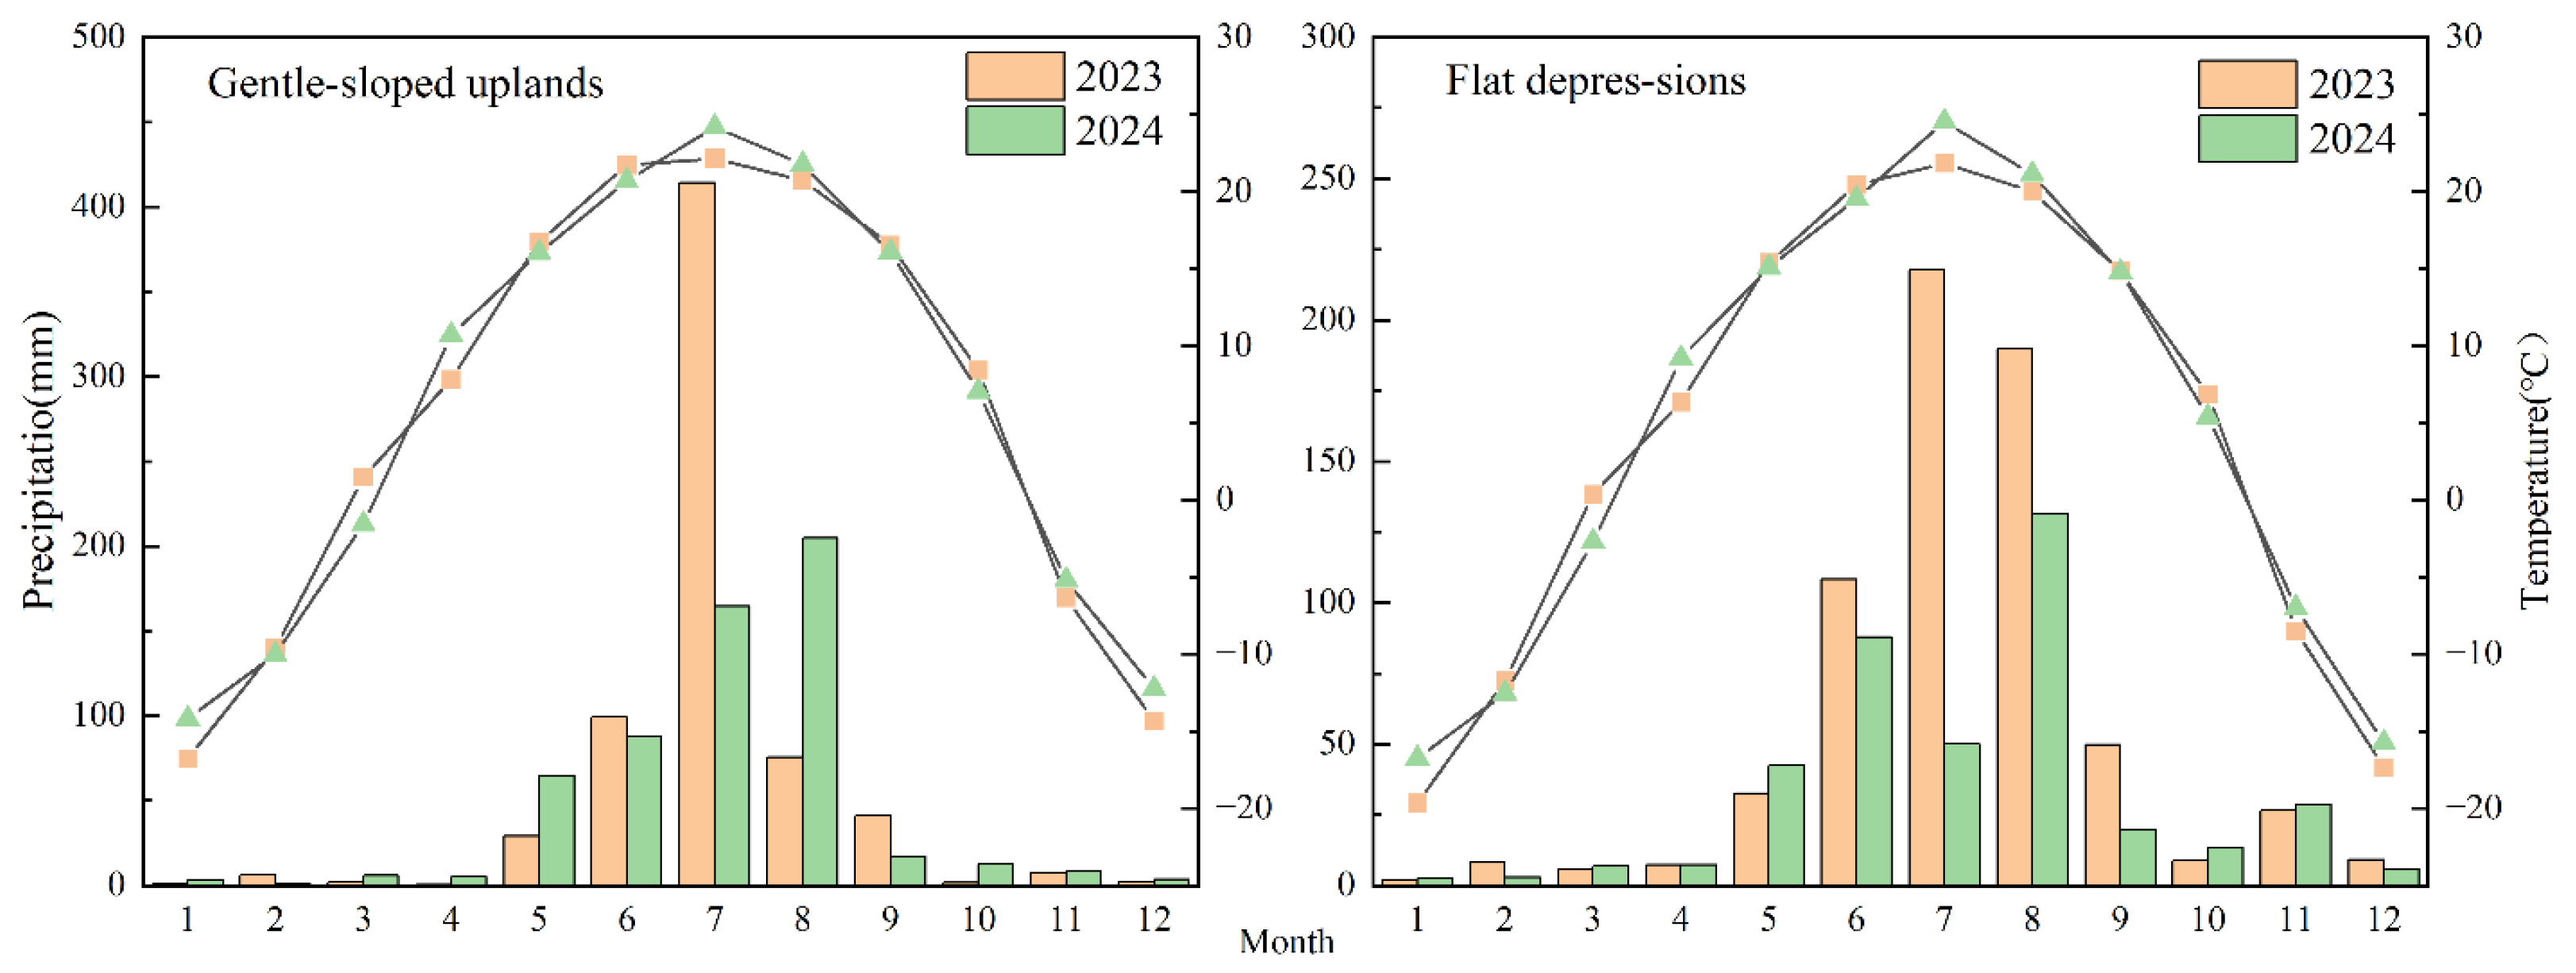
2.1. Experimental Site and Soil Properties

This experiment was conducted from 2023 to 2024 at two sites (Figure 1): the Xinli Town Experimental Base (46°45′ N, 122°47′ E) of the Agriculture, Animal Husbandry, and Science and Technology Bureau in Zhalaite Banner, Xing’an League, Inner Mongolia Autonomous Region and the Modern Agricultural Demonstration Park in Naji Town, Arong Banner, Hulunbuir City, Inner Mongolia Autonomous Region (48°07′ N, 123°28′ E). Xinli Town experiences a temperate continental climate, with an average annual temperature of 3.24 °C, annual precipitation of 400 mm, and a frost-free period of 120–140 days. Naji Town also has a temperate continental climate, with an average annual temperature ranging from 0 to 3.6 °C, annual precipitation of approximately 450 mm, and a frost-free period of 110–130 days. The previous crop at both sites was maize, and the soil type was black soil. In the 0–20 cm soil layer, the organic matter content was 16.0 g·kg−1 and 27.9 g·kg−1, the total nitrogen content was 1.1 g·kg−1 and 1.3 g·kg−1, the available phosphorus content was 17.2 mg·kg−1 and 22.5 mg·kg−1, the available potassium content was 150.5 mg·kg−1 and 158.6 mg·kg−1, and the pH was 6.8 and 6.6 at Xinli Town and Naji Town, respectively. The annual precipitation and daily average temperature are shown in Figure 2.

2.2. Experimental Design and Management

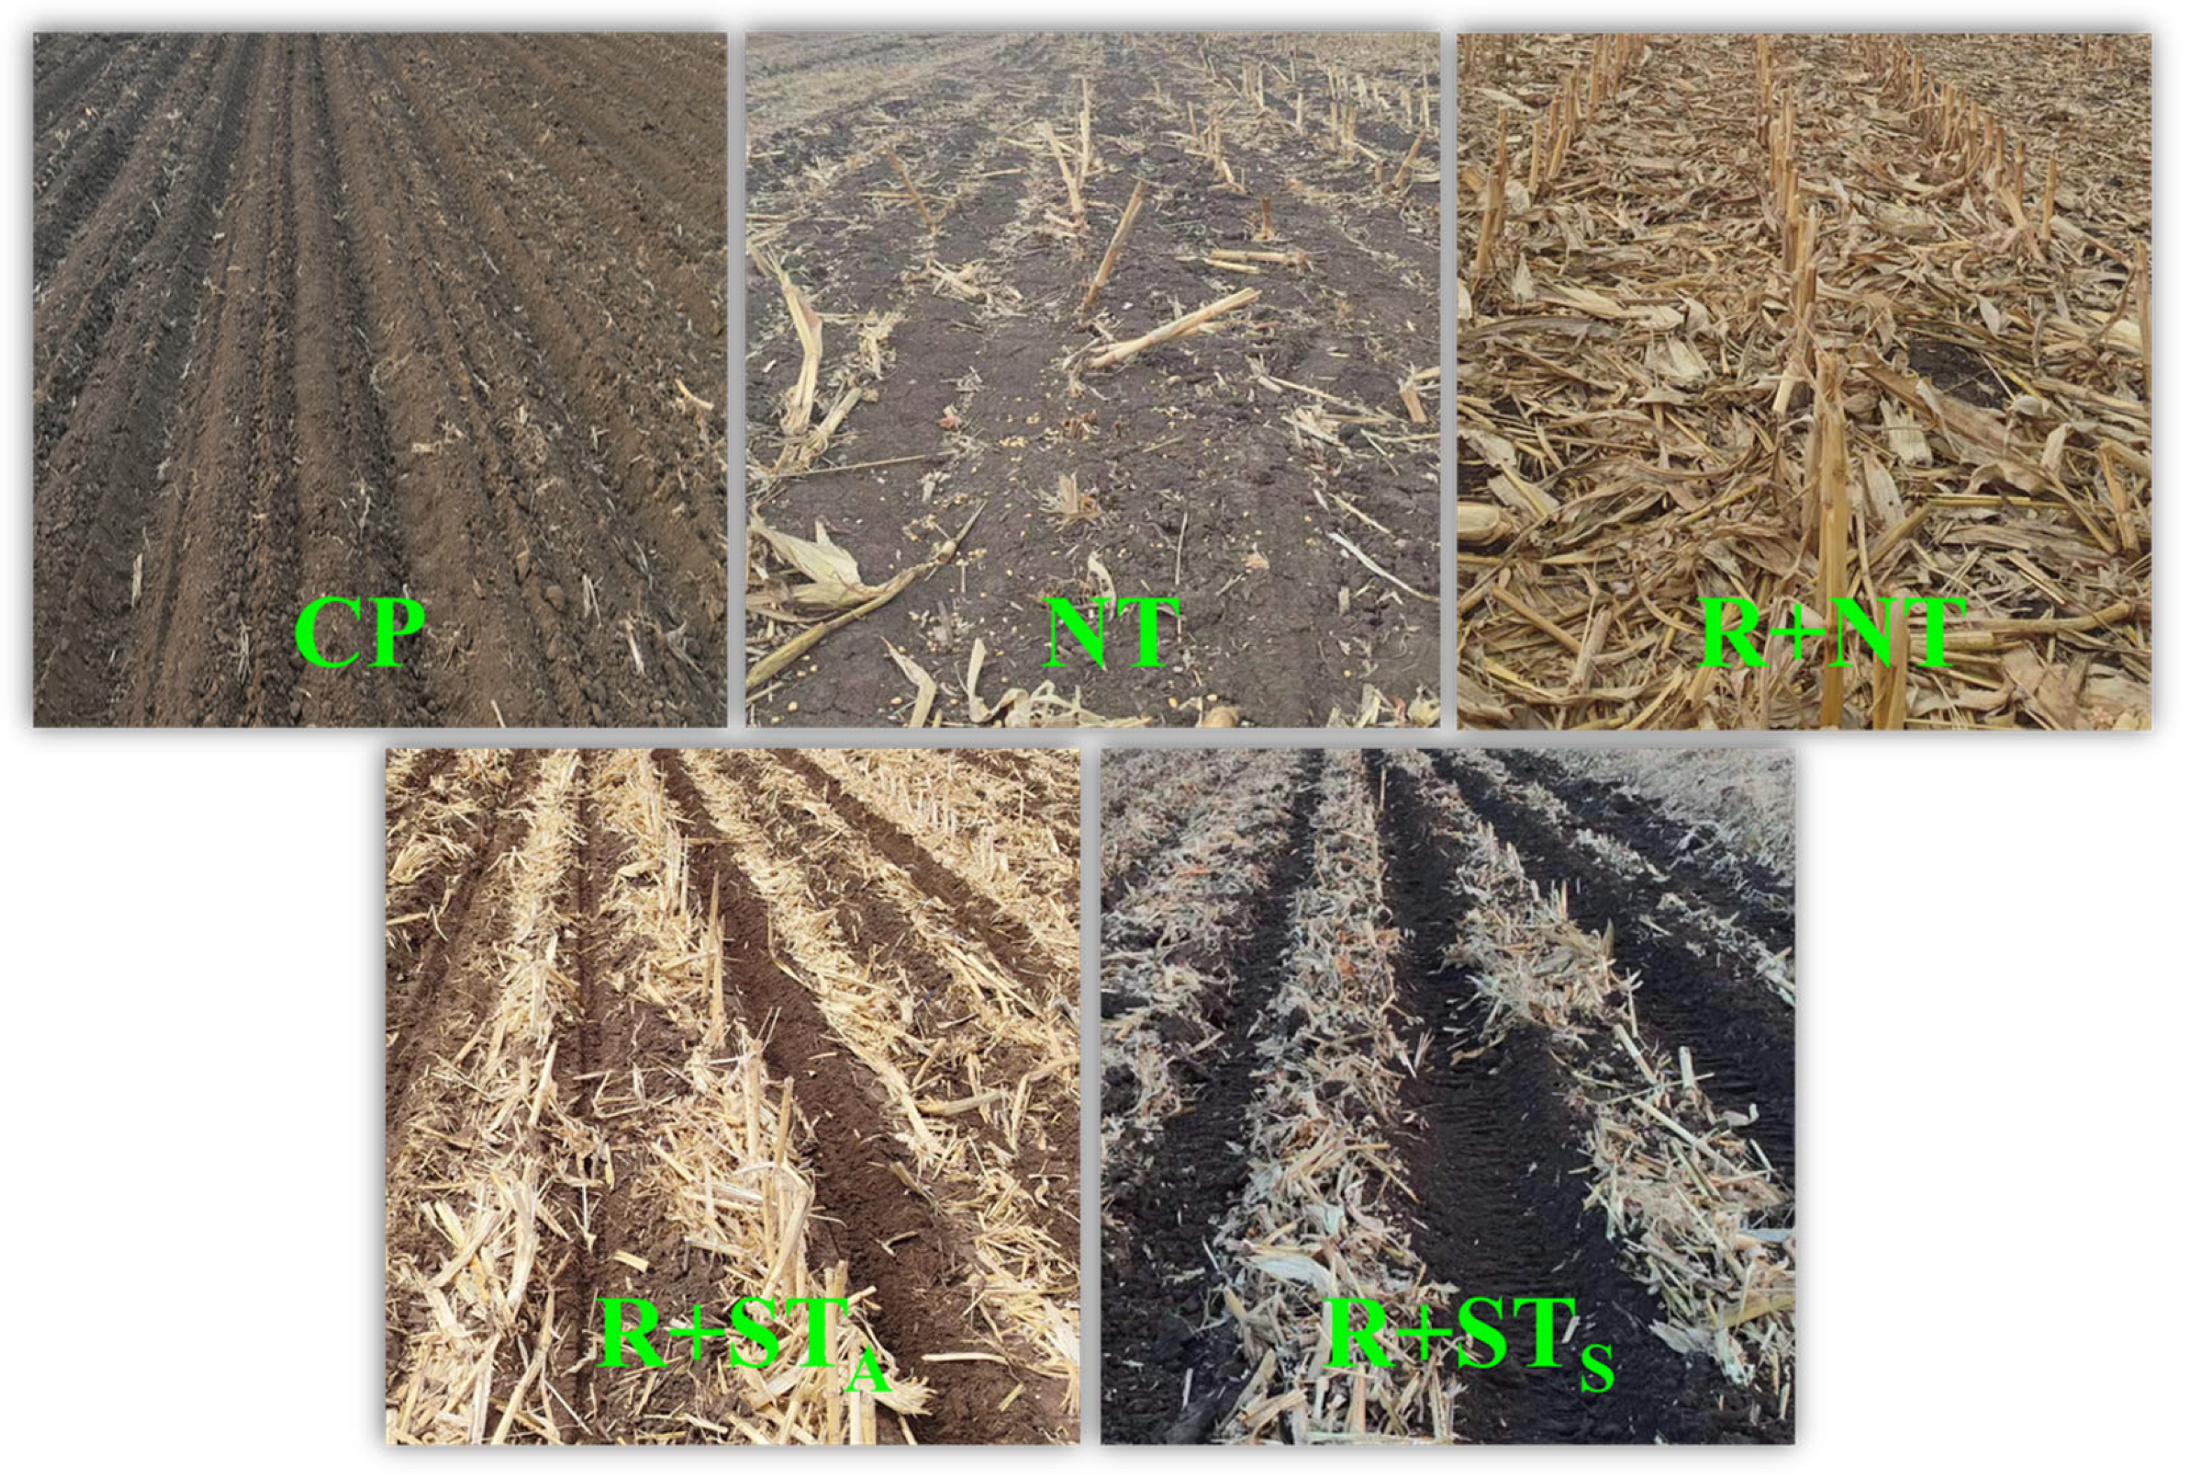
2.2.1. Experimental Design

This experiment was conducted in two distinct regions: Zhalaite Banner, characterized primarily by gently sloped uplands, and Arong Banner, dominated by flat depressions. Under the local traditional farmer fertilization regime, five tillage practices were established (Figure 3).
  • Conventional Ridge Tillage (CP): In Zhalaite Banner, straw was removed after the autumn harvest, and the field was rotary-tilled and ridged uniformly before spring sowing. In Arong Banner, straw was removed after the autumn harvest, followed by plowing, land leveling, and the formation of large ridges, with direct sowing conducted in the following year.
  • No Tillage with Straw Removal (NT): After the autumn harvest, all straw was removed from the field using a straw removal machine. In the following year, a no-till planter was used for direct sowing.
  • No Tillage with Straw Mulching (R+NT): After the autumn harvest, straw stubble was retained at a height of 30 cm. In the following year, a no-till planter was used for direct sowing.
  • Strip Tillage with Straw Mulching after Autumn Harvest (R+STA): After the autumn harvest, straw stubble was retained at a height of 30 cm. A strip-till machine was used to clear the seedling zone and perform deep loosening, soil crushing, and compaction. In the following year, a no-till planter was used for fertilization and sowing.
  • Strip Tillage with Straw Mulching during Spring Sowing (R+STS): After the autumn harvest, straw stubble was retained at a height of 30 cm. Before spring sowing, a strip-till machine was used to clear the seedling zone and perform deep loosening, soil crushing, and compaction. Subsequently, a no-till planter was used for fertilization and sowing.

2.2.2. Crop Establishment and Maintenance

The maize varieties used in this experiment were C1563 (China National Seed Group Co., Ltd., Beijing, China) in Zhalaite Banner and J6518 (China Seed International Seed Co., Ltd., Zhangye, China) in Arong Banner, both of which were recommended cultivars suitable for the respective study sites.
The fertilizers used in this experiment were urea (46% ≤ N) and compound fertilizer (N-P2O5-K2O = 16-22-13). The total nutrient inputs were 225 kg·ha−1 of pure N, 97.5 kg·ha−1 of P2O5, and 105.6 kg·ha−1 of K2O. At sowing, compound fertilizer (N-P-K: 16-22-13) was applied as a base fertilizer at a rate of 450 kg·ha−1. Urea was top-dressed at the V6 at a rate of 333 kg·ha−1. The experiment was designed in large plots with row spacing of 65 cm. Each plot covered an area of 624 m2, and the planting density was 82,500 plants·ha−1. Protective rows were established around the experimental area.

2.3. Sampling Time and Measurement Indicators

In the field, in situ wind erosion monitoring experiments were conducted from April to June in 2023 and 2024 (from one month before sowing to maize canopy closure). Both sites had black soil, with Zhalaite Banner characterized by gently sloped uplands and Arong Banner by flat depressions. Due to land preparation and sowing activities, pre-sowing and post-sowing measurements were conducted separately (equipment was removed during land preparation and sowing and reinstalled immediately after sowing). The timing of measurements varied slightly between the two sites due to differences in the sowing and land preparation schedules, as detailed in Table 1. In 2024, soil samples from the 0–5 cm and 5–20 cm layers were collected using a five-point sampling method before sowing to determine the soil properties, including the organic carbon, total nitrogen, available nitrogen, available phosphorus, and available potassium.
Soil wind erosion rates were measured using an improved soil wind erosion ring method [19]. Sediment discharge rates were determined using Modified Wilson and Cook (MWAC) sediment traps installed at the center of each plot and perpendicular to the prevailing wind direction [20]. Soil creep amounts were measured using buried sediment collection buckets [21]. The aerodynamic roughness was calculated by measuring the near-surface wind speeds at heights of 20 cm and 80 cm using a portable handheld anemometer [22]. The soil bulk density and moisture content were determined using the core sampling method, while straw coverage was assessed using the line-transect method. Soil organic carbon was measured using a TOC analyzer (Multi N/C 3100, analytikjena, Jena, Germany).
Other soil properties were analyzed following the soil agrochemical analysis methods described by Shidan Bao [23]: total nitrogen was determined using the Kjeldahl method, available phosphorus using the sodium bicarbonate extraction–molybdenum antimony colorimetric method, available potassium using the ammonium acetate extraction–flame photometry method, and available nitrogen using the alkaline hydrolysis diffusion method. At physiological maturity, a 10 m section of two rows with uniform growth and no missing plants was selected for harvest. After air-drying, the yield components were analyzed, including the kernel number per ear, thousand-kernel weight, and grain moisture content. The grain yield was calculated at 14% moisture content.

2.4. Data Calculations

(1) Soil wind erosion amount [19]:
W = W 1 × 1 X 1 W 2 × 1 X 2
S = d / 2 2 × π
W f = W S × 10 4
In the formula, W is the total wind erosion amount (kg), S is the surface area of wind erosion (cm2), Wf is the wind erosion amount per unit area (kg m−2), W1 is the wet soil weight before placement (kg), W2 is the wet soil weight after wind erosion measurement (kg), X1 is the soil moisture content at placement (%), X2 is the soil moisture content after wind erosion measurement (%), d is the inner diameter of the wind erosion ring (cm), and π is Pi (approximately 3.1416).
(2) Soil sediment discharge [20]:
Q = 0 1 a ˙ e b z d z
In the formula, Q represents the total soil sediment discharge within the 0–1 m height range (g m−2), z is the calculation height (m), and a and b are curve-fitting constants. Here, a denotes the rate of change in soil sediment discharge with increasing height, while b characterizes the surface soil sediment discharge rate.
(3) Surface aerodynamic roughness [21]:
lg Z 0 = lg Z 2 A lg Z 1 1 A
A = V 2 V 1
In the formula, Z1 and Z2 represent any two heights above the ground, and V1 and V2 are the wind speeds corresponding to these heights, respectively.

2.5. Statistical Analysis

Data were organized using Microsoft Excel 2021. Statistical analyses, including an analysis of variance (ANOVA) and multiple comparisons, were performed using IBM SPSS Statistics 26. Graphs and regression fitting were generated using Origin 2021 and R 4.2.2.

3. Results

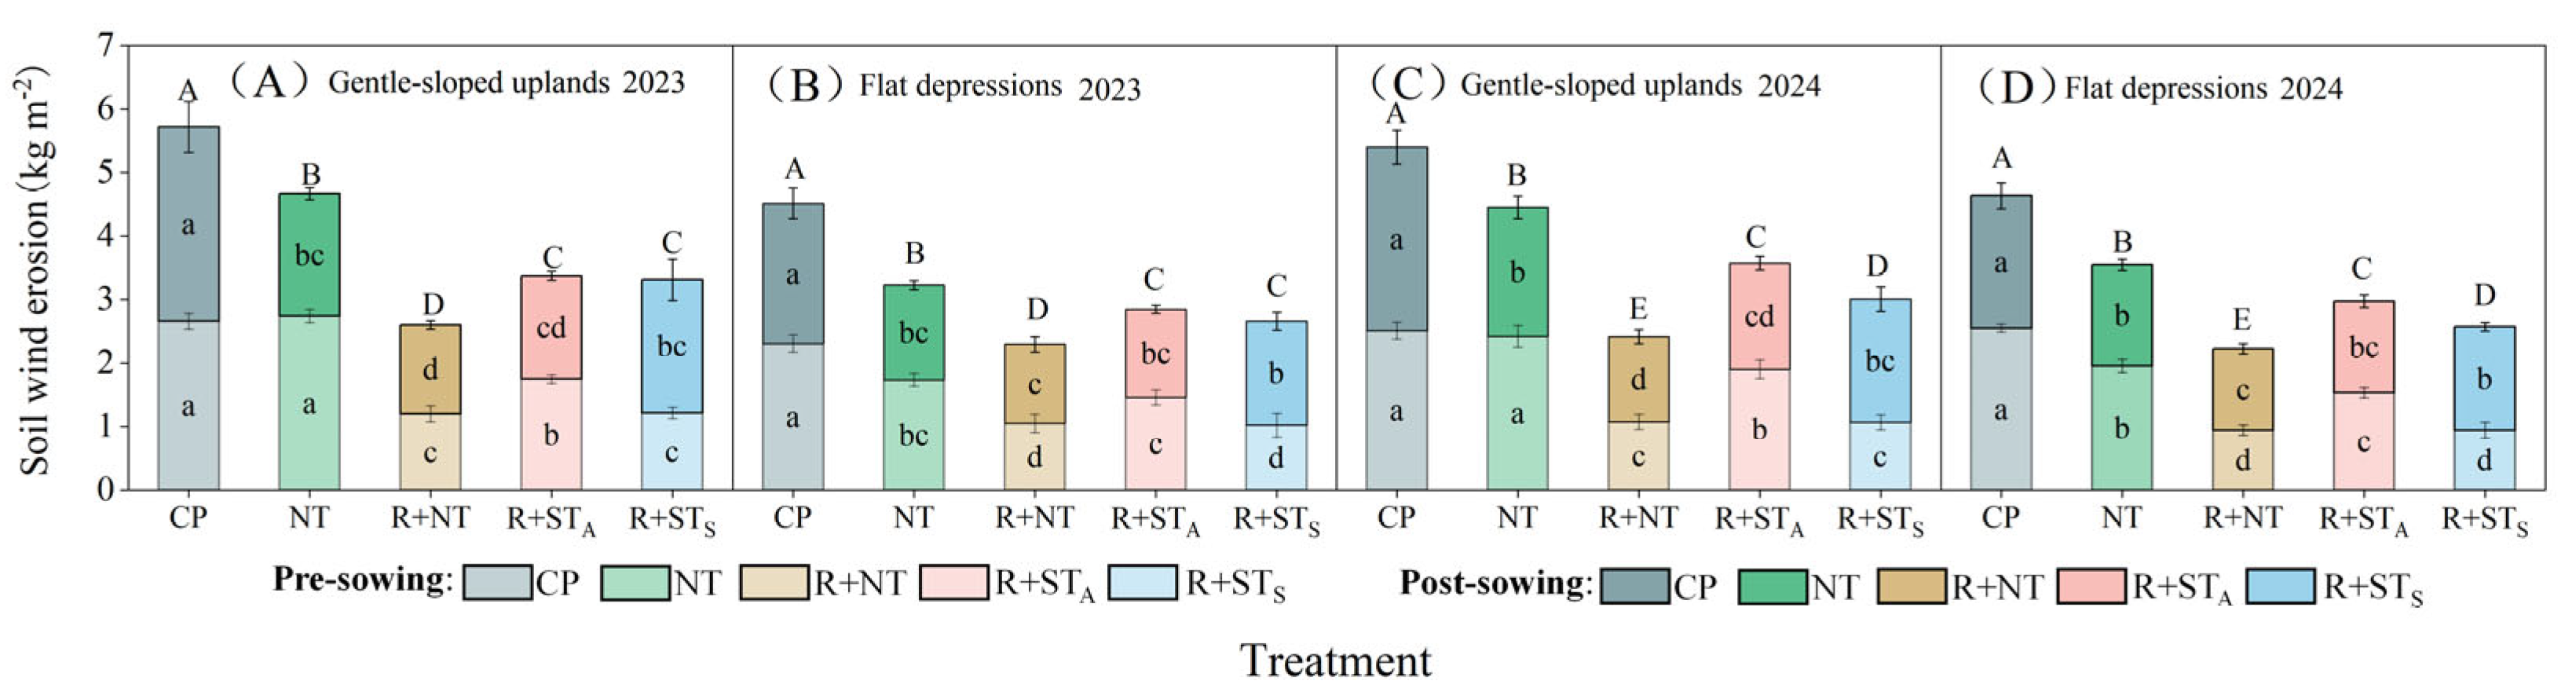
3.1. Effects of Straw Mulching with Strip Tillage on Soil Wind Erosion Rates

As shown in Figure 4, the soil wind erosion rates under all tillage treatments were significantly higher on gently sloped uplands than on flat depressions. Moreover, the tillage practices exerted a significant influence (p < 0.05) on the soil wind erosion rates across both topographic contexts. Compared to straw removal treatments (CP and NT), straw mulching practices (R+NT, R+STS, and R+STA) significantly reduced the soil wind erosion rates. Among these, R+NT demonstrated the lowest erosion rates, followed by R+STS, with both showing statistically significant differences (p < 0.05) relative to the other treatments. Compared to CP, R+NT and R+STS reduced the soil wind erosion rates by an average of 54.90% and 43.19% on gently sloped uplands and 50.59% and 42.78% on flat depressions, respectively. Under both strip tillage practices, R+STS exhibited a trend toward lower erosion rates than R+STA, with a significant reduction of 15.96% observed in 2024.
Compared to CP, straw mulching treatments significantly reduced the soil wind erosion rates both before and after sowing. The pre-sowing erosion rates under R+NT and R+STS showed no significant difference but were 56.03% and 55.85% lower on gently sloped uplands and 58.74% and 59.45% lower on flat depressions, respectively, relative to CP. The post-sowing erosion rates under R+STS, although higher than those under R+NT and R+STA, remained significantly lower than in CP, with average reductions of 32.3% and 21.7% on uplands and depressions, respectively. Under both strip tillage systems, R+STS primarily reduced soil wind erosion by minimizing the pre-sowing erosion rates. These findings demonstrate that reducing the tillage intensity and increasing the straw coverage effectively mitigate soil wind erosion, particularly in wind-prone, gently sloped uplands.

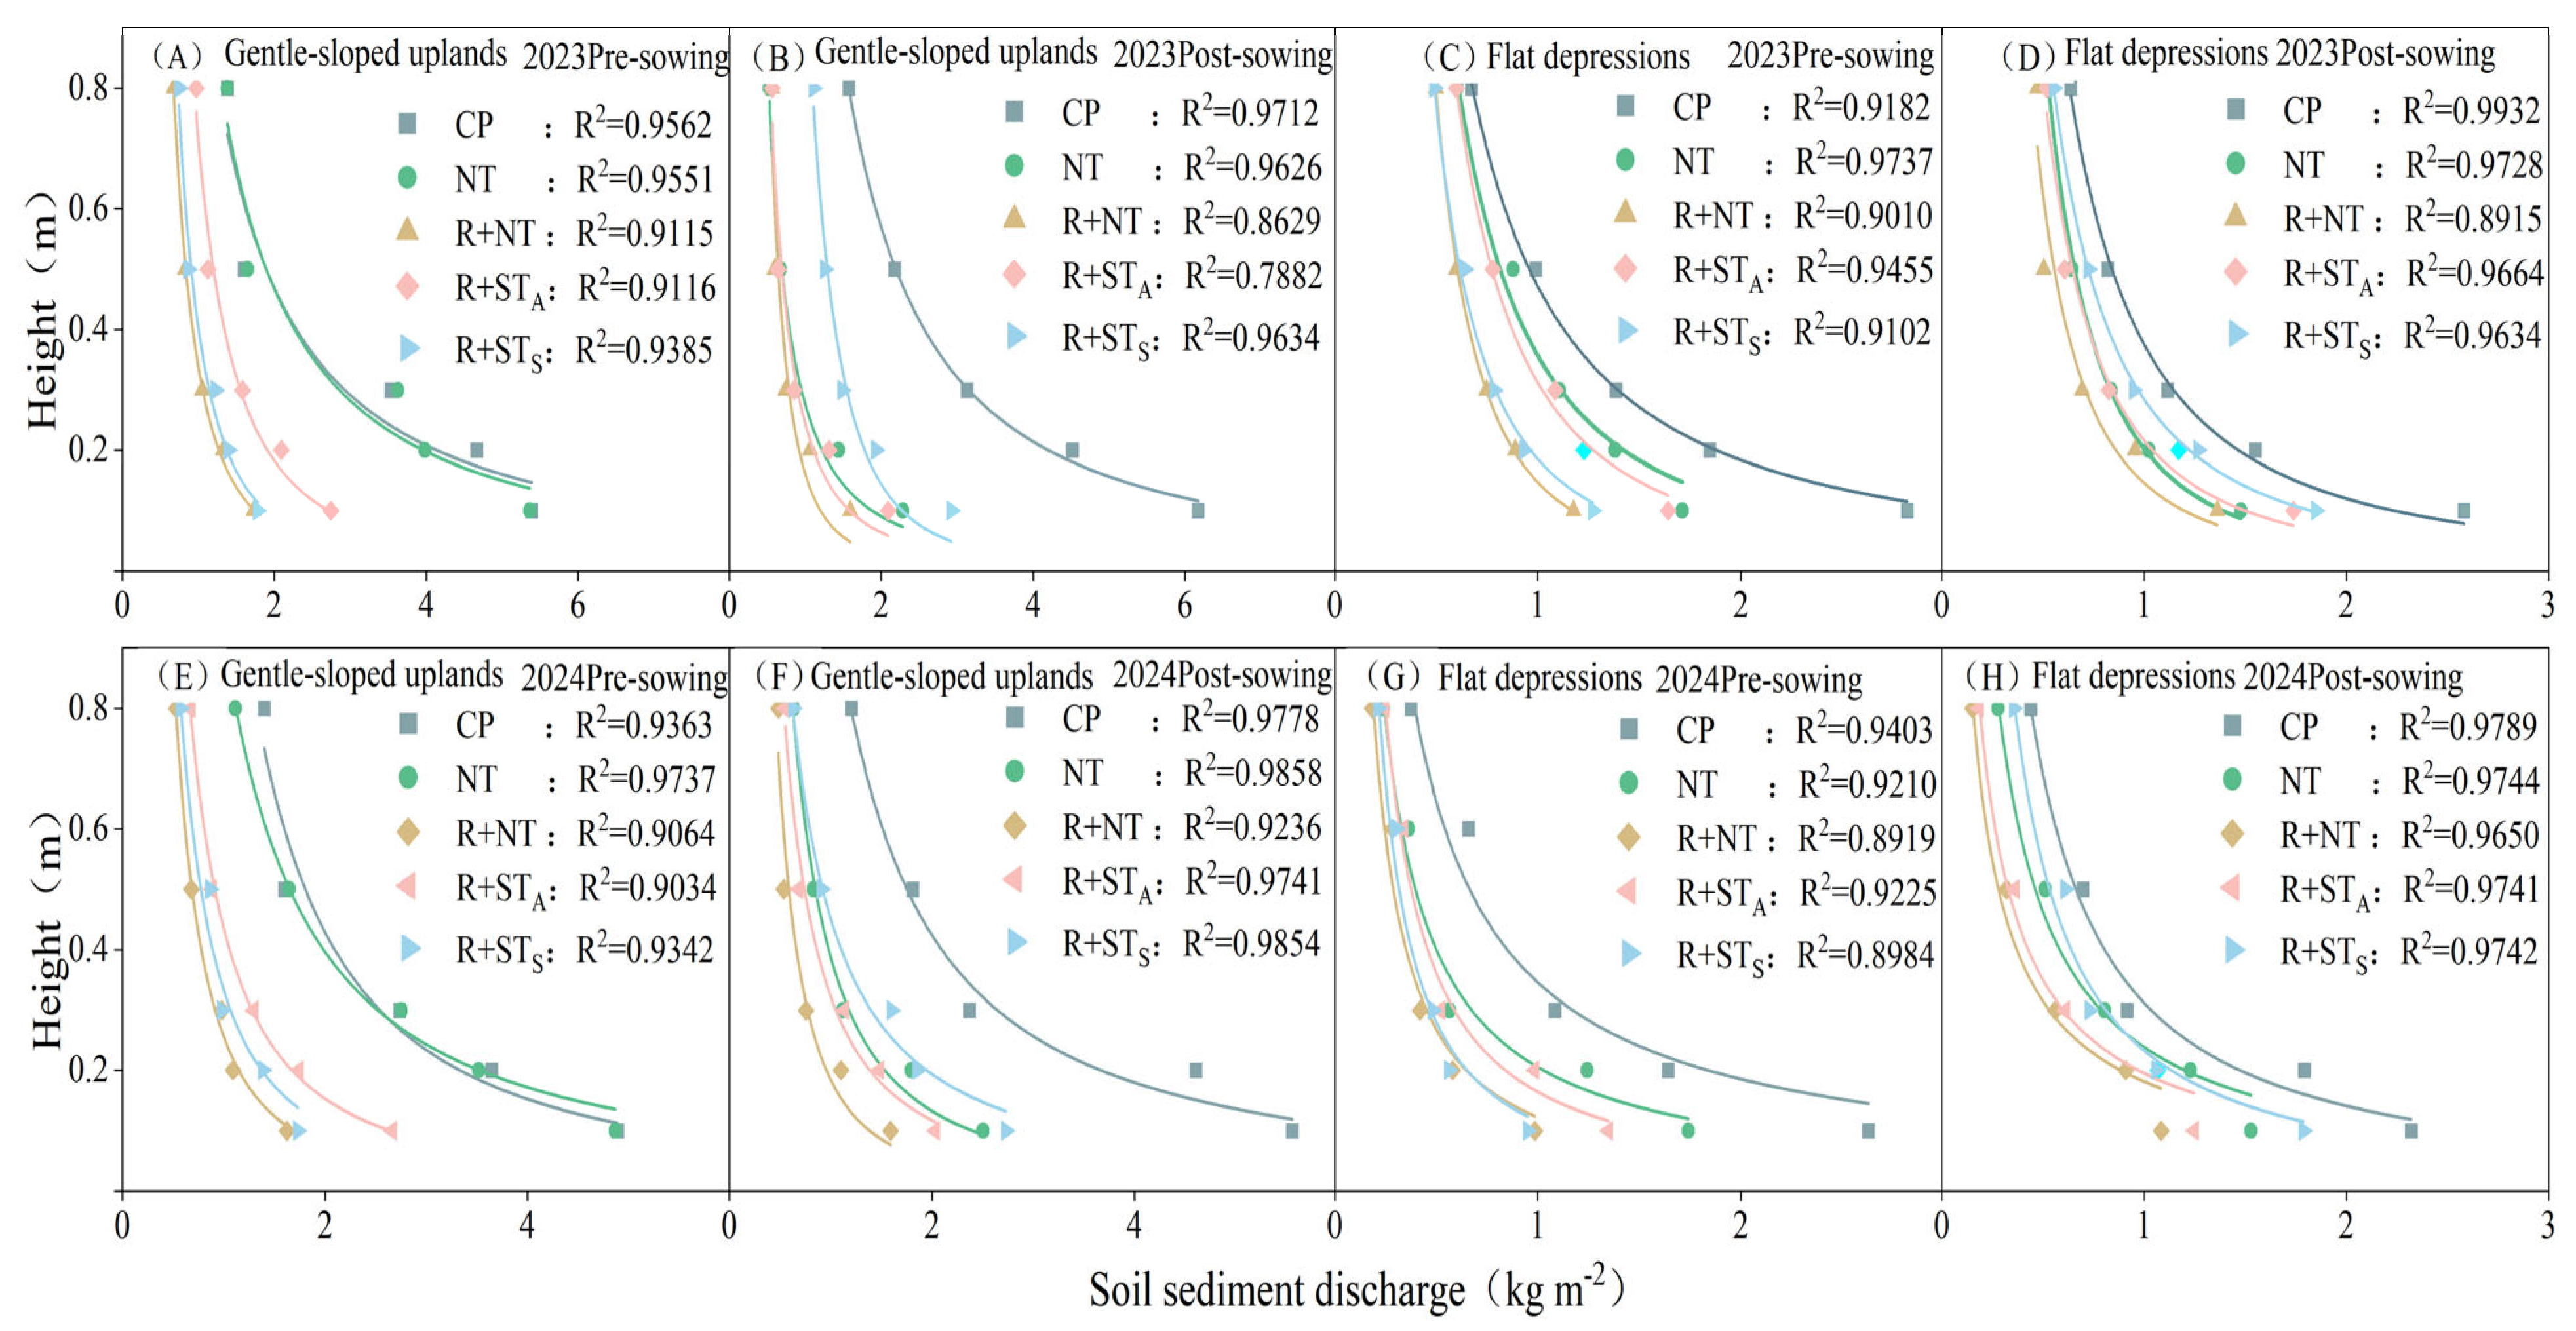
3.2. Effects of Straw Mulching with Strip Tillage on Soil Sediment Discharge

As shown in Figure 5, soil sediment discharge is strongly and negatively correlated with the height, meaning that sediment discharge decreases as the height increases. The trends in pre-sowing and post-sowing soil sediment discharge are similar for both topographic types. Under different tillage practices, the vertical distribution and attenuation patterns of soil sediment discharge vary. The soil sediment discharge on gently sloped uplands is higher than that on flat depressions, and, in both areas, the CP treatment consistently results in the highest sediment discharge at all heights, with the maximum discharge occurring at 0.1 m. The average sediment discharge before sowing was 5.14 kg m−2 and 2.72 kg m−2, respectively, and, after sowing, it was 5.86 kg m−2 and 2.45 kg m−2. This indicates that traditional farming practices in this area offer poor surface soil protection, leading to severe wind erosion.
Overall, compared to straw removal treatments (CP, NT), straw mulching treatments (R+NT, R+STS, R+STA) exhibited steeper attenuation, with the largest differences in soil sediment discharge observed at 0.1 m. On gently sloped uplands and flat depressions, the average reductions in soil sediment discharge before sowing were 67.39%, 60.36%, 65.59%, and 59.25%, respectively, for R+NT and R+STS compared to CP. After sowing, the average reductions were 72.81%, 50.11%, 51.78%, and 25.86%, respectively. These findings suggest that straw mulching suppresses the upward discharge of wind-blown sand and effectively impedes its spread.

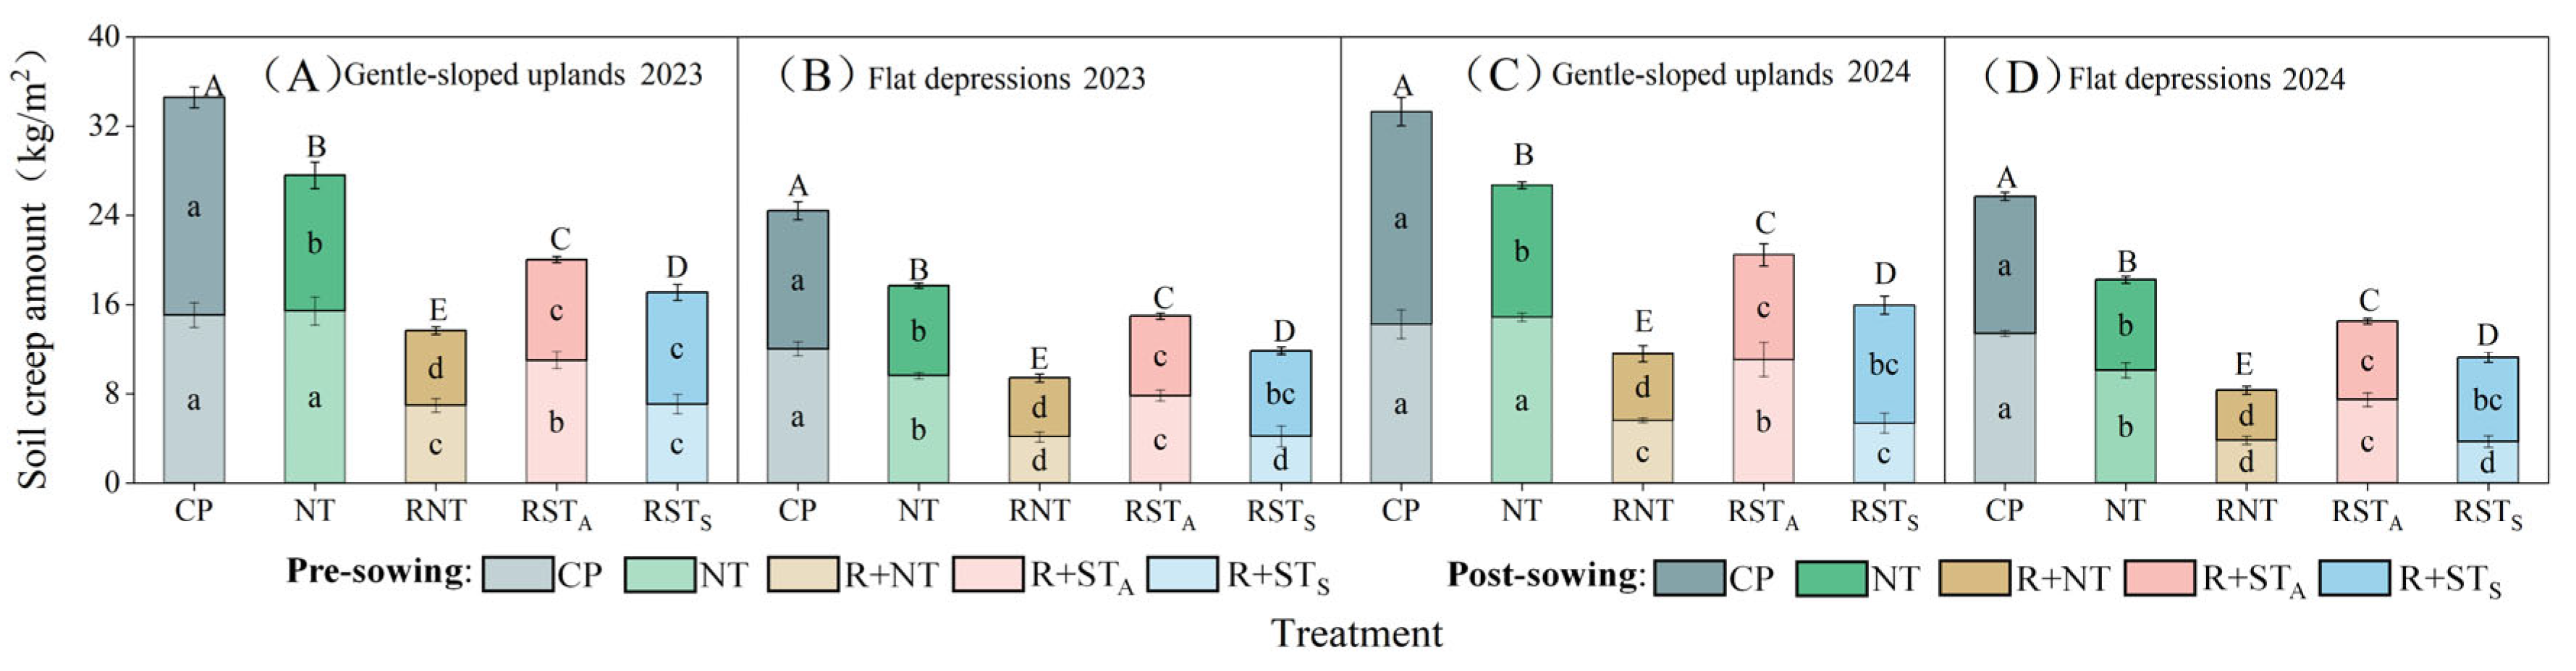
3.3. Effects of Straw Mulching with Strip Tillage on Soil Creep Amount

As shown in Figure 6, the soil creep amounts were consistently higher on gently sloped uplands than on flat depressions under all tillage treatments. The tillage practices significantly influenced the soil creep amount (p < 0.05), exhibiting trends similar to those of the soil wind erosion rates. Compared to straw removal treatments (CP and NT), straw mulching practices (R+NT, R+STS, and R+STA) effectively reduced the soil creep amount. Significant differences (p < 0.05) were observed among the treatments in both landscapes, with the following order: CP > NT > R+STA > R+STS > R+NT. Specifically, R+NT and R+STS reduced the soil creep amount by 62.81% and 51.30% on uplands and 64.51% and 53.82% on depressions, respectively, compared to CP.
Compared to CP, straw mulching treatments significantly reduced the soil creep amount both before and after sowing. The pre-sowing soil creep amounts under R+NT and R+STS were significantly lower than those under the other treatments, with reductions averaging 57.14% and 57.60% on gently sloped uplands and 68.50% and 68.77% on flat depressions, respectively, relative to CP. The post-sowing amount under R+NT remained significantly lower than in other treatments, while R+STS and R+STA exhibited no significant difference. R+NT and R+STS reduced the post-sowing soil creep amount by 67.13% and 63.54% on uplands and 46.57% and 38.31% on depressions, respectively, compared to CP. These results demonstrate that the soil creep amount is highly responsive to the straw mulching and tillage intensity, with reduced and no-till practices combined with straw coverage effectively minimizing the topsoil loss, particularly under R+NT and R+STS.

3.4. Effects of Straw Mulching with Strip Tillage on Straw Coverage and Maize Seedling Emergence Rate

As shown in Table 2, the tillage practices significantly influenced both the pre- and post-sowing ground cover and seedling emergence rates across the two years and landscapes (p < 0.05). R+NT exhibited significantly lower seedling emergence rates compared to other treatments, indicating that conventional no tillage with straw mulching can lead to severe emergence issues. In contrast, R+STS consistently achieved the highest emergence rates over the two-year period, with average increases of 12.04% and 8.75% on uplands and depressions, respectively, relative to R+NT. These results demonstrate that R+STS effectively mitigates the emergence challenges associated with conventional straw mulching no-tillage systems.
At pre-sowing, the coverage under R+STS was not significantly different from that under R+NT, but it was significantly higher than in other treatments. At post-sowing, however, due to the strip tillage’s impact on clearing the seedbed, the coverage in both locations decreased by 13.00% and 10.47%, respectively. Overall, while R+STS resulted in a reduction in straw coverage after sowing compared to R+NT, it significantly increased the maize seedling emergence rates and improved the emergence quality.

3.5. Effects of Straw Mulching with Strip Tillage on Soil Bulk Density and Water Content

As shown in Table 3, significant differences in soil water content were observed between the two topographic contexts. The pre-sowing topsoil water content under R+NT and R+STS was significantly higher than that under the other treatments, with no significant difference between the two. Compared to CP, R+NT and R+STS increased the pre-sowing topsoil water content by 4.54% and 5.02% on gently sloped uplands and 8.48% and 8.91% on flat depressions, respectively. The post-sowing topsoil water content increased across all treatments due to rainfall, but straw mulching practices (R+NT, R+STA, and R+STS) consistently maintained higher moisture levels than straw removal treatments (CP and NT), demonstrating enhanced soil water storage capacities. Specifically, R+STS increased the post-sowing topsoil water content by 3.86% and 2.26% on uplands and depressions, respectively, compared to CP.

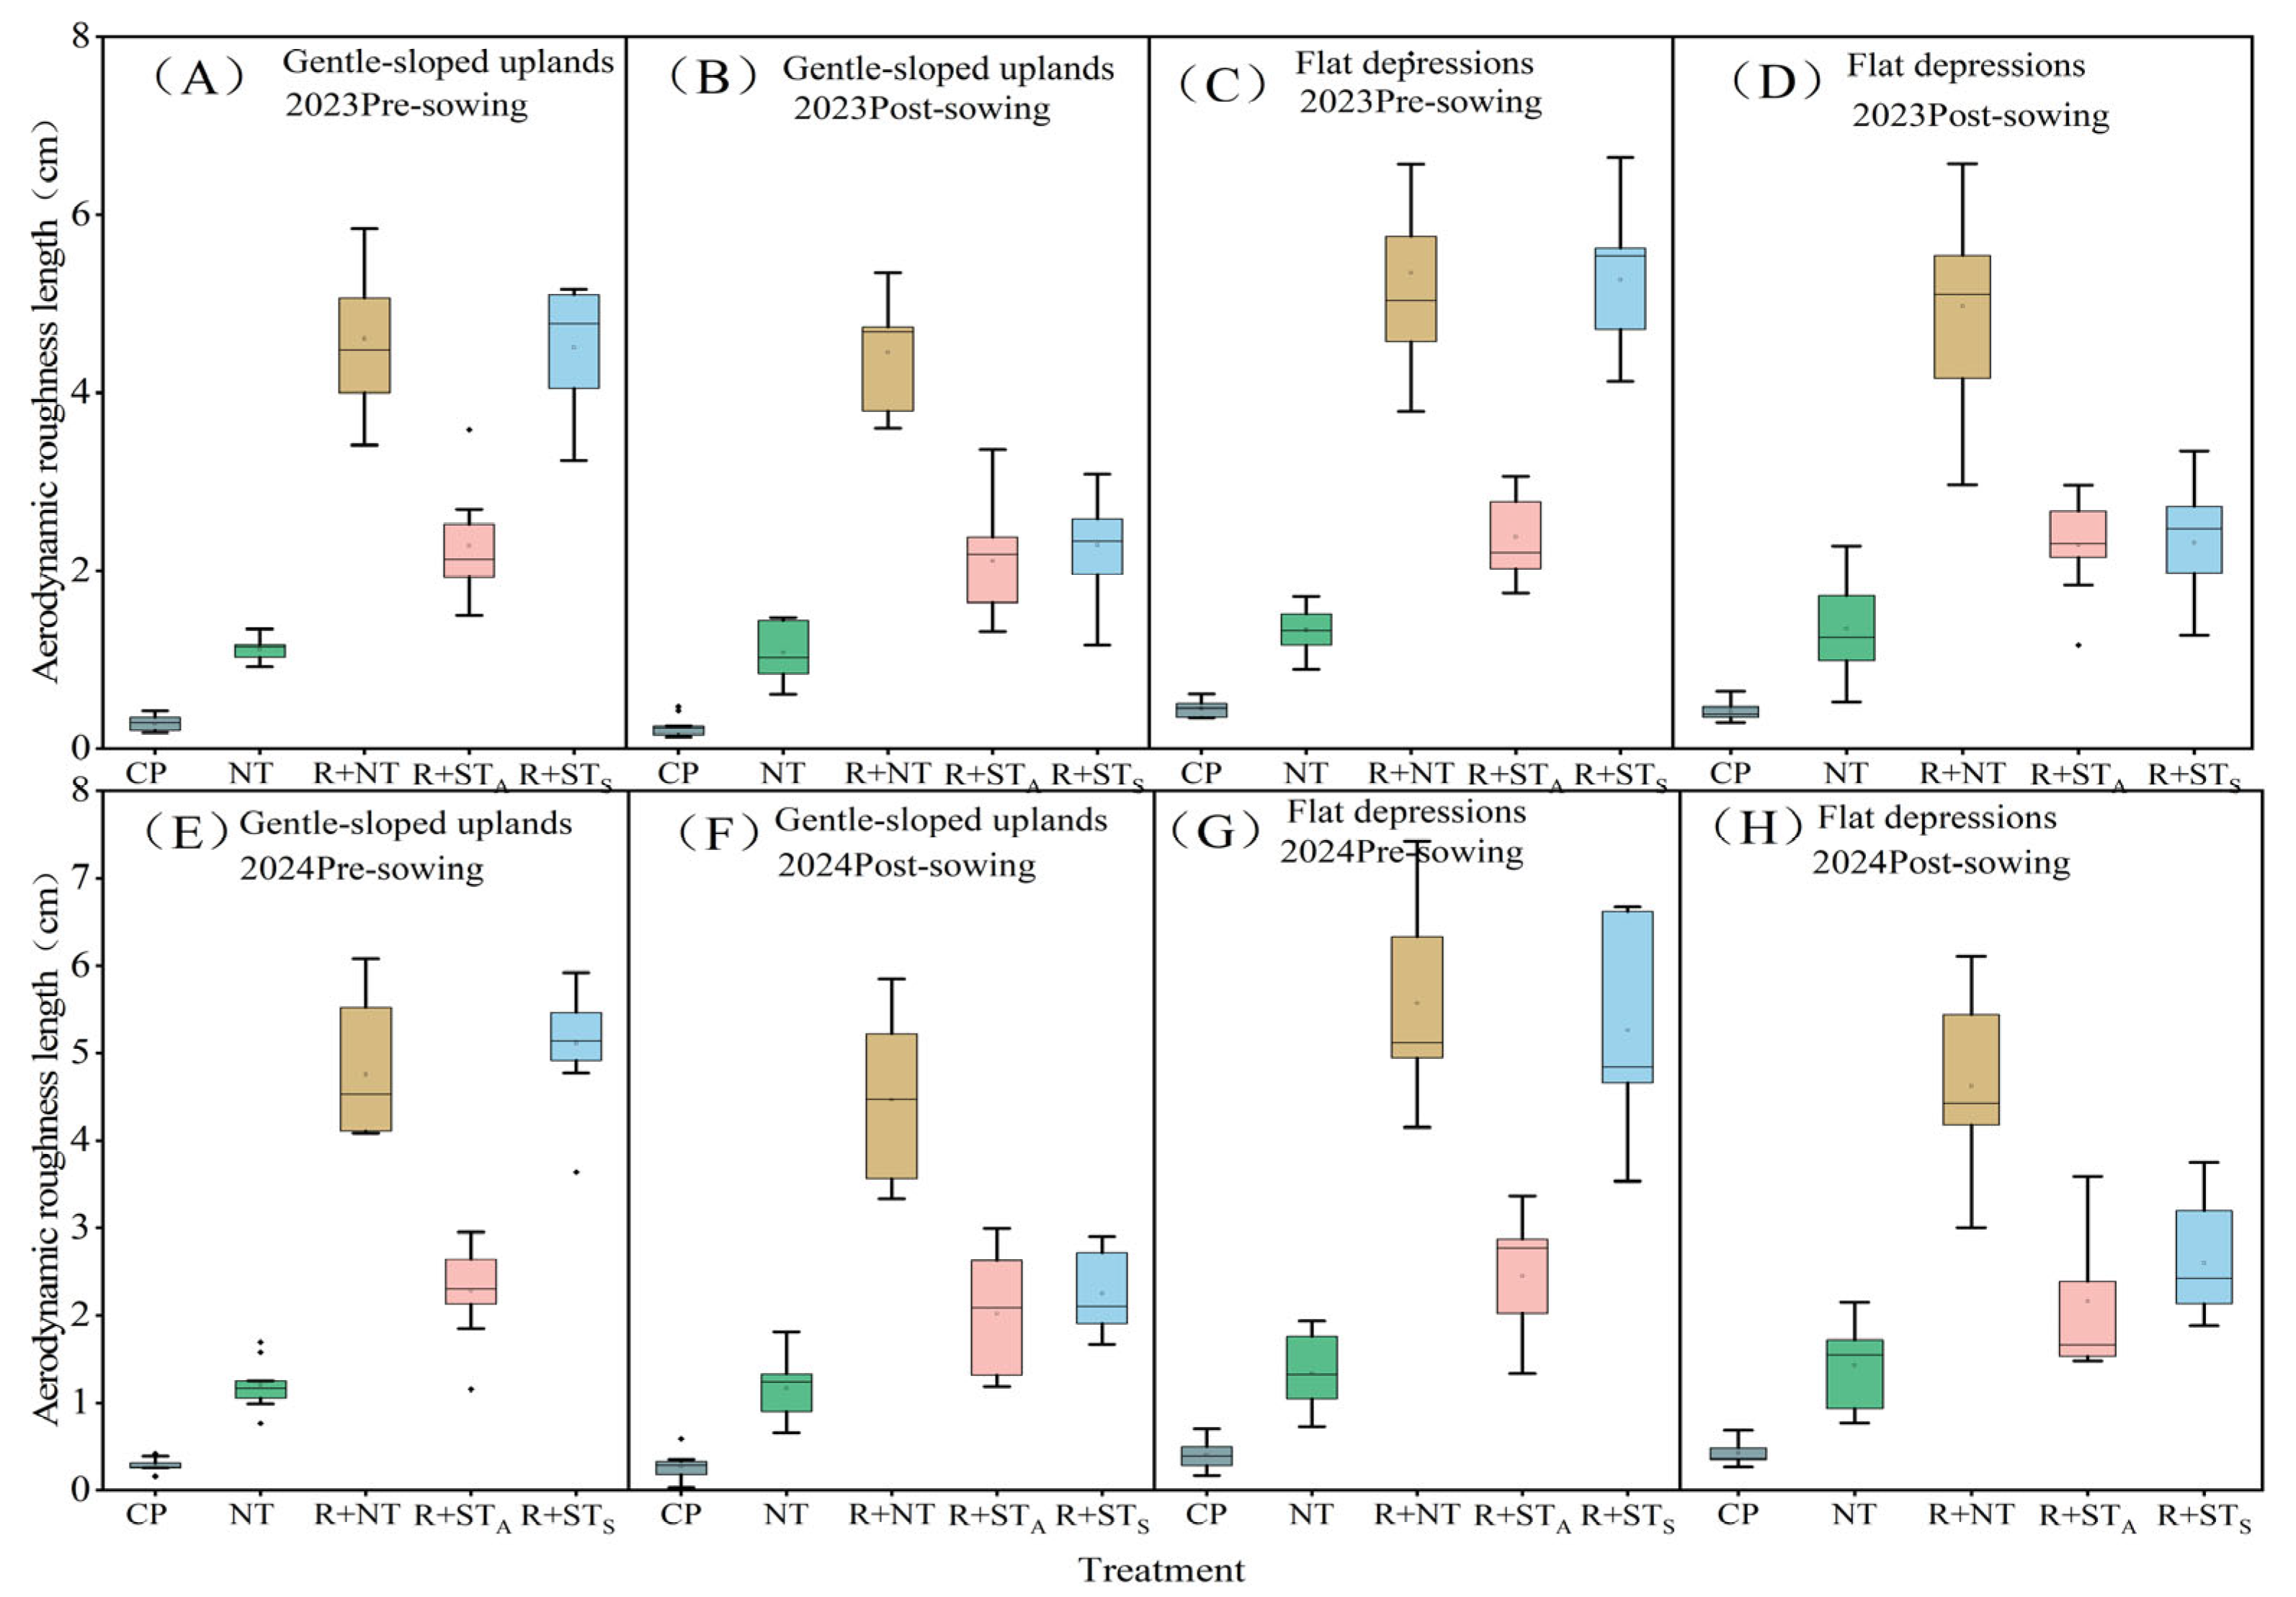
3.6. Effects of Straw Mulching with Strip Tillage on Surface Aerodynamic Roughness

Aerodynamic roughness, which characterizes the frictional resistance of the land surface to airflow and its influence on wind–sand activity, plays a critical role in wind erosion control. Higher roughness values correspond to greater reductions in the surface wind velocity and enhanced resistance to wind erosion. As shown in Figure 7, the soil roughness trends were consistent across both years and landscapes. The pre-sowing roughness was lowest under CP, with average values of 0.29 cm and 0.43 cm on gently sloped uplands and flat depressions, respectively. In contrast, R+NT and R+STS exhibited the highest roughness values, with 4.46 cm and 4.81 cm on uplands and 5.46 cm and 5.26 cm on depressions, respectively, representing increases of 4.17 cm, 4.52 cm, 5.03 cm, and 4.83 cm compared to CP. At post-sowing, R+STS showed reductions of 2.20 cm and 2.35 cm relative to R+NT on uplands and depressions, respectively, but the values remained significantly higher than under CP. These results demonstrate that straw mulching with stubble retention effectively increases the aerodynamic roughness, thereby mitigating wind erosion in agricultural fields.

3.7. Effects of Straw Mulching with Strip Tillage on Soil Fertility

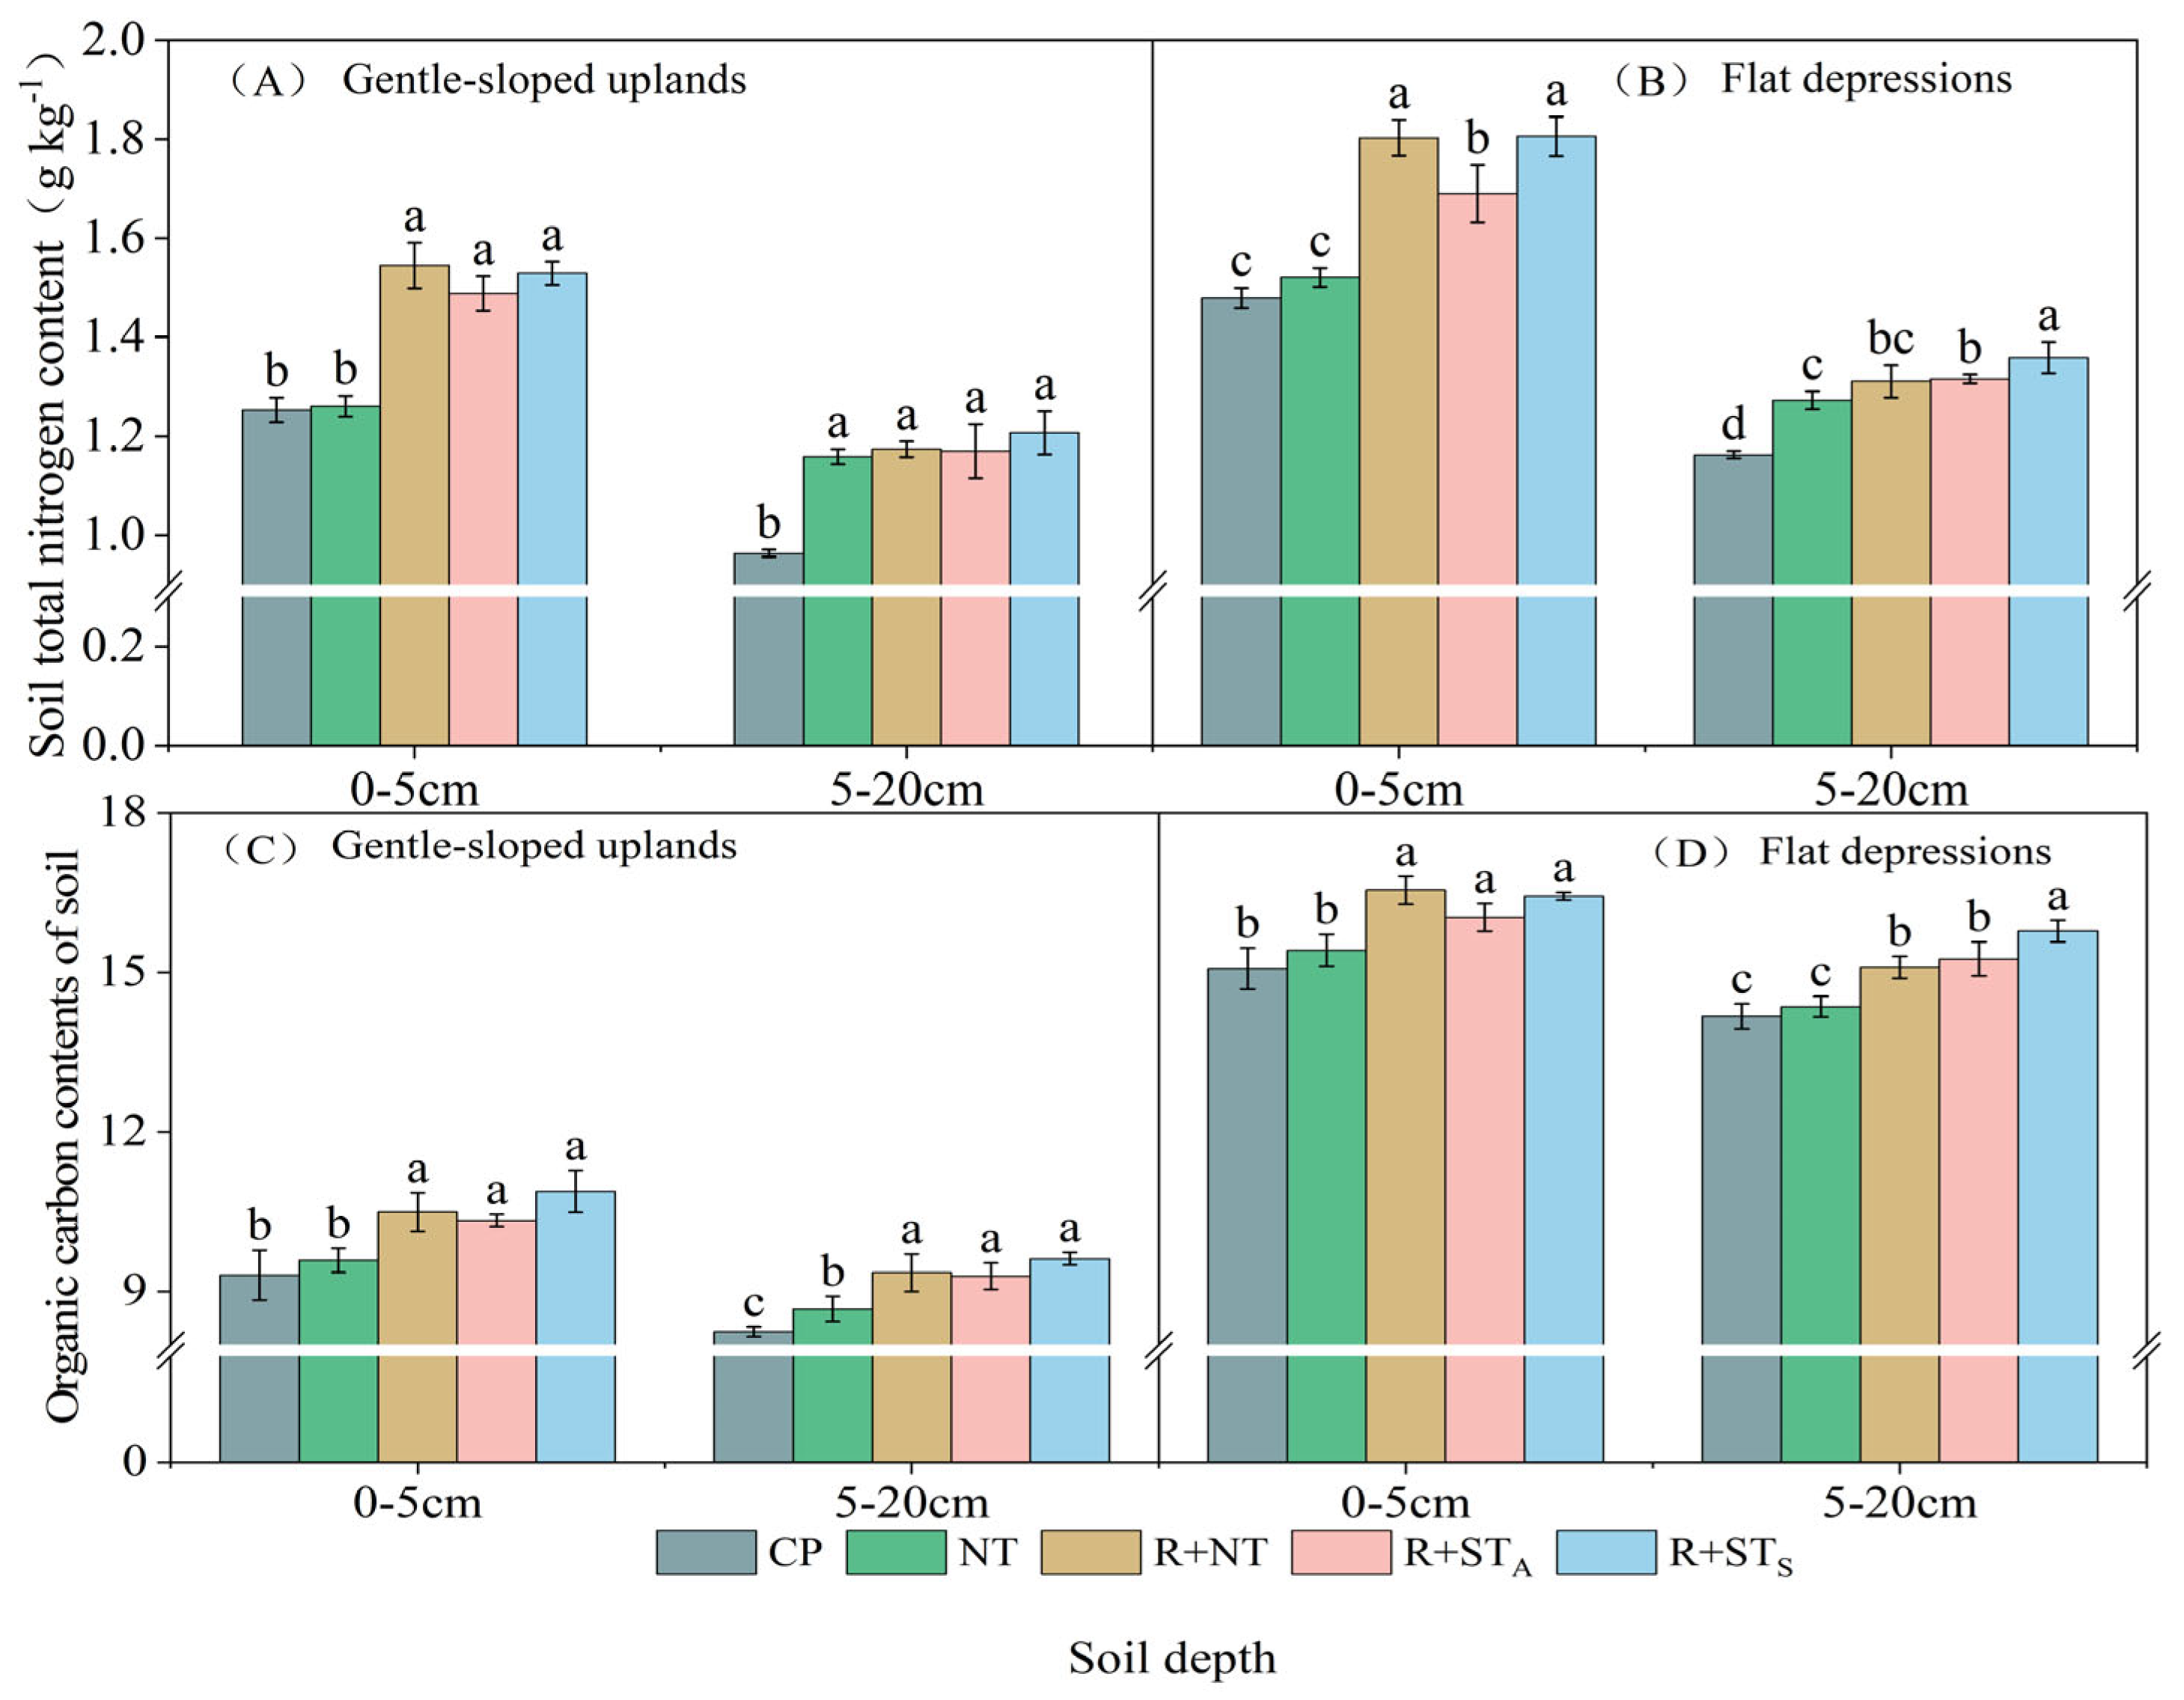
3.7.1. Effects of Straw Mulching with Strip Tillage on Soil Total Nitrogen and Soil Organic Carbon

As shown in Figure 8, the soil total nitrogen (TN) and soil organic carbon (SOC) were higher in flat depressions than in gently sloped uplands. The tillage practices significantly influenced the TN and SOC in both landscapes (p < 0.05), but the patterns differed between the two. On gently sloped uplands, straw mulching treatments (R+NT, R+STA, and R+STS) significantly outperformed straw removal treatments (CP and NT) in the 0–20 cm soil layer, with no significant differences among the straw mulching treatments. R+STS increased the TN and SOC by 22.03% and 16.86%, respectively, in the 0–5 cm layer and by 35.62% and 16.74%, respectively, in the 5–20 cm layer, compared to CP. On flat depressions, R+STS showed no significant difference from R+NT in the 0–5 cm layer but was significantly better than the other treatments, with increases of 22.11% and 9.02% in TN and SOC, respectively, compared to CP. In the 5–20 cm layer, R+STS achieved the highest values, with improvements of 16.85% and 11.36% in TN and SOC, respectively, compared to CP.

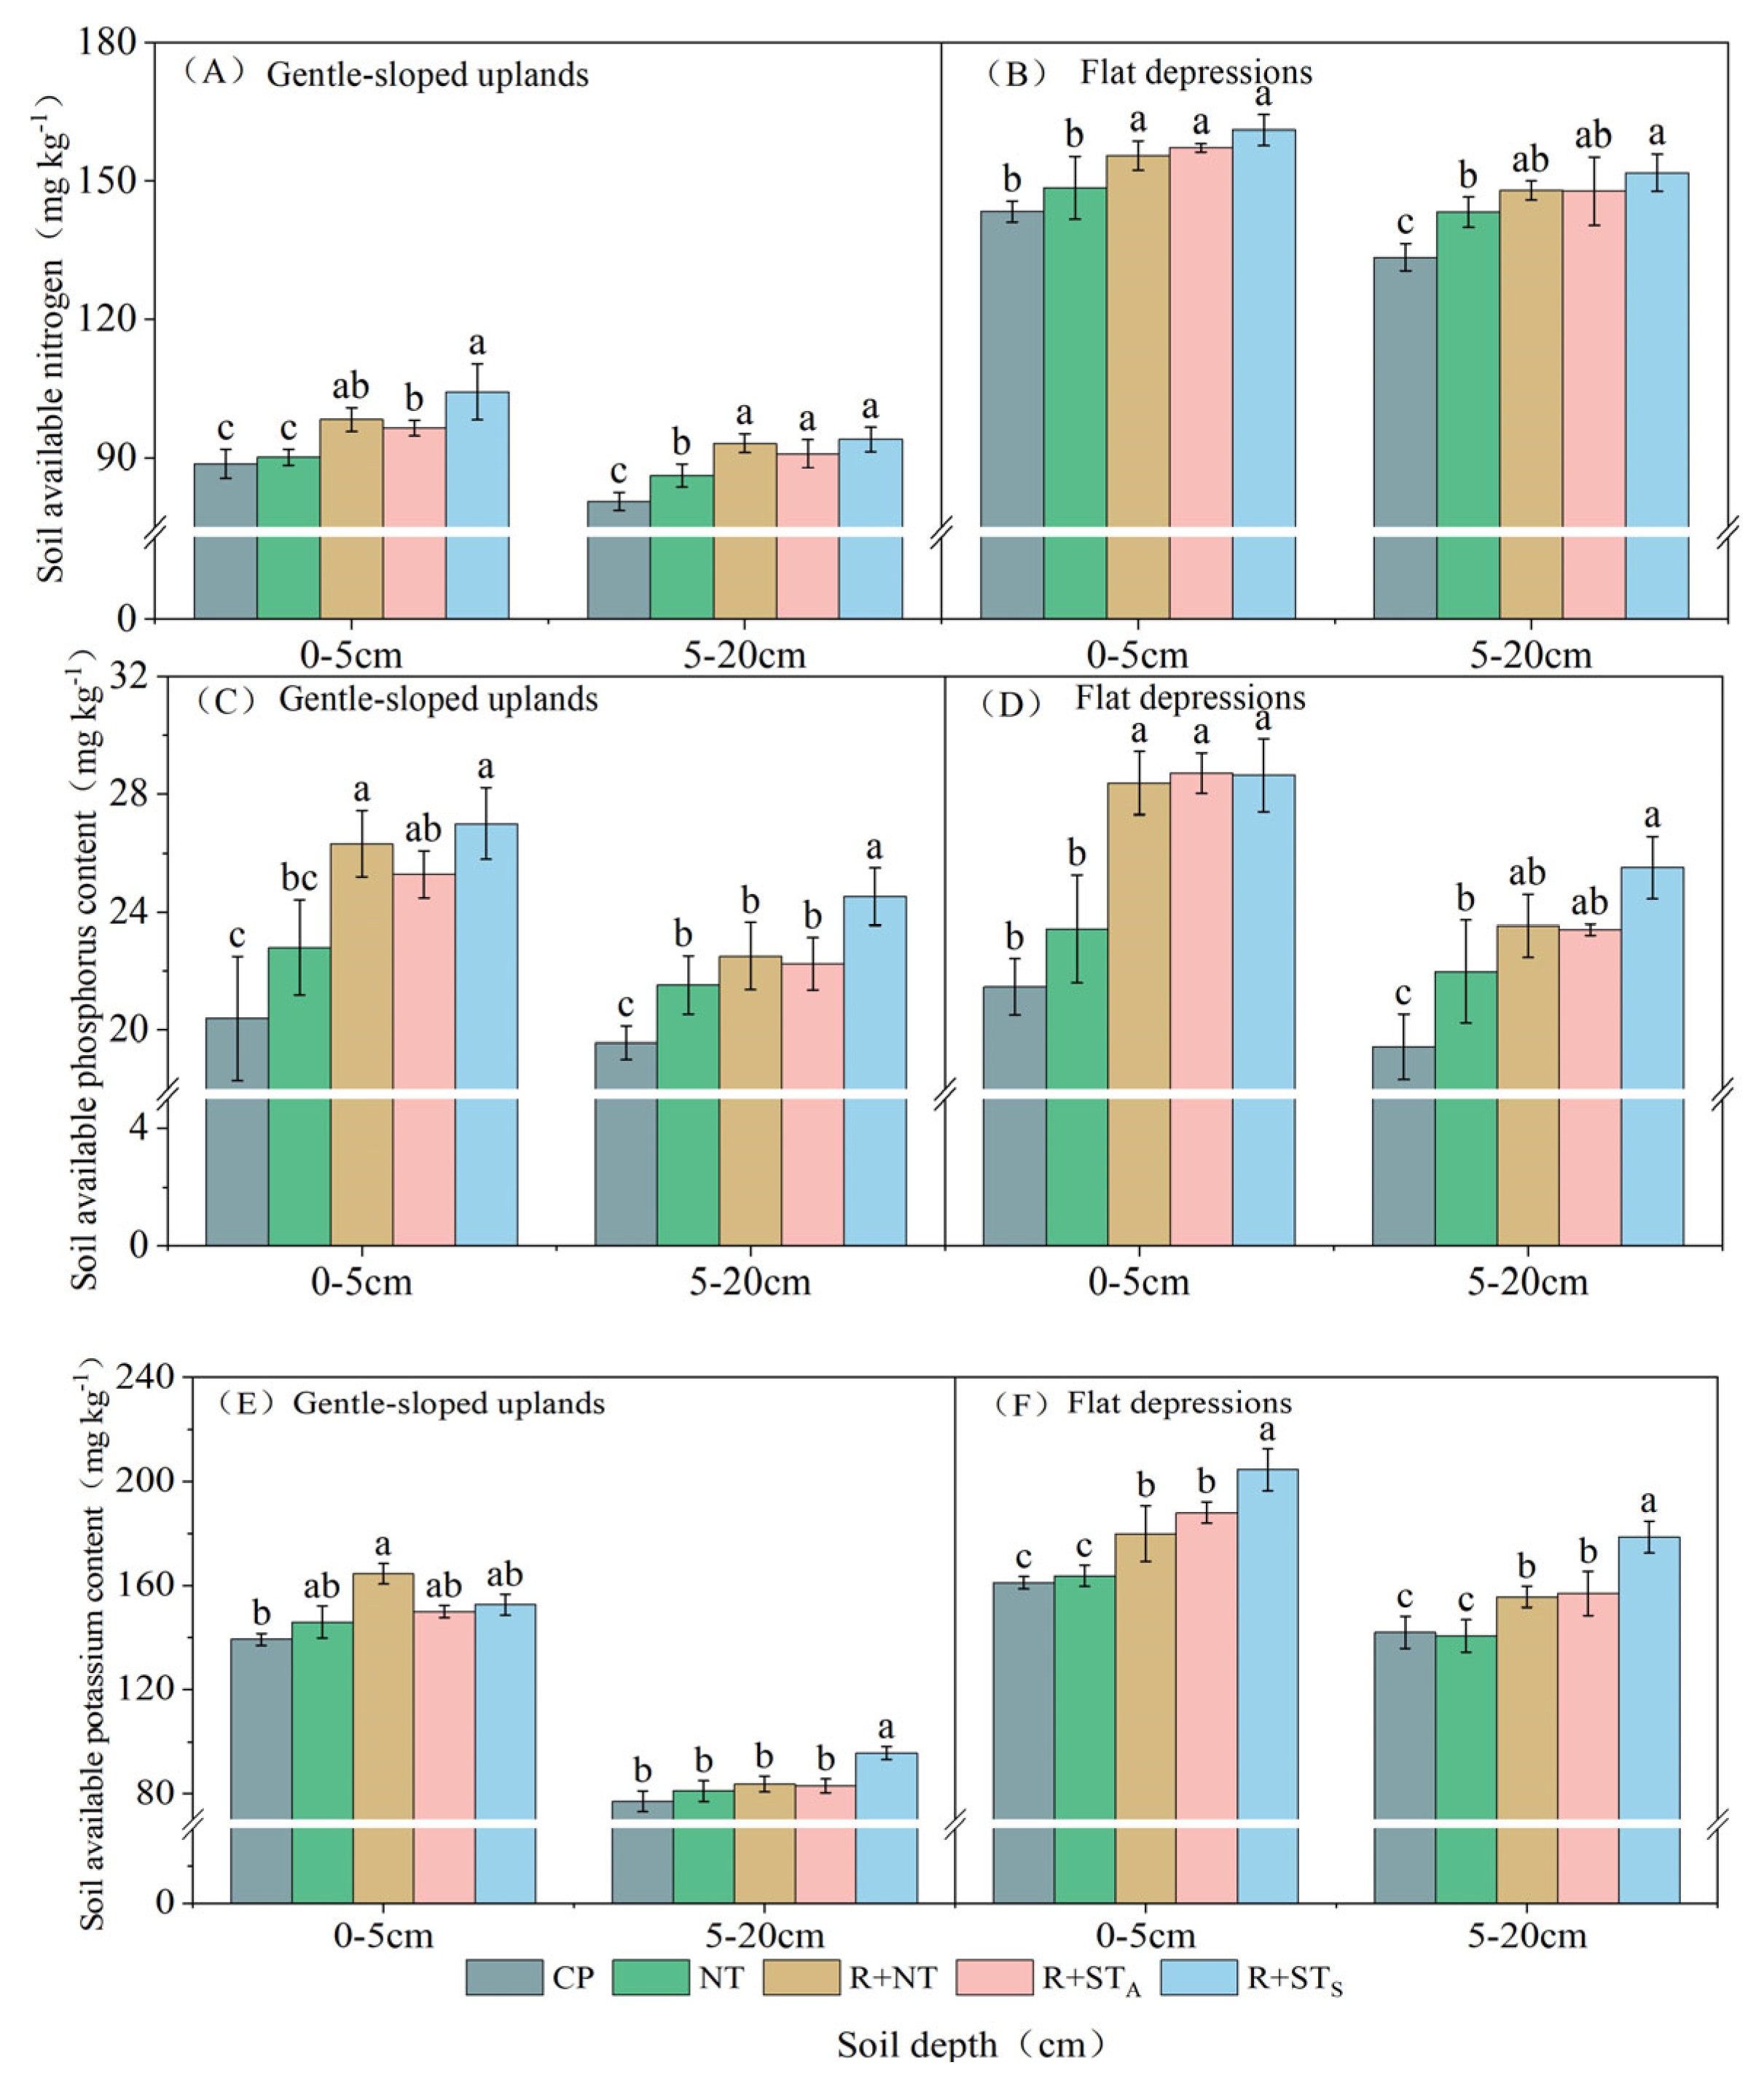
3.7.2. Effects of Straw Mulching with Strip Tillage on Soil Available Nutrients

As shown in Figure 9, the levels of available nitrogen (AN), available phosphorus (AP), and available potassium (AK) in the 0–5 cm soil layer were higher than in the 5–20 cm layer, with flat depressions exhibiting greater nutrient content than gently sloped uplands. The tillage practices significantly influenced the soil available nutrients (p < 0.05). On gently sloped uplands, R+STS showed no significant difference in the 0–5 cm soil AN, AP, and AK compared to R+NT but significantly increased these values by 17.55%, 32.42%, and 9.52%, respectively, relative to CP. In the 5–20 cm layer, R+STS significantly increased the AP and AK compared to both R+NT and R+STA, with improvements of 25.35% and 23.39%, respectively, over CP, while AN showed no significant difference from R+NT. On flat depressions, R+STS exhibited no significant difference from R+NT in the 0–20 cm layer but was significantly better than CP. In the 0–5 cm layer, R+STS increased the AN, AP, and AK by 12.28%, 33.46%, and 9.51%, respectively, compared to CP, while, in the 5–20 cm layer, the increases were 13.70%, 31.29%, and 24.16%, respectively.

3.8. Effects of Straw Mulching with Strip Tillage on Maize Yield

As shown in Table 4, significant differences (p < 0.05) were observed in the yield and its components under the different tillage practices across the two years and landscapes (gently sloped uplands and flat depressions). Over the two-year period, R+STS consistently achieved the highest yields in both landscapes, with average values of 12.68 t ha−1 on uplands and 12.39 t ha−1 on depressions. These values represented significant increases of 8.56% and 13.17%, respectively, compared to CP. Additionally, R+STS increased the grain yield by an average of 9.52% on uplands and 10.45% on depressions, respectively, relative to R+NT, effectively addressing the low yields associated with conventional straw mulching practices in the Daxing’anling foothills.
Compared to R+NT, R+STS significantly increased the yield on gently sloped uplands over the two-year period by enhancing both the number of effective ears and the number of kernels per ear, with improvements of 3.21% and 4.82%, respectively. On flat depressions, R+STS boosted the yield significantly by increasing the number of effective ears and the thousand-kernel weight, with gains of 4.57% and 2.78%, respectively. In summary, R+STS consistently improved the maize grain yield in both landscapes, primarily by increasing the number of effective ears, thereby enhancing the region’s production capacity.

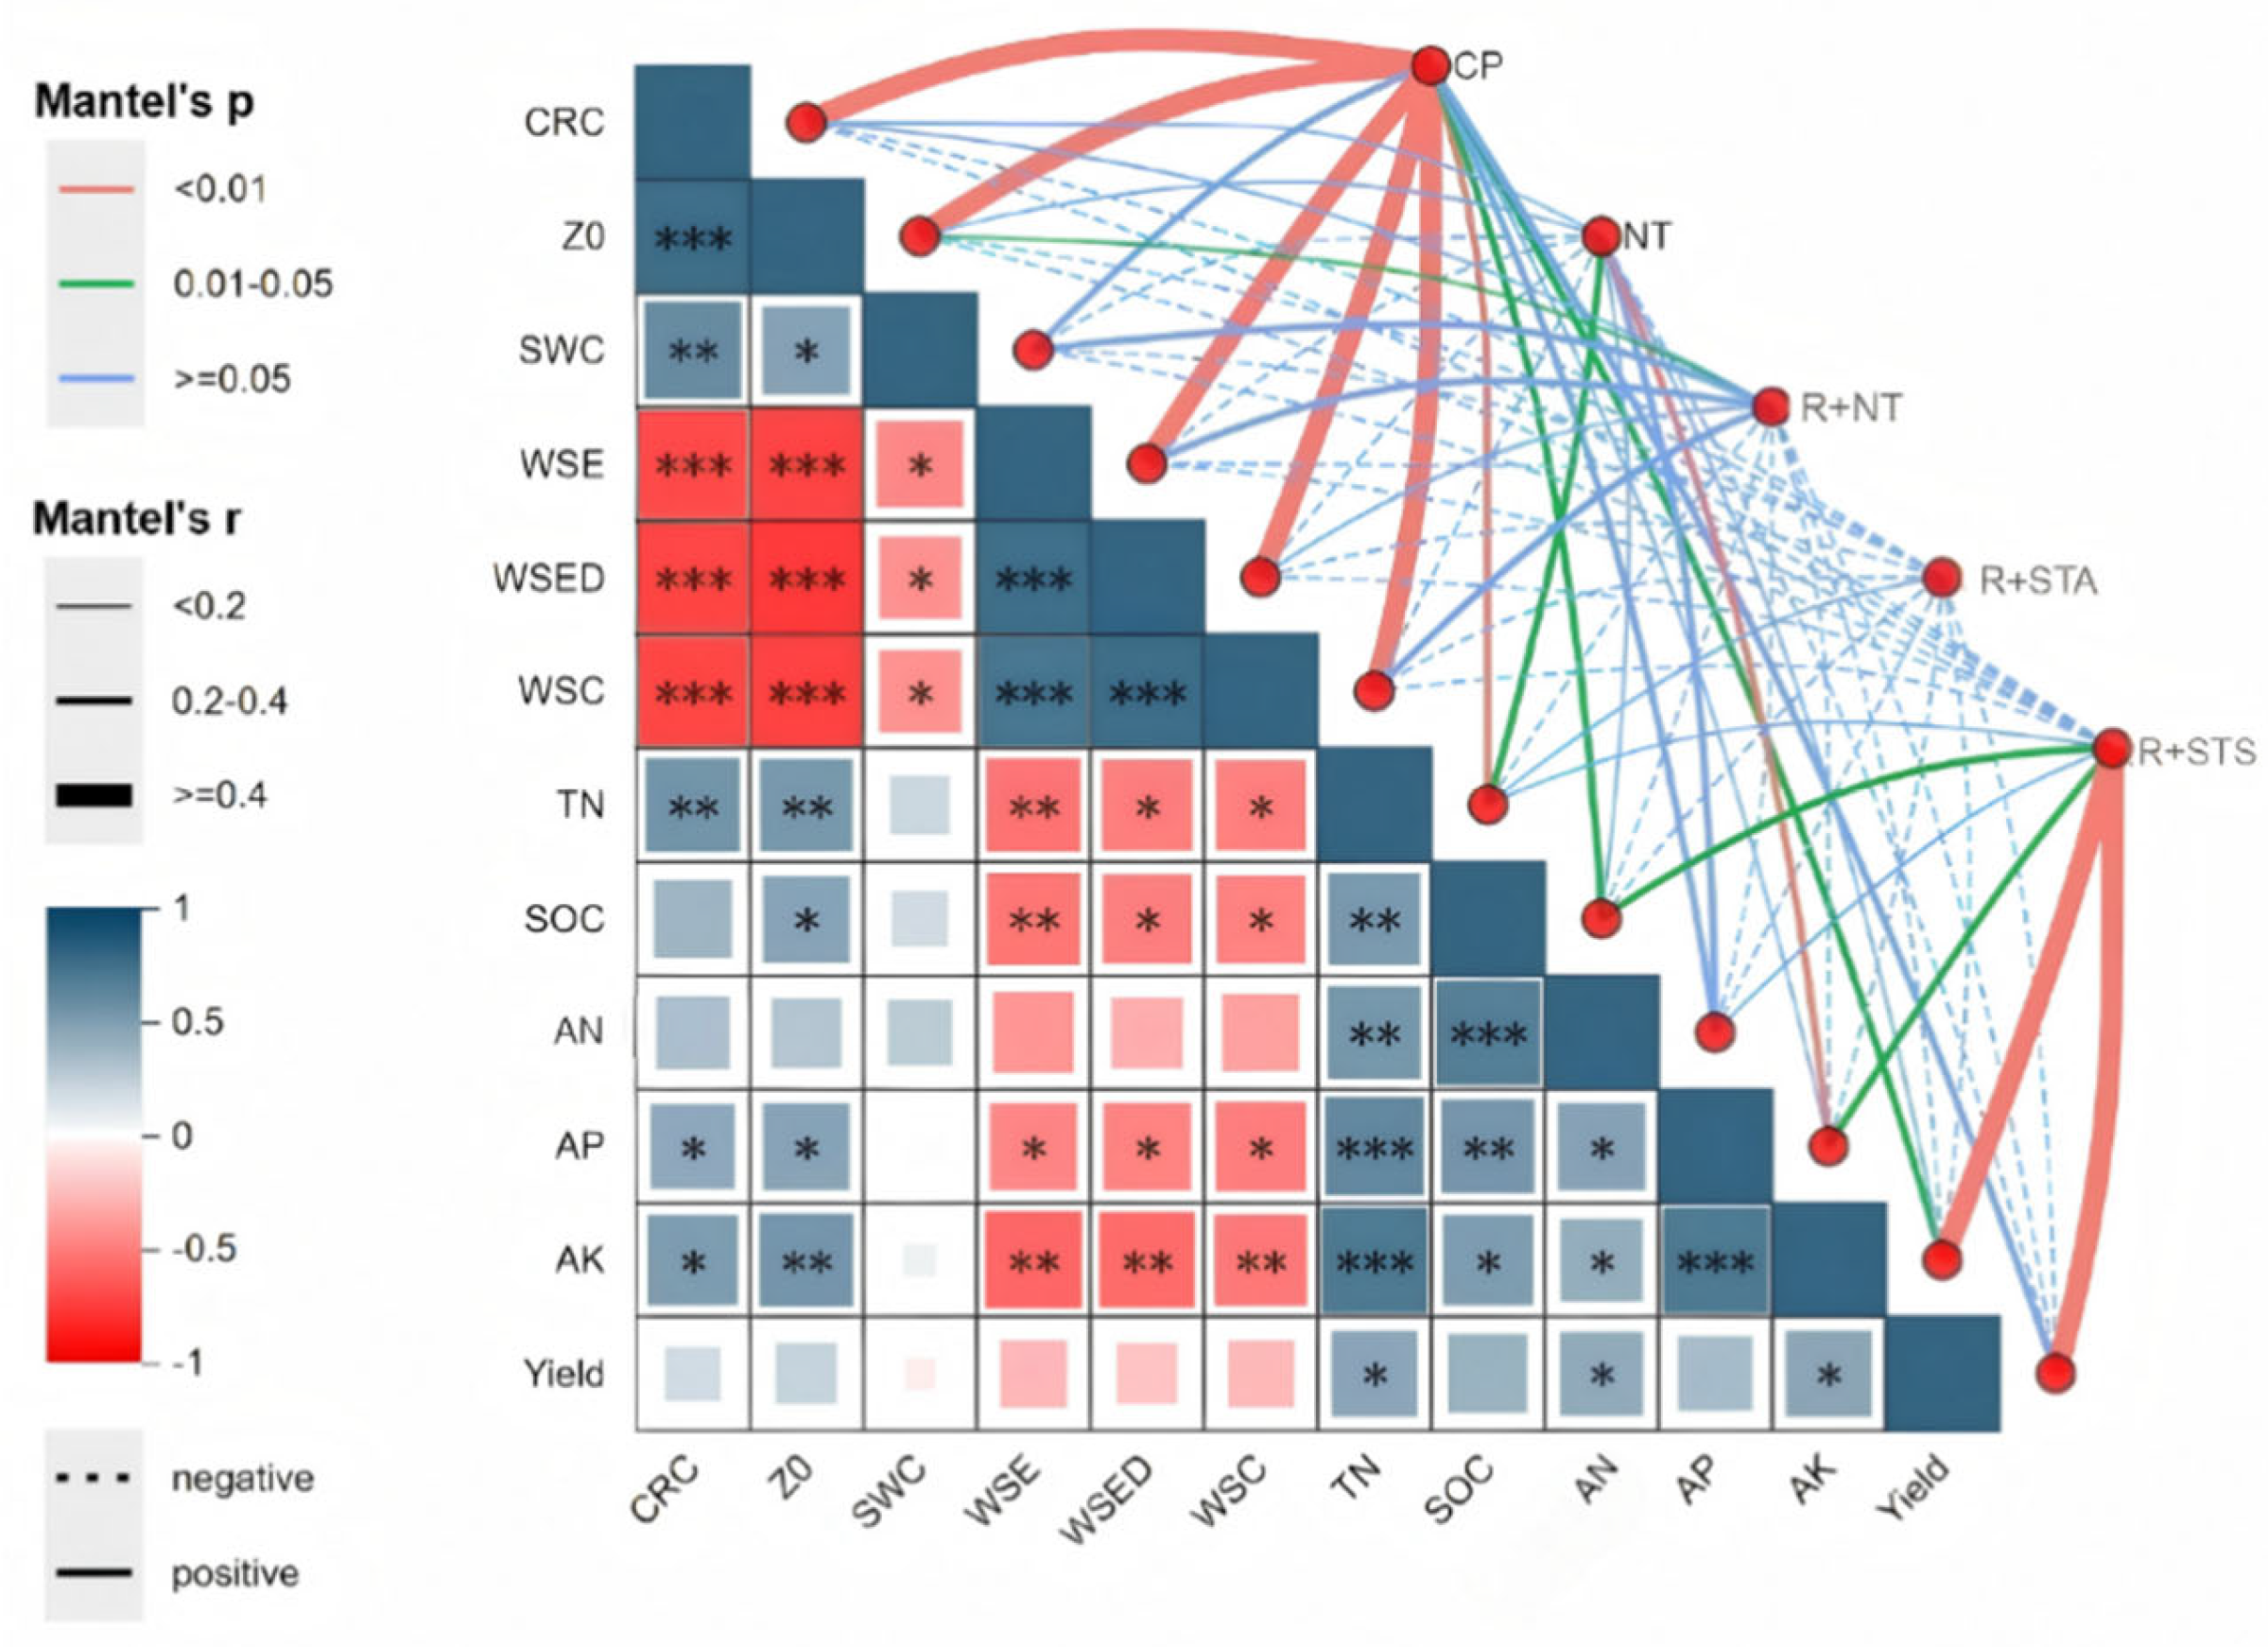
3.9. Correlation Analysis of Tillage Practices with Soil Wind Erosion and Nutrients Based on Mantel Test

This study employed Mantel analysis to examine the relationships between different tillage practices and soil wind erosion-related factors, soil nutrients, and the yield (Figure 10). The soil wind erosion rate (WSE), sediment discharge rate (WSED), and soil creep amount (WSC) exhibited highly significant, positive correlations with each other (p < 0.001). In contrast, straw coverage (CRC) and surface aerodynamic roughness (Z0) were significantly and negatively correlated with wind erosion indicators (p < 0.001). Soil wind erosion indicators were also significantly and negatively correlated with soil nutrients, suggesting that suppressing wind erosion enhances the content of topsoil total nitrogen (TN), soil organic carbon (SOC), available phosphorus (AP), and available potassium (AK). The total nitrogen (TN), available nitrogen (AN), and available potassium (AK) significantly influenced maize yield formation. Conventional tillage practices had a highly significant impact on the soil wind erosion rates, soil creep amounts, and sediment discharge rates (p < 0.01). Spring strip tillage with straw mulching significantly affected the soil organic carbon and available phosphorus (p < 0.05) and had a highly significant impact on the yield and available potassium (p < 0.01).

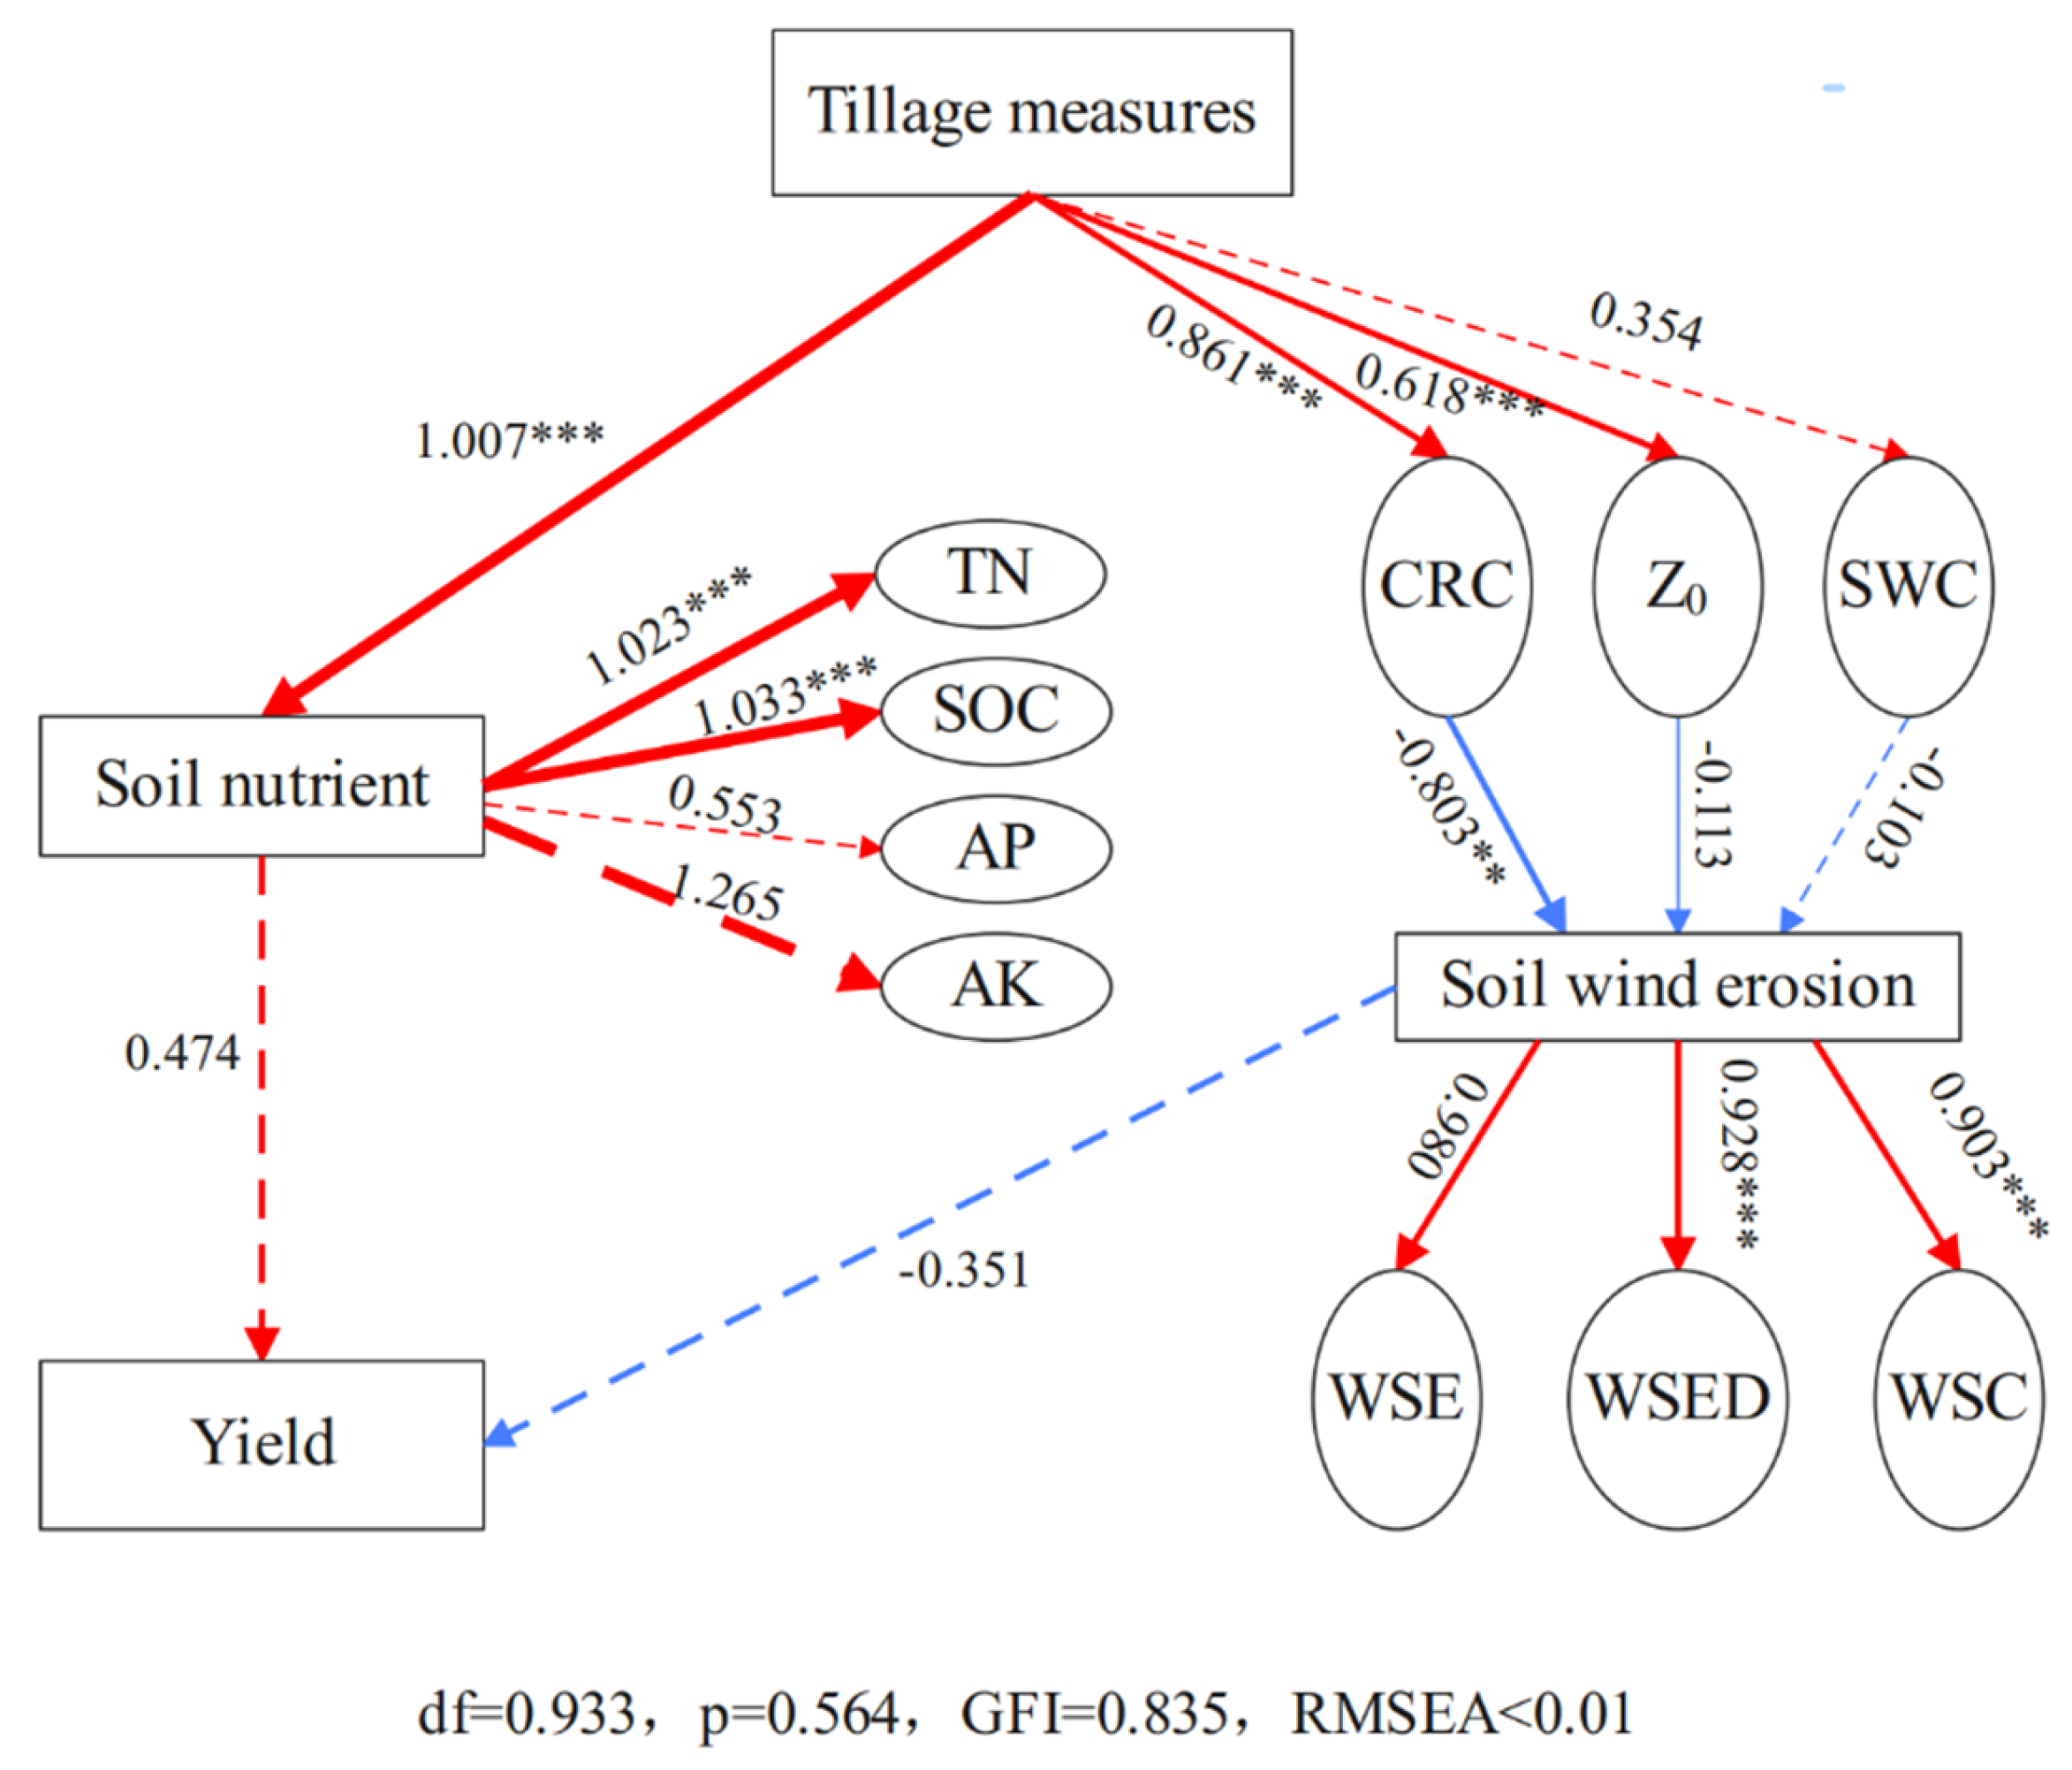
3.10. Structural Equation Modeling (SEM) Analysis

In this study, a structural equation model (SEM) was developed with the maize yield as the outcome, incorporating key influencing factors such as soil nutrients, the topsoil moisture content, the surface aerodynamic roughness, and the soil wind erosion rates, as shown in Figure 11. Path analysis revealed that soil nutrients positively influenced the yield, while soil wind erosion had a negative effect. Tillage practices significantly affected soil nutrients (p < 0.001), with strong, positive impacts on soil total nitrogen and soil organic carbon (p < 0.001). Additionally, tillage practices significantly increased the surface aerodynamic roughness and straw coverage (p < 0.001), with standardized path coefficients of 0.618 and 0.861, respectively. Straw coverage was significantly and negatively correlated with soil wind erosion (p < 0.001), suggesting that tillage practices reduce wind erosion by enhancing soil surface coverage. These findings demonstrate that, in the black soil region along the foothills of the Daxing’anling Mountains, tillage practices influence the maize yield by improving the soil nutrient content and reducing wind erosion.

4. Discussion

4.1. Effects of Tillage Practices on Soil Wind Erosion

In the black soil region of Northeast China, long-term intensive tillage and seasonal wind action have made wind erosion a critical issue, threatening the sustainable use of black soil resources [24,25,26]. This study, through the establishment of a straw mulching and spring strip tillage (R+STS) system, systematically revealed the regulatory mechanisms of different tillage practices on key soil wind erosion factors. The results demonstrate that straw mulching combined with strip tillage significantly improves the surface microenvironment in multiple dimensions, effectively reducing the wind erosion intensity, particularly on gently sloped uplands. This approach offers a novel solution for the simultaneous optimization of wind erosion control and tillage efficiency in the northeastern black soil region.
The wind erosion control effect of straw mulching–strip tillage is attributed to synergistic improvements in the surface physical characteristics. The findings of Li Jingjing et al. [27] regarding the aerodynamic roughness were corroborated in this study, which demonstrated that stubble retention and straw mulching increased the surface aerodynamic roughness to 4.96 cm, compared to just 0.36 cm under conventional tillage. This increase in roughness effectively dissipates the erosive energy of near-surface wind–sand flows. Notably, the spring strip tillage with straw mulching treatment generated a heterogeneous surface through localized tillage in the seedling zone, further enhancing the resistance to wind erosion. This aligns with the sediment discharge inhibition mechanism proposed by Wu Shanshan et al. [28] for conservation tillage systems. Although the post-sowing wind erosion rates under straw mulching–strip tillage increased by 25.95% on gently sloped uplands and 15.79% on flat depressions compared to conventional no tillage with straw mulching, this treatment achieved a balance between ecological benefits and agronomic needs through a ‘spatiotemporal differentiation control’ strategy.
This strategy involved maintaining complete straw coverage during the high-risk wind erosion period (March–May) and improving the soil structure through tillage during the crop growth period (June–September). Spatially, the treatment preserved over 74.80% of the straw-covered strips as windbreaks, while creating 25–30 cm tilled zones to ensure seedling quality. This dynamic regulatory model reduced the soil wind erosion rates by 42.98% compared to conventional tillage (Figure 11) and increased seedling emergence and the yield by 10.04% and 9.99%, respectively, relative to full straw mulching and no tillage. These results underscore straw mulching–strip tillage as a crucial strategy in mitigating wind erosion in black soil farmlands, addressing the emergence challenges of conventional straw mulching with no tillage and supporting sustainable, high-yield agriculture in Northeast China’s black soil region.

4.2. Effects of Tillage Practices and Soil Wind Erosion on Soil Nutrients and Yield
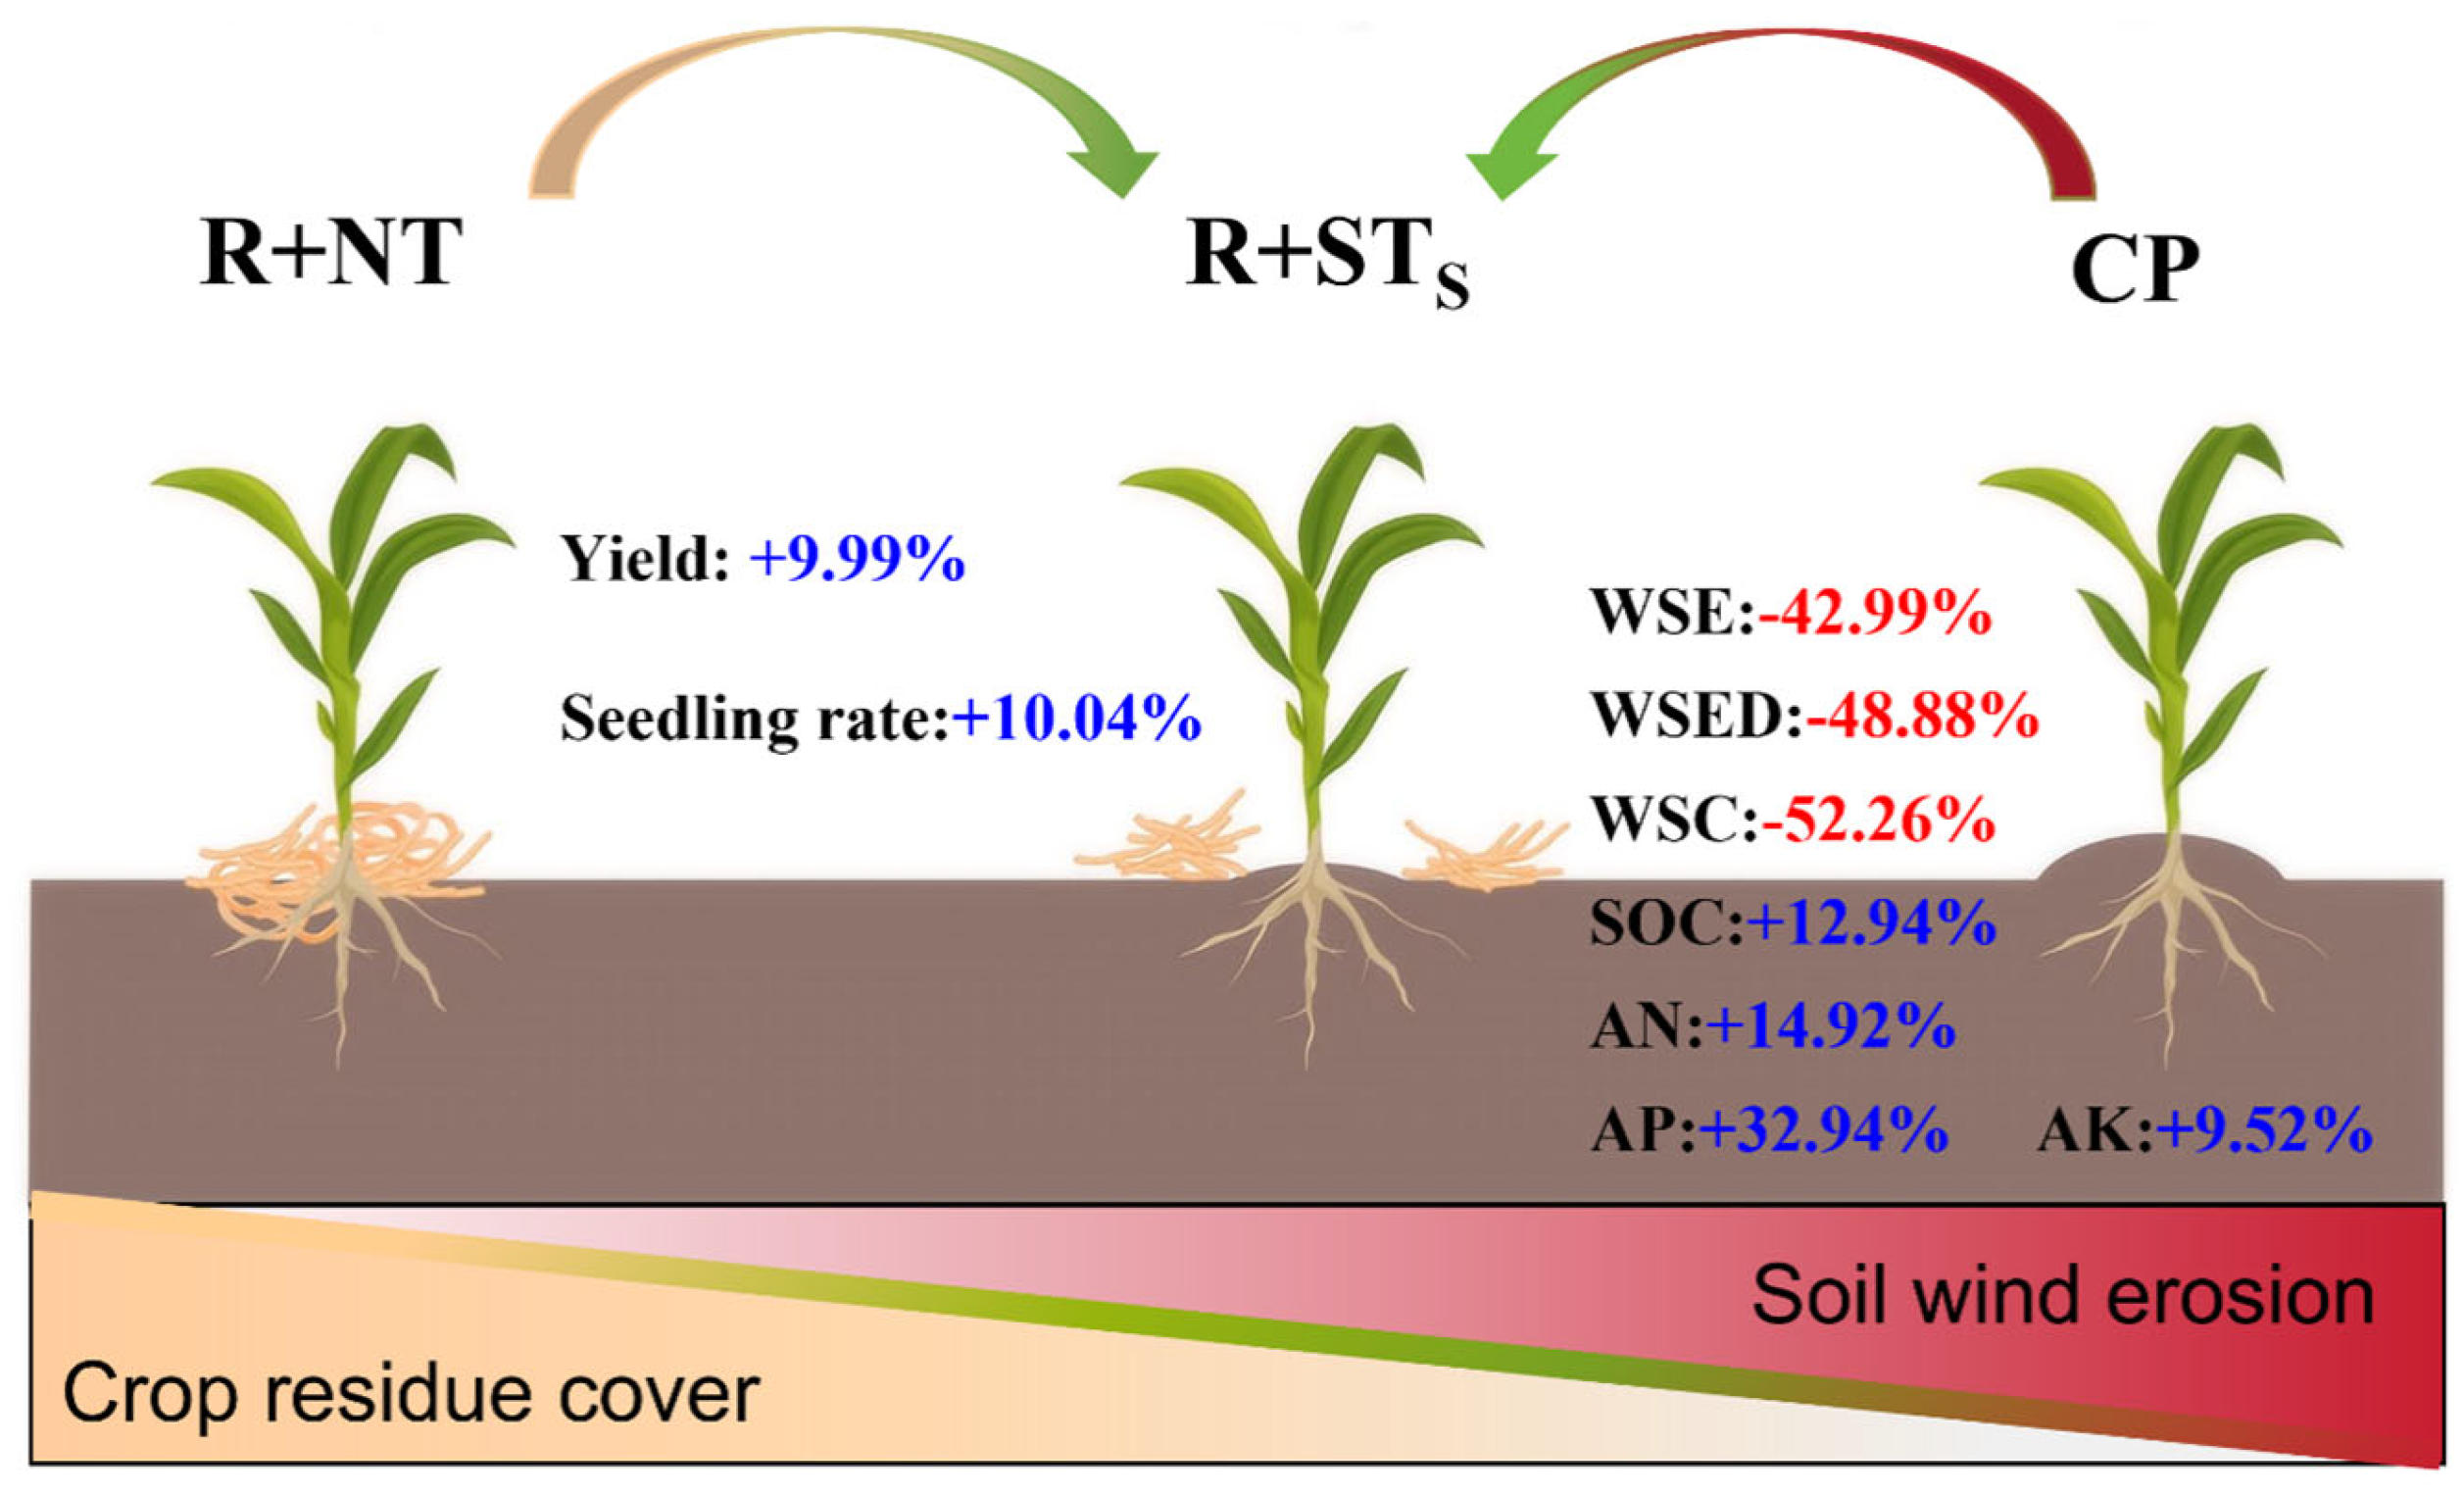
Soil, as the core component of agricultural ecosystems, undergoes quality changes that directly impact agricultural productivity and regional ecological security [29,30]. In semi-arid regions with frequent wind–sand activity, wind erosion has become a critical constraint to sustainable agricultural development [31,32]. Wind erosion not only removes and discharges nutrient-rich fine soil particles, leading to substantial nutrient losses, but, in severe cases, can also trigger farmland desertification [33,34]. To mitigate this issue, studies have demonstrated that soil conservation measures, such as straw mulching combined with stubble retention, help to reduce wind erosion by altering the soil surface microtopography.
These measures disrupt the near-surface airflow, creating zones of reduced wind velocity that effectively lessen wind-driven soil erosion and nutrient loss [35]. This further underscores the critical role of conservation tillage practices in wind erosion control and their significant benefits in improving the topsoil nutrient status. Compared to conventional rotary tillage and ridging, straw mulching–strip tillage enhances the soil nutrient content by increasing the organic matter input through straw incorporation, while simultaneously reducing the wind erosion intensity (Figure 12). The results of this study indicate that, relative to conventional tillage, straw mulching–strip tillage increased the soil available nitrogen, available phosphorus, and available potassium by 14.92%, 32.94%, and 9.52%, respectively. These findings corroborate those of Liu et al. [36], further validating the advantages of conservation tillage practices in improving soil nutrient conditions.
There exists a close interaction between soil nutrients and crop growth. This study found that the soil total nitrogen, available nitrogen, and available potassium content was significantly and positively correlated with the maize yield. Straw mulching–strip tillage improved the soil nutrient status, providing maize with sufficient essential nutrients such as nitrogen, phosphorus, and potassium [37]. As an important source of organic matter, crop straw incorporation not only replenishes the soil nutrient pool but also enhances soil fertility by improving the soil’s physical structure and biological activity [38]. Relevant studies have confirmed that maize straw incorporation significantly increases the soil organic carbon and available nutrient content [39], which aligns with the findings of this study.
From the perspective of the soil–crop system’s overall effects, this study confirmed that the maize yield under straw mulching–strip tillage increased by an average of 10.76% compared to conventional tillage. This yield improvement can be primarily attributed to three factors: (1) straw mulching reduced nutrient losses caused by soil wind erosion; (2) straw incorporation increased the soil organic carbon and nutrient content; and (3) strip tillage improved the soil structure, creating a favorable environment for root growth. These results not only validate the significant efficacy of straw mulching–strip tillage in reducing erosion and enhancing soil fertility but also provide critical agricultural and technical support for regional sustainable development.

5. Conclusions

This study elucidates the differential impacts of various tillage practices on wind erosion, soil nutrients, and maize yields in the black soil region along the foothills of the Daxing’anling Mountains, emphasizing the unique advantages of spring strip tillage with straw mulching. This practice significantly reduces wind erosion, sediment transport, and soil creep by increasing straw coverage, enhancing the aerodynamic roughness, and improving soil moisture, while minimizing soil disturbances and the tillage intensity. These mechanisms effectively prevent topsoil and nutrient losses.
Additionally, spring strip tillage with straw mulching incorporates exogenous organic matter and maintains straw-free seedling zones, promoting optimal maize emergence and creating a favorable environment for crop growth. Compared to conventional tillage and no tillage with straw mulching, this approach effectively mitigates wind erosion, improves soil fertility, and overcomes the limitations of poor emergence and low yields. These findings provide theoretical support and practical guidance for the green and sustainable development of farmland in the black soil region, while also serving as a valuable reference for the promotion of erosion control tillage technologies in similar ecological zones.

Author Contributions

Formal analysis, writing—original draft preparation, Z.Y. and L.B.; methodology, Z.W. (Zhen Wang); conceptualization, T.W. and F.W.; software, F.L. and Y.W.; investigation, Z.Y., T.W. and Z.C.; data curation, Z.Y.; writing—review and editing, Z.W. (Zhigang Wang) and L.B.; funding acquisition, Z.W. (Zhigang Wang). All authors have read and agreed to the published version of the manuscript.

Funding

This research was supported by the National Key Research and Development Program Projects (2022YFD1500902-4); the National Natural Science Foundation of China (32460534); the Inner Mongolia Natural Science Foundation of China (2024JQ09); the Inner Mongolia Natural Science Foundation of China (2024QN03008); and the Inner Mongolia Autonomous Region Key R&D and Achievement Transformation Project (2022YFDZ0041).

Data Availability Statement

The data reported in this study are contained within the article.

Conflicts of Interest

The authors declare that they have no conflicts of interest.

References

  1. Wang, X.; Li, Y.; Gong, X.; Niu, Y.; Chen, Y.; Shi, X.; Li, W. Storage, Pattern and Driving Factors of Soil Organic Carbon in an Ecologically Fragile Zone of Northern China. Geoderma 2019, 343, 155–165. [Google Scholar] [CrossRef]
  2. Zhang, Y.; Liu, M.; Han, L.; Yang, J.; Zhao, X.; Qu, J.; Li, L.; Bai, Y.; Yan, D.; Hou, G. Spatial Distribution Characteristics of Soil C:N:P:K Eco-Stoichiometry of Farmland and Grassland in the Agro-Pastoral Ecotone in Inner Mongolia, China. Agronomy 2024, 14, 346. [Google Scholar] [CrossRef]
  3. Hao, C.; Yan, D.; Xiao, W.; Shi, M.; He, D.; Sun, Z. Impacts of Typical Rainfall Processes on Nitrogen in Typical Rainfield of Black Soil Region in Northeast China. Arab. J. Geosci. 2015, 8, 6745–6757. [Google Scholar] [CrossRef]
  4. Xu, X.; Xu, Y.; Chen, S.; Xu, S.; Zhang, H. Soil Loss and Conservation in the Black Soil Region of Northeast China: A Retrospective Study. Environ. Sci. Policy 2010, 13, 793–800. [Google Scholar] [CrossRef]
  5. Zhang, S.; Chen, X.; Jia, S.; Liang, A.; Zhang, X.; Yang, X.; Wei, S.; Sun, B.; Huang, D.; Zhou, G. The Potential Mechanism of Long-Term Conservation Tillage Effects on Maize Yield in the Black Soil of Northeast China. Soil Tillage Res. 2015, 154, 84–90. [Google Scholar] [CrossRef]
  6. Wang, H.; Yang, S.; Wang, Y.; Gu, Z.; Xiong, S.; Huang, X.; Sun, M.; Zhang, S.; Guo, L.; Cui, J. Rates and Causes of Black Soil Erosion in Northeast China. Catena 2022, 214, 106250. [Google Scholar] [CrossRef]
  7. Dai, Y.C.; Yang, X.Q.; Zhang, Z.G.; Liu, D.; Gao, Y.G. Causes of Soil Degradation and Its Impact on Agriculture in Heilongjiang Province. Mod. Agric. (China) 2017, 10, 13–17. [Google Scholar] [CrossRef]
  8. Ao, M.; Zhang, X.D.; Guan, Y.X. Research and Practice of Conservation Tillage Technology in Black Soil of Northeast China. Bull. Chin. Acad. Sci. 2021, 36, 1203–1215. [Google Scholar] [CrossRef]
  9. Liang, X.; Rehman, S.U.; Zhiqi, W.; Raza, M.A.; Haider, I.; Khalid, M.H.B.; Saeed, A.; Iqbal, Z.; Fatima, S.; Siddiqa, A. Impacts of Conservation Tillage on Agricultural Land Development: A Review. J. Soil Sci. Plant Nutr. 2024, 25, 428–449. [Google Scholar] [CrossRef]
  10. Somasundaram, J.; Sinha, N.; Dalal, R.C.; Lal, R.; Mohanty, M.; Naorem, A.; Hati, K.; Chaudhary, R.; Biswas, A.; Patra, A. No-Till Farming and Conservation Agriculture in South Asia–Issues, Challenges, Prospects and Benefits. Crit. Rev. Plant Sci. 2020, 39, 236–279. [Google Scholar] [CrossRef]
  11. Xiao, L.; You, Z.; Zhang, H.; Xie, Z.; Zhao, R.; Greenwood, P. Effects of Conservation Practices on Global Wind Erosion Control: Evidence from Experimental Data. Land Degrad. Dev. 2023, 34, 4386–4398. [Google Scholar] [CrossRef]
  12. Shinde, R.; Shahi, D.K.; Mahapatra, P.; Singh, C.S.; Naik, S.K.; Thombare, N.; Singh, A.K. Management of Crop Residues with Special Reference to the on-Farm Utilization Methods: A Review. Ind. Crops Prod. 2022, 181, 114772. [Google Scholar] [CrossRef]
  13. Huo, R.; Wang, J.; Wang, K.; Zhang, Y.; Ren, T.; Li, X.; Cong, R.; Lu, J. Long-Term Straw Return Enhanced Crop Yield by Improving Ecosystem Multifunctionality and Soil Quality under Triple Rotation System: An Evidence from a 15 Years Study. Field Crops Res. 2024, 312, 109395. [Google Scholar] [CrossRef]
  14. Liu, R.-Z.; Borjigin, Q.; Gao, J.L.; Yu, X.F.; Hu, S.P.; Li, R.-P. Effects of Different Straw Return Methods on Soil Properties and Yield Potential of Maize. Sci. Rep. 2024, 14, 28682. [Google Scholar] [CrossRef]
  15. Chen, L.; Sun, S.; Yao, B.; Peng, Y.; Gao, C.; Qin, T.; Zhou, Y.; Sun, C.; Quan, W. Effects of Straw Return and Straw Biochar on Soil Properties and Crop Growth: A Review. Front. Plant Sci. 2022, 13, 986763. [Google Scholar] [CrossRef]
  16. Yang, C.; Geng, Y.; Fu, X.Z.; Coulter, J.A.; Chai, Q. The Effects of Wind Erosion Depending on Cropping System and Tillage Method in a Semi-Arid Region. Agronomy 2020, 10, 732. [Google Scholar] [CrossRef]
  17. Jiang, F.; Xue, X.; Zhang, L.; Zuo, Y.; Zhang, H.; Zheng, W.; Bian, L.; Hu, L.; Hao, C.; Du, J. Soil Wind Erosion, Nutrients, and Crop Yield Response to Conservation Tillage in North China: A Field Study in a Semi-Arid and Wind Erosion Region after 9 Years. Field Crops Res. 2024, 316, 109508. [Google Scholar] [CrossRef]
  18. Wang, Y.K. Effects of Straw Mulching Less Tillage and Slow Mixed Fertilization on Nitrogen Efficiency of Dryland Maize. Master’s Thesis, Inner Mongolia Agricultural University, Hohhot, China, 2022. [Google Scholar] [CrossRef]
  19. Zhao, P.Y.; Tuo, D.B.; Zheng, D.W.; Duan, Y.; Li, H.C.; Yan, W.; Yao, J.Q. Research on Quantitative Observation Methods of Field Soil Wind Erosion. J. Anhui Agric. Sci. 2008, 29, 12810–12812. [Google Scholar] [CrossRef]
  20. Mendez, M.J.; Funk, R.; Buschiazzo, D.E. Efficiency of Big Spring Number Eight (Bsne) and Modified Wilson and Cook (Mwac) Samplers to Collect Pm10, Pm2. 5 and Pm1. Aeolian Res. 2016, 21, 37–44. [Google Scholar] [CrossRef]
  21. Zhang, P.; Sherman, D.J.; Li, B. Aeolian Creep Transport: A Review. Aeolian Res. 2021, 51, 100711. [Google Scholar] [CrossRef]
  22. Chang, J.L.; Chen, Z.; Chen, Y.; Qiu, Y.; Shang, X.B. Experimental Study on Three Typical Surface Wind Speed Profiles. J. Soil Water Conserv. (China) 2017, 03, 41–44. [Google Scholar]
  23. Bao, S.D. Soil Agrochemical Analysis, 3rd ed.; China Agriculture Press: Beijing, China, 2000; ISBN 7109066444. [Google Scholar]
  24. Yan, B.; Zhang, Y.; Zang, S.; Chen, Q.; Sun, L. Distributions of Particle Sizes in Black Soil and Their Environmental Significance in Northeast China. Sustainability 2021, 13, 3706. [Google Scholar] [CrossRef]
  25. Zhao, R.; Li, J.; Wu, K.; Kang, L. Cultivated Land Use Zoning Based on Soil Function Evaluation from the Perspective of Black Soil Protection. Land 2021, 10, 605. [Google Scholar] [CrossRef]
  26. Ma, S.; Wang, L.-J.; Wang, H.-Y.; Zhao, Y.-G.; Jiang, J. Impacts of Land Use/Land Cover and Soil Property Changes on Soil Erosion in the Black Soil Region, China. J. Environ. Manag. 2023, 328, 117024. [Google Scholar] [CrossRef]
  27. Li, J.J.; Li, Y.; Li, Y.K.; Zhou, L.P.; Zhang, J.H.; Zheng, Q.Z.; Liu, G.W.; Zhang, Z.P. Wind Tunnel Experimental Study on Wind Erosion Control Effect of Conservation Tillage in Hexi Oasis Irrigation Area. J. Soil Water Conserv. (China) 2017, 01, 45–47+68. [Google Scholar] [CrossRef]
  28. Wu, S.S.; Niu, J.Z.; Lin, X.N. Effects of Conservation Tillage on Soil Wind Erosion in Yanqing Farmland, Beijing Suburbs. Sci. Soil Water Conserv. (China) 2020, 18, 57–67. [Google Scholar] [CrossRef]
  29. Lal, R. Enhancing Eco-Efficiency in Agro-Ecosystems Through Soil Carbon Sequestration. Crop Sci. 2010, 50, S-120–S-131. [Google Scholar] [CrossRef]
  30. McBratney, A.; Field, D.J.; Koch, A. The Dimensions of Soil Security. Geoderma 2014, 213, 203–213. [Google Scholar] [CrossRef]
  31. Jiang, C.; Liu, J.; Zhang, H.; Zhang, Z.; Wang, D. China’s Progress Towards Sustainable Land Degradation Control: Insights from the Northwest Arid Regions. Ecol. Eng. 2019, 127, 75–87. [Google Scholar] [CrossRef]
  32. Zhang, H.; Gao, Y.; Sun, D.; Liu, L.; Cui, Y.; Zhu, W. Wind Erosion Changes in a Semi-Arid Sandy Area, Inner Mongolia, China. Sustainability 2019, 11, 188. [Google Scholar] [CrossRef]
  33. Rashmi, I.; Karthika, K.; Roy, T.; Shinoji, K.; Kumawat, A.; Kala, S.; Pal, R. Soil Erosion and Sediments: A Source of Contamination and Impact on Agriculture Productivity. In Agrochemicals in Soil and Environment: Impacts and Remediation; Springer: Berlin/Heidelberg, Germany, 2022; pp. 313–345. [Google Scholar] [CrossRef]
  34. Zucca, C.; Fleiner, R.; Bonaiuti, E.; Kang, U. Land Degradation Drivers of Anthropogenic Sand and Dust Storms. Catena 2022, 219, 106575. [Google Scholar] [CrossRef]
  35. Jia, H.; Wang, G.; Guo, L.; Zhuang, J.; Tang, L. Wind Erosion Control Utilizing Standing Corn Residue in Northeast China. Soil Tillage Res. 2015, 153, 112–119. [Google Scholar] [CrossRef]
  36. Liu, Y.; Ye, X.; Bao, H.; Wang, X.; Juan, Y. Effects of Straw Incorporation Combined with Fertilizer on Physiochemical Properties of Soil and Yield of Spring Maize. Soils 2023, 55, 254–261. [Google Scholar]
  37. Jaskulska, I.; Lemanowicz, J.; Dębska, B.; Jaskulski, D.; Breza-Boruta, B. Changes in Soil Organic Matter and Biological Parameters as a Result of Long-Term Strip-Till Cultivation. Agriculture 2023, 13, 2188. [Google Scholar] [CrossRef]
  38. Galindo, F.S.; Strock, J.S.; Pagliari, P.H. Impacts of Corn Stover Management and Fertilizer Application on Soil Nutrient Availability and Enzymatic Activity. Sci. Rep. 2022, 12, 1985. [Google Scholar] [CrossRef]
  39. Zhang, X.; Ren, X.; Cai, L. Effects of Different Straw Incorporation Amounts on Soil Organic Carbon, Microbial Biomass, and Enzyme Activities in Dry-Crop Farmland. Sustainability 2024, 16, 10588. [Google Scholar] [CrossRef]
Figure 1. Locations of the experimental sites in 2023–2024: (a) Arong Banner; (b) Zhalaite Banner.
Agronomy 15 01415 g001
Figure 2. Precipitation and temperature dynamics in the test area in 2023–2024. Meteorological data were obtained from the Arong Banner and Zhalaite Banner meteorological stations.
Agronomy 15 01415 g002
Figure 3. Images of different soil tillage treatments.
Agronomy 15 01415 g003
Figure 4. Effects of different tillage practices on the amount of soil wind erosion in 2024 and 2023. Data are expressed as the mean ± SE (n = 3). Lowercase letters indicate significant differences in the pre-sowing or post-sowing soil wind erosion rates between different tillage treatments (p < 0.05), while uppercase letters indicate significant differences in the accumulated soil wind erosion rates before and after sowing (p < 0.05). CP, NT, R+NT, R+STA, and R+STS represent conventional plowing, no till with straw removal, no till with straw mulching, strip till with straw mulching in autumn, and strip tillage with straw mulching during spring sowing, respectively.
Agronomy 15 01415 g004
Figure 5. Effects of different tillage practices on soil sediment discharge in 2024 and 2023. CP, NT, R+NT, R+STA, and R+STS represent conventional plowing, no till with straw removal, no till with straw mulching, strip till with straw mulching in autumn, and strip tillage with straw mulching during spring sowing, respectively.
Agronomy 15 01415 g005
Figure 6. Effects of different tillage practices on soil creep amount in 2024 and 2023. Data are expressed as the mean ± SE (n = 3). Lowercase letters indicate significant differences in the pre-sowing or post-sowing soil creep amount between different tillage treatments (p < 0.05), while uppercase letters indicate significant differences in the accumulated soil wind erosion rates before and after sowing (p < 0.05). CP, NT, R+NT, R+STA, and R+STS represent conventional plowing, no till with straw removal, no till with straw mulching, strip till with straw mulching in autumn, and strip tillage with straw mulching during spring sowing, respectively.
Agronomy 15 01415 g006
Figure 7. Effects of different ploughing practices on surface aerodynamic roughness in 2024 and 2023. Bars show means with standard errors (n = 9). Box plots depict the minimum to maximum and mean (n = 9). CP, NT, R+NT, R+STA, and R+STS represent conventional plowing, no till with straw removal, no till with straw mulching, strip till with straw mulching in autumn, and strip tillage with straw mulching during spring sowing, respectively.
Agronomy 15 01415 g007
Figure 8. Effects of different tillage practices on soil total nitrogen and soil organic carbon. Data are expressed as the mean ± SE (n = 3). Values followed by different lowercase letters within a column are significantly different at a p < 0.05 level among different treatments in the same year. CP, NT, R+NT, R+STA, and R+STS represent conventional plowing, no till with straw removal, no till with straw mulching, strip till with straw mulching in autumn, and strip tillage with straw mulching during spring sowing, respectively.
Agronomy 15 01415 g008
Figure 9. Effects of different tillage practices on soil available nutrients. Data are expressed as the mean ± SE (n = 3). Values followed by different lowercase letters within a column are significantly different at a p < 0.05 level among different treatments in the same year. CP, NT, R+NT, R+STA, and R+STS represent conventional plowing, no till with straw removal, no till with straw mulching, strip till with straw mulching in autumn, and strip tillage with straw mulching during spring sowing, respectively.
Agronomy 15 01415 g009
Figure 10. Correlation analysis of tillage treatments and various indicators based on Mantel test. Mantel’s p is the significance level for the test (used in this paper to reveal the correlations between tillage practices and various indicators; red represents a highly significant correlation, green represents a significant correlation, and blue represents no significant correlation; * indicates significance between different indicators: * p < 0.05, ** p < 0.01, *** p < 0.001). Mantel’s r is the core statistic of Mantel analysis, with a larger value indicating a stronger correlation; Spearman’s r measures the correlation between two variables.
Agronomy 15 01415 g010
Figure 11. Structural equation model of the effects of tillage practices on soil wind erosion, soil nutrients, and crop yields. Note: (1) The values next to the arrows represent standardized path coefficients (SPC); * indicates significance: * p < 0.05, ** p < 0.01, *** p < 0.001. (2) Red represents positive correlations, blue represents negative correlations, solid lines indicate significant correlations, dashed lines indicate non-significant correlations, and the thickness of the line represents the magnitude of the path coefficient. (3) Path coefficients represent the strength and direction of the direct relationships between different variables, reflecting the extent or contribution of the independent variable to the dependent variable. The larger the absolute value, the stronger the influence.
Agronomy 15 01415 g011
Figure 12. Effects of farming practices on soil wind erosion, soil nutrients, and crop yields. CP, R+NT, and R+STS represent conventional plowing, no till with straw mulching, and strip tillage with straw mulching during spring sowing, respectively. WSE: soil wind erosion; WSED: soil sediment discharge; WSC: soil creep amount; SOC: soil organic carbon; AN: soil available nitrogen; AP: soil available phosphorus; AK: soil available potassium.
Agronomy 15 01415 g012
Table 1. Wind erosion-related instrument setup times in 2024 and 2023.
YearTopographySetup TimeSampling TimeLand Preparation and SowingSetup TimeSampling Time
2023Gently sloped uplands04/0104/3004/3005/0206/15
Flat depressions04/0305/0305/0405/0506/18
2024Gently sloped uplands04/0104/2604/0604/2806/12
Flat depressions04/0304/2905/0705/0806/22
Table 2. Effect of different tillage practices on straw coverage and maize germination rate.
YearTopographyTreatmentPre-Sowing Coverage (%)Post-Sowing Coverage (%)Germination Rate (%)
2023Gently sloped uplandsCP--94.35 ± 4.49 ab
NT29.87 ± 1.40 c27.20 ± 3.12 d89.58 ± 1.03 b
R+NT93.20 ± 1.60 a89.07 ± 0.61 a81.55 ± 2.87 c
R+STA86.40 ± 2.80 b82.93 ± 2.20 b90.18 ± 1.79 b
R+STS93.07 ± 0.83 a78.13 ± 2.41 c95.24 ± 1.36 a
Flat depressionsCP--91.96 ± 1.79 ab
NT32.60 ± 1.98 c31.20 ± 3.60 c89.29 ± 3.22 b
R+NT92.27 ± 2.44 a90.40 ± 2.43 a85.42 ± 1.86 c
R+STA86.27 ± 2.31 b84.27 ± 1.29 b91.67 ± 0.52 ab
R+STS92.40 ± 2.50 a80.80 ± 4.40 b94.05 ± 1.36 a
2024Gently sloped uplandsCP--94.05 ± 0.52 a
NT31.20 ± 1.44 c27.07 ± 3.61 d89.58 ± 1.86 b
R+NT93.20 ± 1.60 a89.87 ± 2.89 a84.52 ± 1.86 c
R+STA85.60 ± 2.62 b82.93 ± 3.95 b90.48 ± 0.52 b
R+STS92.80 ± 1.06 a74.80 ± 3.60 c94.94 ± 1.03 a
Flat depressionsCP--92.26 ± 3.72 a
NT33.20 ± 1.44 c30.67 ± 4.42 c91.67 ± 2.06 a
R+NT92.00 ± 1.60 a91.47 ± 1.40 a85.12 ± 1.03 b
R+STA86.40 ± 0.80 b83.47 ± 0.61 b91.07 ± 1.79 a
R+STS91.20 ± 2.50 a80.13 ± 2.81 b94.05 ± 2.73 a
Data are expressed as the mean ± SE (n = 3). Values followed by different lowercase letters within a column are significantly different at a p < 0.05 level among different treatments in the same year. CP, NT, R+NT, R+STA, and R+STS represent conventional plowing, no till with straw removal, no till with straw mulching, strip till with straw mulching in autumn, and strip tillage with straw mulching during spring sowing, respectively.
Table 3. Effects of different tillage practices on soil water content and bulk density.
YearTopographyTreatmentPre-Sowing SWC (%)Post-Sowing SWC (%)Pre-Sowing
BD (g cm−3)
Post-Sowing BD (g cm−3)
2023Gently sloped uplandsCP13.90 ± 0.48 c12.14 ± 0.13 d1.47 ± 0.04 a1.30 ± 0.03 c
NT14.03 ± 0.48 c13.93 ± 0.21 c1.49 ± 0.02 a1.49 ± 0.03 a
R+NT18.60 ± 1.20 a18.58 ± 1.78 a1.43 ± 0.02 b1.43 ± 0.01 b
R+STA17.14 ± 0.95 b15.91 ± 1.03 b1.44 ± 0.01 b1.42 ± 0.04 b
R+STS19.33 ± 0.38 a16.07 ± 0.67 b1.44 ± 0.02 b1.41 ± 0.02 b
Flat depressionsCP15.56 ± 1.27 d25.06 ± 0.31 b1.20 ± 0.06 b1.24 ± 0.02 a
NT18.26 ± 0.61 c25.98 ± 1.80 b1.38 ± 0.09 a1.29 ± 0.01 a
R+NT25.39 ± 1.12 a28.49 ± 0.47 a1.34 ± 0.02 a1.24 ± 0.04 a
R+STA20.93 ± 1.52 b28.30 ± 0.53 a1.31 ± 0.05 a1.26 ± 0.03 a
R+STS26.26 ± 0.99 a28.55 ± 0.35 a1.33 ± 0.03 a1.25 ± 0.02 a
2024Gently sloped uplandsCP14.39 ± 0.40 c13.62 ± 0.22 d1.48 ± 0.02 a1.31 ± 0.02 c
NT14.46 ± 0.26 c15.60 ± 0.21 c1.48 ± 0.01 a1.48 ± 0.01 a
R+NT18.77 ± 0.52 a18.59 ± 0.51 a1.41 ± 0.01 b1.43 ± 0.01 b
R+STA17.09 ± 0.66 b17.07 ± 0.48 b1.42 ± 0.02 b1.41 ± 0.02 b
R+STS18.99 ± 0.43 a17.41 ± 0.51 b1.41 ± 0.01 b1.41 ± 0.02 b
Flat depressionsCP16.55 ± 0.51 d24.60 ± 0.53 c1.23 ± 0.03 c1.22 ± 0.02 c
NT18.55 ± 0.37 c25.29 ± 0.74 c1.41 ± 0.01 b1.40 ± 0.05 a
R+NT23.45 ± 1.30 a28.67 ± 0.59 a1.33 ± 0.04 a1.29 ± 0.02 b
R+STA20.17 ± 0.42 b27.05 ± 0.50 b1.35 ± 0.03 a1.27 ± 0.01 b
R+STS23.67 ± 1.22 a27.89 ± 0.65 ab1.30 ± 0.03 a1.26 ± 0.01 bc
Data are expressed as the mean ± SE (n = 3). Values followed by different lowercase letters within a column are significantly different at a p < 0.05 level among different treatments in the same year. CP, NT, R+NT, R+STA, and R+STS represent conventional plowing, no till with straw removal, no till with straw mulching, strip till with straw mulching in autumn, and strip tillage with straw mulching during spring sowing, respectively.
Table 4. Effects of different tillage practices on maize yield and yield components.
YearTopographyTreatmentEar Density (Ears ha−1)Kernels per Ear (No. Ear−1)1000-Kernel Weight (g)Grain Yield (t ha−1)
2023Gently sloped uplandsCP7.87 ± 0.04 ab562.36 ± 4.76 c312.94 ± 2.50 b11.69 ± 0.06 c
NT7.77 ± 0.07 bc561.13 ± 3.05 c330.15 ± 3.03 a12.23 ± 0.02 b
R+NT7.69 ± 0.07 c552.13 ± 5.92 d319.58 ± 6.54 b11.56 ± 0.12 d
R+STA7.31 ± 0.32 d602.56 ± 3.43 a318.73 ± 3.24 b11.87 ± 0.05 c
R+STS7.95 ± 0.09 a575.46 ± 2.84 b333.41 ± 3.14 a12.96 ± 0.45 a
Flat depressionsCP7.41 ± 0.04 c533.43 ± 2.29 b320.52 ± 2.08 b10.77 ± 0.07 d
NT7.48 ± 0.09 bc543.60 ± 5.31 b338.90 ± 3.54 b11.74 ± 0.04 b
R+NT7.59 ± 0.09 bc536.27 ± 5.77 b322.62 ± 3.84 b11.31 ± 0.07 c
R+STA7.67 ± 0.04 b557.50 ± 4.04 a322.08 ± 3.04 b11.70 ± 0.05 b
R+STS8.03 ± 0.19 a544.43 ± 9.86 b325.20 ± 11.60 a12.89 ± 0.11 a
2024Gently sloped uplandsCP7.93 ± 0.09 b572.70 ± 14.29 a301.29 ± 5.21 a11.66 ± 0.11 b
NT8.08 ± 0.08 ab557.13 ± 19.51 b306.58 ± 8.28 a11.72 ± 0.11 b
R+NT7.89 ± 0.11 b552.83 ± 4.75 b314.30 ± 4.71 a11.50 ± 0.04 c
R+STA7.36 ± 0.04 c582.23 ± 10.85 a313.69 ± 6.79 a11.42 ± 0.07 c
R+STS8.13 ± 0.12 a582.86 ± 9.63 a307.77 ± 1.31 a12.39 ± 0.10 a
Flat depressionsCP7.64 ± 0.09 c553.56 ± 3.79 a290.17 ± 7.48 d10.91 ± 0.19 d
NT7.95 ± 0.09 ab540.10 ± 16.47 b315.09 ± 3.77 ab11.49 ± 0.10 b
R+NT7.79 ± 0.12 bc552.73 ± 4.82 a303.51 ± 0.81 c11.12 ± 0.22 cd
R+STA7.87 ± 0.04 ab549.4 ± 9.72 ab308.71 ± 2.61 bc11.33 ± 0.10 bc
R+STS8.05 ± 0.12 a542.67 ± 3.05 b320.34 ± 4.09 a11.89 ± 0.08 a
Data are expressed as the mean ± SE (n = 3). Values followed by different lowercase letters within a column are significantly different at a p < 0.05 level among different treatments in the same year. CP, NT, R+NT, R+STA, and R+STS represent conventional plowing, no till with straw removal, no till with straw mulching, strip till with straw mulching in autumn, and strip tillage with straw mulching during spring sowing, respectively.
Disclaimer/Publisher’s Note: The statements, opinions and data contained in all publications are solely those of the individual author(s) and contributor(s) and not of MDPI and/or the editor(s). MDPI and/or the editor(s) disclaim responsibility for any injury to people or property resulting from any ideas, methods, instructions or products referred to in the content.

