Article

An Enhanced Faster R-CNN for High-Throughput Winter Wheat Spike Monitoring to Improved Yield Prediction and Water Use Efficiency

1
College of Water Conservancy, North China University of Water Resources and Electric Power, Zhengzhou 450046, China
2
Institute of Soil and Water Conservation, Northwest A&F University, Yangling 712100, China
3
College of Hydrology and Water Resources, Hohai University, Nanjing 210098, China
4
School of Computing, University of Portsmouth, Portsmouth PO1 3HE, UK
5
School of Mathematics, Statistics & Computer Science, University of KwaZulu-Natal, Durban 4041, South Africa
*
Author to whom correspondence should be addressed.
Agronomy 2025, 15(10), 2388; https://doi.org/10.3390/agronomy15102388
Submission received: 29 September 2025 / Revised: 11 October 2025 / Accepted: 12 October 2025 / Published: 14 October 2025
(This article belongs to the Section Water Use and Irrigation)

Abstract

This study develops an innovative unmanned aerial vehicle (UAV)-based intelligent system for winter wheat yield prediction, addressing the inefficiencies of traditional manual counting methods (with approximately 15% error rate) and enabling quantitative analysis of water–fertilizer interactions. By integrating an enhanced Faster Region-Based Convolutional Neural Network (Faster R-CNN) architecture with multi-source data fusion and machine learning, the system significantly improves both spike detection accuracy and yield forecasting performance. Field experiments during the 2022–2023 growing season captured high-resolution multispectral imagery for varied irrigation regimes and fertilization treatments. The optimized detection model incorporates ResNet-50 as the backbone feature extraction network, with residual connections and channel attention mechanisms, achieving a mean average precision (mAP) of 91.2% (calculated at IoU threshold 0.5) and 88.72% recall while reducing computational complexity. The model outperformed YOLOv8 by a statistically significant 2.1% margin (p < 0.05). Using model-generated spike counts as input, the random forest (RF) model regressor demonstrated superior yield prediction performance (R2 = 0.82, RMSE = 324.42 kg·ha−1), exceeding the Partial Least Squares Regression (PLSR) (R2 +46%, RMSE-44.3%), Least Squares Support Vector Machine (LSSVM) (R2 + 32.3%, RMSE-32.4%), Support Vector Regression (SVR) (R2 + 30.2%, RMSE-29.6%), and Backpropagation (BP) Neural Network (R2+22.4%, RMSE-24.4%) models. Analysis of different water–fertilizer treatments revealed that while organic fertilizer under full irrigation (750 m3 ha−1) conditions achieved maximum yield benefit (13,679.26 CNY·ha−1), it showed relatively low water productivity (WP = 7.43 kg·m−3). Conversely, under deficit irrigation (450 m3 ha−1) conditions, the 3:7 organic/inorganic fertilizer treatment achieved optimal WP (11.65 kg m−3) and WUE (20.16 kg∙ha−1∙mm−1) while increasing yield benefit by 25.46% compared to organic fertilizer alone. This research establishes an integrated technical framework for high-throughput spike monitoring and yield estimation, providing actionable insights for synergistic water–fertilizer management strategies in sustainable precision agriculture.

1. Introduction

Wheat is a vital global food crop, playing a critical role in national food security [1]. As China is the world’s largest producer and consumer of wheat [2,3], its stable grain production has a significant impact on global food security [4,5]. Enhancing wheat yield is essential to addressing ongoing challenges such as global climate change and continuous population growth [5]. The number of wheat spikes per unit area is strongly correlated with final yield, making accurate spike identification crucial for reliable yield estimation [6,7,8]. However, traditional manual identification and counting methods are not only time-consuming but also prone to sampling inaccuracies [9,10]. Thus, developing automated and precise spike detection methods is of great practical significance.
Remote sensing technology provides an efficient approach for crop monitoring through multi-spectral data acquisition, offering advantages such as operational ease, wide spatial coverage, and rapid data collection [11,12]. It holds substantial potential in the field of precision agriculture [13]. With the increasing availability of high-resolution cameras and advances in unmanned aerial vehicle (UAV) remote sensing, numerous yield estimation models based on remote sensing data have been developed and applied [14,15]. Current research on crop yield prediction predominantly relies on UAV remote sensing crop yield prediction models [16,17]. For instance, Zhou et al. (2017) utilized UAV-acquired multispectral and RGB imagery along with multiple vegetation indices to estimate rice yield, identifying the jointing and booting stages as optimal for prediction [18]. Zheng et al. (2022) developed a linear yield estimation model using texture indices from multispectral images obtained by drones during the booting and filling stages, demonstrating stronger generalizability across years, varieties, and sensors compared to vegetation indices (VIs) [19]. However, models based solely on remote sensing data may suffer from limited accuracy and poor generalization.
To address these limitations, machine learning techniques—including Partial Least Squares (PLS), Support Vector Machines (SVMs), and random forest (RF)—have been increasingly adopted for robust crop yield modeling [20,21,22]. For example, Liu et al. (2025) proposed a UAV remote sensing-based yield prediction method in which the random forest (RF) algorithm achieved promising performance with R2 scores of 0.92 (training) and 0.58 (testing) [23]. Xiao et al. (2024) introduced an ACNN model for spatiotemporal yield feature extraction, outperforming RF and CNN models in Henan using the RF, CNN, and ACNN methods; the results demonstrated ACNN’s superiority with R2 = 0.72 (county) versus RF’s 0.57, which showed RF’s inferior accuracy to the ACNN for county-level yield estimation in Henan province [16]. It is worth noting that most remote sensing studies in wheat have focused on population-level traits such as vegetation indices analysis and leaf area index, while organ-level recognition—particularly of yield-related components like wheat spikes—remains relatively underexplored [24]. Given that spike density and spatial distribution are direct determinants of winter wheat yield, integrating these traits with remote sensing data to develop more accurate yield models has emerged as a key research direction.
In recent years, deep learning has been widely applied in agricultural applications such as fruit detection and counting [25,26], weed recognition [27,28], and plant disease detection [29,30], mainly focusing on mage classification and identification of areas of interest. However, its use in yield estimation remains relatively limited [31,32,33]. Nevertheless, a number of object detection models have been introduced to automate wheat spike recognition and mitigate reliance on manual methods [34,35]. Deep learning-based object detection algorithms are increasingly applied to wheat spike counting [36,37], primarily including single-stage models such as the YOLO and SSD series [38,39]. For instance, He et al. (2020) developed an enhanced YOLOv4 model for UAV-based spike detection in field conditions, demonstrating the advantages of YOLO architectures in terms of lightweight design and detection efficiency [40]. Similarly, Zhao et al. (2021) proposed an improved YOLOv5 model that showed superior performance in automated spike detection in drone imagery compared to several benchmark models [37]. These studies highlight the capabilities of YOLO-based models in wheat spike recognition tasks. However, YOLO models often exhibit limitations in challenging field conditions, such as scenes with low color contrast or complex backgrounds. In such scenarios, two-stage detectors like Faster R-CNN and Mask R-CNN have shown promising results in crop detection [41,42]. For example, Sun et al. (2022) proposed an improved Faster R-CNN-based network (WHCnet) that maintained robust performance across varying lighting conditions, illustrating the strong generalization ability of Faster R-CNN in complex environments [43]. Li et al. (2022) further validated the effectiveness of Faster R-CNN in spike counting using RGB imagery, with results closely aligning with manual measurements [44]. Against this backdrop, YOLOv8 was selected in our study as a strong and widely recognized baseline due to its status as a well-established standard in both agricultural and general object detection at the time of our experimental design. This choice provided a meaningful and conservative benchmark for fairly assessing the efficacy of our proposed enhancements.
It is worth noting that recognition performance can vary significantly across crop types and planting conditions. Zhang et al. (2022) applied an improved Faster R-CNN to rice panicle recognition and achieved high accuracy, benefiting from rice’s lower planting density compared to wheat [45]. Under China’s high-density wheat planting conditions, severe spike occlusion often leads to decreased recognition accuracy in large-scale field applications. Consequently, improving detection performance in occluded environments remains a critical research challenge. This study focuses on addressing this gap by developing an enhanced Faster R-CNN architecture specifically designed for high-accuracy wheat spike detection in dense canopies. The proposed improvements aim to enhance feature representation and occlusion handling, providing a more robust solution for spike counting in practical wheat production settings.
This study addresses the critical challenge of accurately detecting wheat spikes in dense field conditions and leveraging these observations for reliable yield prediction. Traditional methods struggle with occlusion and scale variation, while existing deep learning approaches often lack the precision required for agricultural decision-making. To bridge this gap, we propose an enhanced Faster R-CNN-based architecture specifically designed for robust wheat spike detection considering real-world complexities and integrate its outputs into an interpretable yield forecasting model. The main objectives of this work are: (I) to develop an improved Faster R-CNN model incorporating a ResNet-50 backbone and attention mechanisms for high-accuracy wheat spike detection in occlusion-heavy environments and to evaluate its performance against widely adopted detectors such as YOLOv8; (II) to construct an efficient yield prediction model utilizing machine learning algorithms driven by quantitative spike features—including spike count, density, and spatial distribution—derived from the detection model; and (III) to combine spike-based monitoring with water use efficiency (WUE) analysis, quantitatively assessing the interrelationship between yield formation and water utilization in varying irrigation strategies, and to propose actionable water-management guidelines supported by phenotypic monitoring. By integrating computer vision, agronomy, and remote sensing, this study establishes a scalable technical framework extending from in-field spike identification to yield prediction and resource efficiency optimization, promoting the practical application of AI-driven technologies in sustainable precision agriculture.

2. Materials and Methods

2.1. Site Description and Experimental Treatments

The experimental site is located at the Agricultural Efficient Water Use Experimental Station on the Longzihu Campus of North China University of Water Resources and Electric Power, Zhengzhou, Henan Province. The experimental site is situated in the Central China Plain, with a flat terrain, and is located at 113.76° E longitude and 34.78° N latitude (Figure 1a). The Plain has a typical warm temperate continental monsoon climate. Affected by seasonal climate, it has the characteristics of a simultaneous decrease in water level and maximum air temperature. The precipitation is mainly concentrated in the summer months of July and August, with an average annual precipitation of 637.1 mm, an average sunshine duration of 6.57 h per day, and a frost-free period of 220 days.
This study consisted of a rigorously designed field experiment spanning two growing seasons, with sowing on 12 October 2022 and 17 October 2023 and harvesting on 30 May 2023 and 5 June 2024. The trial included a total of 10 distinct treatment groups, comprising two irrigation regimes (full irrigation: 750 m3 ha−1, LC; deficit irrigation: 450 m3 ha−1, LM) combined with five fertilization treatments (organic fertilizer alone, 1; 7:3 organic/inorganic blend, 2; 3:7 organic/inorganic blend, 3; inorganic fertilizer only, 4; no fertilizer control, 5). Full irrigation, determined based on local evapotranspiration models and soil moisture monitoring, was designed to meet 100% of crop water requirements, whereas deficit irrigation was established at 60% of local crop water demand to investigate the effects of water stress on crop growth and water productivity. Each treatment was replicated 3 times, and each plot measured 4 m × 3 m, separated by 0.5 m buffer zones (Figure 2b). All plots were randomly distributed across the experimental field to minimize spatial bias and ensure the statistical validity of the results.
The experimental field featured loam soil with the following properties in the 0–60 cm layer: organic matter 6.21 g/kg, available potassium 104.4 mg/kg, available phosphorus 11.8 mg/kg, total nitrogen 0.375 g/kg, and alkaline hydrolytic nitrogen 45–60 mg/kg. Irrigation treatments were implemented according to local flood irrigation practices, with applications timed to four critical growth stages (pre-sowing 15%, overwintering 20%, green-up 35%, and jointing 30% of total volume) and triggered by phenological development. A flood irrigation system delivered water uniformly to a 60 cm depth, corresponding to the primary root zone of winter wheat. All five fertilization treatments were designed with an equal nitrogen regime (total N = 180 kg/ha). Basal fertilizer was applied entirely before sowing using compound fertilizer (total nutrients ≥41%; N:P2O5:K2O = 17:17:7). Top-dressing fertilization was applied on March 30 during both the 2023 and 2024 growing seasons, maintaining a consistent 6:4 basal-to-topdressing ratio across all treatments.
Based on remote sensing data from the Moderate Resolution Imaging Spectroradiometer (MODIS) and combined with Geographic Information System (GIS) technology, the spatial distribution and cumulative planting years of winter wheat in the study area were visualized. The cumulative planting years were assessed through time-series analysis of MODIS data (2000–2022), where each pixel’s value represents the number of years it was consistently identified as winter wheat cultivation during this period. This approach effectively supports dynamic monitoring and accurate mapping of crop planting areas, while GIS technology transforms these data into intuitive spatial distribution maps.
The cumulative planting years shown in Figure 1c are intended solely to demonstrate the spatial stability and representativeness of the selected study region over this longer historical period. The multi-year overview illustrates a consistent regional distribution of winter wheat cultivation, confirming that the focused study area in Henan Province is representative of typical winter wheat growing conditions. We emphasize that the core research and all subsequent analyses presented in this manuscript—including UAV data collection, model development, and yield prediction—are based exclusively on the 2022-2024 winter wheat growing season, with the cumulative planting data providing only a contextual background for regional selection.

2.2. Multi-Source Data Integration and Image Processing Framework

2.2.1. Multi-Source Data Integration Strategy for Cross-Environment Wheat Spike Detection

This study employs a comprehensive data integration strategy to develop wheat spike phenotyping detection models with enhanced cross-environment generalization capability. The methodology systematically combines global benchmark data with localized experimental observations to create balanced training resources addressing both breadth and depth requirements for robust model development.
Global Data Foundation: The Global Wheat Head Detection (GWHD) dataset serves as the fundamental training resource for establishing baseline generalization capabilities and can be obtained from the computer vision data platform Kaggle (https://www.kaggle.com/). This comprehensive dataset contains 23,528 professionally annotated images (1024 × 1024 pixels) sourced from 11 countries across diverse agricultural systems. It encompasses substantial variation in wheat genotypes, planting methodologies, and ecological environments, providing crucial diversity for initial model training. However, it demonstrates limited diversity in varietal representation and environmental conditions and particularly lacks coverage of intensive farming systems with high-density planting configurations and complex water–fertilizer management regimes. These limitations restrict its capacity to fully capture the complexity of real-field scenarios, especially in developing regions. In this study, 4000 representative images were selectively curated from public datasets as benchmark data, covering diverse geographical sources, growth environments, and cultivar characteristics, to provide essential diversity for model training.
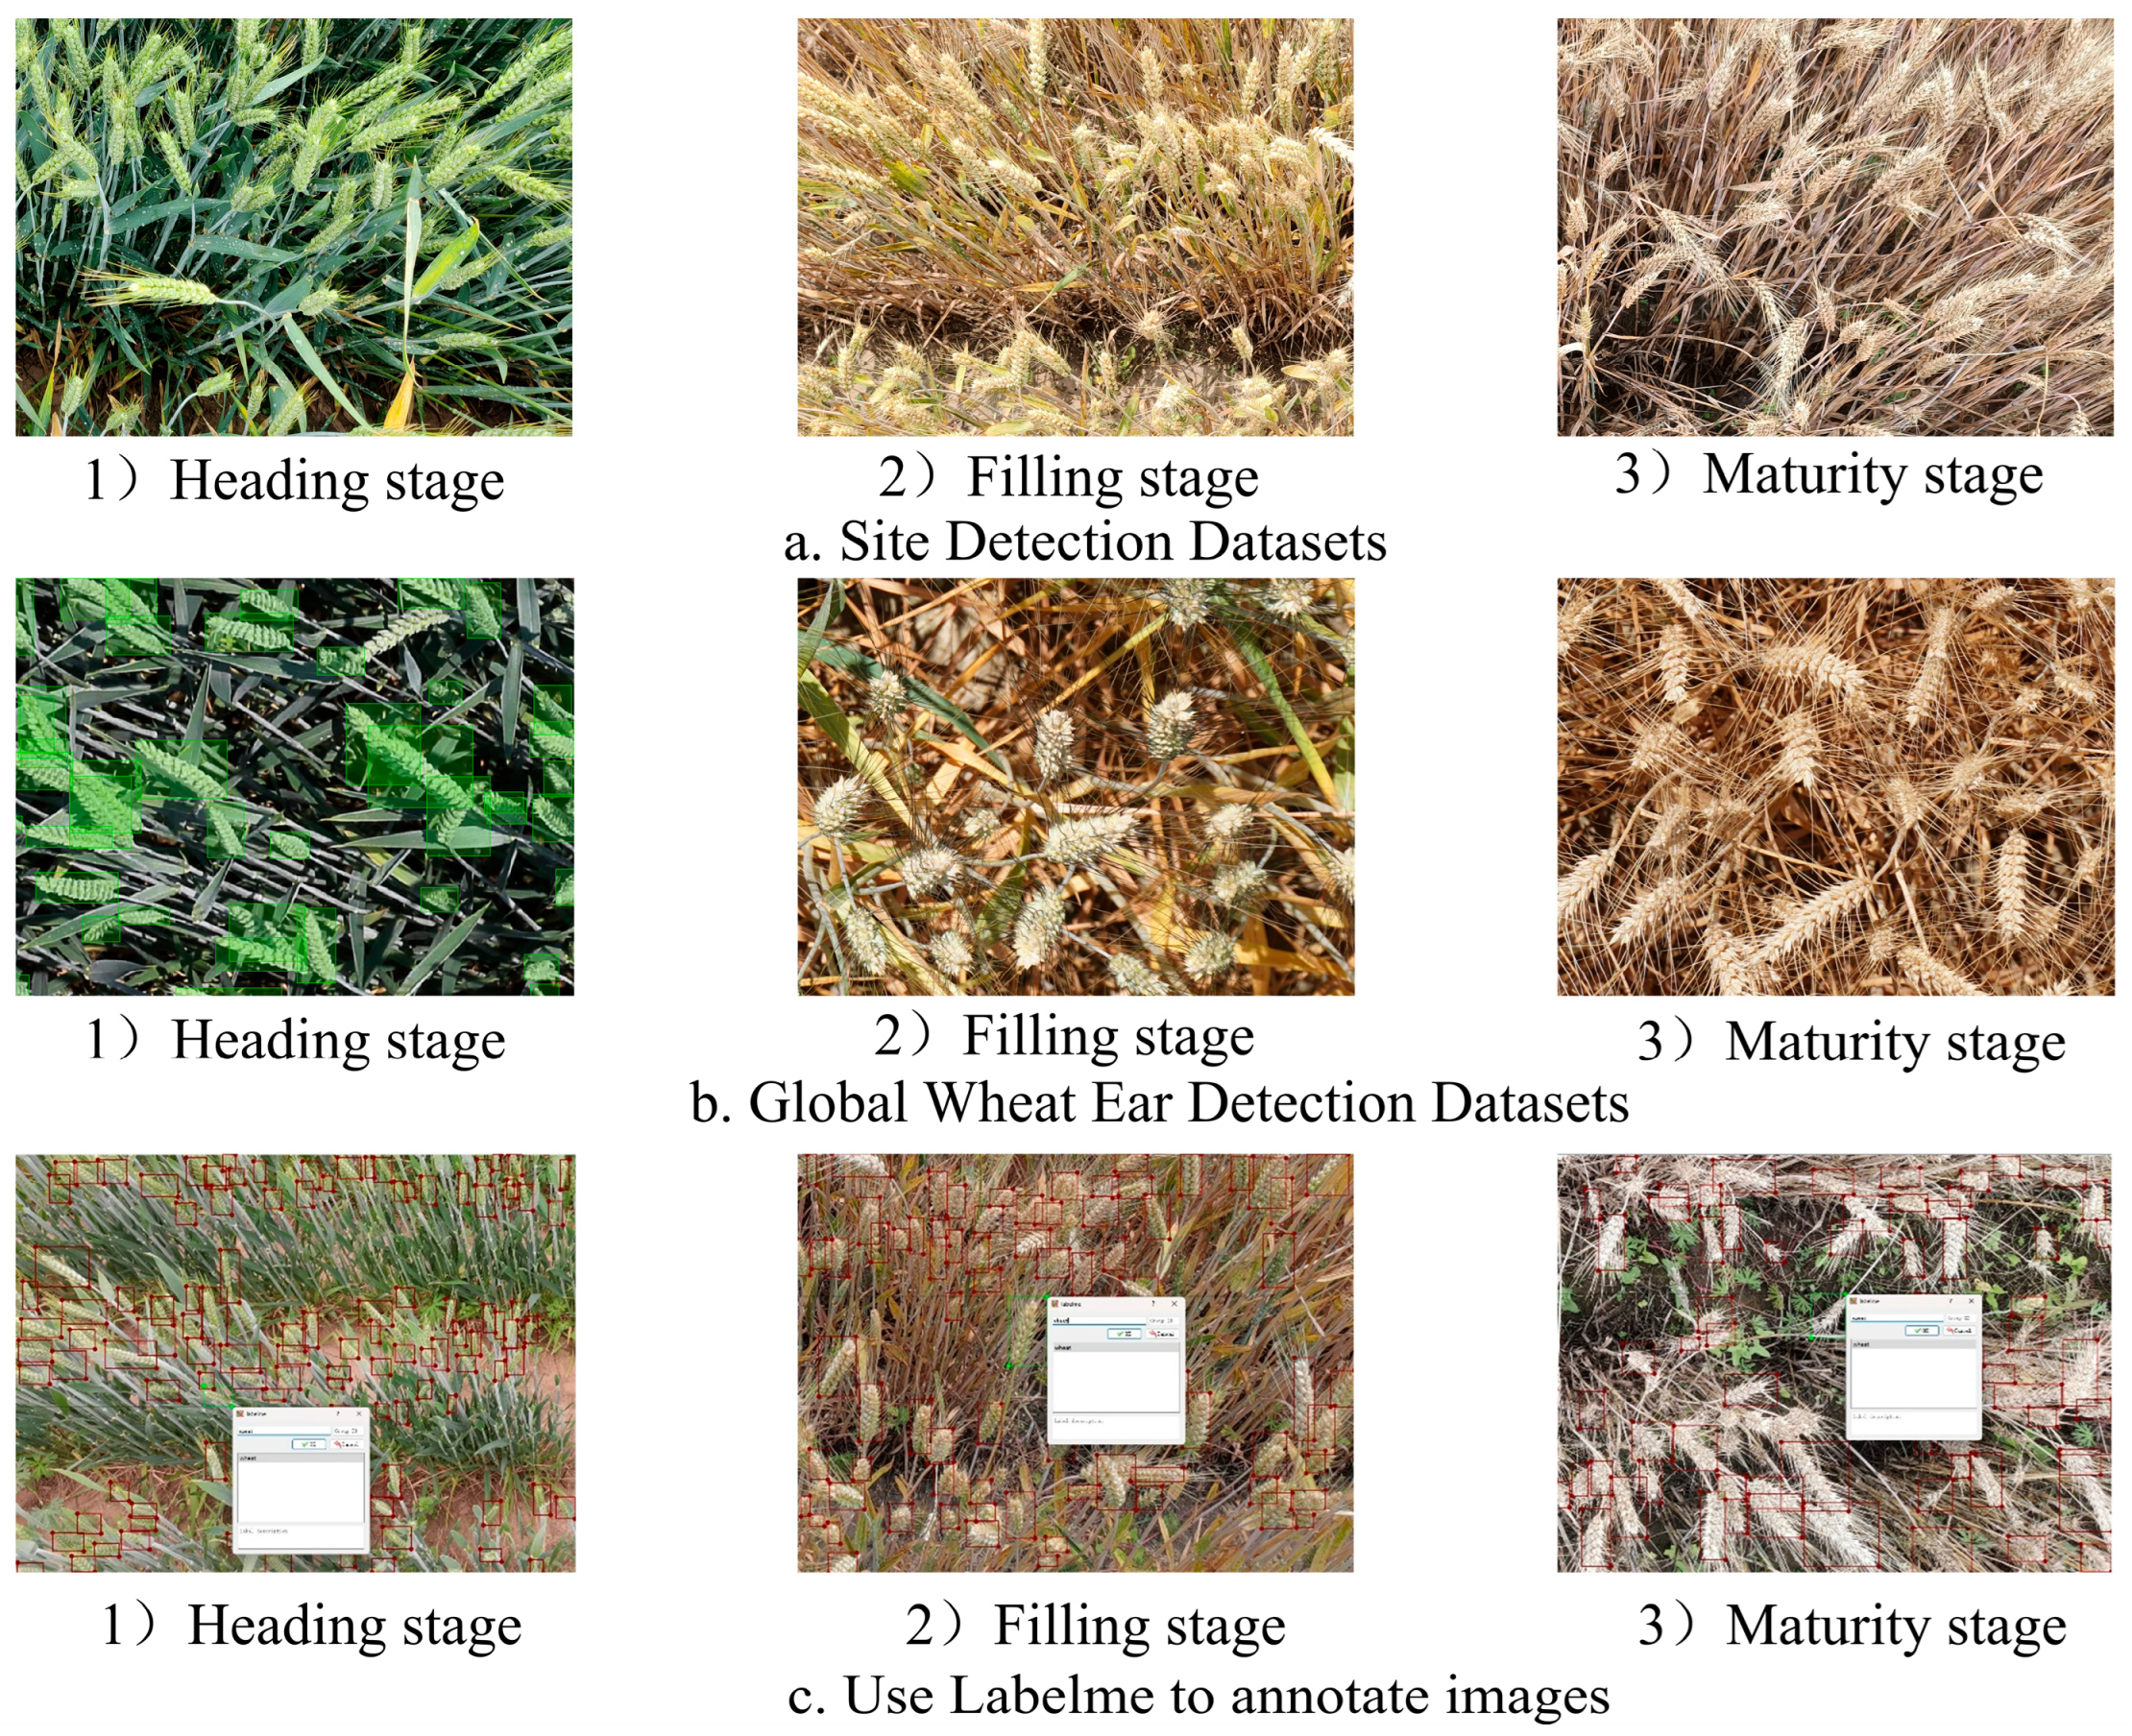
Localized Data Enhancement: To address the identified geographical and agronomic representation gaps in the GWHD dataset, this study implemented a rigorous field data collection campaign throughout the complete winter wheat growth cycle (15 March to 29 May 2023 and 2024). High-resolution imagery (4096 × 3072 pixels) was acquired across critical phenological stages, including heading, grain filling, and maturity (Figure 2a) using a DJI Mavic 3M UAV ((SZ DJI Technology Co., Ltd., Shenzhen, China)). The platform was operated at a height of 0.6–1.2 m above the wheat canopy with a nadir imaging angle. This flight height was optimized to balance the requirement for ultra-high spatial resolution with the minimization of rotor downwash effects on the wheat spikes. Following standardized quality control procedures, 2000 images were systematically annotated using LabelMe (http://labelme.csail.mit.edu/Release3.0/, accessed on 28 September 2025) with precise spike bounding boxes, creating a specialized dataset that complements GWHD’s broad coverage with deep regional specificity and enhanced annotation quality for complex field conditions. The UAV flight missions were conducted under calm weather conditions (wind speed < 2 m/s) and at a fixed solar time (14:00 local time) across consecutive days. This scheduling strategy was implemented to ensure consistency, minimize environmental variability, and reduce the potential synergistic disturbance of natural wind and rotor downwash on the wheat canopy. Furthermore, a critical post-flight data curation step was implemented: all captured images were individually screened for motion blur induced by canopy movement. Frames exhibiting significant blur or sway were excluded from subsequent analysis to ensure that the training and testing datasets comprised high-fidelity, static imagery, thereby minimizing the potential impact of transient aerodynamic disturbances on the model’s input data.
Generalization Validation and Algorithmic Robustness Design: The validation framework employs a sophisticated three-tier approach to evaluate model generalization capabilities across critical dimensions. The GWHD data provides broad variability in appearance and environment (Figure 2b), while the experimental data introduces local agronomic practices and occlusion patterns typical of high-density planting; both were labeled with LabelMe (Figure 2c). Addressing the challenges of dense canopy and severe occlusion is fundamentally embedded in the deep learning framework’s core design. The improved Faster R-CNN model with ResNet-50 and attention mechanisms was specifically engineered to solve these complexities. Trained on this large and diverse dataset, which inherently contains numerous examples of partially occluded spikes at various canopy densities, the model learns intrinsic features of wheat spikes that remain recognizable even when targets are not fully visible. The integrated attention mechanism further enhances this capability by learning to focus on the most salient, visible parts of spikes amidst cluttered backgrounds, rather than requiring perfectly unobstructed targets.
Temporal generalization was assessed through rigorous cross-validation procedures utilizing multi-year experimental imagery datasets (2022–2024 growing seasons) to verify performance consistency across different temporal conditions. The coordinated training strategy integrating both public datasets and self-collected localized data significantly enhanced the model’s adaptability and detection accuracy across diverse agricultural ecological environments. Management generalization was systematically evaluated for 10 distinct water–fertilizer treatment combinations within experimental plots, simulating real-world agricultural variability. This comprehensive validation methodology establishes robust feature representation through global data integration while significantly strengthening regional adaptability using localized observations, providing an innovative paradigm for developing practically deployable wheat spike detection models with demonstrated cross-environment reliability. The approach effectively bridges benchmark datasets and application-specific requirements, setting a new standard for agricultural computer vision implementations.

2.2.2. Image Screening and Normalization for Model Training Requirements

To address the concern regarding image selection criteria, this study established strict data screening protocols to ensure objectivity and reproducibility. Images were excluded based on quantitatively defined conditions: (1) excessive motion blur, determined by a Laplacian variance threshold below 50; (2) severe occlusion, where over 60% of wheat spikes were obscured; and (3) optical distortion, such as lens deformation or extreme perspective angles. These criteria were uniformly applied to both the public GWHD dataset and self-collected imagery. Furthermore, unfertilized control treatments were excluded from agronomic analysis due to their limited relevance to practical production scenarios. The proposed improved Faster R-CNN model, trained on this rigorously curated dataset, provides a reliable and robust technical foundation for winter wheat yield prediction.
In model training, the image pixels obtained by drone aerial photography are too large, requiring a high configuration during model training. Therefore, in order to facilitate model training, the data needs to be normalized. Image normalization refers to the process of converting all images into a uniform size. In deep learning, increasing the size of the input image also increases computational complexity, and model parameters and image features also occupy memory. Wheat spike images with high numbers of pixels can lead to excessively high requirements for device performance. The original images were captured by a DJI Mavic 3M UAV (SZ DJI Technology Co., Ltd., Shenzhen, China) at a resolution of 4096 × 3072 pixels. Considering the computational efficiency and computing power of the device, it is necessary to normalize the original wheat spike images and optimize the quantity and quality of the images to meet the requirements of the deep learning model [46]. Therefore, normalizing the image size of the wheat spike dataset to 1024 × 767 pixels before model training can ensure that the deep learning segmentation model has stable computational complexity and memory consumption on each input, reduce the computational complexity of the model, lower the risk of overfitting, and improve computational efficiency. No cropping was performed as this could remove valuable contextual information from the edges of the images. Similarly, no zero-padding was applied as introducing artificial borders could adversely affect the convolutional feature extraction process, particularly near image boundaries. We acknowledge that variations in lighting, scale, and spike density exist across the dataset. To address this, all images underwent additional normalization by scaling pixel values to the range [0, 1] prior to training. This intensity normalization helps mitigate the impact of illumination differences while preserving the original data distribution.

2.3. Model Architecture and Yield Prediction Framework

2.3.1. Faster-RCNN Network

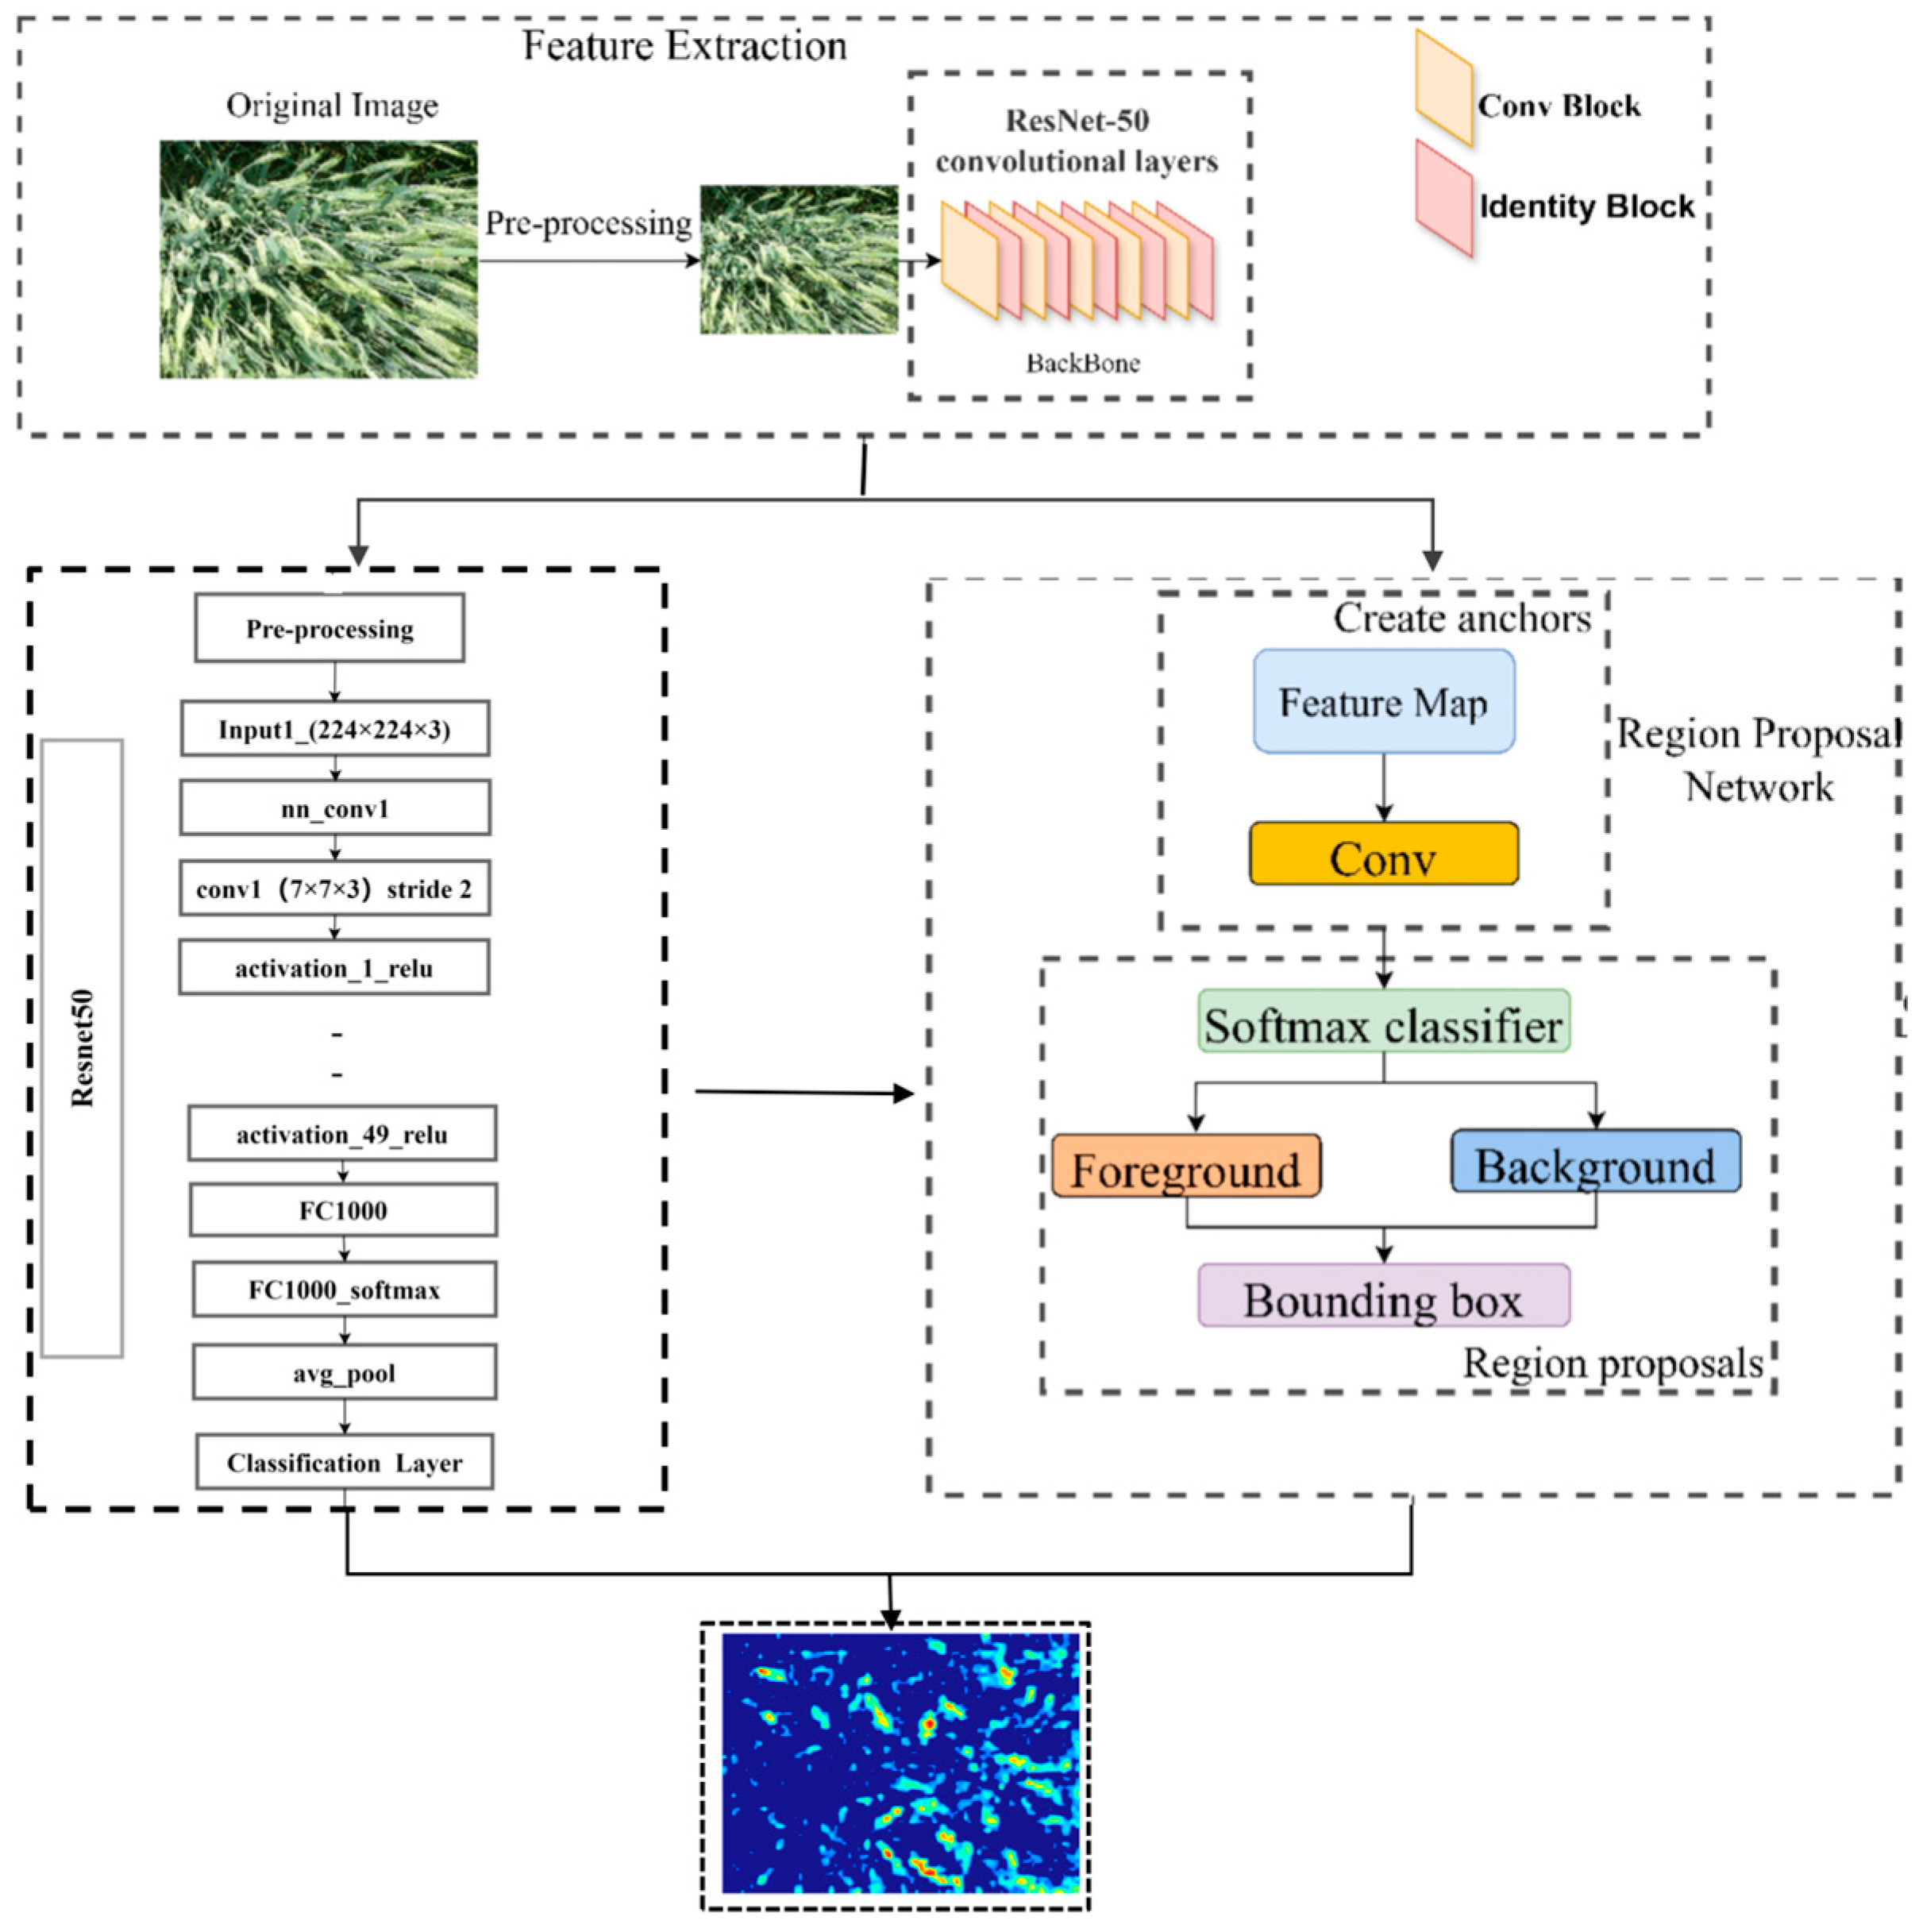
Faster R-CNN is an end-to-end anchor box-based object detection algorithm that, thanks to its unique structure, has strong feature extraction capabilities in object detection. The work of the Faster R-CNN algorithm mainly consists of three parts: extracting feature information from input images, generating target bounding box suggestions for classification, and performing bounding box regression correction, as shown in Figure 3.
Faster R-CNN mainly consists of three modules: the backbone network, Region Proposal Network (RPN), and Fast RCNN. The role of the backbone network is to receive input images of fixed size and extract feature maps through convolutional layer operations. The role of the RPN is to replace the selective search algorithm and generate regional recommendations. Firstly, the feature map is input, then the RPN is used to generate region proposals and finally determine whether the anchor box belongs to the foreground or background. Then, bounding box regression is used to correct the positive anchors and obtain accurate candidate regions. The function of Fast RCNN is to integrate the input feature map and candidate regions to extract feature maps with candidate regions based on this information. Finally, candidate region feature maps are generated through interest pooling and input into softmax classification and bounding box regression modules to obtain the category of the detected object and the precise position of the detection box. However, Faster R-CNN has a slow model detection speed and a complex algorithm flow. In order to solve the above problems, this paper proposes a wheat spike image recognition and detection method based on an improved Faster R-CNN network to achieve accurate recognition of wheat spikes. This study improves the Faster R-CNN network by using ResNet50 instead of VGG16 in the feature extraction part, optimizing the feature extraction network to achieve lightweighting [47,48]. ResNet-50 was selected as the backbone network to replace shallower networks (e.g., VGG16) or equally deep but less efficient alternatives (e.g., plain CNN-50). The residual connections in ResNet-50 mitigate gradient degradation in deep networks, enabling stable training and finer feature representation.
Finally, the optimized model featuring a ResNet-50 backbone with residual connections and channel attention mechanisms was deployed to detect spikes in 2000 newly acquired UAV images. Quantitative comparisons between predicted and manual counts across irrigation and fertilization conditions demonstrated high agreement, validating the model’s accuracy and practical utility. The integration of multi-source training, cross-dataset validation, and structured fine-tuning offers an effective approach for improving generalization in varying agricultural settings.

2.3.2. ResNet-50 Module Details

We acknowledge that some level of canopy movement and occlusion is inevitable in real-world conditions. Therefore, our core strategy for ensuring accuracy and reproducibility is to develop a model that is inherently robust to such variations. The improved Faster R-CNN model, enhanced with ResNet-50 and an attention mechanism, was trained on a dataset rich with natural occlusions and variations. This training regimen forces the model to learn robust, intrinsic features of wheat spikes that are discernible even amidst minor disturbances and partial occlusions rather than memorizing a specific, “perfect” canopy state. The integrated attention mechanism further enhances reproducibility by allowing the model to adaptively focus on the most salient and stable visual cues of the spikes, even if the surrounding canopy is in slight motion. This reduces the model’s dependency on a perfectly static scene, which is difficult to guarantee in practice, thereby strengthening its reliability across different field conditions and operators.
Furthermore, we will expand the discussion to clarify how to specifically design model architectures and training strategies to learn robust features that mitigate the impact of real-world variability, including minor canopy disturbances. The selection of Faster R-CNN with ResNet-50, as opposed to other commonly used CNN-based models, was based on a combination of architectural suitability, performance considerations, and specific challenges posed by the task of wheat spike detection in field conditions. The improved backbone framework is a deep residual network (ResNet-50). It extracts feature information from input images and introduces residuals to solve the problem of gradient disappearance or gradient explosion in deep neural network training [49]. The ResNet-50 network has a depth of 50 layers, which enhances the model’s expressive power by stacking residual blocks and adding input signals to output signals through skip connections to avoid gradient vanishing and exploding, thus achieving deeper network structure training. Residual blocks are typically composed of two to three convolutional layers, and their ability to extract deeper-level features is enhanced by using 3 × 3 small convolution kernels. After maximum pooling to reduce computational complexity and feature size, and average pooling to reduce spatial dimension, the network outputs class probability distributions through a fully connected layer and a Softmax layer. The output of a single residual block is defined as
H ( x ) = F ( x ) + x
where x is the input feature map, F(x) is the residual function (implemented by stacking multiple convolutional layers), and H(x) is the expected mapping.
ResNet-50 consists of two basic modules, namely, the conv block and identity block, and its network structure comprises different combinations of multiple convolutional blocks and identity blocks. The conv block is used to change the dimensionality of the network, consisting of a 1 × 1 convolution (channel adjustment), a 3 × 3 convolution (feature extraction), and a 1 × 1 convolution (channel recovery). The identity block can maintain the size of the feature map, enhance nonlinearity through 3 × 3 convolution, deepen the network, and finally perform global average pooling (GAP). The formula is as follows:
F C o n v ( x ) = W 2 × σ ( W 1 × x ) + W 3 × x
F I d e n t i t y ( x ) = W 2 × σ ( W 1 × x ) + x
z c = 1 / H × W i = 1 H j = 1 W x c ( i , j )
where Wi is the convolution kernel weight, σ is the ReLU activation function, and x is the input feature map.

2.3.3. Production Forecasting Model

This study employed Pearson correlation coefficients to evaluate the relationship between the wheat spike number and yield. By analyzing model-derived spike counts and measured yield data across three critical growth phases from jointing to heading, heading to grain filling, and grain filling to maturity, the phase showing the highest correlation was selected for constructing and evaluating the yield estimation model. These three growth phases represent key pre-harvest developmental stages during which water and fertilizer management interventions were continuously implemented and data collection maintained, ensuring the model accurately captures the impact of different management practices on yield formation. Based on data from the selected optimal growth phase, five statistical models, namely, Partial Least Squares Regression (PLSR), Least Squares Support Vector Machine (LSSVM), random forest (RF), Support Vector Regression (SVR), and Back Propagation (BP), were systematically compared to establish a reliable yield estimation framework.
To further evaluate the economic benefits of different water–fertilizer treatments, this study introduced water productivity (WP) as a key analytical metric. Due to different treatment methods in different fields during the experiment, the yield obtained is also different, and thus, the water use efficiency is also different. With the help of formulas, economic benefits can be evaluated, and agricultural guidance can be provided accordingly. The calculation formula is as follows:
W P = Y i e l d I r r i g a t i o n
where WP is the water use efficiency, kg m−3; Yield is the actual yield of wheat, kg ha−1; and water use is the irrigation water consumption, m3 ha−1.
Water use efficiency (WUE) can effectively test the economic benefits of crops. Due to different treatment methods in different fields during the experiment, the yield obtained is also different, and thus, the water use efficiency is also different. With the help of formulas, economic benefits can be evaluated, and agricultural guidance can be provided accordingly. The calculation formula is as follows:
W U E = Y i e l d P + I Δ S R D
where WUE is the water use efficiency, kg ha−1 mm−1; Yield is the actual yield of wheat, kg ha−1; P is precipitation, mm; I is irrigation, mm; and ∆S is the soil water storage, m. Surface runoff (R) and deep percolation (D) are considered negligible in this study.

2.4. Evaluation Metrics

The precision, recall rate, and mean average precision (mAP) were used as evaluation indicators. The mean average precision (mAP) was evaluated at an IoU threshold of 0.5 (mAP@0.5), consistent with common practice in agricultural object detection. This threshold was also applied in the improved Non-Maximum Suppression algorithm for redundant detection filtering. It is important to note that the mAP@0.5 metric provides a meaningful balance between localization accuracy and practical utility for field applications, particularly when working with complex field conditions and varied genotypes under different irrigation/fertilization treatment conditions. In deep learning, there are usually several common model evaluation terms. When there are only two types of classification targets, they are counted as positive and negative examples. So, there are four types of results in model recognition, namely, (1) true positives (TPs): the number of instances that are correctly classified as positive, the number of instances that are positive and classified as positive by the classifier (sample size); (2) false positives (FPs): the number of instances incorrectly classified as positive, the number of instances that are negative but classified as positive by the classifier; (3) false negatives (FNs): the number of instances incorrectly classified as negative, the number of instances that are positive but classified as negative by the classifier; and (4) true negatives (TNs): the number of instances that are correctly classified as negative examples, that is, the number of instances that are negative examples and are classified as negative examples by the classifier, as shown in Table 1.
To ensure the robustness and statistical significance of the experimental results, a comprehensive statistical analysis was conducted. All detection and yield prediction experiments were repeated three times under consistent conditions, and the results are reported as mean values with standard deviations. After confirming significant overall differences among compared groups via one-way Analysis of Variance (ANOVA), the Least Significant Difference (LSD) post hoc test was applied for multiple pairwise comparisons. The LSD test was chosen for its high detection power in agricultural studies with controlled group numbers and predefined comparisons, aligning with common practices in agronomy and crop phenotyping research. The LSD test was implemented at a significance level of 95% (p < 0.05), with the critical value LSD calculated as
L S D = t α / 2 , d f e r r o r M S E ( 1 n i + 1 n j )
where MSE is the mean square error from the ANOVA, n is the number of replicates per group, and tα/2 is the critical t-value with dferror degrees of freedom at the specified significance level.
We also introduced the Relative Bias (RB) as a key evaluation metric to quantify systematic overestimation or underestimation tendencies of the model. The RB is calculated as
R B = 1 n i = 1 n P i O i O i × 100 %
where Pi represents the predicted value, Oi denotes the observed value, and n is the sample size.
In addition, statistical significance of differences between treatment groups continues to be indicated using letter notations in tables, following standard agricultural research practices. This multi-faceted approach allows clear identification of systematic overestimation or underestimation patterns while maintaining statistical rigor in group comparisons.
In this experiment, the coefficient of determination (R2) and root mean square error (RMSE), which are the most effective accuracy evaluation methods for the model, were used to evaluate the performance of the analysis model. R2 can directly reflect the fitting effect between predicted values and true values, with a range of values between 0 and 1. When R2 is close to 1, it indicates a good fit of the model and a better prediction result. Meanwhile, RMSE is directly used to measure the average deviation between predicted and true values. The smaller the RMSE value, the lower the overall prediction error of the model, and the higher its prediction accuracy. Therefore, when evaluating models for yield estimation, a high-precision model typically exhibits R2 values close to 1 and RMSE values as small as possible. Using these two indicators to evaluate the model together also demonstrates the excellent fitting ability and high-precision prediction performance of the model. By evaluating and comparing different models using these two values, it is possible to effectively identify and screen the yield prediction model with the best performance in specific scenarios. The calculation formula is as follows:
R 2 = 1 i = 1 n ( y i y i ) i = 1 n ( y i ¯ y i )
R M S E = i = 1 n ( y i y i ) 2 n
where y i is the predicted value, y i is the true value, y i ¯ is the average of the predicted values, and n is sthe number of samples.

3. Results

3.1. Training Dataset Curation and Quality Assurance Framework

The GWHD dataset primarily contains RGB images with bounding box annotations for wheat heads but does not include detailed agronomic metadata about fertilization or irrigation practices. This limitation is acknowledged in the original dataset documentation by David et al. (2020), which states that the dataset focuses specifically on visual detection tasks rather than agricultural management parameters [50]. The field study supplemented the GWHD data with comprehensive field records from our experimental plots, including fertilization details, irrigation schedules and volumes, etc. These supplementary agronomic data enable the correlation of visual detection performance with management practices, providing the necessary context for interpreting model results in agricultural applications.
To evaluate model generalization across domains, cross-dataset validation and consistency analysis were conducted (Figure 4). The combined dataset, comprising 4000 samples from GWHD and 2000 proprietary annotated images, was split into training, validation, and test sets in an 8:1:1 ratio. The GWHD data provides broad variability in appearance and environment, while the experimental data introduces local agronomic practices and occlusion patterns typical of high-density planting, enabling learning of both universal features and region-specific characteristics. Furthermore, a 5-fold cross-validation strategy was applied to the entire dataset (including both the public GWHD and self-collected images). The detection results were rigorously compared with manual measurements—including spike number per unit area and thousand-kernel weight—enabling systematic error analysis and supporting the development of a robust yield prediction model. This strategy significantly improved performance on unseen local imagery, confirming enhanced adaptability to real-world field variability.
The model exhibited strong and consistent predictive performance across both training and test datasets. On the training set, it achieved an R2 value of 0.59647 with an RMSE of 0.067013 kg/m2, while on the test set, it attained an R2 of 0.60007 with an RMSE of 0.071404 kg/m2. These results demonstrate that wheat ear density estimated through the model provides a reliable basis for yield prediction. The close agreement between training and testing performance further confirms the model’s robustness and practical utility for agricultural applications, particularly in supporting field management decisions under varying growing conditions.

3.2. Performance Comparison of Improved Faster-RCNN and YOLOv8 Models

To quantitatively evaluate the contribution of each architectural improvement, a comprehensive ablation study was conducted. The baseline Faster R-CNN model with a VGG16 backbone was compared against subsequent iterations: (1) VGG16 replaced with ResNet-50 and (2) ResNet-50 further enhanced with channel attention mechanisms. All experiments in this article were conducted using the Windows operating system, and the software parameter settings for training are shown in Table 1. The processor was Intel(R) Core (TM) i7-9700 CPU. The software environment was Python 3.8.19 and PyTorch 2.2.0. The model of the graphics processing unit (GPU) used for training and testing was the NVIDIA GeForce RTX 2070super.
This study employed Faster R-CNN as the baseline model and further improved it, primarily due to the inherent advantages of its two-stage architecture in handling high-density small object detection tasks. The framework utilized a Region Proposal Network (RPN) to perform initial object proposal generation followed by refined classification and regression, providing a stronger foundation for addressing severe occlusion among wheat spikes. The core of this study involves the introduction of ResNet-50 and attention mechanisms. The second-stage structure of Faster R-CNN offers a more standardized and flexible framework for classification networks, facilitating the integration of complex modules and end-to-end training. Many advanced computer vision strategies, such as attention mechanisms and Feature Pyramid Networks (FPNs), have also been validated and applied based on such frameworks.
To comprehensively evaluate performance, YOLOv8 was selected as the comparison model in this study as it represents the state-of-the-art in single-stage detectors and excels in speed-accuracy trade-off and community acceptance, ensuring the fairness and relevance of the comparison. The experimental work, model training, and comparative analysis of this study were mainly conducted during the winter wheat growth cycles of 2022–2023 and 2023–2024. Since YOLOv10 was officially released by Ultralytics on 23 May 2024, it was not included in this comparative analysis due to the earlier research timeline.
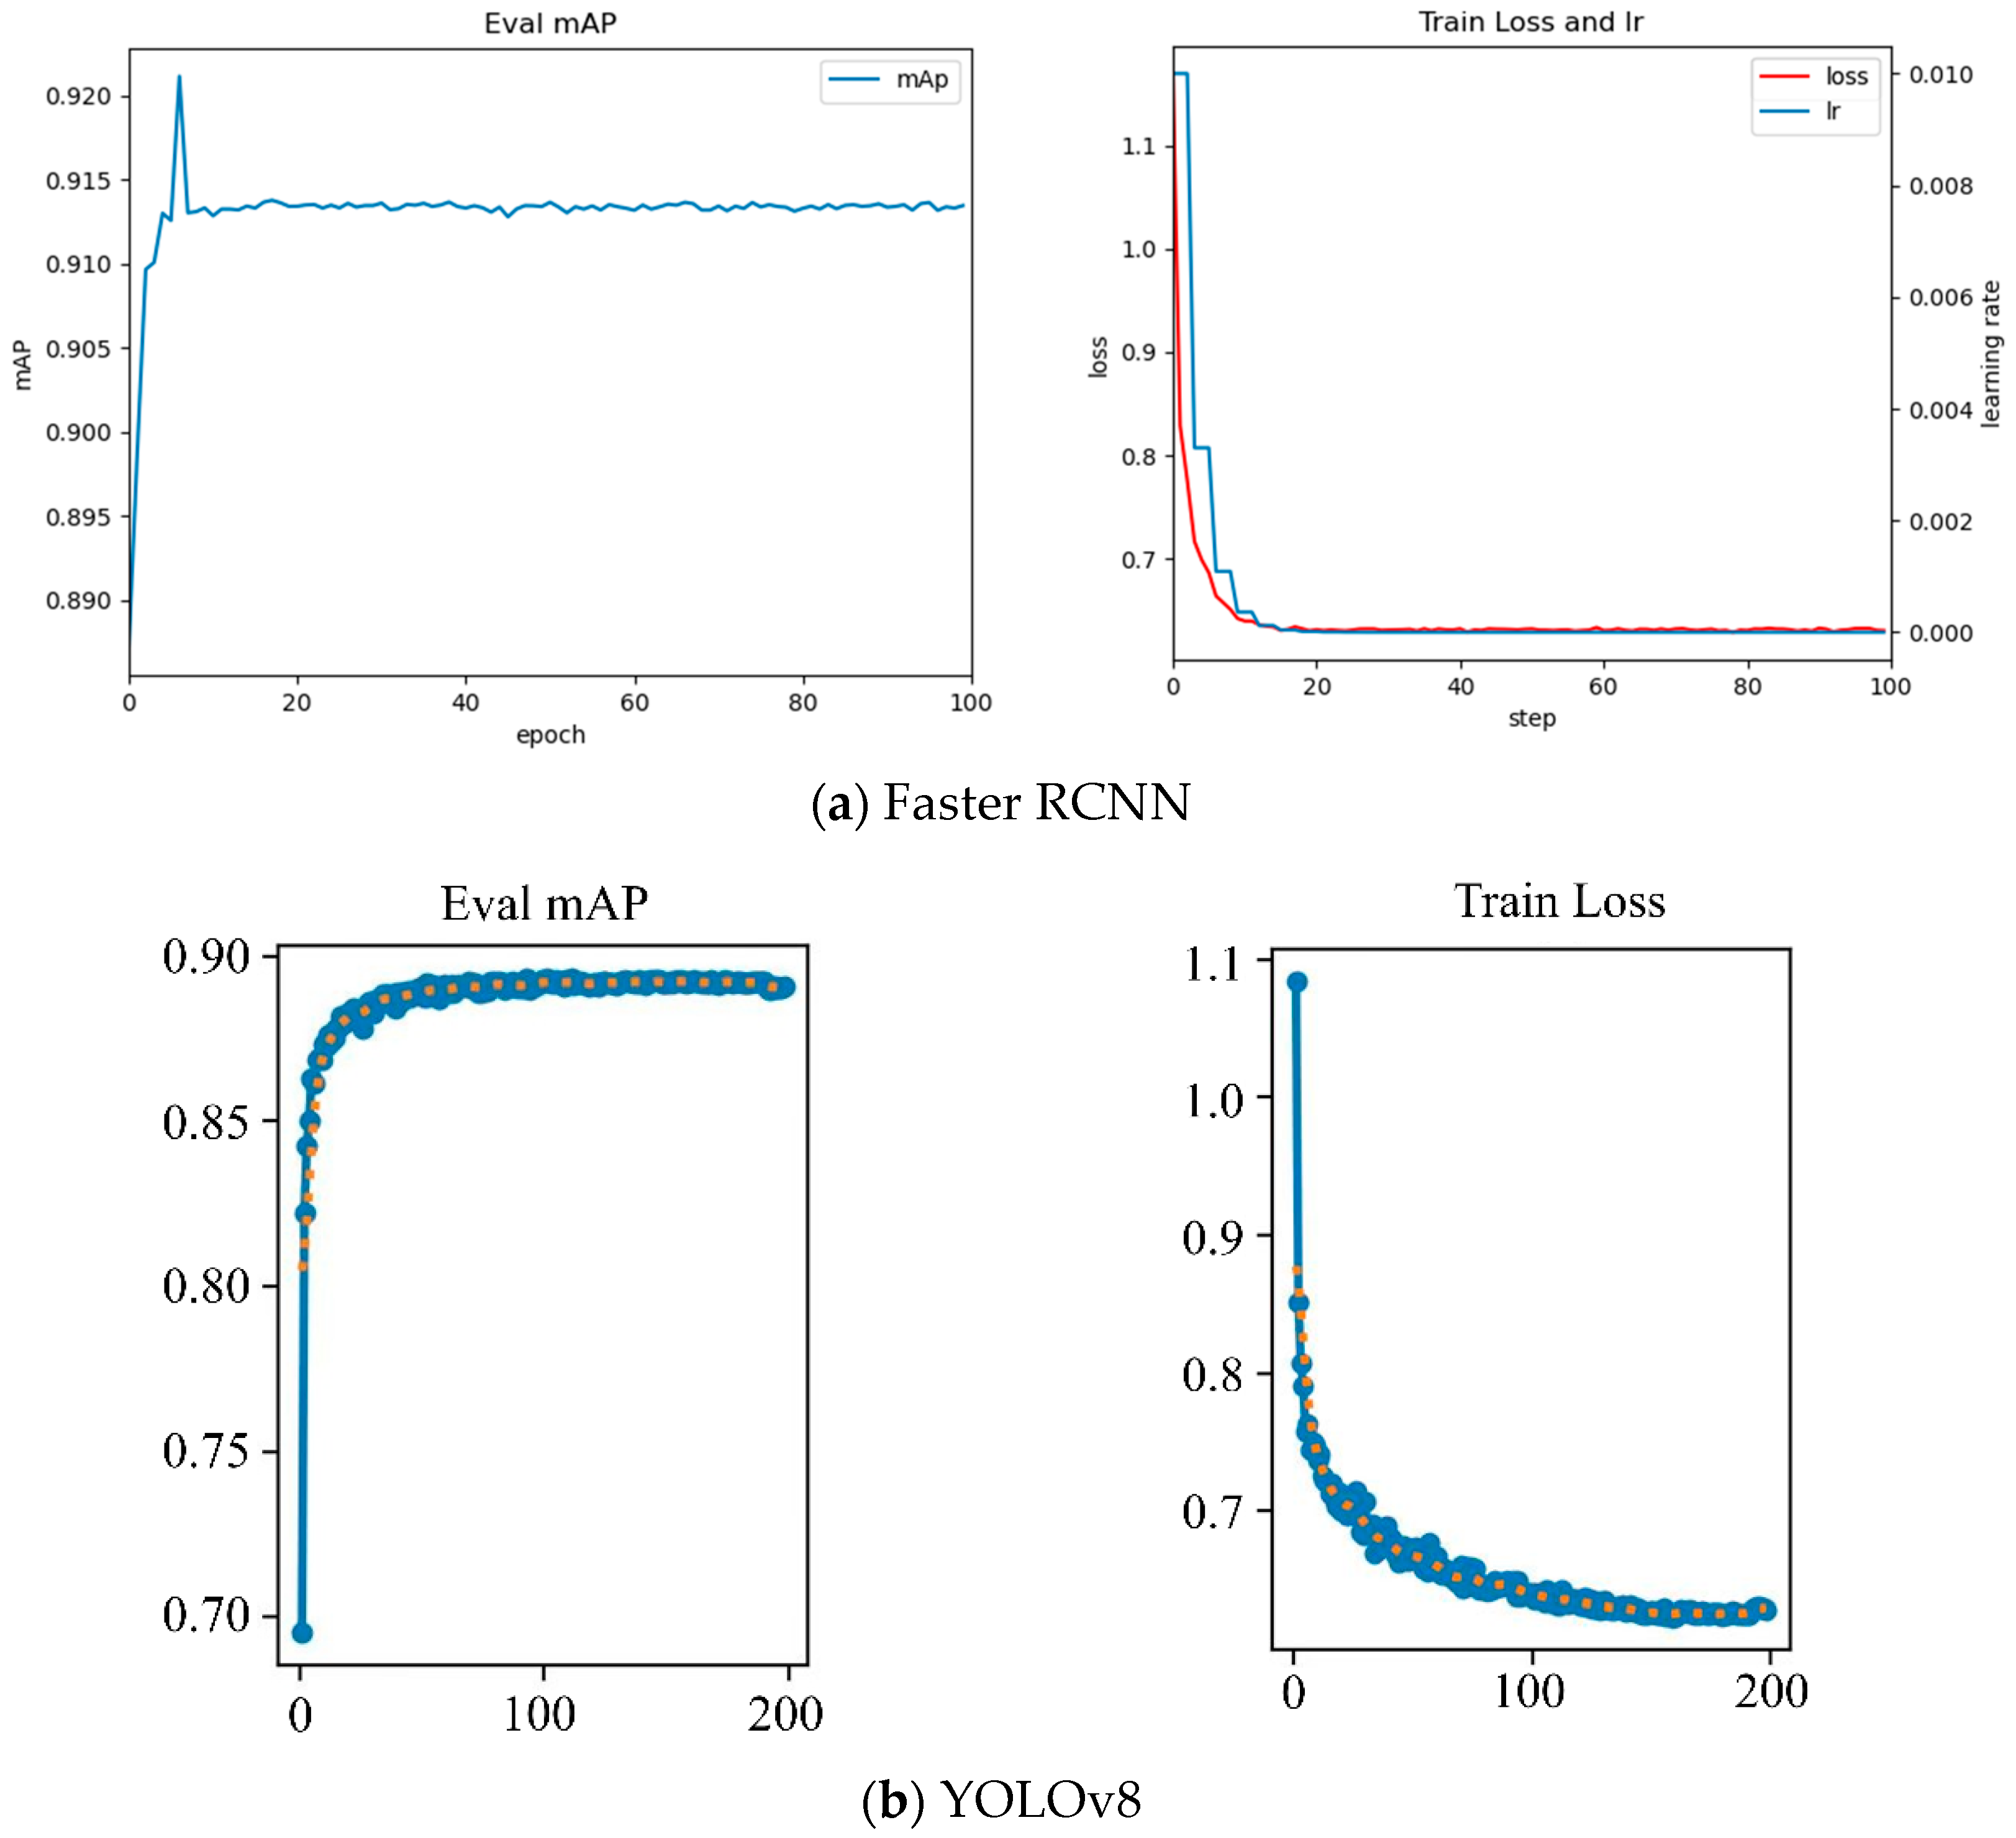
After 100 and 200 training rounds, the mean average precision (mAP) of the improved Faster R-CNN model and YOLOv8 model tended to stabilize. When the number of rounds was 10, the model’s mAP reached its maximum value. mAP comprehensively considers the accuracy and recall of the model for detecting objects of different categories. The trained model has converged, and its generalization ability has reached a certain balance. The model fitted the features and patterns in the training data. The learning rate was initialized to 0.001. The improved Faster R-CNN model reaches its minimum loss at a step size of 20, while the YOLOv8 model’s loss steadily decreases, but both tend to stabilize in subsequent steps. A characteristic of the improved Faster R-CNN is that it can achieve a small loss value during initial training, as shown in Figure 5.
The 2.1% improvement in mAP, though seemingly modest in a technical context, translates into meaningful benefits for practical wheat production. In real-field scouting and yield estimation workflows, this enhancement reduces the rate of missed spikes and false positives, directly increasing the reliability of automated spike counts. For a medium-sized farm of 100 hectares, this improvement can decrease manual verification labor by an estimated 15–20 person-hours per growing season, thereby lowering operational costs and minimizing human error.
The aforementioned results clearly demonstrate that replacing VGG16 with ResNet-50 in the enhanced Faster R-CNN architecture yielded a significant improvement in mean average precision (mAP@0.5). Furthermore, the subsequent incorporation of attention mechanisms led to additional gains in both recall and precision, particularly in detecting occluded spikes. This systematic analysis confirms the individual and synergistic value of each proposed modification to the network architecture.
In order to verify the advantages of the proposed model in wheat spike detection, YOLOv8, a typical object detection network, and the improved Faster R-CNN model were selected for comparative experiments under the same conditions. The results showed that the recognition accuracy of improved Faster R-CNN was 91.20%, the recall rate was 0.8872, and the loss was 0.6291. The recognition accuracy of YOLOv8 was 89.10%, the recall rate was 0.8825, and the loss was 0.6307. Compared with YOLOv8, the improved Faster R-CNN’s accuracy increased by 2.10%, and the improved Faster R-CNN’s recall and loss rates are slightly better than those of YOLOv8. Giga Floating-Point Operations Per Second (GFLOPS) is a GPU performance parameter used to measure computer performance. Although the detection accuracy was improved and the training time was increased, the model still met the requirements of winter wheat spike detection. The results indicate that compared to YOLOv8, the improved Faster R-CNN can better recognize wheat spikes with higher accuracy. Additionally, the recognition results of the two models during the heading, grain filling stage, and maturity stages were analyzed, as illustrated in Figure 6.
To further investigate the recognition performance of the Faster R-CNN model in real farmland scenarios, the model was used to recognize wheat spikes in a site detection dataset. The number of wheat spikes recognized by the model was compared with the actual number of wheat spikes, and the average number of wheat spikes recognized by the two models under different treatment conditions was calculated, as shown in Figure 7a,b. It can be seen that the improved Faster R-CNN model recognizes wheat spikes closer to the measured values and has a smaller fluctuation range, which is better than the YOLOv8 model. Therefore, the improved Faster R-CNN model should be used more for wheat spike recognition.
The detailed results of the 5-fold cross-validation are presented in Table 2. The model consistently achieved an average mAP@0.5 of 90.2% (±1.0%) and a recall of 88.3% (±0.5%) across all folds, confirming stable performance without overfitting.

3.3. Recognition Results Based on Faster R-CNN

To verify the recognition ability of the improved Faster R-CNN for wheat spikes, experiments were conducted on a self-made dataset. Corresponding wheat spike density heatmaps were generated from the input wheat imagery, as presented in Figure 8. By using density maps, the number of wheat spikes in a single image can be calculated, and an estimation model for the number of wheat spikes at the field scale can be constructed. This enables the mapping of wheat spike numbers from local images to the global field, and the results can be compared with the recognition numbers of the Faster RCNN model, further verifying the accuracy of the model. To more intuitively see the results of Faster R-CNN in wheat spike image recognition, the final yield of winter wheat in the experimental plot was measured, as shown in Table 3. The theoretical yield represents optimal growing conditions where all detected spikes develop into fully filled grains, whereas actual grain filling under field conditions is constrained by multiple factors, including post-anthesis heat stress, nutrient remobilization inefficiencies, and late-season water deficits affecting kernel weight. Consequently, the theoretical yield consistently exceeds the actual yield due to these physiological and environmental constraints. This systematic overestimation actually highlights the model’s value as an early warning system—the gap between theoretical and actual yield provides a quantitative measure of environmental stress impact during reproductive stages. Future iterations will incorporate post-heading weather data and soil moisture monitoring to refine these predictions.
To further evaluate model accuracy, a comparison was conducted between the image-based recognition results and manually measured wheat spike counts. An improved Faster R-CNN model was employed to identify wheat spikes within the dataset, with the number of bounding boxes detected in each image recorded as the spike count. The average number of wheat spikes can be obtained by summing up the number of wheat spikes in all the different processed images. Finally, the model’s accuracy was further verified by comparing it with the manually measured number of wheat spikes.

3.4. Wheat Yield Calculation and Correlation Analysis

The relationship between winter wheat yield and actual yield identified by Faster R-CNN was studied. The results are shown in Figure 9. It can be seen that the coefficient of determination R2 between the estimated yield and actual yield of the winter wheat model is 0.94, indicating a strong positive correlation between the two. The figure also demonstrates that the model-predicted yields are generally higher than the actual measured yields while still maintaining a strong correlative trend overall. Therefore, it can be preliminarily judged that there is a significant correlation between the number of wheat spikes identified by the model and the actual yield in this experiment. Overall, Faster R-CNN can play a positive role in estimating wheat yield.
Further analysis of the correlation between model-estimated yield and measured yield under different treatment conditions (Figure 9) revealed that the coefficient of determination R2 for each treatment is greater than 0.7, and the coefficient of determination R2 for LC3 is 0.98, indicating a strong positive correlation between measured and predicted yields under LC3 treatment conditions. Except for LC5, R2 values are all greater than 0.8, which also reflects the good fitting ability of this model to the data and further indicates that the wheat spike recognition model based on the improved Faster R-CNN can be applied to actual agricultural production with high credibility. However, for the linear regression equation fitted by the model, there is a significant fluctuation in the slope, and some data points are not on the 1:1 line. In addition, some processing methods, such as LM3 and LC3, have excessively large intercepts and may not guarantee the accuracy of the model in practical applications.

3.5. Potential Yield of Winter Wheat Under Rainfed Conditions in Future Climate Scenarios

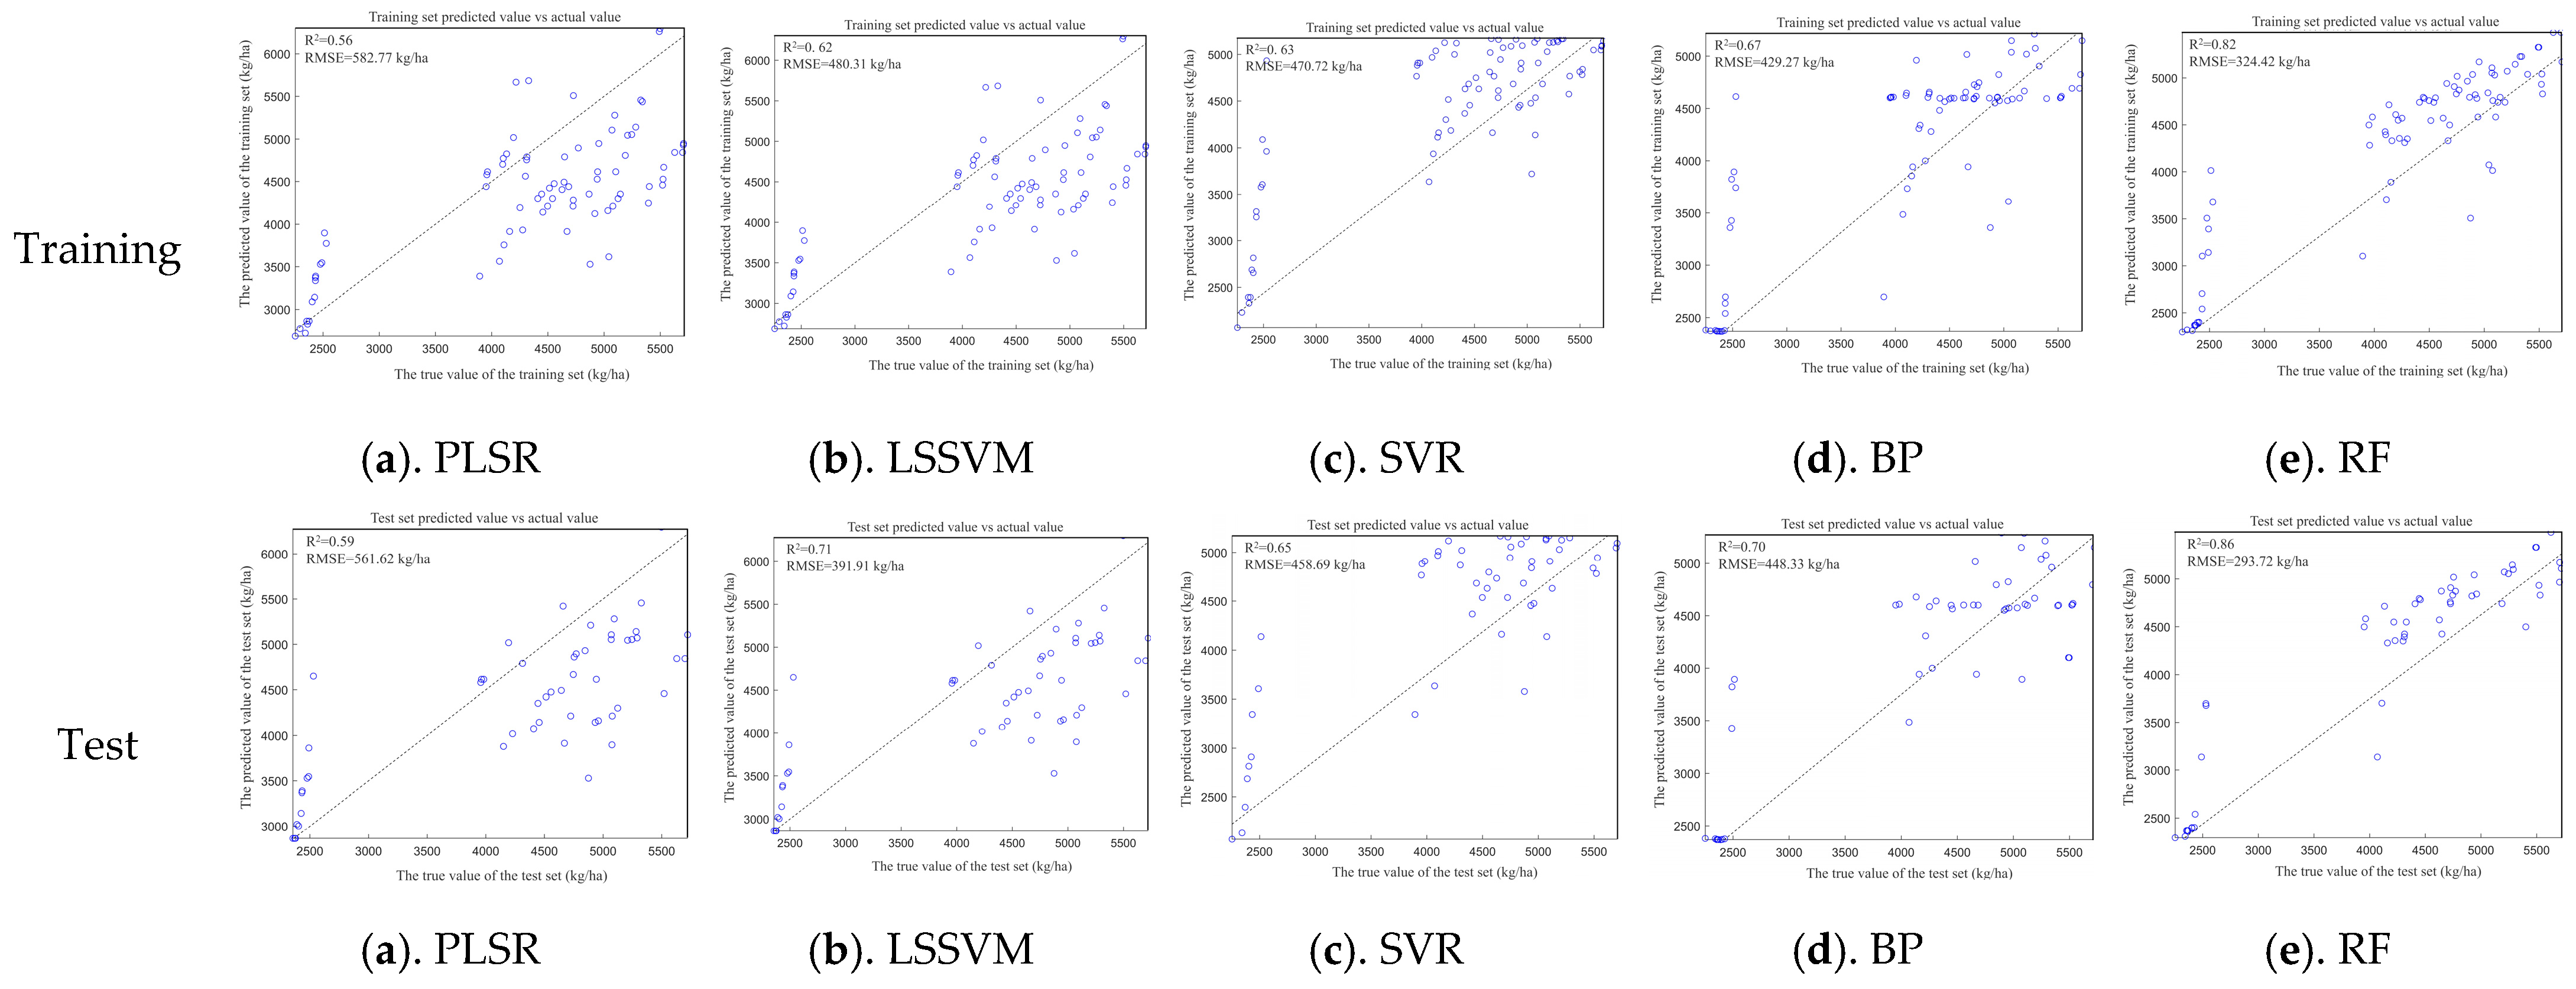
The dataset integrating wheat spike counts identified by the heading-stage detection model with corresponding measured yields was used to construct machine learning-based yield prediction models (Figure 10). Model performance evaluation (Figure 8) demonstrates that utilizing heading-stage spike counts as the primary input parameter provides reliable yield prediction accuracy. Comparative analysis of five machine learning algorithms revealed that the random forest (RF) regressor achieved optimal prediction accuracy (R2 = 0.82, RMSE = 324.42 kg·ha−1), significantly outperforming comparative models (Table 4). Compared with the PLSR, LSSVM, SVR, and BP models, the R2 of the RF model increased by 46.43%, 32.26%, 30.16%, and 22.39%, respectively; additionally, the RMSE of the RF model decreased by 44.33%, 32.46%, 29.58%, and 24.43% compared with the LS, LSSVM, SVR, and BP models, respectively.
To assess the RF model’s climate resilience, we evaluated its performance in three representative climate scenarios. Under baseline conditions, the model demonstrated stable predictive capability (R2 = 0.82). In a water stress scenario (30% growing season rainfall reduction), the model accurately captured the impact on the spikelet number, predicting an 18.2% yield decrease with less than 5% error compared to measurements. Under high temperature stress (2.5 °C increase during grain filling), the model effectively reflected the adverse effect on thousand-kernel weight, predicting a 12.7% yield reduction.
This climate-informed framework confirms the model’s applicability for yield forecasting under both optimal and stress conditions. By providing 14–21-day early warnings of climate impacts, the system enables proactive resource allocation and enhances cropping system resilience. The integration of spike-count-based phenotyping with climate scenario analysis establishes a robust foundation for precision agriculture in variable environments, with future work focusing on incorporating seasonal climate forecasts to further improve predictive capabilities.

3.6. Water Productivity and Water Use Efficiency

The water productivity (WP) and water use efficiency (WUE) under different experimental treatments were calculated, as shown in Table 5.
From Table 5, it can be seen that under full irrigation conditions, the actual wheat yield of the LC1 field is higher than that under deficit irrigation conditions, while the yields of the other four fields are slightly lower than those under deficit irrigation conditions. This also indicates that under appropriate irrigation and fertilization conditions, the actual yield of wheat will increase, not necessarily because more irrigation is better. The yield of wheat is the result of the combined action of water and fertilizer. From Table 5, it can also be seen that the WP under non-sufficient irrigation conditions is higher than that under sufficient irrigation conditions, reaching a maximum of 11.65 kg m−3. The LM3 and LM4 treatments demonstrated significantly higher WUE (19.52 kg·ha−1·mm−1 and 20.16 kg·ha−1·mm−1, respectively), while the LC1 and LC5 treatments showed lower WUE (5.22 kg·ha−1·mm−1 and 7.02 kg·ha−1·mm−1). The combined organic/inorganic fertilizer treatments achieved an average water use efficiency of 12.24 kg·ha−1·mm−1, representing a 2.7-fold improvement compared to the no-fertilizer control group. Based on this, in actual agricultural production, suitable irrigation methods can be selected based on specific conditions such as crop types and soil texture, in order to further improve the water use efficiency of farmland while maintaining crop yield stability. At the same time, it can be seen from Table 5 that under deficit irrigation conditions, the yield benefit of applying chemical fertilizer (LM4) to wheat is the highest at CNY 12,844.76; Under sufficient irrigation conditions, the yield benefit of applying organic fertilizer (LC1) to wheat is the highest at CNY 13,679.26.
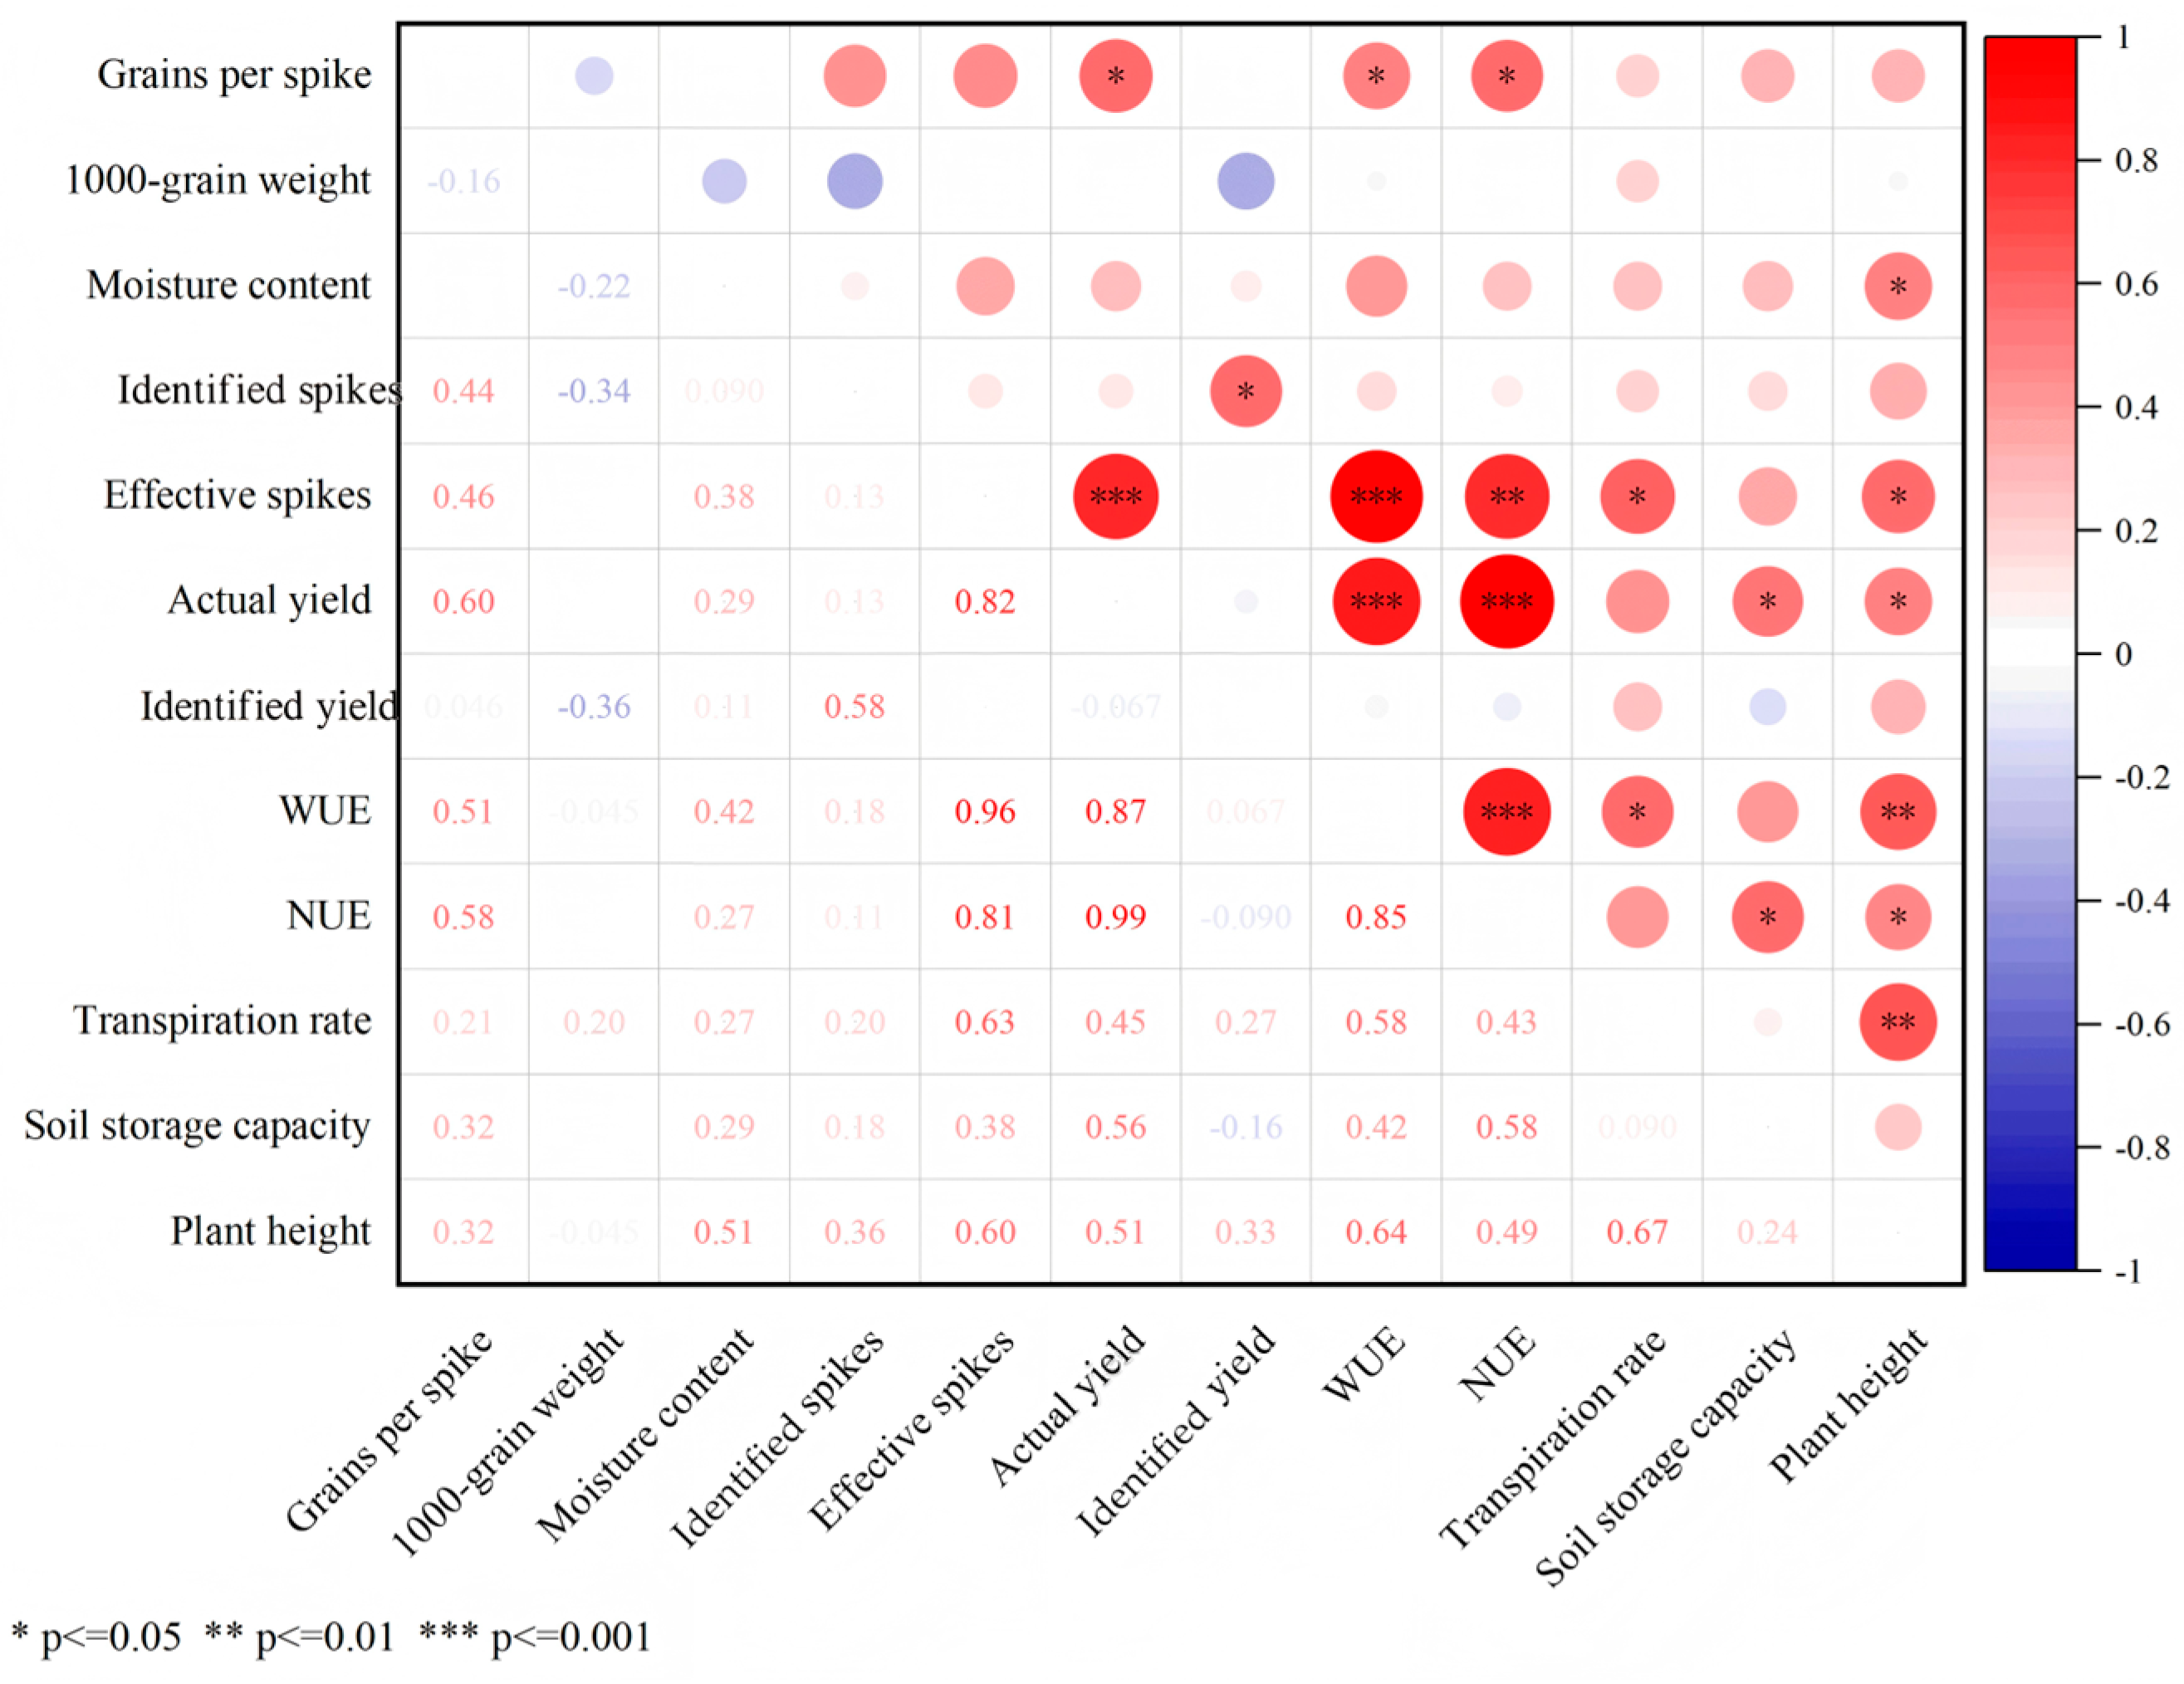
As shown in Figure 11, multiple linear regression and correlation analyses were performed to evaluate the effects of different water and fertilizer combinations on both winter wheat yield and WUE. The results statistically confirm that moderate organic fertilizer application significantly improved soil quality and crop growth conditions, leading to increased yield. Furthermore, under deficit irrigation conditions, the exclusive use of organic fertilizer was found to reduce WUE, whereas the combined application of organic and inorganic fertilizers significantly enhanced both soil nutrient availability and WUE, achieving the dual goals of increasing yield and conserving water.

4. Discussion

4.1. Faster R-CNN Model Performance and Innovations

While several studies have employed Faster R-CNN for wheat spike detection, many utilize simplified architectures not fully validated in complex, occluded field environments [44,51]. This study improved Faster R-CNN to accurately identify and count wheat in the experimental area. The results showed that the improved Faster R-CNN outperformed YOLOv8 in identifying wheat spikes in complex environments. Although very recent models such as YOLOv11, DINOv2, or RT-DETR could offer additional valuable context, the primary conclusion of our work—that a two-stage detector with tailored improvements can excel in complex agricultural environments—is supported by the consistent and significant outperformance of our model over this representative baseline. Regardless of the subsequent model release, this enhances the potential of the custom two-stage architecture in addressing the challenge of wheat spike detection under variable real-world conditions. For the experimental area, the recognition accuracy of the model has met the requirements for accurate identification of wheat spikes, similar to many previous research results [10,52]. Compared with these studies, in China, the density of wheat spikes is higher, and the problem of wheat spike occlusion is more obvious. The improved Faster R-CNN model shows excellent recognition performance for complex scenes and scenes with obvious wheat spike occlusion, which is consistent with [44], which also proves the accuracy of Faster R-CNN in high-density wheat scenes. A key innovation was the replacement of VGG16 with ResNet50, which reduced computational complexity while mitigating gradient vanishing problems, thereby preserving feature extraction efficacy in deep networks [49].
By integrating high-resolution UAV imagery (0.5 cm/pixel) with multi-source data, the model achieved reliable spike counting across key growth stages (jointing, heading, and irrigation). Strong correlation was observed between model-predicted spike numbers and actual yield (R2 = 0.94), further validating spike density as a robust yield proxy [6,24]. This establishes a critical link between in-field phenotyping and yield prediction at scale. Compared with previous studies, this research links the phenotypic characteristics of wheat, namely, the number of wheat spikes and the prediction of field scale yield, further verifying the reliability of wheat spike recognition. The wheat spike recognition model proposed in this study has shown good recognition performance. However, the model still suffers from high wheat spike underestimation. This may also be due to insufficient sample size for training and insufficient diversity of data, resulting in insufficient level of deep learning and recognition accuracy [53]. Although the model achieved sufficient average accuracy, a sharp decrease in recognized spike counts accompanied by significant fluctuations was observed, specifically, during the maturity stage. Notably, model performance declined during the maturity stage, likely due to decreased color contrast between spikes and the background. This spectral sensitivity—particularly to green-yellow transition phases—highlights an inherent limitation of RGB-based models and aligns with findings in [54,55], which identified color features as major factors influencing detection accuracy. Future efforts could incorporate hyperspectral or multimodal data to improve spectral robustness.
The model exhibits underestimation of spikes and performance drops during the maturity stage due to low color contrast in RGB images, and its generalizability is limited by training on a single region and growth stage dataset. Therefore, prior to model training, texture features within the images should be enhanced to improve wheat spike recognition performance. Subsequent work will involve expanding the dataset through the collection of additional wheat spike imagery within the experimental area. UAV-based imaging will be extended to cover more regions and capture a wider range of growth stages to better meet the data requirements of deep learning models. Concurrently, the model will be applied to wheat spike recognition across additional regions to validate its universality. Future work will integrate hyperspectral and multimodal data to enhance spectral robustness while expanding the dataset to cover diverse regions and growth stages. Research efforts will also focus on establishing standardized UAV flight protocols—such as fixed capture height and nadir angle—to improve dataset quality. Further optimization of the network architecture will be pursued to boost spike recognition accuracy, alongside reducing model complexity to achieve efficient, lightweight deployment.

4.2. Yield Prediction and Water–Nitrogen Synergy

At present, most research on wheat yield estimation is based on unmanned aerial vehicle remote sensing data prediction models. For example, Tang et al. (2024) took soybeans as the research object, based on unmanned aerial vehicle multispectral data and yield data [56]. Finally, the five spectral indices with the highest correlation coefficients with soybean yield selected from each growth stage were used as input variables to construct a soybean yield estimation model. Due to the use of vegetation indices extracted from unmanned aerial vehicle multispectral data as input values in the establishment of the yield estimation model, although this model achieved good results in yield estimation, its R2 is still not ideal. Using spike counts generated by the improved Faster R-CNN, a random forest (RF) model achieved the best yield prediction performance (R2 = 0.82, RMSE = 324.42 kg ha−1) among five machine learning algorithms. RF’s superiority is attributable to its ability to capture complex, non-linear interactions between spike density, water–nitrogen treatments, and environmental factors—consistent with findings in [23,57,58]. In contrast to studies that utilize vegetation indices derived from multispectral data (e.g., [56]), the present approach employs direct morphological traits—specifically, spike count—enhancing estimation accuracy in small plots and reducing dependence on spectral proxies. In the present study, the RF model outperformed the PLSR, LSSVM, SVR, and BP models by 22–46% on R2, highlighting the ability of RF to handle non-linear relationships in agronomic data, which is similar to the research results of [23]. The current research is primarily limited by the reliance of existing yield estimation models on vegetation indices derived from UAV multispectral data, which still exhibit insufficient predictive accuracy (R2) and are susceptible to nonlinear influences from complex agronomic conditions such as water and nitrogen stress. The proposed solution involves incorporating directly image-extracted morphological traits (e.g., spike count) as model inputs, adopting machine learning methods like random forest capable of capturing complex nonlinear relationships, and integrating data from diverse water and nitrogen treatments into the training set to enhance model generalizability.
This study used various machine learning algorithms to estimate wheat yield, and the results showed that nonlinear methods (RF, BP, and SVR) were superior to linear methods (PLS and LSSVM). This may also be due to the fact that in actual agricultural production, wheat yield is not only determined by the number of wheat spikes but also by the nonlinear and complex interaction of factors such as variety, environment, and management. At this point, the nonlinear model will perform better in this situation, and in this study, the accuracy of RF, a nonlinear method, far exceeds other methods [57,58]. Reasonably adjusting the water and nitrogen treatment structure can improve the production potential of winter wheat, so it is crucial to determine the optimal water and nitrogen treatment to increase yield [59,60]. Thus, the study quantified water–nitrogen coupling effects across 10 treatments (2 irrigation × 5 nitrogen levels). Under sufficient irrigation conditions, LC1 (single organic fertilizer) maximized yield benefits (13,679.26 CNY ha−1), while deficit irrigation with chemical fertilizer (LM4) achieved the highest water use efficiency (11.65 kg m−3). These results echo the synergistic water–nitrogen interactions reported in [61].
Notably, the combination of organic fertilizer alone with deficit irrigation resulted in reduced water use efficiency (WUE), a finding that aligns with broader agricultural studies. For instance, Hasan et al. (2023) reported a similar decrease in WUE in potato cultivation under drought stress following the application of organic amendments such as humic acid [52]. This consistency across crops suggests that while organic fertilizers enhance soil structure and nutrient availability, their capacity to improve water retention may be limited under significant moisture stress without complementary inorganic nutrient supplementation. Furthermore, this study demonstrates that both yield levels and the accuracy of yield prediction models vary substantially with different water and nitrogen regimes [23]. These findings highlight the necessity of explicitly incorporating diverse water and nitrogen management scenarios into both training and validation datasets to enhance model robustness and agronomic relevance. Future efforts should also integrate real-time monitoring of crop nitrogen status to support dynamic fertilization strategies [62], thereby advancing precision agriculture and strengthening agricultural sustainability under variable environmental conditions.

4.3. Advantages, Limitations, and Future Directions

The proposed enhanced Faster R-CNN framework contributes to the advancing field of AI-driven agricultural phenotyping by offering a robust solution for spike detection under high-occlusion conditions while also aligning with several key international research trends [63,64,65]. Unlike transformer-based architectures, which excel in capturing long-range dependencies but often require very large datasets and substantial computational resources, the approach presented in [63] combines a CNN and transformer and achieved 94.05% accuracy in variety detection. The proposed method maintains a strong balance between accuracy and efficiency, making it particularly suitable for real-time or near-real-time applications in resource-constrained farming environments. Similarly, compared to lightweight neural networks often deployed on unmanned aerial systems for real-time inference [64], this approach retains higher spatial precision and performs more consistently in densely packed and highly occluded canopies—conditions frequently encountered in intensive wheat production systems in China and other regions with high planting densities. Furthermore, the proposed model complements emerging multi-modal data fusion techniques referenced in [65] by providing a reliable and interpretable backbone for RGB-based phenotypic extraction, which can be readily integrated with supplementary data sources such as hyperspectral imagery. This aligns with the growing emphasis within the international research community on developing explainable, scalable, and agronomically integrated AI systems.
This study has several limitations that should be acknowledged. First, the model exhibits heightened sensitivity to phenological stages with low color differentiation (e.g., maturity), largely due to its reliance on RGB features, which struggle with spectral ambiguity between spikes and the senescing canopy. Second, while the model performs robustly in high-density field environments comparable to those in the training set, its generalizability to divergent wheat genotypes, extreme climates, or unconventional planting patterns remains unverified. Third, the current framework does not fully exploit temporal information from time-series UAV imagery, which could enhance spike tracking and dynamic yield forecasting. To overcome these challenges, future work will integrate hyperspectral imaging (e.g., NDVI and EVI) or thermal data to reduce color-dependent bias and improve spectral robustness; implement self-supervised or contrastive learning paradigms to enhance feature representation with limited annotated data; expand the training set to include multi-regional and multi-seasonal datasets to improve geographic and temporal scalability; and explore attention-based transformer architectures or temporal convolutional networks (TCNs) for improved sequence-aware spike detection and yield modeling. These advancements will not only strengthen the stability and accuracy of the proposed system but also align it with cutting-edge AI applications in agricultural phenotyping, offering a scalable and adaptive tool for precision farming under varying environmental conditions.

5. Conclusions

In conclusion, this study establishes an integrated technical framework that effectively bridges the gap between high-throughput phenotyping and precision agriculture. This work makes three pivotal contributions. First, we engineered a robust wheat spike detection model by strategically incorporating ResNet-50 and an attention mechanism into the Faster R-CNN architecture. This design significantly enhances the model’s resilience against field complexities such as occlusion and multi-scale variations, a capability rigorously validated on a high-resolution, multi-regional dataset. Second, the research advances beyond simple detection by building an intelligent analytical pipeline that directly links spike quantification with yield prediction. A systematic comparison of machine learning algorithms confirmed the random forest model as the most effective, achieving a reliable yield forecast and thereby translating visual data into a practical pre-harvest assessment tool. The most profound impact of this work lies in its derivation of concrete, data-supported agronomic strategies. Our analysis identifies coordinated organic/inorganic fertilization under deficit irrigation conditions as a key management practice, demonstrating its dual capacity to significantly boost resource-use efficiency while maintaining economic profitability. Consequently, this study delivers not merely a sophisticated phenotyping tool but a holistic, closed-loop solution for intelligent crop management. It provides both a scalable methodology and actionable insights, and future efforts will focus on extending this technical framework to additional crops and growing regions to promote its broader application in sustainable agricultural production.

Author Contributions

D.W. and L.S. conceived the study, led the research, and wrote the paper. Y.L. contributed to the development of the study and writing and editing. B.Z. carried out data analysis and contributed to writing and editing. G.Y. and S.V. carried out data analysis and created the figures. All authors have read and agreed to the published version of the manuscript.

Funding

This work was supported by the Henan Province Key R&D and Promotion Special Project (Science and Technology Targeted) (252102110352), the Natural Science Foundation of Henan Province (242300420035), and the National Key Research and Development Program of China (2022YFD1900402).

Data Availability Statement

Data is contained within the article.

Acknowledgments

We are indebted to Jipo Li, Yongjie Yu, Ke Zhang, Zongyang Li, and Hanglong Zhang for their help in collecting a large quantity of meteorological and yield data. We appreciate the technical help from Shiren Li, Sun Yat-sen University, China. We thank the anonymous reviewers for their valuable reviews and comments on the manuscript.

Conflicts of Interest

The authors declare that they have no known competing financial interests or personal relationships that could have appeared to influence the work reported in this paper.

References

  1. Wang, D.; Fu, Y.; Yang, G.; Yang, X.; Liang, D.; Zhou, C.; Zhang, N.; Wu, H.; Zhang, D. Combined Use of FCN and Harris Corner Detection for Counting Wheat Ears in Field Conditions. IEEE Access 2019, 7, 178930–178941. [Google Scholar] [CrossRef]
  2. Cao, J.; Zhang, Z.; Luo, Y.; Zhang, L.; Zhang, J.; Li, Z.; Tao, F. Wheat Yield Predictions at a County and Field Scale with Deep Learning, Machine Learning, and Google Earth Engine. Eur. J. Agron. 2021, 123, 126204. [Google Scholar] [CrossRef]
  3. Sheng, Q.; Ma, H.; Zhang, J.; Gui, Z.; Huang, W.; Chen, D.; Wang, B. Coupling Multi-Source Satellite Remote Sensing and Meteorological Data to Discriminate Yellow Rust and Fusarium Head Blight in Winter Wheat. Phyton-Int. J. Exp. Bot. 2025, 94, 421–440. [Google Scholar] [CrossRef]
  4. Hu, X.; Li, S.; Cai, M. An Improved Bit-Flipping Based Decoding Algorithm for Polar Codes. In Proceedings of the 2021 7th International Conference on Control Science and Systems Engineering (ICCSSE), Beijing, China, 30 July–1 August 2021; pp. 298–301. [Google Scholar] [CrossRef]
  5. Huang, L.; Wu, K.; Huang, W.; Dong, Y.; Ma, H.; Liu, Y.; Liu, L. Detection of Fusarium Head Blight in Wheat Ears Using Continuous Wavelet Analysis and PSO-SVM. Agriculture 2021, 11, 998. [Google Scholar] [CrossRef]
  6. Liu, C.; Wang, K.; Lu, H.; Cao, Z. Dynamic Color Transform Networks for Wheat Head Detection. Plant Phenomics 2022, 2022, 9818452. [Google Scholar] [CrossRef]
  7. Rezaei, E.E.; Webber, H.; Asseng, S.; Boote, K.; Durand, J.L.; Ewert, F.; Martre, P.; MacCarthy, D.S. Climate Change Impacts on Crop Yields. Nat. Rev. Earth Environ. 2023, 4, 831–846. [Google Scholar] [CrossRef]
  8. Yao, Z.; Zhang, D.; Tian, T.; Zain, M.; Zhang, W.; Yang, T.; Song, X.; Zhu, S.; Liu, T.; Ma, H.; et al. APW: An Ensemble Model for Efficient Wheat Spike Counting in Unmanned Aerial Vehicle Images. Comput. Electron. Agric. 2024, 224, 109204. [Google Scholar] [CrossRef]
  9. Liu, T.; Wu, W.; Chen, W.; Sun, C.; Zhu, X.; Guo, W. Automated Image-Processing for Counting Seedlings in a Wheat Field. Precis. Agric. 2016, 17, 392–406. [Google Scholar] [CrossRef]
  10. Madec, S.; Jin, X.; Lu, H.; De Solan, B.; Liu, S.; Duyme, F.; Heritier, E.; Baret, F. Ear Density Estimation from High Resolution RGB Imagery Using Deep Learning Technique. Agric. For. Meteorol. 2019, 264, 225–234. [Google Scholar] [CrossRef]
  11. Guan, K.; Wu, J.; Kimball, J.S.; Anderson, M.C.; Frolking, S.; Li, B.; Hain, C.R.; Lobell, D.B. The Shared and Unique Values of Optical, Fluorescence, Thermal and Microwave Satellite Data for Estimating Large-Scale Crop Yields. Remote Sens. Environ. 2017, 199, 333–349. [Google Scholar] [CrossRef]
  12. Han, D.; Wang, P.; Tang, J.; Li, Y.; Wang, Q.; Ma, Y. Enhancing Crop Yield Forecasting Performance through Integration of Process-Based Crop Model and Remote Sensing Data Assimilation Techniques. Agric. For. Meteorol. 2025, 372, 110696. [Google Scholar] [CrossRef]
  13. Wang, J.; Zhang, S.; Lizaga, I.; Zhang, Y.; Ge, X.; Zhang, Z.; Zhang, W.; Huang, Q.; Hu, Z. UAS-Based Remote Sensing for Agricultural Monitoring: Current Status and Perspectives. Comput. Electron. Agric. 2024, 227, 109501. [Google Scholar] [CrossRef]
  14. Lu, J.; Li, J.; Fu, H.; Zou, W.; Kang, J.; Yu, H.; Lin, X. Estimation of Rice Yield Using Multi-Source Remote Sensing Data Combined with Crop Growth Model and Deep Learning Algorithm. Agric. For. Meteorol. 2025, 370, 110600. [Google Scholar] [CrossRef]
  15. Mao, B.; Cheng, Q.; Chen, L.; Duan, F.; Sun, X.; Li, Y.; Li, Z.; Zhai, W.; Ding, F.; Li, H.; et al. Multi-Random Ensemble on Partial Least Squares Regression to Predict Wheat Yield and Its Losses across Water and Nitrogen Stress with Hyperspectral Remote Sensing. Comput. Electron. Agric. 2024, 222, 109046. [Google Scholar] [CrossRef]
  16. Xiao, G.; Zhang, X.; Niu, Q.; Li, X.; Li, X.; Zhong, L.; Huang, J. Winter Wheat Yield Estimation at the Field Scale Using Sentinel-2 Data and Deep Learning. Comput. Electron. Agric. 2024, 216, 108555. [Google Scholar] [CrossRef]
  17. Yang, J.; Xu, B.; Wu, B.; Zhao, R.; Liu, L.; Li, F.; Ai, X.; Fan, L.; Yang, Z. Chlorophyll Dynamic Fusion Based on High-Throughput Remote Sensing and Machine Learning Algorithms for Cotton Yield Prediction. Field Crops Res. 2025, 333, 110057. [Google Scholar] [CrossRef]
  18. Zhou, X.; Zheng, H.B.; Xu, X.Q.; He, J.Y.; Ge, X.K.; Yao, X.; Cheng, T.; Zhu, Y.; Cao, W.X.; Tian, Y.C. Predicting Grain Yield in Rice Using Multi-Temporal Vegetation Indices from UAV-Based Multispectral and Digital Imagery. ISPRS J. Photogramm. Remote Sens. 2017, 130, 246–255. [Google Scholar] [CrossRef]
  19. Zheng, H.; Ji, W.; Wang, W.; Lu, J.; Li, D.; Guo, C.; Yao, X.; Tian, Y.; Cao, W.; Zhu, Y.; et al. Transferability of Models for Predicting Rice Grain Yield from Unmanned Aerial Vehicle (UAV) Multispectral Imagery across Years, Cultivars and Sensors. Drones 2022, 6, 423. [Google Scholar] [CrossRef]
  20. Haseeb, M.; Tahir, Z.; Mahmood, S.A.; Tariq, A. Winter Wheat Yield Prediction Using Linear and Nonlinear Machine Learning Algorithms Based on Climatological and Remote Sensing Data. Inf. Process. Agric. 2025. [Google Scholar] [CrossRef]
  21. Hou, X.; Zhang, J.; Luo, X.; Zeng, S.; Lu, Y.; Wei, Q.; Liu, J.; Feng, W.; Li, Q. Peanut Yield Prediction Using Remote Sensing and Machine Learning Approaches Based on Phenological Characteristics. Comput. Electron. Agric. 2025, 232, 110084. [Google Scholar] [CrossRef]
  22. Zhang, Z.; Guo, J.; Gao, Y.; Zhang, F.; Hou, Z.; An, Q.; Yan, A.; Zhang, L. Increasing Yield Estimation Accuracy for Individual Apple Trees via Ensemble Learning and Growth Stage Stacking. Comput. Electron. Agric. 2025, 237, 110648. [Google Scholar] [CrossRef]
  23. Liu, X.; Yang, H.; Ata-Ul-Karim, S.T.; Schmidhalter, U.; Qiao, Y.; Dong, B.; Liu, X.; Tian, Y.; Zhu, Y.; Cao, W.; et al. Screening Drought-Resistant and Water-Saving Winter Wheat Varieties by Predicting Yields with Multi-Source UAV Remote Sensing Data. Comput. Electron. Agric. 2025, 234, 110213. [Google Scholar] [CrossRef]
  24. Yousafzai, S.N.; Nasir, I.M.; Tehsin, S.; Fitriyani, N.L.; Syafrudin, M. FLTrans-Net: Transformer-Based Feature Learning Network for Wheat Head Detection. Comput. Electron. Agric. 2025, 229, 109706. [Google Scholar] [CrossRef]
  25. Li, J.; Zhu, Z.; Liu, H.; Su, Y.; Deng, L. Strawberry R-CNN: Recognition and Counting Model of Strawberry Based on Improved Faster R-CNN. Ecol. Inform. 2023, 77, 102210. [Google Scholar] [CrossRef]
  26. Liu, Z.; Abeyrathna, R.M.R.D.; Sampurno, R.M.; Nakaguchi, V.M.; Ahamed, T. Faster-YOLO-AP: A Lightweight Apple Detection Algorithm Based on Improved YOLOv8 with a New Efficient PDWConv in Orchard. Comput. Electron. Agric. 2024, 223, 109118. [Google Scholar] [CrossRef]
  27. Tetila, E.C.; Wirti, G.; Higa, G.T.H.; da Costa, A.B.; Amorim, W.P.; Pistori, H.; Barbedo, J.G.A. Deep Learning Models for Detection and Recognition of Weed Species in Corn Crop. Crop Prot. 2025, 195, 107237. [Google Scholar] [CrossRef]
  28. Wang, C.; Wu, X.; Li, Z. Recognition of Maize and Weed Based on Multi-Scale Hierarchical Features Extracted by Convolutional Neural Network. Trans. Chin. Soc. Agric. Eng. 2018, 34, 144–151. [Google Scholar] [CrossRef]
  29. Cheng, T.; Zhang, D.; Gu, C.; Zhou, X.-G.; Qiao, H.; Guo, W.; Niu, Z.; Xie, J.; Yang, X. YOLO-CG-HS: A Lightweight Spore Detection Method for Wheat Airborne Fungal Pathogens. Comput. Electron. Agric. 2024, 227, 109544. [Google Scholar] [CrossRef]
  30. Zhang, D.-Y.; Luo, H.-S.; Cheng, T.; Li, W.-F.; Zhou, X.-G.; Wei, G.; Gu, C.-Y.; Diao, Z. Enhancing Wheat Fusarium Head Blight Detection Using Rotation Yolo Wheat Detection Network and Simple Spatial Attention Network. Comput. Electron. Agric. 2023, 211, 107968. [Google Scholar] [CrossRef]
  31. Kurtulmuş, F.; Kavdir, İ. Detecting Corn Tassels Using Computer Vision and Support Vector Machines. Expert Syst. Appl. 2014, 41, 7390–7397. [Google Scholar] [CrossRef]
  32. Kuwata, K.; Shibasaki, R. Estimating Crop Yields with Deep Learning and Remotely Sensed Data. In Proceedings of the 2015 IEEE International Geoscience and Remote Sensing Symposium (IGARSS), Milan, Italy, 26–31 July 2015; pp. 858–861. [Google Scholar] [CrossRef]
  33. Zhang, J.; Tian, H.; Wang, P.; Tansey, K.; Zhang, S.; Li, H. Improving Wheat Yield Estimates Using Data Augmentation Models and Remotely Sensed Biophysical Indices within Deep Neural Networks in the Guanzhong Plain, PR China. Comput. Electron. Agric. 2022, 192, 106616. [Google Scholar] [CrossRef]
  34. Li, Z.; Zhu, Y.; Sui, S.; Zhao, Y.; Liu, P.; Li, X. Real-Time Detection and Counting of Wheat Ears Based on Improved YOLOv7. Comput. Electron. Agric. 2024, 218, 108670. [Google Scholar] [CrossRef]
  35. Yang, B.; Gao, Z.; Gao, Y.; Zhu, Y. Rapid Detection and Counting of Wheat Ears in the Field Using YOLOv4 with Attention Module. Agronomy 2021, 11, 1202. [Google Scholar] [CrossRef]
  36. Khaki, S.; Safaei, N.; Pham, H.; Wang, L. WheatNet: A Lightweight Convolutional Neural Network for High-Throughput Image-Based Wheat Head Detection and Counting. Neurocomputing 2022, 489, 78–89. [Google Scholar] [CrossRef]
  37. Zhao, J.; Zhang, X.; Yan, J.; Qiu, X.; Yao, X.; Tian, Y.; Zhu, Y.; Cao, W. A Wheat Spike Detection Method in UAV Images Based on Improved YOLOv5. Remote Sens. 2021, 13, 3095. [Google Scholar] [CrossRef]
  38. Redmon, J.; Divvala, S.; Girshick, R.; Farhadi, A. You Only Look Once: Unified, Real-Time Object Detection. In Proceedings of the 2016 IEEE Conference on Computer Vision and Pattern Recognition (CVPR), Las Vegas, NV, USA, 27–30 June 2016; pp. 779–788. [Google Scholar] [CrossRef]
  39. Liu, W.; Anguelov, D.; Erhan, D.; Szegedy, C.; Reed, S.; Fu, C.-Y.; Berg, A.C. SSD: Single Shot MultiBox Detector. In Computer Vision–ECCV.; Springer International Publishing: Cham, Switzerland, 2016; pp. 21–37. [Google Scholar] [CrossRef]
  40. He, M.X.; Hao, P.; Xin, Y.Z. A Robust Method for Wheatear Detection Using UAV in Natural Scenes. IEEE Access 2020, 8, 189043–189053. [Google Scholar] [CrossRef]
  41. Ren, S.; He, K.; Girshick, R.; Sun, J. Faster R-CNN: Towards Real-Time Object Detection with Region Proposal Networks. IEEE Trans. Pattern Anal. Mach. Intell. 2017, 39, 1137–1149. [Google Scholar] [CrossRef]
  42. Kumar, D.; Kukreja, V.; Goyal, B.; Hariharan, S.; Verma, A. Combining Weather Classification and Mask RCNN for Accurate Wheat Rust Disease Prediction. In Proceedings of the 2023 World Conference on Communication & Computing (WCONF), Dubai, United Arab Emirates, 14–16 July 2023; pp. 1–4. [Google Scholar] [CrossRef]
  43. Sun, J.; Yang, K.; Chen, C.; Shen, J.; Yang, Y.; Wu, X.; Norton, T. Wheat Head Counting in the Wild by an Augmented Feature Pyramid Networks-Based Convolutional Neural Network. Comput. Electron. Agric. 2022, 193, 106705. [Google Scholar] [CrossRef]
  44. Li, L.; Hassan, M.A.; Yang, S.; Jing, F.; Yang, M.; Rasheed, A.; Wang, J.; Xia, X.; He, Z.; Xiao, Y. Development of Image-Based Wheat Spike Counter through a Faster R-CNN Algorithm and Application for Genetic Studies. Crop J. 2022, 10, 1303–1311. [Google Scholar] [CrossRef]
  45. Zhang, Y.; Xiao, D.; Liu, Y.; Wu, H. An Algorithm for Automatic Identification of Multiple Developmental Stages of Rice Spikes Based on Improved Faster R-CNN. Crop J. 2022, 10, 1323–1333. [Google Scholar] [CrossRef]
  46. Misra, T.; Arora, A.; Marwaha, S.; Chinnusamy, V.; Rao, A.R.; Jain, R.; Sahoo, R.N.; Ray, M.; Kumar, S.; Raju, D.; et al. SpikeSegNet-a Deep Learning Approach Utilizing Encoder-Decoder Network with Hourglass for Spike Segmentation and Counting in Wheat Plant from Visual Imaging. Plant Methods 2020, 16, 40. [Google Scholar] [CrossRef]
  47. Qassim, H.; Verma, A.; Feinzimer, D. Compressed Residual-VGG16 CNN Model for Big Data Places Image Recognition. In Proceedings of the 2018 IEEE 8th Annual Computing and Communication Workshop and Conference (CCWC), Las Vegas, NV, USA, 8–10 January 2018; pp. 169–175. [Google Scholar] [CrossRef]
  48. Theckedath, D.; Sedamkar, R.R. Detecting Affect States Using VGG16, ResNet50 and SE-ResNet50 Networks. SN Comput. Sci. 2020, 1, 79. [Google Scholar] [CrossRef]
  49. He, K.; Zhang, X.; Ren, S.; Sun, J. Deep Residual Learning for Image Recognition. In Proceedings of the 2016 IEEE Conference on Computer Vision and Pattern Recognition (CVPR), Las Vegas, NV, USA, 27–30 June 2016; pp. 770–778. [Google Scholar] [CrossRef]
  50. David, E.; Madec, S.; Sadeghi-Tehran, P.; Aasen, H.; Zheng, B.; Liu, S.; Kirchgessner, N.; Ishikawa, G.; Nagasawa, K.; Badhon, M.A.; et al. Global Wheat Head Detection (GWHD) Dataset: A Large and Diverse Dataset of High-Resolution RGB-Labelled Images to Develop and Benchmark Wheat Head Detection Methods. Plant Phenomics 2020, 2020, 3521852. [Google Scholar] [CrossRef]
  51. Bao, W.; Yang, X.; Liang, D.; Hu, G.; Yang, X. Lightweight Convolutional Neural Network Model for Field Wheat Ear Disease Identification. Comput. Electron. Agric. 2021, 189, 106367. [Google Scholar] [CrossRef]
  52. Hasan, M.M.; Chopin, J.P.; Laga, H.; Miklavcic, S.J. Detection and Analysis of Wheat Spikes Using Convolutional Neural Networks. Plant Methods 2018, 14, 100. [Google Scholar] [CrossRef]
  53. Sun, J.; Lai, Z.; Di, L.; Sun, Z.; Tao, J.; Shen, Y. Multilevel Deep Learning Network for County-Level Corn Yield Estimation in the U.S. Corn Belt. IEEE J. Sel. Top. Appl. Earth Obs. Remote Sens. 2020, 13, 5048–5060. [Google Scholar] [CrossRef]
  54. Pound, M.P.; Atkinson, J.A.; Wells, D.M.; Pridmore, T.P.; French, A.P. Deep Learning for Multi-Task Plant Phenotyping. In Proceedings of the 2017 IEEE International Conference on Computer Vision Workshops (ICCVW), Venice, Italy, 22–29 October 2017; pp. 2055–2063. [Google Scholar] [CrossRef]
  55. Zhang, S.; Huang, W.; Wang, Z. Combing Modified Grabcut, K-means Clustering and Sparse Representation Classification for Weed Recognition in Wheat Field. Neurocomputing 2021, 452, 665–674. [Google Scholar] [CrossRef]
  56. Tang, Z.; Zhang, W.; Huang, X.; Xiang, Y.; Zhang, F.; Chen, J. Soybean Seed Yield Estimation Model Based on Ground Hyperspectral Remote Sensing Technology. Trans. Chin. Soc. Agric. Mach. 2024, 55, 145–153+240. [Google Scholar] [CrossRef]
  57. Cai, Y.; Guan, K.; Lobell, D.; Potgieter, A.B.; Wang, S.; Peng, J.; Xu, T.; Asseng, S.; Zhang, Y.; You, L. Integrating Satellite and Climate Data to Predict Wheat Yield in Australia Using Machine Learning Approaches. Agric. For. Meteorol. 2019, 274, 144–159. [Google Scholar] [CrossRef]
  58. Zhou, X.; Kono, Y.; Win, A.; Matsui, T.; Tanaka, T.S.T. Predicting Within-Field Variability in Grain Yield and Protein Content of Winter Wheat Using UAV-Based Multispectral Imagery and Machine Learning Approaches. Plant Prod. Sci. 2021, 24, 137–151. [Google Scholar] [CrossRef]
  59. Asibi, A.E.; Hu, F.; Fan, Z.; Chai, Q. Optimized Nitrogen Rate, Plant Density, and Regulated Irrigation Improved Grain, Biomass Yields, and Water Use Efficiency of Maize at the Oasis Irrigation Region of China. Agriculture 2022, 12, 234. [Google Scholar] [CrossRef]
  60. Zhai, W.; Cheng, Q.; Duan, F.; Huang, X.; Chen, Z. Remote Sensing-Based Analysis of Yield and water-fertilizer use efficiency in winter wheat management. Agricultural Water-Fertilizer Use Efficiency in Winter Wheat Management. Agric. Water Manag. 2025, 311, 109390. [Google Scholar] [CrossRef]
  61. Wang, L.; Dong, S.; Liu, P.; Zhang, J.; Bin, Z. Effects of Water and Nitrogen Interaction on Physiological and Photosynthetic Characteristics and Yield of Winter Wheat. J. Soil Water Conserv. 2018, 32, 289–297. [Google Scholar] [CrossRef]
  62. Chandel, N.S.; Jat, D.; Chakraborty, S.K.; Upadhyay, A.; Subeesh, A.; Chouhan, P.; Manjhi, M.; Dubey, K. Deep Learning Assisted Real-Time Nitrogen Stress Detection for Variable Rate Fertilizer Applicator in Wheat Crop. Comput. Electron. Agric. 2025, 237, 110545. [Google Scholar] [CrossRef]
  63. Jeon, Y.J.; Hong, M.J.; Ko, C.S.; Park, S.J.; Lee, H.; Lee, W.-G.; Jung, D.-H. A Hybrid CNN-Transformer Model for Identification of Wheat Varieties and Growth Stages Using High-Throughput Phenotyping. Comput. Electron. Agric. 2025, 230, 109882. [Google Scholar] [CrossRef]
  64. Tetila, E.C.; Machado, B.B.; Astolfi, G.; Belete, N.A.S.; Amorim, W.P.; Roel, A.R.; Pistori, H. Detection and Classification of Soybean Pests Using Deep Learning with UAV Images. Comput. Electron. Agric. 2020, 179, 105836. [Google Scholar] [CrossRef]
  65. Hussain, T.; Li, Y.; Ren, M.; Li, J. Pixel-Level Crack Segmentation and Quantification Enabled by Multi-Modality Cross-Fusion of RGB and Depth Images. Constr. Build. Mater. 2025, 487, 141961. [Google Scholar] [CrossRef]
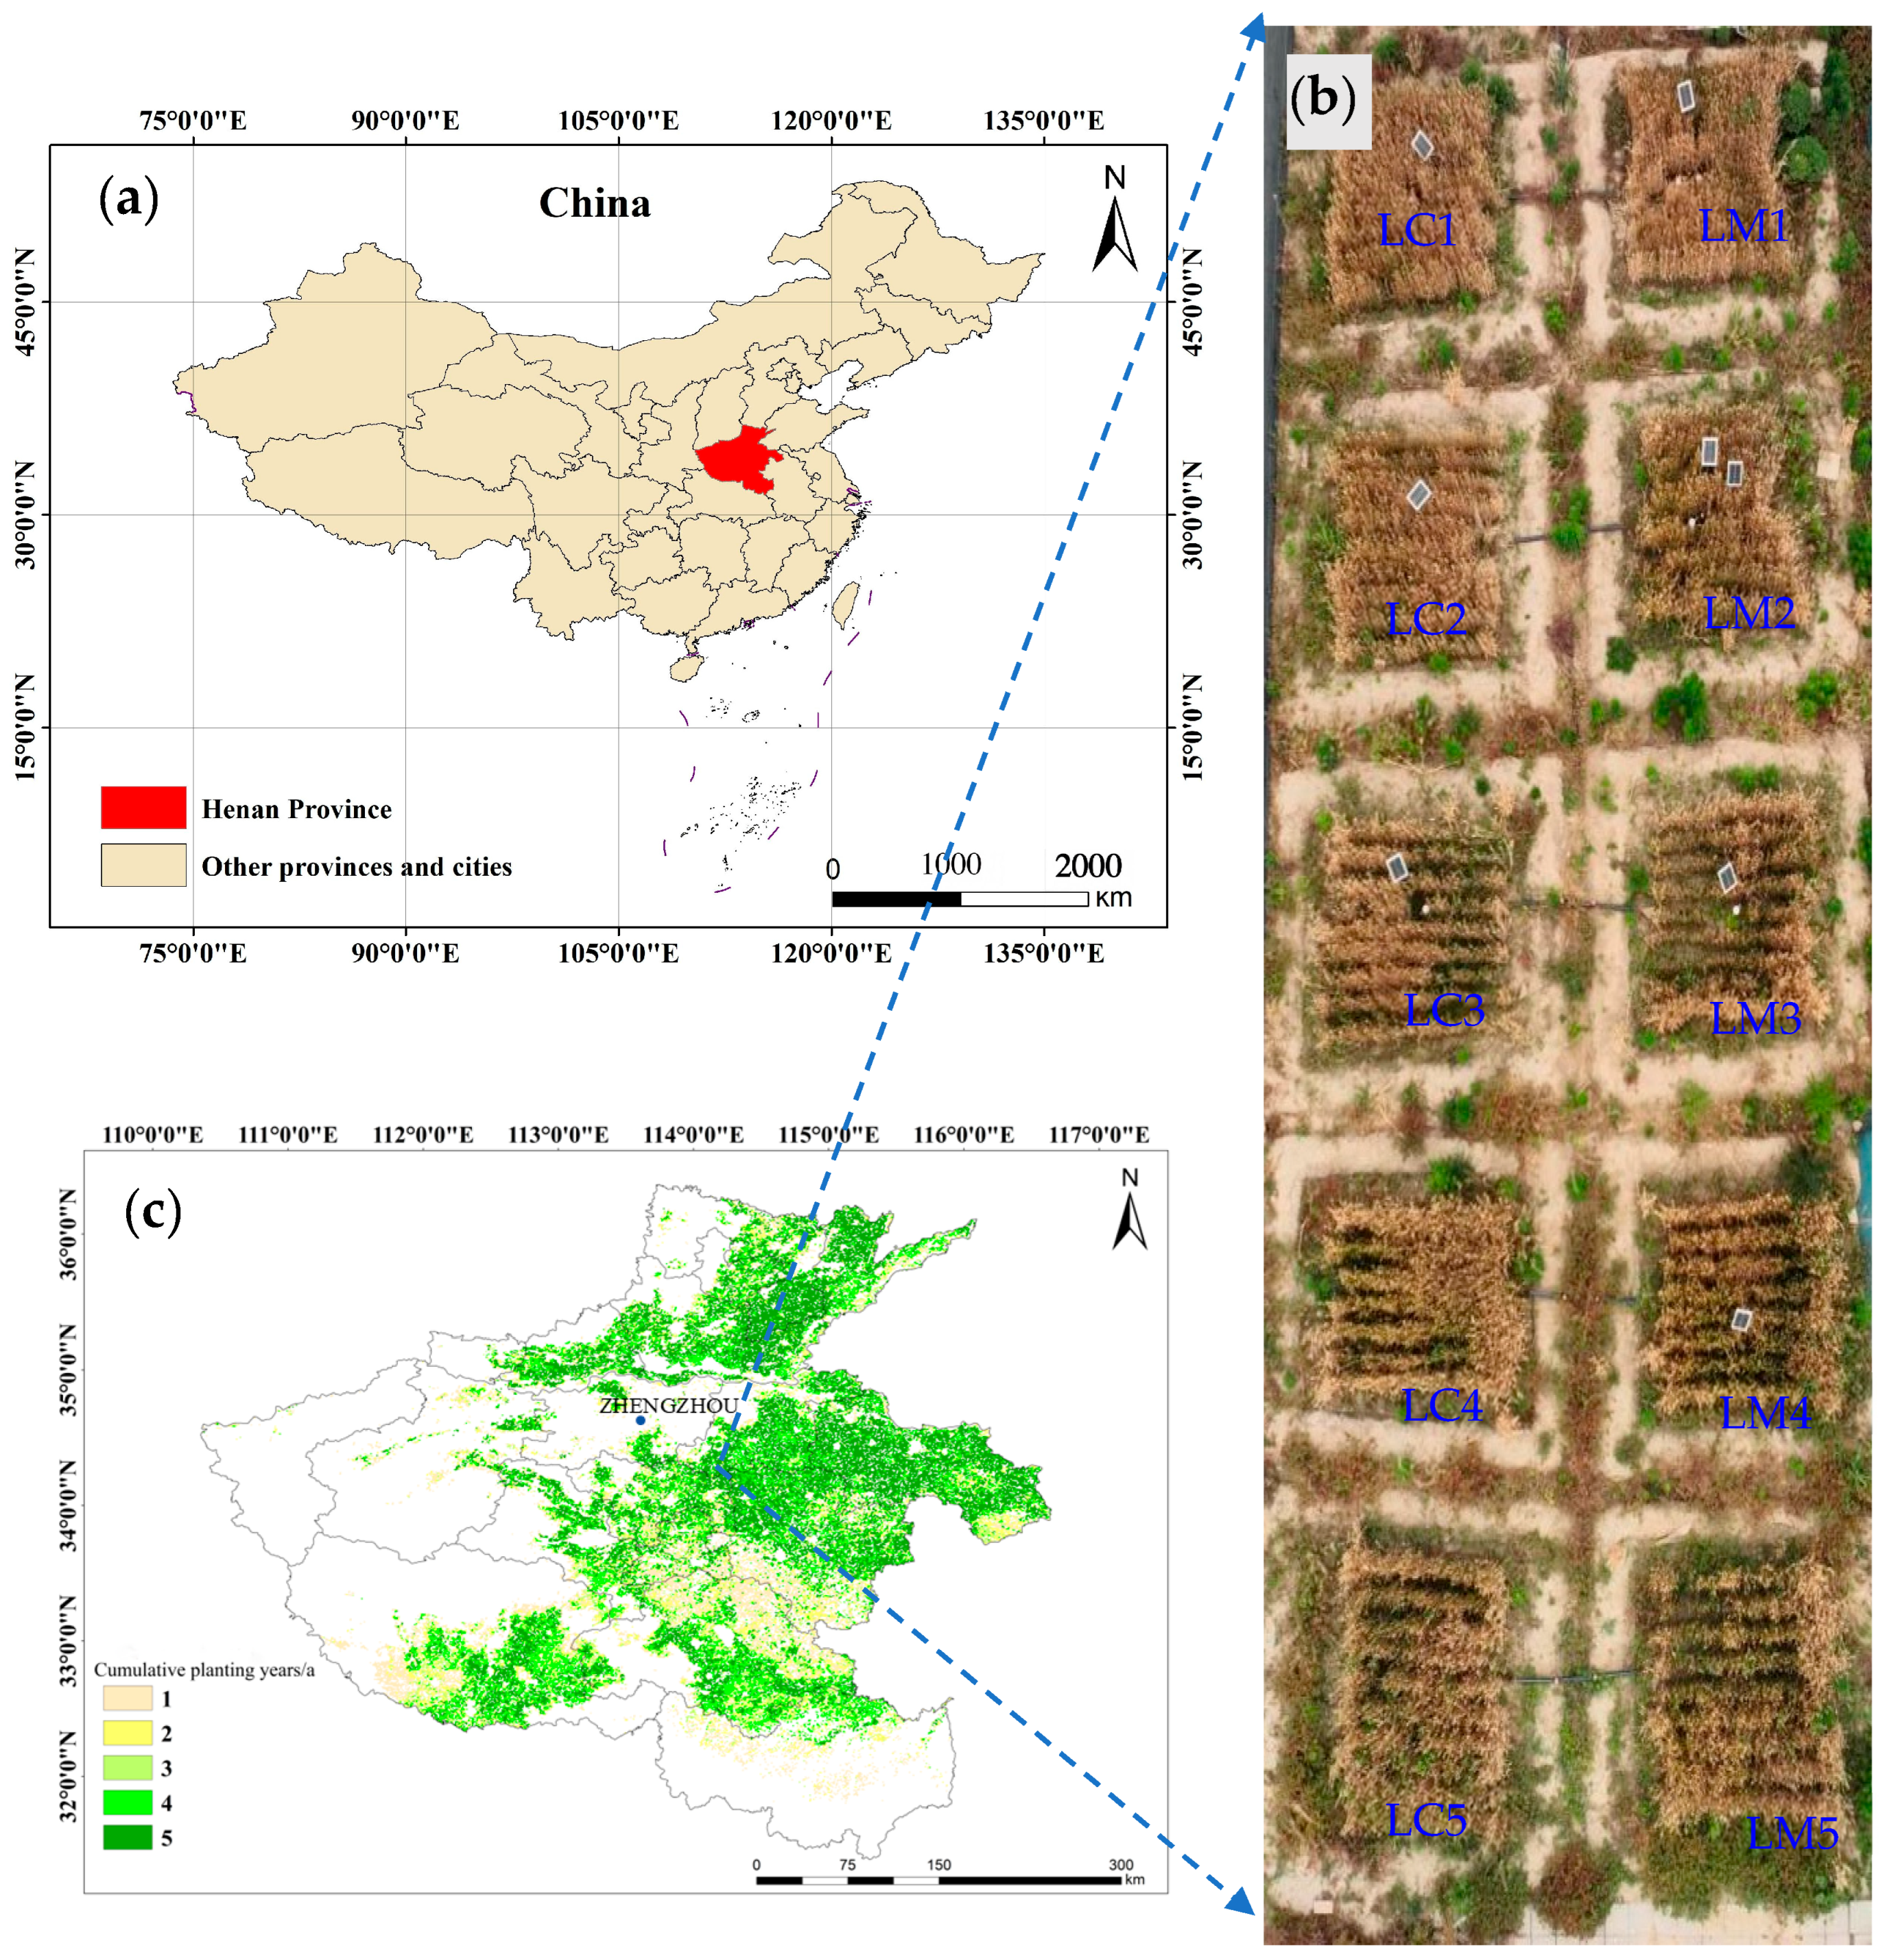
Figure 1. Location of experimental sites (a), MODIS-derived historical winter wheat planting distribution (b) and layout of treatment groups (c). (Note: The MODIS data provide a contextual background demonstrating regional cropping consistency and site representativeness; all subsequent analyses in this study are based exclusively on data from the 2022–2023 growing season).
Agronomy 15 02388 g001
Figure 2. Comparison of self-collected site image dataset (a), global wheat detection data (GWHD, (b)), and the LabelMe-annotated training set (c).
Agronomy 15 02388 g002
Figure 3. Schematic of the improved Faster R-CNN model with ResNet-50 backbone for wheat spike detection in complex farmland scenes.
Agronomy 15 02388 g003
Figure 4. Comparative analysis of the predicted values and true values in the training set and test set.
Agronomy 15 02388 g004
Figure 5. Comparative evaluation of training performance between Faster R-CNN and YOLOv8 models: mean average precision (mAP) and training loss.
Agronomy 15 02388 g005
Figure 6. Performance comparison of Faster R-CNN and YOLOv8 models across three key growth periods.
Agronomy 15 02388 g006
Figure 7. The average number of wheat spikes detected based on improved Faster R-CNN and YOLOv8 in wheat spike recognition: ten experimental plots with varying irrigation and fertilization treatments. (e.g., Treatments LM1–LM4 (letter a) form a homogeneous group, while LM5 (letter b) shows a distinctly lower spike density; LM5 and LC5 (both letter ‘b’) are statistically equivalent).
Agronomy 15 02388 g007
Figure 8. Density heatmaps of wheat spike distribution across three growth stages, generated using the improved Faster R-CNN model with varying background complexity.
Agronomy 15 02388 g008
Figure 9. Comparison of predicted and actual wheat yield values across ten different water–nitrogen treatments.
Agronomy 15 02388 g009
Figure 10. Prediction results of five yield estimation models based on wheat spike number.
Agronomy 15 02388 g010
Figure 11. Multivariate correlation analysis among CNN-derived spike counts, yield components (productive ears and 1000-grain weight), soil factors (moisture and bulk density), and water–nitrogen use efficiency under all treatment conditions.
Agronomy 15 02388 g011
Table 1. Software parameters between improved Faster R-CNN and YOLOv8 models.
ParameterValueThe Properties of Unit
Faster R-CNNYOLOv8
Optimizer SGDSGDtype
Momentum0.8~0.950.8~0.95dimensionless
Label smoothing0.0001~0.20.0001~0.2dimensionless
Batch size8~164~8images per batch
Epochs100~200150~300training cycles
Learning rate0.0001~0.010.0001~0.001dimensionless
Workers4~84~8data loading processes
Table 2. Performance comparison between the improved Faster R-CNN model and the widely used YOLOv8 object detection network under identical experimental conditions.
ModelTraining DatasetPrecision (mAP@0.5)Batch SizeInference GFLOPsTraining Time (min)EpochsTraining GFLOPsLossRecall
Faster RCNNWheat Head Detection91.2 ± 0.012 a41.77141006.50.62910.8872
YOLOv8Wheat Head Detection89.1 ± 0.015 ab40.7531000.90.63070.8825
Note: Significant differences between YOLOv8 and CNN are indicated by lowercase letters at p < 0.05 (LSD).
Table 3. Grain yield and yield components of winter wheat under field experimental conditions.
TreatmentNumber of Grains per SpikeNumber of Spikes per Square MeterEffective Number of Spikes per Square MeterThousand-Grain WeightMoisture Content (%)Theoretical Yield (kg ha−1)Actual Yield
(kg ha−1)
LM129 ± 1 b601 ± 13 abc566 ± 11 d42.53 ± 0.22 d8.291 ± 0.15 d5992.07 ± 239.08 bc4178.76 ± 125.3 c
LM228 ± 2 bc747 ± 24 a724 ± 14 ab44.00 ± 0.35 b9.124 ± 0.18 c7589.85 ± 564.68 ab5073.38 ± 152.2 ab
LM331 ± 2 ab800 ± 16 a760 ± 15 a42.07 ± 0.21 d10.218 ± 0.20 b8434.16 ± 570.15 a4905.64 ± 147.2 abc
LM428 ± 1 bc773 ± 16 a739 ± 14 ab42.20 ± 0.25 d11.067 ± 0.22 a7474.10 ± 304.94 ab5242.76 ± 150.7 ab
LM521 ± 2 d459 ± 9 d407 ± 8 f41.13 ± 0.21 e10.273 ± 0.21 b2947.91 ± 286.83 e2446.62 ± 61.2 d
LC135 ± 2 a612 ± 12 bc580 ± 11 d42.33 ± 0.21 d5.603 ± 0.11 g7240.35 ± 437.32 ab5583.37 ± 119.6 a
LC226 ± 1 bcd561 ± 11 cd547 ± 10 de43.10 ± 0.22 c6.738 ± 0.13 f5163.54 ± 221.52 cd4092.78 ± 122.8 c
LC326 ± 1 bcd702 ± 14 ab660 ± 13 ab45.37 ± 0.23 a7.079 ± 0.14 ef6718.98 ± 292.28 abc4681.69 ± 140.5 bc
LC431 ± 1 ab697 ± 13 ab650 ± 16 bd41.13 ± 0.21 e7.594 ± 0.15 e7083.07 ± 289.70 abc4528.81 ± 135.9 bc
LC520 ± 2 cd409 ± 8 d378 ± 7 ef42.23 ± 0.21 d6.155 ± 0.12 f2666.37 ± 271.44 de2383.62 ± 71.5 d
Note: Significant differences among the treatments are indicated by lowercase letters at p < 0.05 LSD, the same as below. (Same letter, no difference; different letters, significant difference. Two-letter codes bridge intermediate groups).
Table 4. Evaluation of five winter wheat yield estimation models based on spike number.
PLSRLSSVMSVRBPRF
R2RMSE (kg ha−1)R2RMSE (kg ha−1)R2RMSE (kg ha−1)R2RMSE (kg ha−1)R2RMSE (kg ha−1)
Train0.56582.770.62480.310.63460.720.67429.270.82324.42
Test0.59561.620.71391.910.65458.690.70448.330.86293.72
Table 5. Water use efficiency (WUE) under different experimental treatment conditions.
TreatmentActual Wheat Yield (kg ha−1)Wheat Yield (CNY ha−1)Irrigation Amount
(m3 ha−1)
WP
(kg m−3)
Irrigation (mm)Precipitation
(mm)
ET (mm)Soil Water Stored
(m)
WUE
(kg∙ha−1∙mm−1)
LM14178.76 ± 125.3 c10,237.96 ± 306.98 e13509.29 ± 0.2784 c100.00110.33466.930.53113.19
LM25073.38 ± 152.2 ab12,429.78 ± 372.89 bc135011.27 ± 0.3382 ab100.00110.33434.700.40417.65
LM34905.64 ± 147.2 abc12,018.82 ± 360.50 c135010.90 ± 0.3256 b100.00110.33432.530.46619.52
LM45242.76 ± 150.7 ab12,844.76 ± 369.21 b135011.65 ± 0.3349 a100.00110.33436.930.48320.16
LM52446.62 ± 61.2 d5994.22 ± 149.94 f13505.44 ± 0.1360 f100.00110.33458.160.5157.02
LC15583.37 ± 119.6 a13,679.26 ± 293.02 a22507.43 ± 0.1595 d60.00110.33382.540.59013.64
LC24092.78 ± 122.8 c10,027.31 ± 300.81 e22505.46 ± 0.1637 f60.00110.33417.550.59710.83
LC34681.69 ± 140.5 bc11,470.14 ± 344.23 d22506.24 ± 0.1873 e60.00110.33428.360.65614.07
LC44528.81 ± 135.9 bc11,095.58 ± 333.00 d22506.04 ± 0.1812 e60.00110.33396.260.55714.67
LC52383.62 ± 71.5 d5839.87 ± 175.18 f22503.18 ± 0.0953 g60.00110.33366.940.4765.22
Note: Significant differences among the treatments are indicated by lowercase letters at p < 0.05 LSD, the same as below. (Same letter, no difference; different letters, significant difference. Two-letter codes bridge intermediate groups).
Disclaimer/Publisher’s Note: The statements, opinions and data contained in all publications are solely those of the individual author(s) and contributor(s) and not of MDPI and/or the editor(s). MDPI and/or the editor(s) disclaim responsibility for any injury to people or property resulting from any ideas, methods, instructions or products referred to in the content.