Article

Effects of Waterlogging at Different Developmental Stages on Growth, Yield and Physiological Responses of Forage Maize

1
Division of Applied Life Science (BK21 Four), IALS, Gyeongsang National University, Jinju 52828, Republic of Korea
2
Forages Production Systems Division, National Institute of Animal Science, Rural Development Administration, Chonan 31000, Republic of Korea
*
Author to whom correspondence should be addressed.
These authors contributed equally to this work.
Agronomy 2025, 15(10), 2389; https://doi.org/10.3390/agronomy15102389
Submission received: 31 August 2025 / Revised: 1 October 2025 / Accepted: 10 October 2025 / Published: 15 October 2025
(This article belongs to the Section Crop Breeding and Genetics)

Abstract

Waterlogging (WL) is an abiotic stress that severely limits crop yield. However, limited research has addressed the effects of long-term WL stress at different developmental stages on the yield and physiological responses of forage maize. In this study, forage maize plants were subjected to 14-day WL stress at the emergence (E), four-leaf (V4), eleven-leaf (V11), and tasseling (VT) stages. Plant height significantly decreased by 60% at the E stage and 48% at the V4 stage when exposed to 14-day WL. Leaf area decreased by 79% at the E stage, and the number of green leaves decreased most significantly at the VT stage. Chlorophyll fluorescence (Fv/Fm) and the relative chlorophyll content index (RCI) decreased most significantly at the V4 stage. The lysigenous aerenchyma formation rate of the roots increased significantly after 14-day WL at the V4 stage, whereas the number of adventitious roots increased most significantly at the V11 stage. The hydrogen peroxide (H2O2) and malondialdehyde (MDA) contents, which are indicative of the root oxidation state, exhibited the highest increase at the E stage. In addition, at the E and V4 stages, the expression of genes related to energy metabolism and lysigenous aerenchyma formation in the roots was upregulated after 14-day WL. The total dry matter (DM) of maize after harvest decreased most significantly when exposed to 14-day WL at the V4 stage, while acid detergent fiber (ADF) and neutral detergent fiber (NDF) increased with the developmental stages. Consequently, total digestible nutrients (TDNs) and the relative feed value (RFV) decreased with advancing developmental stages, with the highest decrease at the VT stage. These results demonstrate that effective drainage management during the early developmental stage (V4) is more important to prevent forage maize yield loss due to prolonged WL stress, which is expected to increase in frequency due to climate change, and management during the later developmental stage (VT) is critical to prevent decreases in feed values. These findings provide valuable insights into the physiological responses of forage maize to WL stress.

1. Introduction

Maize is the most important crop globally for food, feed, and biomass production [1] and is known as the “king of forage crops” due to its high yield per unit area and high total digestible nutrient (TDN) content [2]. Its high carbohydrate content makes it suitable for silage production, and the entire process from sowing to harvesting is mechanized, making it convenient for farmers [3,4].
In Korea, the number of livestock, including cattle, pigs, and chickens, has increased. Consequently, the demand for livestock feed has also increased. In particular, the forage production rate in Korea relative to the total forage required to raise ruminant livestock, such as cattle, has decreased, leading to an increase in the amount of forage imported from overseas [5]. To address this issue, the Korean government has actively promoted policies to increase forage self-sufficiency by expanding the cultivation of forage maize not only in upland fields during the summer season but also in paddy fields, whose utilization has decreased due to the decline in rice consumption [6]. However, in poorly drained paddy fields, dry matter yield is reduced by 34.5%, and the TDN content is reduced by 32.5%, compared to well-drained paddies [7]. Therefore, expanding maize cultivation in well-drained paddies is essential to achieve yields similar to upland fields. However, even in well-drained paddies, the hardpan layer formed by mechanized operations can weaken the physical properties of the soil, leading to reduced yield [8,9], and there is still the risk of waterlogging during the rainy season from June to August in Korea.
Climatic abnormalities due to climate change are causing an increase in several abiotic stresses that affect crop yields, including heat and cold waves, drought, salinity, and flooding [10]. For maize, climate simulation models predicted a 15–50% reduction in yields from the late 20th century to the middle and late 21st century [11]. Flooding due to climate change is one of the main abiotic stresses that reduces the productivity of food crops [12]. More than 17 million2 km (10–20%) of agricultural land are expected to be affected by flooding annually, resulting in over USD 74 billion in annual losses [13]. In East Asia, the frequency of floods has increased due to changes in summer monsoon patterns, a trend that has accelerated over the past 20 years [14]. Studies conducted in various river basins in East Asia predict that flood damage will continue to rise under future climate scenarios, with flood damage in paddy fields expected to increase by more than 20%, severely impacting agricultural production [15].
Waterlogging is a type of flooding stress in which the soil is saturated with water, affecting the root system and limiting oxygen availability [16]. It also disrupts gas exchange between the soil and atmosphere [17] and often leads to nitrogen deficiency in the soil [18]. Plant roots and microbial activity consume the trapped oxygen in the soil, leading to hypoxia and anaerobic conditions in the rhizosphere [19]. Waterlogging also causes significant changes in soil redox potential (Eh), and these changes can induce elemental toxicity, which negatively impacts crop yield and growth [20,21]. Moreover, under hypoxic conditions, plants exhibit diverse adaptive responses, such as the activation of fermentative metabolism (e.g., alcohol dehydrogenase, ADH; pyruvate decarboxylase, PDC) [22], the regulation of antioxidant enzyme systems (e.g., superoxide dismutase, SOD; peroxidase, POD; catalase, CAT) [23], and the promotion of aerenchyma development and adventitious root formation [24]. In addition, prolonged waterlogging stress can lead to physiological and anatomical alterations, including the inhibition of photosynthesis and tissue damage caused by excessive accumulation of reactive oxygen species (ROS) [25].
Studies on maize’s response to waterlogging stress has primarily focused on specific developmental stages (V3 stage [26,27], V6 stage [28], or the reproductive stage [29]), with only a few recent studies investigating maize’s response to waterlogging across various developmental stages (V3, V6, VT, and R3 [30]; V7 and V14 [31]). However, limited reports have analyzed the effect of long-term waterlogging stress on various developmental stages in preparation for extreme weather conditions. However, most previous studies have focused on short-term (≤10 days) waterlogging treatments or a single developmental stage, and comprehensive analyses of yield, forage quality, and physiological responses under long-term (≥14 days) waterlogging stress conditions, which more realistically reflect field conditions, are still limited.
Therefore, this study was conducted to investigate the effects of long-term (14 days) waterlogging stress at different developmental stages on the growth, yield, forage quality, and physiological responses of forage maize.

2. Materials and Methods

2.1. Experimental Description and Research Design

The study on the growth characteristics and productivity changes in summer forage crops under waterlogging treatment at different developmental stages was conducted at the Livestock Farm of Gyeongsang National University (128°14’ E, 35°20’ N). The maize variety Kwangpyeongok was used in the experiment. In 2022, seeds were sown on May 22 and grown until June 1, when seedlings of the same size were transplanted, one per 1/2000a Wagner pot (top diameter × bottom diameter × height = 256 × 234 × 297 mm). In 2023, seeds were sown on May 31, with transplantation on June 6. The experimental pots were filled with soil to a depth of more than 15 cm with site topsoil (0–15 cm), classified as clay loam according to the Korean Soil Information System (KSIS, unit KtD2). KSIS-reported properties were pH (1:5 H2O) 5.4; organic matter, 39.5 g/kg; available P, 463.5 mg/kg; exchangeable Ca/K/Mg = 2.6/4.1/2.3 cmol+/kg; EC, 0.7 dS/m; and available Si, 60.7 mg/kg. Fertilizer was applied with a N:P:K ratio of 200:150:150 kg/ha, with 50% of the N applied as a base fertilizer and the remaining 50% top-dressed at the 7–8 leaf stage. To approximate field thermal conditions and reduce edge effects, all pots were buried to two-thirds of their height in the experimental plot. At each designated developmental stage (emergence, E; four-leaf, V4; eleven-leaf, V11; tasseling, VT), waterlogging was imposed in the same pots by sealing the bottom drainage hole with a rubber stopper, maintaining 3 cm of standing water above the soil surface for 14 days, and replenishing as needed. Control pots were irrigated every 3 days to maintain field capacity.
Because the trials were conducted outdoors, we compiled site-level climate records to contextualize exposure. Data loggers (Watchdog 1000 Series, Spectrum Technologies Inc., Aurora, IL, USA) were positioned within the experimental site at 100 cm above the soil surface to record air temperature, and soil moisture sensors (WaterScout SM 100 Soil Moisture Sensor, Spectrum Technologies Inc., Aurora, IL, USA) connected to each data logger were placed 10 cm below the soil surface. Precipitation data were obtained from the Jinju-si Chojeon-dong observation station (128°11’ E, 35°20’ N) provided by Agricultural Weather 365. A concise summary is provided in Figure S1.
Maize developmental stages were determined based on the number of fully emerged leaves with a visible collar (Vn, nth leaf stage) according to the Ritchie method [32]. The developmental stages examined in this study were the “early developmental stage (emergence stage: 1 June 2022; 6 June 2023)”, “main vegetative developmental stages (V4 stage: 15 June 2022; 16 June 2023; V11 stage: 11 July 2022; 13 July 2023)”, and “reproductive developmental stage (tasseling stage: 28 July 2022; 28 July 2023)”.

2.2. Plant Measurements

To investigate the growth changes in forage maize under waterlogging at different developmental stages, phenotypic traits, productivity, and photosynthetic parameters of both the control and waterlogging-treated groups were measured after 14 days of waterlogging treatment. The phenotypic traits included plant height, stem diameter, leaf area of the most recently fully emerged leaf, and the number of leaves maintaining more than 80% greenness. Plant height was measured from the soil surface of the pot to the highest part of the highest leaf bending towards the ground, and stem diameter was measured at the thinnest part between the first and second nodes. Leaf area was calculated using a formula based on the length and maximum width of each new fully emerged leaf, estimating leaf area by multiplying length × width × 0.67, following the procedure described by Hatfield et al. [33]. Following the approach of Asha et al. [34], with an adjusted threshold from 50% to 80% greenness, we defined “leaves maintaining greenness” as those retaining at least 80% of their greenness. For counting purposes, we included only those leaves located below the most recently and fully emerged leaf. Productivity was estimated by measuring the dry weight of the above- and below-ground parts, dividing them at 5 cm above the ground, and drying them in a forced-air dryer (WOF-W155, DAIHAN Scientific Co., Ltd., Daegu, Republic of Korea) at 65 °C for 72 h before measuring the dry weight.
Chlorophyll fluorescence was measured using a portable chlorophyll fluorimeter (Handy PEA+, Hansatech Instruments Ltd., Pentney, UK), with measurements taken on the central part of the most recently fully expanded leaf after 20 min of dark adaptation using dark-adaptation leaf clips. The clipped leaves were shielded from direct sunlight to mitigate the effect of fluorescence emission due to the temperature rise caused by the clips. The chlorophyll content was measured at the center of the same leaves used for chlorophyll fluorescence measurements using a relative chlorophyll content meter (CL-01 Chlorophyll Meter, Hansatech Instruments Ltd., UK). The results were expressed as the relative chlorophyll content index (RCI).
After all treatments were completed and the control group reached maturity, each treated group was harvested to measure agricultural characteristics, productivity, and nutrient value. The measured agricultural characteristics included stem height, ear height, and stem diameter. Stem height was measured from the soil surface to the top of the tassel, ear height from the soil surface to the base of the ear, and stem diameter at the thinnest part between the first and second nodes. Productivity was assessed by measuring the total dry weight of the above-ground parts and the ear, separating the leaves and ear, drying at 65 °C in a forced-air dryer (WOF-W155, DAIHAN Scientific Co., Ltd., Republic of Korea) for 72 h, and then measuring the dry weight. The neutral detergent fiber (NDF) and acid detergent fiber (ADF) contents were analyzed using an ANKOM 200 fiber analyzer (ANKOM Tech Co., New York, NY, USA) according to the Van Soest method [35]. The non-fiber carbohydrate (NFC) content was calculated using the NRC method [36], and the total digestible nutrient (TDN) content was calculated using the method of Menke and Huss [37]. The relative feed value (RFV) was determined using the Formulas (2)–(4) based on the values of ADF and NDF, as proposed by Holland et al. [38]. The crude protein (CP), crude ash (CA), and crude fat (CF) contents were analyzed according to AOAC methods [39].
NFC% = 100% − (CP% + NDF% + CF% + Ash%)
TDN (%) = 88.9 − [0.79 × ADF (%)]
DDM (%) = 88.9 − [0.779 × ADF (%)]
DMI (% of Body Weight) = 120/[NDF (%)]
RFV = (DDM × DMI)/1.29

2.3. Anatomical Observation of Roots

Aerenchyma formation in the maize roots was measured according to the method previously described in the literature with minor modifications [40,41]. Briefly, root segments were obtained at 6 cm from the tips of the maize roots. The root segments, which were washed with tap water in the field, were fixed in FAA solution (3.7% formalin, 50% ethanol, 5% glacial acetic acid) at 4 °C for 24 h, with aspiration at 10 inHg for 30 min, repeated three times at 8-h intervals. The fixed material was dehydrated in two stages: The first stage involved dehydration in 50% and 60% ethanol for 1 h and 30 min each, followed by an overnight dehydration in 70% ethanol containing 0.1% eosin Y. In the second stage, the samples were dehydrated in 80%, 90%, and 100% ethanol (I and II) for 3 h each. For paraffin substitution, the samples were immersed in ethanol–xylene solutions of 3:1, 1:1, 1:3, xylene I, and II for 3 h each, followed by the addition of paraffin chips (250 chips/300 mL) six times at 12-h intervals in a 37 °C natural convection incubator (WIG-155, DAIHAN Scientific Co., Ltd., Republic of Korea). Then, the volume was replaced eight times with molten paraffin at 12-h intervals in a 60 °C incubator, with each replacement comprising a quarter of the total volume; the final replacement used 100% molten paraffin to ensure infiltration. The samples were then embedded in paraffin using a deep base mold (SP.MA475.10, DAIHAN Scientific Co., Ltd., Republic of Korea) to form blocks, which were sectioned into 0.2 mm thicknesses using a hand microtome and microtome blade (SKU BI0077, Eisco LLC, Honeoye Falls, NY, USA). The sections were dried on slide glasses at 45 °C on a heating plate, dewaxed, and observed and photographed using a stereoscopic microscope (Model C-DS, NIKON, Tokyo, Japan) and a digital camera (MicroVision for Industrial use (MVI), 3B SYSTEM Inc., Daegu, Republic of Korea).

2.4. Root Hydrogen Peroxide (H2O2) and MDA Contents

To examine the extent of reactive oxygen species (ROS) expression related to the formation of aerenchyma in the roots, the hydrogen peroxide (H2O2) and malondialdehyde (MDA) contents were analyzed. After the waterlogging treatment, the root tissues were stored at −80 °C until analysis. The H2O2 content was measured as described by Jana and Choudhuri [42] and Tsai et al. [43], with minor modifications. Hydrogen peroxide was extracted by homogenizing 0.1 g (FW) of root tissue in liquid nitrogen and mixing with 1 mL of phosphate buffer (50 mM, pH 6.8). The mixture was centrifuged at 12,000 rpm for 20 min. A 0.7 mL aliquot of supernatant was transferred to a new 2 mL tube. To determine H2O2 content, 0.7 mL of the extracted solution was mixed with the same volume of 0.5% titanium chloride in 20% H2SO4 (v/v). The mixture was vortexed for 1 min and then centrifuged at 12,000 rpm for 15 min. The intensity of the yellow color of the supernatant was measured at 410 nm. The H2O2 content was calculated from a standard curve prepared from hydrogen peroxide of known strength.
The MDA content was measured as described by Heath and Packer [44]. MDA was extracted by homogenizing 0.1 g (FW) of root tissue in liquid nitrogen and mixing with 0.5 mL of 0.1% trichloroacetic acid (TCA). The mixture was centrifuged at 13,000× g for 10 min. A 0.5 mL aliquot of supernatant was transferred to a new 15 mL conical tube and mixed with 1.5 mL of 0.5% thiobarbituric acid (TBA) in 20% TCA (w/v). The mixture was heated at 90 °C for 30 min and then cooled in ice for 5 min. The solution was centrifuged at 6000× g for 3 min; then, the supernatant was used to determine the MDA content. To determine the MDA content, the supernatant was measured at 532 and 600 nm. The MDA content was calculated using the Formula (6) presented by Heath and Packer [44]:
MDA equivalents (nmol·mL−1) = [(A532 − A600)/155,000] × 106

2.5. RNA Extraction and qRT-PCR Analysis

Total RNA was extracted according to the manufacturer’s instructions for the Beniprep Super Plant Total Nucleic Acid Extraction Kit (IVT7006, InVirusTech, Gwangju, Republic of Korea). The first-strand cDNA was synthesized from 1 μg of RNA using AccuPower RT PreMix (Bioneer, Daejeon, Republic of Korea). qRT-PCR was performed using an EzAmp™ qPCR 2X Master Mix (EBT-1801, ElpisBiotech, Daejeon, Republic of Korea). The reaction solutions and qRT-PCR procedures were performed according to the kit’s instructions. Finally, the qRT-PCR reaction was carried out using a qTower3 Real-Time PCR Thermal Cycler (Analytik Jena, Thuringia, Germany). DNA amplification reactions were subject to the following thermocycle conditions: an initial denaturation step of 5 min at 95 °C followed by 40 cycles of 15 s denaturation at 95 °C, 15 s annealing at 60 °C, and 20 s extension at 72 °C. qRT-PCR data were analyzed using the 2−ΔΔCt method [45]. The primer sequences used in this study are listed in Table 1, and the maize ZmEF1α gene was used as a reference gene to normalize the expression data. Three technical replicates of each sample were analyzed with qRT-PCR.

2.6. Statistical Analysis

Statistical analysis was performed using IBM SPSS Statistics (IBM SPSS Statistics for Windows, Version 25.0, Armonk, New York, NY, USA). Differences in growth characteristics, photosynthetic traits, aerenchyma formation, and the root H2O2 and MDA contents, as well as the differential expression of mRNA in the roots at each developmental stage between the control and waterlogged treatments, were analyzed using an independent Student’s t-test, with significance tested at the 5% level. After harvesting each maize plant, namely, the control and waterlogging-treated plants at different development stages, one-way ANOVA was used to analyze the agronomic characteristics and nutrient values of each maize plant, and Duncan’s Multiple Range Test was used for the post hoc test of the analysis of variance.

3. Results

3.1. Growth Dynamics Under Waterlogging

To evaluate growth responses to 14-day waterlogging (WL) at defined stages, the control and WL plants were compared within each stage and year (Figure 1). Across the two years, the largest effects on shoot growth occurred at the early developmental stages, with strong effects at the E and V4 stages and smaller but detectable effects at the V11 stage. Based on the two-year mean, plant height decreased by 60% at the E stage (from 36.2 cm in the control to 14.3 cm in WL), by 48% at the V4 stage (from 88.6 cm in the control to 46.1 cm in WL), and by 21% at the V11 stage (from 220.7 cm in the control to 174.1 cm in WL) (Figure 1a,d). Thus, whole-plant morphological sensitivity was greatest before and during the early vegetative phase, particularly at the E and V4 stages.
The shoot dry matter trends were similar to those of plant height (Figure 1b,e). Averaged across years, the values decreased by 87% at the E stage (from 2.7 g plant−1 in the control to 0.4 g plant−1 in WL), by 71% at the V4 stage (from 19.7 g plant−1 in the control to 5.6 g plant−1 in WL), and by 39% at the V11 stage (from 155.8 g plant−1 in the control to 96.6 g plant−1 in WL). At the VT stage, a reduction in shoot dry matter was detected in 2023 (by 16%, from 202.1 g plant−1 in the control to 183.0 g plant−1 in WL), whereas no significant reduction was observed in 2022.
In contrast, root dry matter showed the strongest decline at the VT stage, despite smaller shoot-level changes at that stage (Figure 1c,f). Based on the two-year mean, the root dry matter decreased by 80% at the E stage (from 1.1 g plant−1 in the control to 0.3 g plant−1 in WL), by 54% at the V4 stage (from 6.2 g plant−1 in the control to 2.6 g plant−1 in WL), and by 37% at the V11 stage (from 40.2 g plant−1 in the control to 25.1 g plant−1 in WL). Notably, at the VT stage, the two-year average reduction reached 45% (from 50.8 g plant−1 in the control to 28.1 g plant−1 in WL), indicating substantial below-ground injury during reproduction, even when visible shoot injury was comparatively limited.
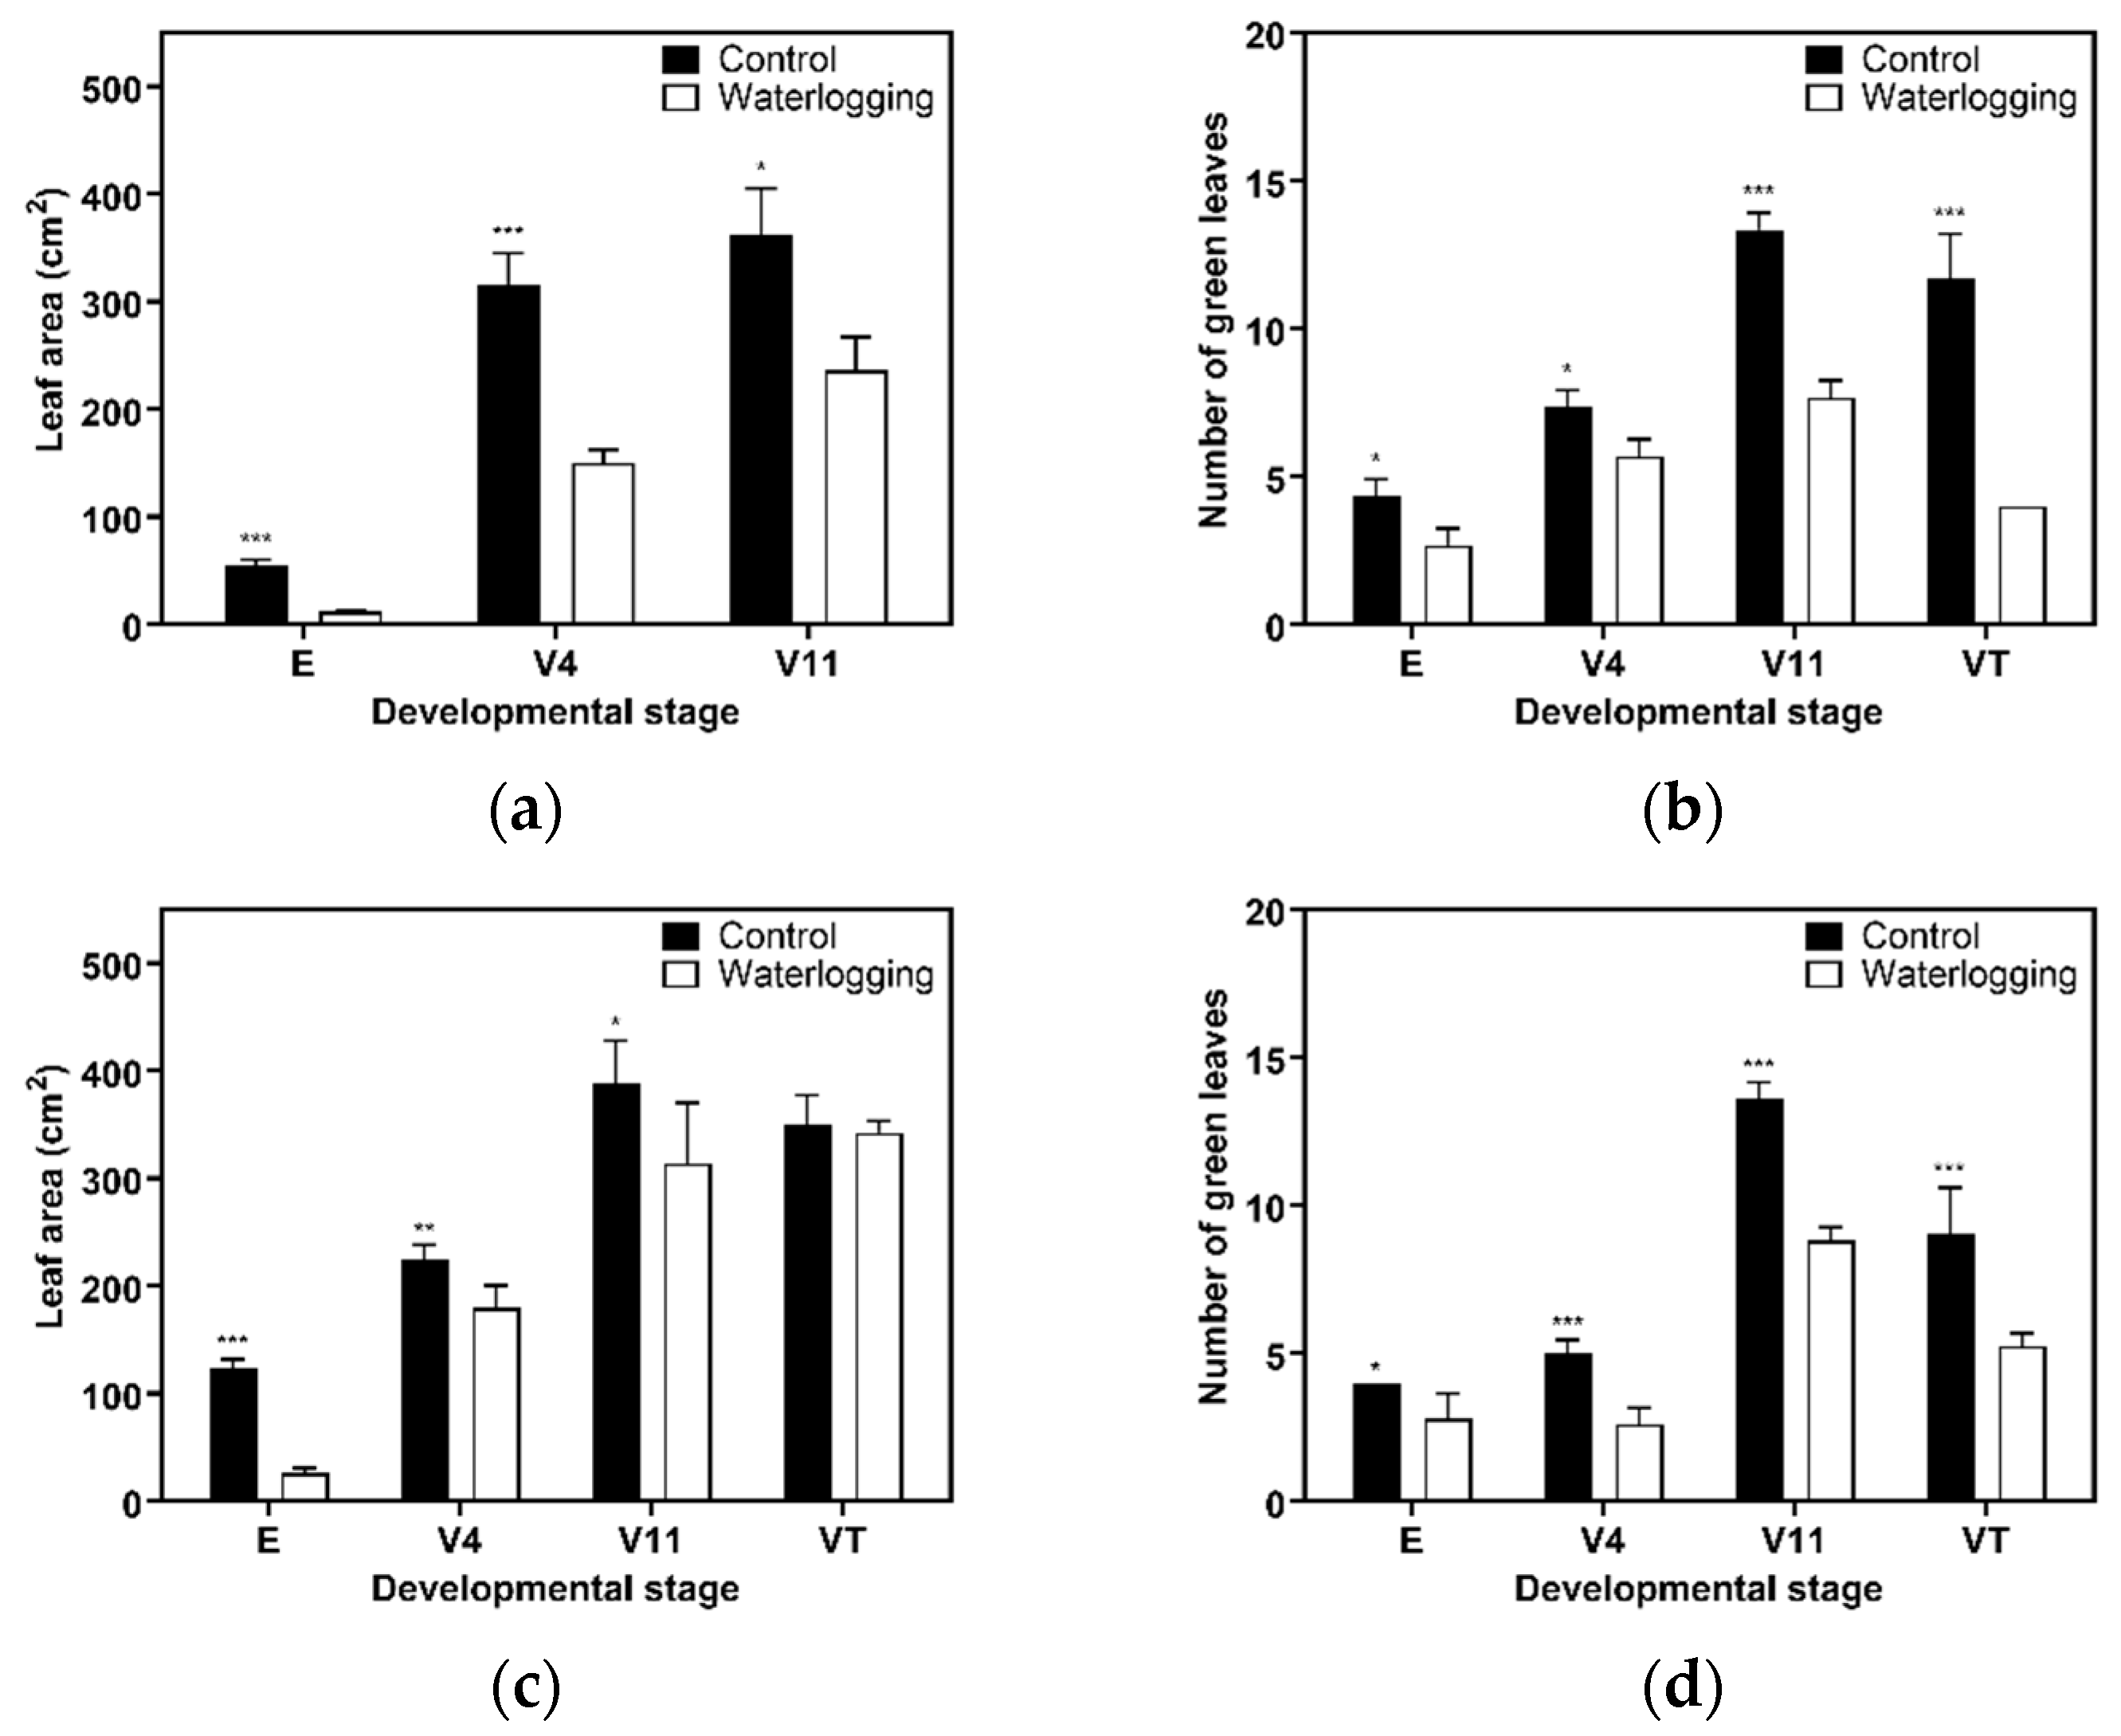
The leaf area of the most recently fully expanded leaf and the number of leaves maintaining greenness were compared between the control and waterlogging (WL) plants within each stage and year (Figure 2a–d). WL reduced the leaf area values at all vegetative stages, with the strongest effect on the two-year mean at the E stage, where the leaf area decreased by 79% (from 89.6 cm2 in the control to 19.0 cm2 in WL). At the V4 stage, the leaf area decreased by 36% (from 270.2 cm2 in the control to 167.7 cm2 in WL), and at the V11 stage, it decreased by 27% (from 375.1 cm2 in the control to 274.8 cm2 in WL) (Figure 2a,c). These results indicate that leaf expansion was most sensitive at the E stage, whereas the magnitude of the reduction decreased in later vegetative stages.
The trends in the number of leaves maintaining greenness differed by year (Figure 2b,d). In 2022, the largest reduction occurred at the VT stage, reducing by 66% (from 11.7 leaves in the control to 4.0 leaves in WL), with additional reductions at the V11 stage by 42% (from 13.3 leaves in the control to 7.7 leaves in WL), at the E stage by 38% (from 4.3 to 2.7), and at the V4 stage by 23% (from 7.3 to 5.7). In 2023, the largest reduction occurred at the V4 stage, decreasing by 48% (from 5.0 leaves in the control to 2.6 leaves in WL), and additional reductions were observed at the VT stage by 42% (from 9.0 leaves in the control to 5.25 leaves in WL), at the V11 stage by 35% (from 13.6 leaves in the control to 8.8 leaves in WL), and at the E stage by 30% (from 4.0 leaves in the control to 2.8 leaves in WL). Across both years, the absolute number of green leaves was highest at the V11 stage in the control plants. With the 14-day WL treatment, the number at the VT stage in 2023 was lower than when WL was applied at earlier developmental stages (E, V4, V11), indicating accelerated senescence around tasseling.
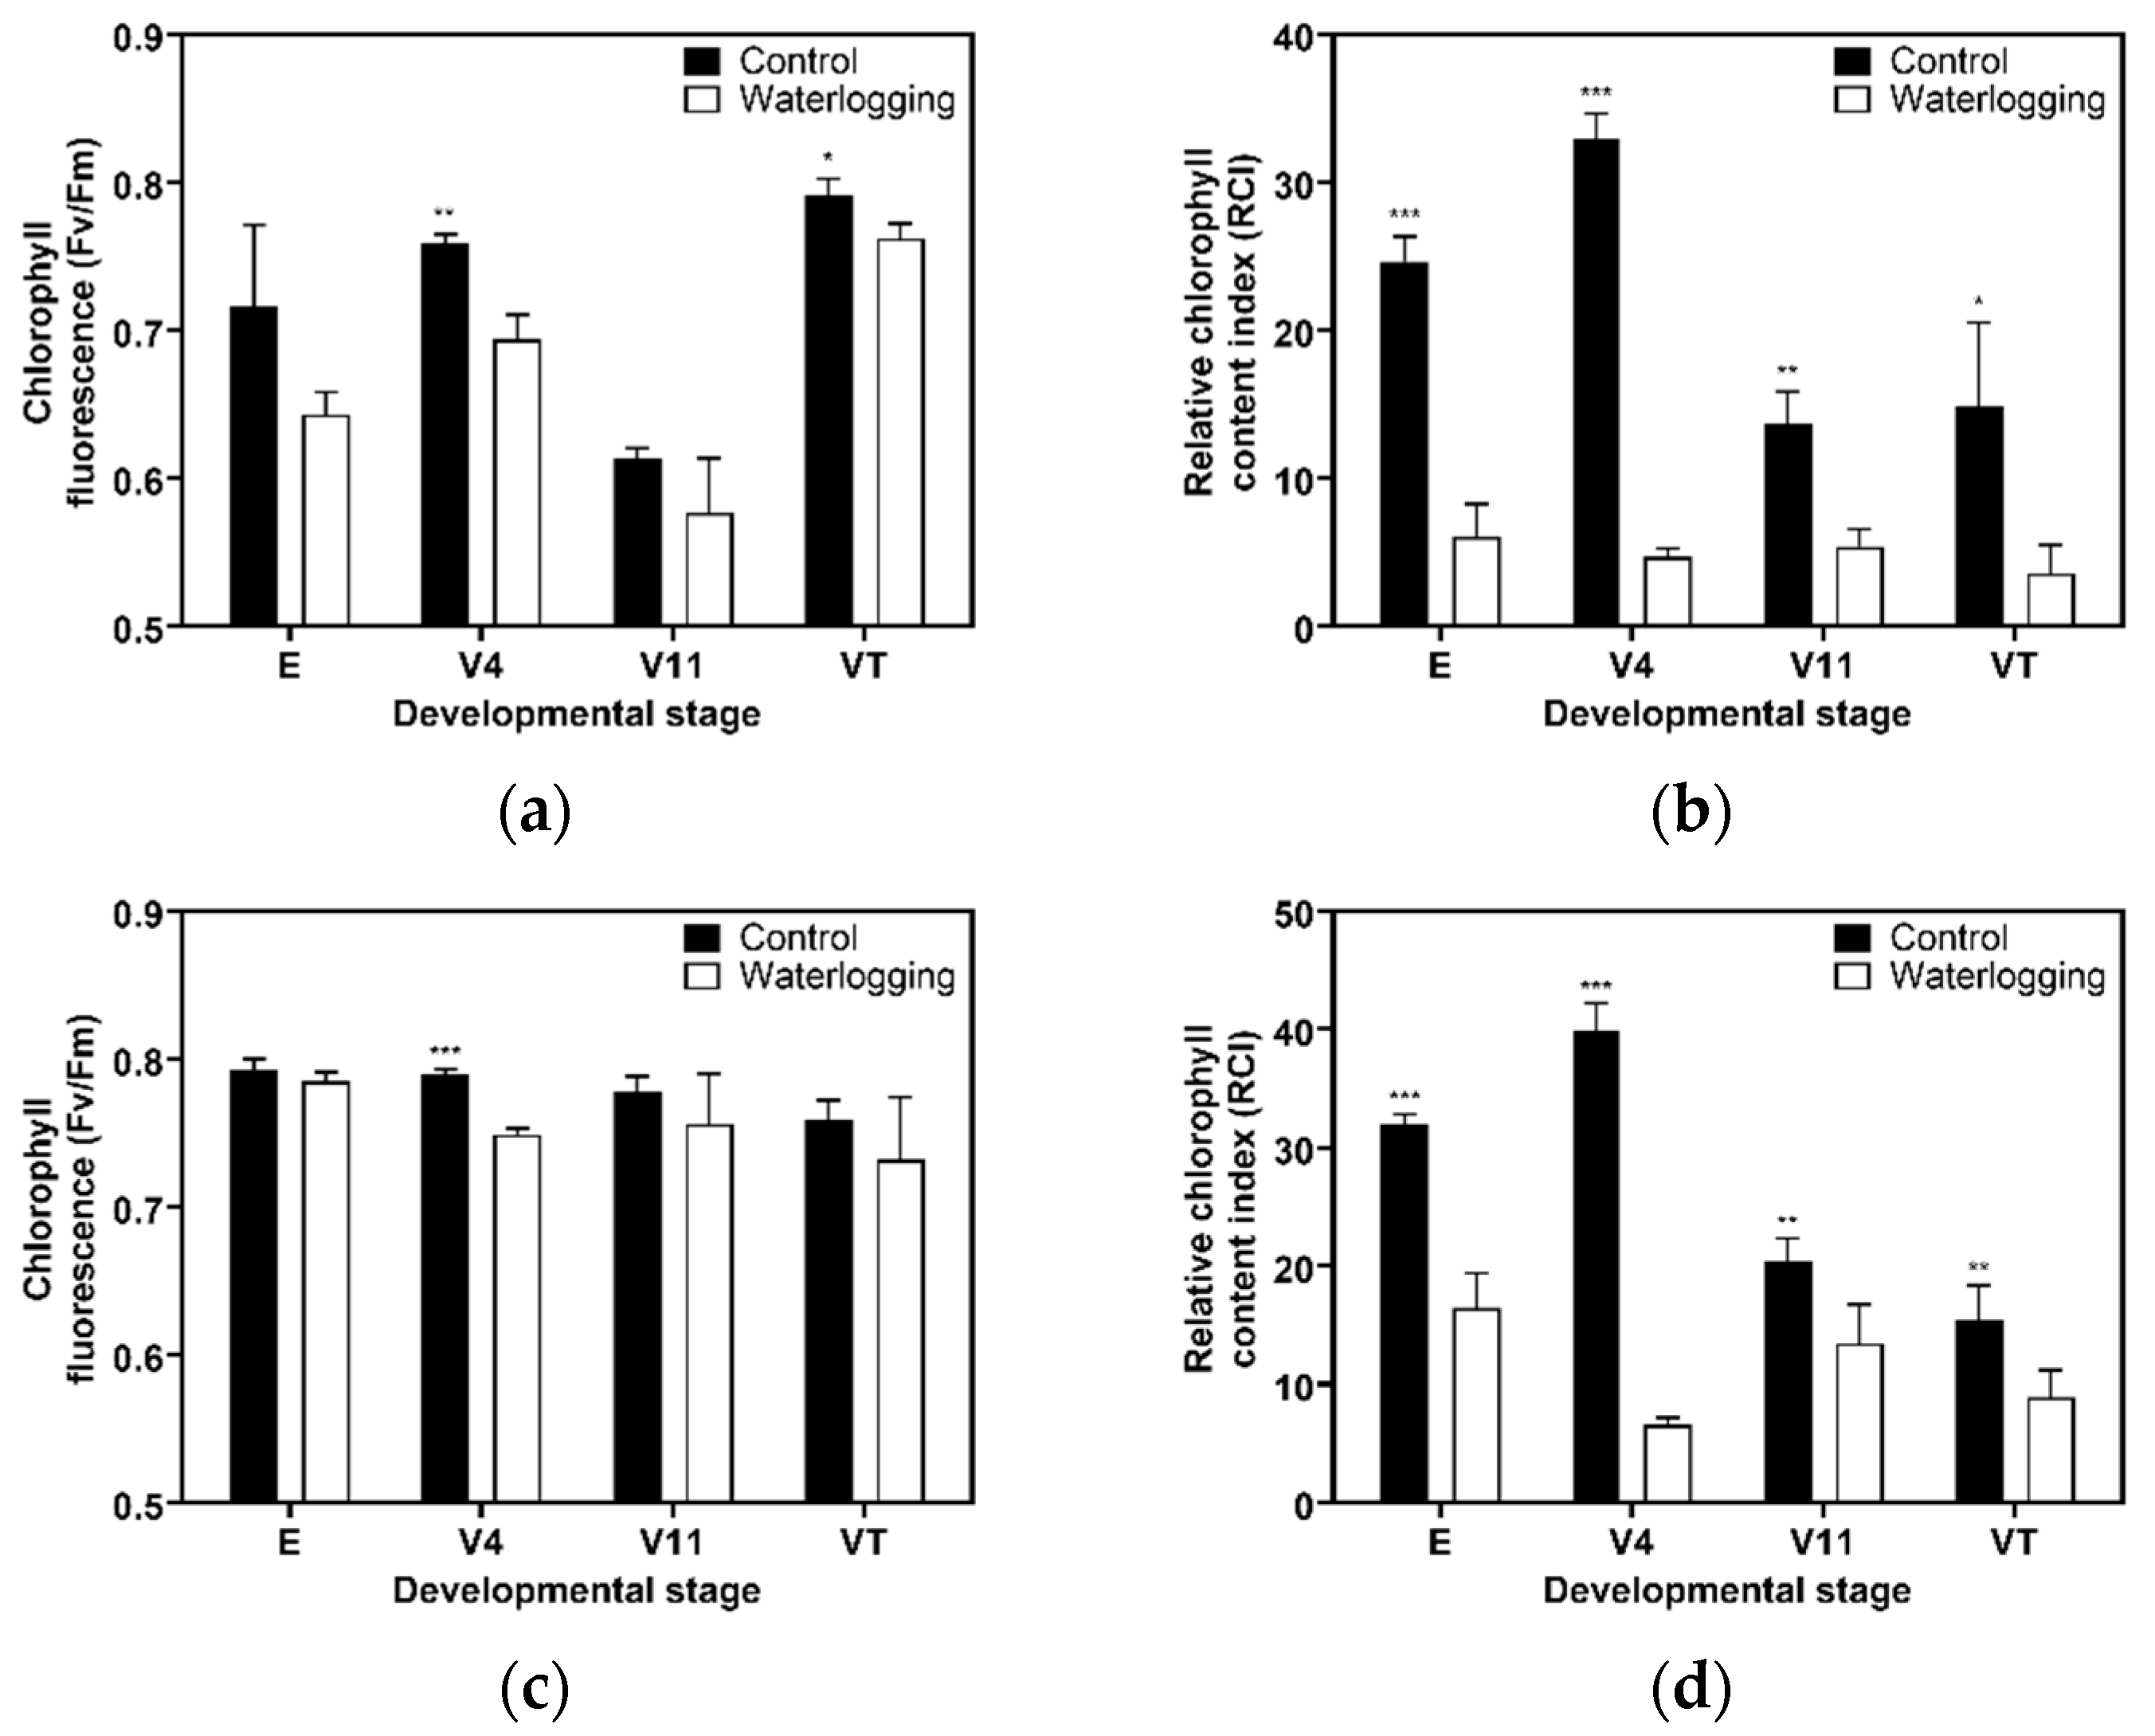
Chlorophyll fluorescence (Fv/Fm) and the relative chlorophyll content index (RCI) were measured in the most recently fully expanded leaves after the 14-day WL at each stage, comparing the control and WL plants within each stage and year (Figure 3). Fv/Fm decreased under WL at all stages. Based on the two-year mean, the largest decline occurred at the V4 stage, by 7% (from 0.774 in the control to 0.722 in WL) (Figure 3a,c). The RCI response followed the same stage pattern, with the greatest susceptibility at the V4 stage. Based on the two-year mean, the RCI decreased by approximately 85% (from 36.4 in the control to 5.6 in WL) (Figure 3b,d). These results indicate that both photochemical efficiency and leaf pigment status were most sensitive to WL at the V4 stage.

3.2. Aerenchyma Formation and ROS Accumulation in Roots Under Waterlogging

Root anatomical and morphological responses were assessed after the 14-day WL at each stage in 2023, comparing the control and WL plants within each stage (Figure 4). Lysigenous aerenchyma in the root cortex formed at all stages under WL. In 2023, the aerenchyma area under WL averaged 18.7% of the cortex, with the largest absolute value at the VT stage (22.0%). The strongest induction relative to the control occurred at the V4 stage, increasing 6.7-fold (from 2.9% in control to 17.3% in WL), followed by the E stage, increasing 5.9-fold (from 2.6% in control to 17.8% in WL) (Figure 4b).
The greatest increase in adventitious roots was observed at the V11 stage, rising by 81% (from 44.8 in the control to 81.2 in WL) (Figure 4c). In contrast, at the E stage, adventitious roots were not detected under WL, and the total root number decreased by 12% (from 23.4 in the control to 20.6 in WL), consistent with injury to the initial root system. Taken together, these results support a stage-dependent strategy: at early stages (E, V4), plants primarily maintain internal aeration through aerenchyma formation, whereas at later stages (V11, VT), acclimation increasingly relies on adventitious root development.
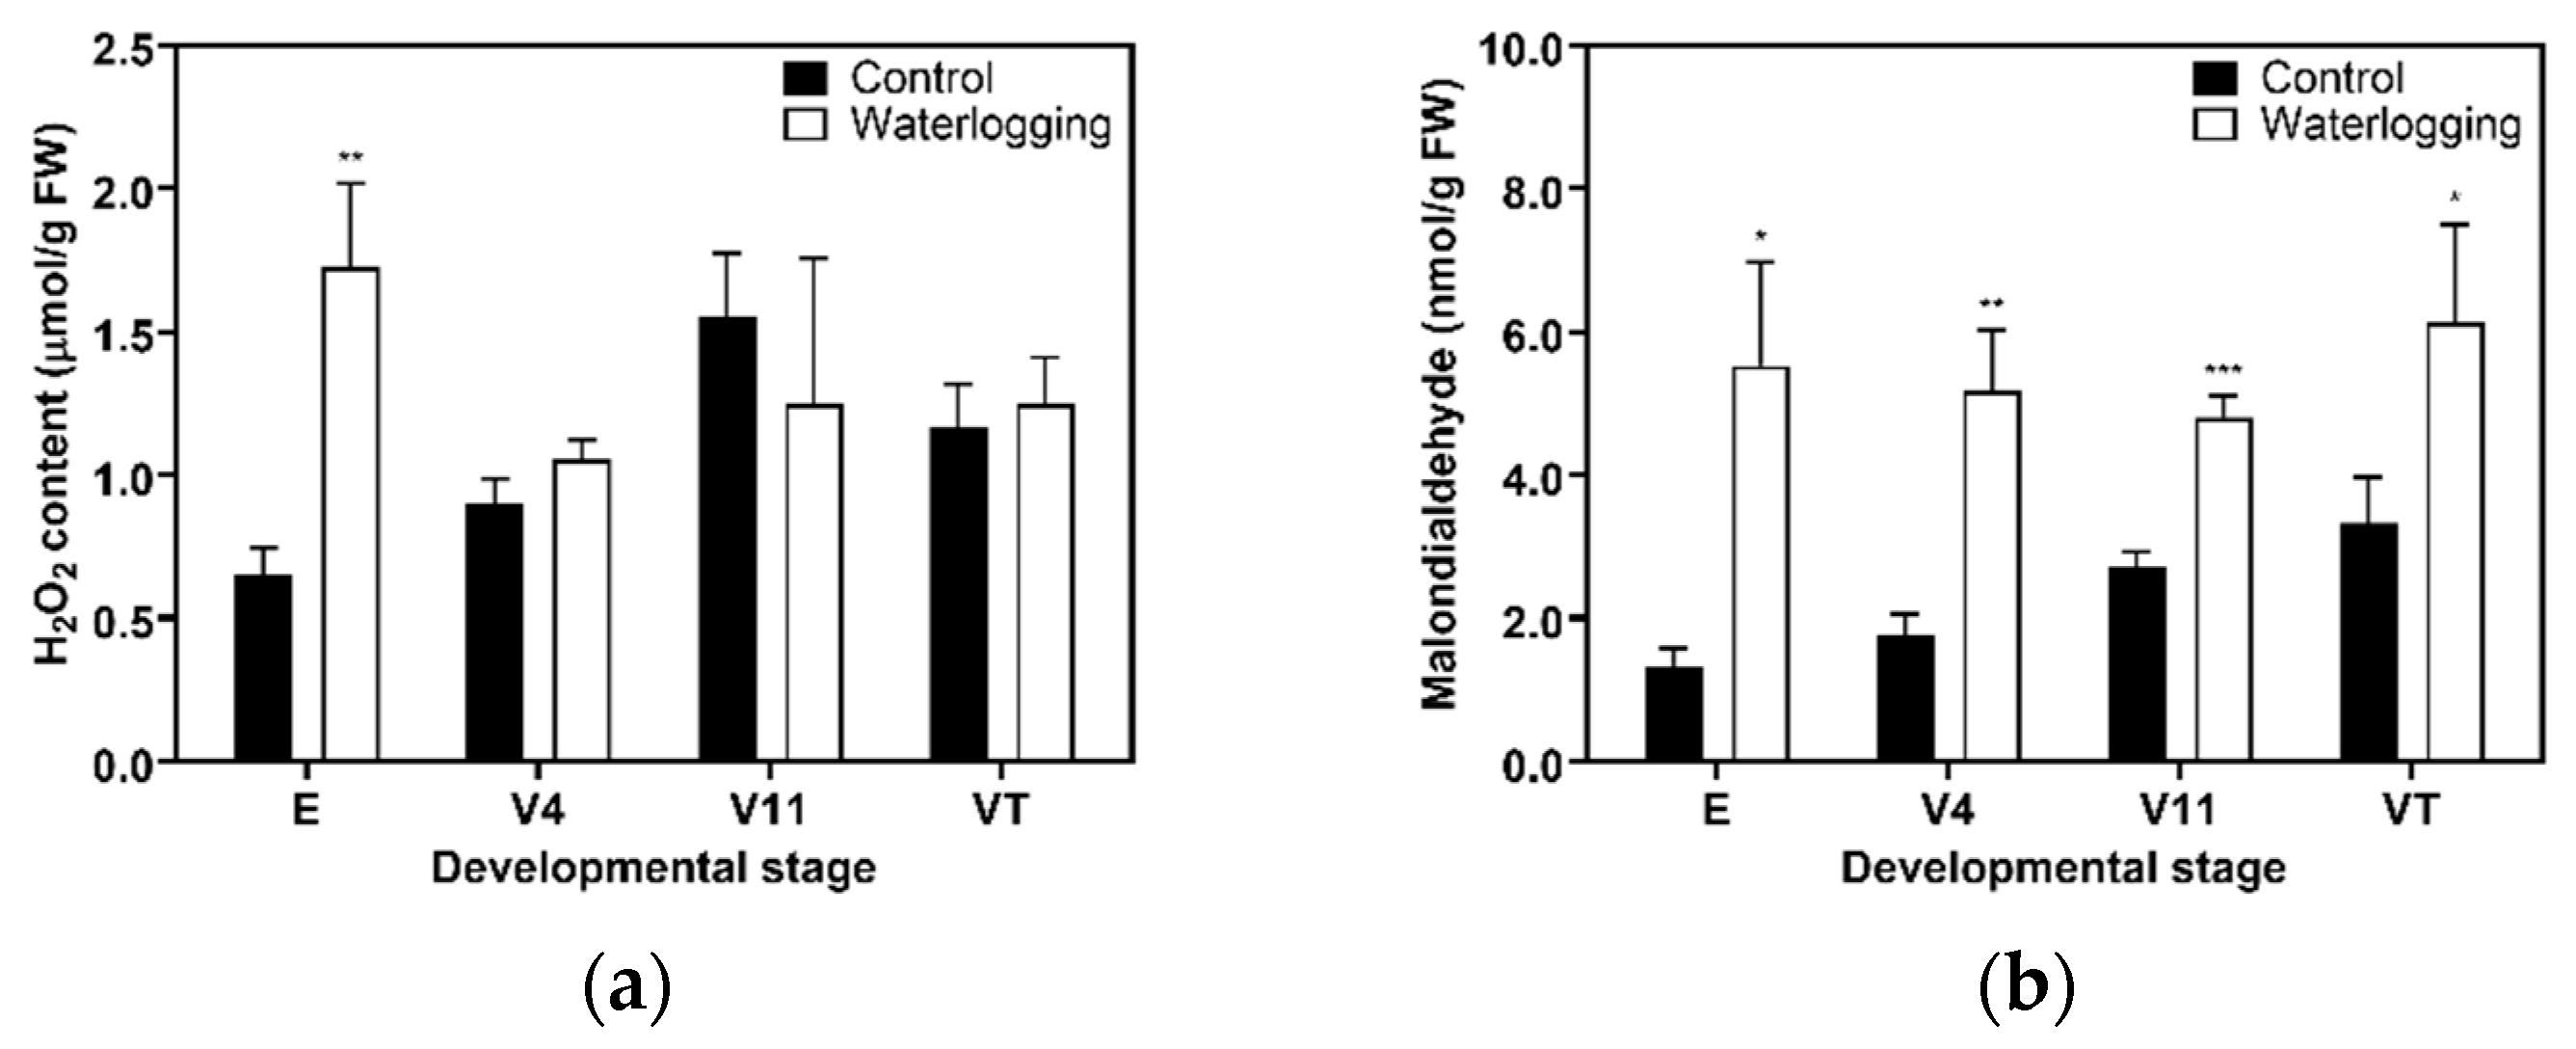
Root oxidative status was assessed via hydrogen peroxide (H2O2) and malondialdehyde (MDA), a lipid peroxidation marker, in 2023 (Figure 5). WL significantly increased H2O2 at the E stage, rising 2.6-fold (from 0.653 µmol g−1 FW in the control to 1.725 µmol g−1 FW in WL). At the V4 and VT stages, the means under WL were greater than under the control, but the differences were not significant. At V4, the difference in the means between the WL and control plants showed a trend toward higher H2O2 under WL (p = 0.0786). At the V11 stage, H2O2 was lower under WL by 20% (from 1.552 µmol g−1 FW in the control to 1.247 µmol g−1 FW in WL) (Figure 5a).
MDA increased under WL at all stages. The largest fold increases were observed at the E stage, 4.1-fold (from 1.336 nmol g−1 FW in control to 5.525 nmol g−1 FW in WL), and at the V4 stage, 2.9-fold (from 1.759 nmol g−1 FW in control to 5.175 nmol g−1 FW in WL). The highest absolute level occurred at the VT stage (from 3.327 nmol g−1 FW in the control to 6.141 nmol g−1 FW in WL) (Figure 5b). Taken together, these results indicate strong oxidative signaling and lipid peroxidation under WL at early developmental stages (E and V4), with high absolute peroxidation at the VT stage.

3.3. Expression Analysis of Selected Genes Using Real-Time PCR

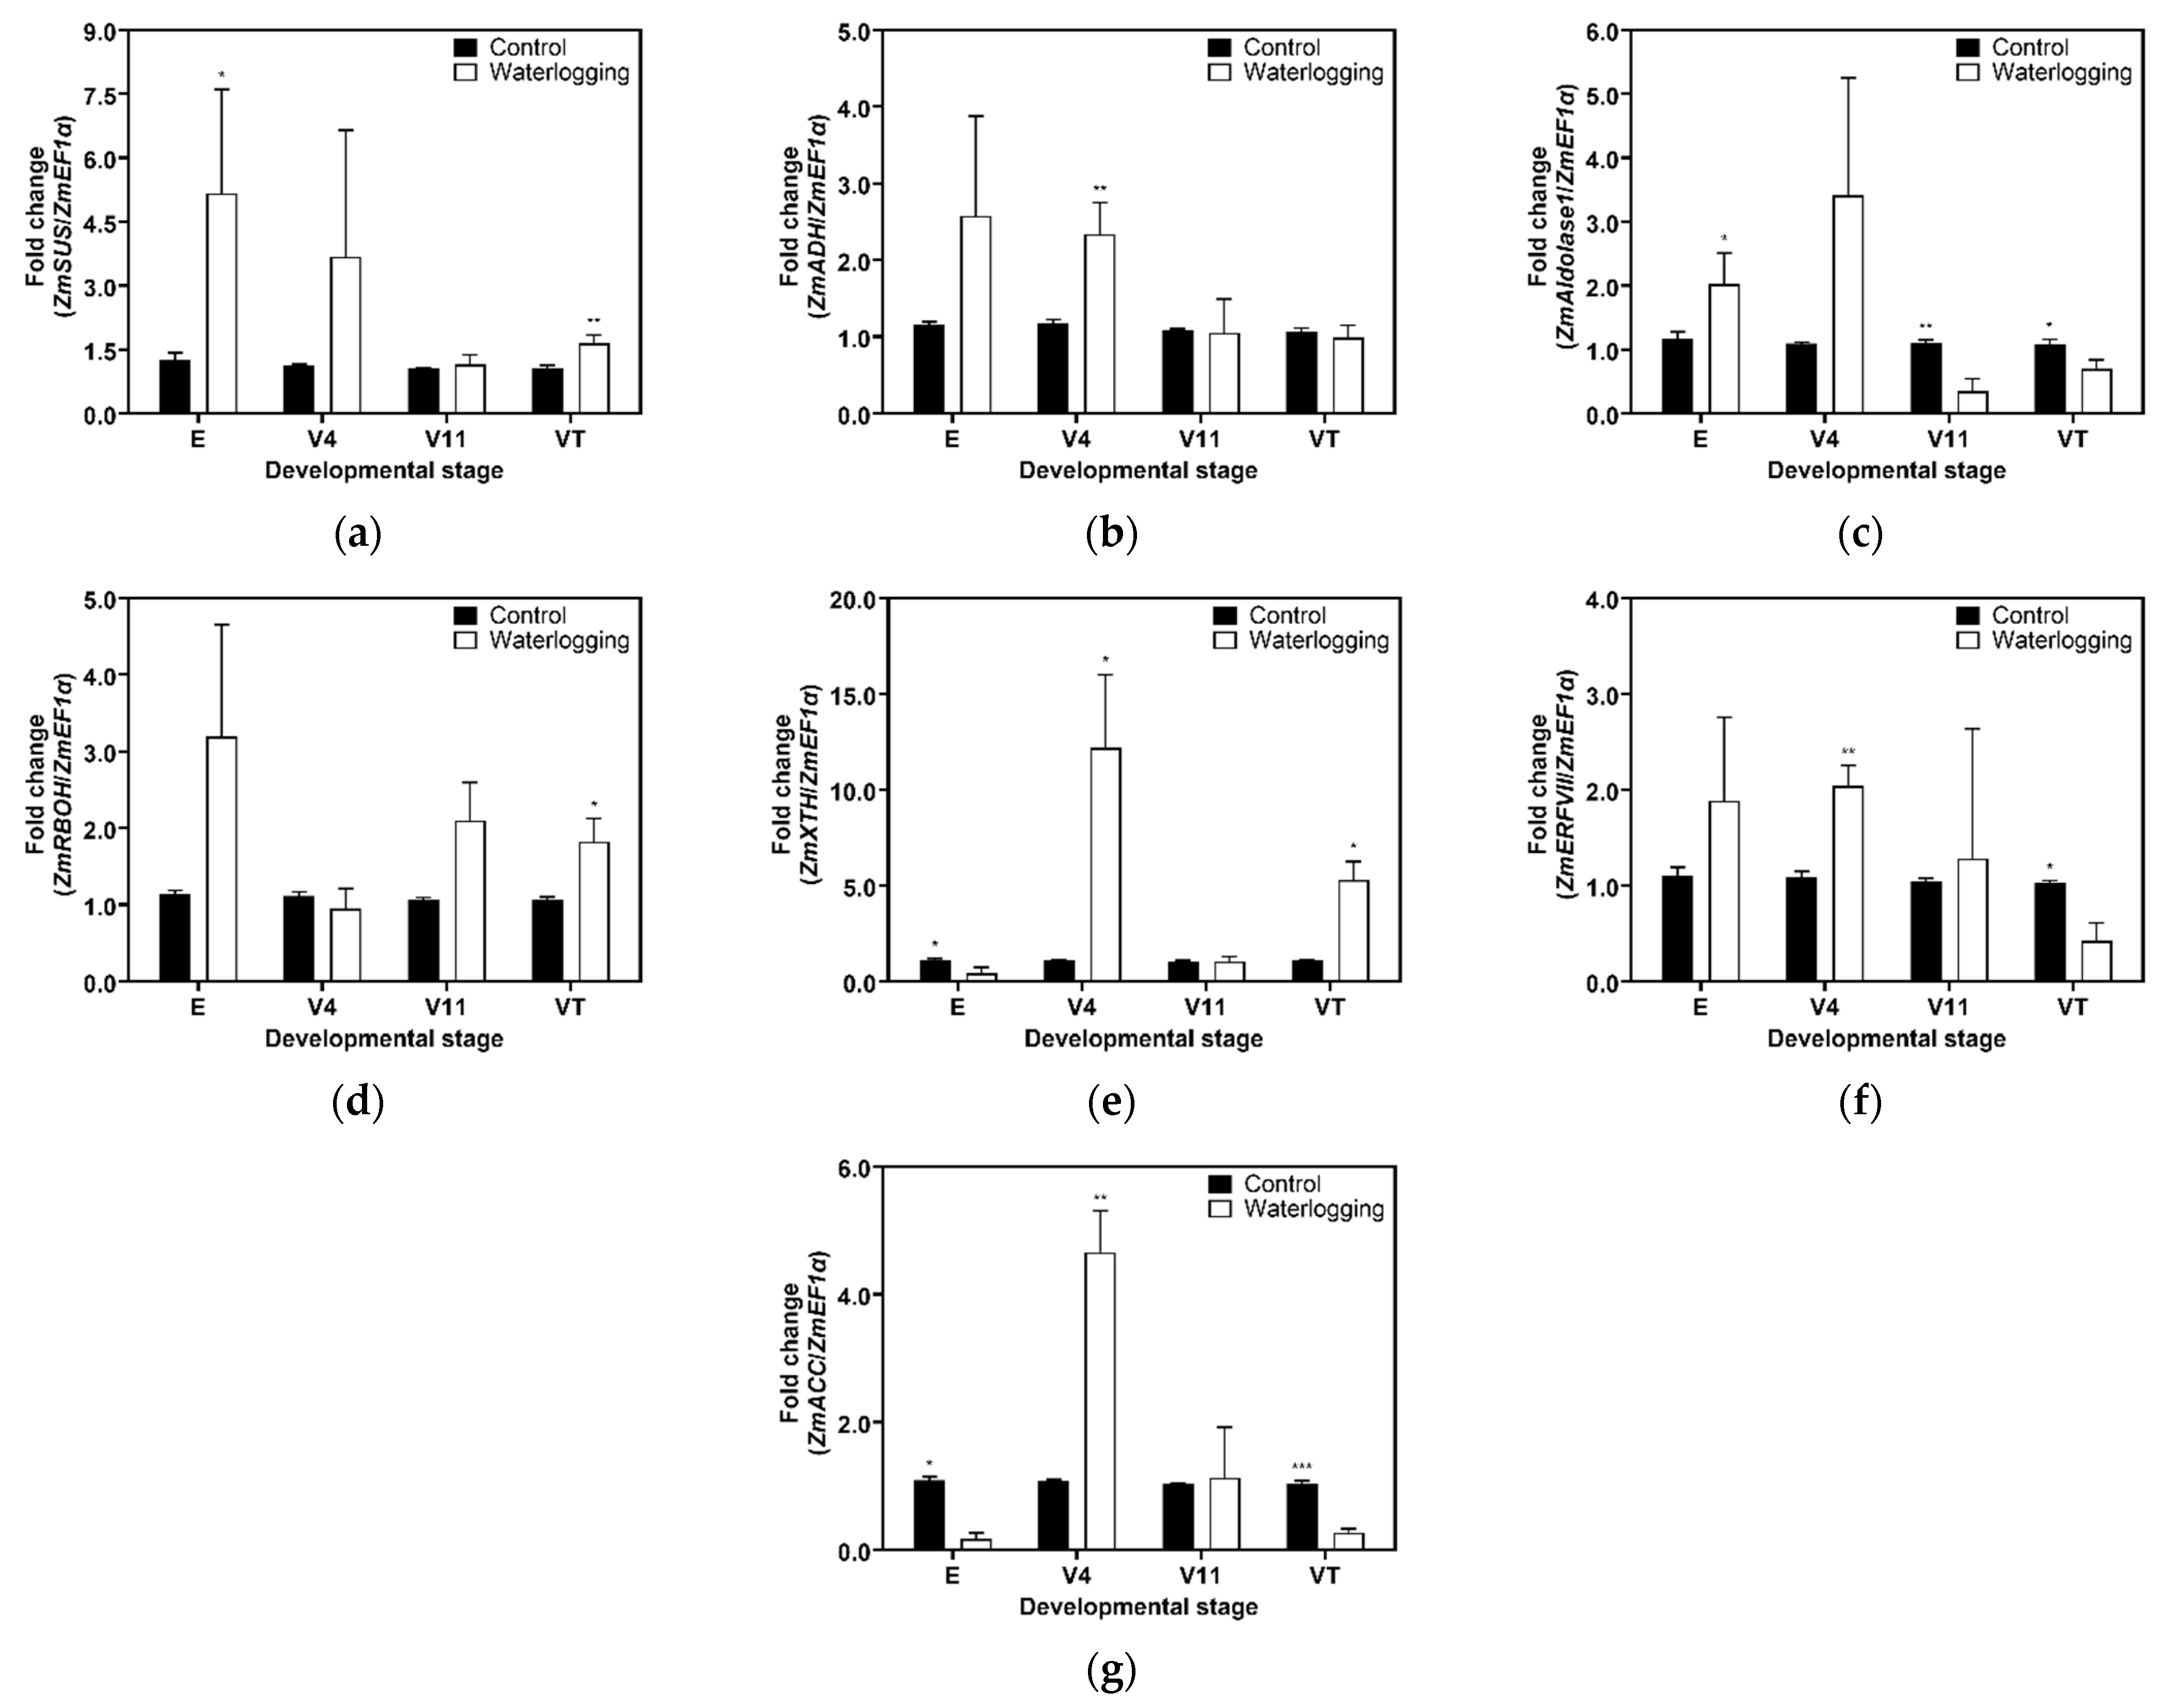
The transcript levels of selected WL-responsive genes were quantified within each stage after a 14-day WL treatment (Figure 6). The genes were classified by physiological process into three groups, namely, energy metabolism, programmed cell death and aerenchyma formation, and ethylene synthesis and ethylene signaling.
First, we analyzed the mRNA expression levels of energy metabolism genes, including sucrose synthase (SUS), alcohol dehydrogenase (ADH), and aldolase1 (Figure 6a–c). SUS increased at the E and VT stages, with a significant induction at the E stage, of about 4.1-fold, and a smaller rise at the VT stage, of about 1.6-fold; it also increased at the V4 stage by about 3.3-fold. ADH increased at the E and V4 stages, with a significant increase at the V4 stage of about 2.0-fold, whereas its expression decreased at the V11 and VT stages. Aldolase1 increased at the E and V4 stages, including a significant increase at the E stage, of about 1.7-fold, and the V4 stage, of about 3.1-fold; it decreased at the V11 and VT stages by about 62% and 36% relative to the control.
We also examined changes in the expression of genes associated with programmed cell death and aerenchyma formation, specifically respiratory burst oxidase homolog (RBOH) and Xyloglucan endotransglycosylase/hydrolase (XTH) (Figure 6d,e). RBOH increased at most stages, with larger inductions at the E stage, of about 2.8-fold, and at the VT stage, of about 1.7-fold, whereas it was about 15% lower than the control at the V4 stage. XTH was strongly activated at the V4 stage, at about 11.1-fold, and at the VT stage, at about 4.9-fold, while its expression at the E stage decreased by about 62% and changed little at the V11 stage.
The expression changes in genes involved in ethylene signaling, group VII ethylene response factor (ERFVII), are shown in Figure 6f. ERFVII increased significantly at the V4 stage by 1.8-fold under 14-day WL. At the E and V11 stage, the expression of ERFVII also increased by 1.7-fold and 1.2-fold, respectively, but the differences were not significant. At the VT stage, the expression of ERFVII decreased significantly by about 59% under 14-day WL. The expression of Acetyl-CoA carboxylase (ACC), which catalyzes the first committed step of fatty acid biosynthesis, significantly increased by 4.3-fold at the V4 stage compared to the control and by an average of 1.1 times at the V11 stage (Figure 6g).
Taken together, the data indicate stage-specific transcription under WL such that at the V4 stage, energy metabolism genes (SUS, ADH, aldolase1) and ethylene pathway genes (ERFVII) are coordinately upregulated together with XTH, whereas at the VT stage, RBOH and XTH remain elevated while several energy metabolism transcripts are reduced.

3.4. Agronomic Characteristics, Yield, and Forage Quality Change Under Waterlogging

The effects of 14-day WL on agronomic traits and biomass are summarized in Table 2. Based on the two-year mean, plant height was lower when WL was applied during vegetative development, decreasing from 224.7 cm in the control to 206.1 cm at the E stage, 195.25 cm at the V4 stage, and 190.35 cm at the V11 stage. However, the height of 235.0 cm at the VT stage under WL was comparable to that of the control. Ear height showed the largest decreases at the early stages and varied by year. In 2022, ear height decreased from 95.5 cm in the control to 82.0 cm under WL at the E stage. In 2023, ear height decreased from 100.3 cm in the control to 83.2 cm at the V4 stage and to 87.8 cm at the E stage. Stem diameter also declined with early WL. In 2022, the values decreased from 21.35 mm in the control to 18.10 mm at the E stage, and the smallest diameter of 15.12 mm was recorded at V4. In 2023, the diameter decreased from 22.84 mm in the control to 15.74 mm at the E stage, and it remained lower at V4, measuring 19.95 mm.
Total dry matter was reduced by WL across stages in both years, with the greatest losses at V4. In 2022, the totals decreased from 234.80 g plant−1 in the control to 139.07 g plant−1 at V4, and the totals were also lower at E, measuring 179.87 g plant−1, and V11, measuring 157.00 g plant−1, under WL. In 2023, the totals decreased from 367.76 g plant−1 in the control to 151.77 g plant−1 at V4, and the values were lower at E, measuring 161.98 g plant−1, V11, measuring 157.25 g plant−1, and VT, measuring 189.69 g plant−1, under WL. Ear dry matter was most affected around the transition to reproduction. In 2022, the values decreased from 80.36 g plant−1 in the control to 3.87 g plant−1 at VT under WL. In 2023, the lowest ear biomass occurred at V11, decreasing from 113.78 g plant−1 in the control to 1.24 g plant−1 under WL.
Across the two seasons, 14-day WL at the V4 stage produced the largest reduction in total dry matter at harvest. Plant height was most affected when stress occurred during the early to mid-vegetative stages (E, V4, V11), with smaller effects at VT. Ear dry matter was most vulnerable near the onset of reproduction, with the greatest losses when waterlogging occurred between V11 and VT.
The feed value traits exhibited clear stage- and year-dependent responses to WL (Table 3). Crude protein (CP) was depressed at the E stage in both years, from 4.90% in the control to 3.54% in WL in 2022, and from 3.84% in the control to 3.49% in WL in 2023. At later stages, CP was maintained or elevated, with the following increases in 2023: at V11 to 5.06% and at VT from 3.84% in the control to 5.04% in WL. Crude fat (CF) declined consistently under WL across stages; for example, it declined from 1.60% in the control to 1.12% at E, 1.04% at V4, and 1.02% at VT in 2022, and it declined from 1.92% in the control to 1.34% at E and 1.62% at V4 in 2023.
Structural carbohydrate fractions were uniformly elevated under WL. ADF and NDF increased at every stage, attaining their highest values at VT. In 2022, ADF increased from 37.74% in the control to 42.99% at VT, and NDF increased from 62.46% in the control to 70.05% at VT. In 2023, ADF increased from 37.34% in the control to 44.65% at VT, and NDF increased from 63.12% in the control to 69.67% at VT. TDN and RFV showed concomitant declines, with minima at VT in both years; for example, TDN was 53.63% and RFV was 72.25 in 2023, each below the corresponding controls.
NFC decreased under WL, with stronger reductions at later stages. The lowest NFC occurred at VT in both years, from 26.8% in the control to 19.5% in 2022 and from 26.7% in the control to 18.4% in 2023. The next lowest values were at V11 (22.8% in 2022 and 18.6% in 2023). Crude ash (CA) varied modestly with comparatively small, stage-specific shifts.
Taken together, WL shifted forage quality toward higher ADF and NDF and lower NFC, with the strongest quality penalties at VT. WL reduced CP at the E stage in both years, whereas, at later stages in 2023, CP was maintained or enhanced, and CF declined broadly across stages.

4. Discussion

4.1. Developmental Stage-Specific Sensitivity to 14 Days of Prolonged Waterlogging

Plants at earlier developmental stages generally show greater vulnerability to abiotic stress, and inhibition at these stages directly reduces yield [47]. Consistent with this principle, our results indicate that prolonged 14-day WL during the early vegetative phase, particularly at the V4 stage, imposes the strongest negative effects on shoot growth. In contrast, at the VT stage, visible shoot injury is comparatively limited, but root biomass is markedly reduced based on the two-year mean (Figure 1). During reproductive growth, assimilates are prioritized for sink development [48], and under hypoxia in chemically reduced soils, root dysfunction is unlikely to recover quickly [49]. This provides a mechanistic basis for the disproportionate root effects at the VT stage relative to earlier stages.
Waterlogging also negatively affected photosynthetic capacity. It reduces leaf area by inhibiting leaf formation and accelerating the senescence of immature leaves [50] and decreases photochemical efficiency and chlorophyll status (RCI) [51,52]. In our study, leaves that emerged and matured during the 14-day treatment were most affected at the E and V4 stages, with sensitivity diminishing toward the V11 stage (Figure 2). This stage pattern is consistent with previous reports that identify the V3 stage as a particularly sensitive phase to waterlogging in maize [53]. In contrast, under 14-day WL, the number of leaves retaining greenness was most sensitive at the VT stage (Figure 2b,d). This pattern is consistent with the findings of previous reports on wheat, barley, and field pea, which indicate that older leaves formed before waterlogging do not recover chlorophyll status through to physiological maturity, suggesting accelerated senescence under waterlogging [54]. Prolonged waterlogging accelerates senescence in older leaves, which reduces green leaf area and light interception [53]. Once the crop enters the reproductive phase, the canopy stops expanding, and nitrogen and carbon are moved from aging leaves to developing kernels, which intensifies the observed responses [48,55].
The greatest reductions in Fv/Fm and the RCI were observed under 14-day WL at the V4 stage (Figure 3), which corresponds with the developmental stage of active leaf differentiation and organogenesis (approximately V3 to V5) [32,56]. This explains the strong vulnerability at V4 and is consistent with studies showing greater injury from short waterlogging near V2 to V3 [53,57,58].
We also noted that during July and August, the control RCI at the V11 and VT stages was lower than at earlier stages, plausibly reflecting seasonal heat. Although our experiment did not test heat × waterlogging interactions, the waterlogging-induced reductions in the RCI at the V11 and VT stages were smaller than at the E and V4 stages (Figure 3), which, together with reports of waterlogging-induced heat-shock responses in maize [59] and partial alleviation of heat injury in rice [60], suggests that background thermal conditions can modulate the apparent severity of waterlogging. Given projected increases in summer rainfall, the interaction between heat and waterlogging warrants targeted study in forage maize production systems.

4.2. Morpho-Physiological Changes in Forage Maize Roots Under 14 Days of Prolonged Waterlogging at Different Developmental Stages

The forage maize root aeration capacity was adjusted in a stage-dependent manner at the early stages (E and V4). Lysigenous aerenchyma formation in the root cortex was prominent under 14-day WL, whereas at later stages (V11 and VT), the plants increasingly relied on the development of functional adventitious roots (Figure 4). This pattern supports a strategy in which internal aeration is maintained primarily by aerenchyma early, with a shift toward adventitious rooting as development proceeds. This developmental shift is consistent with established models in which aerenchyma promotes gas diffusion under hypoxia and adventitious roots facilitate oxygen supply and nutrient uptake under prolonged soil saturation [24,61].
The root redox status was consistent with these morphological responses. H2O2 increased significantly at the E stage and showed a trend toward higher values at the V4 stage (p = 0.0786). At the VT stage, the mean was numerically higher, but without statistical significance, and at the V11 stage, it was lower than the control (Figure 5a). MDA increased under 14-day WL across stages, with the largest fold increases at the E and V4 stages and with the highest absolute level at the VT stage (Figure 5b). Taken together, these data indicate strong oxidative signaling and lipid peroxidation at early stages, and a high peroxidation burden around tasseling even when shoot-level symptoms are limited.
First, we analyzed energy metabolism genes involved in glycolysis and ethanolic fermentation, including sucrose synthase (SUS), alcohol dehydrogenase (ADH), and aldolase1 (Figure 6a–c). Induction was greatest at the E and V4 stages, whereas several of these transcripts were reduced at the V11 and VT stages. This pattern is consistent with the known up-regulation of glycolysis and fermentation under hypoxia in maize roots [22]. We next examined genes associated with programmed cell death and aerenchyma formation, specifically respiratory burst oxidase homolog (RBOH) and xyloglucan endotransglycosylase/hydrolase (XTH) (Figure 6d,e). RBOH was elevated at the E and VT stages, and XTH was strongly induced at the V4 stage and remained elevated at the VT stage, which is in accordance with the ROS burst–PCD–cell-wall remodeling framework for lysigenous aerenchyma [24]. Finally, we assessed signaling genes, group VII ethylene response factor (ERFVII) (Figure 6f). ERFVII increased at the V4 stage and decreased at the VT stage, consistent with the ethylene module’s role in low-oxygen signaling and aerenchyma development [62]. Overall, the V4 stage shows coordinated increases, spanning energy metabolism, the ethylene pathway, and aerenchyma-linked wall remodeling, whereas at the VT stage, aerenchyma-linked components remain high while multiple energy pathway transcripts are reduced. This coherence between morphology, redox status, and transcript profiles supports a shift from aerenchyma-centered acclimation early to adventitious-root-centered acclimation later, aligning with assimilate reallocation during reproduction and the susceptibility of roots in chemically reduced soils [48,49]. We did not assay antioxidant enzyme activities, such as SOD, CAT, POD, and APX. We acknowledge this limited methodological scope and note that pairing ROS and MDA with these enzyme assays would help resolve stage-specific redox dynamics in future work.

4.3. Changes in Agronomic Traits at the Harvest Stage Following Prolonged Waterlogging at Different Developmental Stages

Over the two years, the plants exposed to 14-day WL during early vegetative development did not fully recover to the control levels by harvest time (Table 2). Reductions in ear height were disproportionately large when 14-day WL was applied at emergence or V4, exceeding the concurrent reductions in plant height. This contrasts with the general positive association between plant and ear height reported in genetic and hybrid studies [63,64]; however, it agrees with the effects of flooding at V6, which depressed ear height more than plant height [65]. These converging observations suggest that developmental processes that determine ear position are especially sensitive to early-season waterlogging.
Total dry matter was most severely reduced when 14-day WL was applied at the V4 stage, indicating this stage as the critical developmental stage for whole-plant productivity in forage maize. This pattern agrees with the developmental context, in which rapid expansion and organ differentiation occur before the post-V6 transition [56], and with reports that above-ground biomass losses under prolonged flooding peak between V3 and V6 [30]. Our physiological measurements align with this interpretation. Fv/Fm and the RCI declined most at V4, indicating impaired photochemistry and pigment status during the interval when canopy construction drives biomass accumulation (Figure 3). Taken together, the V4 stage represents the main leverage point for protecting total dry matter in forage systems.
The reproductive outcomes were most vulnerable around the transition from V11 to VT. Ear dry matter declined markedly when 14-day WL was applied in this interval. In 2023, when 14-day WL was applied at the V11 stage, we observed reproductive abnormalities, including failure of some plants to develop normal tassels or to shed pollen, an average 2-day increase in the anthesis-to-silking interval relative to the control, and the absence of silking in a subset of plants. These observations are consistent with impaired pollination under saturated, chemically reduced soils [66].
The feed value responses to prolonged 14-day WL were stage-dependent and most pronounced at VT (Table 3). The application of 14-day WL increased ADF and NDF at all stages, with the largest elevations at VT, and TDN and RFV were lowest at VT. When 14-day WL was applied near tasseling, the harvested forage shifted toward higher structural fiber and lower energy, reducing the feed value at harvest. NFC likewise decreased under 14-day WL and was most depressed at VT. In our dataset, this VT response coincided with a sharp loss of canopy greenness, reflected by fewer green leaves (Figure 2b,d), and with the highest absolute MDA in roots (Figure 5b), indicating accelerated senescence and constrained current assimilate supply during reproduction. Root dry matter also showed the largest reduction at VT on the two-year mean (Figure 1c,f), consistent with impaired below-ground function. Although this evidence comes from other species, studies in perennial ryegrass [67], soybean [68], and Arundinella anomala [69] showed that waterlogging can deplete shoot water-soluble carbohydrates through accelerated senescence and greater respiratory and fermentative sugar use. In our study, NFC at the VT stage likewise declined under waterlogging. At the same time, ADF and NDF increased at VT, and, because TDN is derived from these fiber fractions, TDN was lower. Overall, these observations are consistent with a mechanism whereby prolonged waterlogging near tasseling hastens senescence and draws down soluble carbohydrate pools, which reduces NFC and lowers forage energy (TDN) at harvest by increasing the relative contribution of structural fiber.

5. Conclusions

We imposed 14-day WL on forage maize at four developmental stages (E, V4, V11, and VT) under outdoor conditions and evaluated agronomic characteristics, feed values, and physiological and biochemical responses. Over two years, sensitivity to 14-day WL clearly depended on the stage. Shoot growth and total dry matter were most severely decreased when 14-day WL was applied at the V4 stage, with smaller but detectable losses at the E and V11 stages. Fv/Fm and the RCI were also negatively affected by 14-day WL at the V4 stage, whereas leaf expansion was most constrained at the E stage. Root biomass demonstrated its largest reduction at VT, indicating substantial below-ground impairment during reproduction.
The patterns of root acclimation varied with the developmental stage. At the E and V4 stages, the plants chiefly increased lysigenous aerenchyma, whereas at the V11 and VT stages, they relied more on functional adventitious roots. The redox profile supported this pattern, with relatively high H2O2 and MDA responses under 14-day WL compared with the control at the E and V4 stages and the highest absolute MDA level at the VT stage. The transcript data were consistent with these trends. At the V4 stage, SUS, ADH, aldolase1, ACS, ERFVII, and XTH were coordinately upregulated under 14-day WL, while at the VT stage, RBOH and XTH remained elevated, and several energy metabolism transcripts declined.
The feed value responses were stage-dependent and most pronounced at VT. The application of 14-day WL increased ADF and NDF and decreased TDN and RFV. NFC was lowest at VT, indicating reduced rapidly fermentable carbohydrate availability for ensiling and a potential risk of poorer fermentation quality. Thus, for forage production, the V4 stage is the primary leverage point to protect total dry matter, and the VT window is critical to preserve feed values and fermentation potential.
These results provide stage-resolved targets for management under intensifying rainfall regimes. Practices that prevent or shorten 14-day WL at V4 while improving drainage and plant aeration between V11 and VT are expected to minimize yield loss and maintain the energy density of the harvested crop. The integrated physiological and molecular evidence presented herein offers a basis for breeding and management strategies aimed at improving 14-day WL resilience in forage maize.

Supplementary Materials

The following supporting information can be downloaded at: https://www.mdpi.com/article/10.3390/agronomy15102389/s1, Figure S1. Changes in mean air temperature, soil moisture of the control pot, and precipitation during the waterlogging experiment: a, mean air temperature in 2022; b, soil moisture of the control pot in 2022; c, precipitation in 2022; d, mean air temperature in 2023; e, soil moisture of the control pot in 2023; f, precipitation in 2023.

Author Contributions

Conceptualization, C.-W.M. and B.-H.L.; data curation, C.-W.M. and B.-H.L.; formal analysis, C.-W.M.; investigation, C.-W.M., I.-K.Y., M.-J.K., and J.-S.J.; methodology, C.-W.M., I.-K.Y., and M.-J.K.; project administration, B.-H.L.; supervision, B.-H.L.; validation, C.-W.M. and B.-H.L.; visualization, C.-W.M., I.-K.Y., and M.-J.K.; writing—original draft preparation, C.-W.M.; writing—review and editing, M.A.R. and B.-H.L. All authors have read and agreed to the published version of the manuscript.

Funding

This work was carried out with the support of “Cooperative Research Program for Agriculture Science and Technology Development (Project title: A survey on suitable agro-climate zones and productivity change of forage under climate condition, and assessing impact and vulnerability of forage to climate condition, Project No. RS-2020-RD009412)”, Rural Development Administration, Republic of Korea.

Data Availability Statement

The raw data supporting the conclusions of this article will be made available by the authors upon request.

Conflicts of Interest

The authors declare no conflicts of interest.

Abbreviations

The following abbreviations are used in this manuscript:
ACSAcetyl-CoA carboxylase
ADFAcid detergent fiber
ADHAlcohol dehydrogenase
CACrude ash
CFCrude fat
CPCrude protein
CtrlControl
EEmergence stage
EF1αElongation factor 1-alpha
ERFVIIEthylene-response element binding protein
Fv/FmChlorophyll fluorescence
HSPHeat shock protein
MDAMalondialdehyde
NDFNeutral detergent fiber
NFCNon-fiber carbohydrate
RBOHRespiratory burst oxidase homolog
RCIRelative chlorophyll content index
RFVRelative feed value
ROSReactive oxygen species
SUSSucrose synthase
TDNsTotal digestible nutrients
V11Eleven-leaf stage
V4Four-leaf stage
VTTasseling stage
WLWaterlogging
XTHXyloglucan endotransglycosylase/hydrolase
ZmZea mays

References

  1. Gwirtz, J.A.; Garcia-Casal, M.N. Processing maize flour and corn meal food products. Ann. N. Y. Acad. Sci. 2014, 1312, 66–75. [Google Scholar] [CrossRef]
  2. Amaral-Phillips, D.M.; Roy, N.; Lee, C.; Lehmkuhler, J. Practical Corn Silage Harvest and Storage Guide for Cattle Producers; University of Kentucky Cooperative Extension Service: Lexington, KY, USA, 2023; pp. 1–16. [Google Scholar]
  3. Karnatam, K.S.; Mythri, B.; Un Nisa, W.; Sharma, H.; Meena, T.K.; Rana, P.; Vikal, Y.; Gowda, M.; Dhillon, B.S.; Sandhu, S. Silage maize as a potent candidate for sustainable animal husbandry development—Perspectives and strategies for genetic enhancement. Front. Genet. 2023, 14, 1150132. [Google Scholar] [CrossRef]
  4. Allen, M.S.; Coors, J.G.; Roth, G.W. Corn Silage. In Silage Science and Technology; Buxton, D.R., Muck, R.E., Harrison, J.H., Eds.; American Society of Agronomy: Madison, WI, USA, 2003; pp. 547–608. [Google Scholar]
  5. Roux, N.; Kaufmann, L.; Bhan, M.; Le Noe, J.; Matej, S.; Laroche, P.; Kastner, T.; Bondeau, A.; Haberl, H.; Erb, K. Embodied HANPP of feed and animal products: Tracing pressure on ecosystems along trilateral livestock supply chains 1986–2013. Sci. Total Environ. 2022, 851, 158198. [Google Scholar] [CrossRef]
  6. MAFRA. Guidelines for Implementing Agriculture, Food and Rural Affairs Businesses in 2024; Ministry of Agriculture, Food and Rural Affairs: Sejong, South Korea, 2024; pp. 66–116. [Google Scholar]
  7. Ji, H.C.; Kim, W.H.; Kim, K.Y.; Lee, S.H.; Yoon, S.H.; Lim, Y.C. Effect of different drained conditions on growth, forage production and quality of silage corn at paddy field. J. Korean Soc. Grassl. Forage Sci. 2009, 29, 329–336. [Google Scholar] [CrossRef]
  8. Kim, L.Y.; Jo, I.S.; Um, K.T.; Min, H.S. Changes of soil characteristics and crop productivity by the paddy-upland rotation system. 1. Changes of soil physical properties. Res. Rept. RDA (S&F) 1990, 32, 1–7. [Google Scholar]
  9. Nakano, K. Changes in soil physical properties of clayey soil by conversion from ill-drained paddy field into upland field. Bull. Hokuriku Natl. Agric. Exp. Stn. 1978, 21, 63–94. [Google Scholar]
  10. Ahmed, I.; Ullah, A.; ur Rahman, M.H.; Ahmad, B.; Wajid, S.A.; Ahmad, A.; Ahmed, S. Climate change impacts and adaptation strategies for agronomic crops. In Climate Change and Agriculture; Hussain, S., Ed.; IntechOpen: Rijeka, Croatia, 2019. [Google Scholar] [CrossRef]
  11. Xu, H.; Twine, T.E.; Girvetz, E. Climate change and maize yield in Iowa. PLoS ONE 2016, 11, e0156083. [Google Scholar] [CrossRef] [PubMed]
  12. Kim, W.; Iizumi, T.; Hosokawa, N.; Tanoue, M.; Hirabayashi, Y. Flood impacts on global crop production: Advances and limitations. Environ. Res. Lett. 2023, 18, 054007. [Google Scholar] [CrossRef]
  13. Tyagi, A.; Ali, S.; Park, S.; Bae, H. Exploring the potential of multiomics and other integrative approaches for improving waterlogging tolerance in plants. Plants 2023, 12, 1544. [Google Scholar] [CrossRef] [PubMed]
  14. Takahashi, H.G.; Fujinami, H. Recent decadal enhancement of Meiyu–Baiu heavy rainfall over East Asia. Sci. Rep. 2021, 11, 13665. [Google Scholar] [CrossRef]
  15. Shrestha, B.B.; Perera, E.D.P.; Kudo, S.; Miyamoto, M.; Yamazaki, Y.; Kuribayashi, D.; Sawano, H.; Sayama, T.; Magome, J.; Hasegawa, A.; et al. Assessing flood disaster impacts in agriculture under climate change in the river basins of Southeast Asia. Nat. Hazards 2019, 97, 157–192. [Google Scholar] [CrossRef]
  16. Kaur, G.; Singh, G.; Motavalli, P.P.; Nelson, K.A.; Orlowski, J.M.; Golden, B.R. Impacts and management strategies for crop production in waterlogged or flooded soils: A review. Agron. J. 2020, 112, 1475–1501. [Google Scholar] [CrossRef]
  17. Greenway, H.; Armstrong, W.; Colmer, T.D. Conditions leading to high CO2 (>5 kPa) in waterlogged–flooded soils and possible effects on root growth and metabolism. Ann. Bot. 2006, 98, 9–32. [Google Scholar] [CrossRef] [PubMed]
  18. Kopyra, M.; Gwóźdź, E.A. The role of nitric oxide in plant growth regulation and responses to abiotic stresses. Acta Physiol. Plant. 2004, 26, 459–473. [Google Scholar] [CrossRef]
  19. Sasidharan, R.; Bailey-Serres, J.; Ashikari, M.; Atwell, B.J.; Colmer, T.D.; Fagerstedt, K.; Fukao, T.; Geigenberger, P.; Hebelstrup, K.H.; Hill, R.D.; et al. Community recommendations on terminology and procedures used in flooding and low oxygen stress research. New Phytol. 2017, 214, 1403–1407. [Google Scholar] [CrossRef]
  20. Husson, O. Redox potential (Eh) and pH as drivers of soil/plant/microorganism systems: A transdisciplinary overview pointing to integrative opportunities for agronomy. Plant Soil 2013, 362, 389–417. [Google Scholar] [CrossRef]
  21. Zeng, F.; Shabala, L.; Zhou, M.; Zhang, G.; Shabala, S. Barley responses to combined waterlogging and salinity stress: Separating effects of oxygen deprivation and elemental toxicity. Front. Plant Sci. 2013, 4, 313. [Google Scholar] [CrossRef]
  22. Hossain, M.; Uddin, S.N. Mechanisms of waterlogging tolerance in wheat: Morphological and metabolic adaptations under hypoxia or anoxia. Aust. J. Crop Sci. 2011, 5, 1094–1101. [Google Scholar]
  23. Sairam, R.K.; Kumutha, D.; Ezhilmathi, K.; Chinnusamy, V.; Meena, R.C. Waterlogging induced oxidative stress and antioxidant enzyme activities in pigeon pea. Biol. Plant. 2009, 53, 493–504. [Google Scholar] [CrossRef]
  24. Jia, W.; Ma, M.; Chen, J.; Wu, S. Plant morphological, physiological and anatomical adaption to flooding stress and the underlying molecular mechanisms. Int. J. Mol. Sci. 2021, 22, 1088. [Google Scholar] [CrossRef]
  25. Takahashi, H.; Yamauchi, T.; Colmer, T.D.; Nakazono, M. Aerenchyma formation in plants. In Low-Oxygen Stress in Plants: Oxygen Sensing and Adaptive Responses to Hypoxia; van Dongen, J.T., Licausi, F., Eds.; Springer: Vienna, Austria, 2014; pp. 247–265. [Google Scholar] [CrossRef]
  26. Arora, K.; Panda, K.K.; Mittal, S.; Mallikarjuna, M.G.; Rao, A.R.; Dash, P.K.; Thirunavukkarasu, N. RNAseq revealed the important gene pathways controlling adaptive mechanisms under waterlogged stress in maize. Sci. Rep. 2017, 7, 10950. [Google Scholar] [CrossRef] [PubMed]
  27. Go, Y.S.; Kim, J.-T.; Bae, H.H.; Son, B.-Y.; Yi, G.; Ha, J.Y.; Kim, S.-L.; Baek, S.-B. Analysis of growth response and gene expression by waterlogging stress on B73 maize. Korean J. Crop Sci. 2020, 65, 104–112. [Google Scholar] [CrossRef]
  28. Zhou, X.; Han, H.; Li, C.; Guo, S.; Guo, D.; Cheng, J. Physiological characters and yield formation of corn (Zea mays L.) under waterlogging stress in jointing stage. Trans. Chin. Soc. Agric. Eng. 2014, 30, 119–125. [Google Scholar] [CrossRef]
  29. Zaidi, P.H.; Singh, N.N. Effect of waterlogging on growth, biochemical compositions and reproduction in maize (Zea mays L.). J. Plant Biol. 2001, 28, 61–70. [Google Scholar]
  30. Huang, C.; Gao, Y.; Qin, A.; Liu, Z.; Zhao, B.; Ning, D.; Ma, S.; Duan, A.; Liu, Z. Effects of waterlogging at different stages and durations on maize growth and grain yields. Agric. Water Manag. 2022, 261, 107334. [Google Scholar] [CrossRef]
  31. Jung, J.S.; Choi, G.-J.; Choi, B.-R. Effect of waterlogging duration on growth characteristics and productivity of forage corn at different growth stages under paddy field conditions. J. Korean Soc. Grassl. Forage Sci. 2019, 39, 141–147. [Google Scholar] [CrossRef]
  32. Ritchie, S.W.; Hanway, J.J.; Benson, G.O. How a Corn Plant Develops. Special Report No. 48; Iowa State University of Science and Technology, Cooperative Extension Services: Ames, IA, USA, 1986; pp. 1–21. [Google Scholar]
  33. Hatfield, J.L.; Stanley, C.D.; Carlson, R.E. Evaluation of an electronic foliometer to measure leaf area in corn and soybeans. Agron. J. 1976, 68, 434–436. [Google Scholar] [CrossRef]
  34. Asha, S.N.; Sultana, N.; Hassan, L.; Akhter, S.; Robin, A.H.K. Response of morphological and biochemical traits of maize genotypes under waterlogging stress. J. Phytol. 2021, 13, 108–121. [Google Scholar] [CrossRef]
  35. Goering, H.K.; Van Soest, P.J. Forage Fiber Analysis: Apparatus, Reagents, Procedures and some Applications. Agriculture Handbook No. 379; ARS, USDA: Washington, DC, USA, 1970. [Google Scholar]
  36. National Research Council (NRC). Nutrient Requirements of Dairy Cattle: Seventh Revised Edition; The National Academies Press: Washington, DC, USA, 2001; p. 405. [Google Scholar]
  37. Menke, K.H.; Huss, W. Tierernährung und Futtermittelkunde; Verlag Eugen: Ulmer, Germany, 1980. [Google Scholar]
  38. Holland, C.; Kezar, W.; Kautz, W.P.; Lazowski, E.J.; Mahanna, W.C.; Reinhart, R. Pioneer Forage Manual: A Nutritional Guide; Pioneer Hi-Bred International, Inc.: Des Moines, IA, USA, 1990. [Google Scholar]
  39. AOAC. Official Methods of Analysis, 15th ed.; Association of Official Analytical Chemists: Washington, DC, USA, 1990. [Google Scholar]
  40. Mano, Y.; Omori, F.; Takamizo, T.; Kindiger, B.; Bird, R.M.; Loaisiga, C.H. Variation for root aerenchyma formation in flooded and non-flooded maize and teosinte seedlings. Plant Soil 2006, 281, 269–279. [Google Scholar] [CrossRef]
  41. Weigel, D.; Glazebrook, J. Fixation, embedding, and sectioning of plant tissues. Cold Spring Harb. Protoc. 2008, 3, pdb.prot4941. [Google Scholar] [CrossRef] [PubMed]
  42. Jana, S.; Choudhuri, M.A. Glycolate metabolism of three submersed aquatic angiosperms: Effect of heavy metals. Aquat. Bot. 1981, 11, 67–77. [Google Scholar] [CrossRef]
  43. Tsai, Y.-C.; Hong, C.-Y.; Liu, L.-F.; Kao, C.H. Relative importance of Na+ and Cl in NaCl-induced antioxidant systems in roots of rice seedlings. Physiol. Plant. 2004, 122, 86–94. [Google Scholar] [CrossRef]
  44. Heath, R.L.; Packer, L. Photoperoxidation in isolated chloroplasts: I. Kinetics and stoichiometry of fatty acid peroxidation. Arch. Biochem. Biophys. 1968, 125, 189–198. [Google Scholar] [CrossRef] [PubMed]
  45. Livak, K.J.; Schmittgen, T.D. Analysis of Relative Gene Expression Data Using Real-Time Quantitative PCR and the 2−ΔΔCT Method. Methods 2001, 25, 402–408. [Google Scholar] [CrossRef]
  46. Lin, Y.; Zhang, C.; Lan, H.; Gao, S.; Liu, H.; Liu, J.; Cao, M.; Pan, G.; Rong, T.; Zhang, S. Validation of potential reference genes for qPCR in maize across abiotic stresses, hormone treatments, and tissue types. PLoS ONE 2014, 9, e95445. [Google Scholar] [CrossRef]
  47. Thomas, T.; Purushothaman, J.; Janarthanan, R.; Anusuya, N.; Medisetti, P.G.; Karthick, J.; Nadaradjan, S.; Thirumeni, S. Identification of rice genotypes for seedling stage multiple abiotic stress tolerance. Plant Physiol. Rep. 2020, 25, 697–706. [Google Scholar] [CrossRef]
  48. Thomas, H.; Ougham, H. Chapter 10—Senescence and crop performance. In Crop Physiology, 2nd ed.; Sadras, V.O., Calderini, D.F., Eds.; Academic Press: San Diego, CA, USA, 2015; pp. 223–249. [Google Scholar] [CrossRef]
  49. Pezeshki, S.R. Wetland plant responses to soil flooding. Environ. Exp. Bot. 2001, 46, 299–312. [Google Scholar] [CrossRef]
  50. Tian, L.-X.; Zhang, Y.-C.; Chen, P.-L.; Zhang, F.-F.; Li, J.; Yan, F.; Dong, Y.; Feng, B.-L. How does the waterlogging regime affect crop yield? a global meta-analysis. Front. Plant Sci. 2021, 12, 634898. [Google Scholar] [CrossRef] [PubMed]
  51. Pociecha, E.; Kościelniak, J.; Filek, W. Effects of root flooding and stage of development on the growth and photosynthesis of field bean (Vicia faba L. minor). Acta Physiol. Plant. 2008, 30, 529–535. [Google Scholar] [CrossRef]
  52. Zhu, M.; Li, F.H.; Shi, Z.S. Morphological and photosynthetic response of waxy corn inbred line to waterlogging. Photosynthetica 2016, 54, 636–640. [Google Scholar] [CrossRef]
  53. Ren, B.; Yu, W.; Liu, P.; Zhao, B.; Zhang, J. Responses of photosynthetic characteristics and leaf senescence in summer maize to simultaneous stresses of waterlogging and shading. Crop J. 2023, 11, 269–277. [Google Scholar] [CrossRef]
  54. Ploschuk, R.A.; Miralles, D.J.; Colmer, T.D.; Ploschuk, E.L.; Striker, G.G. Waterlogging of Winter Crops at Early and Late Stages: Impacts on Leaf Physiology, Growth and Yield. Front. Plant Sci. 2018, 9, 1863. [Google Scholar] [CrossRef]
  55. Xu, G.; Fan, X.; Miller, A.J. Plant nitrogen assimilation and use efficiency. Annu. Rev. Plant Biol. 2012, 63, 153–182. [Google Scholar] [CrossRef] [PubMed]
  56. Shin, S.; Kim, S.G.; Lee, J.S.; Go, T.-H.; Shon, J.; Kang, S.; Lee, J.-S.; Bae, H.H.; Son, B.-Y.; Shim, K.-B.; et al. Impact of the consecutive days of visible wilting on growth and yield during tassel initiation in maize (Zea mays L.). J. Crop Sci. Biotechnol. 2016, 18, 219–229. [Google Scholar] [CrossRef]
  57. Kaur, G.; Zurweller, B.; Motavalli, P.P.; Nelson, K.A. Screening corn hybrids for soil waterlogging tolerance at an early growth stage. Agriculture 2019, 9, 33. [Google Scholar] [CrossRef]
  58. Zaidi, P.H.; Rafique, S.; Rai, P.K.; Singh, N.N.; Srinivasan, G. Tolerance to excess moisture in maize (Zea mays L.): Susceptible crop stages and identification of tolerant genotypes. Field Crops Res. 2004, 90, 189–202. [Google Scholar] [CrossRef]
  59. Liu, M.Y.; Sun, J.; Wang, K.Y.; Liu, D.; Li, Z.Y.; Zhang, J. Spermidine enhances waterlogging tolerance via regulation of antioxidant defence, heat shock protein expression and plasma membrane H+-ATPase activity in Zea mays. J. Agron. Crop Sci. 2014, 200, 199–211. [Google Scholar] [CrossRef]
  60. Zhen, B.; Li, H.; Niu, Q.; Qiu, H.; Tian, G.; Lu, H.; Zhou, X. Effects of combined high temperature and waterlogging stress at booting stage on root anatomy of rice (Oryza sativa L.). Water 2020, 12, 2524. [Google Scholar] [CrossRef]
  61. Hopkins, W.G.; Huner, N.P.A. Introduction to Plant Physiology, 4th ed.; John Wiley & Sons, Inc.: New York, NY, USA, 2008; pp. 286–287. [Google Scholar]
  62. Lee, H.Y.; Yoon, G.M. Regulation of ethylene biosynthesis by phytohormones in etiolated rice (Oryza sativa L.) seedlings. Mol. Cells 2018, 41, 311–319. [Google Scholar] [CrossRef]
  63. Li, Y.; Dong, Y.; Niu, S.; Cui, D. The genetic relationship among plant-height traits found using multiple-trait QTL mapping of a dent corn and popcorn cross. Genome 2007, 50, 357–364. [Google Scholar] [CrossRef]
  64. Popović, A.; Kravić, N.; Branković-Radojčić, D.; Golijan, J.; Mladenović, M.; Vančetović, J.; Babić, V. Variability in ratio between ear and plant height among maize top cross hybrids. Serb. Assoc. Plant Breed. Seed Prod. 2022, 28, 1–12. [Google Scholar] [CrossRef]
  65. Azrai, M.; Efendi, R.; Muliadi, A.; Aqil, M.; Suwarti; Zainuddin, B.; Syam, A.; Junaedi; Syah, U.T.; Dermail, A.; et al. Genotype by environment interaction on tropical maize hybrids under normal irrigation and waterlogging conditions. Front. Sustain. Food Syst. 2022, 6, 913211. [Google Scholar] [CrossRef]
  66. Daku, E.K.; Salack, S.; Worou, O.N.; Ogunjobi, K. Maize response to temporary floods under ambient on-farm conditions of the West African Sahel. Environ. Res. Commun. 2022, 4, 045004. [Google Scholar] [CrossRef]
  67. Yin, X.; Zhang, C.; Song, X.; Jiang, Y. Interactive short-term effects of waterlogging and salinity stress on growth and carbohydrate, lipid peroxidation, and nutrients in two Perennial ryegrass cultivars. J. Am. Soc. Hortic. Sci. 2017, 142, 110–118. [Google Scholar] [CrossRef]
  68. Agualongo, D.A.P.; Da-Silva, C.J.; Garcia, N.; de Oliveira, F.K.; Shimoia, E.P.; Posso, D.A.; de Oliveira, A.C.B.; de Oliveira, D.d.S.C.; do Amarante, L. Waterlogging priming alleviates the oxidative damage, carbohydrate consumption, and yield loss in soybean (Glycine max) plants exposed to waterlogging. Funct. Plant Biol. 2022, 49, 1029–1042. [Google Scholar] [CrossRef] [PubMed]
  69. Ye, X.q.; Meng, J.l.; Zeng, B.; Wu, M. Improved flooding tolerance and carbohydrate status of flood-tolerant plant Arundinella anomala at lower water temperature. PLoS ONE 2018, 13, e0192608. [Google Scholar] [CrossRef]
Figure 1. Effects of waterlogging at different developmental stages on plant growth and dry matter yield of forage maize. (a) Plant height in 2022; (b) shoot dry matter in 2022; (c) root dry matter in 2022; (d) plant height in 2023; (e) shoot dry matter in 2023; (f) root dry matter in 2023. Bars show the means ± SDs (n = 5) for the control and waterlogging (WL) plants within each stage and year; asterisks indicate a significant difference between the control and WL plants within a stage (*, p < 0.05; **, p < 0.01; ***, p < 0.001). E, emergence stage; V4, four-leaf stage; V11, eleven-leaf stage; VT, tasseling stage.
Agronomy 15 02389 g001
Figure 2. Effects of 14 days of waterlogging at different developmental stages of forage maize on leaf area and the number of green leaves. (a) Leaf area in 2022; (b) number of green leaves in 2022; (c) leaf area in 2023; (d) number of green leaves in 2023. Bars show the means ± SDs (n = 5) for the control and waterlogging (WL) plants within each stage and year; asterisks indicate a significant difference between the control and WL plants within a given stage (*, p < 0.05; **, p < 0.01; ***, p < 0.001). E, emergence stage; V4, four-leaf stage; V11, eleven-leaf stage; VT, tasseling stage.
Agronomy 15 02389 g002
Figure 3. Effects of waterlogging at different developmental stages (E, V4, V11, VT) on chlorophyll fluorescence (Fv/Fm) and the relative chlorophyll content index (RCI) of forage maize. (a) Chlorophyll fluorescence in 2022; (b) RCI in 2022; (c) chlorophyll fluorescence in 2023; (d) RCI in 2023. Bars show the means ± SDs (n = 5) for the control and waterlogging (WL) plants within each stage and year; asterisks indicate a significant difference between the control and WL plants within a given stage (*, p < 0.05; **, p < 0.01; ***, p < 0.001). E, emergence stage; V4, four-leaf stage; V11, eleven-leaf stage; VT, tasseling stage.
Agronomy 15 02389 g003
Figure 4. Effects of waterlogging at different developmental stages (E, V4, V11, VT) on aerenchyma formation of forage maize grown in 2023. (a) Image of a root cross-section at 6 cm from the root tip (scale bar, 1 mm); (b) aerenchyma area rate in the root cortex; (c) number of adventitious roots. Bars show the means ± SDs (b, n = 5; c, n = 3) for the control and waterlogging (WL) plants within each stage and year; asterisks indicate a significant difference between the control and WL plants within a given stage (*, p < 0.05; ***, p < 0.001). E, emergence stage; V4, four-leaf stage; V11, eleven-leaf stage; VT, tasseling stage.
Agronomy 15 02389 g004
Figure 5. Changes in hydrogen peroxide (H2O2) and malondialdehyde (MDA) contents in roots of forage maize after 14 days of waterlogging at different developmental stages (E, V4, V11, and VT). (a) H2O2 in 2023; (b) MDA in 2023. Bars show the means ± SDs (n = 3) for the control and waterlogged (WL) plants within each stage and year; asterisks indicate a significant difference between the control and WL plants within a given stage (*, p < 0.05; **, p < 0.01; ***, p < 0.001). E, emergence stage; V4, four-leaf stage; V11, eleven-leaf stage; VT, tasseling stage.
Agronomy 15 02389 g005
Figure 6. Expression of selected waterlogging-responsive genes at the mRNA level after 14 days of waterlogging at different developmental stages (E, V4, V11, and VT). (a) Sucrose synthase (SUS); (b) alcohol dehydrogenase (ADH); (c) aldolase1; (d) respiratory burst oxidase homolog (RBOH); (e) xyloglucan transglycosylase (XTH); (f) group VII ethylene response factor (ERFVII); (g) acetyl-coenzyme A carboxylase (ACC). Bars show the means ± SDs (n = 3) for the control and waterlogged (WL) plants within each stage and year; asterisks indicate a significant difference between the control and WL plants within a given stage (*, p < 0.05; **, p < 0.01; ***, p < 0.001). E, emergence stage; V4, four-leaf stage; V11, eleven-leaf stage; VT, tasseling stage.
Agronomy 15 02389 g006
Table 1. List of primers for waterlogging-related genes.
GeneGene IDAccessionPrimer Sequence (5’–3’)Amplicon
Size (bp)
Sucrose synthaseGRMZM2G152908NM_001111853F: AGCTCCTGTACAGCCAAACC
R: CCCGTTCAGGTTGTACTGCT
266
AldolaseGRMZM2G057823NM_001111866.2F: GGAGAATGGTCTGGTGCCAA
R: ACCTCAGGGGTCACCTTCTT
213
Alcohol dehydrogenase (ADH)GRMZM2G152981NM_001146840.1F: TGTGTGGAACCTACCGTGTG
R: CGAGTCCAAACACTGCAACG
298
Respiratory burst oxidase homolog (RBOH)GRMZM2G034896NM_001322022.1F: AAGGTTGCAGTGTATCCGGG
R: ACGTGAAGTCCAATCACCCC
201
Xyloglucan endotransglycosylase/hydrolase (XTH)GRMZM2G060837NM_001137402.1F: TACGGCAATGGCAGCACTAG
R: TTGACCTTGTACTTGCCCCC
254
Ethylene-response element binding protein (ERF VII)GRMZM2G018398NM_001155219.2F: CCATTGCTCCCATTCCCACT
R: TCGAAGGTCCAGAGGTCCAT
250
Acetyl-CoA carboxylase (ACC)GRMZM5G858094NM_001111903.1F: GCTGCTTAGACGCGATACCT
R: ATATTGGGGAGCCAGGGACT
213
Elongation factor 1-alphaGRMZM2G153541NM_001112117F: TGGGCTACTGGTCTTACTACTGA
R: ACATACCCACGCTTCAGATCCT
135 [46]
Table 2. Effects of waterlogging at different forage maize developmental stages on growth characteristics and dry matter.
YearTreatment 1Stem Height
(cm)
Ear Height
(cm)
Stem Diameter
(mm)
Dry Matter (g/plant)
TotalEar
2022Ctrl229.5 ± 10.6 a95.5 ± 7.78 a21.35 ± 0.49 a234.80 ± 43.84 a80.55 ± 27.51 a
E198.3 ± 11.0 b82.0 ± 8.7 b18.10 ± 2.07 ab179.87 ± 29.45 ab34.67 ± 8.04 b
V4192.3 ± 4.1 b99.3 ± 4.1 a15.12 ± 3.11 b139.07 ± 18.23 b19.9 ± 4.64 b
V11184.5 ± 1.5 b100.5 ± 3.5 a21.45 ± 0.05 a157.00 ± 6.00 b17.15 ± 1.45 b
VT231.3 ± 6.7 a102.7 ± 2.3 a21.10 ± 0.96 a156.7 ± 10.70 b3.87 ± 3.03 b
2023Ctrl219.8 ± 5.8 ab100.3 ± 8.5 a22.84 ± 2.13 a367.76 ± 76.87 a113.78 ± 1.2 a
E213.8 ± 14.1 b87.8 ± 10.0 b15.74 ± 1.14 b161.98 ± 23.52 b30.27 ± 2.69 c
V4198.2 ± 26.8 b83.2 ± 9.2 b14.96 ± 1.28 b151.76 ± 32.58 b21.43 ± 6.59 c
V11196.2 ± 22.9 b99.5 ± 5.4 a22.28 ± 0.59 a157.24 ± 16.77 b1.24 ± 0.75 d
VT238.6 ± 10.5 a109.4 ± 5.5 a21.20 ± 1.17 a189.69 ± 11.38 b54.08 ± 13.62 b
1 Ctrl, control; E, emergence; V4, four-leaf stage; V11, eleven-leaf stage; VT, tasseling stage. a–d Means ± SDs (n = 3) with the same superscript in a column for each treatment are not significantly different (p > 0.05).
Table 3. Effects of waterlogging at different forage maize developmental stages on feed values.
YearTreat 1CP 2
(%)
CF 2
(%)
CA 2
(%)
ADF 2
(%)
NDF 2
(%)
NFC
(%)
TDN 2
(%)
RFV 2
2022Ctrl4.90 ± 2.16 a1.60 ± 0.41 a4.21 ± 0.42 b37.74 ± 2.30 c62.46 ± 3.25 c26.8 ± 1.16 a59.09 ± 1.81 a88.87 ± 7.34 a
E3.54 ± 0.18 a1.12 ± 0.06 b4.61 ± 0.42 b41.74 ± 1.40 ab67.30 ± 1.10 ab23.4 ± 1.69 b55.93 ± 1.10 bc77.97 ± 2.78 bc
V44.25 ± 0.55 a1.04 ± 0.15 b5.75 ± 0.4 a40.51 ± 0.58 ab64.93 ± 0.24 bc24.0 ± 0.34 b56.90 ± 0.46 bc82.15 ± 0.52 ab
V114.22 ± 0.79 a1.38 ± 0.34 ab4.62 ± 0.99 b39.83 ± 0.72 bc67.01 ± 2.02 ab22.8 ± 2.41 b57.44 ± 0.57 ab80.40 ± 2.91 bc
VT4.59 ± 0.87 a1.02 ± 0.06 b4.87 ± 0.5 ab42.99 ± 1.23 a70.05 ± 1.60 a19.5 ± 1.07 c54.94 ± 0.97 c73.63 ± 2.70 c
2023Ctrl3.84 ± 0.13 b1.92 ± 0.44 a2.88 ± 0.35 b37.34 ± 1.66 b64.61 ± 2.13 b26.7 ± 3.27 a59.40 ± 1.31 a86.21 ± 4.78 a
E3.49 ± 0.12 b1.34 ± 0.11 b3.32 ± 0.25 b38.81 ± 0.48 b63.52 ± 0.73 b27.2 ± 0.77 a58.24 ± 0.38 a85.93 ± 0.64 a
V43.47 ± 0.30 b1.62 ± 0.14 ab3.43 ± 0.29 b39.17 ± 0.78 b64.68 ± 0.75 b26.8 ± 0.96 a57.95 ± 0.61 a83.98 ± 1.65 a
V115.06 ± 0.12 a1.52 ± 0.07 ab4.4 ± 0.36 a43.50 ± 1.41 a70.48 ± 2.55 a18.6 ± 3.01 b54.53 ± 1.11 b72.70 ± 4.08 b
VT5.04 ± 0.52 a1.86 ± 0.08 a3.12 ± 0.19 b44.65 ± 1.14 a69.67 ± 0.10 a18.4 ± 1.33 b53.63 ± 0.90 b72.25 ± 1.08 b
1 Ctrl, control; E, emergence; V4, four-leaf stage; V11, eleven-leaf stage; VT, tasseling stage. 2 CP, crude protein; CF, crude fat; CA, crude ash; ADF, acid detergent fiber; NDF, neutral detergent fiber; NFC, non-fiber carbohydrate; TDNs, total digestible nutrients; RFV, relative feed value. a–c Means ± SDs (n = 3) with the same superscript in a column for each treatment are not significantly different (p > 0.05).
Disclaimer/Publisher’s Note: The statements, opinions and data contained in all publications are solely those of the individual author(s) and contributor(s) and not of MDPI and/or the editor(s). MDPI and/or the editor(s) disclaim responsibility for any injury to people or property resulting from any ideas, methods, instructions or products referred to in the content.