Abstract
Balancing soil nitrogen leaching with production benefits remains a critical challenge in sustainable greenhouse tomato cultivation. This study evaluated the effects of reduced water-soluble nitrogen fertilizer (N) application rates on soil environmental parameters and production outcomes to optimize nitrogen management strategies. Four treatments were implemented across two growing seasons: control (CK), high-N (H), medium-N (M), and low-N (L) nitrogen fertilizer applications in soil solution (SS) and autumn–winter (AW) systems. Results demonstrated that reduced nitrogen inputs significantly decreased soil electrical conductivity and soil nitrogen retention by 88% and 83% in SS and AW, respectively, while reducing soil residual nitrate nitrogen. The tomato yield decreased by 14–26% under low fertilizer treatment, while fruit quality was substantially enhanced, with soluble solid content increasing by 56% in SS and 217% in AW for the L treatment compared to the CK. Nitrogen-use efficiency improved by 54.7% and 34.78% in SS and AW, respectively, demonstrating superior resource utilization under reduced fertilizer applications. Principal component analysis revealed that fruit quality was primarily influenced by soluble solid content, organic acid, total soluble solids, and sugar–acid ratio. Gray relational analysis identified the L treatment (361.62 kg ha−1 in SS and 182.6 kg ha−1 in AW) as optimal for comprehensive performance evaluation. The findings demonstrate that strategic nitrogen reduction effectively balances production benefits with environmental sustainability, providing a practical framework for sustainable nitrogen management in controlled environment agriculture.
1. Introduction
China is the world’s largest vegetable producer and consumer. In 2022, the production of vegetables in China accounted for 53% of the world’s vegetable system [1]. Tomato is the second most important fruit or vegetable crop, next to potato [2]. Greenhouse cultivation is a major method of vegetable production. However, it has led to severe environmental damage [3]. Drip fertigation, a water-saving technique, mitigates the mismatch between irrigation supply and crop demand and has been widely adopted for tomato production in greenhouse cultivation [4]. Nitrogen fertilizer (N) application can increase crop yield. In pursuit of high yields, growers may overapply nitrogen fertilizers. However, excessive application of nitrogen fertilizers can increase the risk of nitrogen release into the environment [5], such as the increase in nitrate content in greenhouse soil [6]. The excessive application of nitrogen fertilizer is one of the main causes of soil salinization in greenhouses. Soil electrical conductivity (EC) is commonly used as an indicator of soil salinity. In addition, nitrate accumulation is closely related to soil acidification and salinization. High nitrogen input can increase the EC value of soil, thereby affecting soil quality and environmental quality [7]. Moreover, excessive N application, which causes a rapid increase in soil nitrate residue (SNR), will further lead to an increase in the EC of deeper soil layers. Since the contribution of residual nitrogen is often ignored, the apparent recovery efficiency of nitrogen fertilizer remains low, and the surplus nitrate continues to migrate downward, threatening groundwater quality [8]. Both EC and SNR therefore provide integrative measures of nitrogen accumulation under greenhouse conditions. Owing to the enclosed nature of these systems, irrigation is the sole water source; natural precipitation that could dilute or leach salts is absent [9]. Consequently, controlled N application is imperative to curb nitrate leaching. Developing science-based N application rate management strategies is essential to prevent nitrogen accumulation and sustain greenhouse soil fertility [10].
Irrigation and N application rates are primary determinants of tomato growth [11]. Regarding plant growth and biomass accumulation, studies present mixed findings: while some research indicates that lower N application rates do not limit biomass accumulation and increasing N fails to induce further gains [12]. Other studies demonstrate that elevated N supply significantly promotes both plant height and biomass in greenhouse cultivation [13].
Regarding tomato yield responses to N application, research consistently indicates diminishing or absent returns from excessive N application. A previous study reported that increasing nitrogen fertilizer application had no significant effect on tomato yield [14], while another study found that applying nitrogen fertilization beyond a certain threshold not only failed to increase tomato yield but may have detrimental effects [15]. These findings collectively suggest that optimal tomato yields were achieved at moderate N application rates, rather than maximum rates. Regarding nitrogen use efficiency (NUE) in greenhouse tomato production, research demonstrates that nitrogen fertilizer application rates significantly affect NUE, with moderate nitrogen fertilizer application enhancing NUE, while excessive application reduces it [16]. This finding aligns with the yield response patterns, where both parameters exhibit optimal performance at intermediate N application levels rather than at maximum fertilization rates, reinforcing the concept of an optimal nitrogen application threshold for sustainable tomato production.
For fruit quality parameters, research reveals a consistent inverse relationship with nitrogen fertilization levels. Reduced N application generally enhances key quality traits including soluble solids, vitamin C, and soluble sugars [17]. While higher N application may initially appear to improve certain quality indicators [18,19] this relationship reverses beyond an optimal threshold. Mao et al. (2024) demonstrated that exceeding a critical N application level ultimately compromises both yield and these important quality traits [20]. These findings collectively indicate that fruit quality parameters are optimized lower to moderate N application rates, contrasting with the growth response patterns and reinforcing the need for balanced fertilization strategies that consider multiple production objectives.
Above all, two key questions should be considered: (1) How do progressively reduced nitrogen inputs affect soil environmental parameters (EC and SNR), plant growth, yield, fruit quality, NUE, and economic profitability in greenhouse tomato production? (2) What is the optimal nitrogen application rate that balances production benefits with environmental sustainability in controlled environment agriculture. Therefore, this study aimed to: (1) quantify how progressively reduced nitrogen inputs jointly influence soil EC, SNR, plant growth, yield, fruit quality, NUE, and economic profitability; and (2) identify an optimal nitrogen application rate through multi-criteria optimization, using gray relational analysis (GRA) to promote sustainable tomato production systems.
2. Materials and Methods
2.1. Site Description
Hebei Province is one of the most important provinces for greenhouse vegetable production [21]. The experiment was conducted in Xuan Hua, located in Zhangjiakou, Hebei Province (40°60′ N, 114°95′ E), which has a semi-arid continental monsoon climate. The annual average temperature is 8.1 °C, with the average temperature in summer (represented by July) being 23.4 °C and the average temperature in winter (represented by January) being −10.0 °C. The annual average precipitation is 350.0 mm, which is mainly concentrated in summer (accounting for about 70% of the annual total). The dimensions of the greenhouse were as follows: its length was 62 m, its width was 10 m, and its height was 4.5 m. The experiment was conducted over the course of two successive growing seasons: the spring–summer (SS) and autumn–winter (AW) seasons. The SS crops were planted on 15 March 2019, and harvested on 5 August 2019. The AW crops were planted on 7 August 2019, and harvested on 20 January 2020. The physical and chemical properties of the 0–50 cm soil layer for both SS and AW prior to the initiation of the experiments are presented in Table 1 and Table 2.

Table 1.
Soil physical and chemical indices in greenhouse of SS.
Table 2.
Soil physical and chemical indices in greenhouse of AW.
2.2. Experimental Design
A surface drip irrigation system was installed throughout the facility. The volume of clean water utilized for the dissolution of fertilizer was equivalent to the volume of water employed for irrigation, suggesting that a discrete irrigation event was not observed.
To establish a systematic gradient spanning from conservative (15% reduction) to substantial (45% reduction) nitrogen management for identifying threshold effects on both production and environment, four fertilization rates were set: CK (Control, 100% of locally recommended nitrogen rate), H (High-N, 85% of CK), M (Medium-N, 70% of CK), and L (Low-N, 55% of CK). The CK represents the nitrogen application rate recommended by local standards for greenhouse tomato cultivation [22].
The specifications and quantities of pure nitrogen fertilizer applied are provided in Table 3 and Figure 1. Table 3 shows the total N application, which was evenly divided into 7 and 8 applications with SS and AW during the growth period: that is, the amount of N applied each time was equal. The specific dates and amounts of nitrogen fertilizer applied for each treatment are shown in the Supplementary Material Table S3.
Table 3.
Irrigation and nitrogen application amounts in SS and AW.
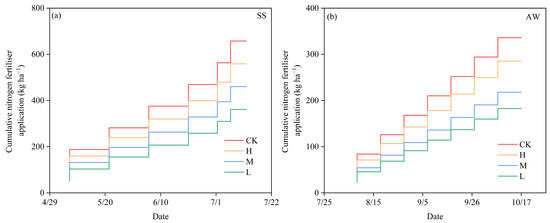
Figure 1.
Cumulative nitrogen fertilizer application under different treatments. (a) Spring-Summer (SS) season; (b) Autumn-Winter (AW) season.
The solar greenhouse was composed of an east and west side, a back wall that functioned as a foundation, a supporting structure, and a plastic cover (Figure 2). Each plot encompassed 45 square meters (10 × 4.5 m) and was meticulously arranged in a randomized complete block design, with three replicates, culminating in a total of 12 plots. The planting configuration of the tomatoes was arranged in a manner that constituted a wide-narrow row configuration, characterized by alternating 70 cm and 80 cm row lengths, with 50 cm intra-row spacing. The individual plants were supported by vertical stakes, with nylon ropes utilized for this purpose. All other field management practices remained constant across treatments. The configuration of the site is illustrated in Figure 2. Each plot contained three rows, with plants and soil in the central row designated for subsequent measurements. The tomato cultivar ‘Mei Fen 869’ was utilized in this study. The installation of drip irrigation lines was conducted along each row, with a hydraulic proportional fertilizer pump situated at the main pipe head. The application of fertilized water was measured in each plot of land using a water meter. The drip emitters exhibited a discharge rate of 1.38 L/h at 0.1 MPa of working pressure, with a spacing of 30 cm between emitters.
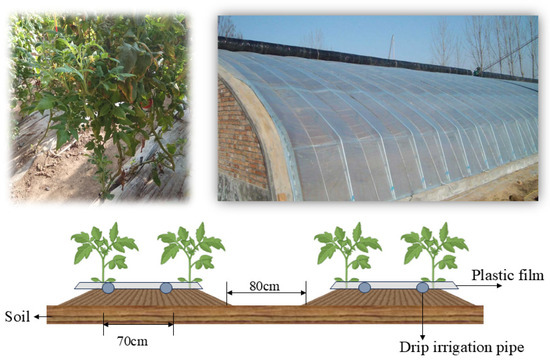
Figure 2.
Placement of tomato plants, greenhouse photo, as well as layout of drip irrigation system.
2.3. Measurements and Calculations
2.3.1. Measurement of Soil EC, Soil Nitrate Nitrogen and Calculation of NUE
The EC was continuously monitored using EM50 data loggers equipped with 5TE sensors (Decagon Devices, Pullman, WA, USA). In the present study, a single point within the drip irrigation-created root wetting zone was systematically selected for the installation of sensors, with each sensor installed at a depth of 20 cm within each test plot. The measurements were automatically recorded at 30 min intervals.
Prior to the initiation of the experiment and immediately following harvest, a 100 cm-deep soil profile was excavated in the greenhouse at 10 cm intervals. Soil samples were collected from locations at the center of each plot, selected at random. The nitrate nitrogen concentrations (NO3−) were determined using a continuous flow analyzer (AA3, Bran Luebbe, Norderstedt, Germany) following laboratory soil analysis [23]. The nitrate residue (NR) in each soil layer was calculated as follows [24]:
The SNR was calculated as follows [25]:
CN represents the soil nitrate concentration, measured in milligrams per kilogram of soil. The symbol γ denotes the dry bulk density, measured in grams per cubic centimeter. The variable h indicates the soil depth, measured in centimeters, and ranges from 0 to 100 cm at intervals of 10 cm. The number 0.1 serves as a conversion coefficient. The NUE was calculated using the following equation, as described by [26]:
Y represents yield (kg), while NU denotes the amount of nitrogen fertilizer that was applied (kg ha−1). Considering the uniform soil texture in the planting zone, the initial soil nitrogen reserve that existed before the experiment commenced was excluded from the calculation herein.
2.3.2. Plant Height and Biomass
Plant height was measured from the base to the growth point of each tomato plant. Five plants were randomly selected from each plot every 10 days after transplanting the tomatoes, to measure their height with a steel tape.
Total biomass was measured as the sum of the complete roots, stems, and leaves at harvest, including the pruning of stems and leaves during growth. Five fresh plant samples were randomly collected from each experimental plot, immediately dried in an oven at 105 °C for 30 min, and then dried at 75 °C until they reached a constant weight.
2.3.3. Measurement of Yield, Fruit Quality, and Economic Benefit
Yield was recorded at the tomato harvest. Fresh fruit was weighed using a balance (±0.01 g; HR-150AZ, AND, Shenzhen, China). Harvesting began when each plant produced four clusters of tomatoes, which were collected in order of ripeness. The total yield for each experimental plot was recorded as the tomato yield. Ten plants per plot were marked to facilitate yield assessment.
Economic input included expenses for irrigation, fertilizer, and greenhouse heating. Irrigation water cost CNY 2 per cubic meter, while nitrogen fertilizer cost CNY 8.5 per kilogram. Greenhouse heating incurred an additional cost of CNY 3000 per hectare. These cost parameters represent typical production conditions in the study region at the time of the experiment and were held constant across treatments, except for nitrogen fertilizer inputs. Fruit revenue was calculated based on market purchase prices: CNY 2.5 per kilogram during the SS season and CNY 3.5 per kilogram during the AW season. Aside from the varying nitrogen fertilizer application rates, all other field management practices remained consistent, including labor costs (CNY 5000 per hectare) and irrigation system maintenance costs (CNY 1000 per hectare). Therefore, the difference in economic benefits stems primarily from the varying nitrogen fertilizer inputs. The input–output ratio (ROI), defined as the ratio of revenue to cost [27], was used as the index to measure economic benefits. These cost parameters represent typical production conditions in the study region at the time of the experiment and were held constant across treatments, except for nitrogen fertilizer inputs.
During harvest, five intact, mature tomato fruits per plot were selected, washed, peeled, and homogenized using a blender from each plot during the harvesting stage to assess fruit quality. Total soluble solids (TSS) were measured with an RHBO-90 handheld refractometer. Soluble sugar content (SSC) was determined via the anthrone colorimetric method [28]. Vitamin C (Vc) was quantified using the classical titration method with a solution of 2,6-dichlorophenol indophenol sodium salt [29]. Organic acid (OA) content was analyzed by high-performance liquid chromatography-mass spectrometry (HPLC-MS) [30]. The sugar–acid ratio (SSR) was calculated as SSC divided by OA. A comprehensive assessment of tomato quality was performed using the PCA-derived F value.
Principal component analysis (PCA) [31] was conducted to assess the overall quality of tomato fruits using five quality indicators: soluble sugar content (SSC), organic acid (OA), sugar–acid ratio (SSR), vitamin C (Vc), and total soluble solids (TSS). The comprehensive evaluation index (F) was calculated based on the eigenvalues and eigenvectors of principal components with eigenvalues greater than 1. Detailed mathematical procedures are provided in Supplementary Material S2.
Gray relational analysis (GRA) [32] was used to conduct a multi-criteria comprehensive evaluation of different treatments based on nine indicators: ROI, yield, SSC, OA, SSR, Vc, TSS, SNR, and NUE. Equal weights (wj = 1/9 = 0.111) were assigned to all evaluation indices to develop an optimal management strategy for water-soluble nitrogen fertilizer. Complete calculation procedures are provided in Supplementary Material S3.
2.4. Data Analysis
Data were organized using Excel (Office 2016, Microsoft Corp., Redmond, WA, USA). All data were averaged from three replicates. All statistical analyses were performed using R version 4.4.2 (https://cran.r-project.org, accessed on 15 December 2024). Prior to statistical analysis, data normality was assessed using the Shapiro–Wilk test, and homoscedasticity was evaluated using Levene’s test. Statistical differences among the four treatments across both seasons were analyzed using one-way ANOVA. When significant interactions among the independent variables were detected, Duncan’s multiple range test was subsequently employed at the 5% confidence level to identify significant differences between treatments. Principal component analysis (PCA) was conducted to assess the overall quality of the tomato fruits [33]. Pearson correlation analysis was performed to examine the relationships among the variables: index ROI, yield, SNR, NUE, and the standardized values of the nine indicators under various treatments across the two seasons. Gray relational analysis (GRA) was conducted using Excel to provide comprehensive evaluation of the treatments.
3. Results
3.1. Soil EC and Soil Nitrate Nitrogen
The EC in the 0–20 cm soil layer showed a consistent decreasing trend with reduced water-soluble nitrogen fertilizer application throughout the growth period in both seasons (SS and AW). The control treatment (CK) maintained significantly higher soil EC values compared to the high (H), medium (M), and low (L) treatments across both seasons (Figure 3).
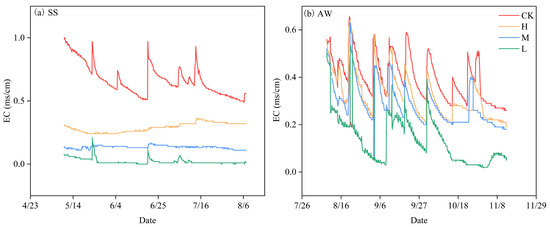
Figure 3.
Dynamics of soil EC in the 0–20 cm soil layer in SS (a) and AW (b).
Soil nitrate nitrogen (NO3−-N) distribution in the 0–100 cm profile, measured at 10 cm intervals at harvest, revealed significantly higher concentrations in the CK treatment compared to all reduced fertilizer treatments (H, M, and L) in both seasons (Figure 4). NO3−-N concentrations decreased proportionally with fertilizer reduction rates and showed a clear vertical gradient, with higher concentrations in surface layers compared to deeper soil layers. The magnitude of treatment differences diminished with increasing soil depth.
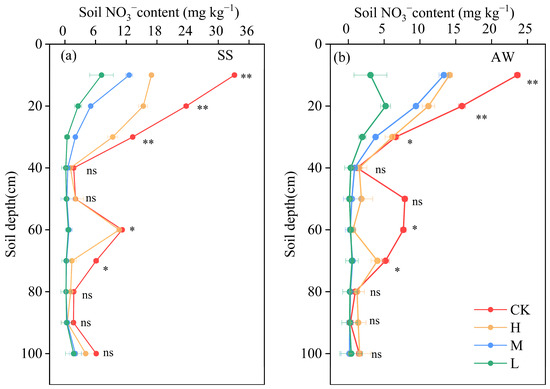
Figure 4.
NO3− content of soil profile in 0–100 cm with 10 cm interval at the end of experiment in SS (a) and AW (b). Note: Labels in the same row followed by different markings represent the following: * p < 0.05; ** p < 0.01; ns: no significance.
The SNR values decreased proportionally with fertilizer reduction rates, showing significant differences among treatments (Table 4). SNR values ranged from 12.47 to 113.85 kg ha−1 across treatments and seasons. Compared to CK, the H, M, and L treatments achieved SNR reductions of 46%, 63%, and 88% in SS, and 39%, 59%, and 83% in AW, respectively.
Table 4.
SNR of soil profile in 0–100 cm at the end of experiment in SS and AW.
3.2. Plant Height and Biomass
Plant height responses to varying water-soluble nitrogen fertilizer rates across four treatments during two growing seasons are presented in Figure 5. Final plant heights reached 250 cm in SS and ranged from 130 to 180 cm in AW. During the SS season, plant height in the CK and H treatments was significantly greater (p < 0.05) than in the M and L treatments throughout the growth period. Conversely, no significant differences in plant height were observed among treatments during the AW season.
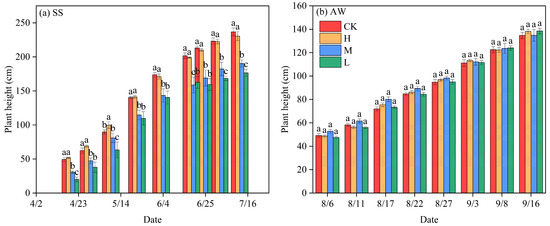
Figure 5.
Variation in tomato plant height during the whole growing seasons of SS and AW. Note: different letters are significantly different at p < 0.05.
Biomass accumulation patterns differed from plant height responses, with the CK treatment not producing the highest aboveground or belowground biomass (Figure 6). In SS, significant differences (p < 0.05) were observed among treatments for both biomass components, following the order: M > CK > H > L. In AW, no significant differences in aboveground biomass occurred among treatments, except that the M treatment significantly exceeded the other three treatments. No significant differences were detected between CK and H treatments for aboveground biomass in AW.
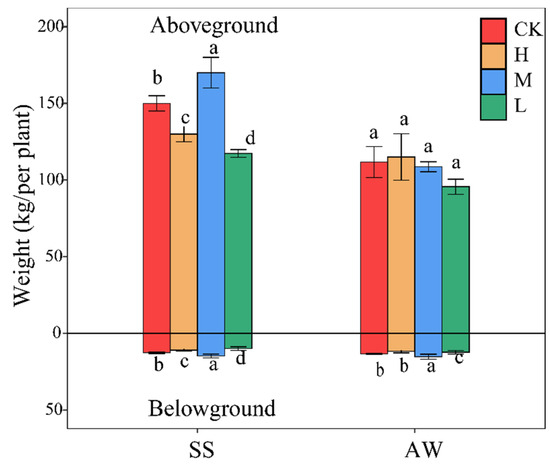
Figure 6.
Biomass of tomato at the end of experiment of SS and AW. Note: Different letters indicate significant differences at the p < 0.05 level.
3.3. Yield, Fruit Quality, and Economic Benefit
The tomato yield was significantly affected by the water-soluble nitrogen fertilizer amount, and showed that the yield of CK was significantly higher than H, M and L in SS and AW. The tomato yield showed CK > H > M > L in SS, while there was no significant difference in yield between M and L for AW. Compared with CK treatment, L treatment decreased the yield by 14% in SS, and L treatment decreased the yield by 26% in AW (Figure 7).
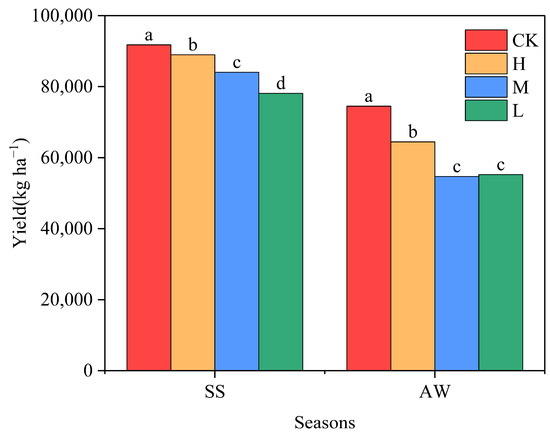
Figure 7.
Tomato yield of different irrigation and fertilization in SS and AW. Note: Different letters indicate significant differences at the p < 0.05 level.
Water-soluble nitrogen fertilizer levels significantly affected SSC, OA, and TSS compared to the CK. Compared to the CK, the L treatment increased SSC, OA, and TSS by 56%, 75%, and 31% in the SS, respectively. Similarly, the L treatment resulted in increases of 217%, 86%, and 41% for SSC, OA, and TSS in the AW. However, no significant differences were observed in SSR and Vc among the water-soluble nitrogen fertilizer levels in both SS and AW (Table 5). The tomato quality index data from the two seasons were transformed using functions to conduct principal component analysis (PCA). SSC (X1), OA (X2), SSR (X3), Vc (X4), and TSS (X5) were utilized to evaluate fruit quality.
Table 5.
Tomato quality in different treatments of two seasons.
Standardized values of the five indicators under various treatments in two seasons were obtained using R (Tables S1 and S2). The results showed that two principal components were obtained after dimension reduction in each index in two seasons, respectively (Table 6). The first principal component eigenvalue of SS was 1.78, and the variance contribution rate reached 63.81%, representing 63.81% of all index information. The second principal component eigenvalue is 1.12, and the variance contribution rate is 25.25%, which represents 25.25% of all index information. The variance contribution rate of the prior two principal components accumulated to 89.07%, which accounted for 89.07% of the total information (Table 6). According to principal component analysis theory, if the cumulative contribution rate of the prior n principal components exceeds 85%, it is enough to reflect all of the information. Therefore, the prior two principal components can be selected to represent the fruit quality of tomatoes in our study.
Table 6.
Eigenvalues and cumulative contribution proportions of principal components of the indices.
The composition matrix and eigenvectors of the five indicators under the components were calculated (see Table 7). Based on the feature vectors obtained from SS, the first principal component (F1) showed that the SSC had the highest loading value, followed by OA and TSS. The SSR coefficient value was negative (with an absolute value that was smaller), indicating that the first principal component of SS primarily reflected the quality characteristics of tomato fruits related to SSC, OA, and TSS. In the second principal component (F2), the absolute value of the SSR coefficient was the largest, suggesting that this component could be regarded as representing the intrinsic quality of the fruit, dominated by SSR. From the variance contribution rate of the principal components and the eigenvector analysis of the fruit quality correlation matrix, it can be concluded that SSC, OA, TSS, and SSR are the main factors affecting the quality of tomato fruits in SS. Similarly, SSC, OA, Vc, and TSS are the primary factors influencing the quality of tomato fruits in AW.
Table 7.
Feature vectors obtained by principal component analysis.
The F value was determined by summing the products of the eigenvectors and the standardized values of the five indicators across various treatments in two seasons. Using the dataset from SS as an example, the formulas for calculating F1 under principal component 1 and F2 under principal component 2 are as follows:
F1 = 0.529 X1 + 0.520 X2 − 0.111 X3 + 0.416 X4 + 0.515 X5
F2 = 0.217 X2 − 0.845 X3 − 0.473 X4
The weighted means were calculated based on the proportion of the eigenvalues of two principal components, to obtain the comprehensive score (F) for the corresponding treatment (Table 8). The calculation formula is as follows: F = 0.6381F1 + 0.2525F2. Similarly, the F values for the corresponding treatments in AW are represented by the formula F = 0.7176F1 + 0.1313F2. The levels of water-soluble nitrogen fertilizer significantly affected the comprehensive quality of tomatoes. The F value for tomato quality, as determined by Principal Component Analysis (PCA), indicated that the L treatment was significantly higher than the CK, H, and M treatments in both SS and AW.
Table 8.
F value of tomato quality of different treatments of two seasons.
3.4. Water and Nitrogen Utilization and Economic Benefit
Water-soluble nitrogen fertilizer levels significantly affected NUE and ROI in both SS and AW treatments. The highest values for NUE and ROI were observed in the L treatment. Compared to the CK treatment, the L treatment increased NUE and ROI by 54.7% and 20.3% in SS, respectively. Additionally, the L treatment enhanced NUE by 34.78% and ROI by 36.45% in AW, with no significant difference in ROI between the H and L treatments (Table 9). Original values and calculation procedures are provided in Supplementary Material S3.
Table 9.
NUE and ROI in two growing seasons.
Pearson correlation was employed to analyze the relationships among the variables: ROI, yield, SNR, and NUE across two seasons. Correlation coefficients indicating significant correlations (with a significance level set at p < 0.05) are presented in Table 10. There were strong correlations among the four indicators in both seasons. SNR was significantly positively correlated with yield and significantly negatively correlated with NUE, while NUE was significantly negatively correlated with yield.
Table 10.
Pearson correlation coefficients among SNR, ROI, yield, and NUE of all data in two seasons.
GRA was utilized to determine the optimal rates of water-soluble nitrogen fertilizers that can balance higher yield, quality, NUE, ROI, and lower SNR. The results indicated that the L treatment ranked first in both SS and AW (Table 11).
Table 11.
Comprehensive evaluation of different treatments with GRA in SS and AW.
4. Discussion
4.1. Effect of Irrigation and Nitrogen Fertilization on Soil Environment
Excessive application of irrigation and fertilizers can diminish the fertility of greenhouse soil [7]. Application of nitrogen fertilizer had a significant impact on soil EC and SNR [34]. To investigate this relationship, our study examined the effects of reducing water-soluble nitrogen fertilizer application on soil properties. When fertilizer application was decreased by 55% to 85% compared to the control treatment, we observed corresponding reductions in both EC and SNR. These findings suggest that while excessive fertilization can be detrimental, significant reductions in nitrogen input also impact key soil chemical parameters that influence nutrient availability.
The gradient of water-soluble nitrogen fertilizer had a significant impact on soil EC and SNR across the four treatments in both seasons. Soil EC and SNR decreased as the amount of water-soluble nitrogen fertilizer increased (see Figure 3 and Figure 4). Our findings are consistent with a previous study [25], who reported that high soil EC and low soil organic matter (SOM) are the primary factors contributing to reduced soil fertility in greenhouse soils. Additionally, our results indicated that excessive application of nitrogen fertilizer led to increased soil EC and soil nitrate nitrogen levels. These findings are supported by previous studies [35,36,37]. The results of this study suggest that controlling the amount of water-soluble nitrogen fertilizer is an effective method for reducing residual soil nitrate nitrogen content and preventing nitrogen leaching (see Table 4). This study focused solely on nitrogen optimization while maintaining constant phosphorus and potassium inputs, which may limit generalization, since these nutrients also affect tomato yield and fruit quality.
Continuous reduced-nitrogen practice over 5–10 years is expected to progressively reverse the soil degradation that is commonly observed in intensive greenhouse systems. The substantial decreases in electrical conductivity and soil nitrogen residues suggest that long-term nitrogen reduction could restore soil chemical balance and reduce environmental risks associated with nitrate leaching. However, sustained soil fertility will ultimately require maintaining equilibrium between nitrogen inputs and crop uptake to prevent gradual nutrient depletion [38].
4.2. Effect of Irrigation and Nitrogen Fertilization on Growth of Tomatoes
The application of irrigation and fertilizers was a key factor in plant growth [39]. Our results indicated that plant height decreased with a reduction in the gradient of water-soluble nitrogen fertilizer when the reduction exceeded 30% in the SS treatment. This suggests that a moderate reduction in the amount of water-soluble fertilizer could promote plant growth. This finding is consistent with the previous study [13], which demonstrated that deficit drip irrigation at 75% of the estimated crop evapotranspiration (ETc) has the potential to support tomato growth. However, the gradient of water-soluble nitrogen fertilizer did not have a significant effect on plant height in the AW treatment. The results for AW differed from those for SS, which can be explained by the fact that the amount of control (CK) water-soluble nitrogen fertilizer in the AW treatment was less than that in the SS season.
Both underground and aboveground biomass in the M treatment was the highest among the four treatments across both seasons, indicating that a suitable reduction in water-soluble fertilizer can promote the accumulation of plant biomass. This finding contrasts with the previous study [40], which reported that biomass increased with higher amounts of nitrogen fertilizer. The discrepancy is primarily attributed to the higher concentration of water-soluble nitrogen fertilizer (CK) used in our study, even in the lowest L treatment (55% CK).
4.3. Effect of Irrigation and Nitrogen Fertilization on Yield and Quality of Tomatoes
Our study demonstrated that the yield of tomatoes significantly decreased with lower application rates of water-soluble nitrogen fertilizer. As indicated in our findings, the control treatment (CK) produced the highest tomato yield (Figure 7). However, the quality of the tomatoes was not optimal in CK (Table 8). This observation aligns with the study by Li et al. (2021) [41], which reported that improvements in tomato fruit quality can mitigate the negative effects of yield reduction. It is important to note that increases in nitrogen fertilizer application do not always promote yield; excessive fertilization may reduce tomato yield [42]. The divergent results observed in this study may be attributed to the non-linear relationship between nitrogen fertilizer application and tomato yield, characterized by a threshold effect rather than a simple linear association. This finding is consistent with previous research, which demonstrated that nitrogen fertilizer application rates exceeding 320 kg/ha had a negative impact on tomato yield [15], suggesting the existence of an optimal application threshold beyond which additional nitrogen inputs become counterproductive for crop productivity.
Our results indicated that fruit quality improved with decreasing application rates of water-soluble nitrogen fertilizer. While SSC, OA, and TSS significantly increased with reduced nitrogen (56–217%), Vc remained stable across treatments (Table 5). This differential response reflects distinct regulatory mechanisms: sugar and organic acid accumulation are primarily governed by source–sink relationships and carbon partitioning, which are directly influenced by nitrogen availability [43]. In contrast, ascorbic acid biosynthesis is predominantly regulated by other environmental factors such as light intensity [44] rather than nitrogen levels. Under our controlled greenhouse conditions with stable environmental regimes, nitrogen reduced without substantially altering the environmental stimuli that regulate Vc synthesis. The stability of Vc across 45% nitrogen reduction demonstrates that substantial fertilizer savings can be achieved while maintaining this essential nutritional component.
Furthermore, the greater quality improvements observed in AW (a 217% increase in SSC versus 56% in SS) can be attributed to the reduced light intensity and lower temperatures, which promote carbohydrate accumulation over vegetative growth. This seasonal variation demonstrates that nitrogen reduction strategies may be particularly effective for improving fruit quality during the autumn–winter production.
4.4. Effect of Irrigation and Nitrogen Fertilization on NUE and Economic Benefit
The rational application of nitrogen fertilizer and irrigation water is crucial for increasing the tomato yield and nitrogen-use efficiency [45]. Research demonstrates a negative correlation between NUE and excessive water-soluble nitrogen fertilizer levels. Excessive fertilizer application can exacerbate soil salinity, which in turn reduces NUE and economic benefits [37]. Conversely, indiscriminately reducing nitrogen fertilizer inputs can also diminish NUE and economic returns.
Our results indicate that NUE and economic benefits increased with strategic reductions in nitrogen fertilizer application, with the L treatment yielding the highest net profit in both SS and AW seasons (Table 9). Notably, the decrease in yield for the L treatment (14% in SS) was significantly less than the reduction in nitrogen fertilizer application (45%), demonstrating efficient resource utilization (Figure 7, Table 3). The NUE in the L treatment was enhanced in both growing seasons, clearly indicating that appropriate nitrogen reduction does not diminish economic benefits or NUE. This finding aligns with previous studies [13], which reported that improved economic benefits and sustained agricultural production can be achieved by reducing nitrogen fertilizer applications, thereby alleviating soil environmental pollution caused by nitrogen leaching.
Our economic analysis was based on fixed market prices and production costs, which may vary in practice due to seasonal fluctuations and market dynamics. While these assumptions reflect typical conditions in the studied region, the economic feasibility of reduced nitrogen strategies should be evaluated by considering local cost structures and market conditions. Notably, our results showed that reducing nitrogen fertilizer application significantly improves NUE (by 54.7% and 34.78%), although ROIs show modest reductions in some cases. However, when environmental benefits (an 88% reduction in SNR) and quality improvements (56–217% increases in SSC) are considered alongside economic returns, the L treatment remains optimal through multi-objective evaluation. This integrated perspective—balancing production, environmental, and quality outcomes—extends beyond previous single-objective studies [13,23], and thus demonstrates the effectiveness of integrated optimization for balancing production and environmental sustainability.
Furthermore, reduced nitrogen saves input costs and improves fruit quality; the 14–26% yield reduction may be economically unacceptable for large-scale farmers focusing on bulk production where total output determines profitability. This trade-off suggests that reduced-nitrogen strategies are more suitable for quality-oriented production systems.
5. Conclusions
This study successfully addressed the critical challenge of balancing soil nitrogen leaching with production benefits in greenhouse tomato cultivation. The comprehensive evaluation of different nitrogen fertilization strategies revealed that reducing water-soluble nitrogen fertilizer input enhances the production benefits index, including yield, quality, NUE, and ROI, while simultaneously affecting the soil environmental benefit index, encompassing soil EC and SNR.
The L treatment, consisting of 361.62 kg ha−1 of water-soluble fertilizer in soil solution and 182.6 kg ha−1 in autumn–winter (AW), was identified as the optimal treatment that effectively balances production benefits with soil environmental benefits for local greenhouse tomato production. This finding provides a practical framework for sustainable nitrogen management in controlled environment agriculture.
The results demonstrate that sustainable greenhouse production requires prioritizing fruit quality and soil environmental health over maximizing yield and short-term economic returns. This approach aligns with the broader goals of resource conservation and environmental stewardship in modern agricultural systems. The findings contribute valuable insights to the development of integrated nutrient management strategies that support both productivity and sustainability in greenhouse horticulture, offering significant implications for the comprehensive consideration of resource conservation and production benefits in pursuit of sustainable agriculture.
Supplementary Materials
The following supporting information can be downloaded at: https://www.mdpi.com/article/10.3390/agronomy15102363/s1, Table S1: Eigenvalues obtained by principal component analysis of R in SS and AW; Table S2: Features vectors obtained by principal component analysis of R; Table S3: Fertilization Schedule During the Experiment; Supplementary Material S2: The procedures for PCA; Supplementary Material S3: The procedures for GRA.
Author Contributions
H.W. and L.W.: Writing—original draft, data curation, visualization, methodology, investigation, conceptualization, T.W.: Methodology, formal analysis, visualization, methodology. H.W. and D.G.: Writing—review and editing, resources, methodology, conceptualization, funding acquisition. All authors have read and agreed to the published version of the manuscript.
Funding
This work was funded by the Joint Foundation of National Science Foundation of China (NSFC) and Consultative Group for International Agricultural Research (CGIAR) (No. 32261143464), and National Science Foundation of China (NSFC) (No. 52179053); Centrally Guided Local Science and Technology Development Fund Project [246Z7001G], the National Key R&D Program of China [grant 2021YFB3900602], the Hebei Provincial Water Resources Science and Technology Plan Project [2020-07; 2022-20; 2024-63; HBST2024-03; 2025-72], and the Hebei Academy of Agriculture and Forestry Sciences Agriculture Science and Technology Innovation Project [2022KJCXZX-SSS-7].
Data Availability Statement
The original contributions presented in this study are included in the article/Supplementary Material. Further inquiries can be directed to the corresponding author(s).
Conflicts of Interest
The authors declare no conflicts of interest.
References
- FAO. Food and Agriculture Organization of the United Nations; FAO: Rome, Italy, 2022. [Google Scholar]
- Quinet, M.; Angosto, T.; Yuste-Lisbona, F.J.; Blanchard-Gros, R.; Bigot, S.; Martinez, J.-P.; Lutts, S. Tomato Fruit Development and Metabolism. Front. Plant Sci. 2019, 10, 1554. [Google Scholar] [CrossRef]
- Jensen, A.; Mogensen, L.; van der Werf, H.M.G.; Xie, Y.; Kristensen, H.L.; Knudsen, M.T. Environmental Impacts and Potential Mitigation Options for Organic Open-Field Vegetable Production in Denmark Assessed through Life Cycle Assessment. Sustain. Prod. Consum. 2024, 46, 132–145. [Google Scholar] [CrossRef]
- Si, Z.; Zain, M.; Mehmood, F.; Wang, G.; Gao, Y.; Duan, A. Effects of Nitrogen Application Rate and Irrigation Regime on Growth, Yield, and Water-Nitrogen Use Efficiency of Drip-Irrigated Winter Wheat in the North China Plain. Agric. Water Manag. 2020, 231, 106002. [Google Scholar] [CrossRef]
- Noulas, C.; Torabian, S.; Qin, R. Crop Nutrient Requirements and Advanced Fertilizer Management Strategies. Agronomy 2023, 13, 2017. [Google Scholar] [CrossRef]
- He, F.; Chen, Q.; Jiang, R.; Chen, X.; Zhang, F. Yield and Nitrogen Balance of Greenhouse Tomato (Lycopersicum esculentum Mill.) with Conventional and Site-Specific Nitrogen Management in Northern China. Nutr. Cycl. Agroecosyst. 2007, 77, 1–14. [Google Scholar] [CrossRef]
- Wang, X.; Wang, X.; Sheng, H.; Wang, X.; Zhao, H.; Feng, K. Excessive Nitrogen Fertilizer Application Causes Rapid Degradation of Greenhouse Soil in China. Pol. J. Environ. Stud. 2022, 31, 1527–1534. [Google Scholar] [CrossRef] [PubMed]
- Fan, Y.; Zhang, Y.; Chen, Z.; Wang, X.; Huang, B. Comprehensive Assessments of Soil Fertility and Environmental Quality in Plastic Greenhouse Production Systems. Geoderma 2021, 385, 114899. [Google Scholar] [CrossRef]
- Lv, H.; Zhao, Y.; Wang, Y.; Wan, L.; Wang, J.; Butterbach-Bahl, K.; Lin, S. Conventional Flooding Irrigation and over Fertilization Drives Soil pH Decrease Not Only in the Top- but Also in Subsoil Layers in Solar Greenhouse Vegetable Production Systems. Geoderma 2020, 363, 114156. [Google Scholar] [CrossRef]
- Wang, H.; Wang, X.; Bi, L.; Wang, Y.; Fan, J.; Zhang, F.; Hou, X.; Cheng, M.; Hu, W.; Wu, L.; et al. Multi-Objective Optimization of Water and Fertilizer Management for Potato Production in Sandy Areas of Northern China Based on TOPSIS. Field Crops Res. 2019, 240, 55–68. [Google Scholar] [CrossRef]
- He, Z.; Li, M.; Cai, Z.; Zhao, R.; Hong, T.; Yang, Z.; Zhang, Z. Optimal Irrigation and Fertilizer Amounts Based on Multi-Level Fuzzy Comprehensive Evaluation of Yield, Growth and Fruit Quality on Cherry Tomato. Agric. Water Manag. 2021, 243, 106360. [Google Scholar] [CrossRef]
- Jalpa, L.; Mylavarapu, R.; Hochmuth, G.; Wright, A.; van Santen, E. Apparent Recovery and Efficiency of Nitrogen Fertilization in Tomato Grown on Sandy Soils. HortTechnology 2020, 30, 1–8. [Google Scholar] [CrossRef]
- Wu, Y.; Yan, S.; Fan, J.; Zhang, F.; Xiang, Y.; Zheng, J.; Guo, J. Responses of Growth, Fruit Yield, Quality and Water Productivity of Greenhouse Tomato to Deficit Drip Irrigation. Sci. Hortic. 2021, 275, 109710. [Google Scholar] [CrossRef]
- Chormova, D.; Kavvadias, V.; Okello, E.; Shiel, R.; Brandt, K. Nitrogen Application Can Be Reduced without Affecting Carotenoid Content, Maturation, Shelf Life and Yield of Greenhouse Tomatoes. Plants 2023, 12, 1553. [Google Scholar] [CrossRef] [PubMed]
- Yue, W.; Liu, L.; Chen, S.; Bai, Y.; Li, N. Effects of Water and Nitrogen Coupling on Growth, Yield and Quality of Greenhouse Tomato. Water 2022, 14, 3665. [Google Scholar] [CrossRef]
- Nie, K.; Bai, Q.; Chen, C.; Zhang, M.; Li, Y. DMPP and Polymer-Coated Urea Promoted Growth and Increased Yield of Greenhouse Tomatoes. Horticulturae 2022, 8, 472. [Google Scholar] [CrossRef]
- Wei, Z.; Du, T.; Li, X.; Fang, L.; Liu, F. Interactive Effects of Elevated CO2 and N Fertilization on Yield and Quality of Tomato Grown Under Reduced Irrigation Regimes. Front. Plant Sci. 2018, 9, 328. [Google Scholar] [CrossRef]
- Zhang, M.Z.; Liu, S.P.; Zhang, S.W.; Li, Y. Effects of the Coupling of Microbial Fertilizers and Chemical Nitrogen Fertilizers on Greenhouse Tomato (Solanum lycopersicum L.) Growth and Yield. Appl. Ecol. Environ. Res. 2025, 23, 5561–5596. [Google Scholar] [CrossRef]
- Zheng, Y.; Yang, Z.; Luo, J.; Zhang, Y.; Jiang, N.; Khattak, W.A. Transcriptome Analysis of Sugar and Acid Metabolism in Young Tomato Fruits under High Temperature and Nitrogen Fertilizer Influence. Front. Plant Sci. 2023, 14, 1197553. [Google Scholar] [CrossRef]
- Mao, X.; Gu, J.; Wang, F.; Wang, K.; Liu, R.; Hong, Y.; Wang, Y.; Han, F. Yield, Quality, and Nitrogen Leaching of Open-Field Tomato in Response to Different Nitrogen Application Measures in Northwestern China. Plants 2024, 13, 924. [Google Scholar] [CrossRef]
- Guo, B.; Zhou, B.; Zhang, Z.; Li, K.; Wang, J.; Chen, J.; Papadakis, G. A Critical Review of the Status of Current Greenhouse Technology in China and Development Prospects. Appl. Sci. 2024, 14, 5952. [Google Scholar] [CrossRef]
- DB 13/T 5668-2023; Fertilizer Application Limits for Vegetable Production. Hebei Provincial Administration for Market Regulation: Beijing, China, 2023.
- Wang, D.; Li, G.; Mo, Y.; Cai, M.; Bian, X. Evaluation of Optimal Nitrogen Rate for Corn Production under Mulched Drip Fertigation and Economic Benefits. Field Crops Res. 2018, 216, 225–233. [Google Scholar] [CrossRef]
- Yang, X.; Lu, Y.; Ding, Y.; Yin, X.; Raza, S.; Tong, Y. Optimising Nitrogen Fertilisation: A Key to Improving Nitrogen-Use Efficiency and Minimising Nitrate Leaching Losses in an Intensive Wheat/Maize Rotation (2008–2014). Field Crops Res. 2017, 206, 1–10. [Google Scholar] [CrossRef]
- Zhang, X.; Li, X.; Luo, L.; Ma, Q.; Ma, Q.; Hui, X.; Wang, S.; Liu, J.; Wang, Z. Monitoring Wheat Nitrogen Requirement and Top Soil Nitrate for Nitrate Residue Controlling in Drylands. J. Clean. Prod. 2019, 241, 118372. [Google Scholar] [CrossRef]
- Wu, Y.; Yan, S.; Fan, J.; Zhang, F.; Zhao, W.; Zheng, J.; Guo, J.; Xiang, Y.; Wu, L. Combined Effects of Irrigation Level and Fertilization Practice on Yield, Economic Benefit and Water-Nitrogen Use Efficiency of Drip-Irrigated Greenhouse Tomato. Agric. Water Manag. 2022, 262, 107401. [Google Scholar] [CrossRef]
- Hendricks, G.S.; Shukla, S.; Roka, F.M.; Sishodia, R.; Obreza, T.; Hochmuth, G.J.; Colee, J. Economic and Environmental Consequences of Overfertilization under Extreme Weather Conditions. J. Soil Water Conserv. 2019, 74, 160–171. [Google Scholar] [CrossRef]
- Liu, H.; Duan, A.; Li, F.; Sun, J.; Wang, Y.; Sun, C. Drip Irrigation Scheduling for Tomato Grown in Solar Greenhouse Based on Pan Evaporation in North China Plain. J. Integr. Agric. 2013, 12, 520–531. [Google Scholar] [CrossRef]
- Liu, H.; Li, H.; Ning, H.; Zhang, X.; Li, S.; Pang, J.; Wang, G.; Sun, J. Optimizing Irrigation Frequency and Amount to Balance Yield, Fruit Quality and Water Use Efficiency of Greenhouse Tomato. Agric. Water Manag. 2019, 226, 105787. [Google Scholar] [CrossRef]
- Bélanger, J.M.R.; Jocelyn Paré, J.R.; Sigouin, M. Chapter 2 High Performance Liquid Chromatography (HPLC): Principles and Applications. In Techniques and Instrumentation in Analytical Chemistry; Paré, J.R.J., Bélanger, J.M.R., Eds.; Elsevier: Amsterdam, The Netherlands, 1997; Volume 18, pp. 37–59. [Google Scholar]
- Abdi, H.; Williams, L.J. Principal Component Analysis. WIREs Comput. Stat. 2010, 2, 433–459. [Google Scholar] [CrossRef]
- Wang, Z.; Rangaiah, G.P. Application and Analysis of Methods for Selecting an Optimal Solution from the Pareto-Optimal Front Obtained by Multiobjective Optimization. Ind. Eng. Chem. Res. 2017, 56, 560–574. [Google Scholar] [CrossRef]
- Wang, X.; Xing, Y. Evaluation of the Effects of Irrigation and Fertilization on Tomato Fruit Yield and Quality: A Principal Component Analysis. Sci. Rep. 2017, 7, 350. [Google Scholar] [CrossRef]
- Amin, A.E.E.A.Z. Effect of Co-Applying Different Nitrogen Fertilizers with Bone Char on Enhancing Phosphorus Release in Calcium Carbonate-Rich Soil: An Incubation Study. J. Soil Sci. Plant Nutr. 2023, 23, 1565–1575. [Google Scholar] [CrossRef]
- Hu, W.; Zhang, Y.; Huang, B.; Teng, Y. Soil Environmental Quality in Greenhouse Vegetable Production Systems in Eastern China: Current Status and Management Strategies. Chemosphere 2017, 170, 183–195. [Google Scholar] [CrossRef] [PubMed]
- Lv, H.; Lin, S.; Wang, Y.; Lian, X.; Zhao, Y.; Li, Y.; Du, J.; Wang, Z.; Wang, J.; Butterbach-Bahl, K. Drip Fertigation Significantly Reduces Nitrogen Leaching in Solar Greenhouse Vegetable Production System. Environ. Pollut. 2019, 245, 694–701. [Google Scholar] [CrossRef] [PubMed]
- Kianpoor Kalkhajeh, Y.; Huang, B.; Hu, W.; Ma, C.; Gao, H.; Thompson, M.L.; Bruun Hansen, H.C. Environmental Soil Quality and Vegetable Safety under Current Greenhouse Vegetable Production Management in China. Agric. Ecosyst. Environ. 2021, 307, 107230. [Google Scholar] [CrossRef]
- Behr, J.H.; Kuhl-Nagel, T.; Sommermann, L.; Moradtalab, N.; Chowdhury, S.P.; Schloter, M.; Windisch, S.; Schellenberg, I.; Maccario, L.; Sørensen, S.J.; et al. Long-Term Conservation Tillage with Reduced Nitrogen Fertilization Intensity Can Improve Winter Wheat Health via Positive Plant–Microorganism Feedback in the Rhizosphere. FEMS Microbiol. Ecol. 2024, 100, fiae003. [Google Scholar] [CrossRef]
- Muhammad, I.; Yang, L.; Ahmad, S.; Farooq, S.; Al-Ghamdi, A.A.; Khan, A.; Zeeshan, M.; Elshikh, M.S.; Abbasi, A.M.; Zhou, X.-B. Nitrogen Fertilizer Modulates Plant Growth, Chlorophyll Pigments and Enzymatic Activities under Different Irrigation Regimes. Agronomy 2022, 12, 845. [Google Scholar] [CrossRef]
- Liu, R.; Yang, Y.; Wang, Y.; Wang, X.-C.; Rengel, Z.; Zhang, W.-J.; Shu, L.-Z. Alternate Partial Root-Zone Drip Irrigation with Nitrogen Fertigation Promoted Tomato Growth, Water and Fertilizer-Nitrogen Use Efficiency. Agric. Water Manag. 2020, 233, 106049. [Google Scholar] [CrossRef]
- Li, B.; Wim, V.; Shukla, M.K.; Du, T. Drip Irrigation Provides a Trade-off between Yield and Nutritional Quality of Tomato in the Solar Greenhouse. Agric. Water Manag. 2021, 249, 106777. [Google Scholar] [CrossRef]
- Song, Q.; Fu, H.; Shi, Q.; Shan, X.; Wang, Z.; Sun, Z.; Li, T. Overfertilization Reduces Tomato Yield under Long-Term Continuous Cropping System via Regulation of Soil Microbial Community Composition. Front. Microbiol. 2022, 13, 952021. [Google Scholar] [CrossRef]
- Zhang, F.; Liu, Y.; Liang, Y.; Dai, Z.; Zhao, Y.; Shi, Y.; Gao, J.; Hou, L.; Zhang, Y.; Ahammed, G.J. Improving the Yield and Quality of Tomato by Using Organic Fertilizer and Silicon Compared to Reducing Chemical Nitrogen Fertilization. Agronomy 2024, 14, 966. [Google Scholar] [CrossRef]
- Tanaka, Y.; Maruta, T.; Arima, K.; Nakayama, H.; Hamada, A.; Ishikawa, T. Simultaneous Knockout of VITAMIN C DEFECTIVE 2 and 3 Exacerbates Ascorbate Deficiency and Light Stress Sensitivity. J. Exp. Bot. 2025, eraf352. [Google Scholar] [CrossRef]
- García-Tejero, I.F.; Durán-Zuazo, V.H. Plant Water Use Efficiency for a Sustainable Agricultural Development. Agronomy 2022, 12, 1806. [Google Scholar] [CrossRef]
Disclaimer/Publisher’s Note: The statements, opinions and data contained in all publications are solely those of the individual author(s) and contributor(s) and not of MDPI and/or the editor(s). MDPI and/or the editor(s) disclaim responsibility for any injury to people or property resulting from any ideas, methods, instructions or products referred to in the content. |
© 2025 by the authors. Licensee MDPI, Basel, Switzerland. This article is an open access article distributed under the terms and conditions of the Creative Commons Attribution (CC BY) license (https://creativecommons.org/licenses/by/4.0/).