Article

Contribution of Roots and Shoots of Three Summer Cover Crops to Soil C and N Cycling Post-Termination

Stockbridge School of Agriculture, University of Massachusetts, Amherst, MA 01003, USA
*
Author to whom correspondence should be addressed.
Agronomy 2025, 15(6), 1467; https://doi.org/10.3390/agronomy15061467
Submission received: 30 April 2025 / Revised: 24 May 2025 / Accepted: 27 May 2025 / Published: 16 June 2025

Abstract

Although summer cover crops (CCs) have relatively short growing periods, they can significantly enhance soil health by contributing to carbon (C) and nitrogen (N) cycling. Three summer CCs—including oat, buckwheat, and pea—were planted in June–July and evaluated for their biomass, allocation of assimilates to roots, C and N yield, and residue decomposition patterns after termination in a 14-week period. Total biomass (roots + shoots) was highest in buckwheat (5822 kg ha−1), followed by oat (4836 kg ha−1) and then pea (20 22 kg ha−1). Across species, the allocation of assimilates to roots decreased from 34% at 30 days after planting to 18% at termination. Total C yield was 2409, 1941, and 808 kg ha−1 for buckwheat, oat, and pea, respectively, with root C content considerably lower than shoot C content. The initial carbon-to-nitrogen (C:N) ratios in the roots and shoots of pea were substantially lowest among the species and remained below the 25:1 threshold, indicating potential for net N mineralization. In contrast, oat and buckwheat exhibited initial C:N of 40–50 in roots and around 30 in shoots. These ratios shifted during decomposition. After a 14-week decomposition period, all CCs had released over 50% of their root and shoot biomass. However, the release of their C and N did not directly align with biomass decay. Approximately 70% of the C in roots and shoots of oats and buckwheat remained unreleased after 14 weeks. The slow N release from oat and buckwheat residues suggests potential N immobilization, which could lead to nitrogen deficiency in subsequent crops.

1. Introduction

Improving crop quality and yield in intensified systems while preventing nutrient loss is a critical challenge in developed farmland [1]. There is a long list of agroecological benefits due to integrating cover crops (CCs) in cropping systems [2,3], including improving natural soil fertility, soil physio-chemical properties [4], and consumer health. Moreover, CCs can be considered as an alternative to synthetic fertilizer to reduce the risk of non-point source pollution and act as an agent to rejuvenate farms [3,5,6]. To maximize CCs services, time-sequenced studies can help to quantify various CC species contributions to nutrient cycling. Summer CCs are often cultivated to cover the soil surface and nourish the soil between two income-producing crops following the harvest of fall-planted main crops. The effectiveness of summer CCs after termination is related to their biomass allocation and nutrient provision.
In areas with cool early summer conditions, such as in the Northeast U.S., there is a short window between harvesting fall-planted small grains in mid-June and cultivation of a second crop in August. Therefore, summer CCs with fast growth, high biomass production, and distinct agroecological benefits should be identified. Summer CCs are generally known as high-biomass-producing plants and are efficient in promoting soil health [7,8], mainly due to the favorable temperatures during late spring and late summer [9]. However, to maximize their biomass, summer CCs require full growth. For example, Balkcom and Reeves (2005) [10] reported that Sunn hemp—a summer legume CC—produces 7.6 Mg ha−1 of biomass and fixes as much as 144 kg N ha−1. High biomass production in other summer CC species has been reported, including 2.8 Mg ha−1 for buckwheat [11], 4.0 Mg ha−1 for red clover [12], and 7.5 Mg ha−1 for teff grass [13].
The biomass and decomposition rates of CCs can be modulated by many internal and external factors [14,15,16]. Cover crop species have a pronouncing effect on biomass composition and nutrient content; thus, their decay rates can be quite different [17,18]. Cover crop species differ in nutrient content due to four driving factors: Intrinsic N-demand, efficiency of N-uptake, size of N pool in roots, and the N-Supply pathway. Additionally, crop parts demonstrate variable biomass and composition above- and belowground.
The roots of CCs play a significant role in adding organic C to the soil, uptaking nutrients from the soil [19], and (in the case of legumes) fixing atmospheric N [20]. The amount of C and N released by roots and the contribution of the belowground parts of CCs to the N requirements of subsequent cash crops depends on their biomass and composition [21,22], as well as environmental factors. Despite the significant roles that CC roots play in improving general soil health [22,23], reports are often centered around aerial parts. In many studies, the amount of biomass and N and C contribution of roots to nutrient recycling is overlooked. The contribution of roots to soil fertility is even more neglected when CCs are grown for a relatively short period. Notably, fast acquisitive CC species may induce stronger rhizosphere priming effects on the decay of their residues [18].
The allocation of assimilates to the roots of CC species differs substantially [24]. For example, R:S of 18%, 37%, and 11% have been reported for oil radish, winter rye, and crimson clover, respectively [24,25]. However, reported ratios are often assessed at termination, when CCs are fully grown [9,26]. Generally, as CCs grow, their R:S declines [27,28], reaching the lowest ratio at termination. Therefore, for example, between late June (after harvesting small grains) and mid-August (before a brassica or a small grain such as wheat or barley is planted), the ratio of root biomass to the aerial part in a short growing period may be higher; thus, roots can significantly contribute to the soil health and N needs of the subsequent crop.
Reports indicated that the decay process of aboveground parts is generally faster than that of belowground parts [29,30,31]; however, some reports showed a slower rate [32,33], and more so in no-till systems [34]. This disparity is partly due to differences in biochemical composition (i.e., tannins and secondary metabolites, lignins, and (C:N) [35,36,37]. Moreover, mineral-associated organic matter (MAOM) forms more efficiently from root than shoot residues [38]; thus, root residues foster C stabilization, and release N slower than aerial parts [36,39].
In the current study, we hypothesized that root and shoot decomposition in CCs may not differ considerably when grown in a relatively short period in a conventional tillage system. In addition, in many studies where litter bags were used to monitor the decomposition trend of residues, the bags were placed near, but still outside of the experimental plots to avoid the presence effects of other species [40,41]. In the current study, our litter bags were placed at their own residue species plot and buried in the soil. We postulated that their decomposition dynamics may show different apexes for different species. For example, an analogous study of oat residue decomposition patterns at the second stage showed a slighter decay trend than that of faba bean residue [42]. This was because organic C in grasses is less protected by their association with minerals than they are by organic carbon in legumes [43]. Additionally, oat, pea, and buckwheat are commonly used as summer CCs in the Northern U.S., and the biomass for these CCs has been reported to be 4.0 Mg ha−1 for oat [44], 4.5 Mg ha−1 for buckwheat [45], and 2.5–3.0 Mg ha−1 for pea [46]. Thus, the objective of this field-scale study was to quantify biomass allocation to the roots and aerial parts of these summer cover crops during a relatively short period and, subsequently, quantify the decomposition trend after termination, as well as the N and C contributions of roots and shoots to the soil.

2. Materials and Methods

2.1. Experimental Site

A two-year field study was conducted at the Crops and Animal Research and Education Farm at the University of Massachusetts Amherst in South Deerfield, MA (42°28′41.9″ N, 72°34′40.4″ W) in 2022 and 2023. The soil of the experimental site is classified as Hadley fine sandy loam (coarse–silty, mixed, superactive, nonacid, mesic Typic Udifluvent). The experiments took place on two separate but closely located plots. Each year, a baseline composite soil sample was collected before CC planting. Select chemical properties of the experimental plots in both years are presented in Table 1.
Weather data for the CCs growing period and post-termination (during the decomposition study) are presented in Figure 1, including the 20-year mean, average monthly temperature, total precipitation, and growing degree days (GDD). Weather data were obtained from the weather station located at the UMass Research Farm in South Deerfield, MA. The experimental plots were rainfed and received no supplemental irrigation.

2.2. Cover Crop Establishment

CC species were selected based on particular characteristics, such as, their rapid growth, heat tolerance, familiarity to growers, and suitability in Northeast climate conditions. The three summer CC species selected included pea (Pisum sativum L.), oat (Avena sativa L.), and buckwheat (Fagopyrum esculentum). Cover crops were planted as monocultures in mid-June using a John Deere BD 1108 grain drill, with rows spaced 15 cm apart. The CC species, their characteristics, and their seeding rates are presented in Table 2. In both years, the study was conducted on an experimental block measuring 35 m by 38 m (for each replication plot: 2.4 × 7.6 m). In both years, the CCs were terminated in late August using a flail mower, and residues were incorporated into soil using a rototiller (Figure 2). Details on the CCs characteristics, establishment, and major agronomic practices are presented in Table 2 and Table 3.

2.3. Cover Crop Biomass and Root Shoot Allocation

In both years, a 0.71 m × 0.71 m (0.5 m2) quadrat was used to randomly harvest CCs from each replication at two growing stages: 30 days after planting (DAP) and late August before termination (60 DAP). Cover crops were hand-clipped at the soil surface to evaluate the aboveground biomass. The remainder of the CC plants were carefully dug out. To avoid missing root biomass and underestimating total plant biomass, we excavated several plants outside the experimental plots to determine the maximum root depth among the three cover crop species. Based on these preliminary observations, a depth of 60 cm was deemed sufficient to capture the entire root system, ensuring accurate biomass estimation. Roots were transferred to a large plastic container filled with water to remove soil contamination. Root samples were washed very carefully in a 0.5 mm sieve mesh to capture 95% of the root biomass [49,50]. Harvested roots and shoots were oven-dried at 60 °C to constant weight.

2.4. Cover Crop Root and Shoot Residue Decomposition Kinetics

Biomass, C, and N release trends from cover crop root and shoot residues were monitored for 14 weeks. Just prior to CCs termination, 20 plants from each experimental plot were randomly selected, dogged out, and washed carefully. Fresh samples of roots and shoots (including leaves, stems, and flowers) were cut into 1 cm length segments and separately placed in nylon mesh litter bags (12 cm × 10 cm). Equal proportions of roots (7 g) and shoots (33 g) from all species were placed in corresponding mesh bags (3 CC species × 4 reps × 6 harvesting time = 72 for each root and shoot). The same amount of fresh material in litter bags was dried in a forced-air oven to measure the corresponding dry weight and determine the starting point of the decomposition study. Litter bags containing roots and shoots were buried 15 cm deep in their corresponding CC species to mimic a conventional tillage system. Root and shoot litter bags were harvested at 0-, 1-, 2-, 4-, 10-, and 14-week intervals, covering the growing window of a fall-planted cash crop (29 August–5 December) before freezing. After each harvest, litter bags were gently cleaned using a brush to avoid soil and other non-target particles. Harvested samples were transferred to a forced-air oven for 72 h at 60 °C until reaching constant weight. All samples were finely ground (1 mm screen) using a Foss Cyclotec 1093, Hilleroed, Denmark, and analyzed for the total N and C contents using the Kjeldahl procedure [51] and near-infrared spectroscopy.
Statistical analysis:
The experimental design for CCs biomass yield and its residue decompaction kinetic followed a complete randomized plot (CRP) with four replications. In the CC biomass yield experiment, data were compared through analysis of variance (ANOVA) using proc-GLM in SAS studio (SAS version 9.4: SAS Institute Inc., Cary, NC, USA). Mean separation was conducted using Tukey’s test at p ≤ 0.05 and sliced for the cover crop species. For the decomposition experiment, trends in mass, N, and C loss were compared across CC species and plant parts (root and shoot). To meet the assumption of homogeneity of residual variance in ANOVA, data from the decomposition experiment were normalized and log-transformed prior to analysis. For ease of graphical visualization and interpretation, the results were subsequently back-transformed. Regression analysis was performed using PROC REG in SAS (SAS version 9.4: SAS Institute Inc., Cary, NC, USA). Tukey’s test (p ≤ 0.05) was applied for mean separation and species-specific slicing. The analysis considered fixed factors including experiment year, CC species, and plant parts (root and shoot), while replication was considered a random effect.

3. Results

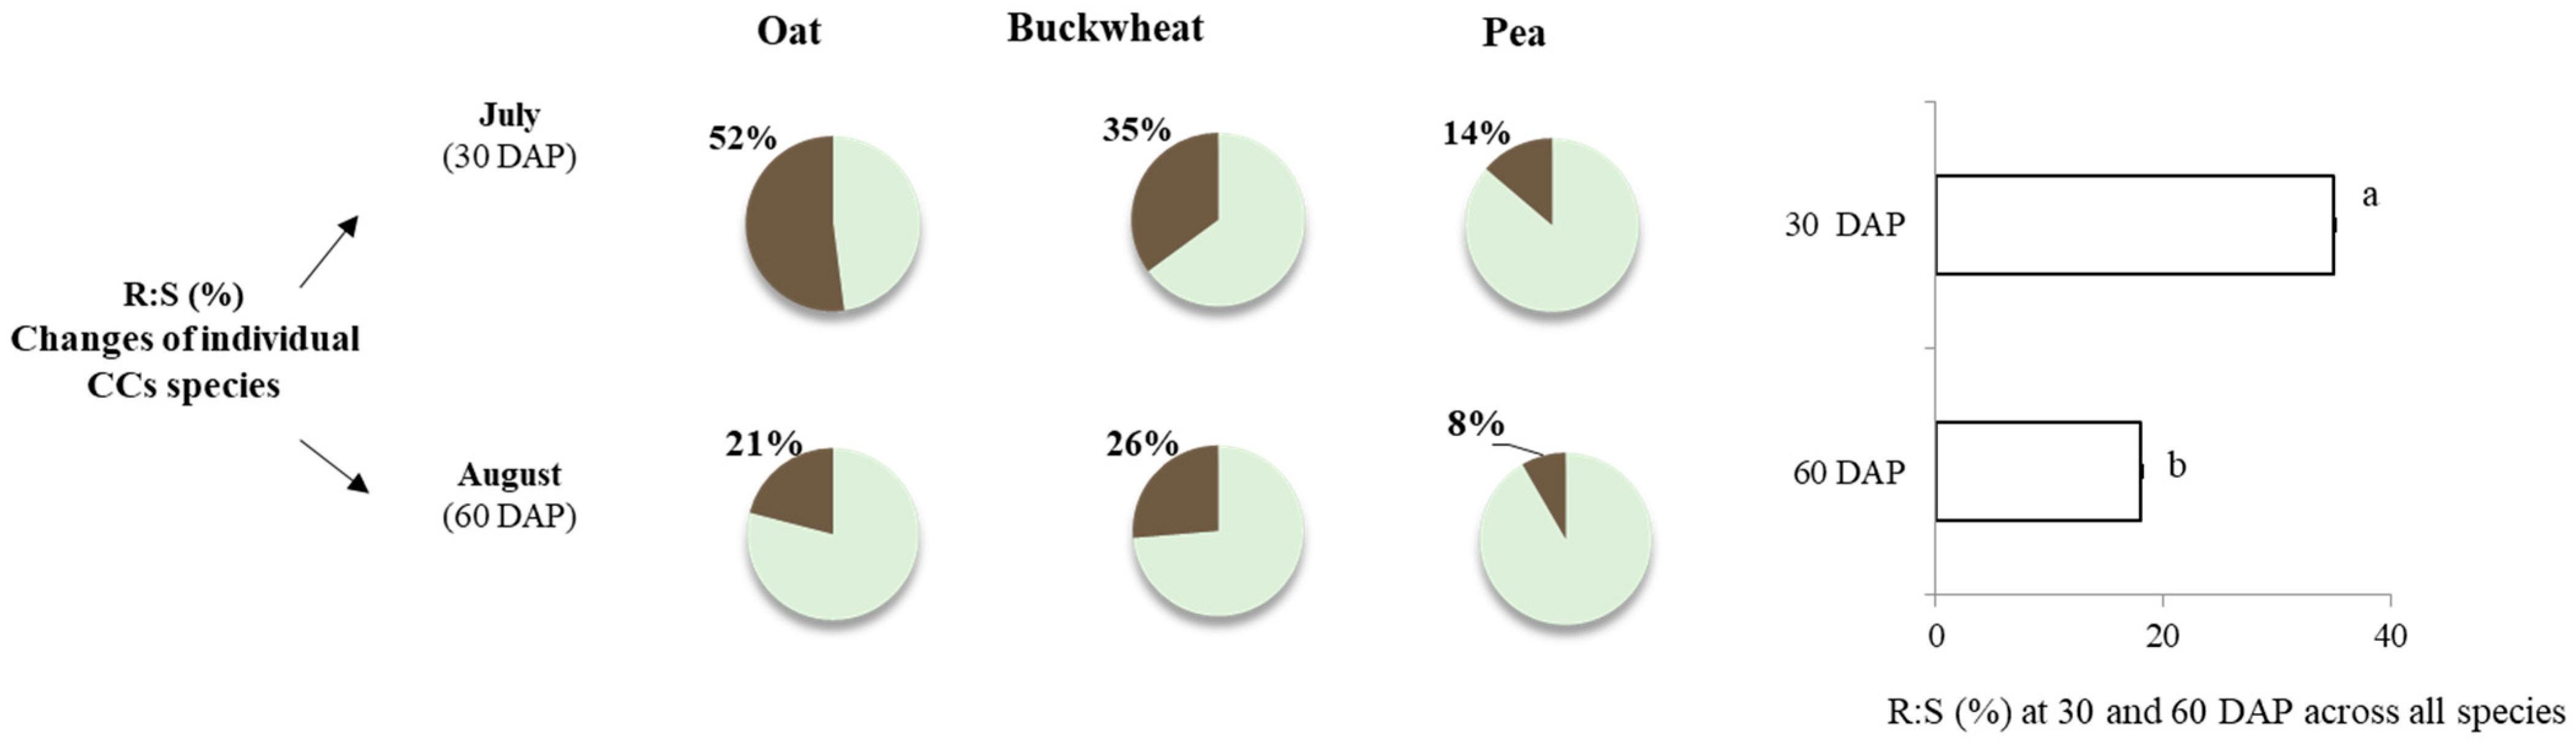
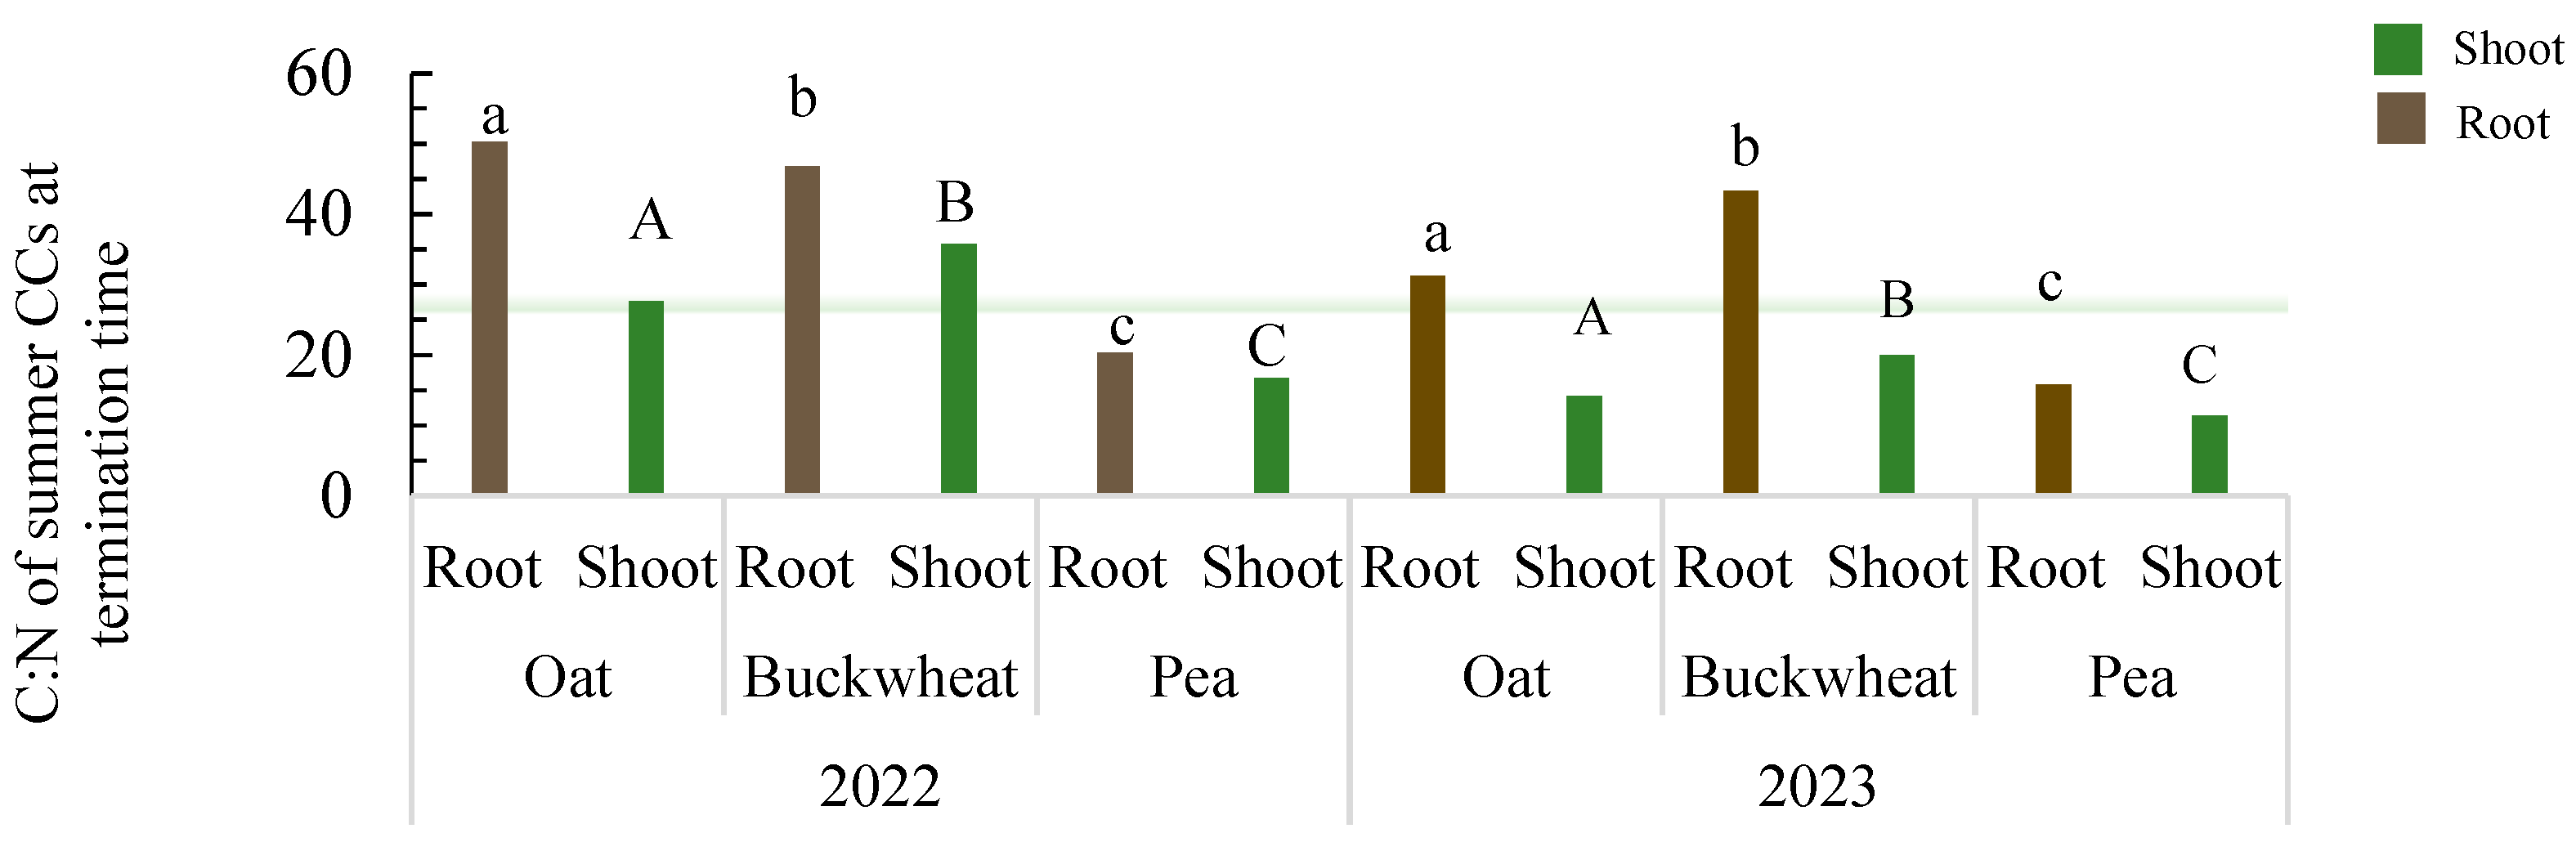
3.1. Cover Crop Biomass, Root and Shoot Assimilate Allocation, C and N Distribution

Total biomass accumulation and assimilate allocation to roots and shoots differed in 2022 and 2023 (Table 4); however, the relative rankings of CC species for biomass production remained consistent across both years and in the following order: buckwheat > oat > pea. Variations in total biomass between 2022 and 2023 were partially influenced by edaphic factors such as temperature and humidity but primarily driven by differences in planting dates: 23 June 2022 and 10 July 2023 (Table 2). The earlier planting in 2022 led to seed production in oat and, to a lesser extent, buckwheat. To mitigate this issue, planting was delayed by 17 days in 2023.
As the summer CCs approached termination, the root-to-shoot (R:S) ratio declined significantly from 34% to 18% (p < 0.001), averaged across all species (Figure 3). However, the decline in R:S varied among species. Although roots continued to grow, the proportion of assimilates allocated to roots decreased relative to shoots. For instance, 30 days after planting (DAP) in July, the R:S declined from 52% to 21% in oat, 14% to 8% in pea, and 35% to 26% in buckwheat (Figure 3).
The roots and shoots of CCs not only accumulated different amounts of assimilates but also differed in C and N contents, which were influenced by species, termination timing, and year (Figure 4 and Figure 5). In other words, C and N allocation between belowground and aboveground biomass varied significantly among CC species and, to a lesser extent, between the two years of the experiment (Table 4). At termination in both years, buckwheat and oat accumulated considerably more C and N in their roots than pea, whereas biomass allocation to the shoots of pea was greater than oat and buckwheat.
These variations in C and N contents between roots and shoots resulted in significant differences in their C:N, the key indicator of decomposition dynamics. Across both years, roots consistently exhibited higher C:N than shoots at termination time, regardless of species (Figure 6). However, the percentage of C in roots and shoots, calculated relative to their respective biomass, varied between years. For instance, root C content (as a percentage of root biomass) ranked in the order of buckwheat (19.7%) > oat (15.2%) > pea (6.7%) in 2022, whereas in 2023, the ranking was oat (20.5%) > buckwheat (11.9%) > pea (8.6%) (Figure 4). These values are summarized in Table 4, indicating species-specific differences in root C accumulation.
Carbon percentages in shoots followed a consistent ranking across years but differed significantly among species. In 2022, the ranking of shoot C content was buckwheat (80.3%) > oat (84.4%) > pea (93.3%), while in 2023, it was buckwheat (88.1%) > oat (79.5%) > pea (91.4%). The slightly lower shoot C values in 2023 may pertain to the shorter growing period than that of 2022.
The carbon-to-nitrogen (C:N) ratio of cover crop roots and shoots is an important metric influencing the rate of residue decomposition following termination. In this study, initial root C:N were considerably higher than those of the aerial parts and significantly affected by CC species, year, and year-by-treatment interactions. As anticipated, pea exhibited the lowest initial C:N in both roots and shoots, well below the commonly accepted threshold (25:1) indicating a potential for net nitrogen mineralization. In contrast, the initial C:N for oat and buckwheat ranged from 40 to 50 in roots and approximately 30 in shoots.
However, these initial values did not remain static. The C:N evolved during the decomposition process (Figure 5 and Figure 6), with the magnitude of change closely tied to the initial C:N values. Specifically, residues with higher initial ratios, such as the roots of oat and buckwheat, experienced more substantial shifts in their C:N during decay. This pattern suggests a greater initial degree of nutrient immobilization, followed by gradual release.
At termination, the aerial parts of all three CCs exhibited C:N at or below the threshold for net nitrogen mineralization, except for buckwheat, whose shoot C:N initially exceeded 25:1. However, this ratio declined to the threshold level within two weeks of post-termination. The observed decrease in C:N over time indicates a faster release of carbon relative to nitrogen, a pattern commonly associated with residue decomposition that begins with higher initial C:N.

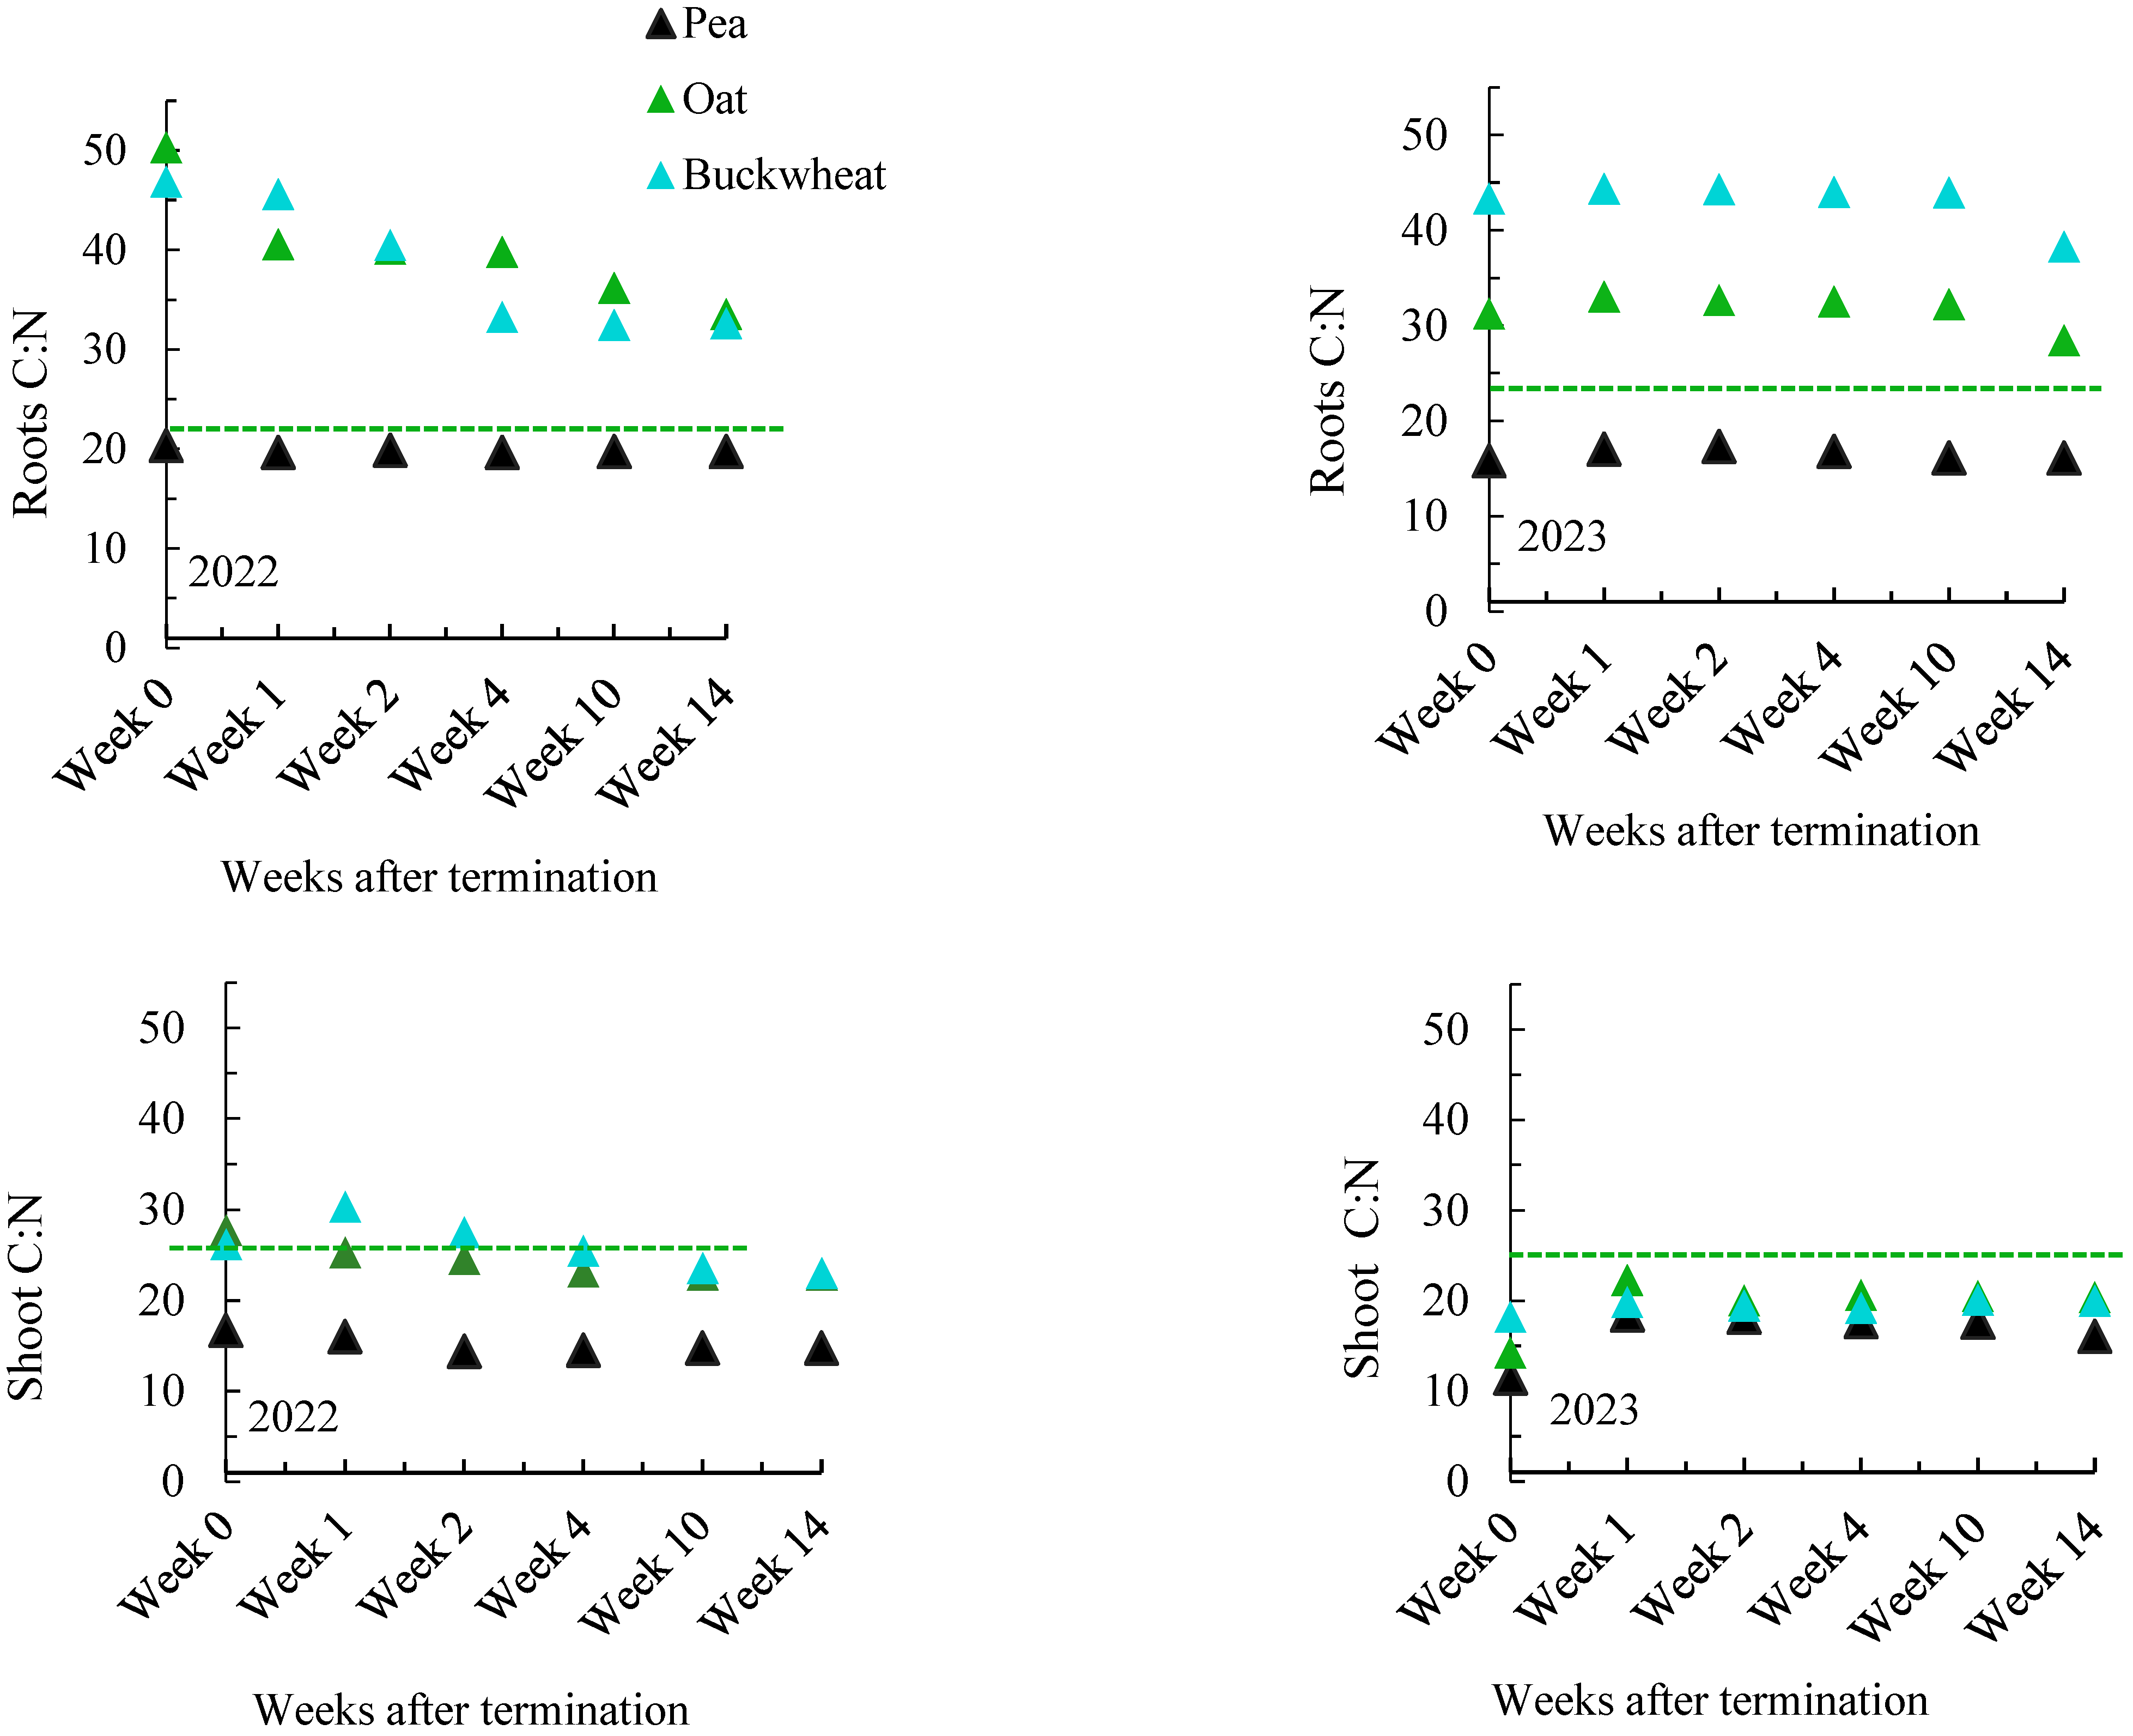
3.1.1. Decomposition Trend of Root and Shoot Residues

As expected, pea residues decomposed significantly faster than those of oat and buckwheat, primarily due to the lower C:N (Figure 7). In both years, approximately 50% of pea root biomass decomposed within two weeks post-termination. In contrast, oat and buckwheat roots decomposed more slowly, reaching the 50% decomposition threshold after 10 weeks in 2022 and after 14 weeks in 2023. The faster decomposition observed in 2022 may be partly due to warmer temperatures (higher GDD) and greater precipitation during the decomposition period than in 2023.
In 2022, shoot residues decomposed more slowly than root residues, whereas in 2023, decomposition rates for shoots and roots were similar. As a result, it took 14 weeks for pea shoot residues to reach the 50% decomposition threshold in 2022, while 57% of buckwheat and 64% of oat shoot biomass remained undecomposed by the end of the study period (Figure 7). By contrast, root residues of all CC species reached the 50% decomposition threshold within approximately four weeks. No significant differences in root decomposition were observed between buckwheat and oat (Table 5). The R² values were consistent across the three CC species, indicating low variability in decomposition patterns among them (Figure 7).

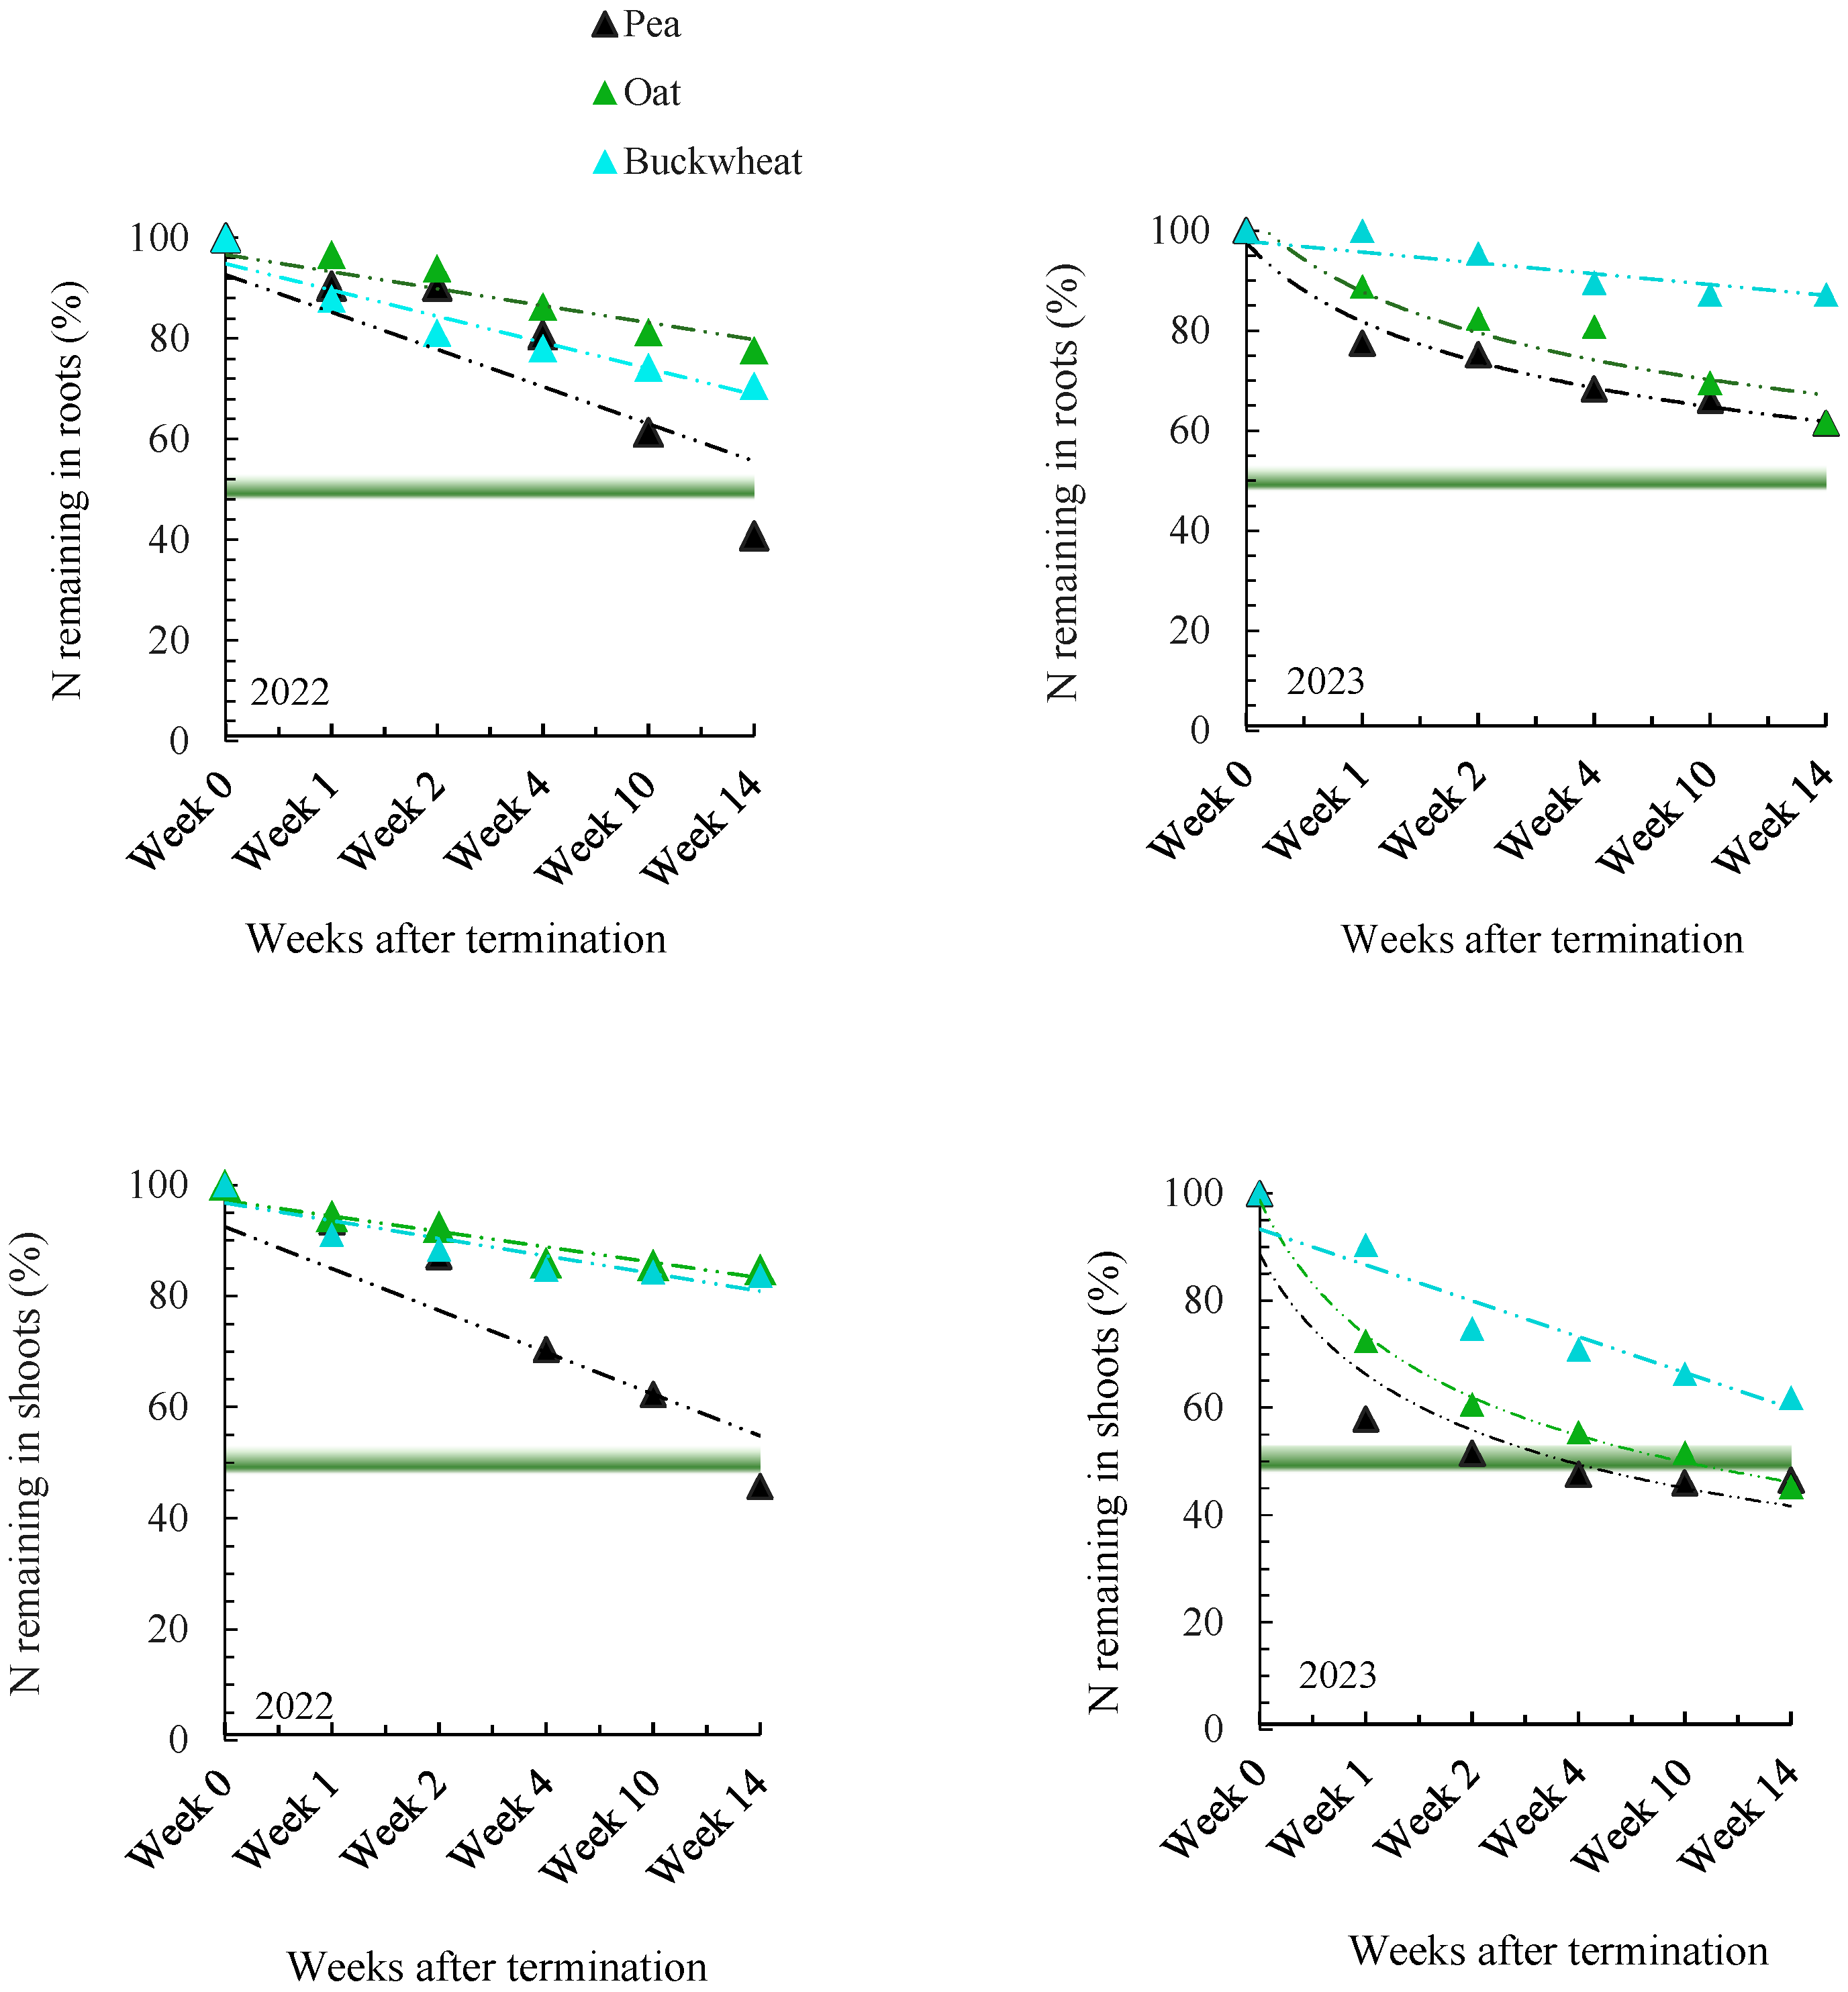
3.1.2. N and C Release from Roots and Shoots of Cover Crop Residues

The percentage of N and C remaining in root and shoot residues was measured at each sampling point (harvest) and compared to the initial N and C contents of the corresponding cover crop species. Regression analysis of N dynamics revealed significant variation among CC species (Figure 8). In both years, N release from pea residues, both roots and shoots, was notably faster than from oat and buckwheat. For pea and oat shoots in 2023, N release followed a quadratic trend, whereas N release from buckwheat residues exhibited a linear pattern (Table 6).
In 2022, approximately 45% of the total N in pea roots and shoots was released within 10 weeks. In contrast, even after 14 weeks, more than 80% of the initial N in oat and buckwheat residues remained unreleased. Although N release from oat residues was faster in 2022 than in 2023, it still did not reach the 50% release threshold in either year. Interestingly, in 2023, N release from the aerial parts of pea was faster than in 2022, reaching the 50% threshold within three weeks. However, a substantial portion of N remained in the roots of pea even after 14 weeks of decomposition (Figure 8).
Regression analysis of C release from CC residues showed less variation among species compared to nitrogen (N) release (Figure 9; Table 7). Additionally, C release patterns were relatively consistent across both years. When averaged over two years, the percentage of C remaining in root residues was 83.8% for buckwheat, 74.7% for pea, and 73.8% for oat. Similarly, the percentage of C remaining in shoot residues was 87.5% for buckwheat, 75.8% for pea, and 77.8% for oat.

4. Discussion

4.1. Cover Crop Biomass, Root and Shoot Assimilate Allocation, and C and N Distribution

This study evaluated biomass allocation between roots and shoots in three summer CC species, quantifying their carbon (C) and nitrogen (N) contributions to the soil. Despite the relatively short growing periods—60 days in 2022 and 47 days in 2023—these CCs maintained continuous living root systems between the cultivation of two potential cash crops—one harvested in June and one planted in early fall—while offering additional agronomic and ecological benefits. Both long-term improvements in soil organic carbon (SOC) and short-term enhancements through nitrogen recycling can significantly contribute to the overall soil health and environmental quality [9,52].
This study primarily aimed to quantify N and C inputs from CC residues, a major ecological service attributable to cover cropping, as sequestered carbon is essential for maintaining and enhancing SOC levels [53]. The biomass yield of cover crops is considered a primary indicator of their potential agroecological benefits. Despite the short growing window in this study, biomass production across all three species was considerably high. For instance, averaged over two years, the total biomass (roots + shoots) for buckwheat was 5.8 Mg ha−1, the highest among the species studied here but less than the 6.4 Mg ha−1 reported by Bilenkey et al. (2022) [13]. This discrepancy highlights the influence of key factors such as planting date, seeding rate, growing duration, termination time, and environmental conditions. Notably, Bilenkey et al. [13] used a seeding rate of 123 kg ha−1, nearly double that of this study (67 kg ha−1). In addition, longer growing periods generally result in greater biomass accumulation. For example, Ruis et al. (2019) [9] and Almeida et al. (2024) [54] reported average biomass yields of 3.37 Mg ha−1 and 7.56 Mg ha−1, respectively, for cereal rye under extended growing periods. Similarly, high-yielding winter cover crops like winter wheat [8], winter rye, and triticale [55] achieve peak biomass during longer seasons. Duiker (2014) [56] emphasized that the month of May is critical for biomass accumulation in cereal rye, with early October plantings yielding 1–7 Mg ha−1 by early May, and up to 12 Mg ha−1 by early June.
Specific emphasis was placed on R:S. This metric is important for two main reasons: first, it can improve CCs carbon input estimation, especially when roots account for up to 30% of total plant biomass [57,58]; second, as the distribution of photo-assimilates between roots and shoots is considered a balance activity [59], it helps to estimate root biomass when only the shoot biomass is known [60], for example, nutrient accumulation at termination time [61,62]. However, the relative amount of biomass allocated to the roots depends on soil fertility and is generally lower when the nutrient supply in soil is high [63]. Generally, root biomass allocation is lower in nutrient-rich soils [63]. Analogous studies showed that root biomass in grasses typically comprises 20–30% of the total biomass [57,58], aligning well with the findings of this study.
In our study, species-specific differences in R:S were pronounced. Root biomass accounted for 26% of total biomass in buckwheat, but only 8% in pea. Furthermore, all species exhibited a declining R:S trend over time. At the time of termination, the R:S decreased by 60% in oat, 43% in pea, and 25% in buckwheat compared with values measured 30 days after planting. This reduction with stand age supports the resource allocation strategy proposed by Jain (1979) [64], where R:S adjust to optimize resource use between vegetative and reproductive growth stages. A novel contribution of this study is the quantification of how assimilate allocation shifts between roots and shoots across species within a short growing period, an insight with implications for modeling CCs performance and ecological benefit under constrained seasonal windows.
In addition to differences in assimilate allocation between roots and shoots, the amount of C in these plant parts, calculated based on their respective biomass, showed substantial variability. At termination, root C accumulation was 309.6 kg C ha−1 for oat, 410 kg C ha−1 for buckwheat, and 57.1 kg C ha−1 for pea. By contrast, C yield in the aerial parts of the summer CCs was 1631.1 kg C ha−1 (oat), 1999.2 kg C ha−1 (buckwheat), and 751.3 kg C ha−1 (pea). Recently, Smychkovich et al. (2025) [53] reported that fall-planted CCs grown on the same research farm produced between 787 and 1194 kg C ha−1, which can potentially contribute to the soil organic carbon (SOC). Despite the shorter growing period in the current study, the C yield was considerably higher than that reported by Smychkovitch et al. (2025) [53]. This is not unexpected, as summer growing conditions—particularly higher temperatures—are generally more favorable for photosynthesis compared with those in the fall.

4.2. Decomposition Trend of Root and Shoot Residues

Our study also tracked the C loss dynamics from CC residues, which varied significantly between species and plant parts. Notably, our decomposition experiment used fresh, non-senesced litter. The higher water content in fresh residue can enhance microbial activity and accelerate decomposition [65] compared with studies using dried samples in litter bags. Across both years, C release from decaying roots and shoots in all three CC species remained slow, with no treatment reaching 50% C loss by week 14. Indeed, carbon decomposition in soil depends heavily on the chemical form and structural complexity of the organic matter [66]. While higher C content in residues suggests greater potential for SOC input, decomposition is moderated by soil texture and the biochemical structure of the residues. Crop species or cultivars exhibiting slower decomposition rates may possess lignin–cellulose complexes that are resistant to microbial breakdown. Additionally, the slow C release may partly reflect low soil temperatures from September to December, which can limit microbial biomass and enzyme activity [67,68]. Interestingly, the high C:N in roots compared with aerial biomass suggests that root-derived C is retained longer post-termination, implying a greater long-term contribution to SOC than that from aboveground biomass.
To assess the turnover dynamics of root and shoot biomass in CCs, this study evaluated whether their residues could contribute to the plant-available nitrogen (N) needs of a subsequent cash crop. All three summer CC species accumulated more N in their shoots than in their roots. This distribution could pose a challenge in no-till systems, where surface residues decompose slowly, delaying N release. However, in this study, CC residues were incorporated into the soil, likely accelerating N mineralization.
At the beginning of the study, we hypothesized that incorporating aerial biomass would promote faster N release, thereby reducing the risk of N immobilization in double-cropping systems. However, total N accumulation in CCs roots and shoots was relatively low, ranging from 46.7 kg N ha−1 in pea to 58.3.6 kg N ha−1 in buckwheat. The relatively low N yield in the current study was not unexpected, as the CCs were neither fertilized nor preceded by a fertilized crop, meaning no residual soil N was available.
As expected, N release from pea residues was more rapid than from the non-legume CCs, with over 50% of accumulated N released within 14 weeks. By contrast, N release from oat and especially buckwheat residues were much slower and did not correspond proportionally to the rate of biomass decay. The initial C:N of crop residues is a useful predictor of whether net N mineralization or immobilization will occur [69,70].
Our findings suggest that, apart from pea (and potentially other summer legumes), summer CCs may cause temporary N immobilization, which could hinder the growth of a subsequent fall-planted crop unless supplemented with additional N fertilizer. Moreover, beyond N dynamics, previous studies have reported that oat and buckwheat residues may exert allelopathic effects on the following crop [47,48].
As nutrients accumulated by CCs are released progressively, the carbon-to-nitrogen (C:N) ratio serves as a useful indicator of residue decomposition and mineralization rates [69]. It also aids in estimating optimal N synchronization for the subsequent crop [2,4,71]. In this study, the C:N of CCs was higher in 2022 than in 2023, likely because more mature crops tend to contain greater proportions of carbon-rich compounds (e.g., sugars and starches) relative to N. This pattern is especially evident in rapidly growing tissues, where carbohydrate synthesis outpaces protein accumulation.
Consistently, roots C:N were higher than those of their corresponding shoots and remained above the minimum threshold for net N mineralization throughout the decomposition study, except in pea. Similar C:N values between roots and shoots in legumes have been reported previously [72], likely due to a more even distribution of nitrogen across plant parts [73]. By contrast, the greater variability observed between root and shoot C:N in oat may attribute to the chemical composition of the tissues; oat roots tend to store more carbohydrates and thus contain high total carbon content relative to nitrogen [2,74,75]. Furthermore, in contrast to legumes that typically do not overwinter, cereal crops such as oat show a decline in tissue nitrogen concentration as an adaptive mechanism to endure cold conditions, including freeze–thaw cycles during winter [76]. Among both roots and shoots, buckwheat exhibited the highest C:N, while pea had the lowest. The elevated C:N in buckwheat may be due to its higher cellulose and lignin contents in cell walls [77], as well as the presence of anti-nutritional compounds such as tannins and phytic acid, which can bind nitrogen and subsequently reduce its availability within plant tissues [78]. Additionally, both root and shoot tissues showed higher C:N and slower residue decomposition in 2022 than in 2023. The increased C:N in 2022 likely reflects a longer growth period, which may have resulted in the greater accumulation of structural, carbon-rich, and nitrogen-poor components like lignin and cellulose. As plants mature, nitrogen content in older tissues tends to decrease due to reduced growth rates and the reallocation of nitrogen to reproductive processes. Furthermore, the slower decomposition observed in 2022 may also be partly explained by drier conditions from August to October and lower GDD during September and October (Figure 1).

5. Conclusions

Our findings indicated that integrating summer CCs into a double cropping system where CCs are grown for a relatively short period between two cash crops may offer limited agroecosystem benefits, primarily through modest increases in soil organic carbon (SOC). However, the quantity and timing of nitrogen (N) release from CC residues could hinder the growth and productivity of the subsequent cash crop, particularly in the absence of supplemental N. In this context, legumes such as pea, as well as other summer CCs with higher N content, may serve as valuable sources of supplemental N for crops planted in late summer or early fall.
This study also highlights the relatively small contribution of roots to overall C and N cycling, largely due to low initial soil fertility and the use of conventional tillage. Nonetheless, the role of summer CC roots in enhancing soil C stabilization should not be overlooked, as they can contribute to soil organic matter (SOM) formation and support long-term soil health.

Author Contributions

M.H., experimental design, methodology, and conceptualization. A.S. and D.S., analysis tools and data. M.H., financial support, resources, and supervision. M.H. and A.S., data interpretation, review, and editing. S.H., data collection and conceptualizing. D.S. paper draft. A.S., chemical analysis. All authors have read and agreed to the published version of the manuscript.

Funding

This material is based on work supported by the National Institute of Food and Agriculture, U.S. Department of Agriculture, and the Center for Agriculture, Food and the Environment at the University of Massachusetts Amherst, under project number MAS00579. The contents are solely the responsibility of the authors and do not necessarily represent the official views of the USDA or NIFA.

Data Availability Statement

The data supporting the findings of this study are available from the authors upon request.

Conflicts of Interest

The authors declare no conflicts of interest.

References

  1. Lyu, H.; Li, Y.; Wang, Y.; Wang, P.; Shang, Y.; Yang, X.; Wang, F.; Yu, A. Drive soil nitrogen transformation and improve crop nitrogen absorption and utilization—A review of green manure applications. Front. Plant Sci. 2024, 14, 1305600. [Google Scholar] [CrossRef] [PubMed]
  2. Singh, A.; Bista, P.; Deb, S.K.; Ghimire, R. Simulating cover crops impacts on soil water and nitrogen dynamics and silage yield in the semi-arid Southwestern United States. Agric. Water Manag. 2025, 307, 109246. [Google Scholar] [CrossRef]
  3. Ahmadnia, F.; Ebadi, A.; Hashemi, M.; Ghavidel, A.; Alebrahim, M.T. Impact of Oat (Avena sativa L.) and Daikon Radish (Raphanus Sativus var. Longipinnatus) Cover Crops on Some Soil Properties. Appl. Soil Res. 2024, 12, 1–17. [Google Scholar]
  4. Ghorbi, S.; Ebadi, A.; Parmoon, G.; Siller, A.; Hashemi, M. The Use of Faba Bean Cover Crop to Enhance the Sustainability and Resiliency of No-Till Corn Silage Production and Soil Characteristics. Agronomy 2023, 13, 2082. [Google Scholar] [CrossRef]
  5. Robertson, G.P.; Vitousek, P.M. Nitrogen in agriculture: Balancing the cost of an essential resource. Annu. Rev. Environ. Resour. 2009, 34, 97–125. [Google Scholar] [CrossRef]
  6. Rees, H.W.; Chow, T.L. Impact of incorporated hay mulch on selected physical, chemical and microbiological properties of a loam soil in Atlantic Canada after five years of continuous potato production. Can. J. Soil Sci. 2005, 85, 161–172. [Google Scholar] [CrossRef]
  7. Lami, F.; Vuerich, M.; Fabro, M.; Zandigiacomo, P.; Braidot, E.; Petrussa, E.; Barbieri, S.; Volpe, V.; Sigura, M.; Delle Vedove, G.; et al. Sustaining multiple ecosystem functions in agricultural landscapes: Effect of summer cover crops on weed control, soil quality and support to pollinators. Crop Prot. 2024, 184, 106832. [Google Scholar] [CrossRef]
  8. Weiler, D.A.; Giacomini, S.J.; Recous, S.; Bastos, L.M.; Pilecco, G.E.; Dietrich, G.; Aita, C. Trade-off between C and N recycling and N2O emissions of soils with summer cover crops in subtropical agrosystems. Plant Soil 2018, 433, 213–225. [Google Scholar] [CrossRef]
  9. Ruis, S.J.; Blanco-Canqui, H.; Creech, C.F.; Koehler-Cole, K.; Elmore, R.W.; Francis, C.A. Cover Crop Biomass Production in Temperate Agroecozones. Agron. J. 2019, 111, 1535–1551. [Google Scholar] [CrossRef]
  10. Balkcom, K.S.; Reeves, D.W. Sunn-hemp utilized as a legume cover crop for corn production. Agron. J. 2005, 97, 26–31. [Google Scholar] [CrossRef]
  11. Bulan, M.T.S.; Stoltenberg, D.E.; Posner, J.L. Buckwheat Species as Summer Cover Crops for Weed Suppression in No-Tillage Vegetable Cropping Systems. Weed Sci. 2015, 63, 690–702. [Google Scholar] [CrossRef]
  12. Yang, X.; Reynolds, W.D.; Drury, C.F.; Reeb, M.A. Impacts of summer-seeded legume cover crops and termination-tillage method on nitrogen availability to corn in rotation. Front. Soil Sci. 2022, 2, 1082940. [Google Scholar] [CrossRef]
  13. Bilenky, M.T.; Nair, A.; McDaniel, M.D. Effect of summer cover crops on cabbage yield, weed suppression, and N mineralization in a low input cropping system. Front. Sustain. Food Syst. 2022, 6, 1021639. [Google Scholar] [CrossRef]
  14. Angst, Š.; Mudrák, O.; Frouz, J.; Jílková, V.; Schnablová, R.; Straková, P.; Veselá, H.; Angst, G. The effect of dead standing (marcescent) biomass on litter decomposition in herbaceous flora is governed by plant functional group. Funct. Ecol. 2024, 38, 1309–1319. [Google Scholar] [CrossRef]
  15. Follstad Shah, J.J.; Kominoski, J.S.; Ardón, M.; Dodds, W.K.; Gessner, M.O.; Griffiths, N.A.; Hawkins, C.P.; Johnson, S.L.; Lecerf, A.; LeRoy, C.J.; et al. Global synthesis of the temperature sensitivity of leaf litter breakdown in streams and rivers. Glob. Change Biol. 2017, 23, 3064–3075. [Google Scholar] [CrossRef] [PubMed]
  16. Adhikari, A.; Bishal, D.; Regmi, S.; Timilsena, K.; Lamsal, S. Effect of sowing methods and varieties on growth and yield of wheat (Triticum aestivum L.) in Dang, Nepal. Agric. Environ. Sci. 2024, 9, 58–63. [Google Scholar] [CrossRef]
  17. De Notaris, C.; Peixoto, L.; Mortensen, E.Ø.; Rasmussen, J. Cover crop biomass production as a predictor of nitrogen fertilizer replacement value-legumes secure positive effects. Ecosyst. Environ. 2025, 381, 109446. [Google Scholar] [CrossRef]
  18. Wang, P.; Liu, Y.; Zhang, B.; Li, L.; Lin, L.; Li, X.; Zeng, Q. The effect of litter decomposition mostly depends on seasonal variation of ultraviolet radiation rather than species in a hyper-arid desert. Front. Environ. Sci. 2024, 12, 1379442. [Google Scholar] [CrossRef]
  19. Schulz, S.; Brankatschk, R.; Dümig, A.; Kögel-Knabner, I.; Schloter, M.; Zeyer, J. The role of microorganisms at different stages of ecosystem development for soil formation. Biogeosciences 2013, 10, 3983–3996. [Google Scholar] [CrossRef]
  20. Bergmann, J.; Weigelt, A.; van der Plas, F.; Laughlin, D.C.; Kuyper, T.W.; Guerrero-Ramirez, N.; Valverde-Barrantes, O.J.; Bruelheide, H.; Fresche, G.T.; Iversen, C.M.; et al. The fungal collaboration gradient dominates the root economics space in plants. Sci. Adv. 2020, 6, eaba3756. [Google Scholar] [CrossRef]
  21. Lavergne, S.; Vanasse, A.; Thivierge, M.N.; Halde, C. Pea-based cover crop mixtures have greater plant belowground biomass, but lower plant aboveground biomass than a pure stand of pea. Agric. Ecosyst. Environ. 2021, 322, 107657. [Google Scholar] [CrossRef]
  22. Amsili, J.P.; Kaye, J.P. Root traits of cover crops and carbon inputs in an organic grain rotation. Agric. Food Syst. 2021, 36, 182–191. [Google Scholar] [CrossRef]
  23. Wang, Q.; Li, S.; Li, J.; Huang, D. The Utilization and Roles of Nitrogen in Plants. Forests 2024, 15, 1191. [Google Scholar] [CrossRef]
  24. Wong, K.M.; Griffiths, M.; Moran, A.; Johnston, A.; Liu, A.E.; Sellers, M.A.; Topp, C.N. Cover crop cultivars and species differ in root traits potentially impacting their selection for ecosystem services. Plant Soil 2024, 500, 279–296. [Google Scholar] [CrossRef]
  25. Kemper, R.; Döring, T.F.; Legner, N.; Meinen, C.; Athmann, M. Oil radish, winter rye and crimson clover: Root and shoot performance in cover crop mixtures. Soil 2023, 506, 157–172. [Google Scholar] [CrossRef]
  26. Saadat, D.; Siller, A.; Hashemi, M. Phenology, Nitrogen Status, and Yield of Red Clover (Trifolium pretense L.) Affected by Application of Vitamin B12, Humic Acid, and Enriched Biochar. Agronomy 2023, 13, 2885. [Google Scholar] [CrossRef]
  27. Iwasa, Y.; Roughgarden, J. Shoot/root balance of plants: Optimal growth of a system with many vegetative organs. Popul. Biol. 1984, 25, 78–105. [Google Scholar] [CrossRef]
  28. Ericsson, T. Growth and shoot: Root ratio of seedlings in relation to nutrient availability. In Nutrient Uptake and Cycling in Forest Ecosystems; Springer: Dordrecht, The Netherlands, 1995; pp. 205–214. [Google Scholar] [CrossRef]
  29. Palomino, J.; García-Palacios, P.; de Deyn, G.B.; Martínez-García, L.B.; Sánchez-Moreno, S.; Milla, R. Impacts of plant domestication on soil microbial and nematode communities during litter decomposition. Plant Soil 2023, 487, 419–436. [Google Scholar] [CrossRef]
  30. García-Palacios, P.; Prieto, I.; Ourcival, J.M.; Hättenschwiler, S. Disentangling the Litter Quality and Soil Microbial Contribution to Leaf and Fine Root Litter Decomposition Responses to Reduced Rainfall. Ecosystems 2016, 19, 490–503. [Google Scholar] [CrossRef]
  31. Talgre, L.; Roostalu, H.; Mäeorg, E.; Lauringson, E. Nitrogen and carbon release during decomposition of roots and shoots of leguminous green manure crops. Agron. Res. 2017, 15, 594–601. [Google Scholar]
  32. Buyanovsky, G.A.; Wagner, G.H. Carbon transfer in a winter wheat (Triticum aestivum) ecosystem. Biol. Fertil. Soils 1987, 5, 76–82. [Google Scholar] [CrossRef]
  33. Blenis, P.v.; Chow, P.S.; Stringam, G.R. Effects of burial, stem portion and cultivar on the decomposition of canola straw. Can. J. Plant Sci. 1999, 79, 97–100. [Google Scholar] [CrossRef]
  34. Etemadi, F.; Hashemi, M.; Zandvakili, O.; Dolatabadian, A.; Sadeghpour, A. Nitrogen Contribution from Winter-Killed Faba Bean Cover Crop to Spring-Sown Sweet Corn in Conventional and No-Till Systems. Agron. J. 2018, 110, 455–462. [Google Scholar] [CrossRef]
  35. Stewart, C.E.; Moturi, P.; Follett, R.F.; Halvorson, A.D. Lignin biochemistry and soil N determine crop residue decomposition and soil priming. Biogeochemistry 2015, 124, 335–351. [Google Scholar] [CrossRef]
  36. Ntonta, S.; Zengeni, R.; Muchaonyerwa, P.; Chaplot, V. Variability in decomposition rate of sorghum cultivar residues linked to lignin content. Rhizosphere 2024, 29, 100850. [Google Scholar] [CrossRef]
  37. Chomel, M.; Guittonny-Larchevêque, M.; Fernandez, C.; Gallet, C.; DesRochers, A.; Paré, D.; Jackson, B.G.; Baldy, V. Plant secondary metabolites: A key driver of litter decomposition and soil nutrient cycling. J. Ecol. 2016, 104, 1527–1541. [Google Scholar] [CrossRef]
  38. Kaštovská, E.; Choma, M.; Angst, G.; Remus, R.; Augustin, J.; Kolb, S.; Wirth, S. Root but not shoot litter fostered the formation of mineral-associated organic matter in eroded arable soils. Soil Tillage Res. 2024, 235, 105871. [Google Scholar] [CrossRef]
  39. Rossi, L.M.W.; Mao, Z.; Merino-Martín, L.; Roumet, C.; Fort, F.; Taugourdeau, O.; Boukcim, H.; Fourtier, S.; del Rey-Granado, M.; Chevallier, T.; et al. Pathways to persistence: Plant root traits alter carbon accumulation in different soil carbon pools. Plant Soil 2020, 452, 457–478. [Google Scholar] [CrossRef]
  40. Hättenschwiler, S.; Gasser, P. Soil animals alter plant litter diversity effects on decomposition. Acad. Sci. 2005, 102, 1519–1524. [Google Scholar] [CrossRef]
  41. Wardle, D.A.; Nilsson, M.C.; Zackrisson, O.; Gallet, C. Determinants of litter mixing effects in a Swedish boreal forest. Biochem. 2003, 35, 827–835. [Google Scholar] [CrossRef]
  42. Ouédraogo, F.; Cornu, J.Y.; Fanin, N.; Janot, N.; Sourzac, M.; Parlanti, E.; Denaix, L. Changes over time in organic matter dynamics and copper solubility in a vineyard soil after incorporation of cover crop residues: Insights from a batch experiment. Chemosphere 2024, 350, 141137. [Google Scholar] [CrossRef] [PubMed]
  43. Zhang, Y.Y.; Stockmann, R.; Ng, K.; Ajlouni, S. Revisiting phytate-element interactions: Implications for iron, zinc and calcium bioavailability, with emphasis on legumes. Food Sci. Nutr. 2022, 62, 1696–1712. [Google Scholar] [CrossRef]
  44. Clark, A. (Ed.) Managing Cover Crops Profitably; Diane Publishing: Collingdale, PA, USA, 2008. [Google Scholar]
  45. Björkman, T.; Shail, J.W. Using a Buckwheat Cover Crop for Maximum Weed Suppression after Early Vegetables. HortTechnology 2013, 23, 575–580. [Google Scholar] [CrossRef]
  46. Sainju, U.M.; Lenssen, A.; Caesar-Tonthat, T.; Waddell, J. Tillage and Crop Rotation Effects on Dryland Soil and Residue Carbon and Nitrogen. Soil Sci. Soc. Am. J. 2006, 70, 668–678. [Google Scholar] [CrossRef]
  47. Sturm, D.J.; Peteinatos, G.; Gerhards, R. Contribution of allelopathic effects to the overall weed suppression by different cover crops. Weed Res. 2018, 58, 331–337. [Google Scholar] [CrossRef]
  48. Kato-Noguchi, H.; Mizutani, J.; Hasegawa, K. Allelopathy of oats. II. Allelochemical effect of l-Tryptophan and its concentration in oat root exudates. J. Chem. Ecol. 1994, 20, 315–319. [Google Scholar] [CrossRef]
  49. Livesley, S.J.; Stacey, C.L.; Gregory, P.J.; Buresh, R.J. Sieve size effects on root length and biomass measurements of maize (Zea mays) and Grevillea robusta. Plant Soil 1999, 207, 183–193. [Google Scholar] [CrossRef]
  50. Amato, M.; Pardo, A. Root length and biomass losses during sample preparation with different screen mesh sizes. Plant Soil 1994, 161, 299–303. [Google Scholar] [CrossRef]
  51. Bremner, J.M. Determination of nitrogen in soil by the Kjeldahl method. Agric. Sci. 1960, 55, 11–33. [Google Scholar] [CrossRef]
  52. Novelli, L.E.; Caviglia, O.P.; Piñeiro, G. Increased cropping intensity improves crop residue inputs to the soil and aggregate-associated soil organic carbon stocks. Soil Tillage Res. 2017, 165, 128–136. [Google Scholar] [CrossRef]
  53. Smychkovich, A.; Glaze-Corcoran, S.; Keiser, A.; Hashemi, M. Assessing the root and shoot composition, decomposition, carbon contribution and nitrogen mineralization trends of single species and mixed cover crops. Field Crops Res. 2025, 327, 109902. [Google Scholar] [CrossRef]
  54. Almeida, L.F.; Correndo, A.A.; Hefley, T.; Hintz, G.; Prasad, P.V.V.; Licht, M.; Casteel, S.; Singh, M.; Naeve, S.; Bais, J.; et al. Assessing the influence of environmental drivers on soybean seed yield and nitrogen fixation estimates and uncertainties in the United States. European Eur. J. Agron. 2025, 162, 127428. [Google Scholar] [CrossRef]
  55. Huddell, A.; Needelman, B.; Law, E.P.; Ackroyd, V.J.; Bagavathiannan, M.v.; Bradley, K.; Davis, A.S.; Evans, J.A.; Everman, W.J.; Flessner, M.; et al. Early-season biomass and weather enable robust cereal rye cover crop biomass predictions. Agric. Environ. Lett. 2024, 9, e20121. [Google Scholar] [CrossRef]
  56. Duiker, S.W. Establishment and termination dates affect fall-established cover crops. Agron. J. 2014, 106, 670–678. [Google Scholar] [CrossRef]
  57. Puget, P.; Drinkwater, L.E. Short-Term Dynamics of Root- and Shoot-Derived Carbon from a Leguminous Green Manure. Soil Sci. Soc. Am. J. 2001, 65, 771–779. [Google Scholar] [CrossRef]
  58. Williams, M.A.; Myrold, D.D.; Bottomley, P.J. Carbon flow from 13C-labeled straw and root residues into the phospholipid fatty acids of a soil microbial community under field conditions. Soil Biol. Biochem. 2006, 38, 759–768. [Google Scholar] [CrossRef]
  59. Van der Werf, A. Growth analysis and photoassimilate partitioning. In Photoassimilate Distribution in Plants and Crops: Source–Sink Relationships; Routledge: London, UK, 1996; pp. 1–20. [Google Scholar]
  60. Amanullah. Wheat and Rye Differ in Drymatter Partitioning, Shoot-Root Ratio and Water Use Efficiency Under Organic and Inorganic Soils. Plant Nutr. 2014, 37, 1885–1897. [Google Scholar] [CrossRef]
  61. Kurz, W.A.; Beukema, S.J.; Apps, M.J. Estimation of root biomass and dynamics for the carbon budget model of the Canadian forest sector. Can. J. For. Res. 1996, 26, 1973–1979. [Google Scholar] [CrossRef]
  62. Snowdon, P.; Eamus, D.; Gibbons, P.; Khanna, P.; Keith, H.; Raison, J.; Kirschbaum, M. Synthesis of Allometrics, Review of Root Biomass and Design of Future Woody Biomass Sampling Strategies; The Lead Commonwealth Agency on Greenhouse Matters: Canberra, Australia, 2002. Available online: https://www.dcceew.gov.au/ (accessed on 6 June 2025).
  63. Aerts, R.; Bakker, C.; de Caluwe, H. Root turnover as determinant of the cycling of C, N, and P in a dry heathland ecosystem. Biogeochemistry 1992, 15, 175–190. [Google Scholar] [CrossRef]
  64. Jain, S. Adaptive strategies: Polymorphism, plasticity, and homeostasis. In Topics in Plant Population Biology; Columbia University Press: New York, NY, USA, 1979; pp. 160–187. [Google Scholar]
  65. Berg, B.; McClaugherty, C. Decomposition and ecosystem function. In Plant Litter; Springer: Berlin/Heidelberg, Germany, 2003; pp. 203–237. [Google Scholar] [CrossRef]
  66. Pane, C.; Celano, G.; Piccolo, A.; Villecco, D.; Spaccini, R.; Palese, A.M.; Zaccardelli, M. Effects of on-farm composted tomato residues on soil biological activity and yields in a tomato cropping system. Chem. Biol. Technol. Agric. 2015, 2, 4. [Google Scholar] [CrossRef]
  67. Xu, H.; Wang, M.; You, C.; Tan, B.; Xu, L.; Li, H.; Zhang, L.; Wang, L.; Liu, S.; Hou, G.; et al. Warming effects on C:N:P stoichiometry and nutrient limitation in terrestrial ecosystems. Soil Tillage Res. 2024, 235, 105896. [Google Scholar] [CrossRef]
  68. Melillo, J.M.; Frey, S.D.; DeAngelis, K.M.; Werner, W.J.; Bernard, M.J.; Bowles, F.P.; Pold, G.; Knorr, M.A.; Grandy, A.S. Long-term pattern and magnitude of soil carbon feedback to the climate system in a warming world. Science 2017, 358, 101–105. [Google Scholar] [CrossRef] [PubMed]
  69. Justes, E.; Mary, B.; Nicolardot, B. Quantifying and modelling C and N mineralization kinetics of catch crop residues in soil: Parameterization of the residue decomposition module of STICS model for mature and non mature residues. Plant Soil 2009, 325, 171–185. [Google Scholar] [CrossRef]
  70. Trinsoutrot, I.; Recous, S.; Bentz, B.; Linères, M.; Chèneby, D.; Nicolardot, B. Biochemical Quality of Crop Residues and Carbon and Nitrogen Mineralization Kinetics under Nonlimiting Nitrogen Conditions. Soil Sci. Soc. Am. J. 2000, 64, 918–926. [Google Scholar] [CrossRef]
  71. Ghahremani, S.; Ebadi, A.; Tobeh, A.; Hashemi, M.; Sedghi, M.; Gholipoouri, A.; Barker, A.v. Short-Term Impact of Monocultured and Mixed Cover Crops on Soil Properties, Weed Suppression, and Lettuce Yield. Commun. Soil Sci. Plant Anal. 2021, 52, 406–415. [Google Scholar] [CrossRef]
  72. Patel, S.; Singh, A.; Sawyer, J.E.; Lundvall, J.P. Root and shoot biomass and nutrient composition of winter rye cover crop following corn and soybean. Agrosyst. Geosci. Environ. 2024, 7, e70017. [Google Scholar] [CrossRef]
  73. Jani, A.D.; Grossman, J.M.; Smyth, T.J.; Hu, S. Influence of soil inorganic nitrogen and root diameter size on legume cover crop root decomposition and nitrogen release. Plant Soil 2015, 393, 57–68. [Google Scholar] [CrossRef]
  74. Doran, J.W.; Smith, M.S. Role of Cover Crops in the Nitrogen Cycle. In Cover Crops for Clean Water; Har grove, W.L., Ed.; Soil and Water Conservation Society: Ankeny, IA, USA, 1991; pp. 85–90. Available online: https://www.scirp.org/reference/referencespapers?referenceid=2338314 (accessed on 26 May 2025).
  75. Kavdir, Y.; Smucker, A.J.M. Soil aggregate sequestration of cover crop root and shoot-derived nitrogen. Plant Soil 2005, 272, 263–276. [Google Scholar] [CrossRef]
  76. Gardner, M.; Sarrantonio, M. Cover Crop Root Composition and Density in a Long-Term Vegetable Cropping System Trial. Sustain. Agric. 2012, 36, 719–737. [Google Scholar] [CrossRef]
  77. Hansen, V.; Eriksen, J.; Jensen, L.S.; Thorup-Kristensen, K.; Magid, J. Towards integrated cover crop management: N, P and S release from aboveground and belowground residues. Agric. Ecosyst. Environ. 2021, 313, 107392. [Google Scholar] [CrossRef]
  78. Adamczyk, B.; Simon, J.; Kitunen, V.; Adamczyk, S.; Smolander, A. Tannins and Their Complex Interaction with Different Organic Nitrogen Compounds and Enzymes: Old Paradigms versus Recent Advances. ChemistryOpen. 2017, 6, 610. [Google Scholar] [CrossRef] [PubMed]
Figure 1. Weather-related parameters during two-year experiment at the University of Massachusetts Agricultural Research Farm, South Deerfield, MA. GDD = (Tmax + Tmin)/2 _T base (10 °C).
Agronomy 15 01467 g001aAgronomy 15 01467 g001b
Figure 2. (left) Summer CCs before termination, (center) terminated cover crops using a flail mower, and (right) placement of litter bags in corresponding CCs. Buried litter bags of roots and shoots are marked by different flags; red flags indicate roots, and orange flags represent shoot parts.
Agronomy 15 01467 g002
Figure 3. Root–shoot ratio (R:S) of summer CC species measured at 30 and 60 days after planting (DAP). Bar graph (right) illustrates the root–shoot ratio (%) at 30 and 60 DAP, across all three CC species. Lowercase letters indicate significant differences (p ≤ 0.05).
Agronomy 15 01467 g003
Figure 4. Proportion of C and N in roots and shoots of three summer CCs at termination time (August). Lowercase letters represent significant differences within a year among species for shoot N/root N, while uppercase letters represent significant differences within a year among species for shoot C/root C.
Agronomy 15 01467 g004
Figure 5. C:N of roots and shoots of summer CCs at termination time in 2022 and 2023. Green line indicates C:N = 25:1. Lowercase letters indicate significant differences among roots within each year, while uppercase letters indicate significant differences among shoots within each year.
Agronomy 15 01467 g005
Figure 6. Changes in the C:N spanned 14 weeks of decomposition in the roots and shoots of summer CC species. The green line represents the acceptable threshold level of C:N (25:1). C:N values above the green line suggest net soil N immobilization, while values below the line tend toward net soil N mineralization. The growing period in 2022 was 17 days longer than in 2023, but all CCs were terminated at the same time in August of both years.
Agronomy 15 01467 g006
Figure 7. Changes in percentage of root and shoot biomass remaining over 14 weeks of decomposition for three summer CCs in 2022 and 2023. Cover crops had a longer growth period (60 days) in 2022 than in 2023 (47 days). Green line indicates 50% residual decomposition.
Agronomy 15 01467 g007
Figure 8. Changes in N status of root and shoot residues over 14 weeks of decomposition for three summer CCs in a conventional tillage system. Collected shoot and root residues in 2022 are related to more mature plants (60 days) than in 2023 (47 days). Green line indicates 50% residual decomposition.
Agronomy 15 01467 g008
Figure 9. Changes in C percentage of roots and shoots in summer CCs over 14 weeks of decomposition. Residues collected from shoots and roots in 2022 are from more mature plants (60 days) than those from 2023 (47 days). Green line indicates 50% residual decomposition.
Agronomy 15 01467 g009aAgronomy 15 01467 g009b
Table 1. Select chemical properties of the soil of the experimental plots.
pHMacronutrients (mg kg−1)Micronutrients (mg kg−1)
PKCaMgSBMnZnCuFe
20226.613.480569755.601.20.91.32.1
20236.819.7110757896.80.12.70.51.01.6
Table 2. Select characteristics of summer CCs used in this experiment.
Cover CropSeedling Rate
kg ha−1
TypeRoot
Characteristic
Allelopathy
Potential
Fagopyrum esculentum
Buckwheat
67broadleaf/non-legume-non-grassDense, fibrousReported
[47]
Pisum sativum L.
Pea
67broadleaf/legumeTap rootNot observed
Avena sativa L.
Oat
100grassDense, fibrousReported
[48]
Table 3. The sequence of field activities carried out in 2022 and 2023.
Activity Description(2023)(2023)
CC seeding date23 June10 July
Biomass measurementJuly–AugustJuly–August
Cover crops termination23 August21 August
CC growth duration60 days42 days
Litter bag placement29 August26 August
CC litter bag study duration100 days100 days
Table 4. Biomass allocation, N and C yield (kg ha−1) of roots and shoots (% of total biomass) and nutrients released from three summer CC species, 14 weeks after termination in 2022 and 2023.
YearCover Crop
Species
Plant PartBiomass
(kg ha−1)
Biomass Allocation
(%) of
Total Biomass
Nutrient Yield
(kg ha−1)
N                    C
Nutrient Released
(kg ha−1 After 14 Weeks)
N                    C
2022OatRoot 1393 ± 0.1 b *19.496.15 ± 0.01 a309.6 ± 0.01 a1.30 ± 0.181.0 ± 2.9
Shoot6478 ± 0.1 B 80.5159.4 ± 0.03 A1631.1 ± 0.01 A32.00 ± 0.7204.7 ± 2.1
Buckwheat Root 1992 ± 0.5 c17.958.7 ± 0.01 b410.0 ± 0.02 b3.06 ± 0.0999.1 ± 0.8
Shoot7027 ± 0.7 C82.0554.4 ± 0.04 B1999.2 ± 0.01 B14.81 ± 0.17442.9 ± 0.8
PeaRoot 205 ± 0.1 a8.082.81 ± 0.02 c57.1 ± 0.02 c1.37 ± 0.49.2 ± 6.8
Shoot2567 ± 0.9 A91.9344.9 ± 0.05 C751.3 ± 0.01 C13.63 ± 0.1190.2 ± 2.5
2023OatRoot 382 ± 58.1 a19.494.7 ± 0.7 a148.4 ± 22.7 a1.30 ± 0.0781.0 ± 1.1
Shoot1416 ± 25.3 A80.5140.4 ± 7.2 A586.4 ± 10.3 A32.0 ± 0.07204.7 ± 1.7
Buckwheat Root 362 ± 41.1 a17.953.1 ± 0.3 a134.90 ± 15.3 a3.06 ± 0.0499.1 ± 3.8
Shoot2261 ± 46.6 A82.0550 ± 10.27 A999.7 ± 20.5 A14.81 ± 0.3442.9 ±1.07
PeaRoot 111 ± 12.7 b8.082.9 ± 0.3 a45.9 ± 5.3 b1.37 ± 0.059.2 ± 3.0
Shoot1160 ± 52.63 A91.9342.8 ± 1.9 A490.50 ± 22.2 A13.63 ± 0.15190.2 ± 0.7
* Lowercase letters indicate significant differences among roots within each year, while uppercase letters indicate significant differences among shoots between years.
Table 5. Regression equations and statistics for summer CC residue mass loss trend over five months after residue burial.
Plant PartYearResidue SpeciesMean ± SE
(Log-Transformed)
EquationRMSER2
Roots2022Buckwheat4.24 ± 0.17 by = −0.14x + 4.59 *0.0160.99
Oat4.28 ± 0.04 by = −0.25x + 4.58 *0.0060.99
Pea4.13 ± 0.03 ay = 0.008x2 − 0.57x + 4.59 *0.0320.99
2023 Buckwheat 4.35 ± 0.03 by = −0.11x + 4.57 *0.0540.95
Oat4.32 ± 0.03 by = −0.12x + 4.59 *0.0110.99
Pea4.00 ± 0.02 ay = 0.076x2 − 0.39x + 4.59 *0.0220.99
Shoots2022Buckwheat4.30 ± 0.03 Cy = −0.13x + 4.57 *0.0530.97
Oat4.37 ± 0.01 By = −0.10x + 4.59 *0.0380.98
Pea4.18 ± 0.03 Ay = 0.057x2 − 0.31x + 4.58 *0.0390.9
2023Buckwheat4.20 ± 0.03 By = −0.27x + 4.62 *0.0600.98
Oat3.97 ± 0.02 ABy = −0.39x + 4.59 *0.0200.99
Pea3.82 ± 0.08 Ay = 0.107x2 − 0.61x + 4.60 *0.0580.99
* The linear regression analysis was significant for the correlation during five months of decay. Lowercase letters indicate significant differences among roots, while uppercase letters indicate significant differences among shoots within each year.
Table 6. Regression equations and statistics for summer CC residue N-loss trend over five months after residue burial.
Plant PartYearResidue SpeciesMean ± SE
(Log Transformed)
EquationRMSER2
Roots2022Buckwheat4.39 ± 0.01 cy = −0.14x + 4.59 *0.0170.99
Oat4.48 ± 0.01 by = −0.02x + 4.60 *0.0060.99
Pea4.30 ± 0.01 ay = −0.057x + 4.58 *0.0320.99
2023Buckwheat4.45 ± 0.01 by = −0.07x + 4.59 *0.0510.93
Oat4.28 ± 0.05 ay = 0.01096x2 − 0.11x + 4.59 *0.0060.99
Pea4.32 ± 0.03 ay = 0.005x2 − 0.08x + 4.58 *0.0280.99
Shoots2022Buckwheat4.48 ± 0.05 By = −0.11x + 4.60 *0.0120.99
Oat4.50 ± 0.01 By = −0.05x + 4.59 *0.0110.96
Pea4.30 ± 0.01 Ay = −0.08x + 4.60 *0.0340.99
2023Buckwheat4.33 ± 0.01 By = −0.18x + 4.61 *0.0440.97
Oat3.98 ± 0.02 Ay = 0.0946x2 − 0.47x + 4.56 *0.0840.97
Pea4.02 ± 0.02 Ay = 0.11x2 + 0.51x + 4.55 *0.0950.95
* The linear regression analysis was significant for the correlation during five months of decay. Lowercase letters indicate significant differences among roots, while uppercase letters indicate significant differences among shoots within each year.
Table 7. Regression equations and statistics for summer CC residue C-loss trend over five months after residue burial.
Plant PartYearResidue SpeciesMean ± SE
(Log-Transformed)
EquationRMSER2
Root2022 Buckwheat4.19 ± 0.03 by = −0.18x + 4.57 *0.0660.97
Oat4.50 ± 0.03 by = −0.10x + 4.561 *0.0350.90
Pea4.42 ± 0.02 ay = −0.06x + 4.58 *0.0630.91
2023 Buckwheat 4.52 ± 0.17 ay = −0.04x + 4.59 *0.006770.99
Oat4.39± 0.04 by = −0.09x + 4.60 *0.019540.99
Pea4.56 ± 0.03 ay = −0.056x + 4.590.012950.96
Shoots2022Buckwheat4.55 ± 0.17 Ay = −0.03x + 4.59 *0.008670.97
Oat4.54 ± 0.04 By = −0.04x + 4.60 *0.024230.91
Pea4.43 ± 0.03 Ay = −0.76x + 4.67 *0.426770.51
2023Buckwheat4.48± 0.03 Ay = −0.21x + 4.61 *0.0600.85
Oat4.48 ± 0.02 Ay = −0.09x + 4.61 *0.049640.85
Pea4.48 ± 0.08 Ay = −0.14x + 4.60 *0.065340.72
* The linear regression analysis was significant for the correlation during five months of decay. Lowercase letters indicate significant differences among roots, while uppercase letters indicate significant differences among shoots within each year.
Disclaimer/Publisher’s Note: The statements, opinions and data contained in all publications are solely those of the individual author(s) and contributor(s) and not of MDPI and/or the editor(s). MDPI and/or the editor(s) disclaim responsibility for any injury to people or property resulting from any ideas, methods, instructions or products referred to in the content.

