Article

Erosion Control Effects of a Polymer-Based Soil Conditioner on Red Soil in Okinawa, Japan

1
United Graduate School of Agricultural Science, Tokyo University of Agriculture and Technology, 3-5-8 Saiwaicho, Fuchu 183-8509, Tokyo, Japan
2
School of Agriculture, Utsunomiya University, 350 Minemachi, Utsunomiya 321-8505, Tochigi, Japan
3
Japan Calcium Cyanamide Industry Association, 3-3-4 Kandakajichou, Chiyodaku 101-0045, Tokyo, Japan
4
Polymer Research Department, Denka Company Limited, 1-1-2 Nihonbashi-Muromachi, Chuoku 103-8338, Tokyo, Japan
5
Water & Agri-Products Department, Elastomers & Infrastructure Solutions, Denka Company Limited, 1-1-2 Nihonbashi-Muromachi, Chuoku 103-8338, Tokyo, Japan
*
Authors to whom correspondence should be addressed.
Agronomy 2025, 15(10), 2362; https://doi.org/10.3390/agronomy15102362
Submission received: 8 September 2025 / Revised: 28 September 2025 / Accepted: 7 October 2025 / Published: 9 October 2025

Abstract

Preventing soil degradation caused by water erosion is essential for sustainable agriculture and long-term agroecological development. The objective of this study was to evaluate the effectiveness of an ethylene-vinyl acetate (EVA) polymer-based soil conditioner in mitigating soil erosion, a key driver of soil degradation. Laboratory experiments and simulations employing the Water Erosion Prediction Project (WEPP) model were conducted to assess soil erodibility parameters and sediment yield of two soil types from Okinawa, Japan. A key contribution of this work is the integration of these experimentally determined erodibility parameters into the WEPP model for robust validation. Interrill and rill erosion processes were analyzed under different soil conditioner application rates. Laboratory results showed that applying the soil conditioner reduced interrill erodibility by 59 to 99% and rill erodibility by 65 to 100%, while increasing critical shear stress and water infiltration rate. The effectiveness varied between the two soil types due to differences in particle-size distribution and inherent erodibility. The soil conditioner exhibited a more pronounced impact on rill erosion. WEPP simulations confirmed sediment yield reductions of 73% to 99%, primarily influenced by changes in rill erodibility and critical shear stress. While its practical application will be subject to various field conditions, our findings confirm the significant potential of this soil conditioner as a strategy for preserving topsoil resources.

1. Introduction

The long-term viability of agroecological development fundamentally depends on the maintenance of resilient and healthy soil systems. However, accelerated soil erosion, driven by intensified human activities and extreme weather events [1,2], poses a significant threat to sustainable agroecological development. Soil erosion directly reduces crop productivity [3] while destabilizing geochemical cycles [4]. As the preservation of topsoil becomes critical for the promotion of sustainable agricultural practices [5], integrated approaches combining mechanism analysis, prediction, and control strategies are urgently needed to mitigate soil degradation [6].
This global issue of soil degradation is particularly acute in Okinawa, Japan, where soil erosion poses a serious threat to agriculture and ecosystems. The region is dominated by fine-textured red soils formed from limestone, marl, and igneous rocks [7], which are highly susceptible to erosion under human activities and heavy rainfall. In particular, the rainfall and runoff factor (R) and the soil erodibility factor (K) in the Universal Soil Loss Equation (USLE) for Okinawa have been reported to be three times higher than the national average [8]. Agricultural activities are a major source of sediment runoff, while farmers are also economically affected by erosion due to the loss of fertile topsoil and reduced land productivity. Although regulations enhanced by Okinawa Prefectural Government resulted in a 53% reduction in red soil loss from 1994 to 2021, farmland still accounted for 81% of the total in 2021 [9]. Conventional approaches such as grass buffers and mulching are not widely adopted due to limited planting area and increased labor. Therefore, alternative erosion control measures that avoid these limitations are required.
Polymer-based soil conditioners provide an effective solution for reducing soil erosion by promoting cohesion among soil particles, stabilizing aggregates against detachment, and enhancing infiltration through improved pore connectivity [10,11]. The treated surface maintained its structural stability even under heavy rainfall [12]. Polymer-based conditioners have demonstrated 40–54% erosion reduction in steep slope erosion control applications [13]. However, the specific mechanisms and quantitative erosion control effectiveness in agricultural systems remain understudied. To address this issue, the present study investigates ethylene-vinyl acetate copolymer (EVA), which is selected for its potential to enhance cohesion between soil particles through its flexibility and weather resistance. While these material properties of EVA have been well characterized, its potential as a soil conditioner remains unexplored.
To evaluate the erosion control effectiveness of the EVA-based soil conditioner, standardized soil erosion modeling provides an effective approach. The Water Erosion Prediction Project (WEPP) (version 2012.8; USDA-ARS, West Lafayette, IN, USA) is a process-based model developed by the Agricultural Research Service, United States Department of Agriculture for simulating erosion processes [14]. The incorporation of a dataset encompassing meteorological parameters, soil characteristics, topographical features, and land use patterns enables the simulation of soil erosion on farmland slopes and the dynamics of sediment transport processes within a watershed. The model was widely applicable for simulating diverse climates, topographies, and soil conditions [15,16]. It accurately predicted sediment yields in an Austrian watershed [17], identified optimal management practices in Indian hills [18], and outperformed other models in Chinese watershed comparisons [19]. The WEPP model can calculate soil erodibility values automatically from soil texture and other soil properties. These values are then used to estimate sediment yield. For a process-based erosion model such as WEPP, it is crucial to obtain empirical erodibility values to improve its accuracy and predictive capability [20]. Rainfall simulators and small flumes were used to determine soil erodibility in field and laboratory studies [21,22]. However, few studies have focused on the relationship between soil erodibility and soil conditioner application, although [23] examined rill erodibility behavior after application of different amounts of a cationic polyelectrolyte. These findings indicate that soil erodibility is a key factor to evaluate the effectiveness of soil erosion control measures such as soil conditioners.
While the practice of improving soil with polymer-based conditioners to reduce erosion is well-established, a critical gap remains in the current literature. Specifically, how conditioner application quantitatively affects fundamental erodibility parameters remains poorly defined, compromising the accurate validation of models like WEPP. This knowledge gap is especially significant for materials like EVA. While its material properties, such as flexibility and weather resistance, are well-characterized, its potential as an effective soil conditioner remains largely unexplored. Based on these gaps, we hypothesized that (1) an increase in the conditioner application amount would lead to a significant decrease in soil erodibility; and (2) the conditioner’s effectiveness would differ between soil types.
Therefore, the objective of this study is to evaluate the effectiveness of an EVA-based soil conditioner in mitigating soil erosion and improving soil properties. To achieve this, the specific aims were: (1) to determine soil erodibility through laboratory experiments; (2) to estimate sediment yield by WEPP model simulation; and (3) to assess related improvements in soil physical properties such as water permeability.

2. Materials and Methods

This chapter outlines the chronological workflow of the study, which is organized into three principal stages. The first stage involved the preparation of the soil conditioner and the two soil types used in this study (Section 2.1). The second stage consisted of the interrill erosion test (Section 2.3) and the rill erosion test (Section 2.4) conducted to determine key erodibility parameters as defined by the WEPP framework (Section 2.2). The above experimental procedure is visually summarized in Figure 1. In the final stage, these experimentally derived parameters were used as inputs for the WEPP model to simulate long-term sediment yield under specified climate and management scenarios (Section 2.5).

2.1. Preparation for Laboratory Experiments

2.1.1. Conditioner and Tested Soil Characteristics

The soil conditioner (Farmcoat, Denka Company Limited, Tokyo, Japan) used in this study is developed for mitigating soil erosion [24]; its physical properties are presented in Table 1. This soil conditioner is a blend of EVA, a flexible polymer emulsion with adhesive and mechanical properties [25], and a humic acid solution (Figure 2a). When applied to a soil surface, EVA in the soil conditioner is expected to promote cohesion among soil particles, thereby promoting the development of soil aggregates. After drying, application of EVA improved the cohesion between aggregates and compressive strength of the soil surface [26]. These improvements can lead to the hardening of the soil surface (Figure 2d). At the same time, strong bonding among soil aggregates by the EVA may increase internal stress during drying. The resistance to shrinkage forces by these strong bonds results in higher internal tensile stress because this stress is not easily relieved [27]. This increased stress may exceed the tensile strength of the soil and result in crack formation [28] (Figure 2b,c). Collectively, the soil conditioner is expected to reduce soil erosion by hardening the soil surface and promoting macro cracks, thereby increasing infiltration. To validate these mechanistic hypotheses under experimental conditions, we selected two typical Okinawa soils with different properties.
According to safety data provided by the developer, the EVA-based conditioner was evaluated for potential environmental and ecotoxicological risks. These internal assessments, which followed standard protocols and included plant germination tests as well as aquatic toxicity assays on fish, indicated that the conditioner poses negligible risk at the recommended application rates.
The tested soils, Kunigami Maaji (Soil A) and Shimajiri Maaji (Soil B), are Haplic Acrisols [29]; their textures and organic contents are presented in Table 2. In this study, soil texture was obtained by grain size analysis based on JIS A 1204 [30]. Coarse fragments (%) were defined as the mass percentage of the sample retained on a 2 mm sieve. The value of organic matter content was obtained by ignition loss test based on JIS A 1226 [31]. Soil A, sampled from Higashi village (26°37′48.5″ N; 128°07′51.9″ E), exhibits a predominantly reddish-brown color and is the dominant type in Okinawa Prefecture, occupying approximately 55% of the total area [32]. Soil B was sampled from a sugarcane field in Ishigaki city (24°21′57.3″ N; 124°07′32.5″ E) and exhibits a predominantly dark red color. This soil is distributed primarily in the southern part of the Okinawa main island [32].

2.1.2. Preparation for Test Soils

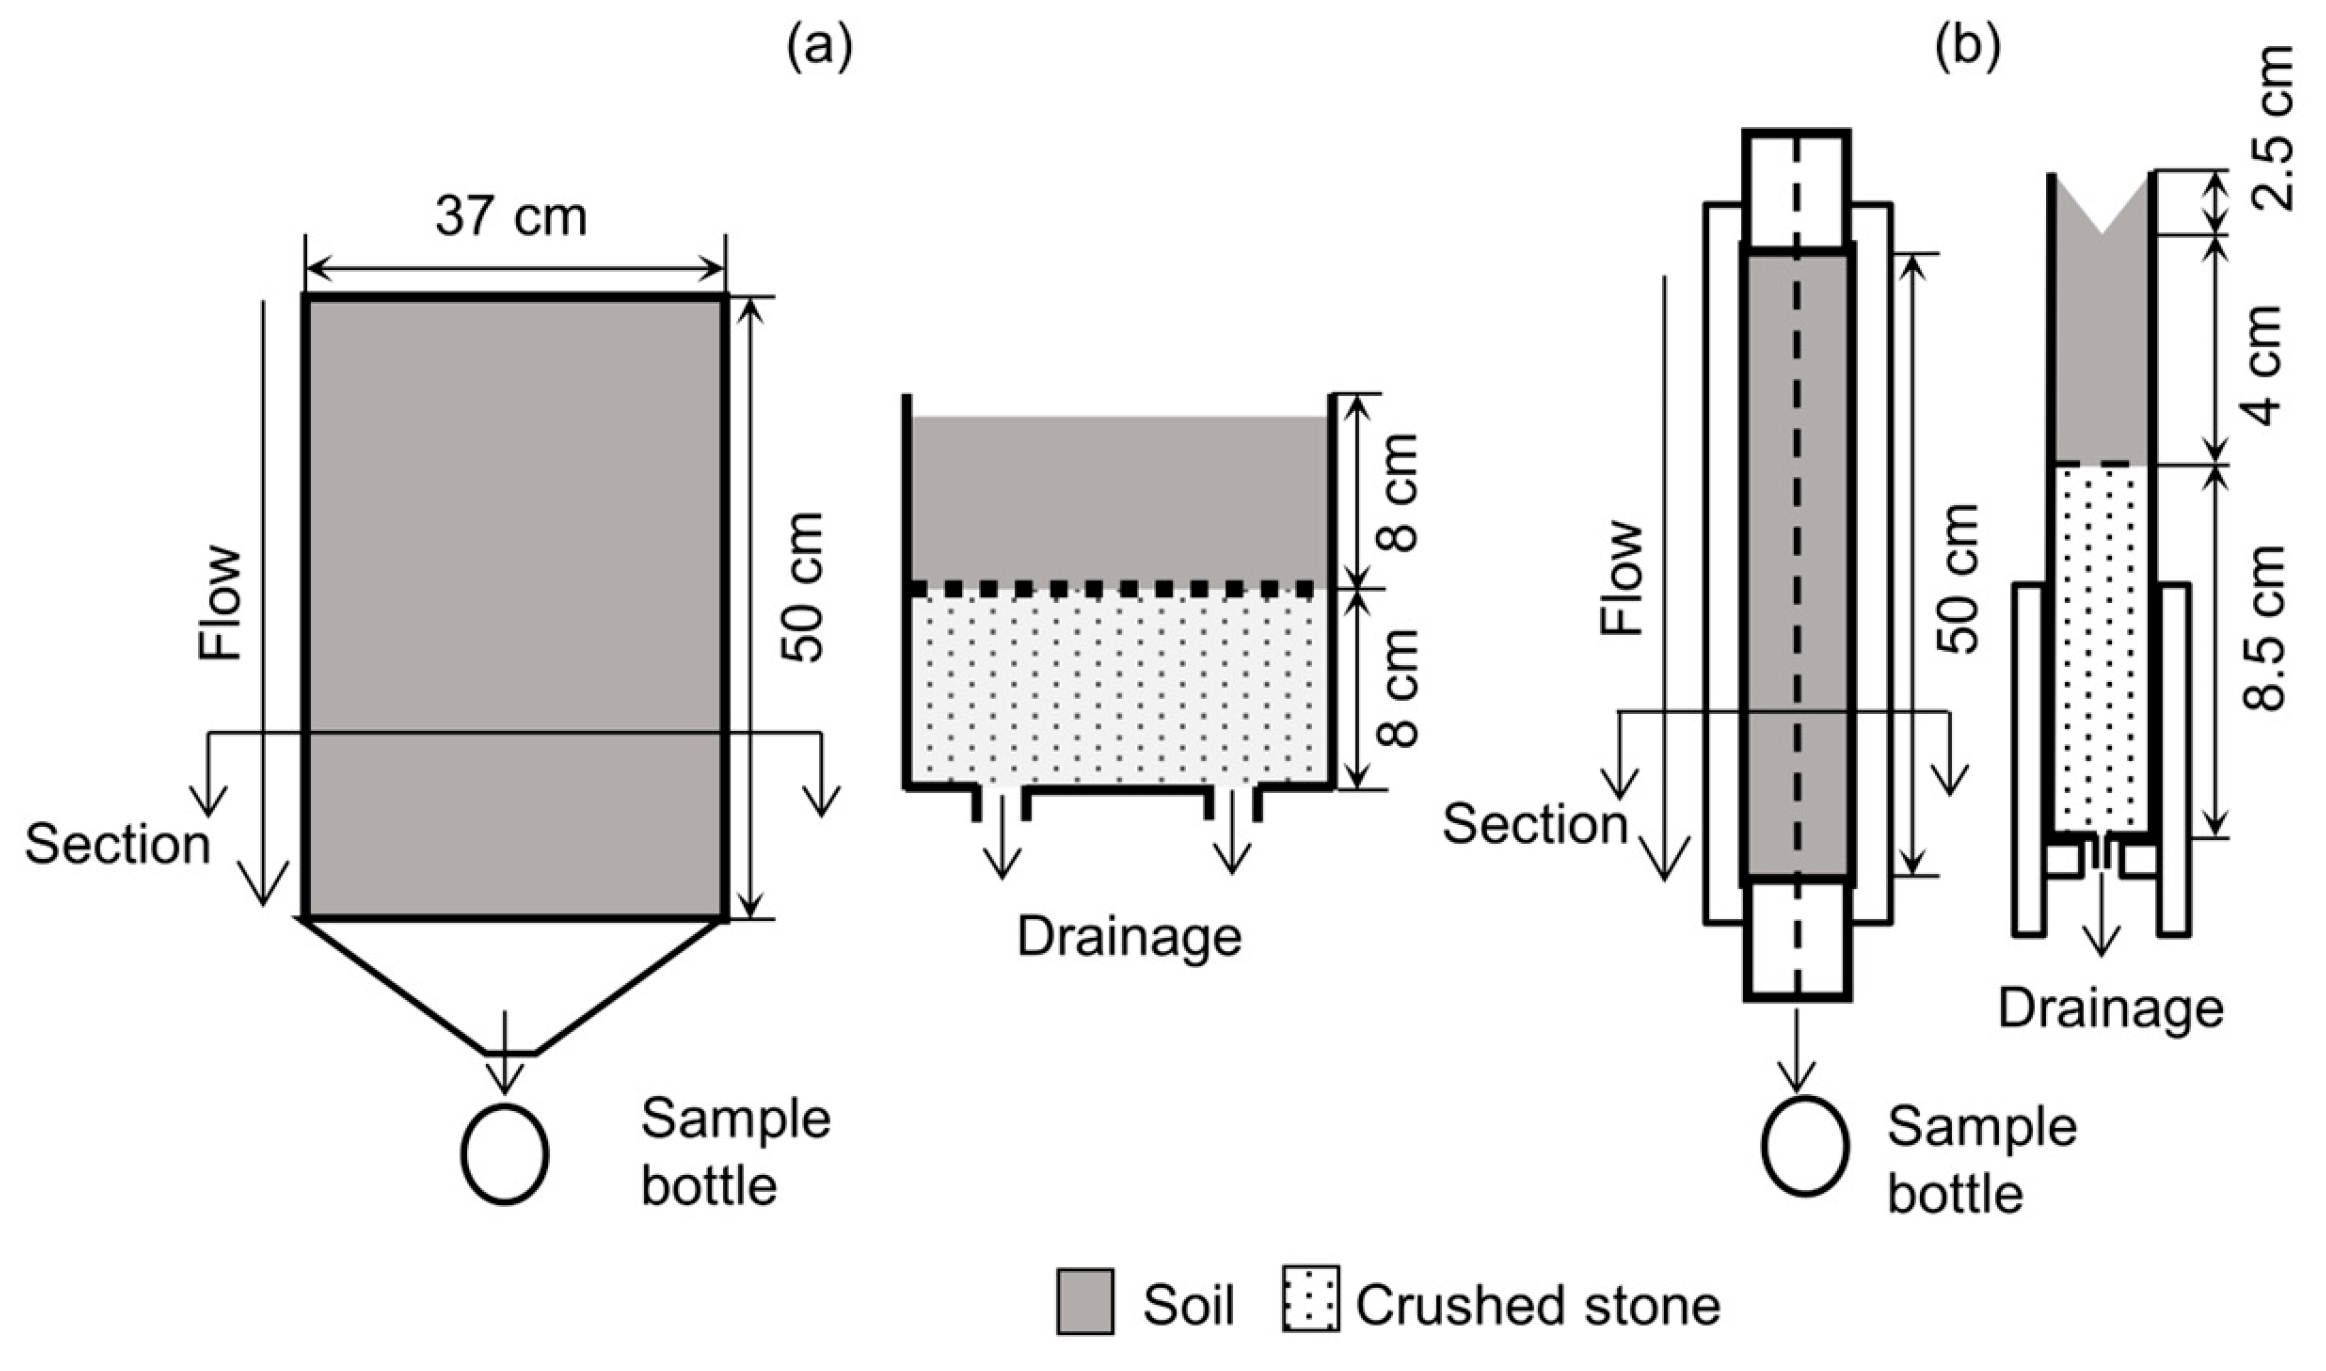
Prior to laboratory experiments, test soils were air-dried and sieved to remove gravel and other impurities. The sieving mesh size differed by experiment type, with a 5 mm mesh used for the interrill erosion experiment and a 2 mm mesh used for the rill erosion experiment. After sieving, the water content was adjusted to optimal levels (Table 3) to induce crack formation. To ensure a uniform bulk density, a pre-calculated mass of soil was then packed into each soil box in multiple thin layers. Each layer was gently and evenly compacted with a flat wooden block to achieve the target depth and a final dry bulk density of 1.00 g·cm−3 (Figure 3; dimensions varied by experiment type). Following packing, a single application of the soil conditioner was applied uniformly to the soil surface using a handheld sprayer. The details of each treatment level, including dilution factors, application amounts (g·m−2), and their equivalent field rates (t·ha−1), are presented in Table 4. Finally, the boxes were transferred to a temperature-controlled room (25 °C) and cured for at least 2 h.
Notably, preliminary tests showed that SC100 at 25% water content failed to induce cracking within 24 h, as viscous membranes on aggregates impeded evaporation [11]. Therefore, we reduced the water content to 15%, which successfully induced crack formation within 3 h in preliminary test.

2.2. WEPP Erosion Framework and Target Parameters

This study discussed two types of soil erosion, interrill erosion and rill erosion. In interrill erosion, soil particles are detached by the impact of raindrops on the soil between rills, whereas in rill erosion, soil particles in small channels are detached by water flow in the channel. WEPP utilizes various parameters, including interrill erodibility, rill erodibility, critical shear stress and effective hydraulic conductivity, to estimate the erosion rate on a hillslope. In most cases, these three parameters are calculated using data of soil properties such as soil texture, but in this study, they were acquired by means of the laboratory experiments described in Section 2.3 and Section 2.4.
In WEPP simulation, total erosion rate is estimated with the following continuous equation by assuming steady-state conditions:
d G d x = D i + D f
where G is the sediment load (kg·m−1·s−1), x is the distance downslope (m), Di is interrill sediment delivery to a rill (kg·m−2·s−1), and Df is the rill erosion rate (kg·m−2·s−1).
Interrill erodibility (Kib) is estimated from the following equation:
D i = K i b I σ S
where Kib is the baseline interrill erodibility (kg·m−4·s), I is rainfall intensity (m·s−1), σ is the runoff rate (m·s−1), S is an interrill slope adjustment factor that is calculated as follows:
S = 1.05 0.85 e 4 sin θ
Here, θ is the slope angle (°). The values of Di, I, σ, and θ used in these equations are obtained experimentally, and Kib is estimated by regressing Di against I∙σ∙S. In WEPP calculation, all the soil particles detached in interrill processes are transported to rills then further transported downslope.
Rill erosion includes both the transport of sediment derived from interrill erosion and the transport of sediment eroded by water flow in the rill. In our laboratory experiments, the surface of test soil was smooth and devoid of vegetation cover, resulting in a relatively high sediment transport capacity. Meanwhile, G was minimal because no sediment was derived from interrill erosion. Consequently, G was much smaller than the sediment transport capacity of the rill in this study. When hydraulic shear stress of the rill flow exceeded the critical shear stress for the soil, the rill erosion rate Df is equal to the detachment capacity Dc (kg·m−1·s−2) due to flow in the rill and is estimated as follows:
D f = K r b τ f τ c b
where Krb is the baseline rill erodibility (s·m−1), τf is the overland flow shear stress (Pa), and τcb is the baseline critical shear stress (Pa). Df and τf were obtained experimentally, and τcb and Krb were estimated by regression of Df against τf.
Furthermore, the WEPP model uses effective hydraulic conductivity, Ke, to characterize soil permeability. Similarly to soil erodibility, Ke is a dynamic value that varies with factors like surface crusting. For this study, we refer to its baseline value (Kb) as the effective hydraulic conductivity. This parameter is estimated using an equation with sand content fraction (sand), clay content fraction (clay), and cation exchange capacity (CEC, meq/100 g) as variables, where the formulation varies based on the clay content:
For soils with clay ≤ 0.4, the equation is:
K e = 0.265 + 0.086 ( 100 s a n d ) 1.8 + 11.46 C E C 0.75
For soils with clay > 0.4, the equation is:
K e = 0.0066 e 2.44 / c l a y
It should be noted that unlike the other experimentally derived parameters, Ke was calculated using the standard WEPP formula based on intrinsic soil properties. Therefore, this value served as a constant baseline input for the WEPP model and does not reflect the actual permeability changes induced by our conditioner treatments.

2.3. Interrill Erosion Experiment

For the interrill erosion experiment, the prepared soils were packed into 2 independent soil boxes (n = 2) (37 cm long × 50 cm wide, Figure 2a) containing an 8 cm crushed stone layer. Each soil box underwent a total of 8 experimental runs. The boxes were positioned at 7.5° and 15° slopes for each conditioner application amount. Prior to testing, soil surfaces were saturated using a rainfall simulator.
The rainfall was simulated by using silicon tube nozzles (TRCN-ST, Technocore, Tokyo, Japan) spaced 150 mm apart, which move reciprocating under water pressure. The simulated raindrops had a diameter range of approximately 1.2 to 2.0 mm. Each box was subjected to four nominal rainfall intensities with target values of 25, 50, 75, and 100 mm·h−1, which were achieved by varying the number of active nozzles (8, 16, 24, and 32, respectively) in the rainfall simulator. Due to minor variations in water pressure and nozzle performance, the actual measured intensities across all experimental runs ranged from 5.69 to 90.08 mm·h−1 (Table 4). The rainfall intensities used in this stud0y were selected to cover a wide range necessary for regression analysis of erodibility parameters rather than to reproduce a single storm event. For context, this experimental range closely corresponds to the observed monthly maximum 1 h rainfall intensities in Naha, Okinawa Prefecture during 2024, which ranged from 4.5 to 94.5 mm·h−1 [33] Initially, one box was set to a 7.5° slope and the other to 15°. A sequence of four settled rainfall intensities (75, 25, 50, and 100 mm·h−1) was then applied to both boxes. For each intensity in this sequence, the rainfall intensity was first measured by collecting the rainfall over the soil box area. Measurement duration was 10 min for 25 and 50 mm·h−1, and 5 min for 75 and 100 mm·h−1). After this, rainfall was initiated, and a steady state was considered to be reached 10 min after rainfall initiation. This timeframe was established from previous rainfall simulations and confirmed by a stable runoff, evidenced by the variation in filling times for the three replicate sample bottles being less than 3 s. Once steady state was confirmed, three runoff samples were collected. After all rainfall intensities were tested, the slope settings for the two boxes were interchanged, and the procedures described above were repeated.
5 g of flocculant solution (50 g·L−1 of aluminum potassium sulfate 12-water) was added to each runoff sample. The bottles were then shaken and left undisturbed for at least 10 h to settle the sediment. Then, the clear supernatant water was carefully decanted without disturbing the residue. and the bottles containing the remaining sediment were then oven-dried in a constant temperature of 110 °C for 24 h. Finally, the dried residue was weighed to determine the amount of soil eroded by interrill erosion.

2.4. Rill Erosion Experiment

For the rill erosion experiment, the prepared soils were packed into 2 soil boxes (4 cm wide × 50 cm long Figure 3b) containing an 8.5 cm crushed stone layer and pre-formed V-shaped channels. Two identical soil boxes as for one independent unit (n = 1) were prepared for each treatment. Each conditioner concentration was tested under various slope and flow rate combinations, with the boxes positioned at 5°, 10°, and 15° slopes. Prior to testing, the soil in each box was saturated through capillary action by connecting a silicone tube to the base and maintaining the water level aligned with the soil undersurface in the beaker. The experiment was conducted sequentially on each box until significant erosion occurred.
The experiment on the first soil box began at a 5° slope. By adjusting the speed of a tube pump (FP-600-1515, Front Lab, AS ONE, Osaka, Japan), water was passed through the soil boxes at flow rates ranging from 0.23 to 2.45 L·min−1 in 0.25 L·min−1 increments (Table 4). Flow rate of the pump was measured twice before each new setting by collecting the outflow for a set duration (1 min for rates less than 1.5 L·min−1; 30 s for rates greater than 1.5 L·min−1). This measurement was performed each time the flow rate or slope condition was changed. For each flow rate increment, a 10 min stabilization period was allowed before samples were collected. This duration was established from preliminary experiments and confirmed by a stable runoff rate, as evidenced by a variation of no more than 3 s in the filling times for the three replicate sampling bottles. After the sequence of flow rates was completed, the box was repositioned to the next slope (10° and then 15°), and the entire procedure of flow rate increments, measurement, and sampling was repeated. This process continued until significant erosion caused the V-shaped channel to fail. Following this, the entire procedure described above was repeated using the second soil box. The initial slope and flow rate for the second soil box were set to a level immediately below the conditions that caused channel failure of the first soil box.
Rill erosion soil loss was determined using the identical flocculation-drying procedure as described for interrill erosion in Section 2.3.

2.5. Inputs for WEPP Simulation

WEPP simulations were used to estimate the sediment yield from farmland by inputting weather, soil, topography, and management data in this study. One hundred years of weather data, including rainfall, air temperature, wind parameters (direction, speed), solar radiation, and dew point temperature, for Ishigaki city were generated by the Climate Generator model (CLIGEN) [34]. As CLIGEN input, Automated Meteorological Data Acquisition System data (1994 to 2009) and surface weather observing systems data (1964 to 2014) for Ishigaki city were obtained from the Japan Meteorological Agency [35,36]. Soil data, including interrill erodibility, rill erodibility, and critical shear stress, were obtained from the rill and interrill experiment results. For effective hydraulic conductivity, we used a default estimated value because estimating how this value might be changed by the soil conditioner is difficult. Soil texture and organic matter content values were sourced from Table 1. Cation exchange capacity values were obtained from [32], and albedo parameters were defined according to the default conditions specified in WEPP. As topographic data, slope length was set to 100 m, and the gradient in the downflow direction was set to 3%. This gradient is the maximum value for farmland allowed by regulations of the Okinawa Prefectural Government [37]. Management during the simulations was set to fallow conditions (no crop cover).
It should be noted that for instances where significant erosion was not observed, a minimal amount of particle detachment was still present, which allowed us to calculate erodibility parameters via regression. If the erodibility parameter (Kib or Krb) was below the minimum effective input threshold of the WEPP model, the model’s minimum value was used. In cases where an exact critical shear stress (τcb) could not be determined, the maximum shear stress during the corresponding test was used as the input value.

3. Results

3.1. Interrill Erosion Experiments

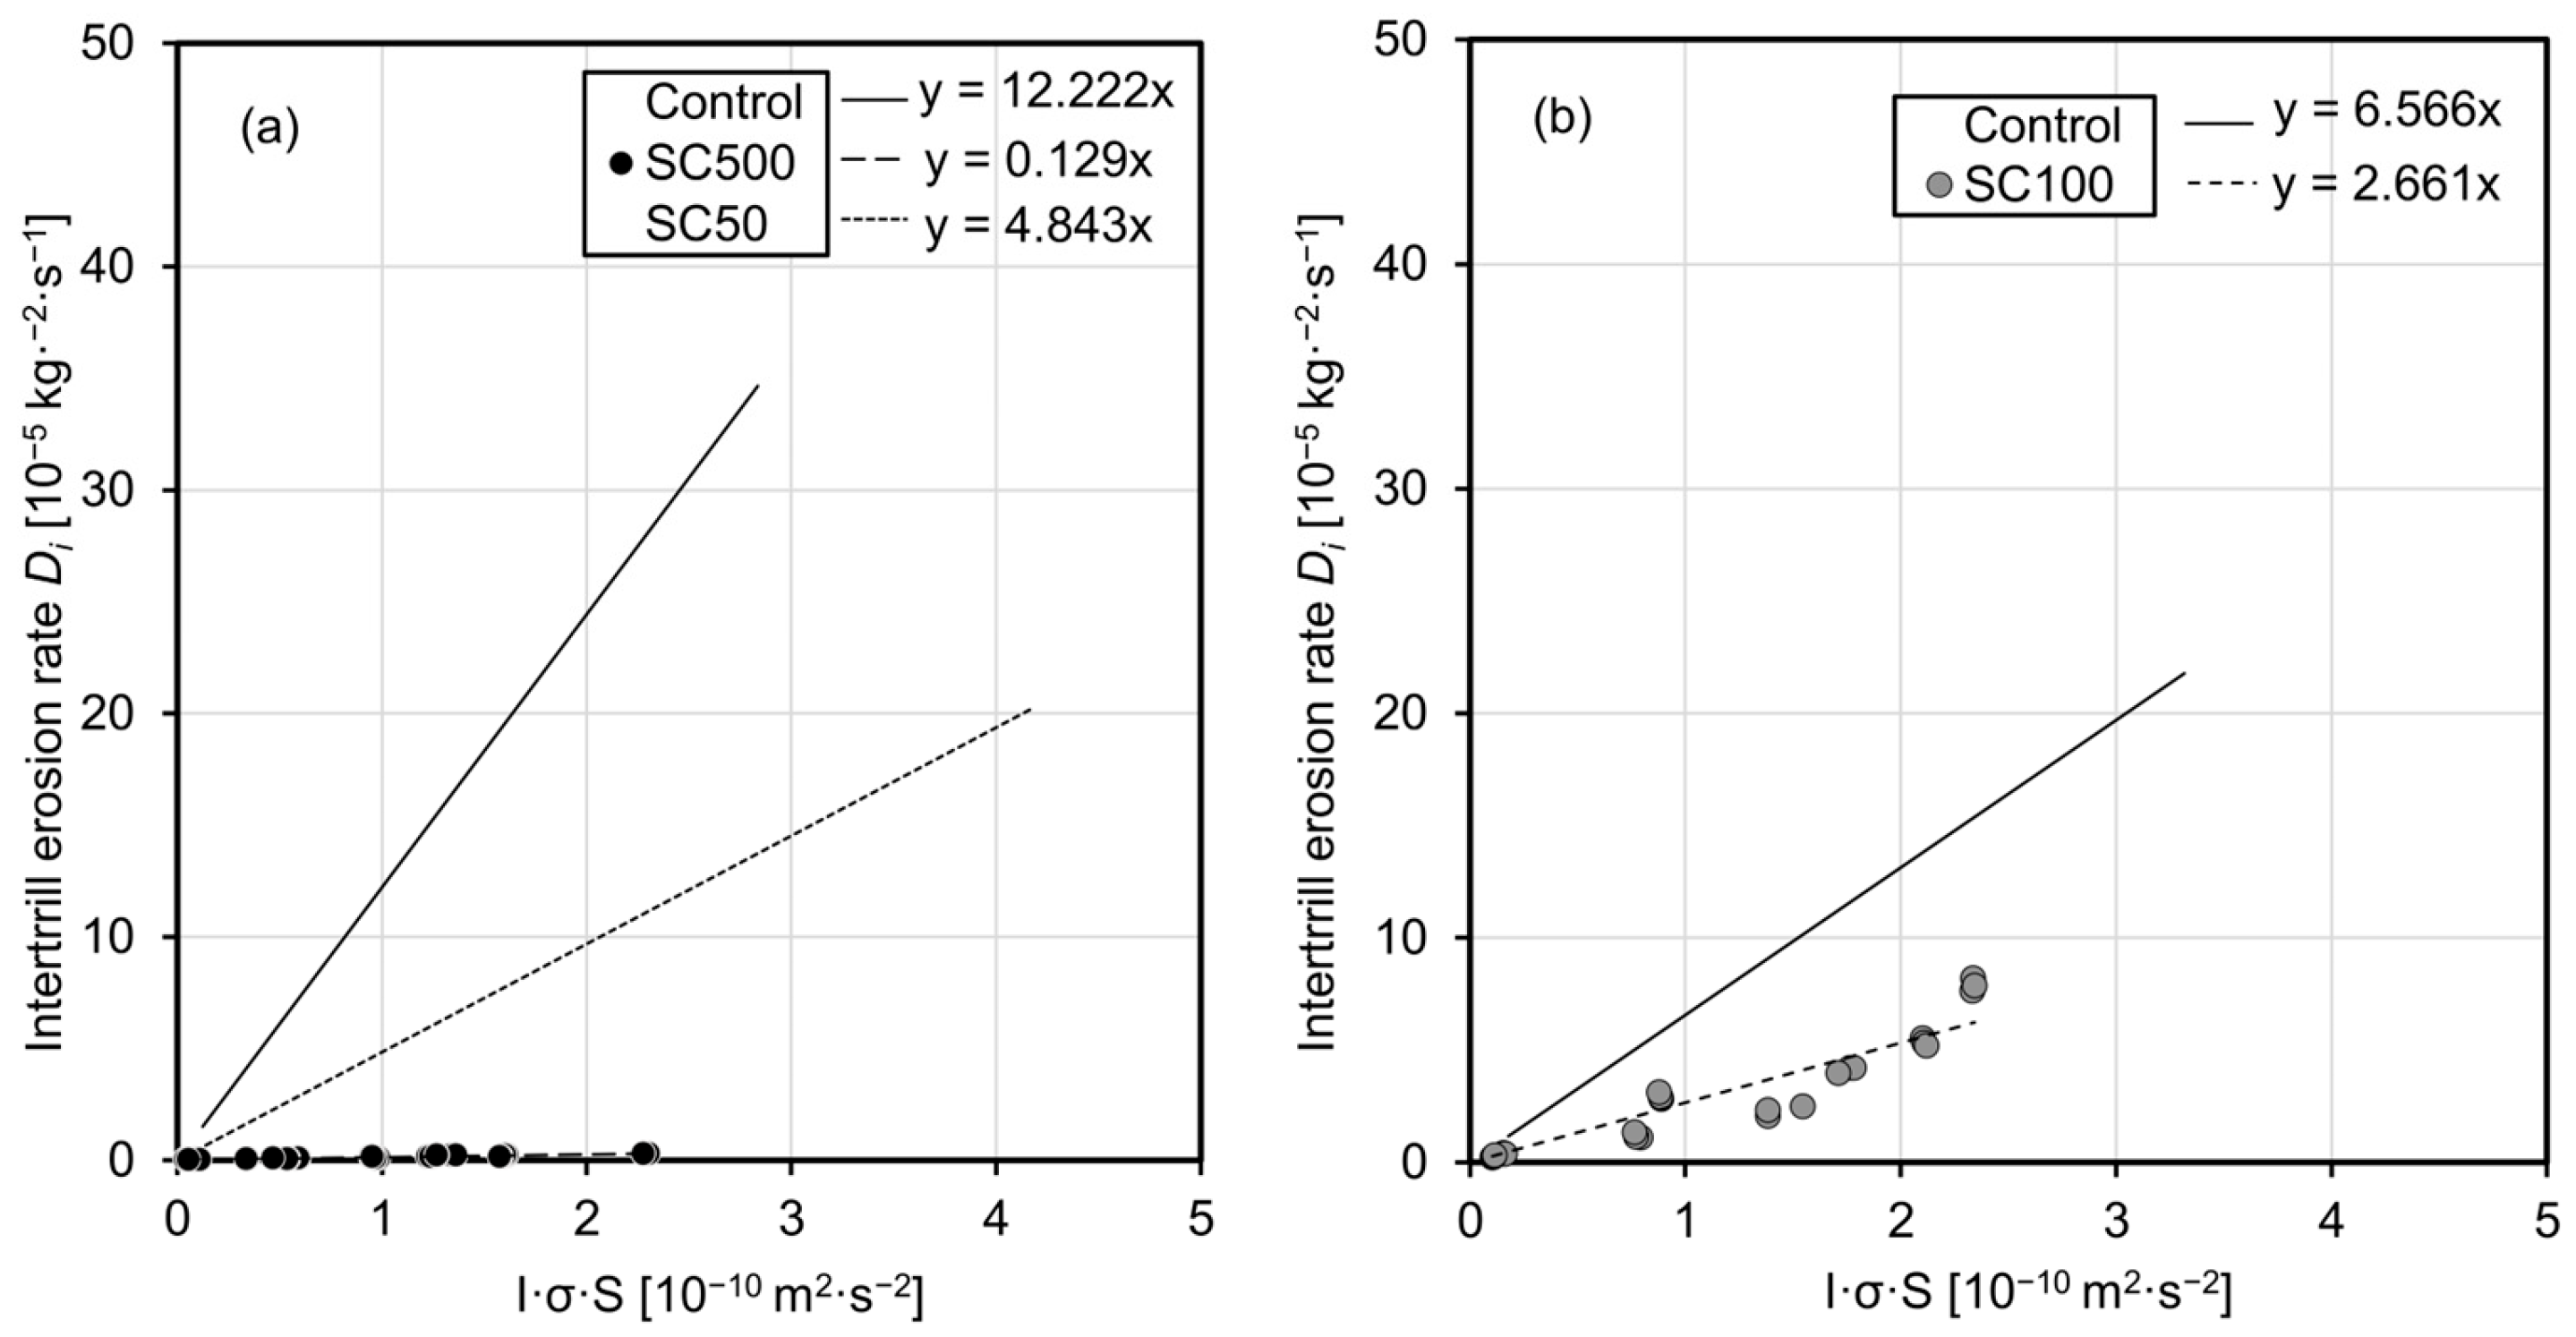
Figure 4 shows a visual comparison of the soil surfaces in the interrill erosion experiment. While the overall topographical differences created by this uniform erosion process are subtle, characteristic changes in the soil surface are visible. The untreated control surface (Figure 4a) developed a rougher texture and a patchy surface crust due to raindrop impact. Conversely, the surface of the treated soil (Figure 4b) remained visibly more stable and intact, even with the cracks pre-formed by the soil conditioner obscured by saturation. The results of interrill erosion experiments are plotted in Figure 5 (For visual clarity, data points are only shown for the regression line closest to the X-axis; see Figure S1 in Supplementary Material for all data). Here, the slopes of the relationships between the interrill erosion rate (Di) and the product of rainfall intensity (I), the runoff rate (σ), and the interrill slope adjustment factor (S) represents interrill erodibility (Kib). Above results are presented in Table 5.
The slopes of the trend lines in Figure 5 show that application of the soil conditioner significantly decreased interrill erosion under tested conditions (Soil A: F(2, 138) = 86.99, p < 0.001; Soil B: F(1, 68) = 29.84, p < 0.001). Among all treatments, SC500 achieved the highest reduction in interrill erodibility. However, because the SC100 treatment failed to reduce the hydraulic conductivity of Soil A, its interrill erodibility was unexpectedly higher than that of the SC50-treated Soil A, indicating this treatment was ineffective. Therefore, this study did not provide detailed data for SC100-treated Soil A in interrill erosion experiments.
To quantify the effect of the treatments on water infiltration, in interrill erosion experiments, we compared the runoff ratio (runoff rate/rainfall intensity) among all tested conditions (Table 4). Under all interrill erosion experiment conditions, SC500 demonstrated the highest improvement in water infiltration. Moreover, the runoff ratio increased with rainfall intensity (Table 4). This trend was particularly noticeable for SC50-treated Soil A, as its runoff ratio under high-intensity rainfall nearly equaled that of untreated Soil A.

3.2. Rill Erosion Experiments

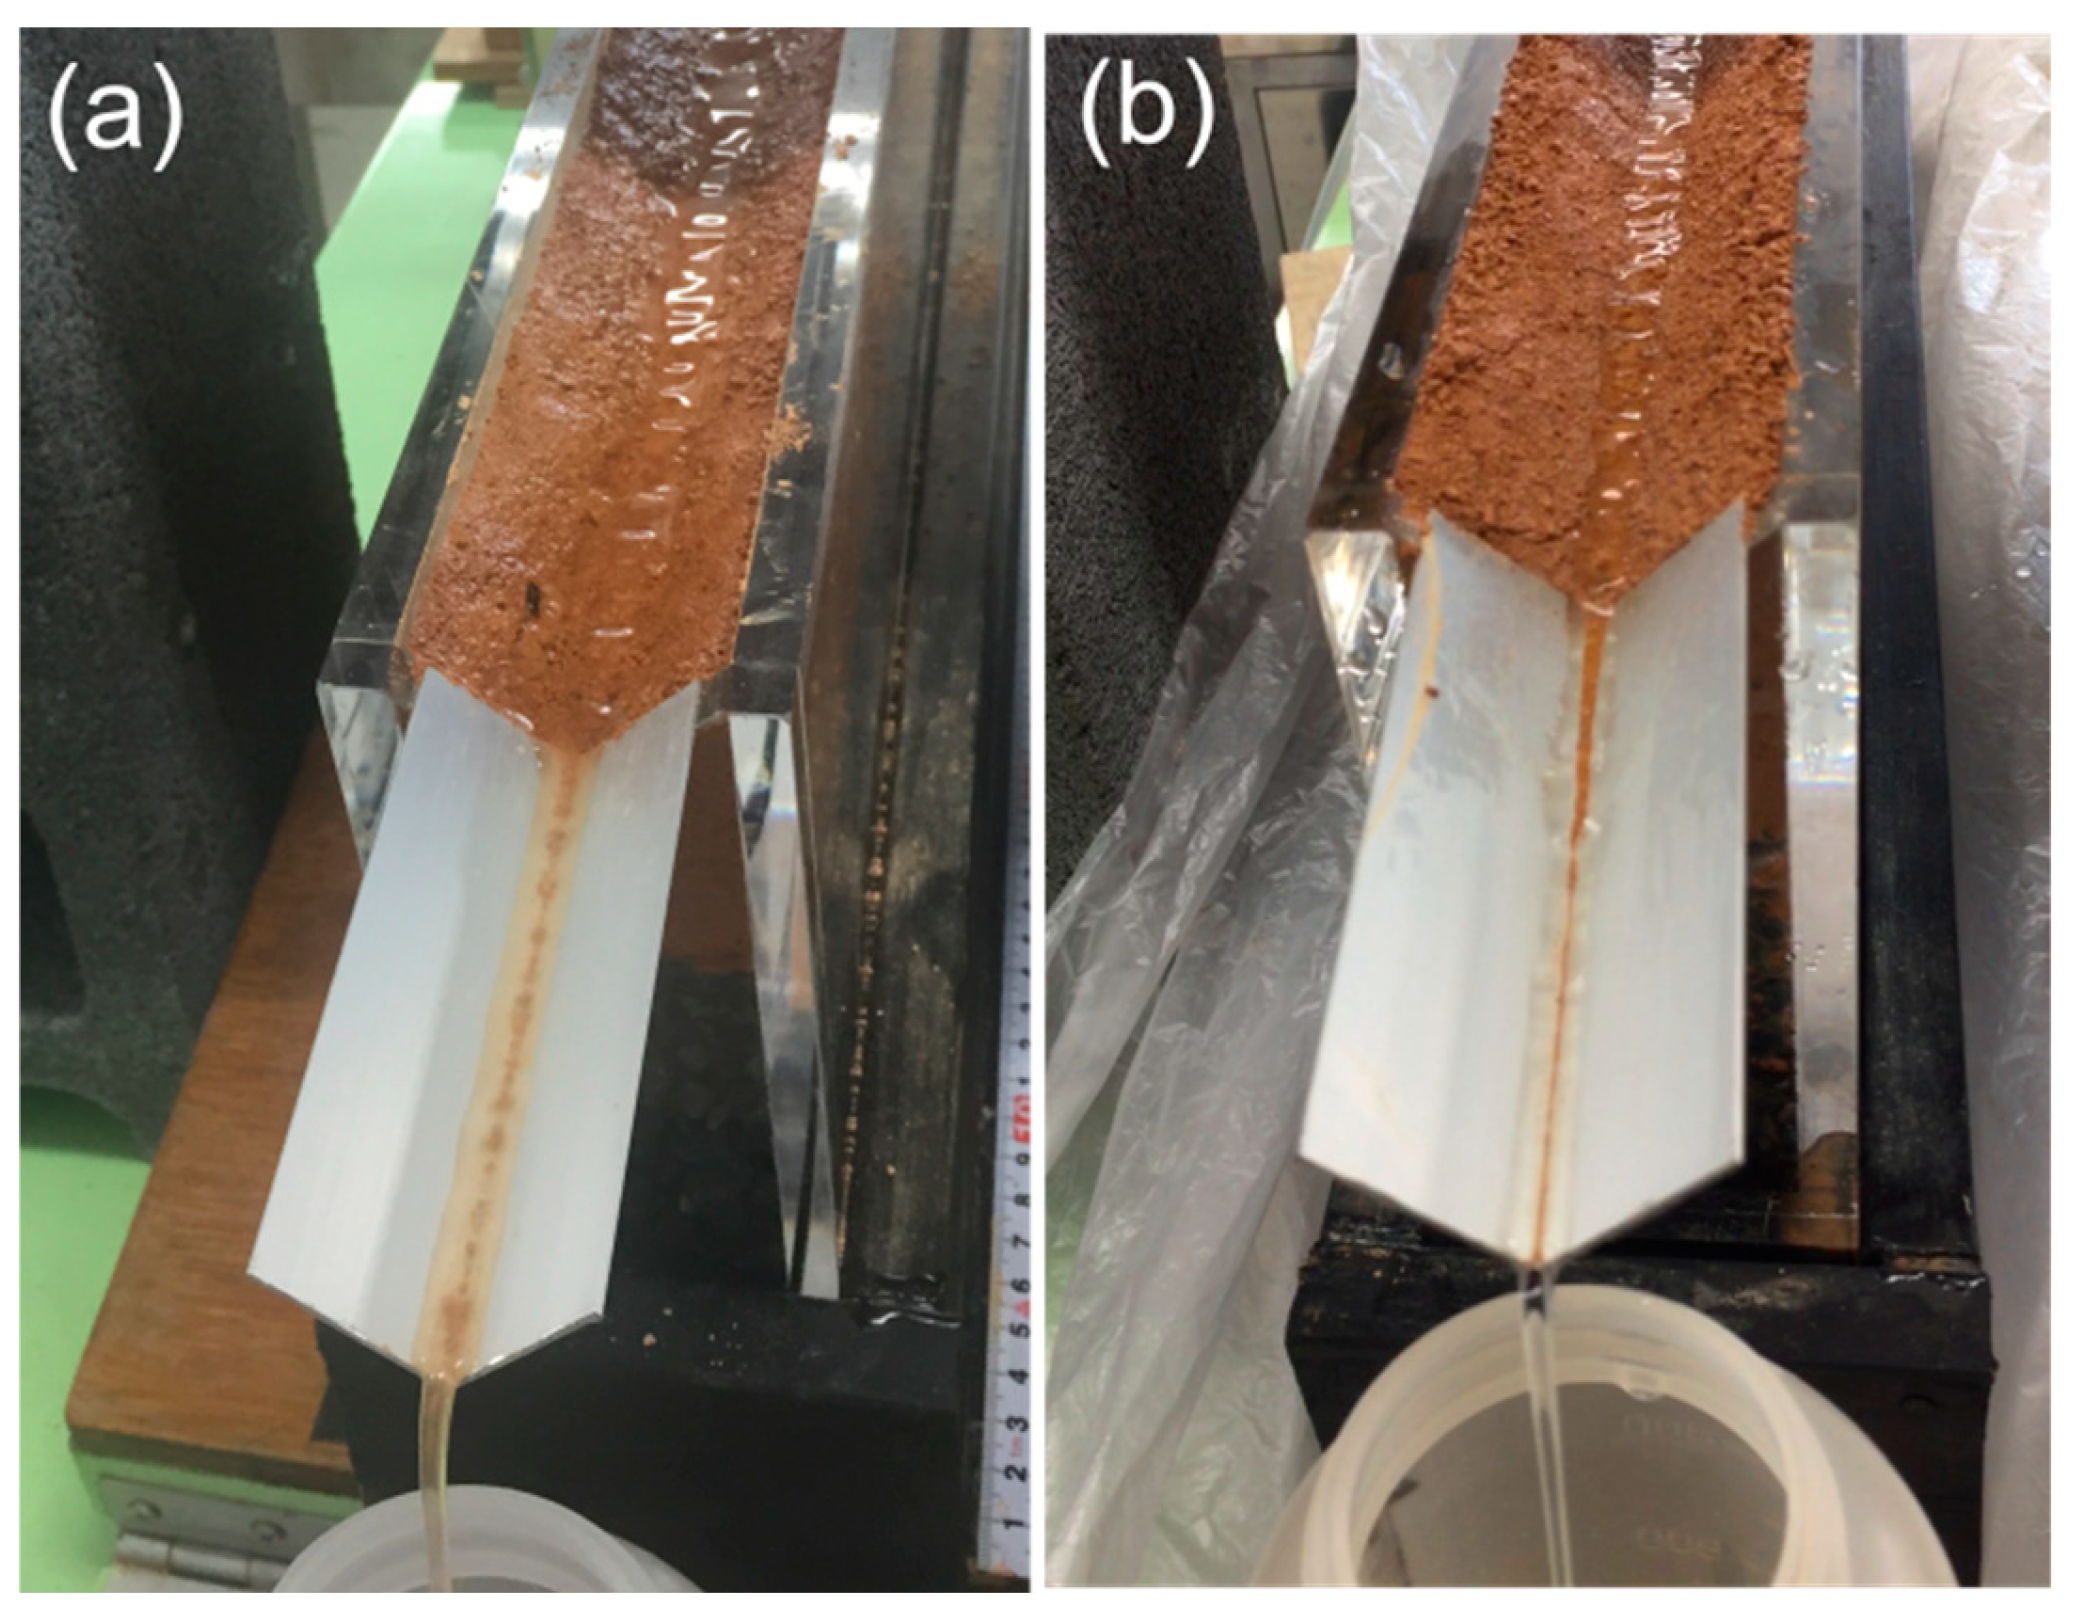
A visual comparison of the runoff from the rill erosion experiment is shown in Figure 6. This image showed that the V-shaped channel in the treated soil (Figure 6b) remained more intact, and the runoff water was clearer than that of the untreated soil (Figure 6a). The experimental results for rill erosion are plotted in Figure 7 (For visual clarity, data points are only shown for the regression line closest to the X-axis; see Figure S2 in Supplementary Material for all data). The slopes of the trend lines between the rill erosion rate (Dr) and the overland flow shear stress (τf) represents rill erodibility (Krb), and the intercept is the critical shear stress (τcb). These results are presented in Table 5. Due to the maximum flow rate limitation of the tube pump, no noticeable rill erosion was detected in SC100 application cases for either soil types, although minor detachment and transport of soil particles were observed. Additionally, Krb of SC500-treated Soil A was not presented, as no detachment of soil particles was observed. Consequently, the maximum shear stress observed during the experiments was used as a lower bound for τcb under the SC500 and SC100 conditions.
As indicated by the slopes of the trend lines in Figure 7, the soil conditioner reduced rill erosion across all experimental conditions (Soil A: F(2, 53) = 13.79, p < 0.001; Soil B: F(1, 68) = 24.456, p < 0.01). Similarly to the interrill erosion experiments, SC500 demonstrated the greatest effectiveness in reducing rill erodibility and enhancing critical shear stress. While SC100 did not entirely prevent rill erosion, its performance was comparable as SC500 for both soil types.

3.3. Estimation of Sediment Yield in Farmland by WEPP Simulations

The WEPP simulation inputs and results are summarized in Table 6. We omitted SC100-treated Soil A from the simulation because this treatment failed to perform as expected, preventing the determination of a valid Kib as detailed in Section 3.1. This exclusion ensured the integrity of the modeling analysis by avoiding the use of invalid data. A specific approach was required for the WEPP inputs for SC500-treated Soil A and SC100-treated Soil B, as the observed soil detachment in rill erosion tests was too low to establish a reliable regression. This prevented the accurate determination of Krb and τcb. Therefore, a conservative method was adopted for the model inputs: τcb was set to the maximum flow shear stress applied in the experiments, and the minimum input value of 1.0 × 10⁻⁶ s·m−1 was used for Krb, as this value best represented the extremely high erosion resistance observed in both cases.
According to Table 6, annual sediment yield was notably decreased under all conditions. The reduction ratio of sediment yield due to interrill erosion closely matched that of interrill erodibility in Table 5. When rill erosion occurred (SC50-treated Soil A), the reduction in sediment yield from rill erosion exceeded the reduction in rill erodibility due to increased critical shear stress. In the case where rill erosion did not occur in the experiments, the WEPP simulation also estimated zero sediment yield from rill erosion, resulting in almost identical reduction ratios for rill erodibility and sediment yield. However, the simulated annual runoff was unaffected by the application of the soil conditioner, as improvements in water infiltration were not reflected in the simulation.

4. Discussion

4.1. Effect of Different Application Amounts of Soil Conditioner

The data in Table 5 demonstrate that increasing the soil conditioner application amount led to progressive improvements in erosion prevention, which is consistent with the report that the lower application amount may not have been sufficient to improve soil structure and stability [38,39]. The soil conditioner reduced detachment and transport of soil particles by promoting cohesion among soil particles and forming a thick “cohesive layer” (3–5 mm) on the soil surface, which also reduced soil roughness. Additionally, the soil conditioner improved water infiltration by promoting cracking and macropores. These improvements observed in SC50-treated Soil A were less pronounced compared with those in SC500-treated and SC100-treated Soil A. Nevertheless, these findings suggest that even a small application amount can still contribute to erosion control by enhancing particle adhesion.
When the soil conditioner application is insufficient (e.g., SC50 treatment), the cohesive layer may become vulnerable due to inadequate cohesion among soil particles. In laboratory experiments, interrill erosion occurred in all experiments except SC500-treated Soil A, and rill erosion was observed only for SC50-treated Soil A. This suggests that in the laboratory experiments, part of the cohesive layer was more prone to disruption by the impacts of raindrops than by water flow, which means the soil conditioner was more effective in reducing rill erosion than interrill erosion.
Compared with a fully hardened soil surface, a vulnerable cohesive layer formed under a low application amount tends to exhibit uneven thickness and localized depressions. These depressions serve as initial failure zones where raindrop impacts preferentially disrupt the cohesive layer. Once disruption occurs, the depressions can deepen and expand, thereby increasing the roughness of the soil surface and amplifying erosion. Ref. [40] reported that in rainfall simulations, the rate of soil loss increases as surface roughness increases. Even though the soil conditioner reduced the roughness of soil surface through cohesive layer formation, its effectiveness was decreased by rainfall because the impact of the raindrops elevates the roughness of the initially smooth surface [41]. Therefore, if the amount of soil conditioner applied is insufficient to create a stable cohesive layer, its effectiveness in mitigating interrill erosion will be reduced.
Beyond its role in mitigating raindrop impact, the soil conditioner also influences behavior of surface flow. In rill erosion experiments, rough surfaces existing before the application of soil conditioner can disrupt the smooth laminar flow of water, allowing it to transition to turbulent flow at lower velocities [42]. Applying soil conditioner to the surface leads to an increase in the thickness of a viscous sublayer, within which, the flow is relatively laminar because viscous forces are dominant. Compared to turbulent flow, it is inferred that relatively laminar flow imposes lower shear stress on the soil surface, which can reduce detachment and transport of soil particles [43]. Therefore, the viscous sublayer becomes more resistant to disruption by water flow, and rill erosion is less likely to occur after the application of soil conditioner.
Overall, the soil conditioner shows considerable potential in reducing rill erosion than interrill erosion. However, insufficient application may fail to form stable cohesive layer, which is crucial for mitigating both interrill and rill erosion. Therefore, careful consideration of application amount is essential to optimize erosion control performance of the soil conditioner.

4.2. Different Reduction Effects on Kunigami Maaji and Shimajiri Maaji

The effectiveness of soil conditioners is influenced by various factors such as soil texture. In this study, Soil A was rich in clay whereas Soil B was rich in sand (Table 2). Consistent with previous studies that distinct soil characteristics generally lead to disparate performance of soil conditioners [44,45], the two types of soils exhibited different reduction ratio for interrill erodibility. In contrast, they showed similar reduction ratio for rill erodibility (Table 5).
Due to the different particle-size distribution, the soil conditioner exhibited significantly greater effectiveness in reducing interrill erosion for Soil A than for Soil B. Interrill erosion tests showed that although the application amount of SC100-treated Soil B was double that of SC50-treated Soil A, the reduction in interrill erodibility showed a similar ratio (Table 5). This result is attributable to the inherent erodibility difference between untreated soils. Compared with Soil B, untreated Soil A showed greater interrill erodibility due to its higher clay content. Ref. [46] reported that soils with high clay content generally promote aggregate formation. However, these aggregates are highly vulnerable to raindrop impact and lead to crust development and elevated interrill erosion risk [47]. As indicated in Section 4.1, the soil conditioner improved the stability of aggregates and physical strength of the soil surface, thereby reducing splash and detachment of soil particles caused by rainfall. Consequently, the soil conditioner achieved greater interrill erosion reduction effect in Soil A due to its high clay content.
Rill erosion experiments demonstrated that the application amount of SC100 optimally balanced erosion control effectiveness and practical feasibility in this study. As indicated in Table 5, untreated-Soil B exhibited higher rill erodibility and lower critical shear stress compared to untreated-soil A. These results indicate that Soil B is more prone to rill erosion than Soil A. Notably, no rill erosion of either soil A or soil B occurred after the application of SC100. This can be attributed to the cohesive layer formed on the soil surface due to the SC100 application, which significantly reduced rill erodibility and increased critical shear stress. As previously stated in Section 4.1, the cohesive layer is less prone to disruption by water flow than by raindrops. Therefore, the layer formed by SC100 application remained intact during the rill erosion tests, thereby preventing soil particle detachment. Under the SC50 condition, the layer was disrupted and lead to rill erosion. However, this lower application of soil conditioner still influenced rill erodibility and critical shear stress, thus contributing to a reduction in rill erosion. Notably, while the SC500 application fully prevented rill erosion, SC100 demonstrated nearly the same level of effectiveness. Collectively, these results establish SC100 as a robust application amount for rill erosion mitigation across two soil types in this study.

4.3. Assessment of Erosion Control Performance and Limitations in WEPP Simulation

According to Table 6, while the WEPP simulation quantitatively demonstrated the erosion reduction effect of the soil conditioner, it did not reflect improvements in hydrological properties, such as water infiltration.
The WEPP simulation result (Table 6) indicate that the soil conditioner reduced annual sediment yield predominantly through rill erosion mitigation with a minor reduction in interrill erosion. This outcome resulted from two factors. First, sediment yield due to interrill erosion was inherently limited in both soils. Second, WEPP model is sensitive to changes in rill erodibility and critical shear stress but less responsive to variations in interrill erodibility [48], while the conditioner exhibited greater effectiveness in reducing rill erosion as mentioned in Section 4.1. These factors collectively amplified soil conditioner effectiveness in reducing sediment yield due to rill erosion in the WEPP simulation. To evaluate how erodibility parameters mediate sediment control by the soil conditioner, simulations were conducted by exchanging erodibility parameters between SC50-treated Soil A and untreated Soil A. Compared to their respective baselines in Table 6, replacing untreated value of critical shear stress with SC50-treated Soil A value reduced sediment yield by 50%, while applying critical shear stress of untreated Soil A to SC50-treated Soil A increased yield by 140%. For rill erodibility, the same parameter exchange method resulted in 49% reduction and 126% increase in sediment yield, respectively. For interrill erodibility, this identical approach resulted in 3% reduction and 15% increase in sediment yield, respectively. These results confirmed that sediment yield reduction by the soil conditioner resulted mainly from its comparable impact on rill erodibility and critical shear stress, while interrill erodibility was less affected. Building on this, we propose determining the optimal application amount of the soil conditioner through rill erosion experiments, then applying this amount to both interrill erosion experiments and WEPP simulations. This approach could notably reduce experimental repetitions while improving research efficiency.
A potential model limitation is evidenced by the annual runoff outputs, in which WEPP simulation did not reflect water infiltration improvement by the soil conditioner (Table 6). Although soil conditioner addition induced aggregates and macropore formation (Section 4.1), WEPP simulation failed to capture the water infiltration enhancement and runoff reduction since effective hydraulic conductivity was automatically calculated based on soil texture. Since water infiltration affects sediment yield reduction [48], we manually calibrated effective hydraulic conductivity by iteratively adjusting its value in the model until the WEPP-simulated runoff ratio (average annual runoff/average annual precipitation) to match observed runoff ratios from the interrill erosion tests in Table 5. Compared to the baseline values prior to calibration, annual runoff decreased by 5–26%, while sediment yield was only reduced by 0.03–1.27%. Thus, although incorporating infiltration improvement modestly enhanced WEPP simulation accuracy through reduced annual runoff and sediment yields, its influence remained smaller than other model inputs affected by the soil conditioner.
The simulation may also underestimate the performance for some effective treatments. This is because a conservative, lower-bound estimate for τcb had to be used as the WEPP input in these cases as we mentioned in Section 3.3. As a result, the model likely predicted a higher sediment yield than would actually occur, meaning the true performance of the conditioner was underestimated.
While WEPP simulation demonstrated the efficacy of the soil conditioner under laboratory conditions, different surface conditions in the field (details will be presented in Section 4.4) may influence erodibility and WEPP simulation results. Therefore, accurately predicting erosion control effectiveness of the soil conditioner in practical applications requires model settings that adequately reflect these conditions differing from laboratory experiments.

4.4. Key Factors Affecting Conditioner Performance in Field Application

Both the laboratory experiments and WEPP simulations in this study were conducted under controlled conditions with smooth and bare surface. However, actual field conditions involve multiple influencing factors such as surface roughness, vegetation development, and tillage disturbance that may affect soil conditioner performance. Therefore, comprehensive evaluation under real agricultural field conditions remains essential for assessing the practical effectiveness of the soil conditioner.
Surface roughness of the field during the spraying of the soil conditioner can significantly reduce its effectiveness. Field application of soil conditioner prior to seeding hardens the soil surface and impedes seeding operations. Consequently, post-emergence application is considered as the optimal timing. However, crop fields at emergence typically exhibit heterogeneous surface. Clods, gravel, and crop residues in the field may intercept conditioner droplets and produce thinner zones and mechanical discontinuities at microtopographic variations within the cohesive layer. These localized weaknesses can become erosion hotspots under rainfall impact. Extreme rainfall events further intensify this risk by disrupting the cohesive layer through concentrated flow shear stress. Compared to the uniform and stable cohesive layer observed under laboratory conditions, surface roughness coupled with extreme rainfall events substantially increase erosion risk under field conditions.
Vegetation development in the field may obscure measurable effectiveness of the soil conditioner. Raindrop interception by canopy reduces interrill erosion [49,50], while plant roots reduce rill erosion by increasing critical shear stress and dissipating concentrated flow energy [51]. Crop residues further control rill erosion through ground coverage and flow resistance [52]. Under these conditions, vegetation is presumed to be the dominant factor in soil erosion mitigation, while the contribution from the conditioner may become less discernible.
During the post-harvest to pre-seeding period, tillage operations critically reduce soil conditioner effectiveness. In annual cropping systems, post-harvest tillage typically disrupts the cohesive layer, thereby diminishing the erosion mitigation effect. Consequently, the long-term persistence of soil conditioner effects is inherently limited in such systems.
Building on these factors discussed above, the effectiveness of the soil conditioner is most pronounced under two critical scenarios. First, on steep slopes, high-gradient topography concentrates rainfall-induced surface flow, thereby generating elevated flow shear stress and significantly increasing erosion risk [53]. While mulching serves as a common erosion control practice in farmland, its effectiveness on steep slopes is usually limited since covering materials are easily displaced by rainfall and runoff. In such conditions, the soil conditioner provides an effective solution that directly enhances structural integrity of soil surface and reduces erosion risk. Second, perennial cropping systems (e.g., orchards, coffee, and sugarcane) typically avoid regular tillage, thereby preserving the cohesive layer and prolonging the effectiveness of the conditioner. The synergistic interaction between steep slopes, which require protection against soil erosion, and perennial cropping systems, which help maintain this protection, creates an optimal scenario for maximizing the performance of the soil conditioner. In addition to small-scale sloped fields, the conditioner may also have potential in the recovery of degraded lands or in agricultural fields where soil structure has been compromised, although its economic viability in these contexts requires further evaluation.
While identifying optimal application scenarios is foundational, several other challenges related to long-term durability and practical viability must be addressed. A primary limitation of the present study is that the conditioner’s effectiveness was evaluated under a single simulated rainfall event. In practical application, the long-term durability of the conditioner is a critical factor. The polymer’s performance could be diminished over time by several environmental stressors, such as repeated rainfall events, wetting-drying cycles, or prolonged exposure to solar UV radiation. Site-specific soil profile conditions also pose a challenge. For example, in sandy soils like Soil B, a restrictive subsurface layer can cause lateral flow and internal erosion (piping). This subsurface process was beyond the scope of our surface-focused study. Another limitation is that although some hardened cohesive layers may remain after tillage, we predict a considerable reduction in the conditioner’s effectiveness due to the disruption of the hardened soil surface. Economic viability of the conditioner is another crucial hurdle as the production and application costs may limit its adoption by farmers. Future research should not only focus on maximizing erosion control but also on identifying the cost-effective application amount for farmers. Moreover, practical application methods need to be developed. While power sprayers could be a viable option especially for small-scale, sloped fields such as those in Japan, more efficient technologies would be required for large commercial farms. Finally, potential agronomic impacts warrant investigation. The formation of a hardened surface layer, for example, could hinder seed germination in annual cropping systems. A practical solution would be to apply the conditioner after crop emergence. At the same time, the improved water infiltration observed in laboratory experiments with the conditioner is likely to enhance soil aeration, which could benefit crop root systems.
In summary, a potential effectiveness gap is indicated between laboratory tests and field applications of the soil conditioner for erosion control. To address this gap, future research should focus on long-term field plot tests. These tests must comprehensively evaluate physical factors like surface roughness, vegetation development, and tillage disturbance, but also the critical challenges of long-term durability, cost-effectiveness, application methods, and potential agronomic impacts. These investigations will enable determination of optimal application conditions for the soil conditioner and develop practical guidelines for field applications.

5. Conclusions

The EVA-based soil conditioner was highly effective in mitigating erosion for both Okinawan soil types by hardening the soil surface and reducing particle detachment. Laboratory experiments demonstrated that the treatment significantly decreased interrill and rill erodibility while increasing critical shear stress and water infiltration. These effects were most pronounced in clay-rich and erosion-prone soils such as Kunigami Maaji (Soil A).
WEPP simulations confirmed the experimental findings, identifying the reduction in rill erodibility and the increase in critical shear stress as the primary determinants of the conditioner’s effectiveness in reducing sediment yield.
In a practical context, our findings suggest that perennial cropping systems on steep slopes likely provide the optimal scenario for the conditioner’s effectiveness. However, a significant gap remains between laboratory results and practical performance. Long-term field plot tests are essential to account for complex field conditions and to validate the conditioner’s field viability for the sustainable management of agricultural lands.

Supplementary Materials

The following supporting information can be downloaded at: https://www.mdpi.com/article/10.3390/agronomy15102362/s1, Figure S1: Relationship between the interrill erosion rate Di and the product of rainfall intensity I, runoff rate σ, and interrill slope adjustment factor S for all observed data point: (a) Soil A; (b) Soil B; Figure S2: Relationship between the rill erosion rate Dr and the overland flow shear stress τf for all observed data point: (a) Kunigami Maaji; (b) Shimajiri Maaji; Data S1: Supplementary raw data and model input files.

Author Contributions

Methodology: K.O.; Investigation: Y.X., S.C., J.T., K.H.; Formal Analysis: Y.X.; Data curation: Y.X.; Visualization: K.O., Y.X.; Validation: H.M., S.C., J.T., K.H.; Writing—Original Draft: Y.X.; Writing—Review & Editing: K.O., H.M.; Supervision: K.O., H.M.; Funding Acquisition: K.O.; Resources: S.C., J.T., K.H. All authors have read and agreed to the published version of the manuscript.

Funding

This work was supported by Japan Society for the Promotion of Science under Grant Number JP25K02116.

Data Availability Statement

The data presented in this study are available in the Supplementary Materials.

Conflicts of Interest

Yang Xin, Kazutoshi Osawa, and Hiroyuki Matsui declare no conflicts of interest. The following authors declare a conflict of interest due to their employment affiliation: Susumu Chiba is employed by the Japan Calcium Cyanamide Industry Association; Junpei Takahashi and Kazuma Honda are employed by Denka Company Limited. The authors declare that the research was conducted in the absence of any commercial or financial relationships that could be construed as a potential conflict of interest.

References

  1. Pimentel, D.; Harvey, C.; Resosudarmo, P.; Sinclair, K.; Kurz, D.; McNair, M.; Crist, S.; Shpritz, L.; Fitton, L.; Saffouri, R.; et al. Environmental and economic costs of soil erosion and conservation benefits. Science 1995, 267, 1117–1123. [Google Scholar] [CrossRef]
  2. Yang, D.; Kanae, S.; Oki, T.; Koike, T.; Musiake, K. Global potential soil erosion with reference to land use and climate changes. Hydrol. Process. 2003, 17, 2913–2928. [Google Scholar] [CrossRef]
  3. Lal, R. Soil erosion impact on agronomic productivity and environment quality. Crit. Rev. Plant Sci. 1998, 17, 319–464. [Google Scholar] [CrossRef]
  4. Pimentel, D.; Burgess, M. Soil erosion threatens food production. Agriculture 2013, 3, 443–463. [Google Scholar] [CrossRef]
  5. Pimentel, D. Soil erosion: A food and environmental threat. Environ. Dev. Sustain. 2006, 8, 119–137. [Google Scholar] [CrossRef]
  6. Kojima, R.; Osawa, K.; Matsuura, M.; Fujisawa, H.; Tomisaka, M.; Matsui, H. Identification of soil erodibilities for an application of wepp model with biological ground cover by algae and fungi. J. Jpn. Soc. Civ. Eng. Ser. G Environ. Res. 2018, 74, I_233–I_239. [Google Scholar] [CrossRef] [PubMed]
  7. Zamami, Y.; Chibana, C.; Kinjo, K. The Particle Size Distribution of the Soils Distributed in Okinawa and the Particle Size of Suspended Solids in Turbid Water. Annual report of Okinawa Prefectural Institute of Health and Environment, No. 48. 2014, pp. 63–66. Available online: https://www.pref.okinawa.jp/_res/projects/default_project/_page_/001/006/587/48-p63-66.pdf (accessed on 10 April 2024).
  8. Okinawa Prefectural Government. The Second the Master Plan for Countermeasures of Red Soil Erosion Prevention. 2023; p. 15. Available online: https://www.pref.okinawa.jp/_res/projects/default_project/_page_/001/004/801/akatuchikihonkeikaku2-2.pdf (accessed on 10 April 2024).
  9. Okinawa Prefectural Government. Final Report of the Master Plan for Countermeasures of Red Soil Erosion Prevention. 2022. Available online: https://www.pref.okinawa.jp/_res/projects/default_project/_page_/001/004/801/01akatuchihyouka.pdf (accessed on 10 April 2024).
  10. Seybold, C.A. Polyacrylamide review: Soil conditioning and environmental fate. Commun. Soil Sci. Plant Anal. 1994, 25, 2171–2185. [Google Scholar] [CrossRef]
  11. Liu, J.; Shi, B.; Jiang, H.; Bae, S.; Huang, H. Improvement of water-stability of clay aggregates admixed with aqueous polymer soil stabilizers. CATENA 2009, 77, 175–179. [Google Scholar] [CrossRef]
  12. Wallace, G.A.; Wallace, A. Control of soil erosion by polymeric soil conditioners. Soil Sci. 1986, 141, 363. [Google Scholar] [CrossRef]
  13. Green, V.S.; Stott, D.E. Polyacrylamide: A review of the use, effectiveness, and cost of a soil erosion control amendment. In Sustaining the Global Farm: Selected Papers from the 10th International Soil Conservation Organization Meeting; Stott, D.E., Mohtar, R.H., Steinhardt, G.C., Eds.; Purdue University and USDA-ARS National Soil Erosion Research Laboratory: West Lafayette, Indiana, 2001; pp. 384–389. [Google Scholar]
  14. Flanagan, D.C.; Gilley, J.E.; Franti, T.G. Water Erosion Prediction Project (WEPP): Development History, Model Capabilities, and Future Enhancements. Trans. ASABE 2007, 50, 1603–1612. [Google Scholar] [CrossRef]
  15. Laflen, J.M.; Flanagan, D.C.; Ascough II, J.C.; Weltz, M.A.; Stone, J.J. The WEPP model and its applicability for predicting erosion on rangelands. In Proceeding of Symposium Variability in Rangeland Water Erosion Processes; Soil Science Society of America, INC., Special Publication: Madison, WI, USA, 1994; Volume 38, pp. 11–22. [Google Scholar]
  16. Amore, E.; Modica, C.; Nearing, M.A.; Santoro, V.C. Scale effect in USLE and WEPP application for soil erosion computation from three Sicilian basins. J. Hydrol. 2004, 293, 100–114. [Google Scholar] [CrossRef]
  17. Klik, A.; Jester, W.; Rauter, C. Sediment transport in a small agricultural watershed—Evaluation of WEPP simulations with measured data. In Sediment Budgets 2 (Proceedings of Symposium S1 Held During the Seventh IAHS Scientific Assembly at Foz do Iguaçu, Brazil, 3–9 April 2005); Horowitz, A.J., Walling, D.E., Eds.; IAHS Publ. 292: Wallingford, UK, 2005; pp. 127–135. [Google Scholar]
  18. Ramsankaran, R.; Kothyari, U.C.; Rawat, J.S. Simulation of surface runoff and sediment yield using the water erosion prediction project (WEPP) model: A study in Kaneli watershed, Himalaya. Hydrol. Sci. J. 2009, 54, 513–525. [Google Scholar] [CrossRef]
  19. Shen, Z.Y.; Gong, Y.W.; Li, Y.H.; Hong, Q.; Xu, L.; Liu, R.M. A comparison of WEPP and SWAT for modeling soil erosion of the Zhangjiachong Watershed in the Three Gorges Reservoir Area. Agric. Water Manag. 2009, 96, 1435–1442. [Google Scholar] [CrossRef]
  20. Laflen, J.M.; Elliot, W.; Simanton, J.R.; Holzhey, C.S.; Kohl, K.D. WEPP: Soil erodibility experiments for rangeland and cropland soils. J. Soil Water Conserv. 1991, 46, 39–44. [Google Scholar] [CrossRef]
  21. Verhaegen, T. The use of small flumes for the determination of soil erodibility. Earth Surf. Process. Landf. 1987, 12, 185–194. [Google Scholar] [CrossRef]
  22. Romero, C.C.; Stroosnijder, L.; Baigorria, G.A. Interrill and rill erodibility in the northern Andean Highlands. CATENA 2007, 70, 105–113. [Google Scholar] [CrossRef]
  23. Yamaguchi, A.; Kanashiki, N.; Ishizaki, H.; Kobayashi, M.; Osawa, K. Relationship between soil erodibility by concentrated flow and shear strength of a Haplic Acrisol with a cationic polyelectrolyte. CATENA 2022, 217, 106506. [Google Scholar] [CrossRef]
  24. Takahashi, J.; Nishino, K. Emulsion Composition and Soil Erosion Prevention Material. World Intellectual Property Organization Patent WO2022018919A1, 27 January 2022. Available online: https://patents.google.com/patent/WO2022018919A1/en?oq=WO2022018919A1 (accessed on 10 April 2024).
  25. Henderson, A.M. Ethylene-vinyl acetate (EVA) copolymers: A general review. IEEE Electr. Insul. Mag. 1993, 9, 30–38. [Google Scholar] [CrossRef]
  26. Zeng, L.; Liang, M.; Cai, W.; Tang, J.; Liu, G.; Zhang, J.; Wang, S.; Yang, K. Investigation on effect of EVA on properties of desert sand-based permeable materials. Case Stud. Constr. Mater. 2023, 18, e02038. [Google Scholar] [CrossRef]
  27. Gribniak, V.; Kaklauskas, G.; Bacinskas, D. Shrinkage in reinforced concrete structures: A computational aspect. J. Civ. Eng. Manag. 2008, 14, 49–60. [Google Scholar] [CrossRef]
  28. Kodikara, J.; Barbour, S.; Fredlund, D. Desiccation cracking of soil layers. In Proceedings of the Asian Conference on Unsaturated Soils UNSAT ASIA 2000; CRC Press: Boca Raton, FL, USA, 2000; pp. 693–698. [Google Scholar] [CrossRef]
  29. FAO. World Reference Base for Soil Resources 2014: International Soil Classification System for Naming Soils and Creating Legends for Soil Maps; World Soil Resources Reports No. 106; FAO: Rome, Italy, 2014. [Google Scholar]
  30. Japanese Industrial Standards Association. Test Method for Ignition Loss of Soils (JIS A 1226: 2020); Japanese Industrial Standards Association: Tokyo, Japan, 2020. [Google Scholar]
  31. Japanese Industrial Standards Association. The Method for Particle Size Distribution of Soils (JIS A 1204: 2020); Japanese Industrial Standards Association: Tokyo, Japan, 2020. [Google Scholar]
  32. Matsusaka, Y.; Otawa, M.; Yamada, Y.; Hamazaki, T. Soils of Okinawa and Kume Islands. Natl. Inst. Agric. Sci. 1971, 22, 305–404. Available online: https://agriknowledge.affrc.go.jp/RN/2030826392.pdf (accessed on 10 November 2023).
  33. Japan Meteorological Agency. Surface Weather Observing Systems Data (Monthly), 2004. 2025. Available online: https://www.data.jma.go.jp/stats/etrn/view/monthly_s1.php?prec_no=91&block_no=47936&year=2024&month=&day=10&view=a5 (accessed on 25 September 2025).
  34. Nicks, A.D.; Lane, L.J.; Gander, G.A. Weather generator. In USDA-Water Erosion Prediction Project: Hillslope Profile and Watershed Model Documentation; Flanagan, D.C., Nearing, M.A., Eds.; NSERL Report No. 10; USDA-ARS National Soil Erosion Research Laboratory: West Lafayette, IN, USA, 1995; Chapter 2. [Google Scholar]
  35. Japan Meteorological Agency. Automated Meteorological Data Acquisition System Data, 1994–2009. 2024. Available online: https://www.data.jma.go.jp/risk/obsdl/index.php (accessed on 10 November 2023).
  36. Japan Meteorological Agency. Surface Weather Observing Systems Data, 1964–2014. 2024. Available online: https://www.data.jma.go.jp/risk/obsdl/index.php (accessed on 10 November 2023).
  37. Okinawa Prefectural Government. Established Rules Relating to Red Soil Erosion Prevention Ordinance. 1995. Available online: https://www.pref.okinawa.jp/_res/projects/default_project/_page_/001/023/458/jyourei.pdf (accessed on 10 April 2024).
  38. Zhou, C.; Zhao, S.; Huang, W.; Li, D.; Liu, Z. Study on the stabilization mechanisms of clayey slope surfaces treated by spraying with a new soil additive. Appl. Sci. 2019, 9, 1245. [Google Scholar] [CrossRef]
  39. Huang, W.; Liu, Z.; Zhou, C.; Yang, X. Enhancement of soil ecological self-repair using a polymer composite material. CATENA 2020, 188, 104443. [Google Scholar] [CrossRef]
  40. Vermang, J.; Norton, L.D.; Huang, C.; Cornelis, W.M.; da Silva, A.M.; Gabriels, D. Characterization of soil surface roughness effects on runoff and soil erosion rates under simulated rainfall. Soil Sci. Soc. Am. J. 2015, 79, 903–916. [Google Scholar] [CrossRef]
  41. Bahddou, S.; Otten, W.; Whalley, W.R.; Shin, H.-C.; El Gharous, M.; Rickson, R.J. Changes in soil surface properties under simulated rainfall and the effect of surface roughness on runoff, infiltration and soil loss. Geoderma 2023, 431, 116341. [Google Scholar] [CrossRef]
  42. Helming, K.; Römkens, M.J.M.; Prasad, S.N. Surface roughness related processes of runoff and soil loss: A flume study. Soil Sci. Soc. Am. J. 1998, 62, 243–250. [Google Scholar] [CrossRef]
  43. Nearing, M.A.; Parker, S.C. Detachment of soil by flowing water under turbulent and laminar conditions. Soil Sci. Soc. Am. J. 1994, 58, 1612–1614. [Google Scholar] [CrossRef]
  44. Imbufe, A.U.; Patti, A.F.; Burrow, D.; Surapaneni, A.; Jackson, W.R.; Milner, A.D. Effects of potassium humate on aggregate stability of two soils from Victoria, Australia. Geoderma 2005, 125, 321–330. [Google Scholar] [CrossRef]
  45. Özdemir, N.; Kassım, H. Effects of soil conditioner and humic acid applications on the development of some soil quality parameters. Soil Stud. 2022, 11, 1. [Google Scholar] [CrossRef]
  46. Wagner, S.; Cattle, S.; Scholten, T. Soil-aggregate formation as influenced by clay content and organic-matter amendment. J. Plant Nutr. Soil Sci. 2007, 170, 173–180. [Google Scholar] [CrossRef]
  47. Legout, C.; Leguédois, S.; Le Bissonnais, Y. Aggregate breakdown dynamics under rainfall compared with aggregate stability measurements. Eur. J. Soil Sci. 2005, 56, 225–238. [Google Scholar] [CrossRef]
  48. Ascough II, J.C.; Flanagan, D.C.; Nearing, M.A.; Engel, B.A. Sensitivity and first-order/monte carlo uncertainty analysis of the WEPP hillslope erosion model. Trans. ASABE 2013, 56, 437–452. [Google Scholar] [CrossRef]
  49. Haynes, J.L. Ground rainfall under vegetative canopy of crops. Agron. J. 1940, 32, 176–184. [Google Scholar] [CrossRef]
  50. Ma, B.; Yu, X.; Ma, F.; Li, Z.; Wu, F. Effects of crop canopies on rain splash detachment. PLoS ONE 2014, 9, e99717. [Google Scholar] [CrossRef]
  51. Gyssels, G.; Poesen, J.; Bochet, E.; Li, Y. Impact of plant roots on the resistance of soils to erosion by water: A review. Prog. Phys. Geogr. 2005, 29, 189–217. [Google Scholar] [CrossRef]
  52. Hussein, M.H.; Laflen, J.M. Effects of crop canopy and residue on rill and interrill soil erosion. Trans. ASABE 1982, 25, 1310–1315. [Google Scholar] [CrossRef]
  53. Renard, K.G.; Foster, G.R.; Weesies, G.A.; McCool, D.K.; Yoder, D.C. Predicting soil erosion by water: A guide to conservation planning with the Revised Universal Soil Loss Equation (RUSLE). In USDA Agriculture Handbook No. 703; U.S. Department of Agriculture: Washington, DC, USA, 1997. [Google Scholar]
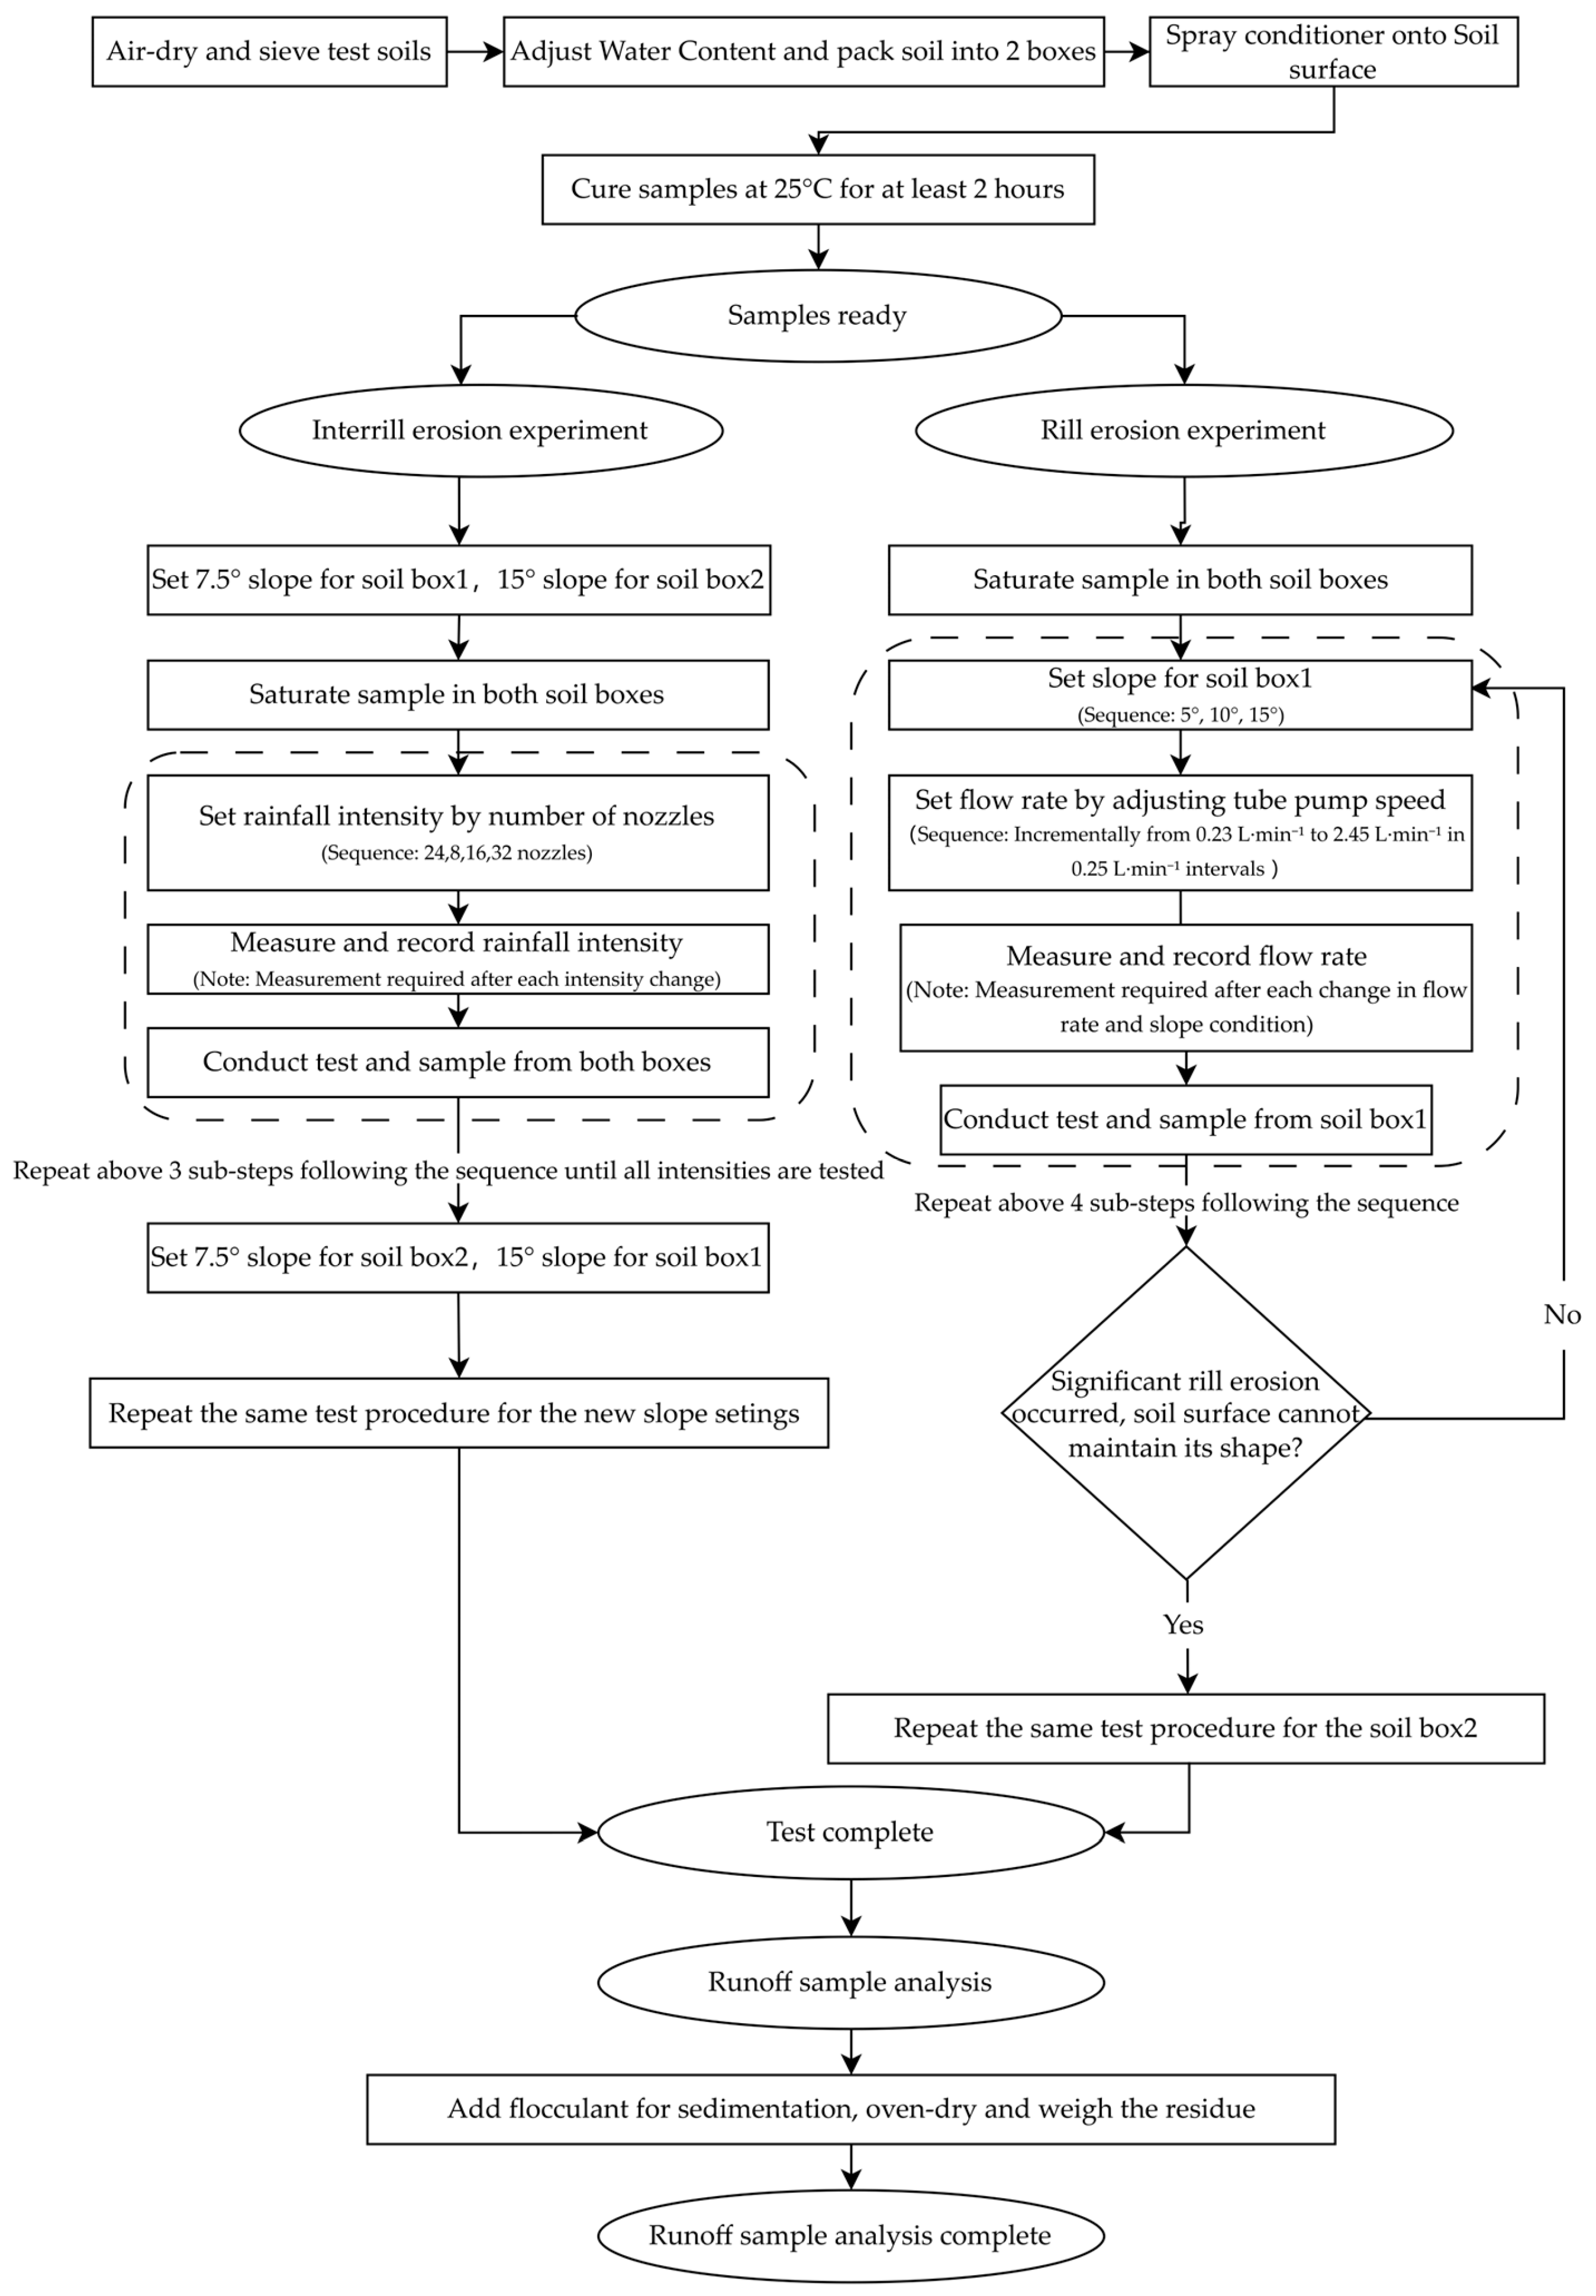
Figure 1. A flowchart of the overall experimental procedure, from soil pre-treatment to the sample analysis.
Agronomy 15 02362 g001
Figure 2. EVA-based soil conditioner and changes in soil surface features following application of the conditioner: (a) EVA-based soil conditioner; (b) immediately after application of the conditioner (500 g·m−2) to Kunigami Maaji soil (Soil A); (c) 5 h after application; (d) vertical section of the treated soil.
Agronomy 15 02362 g002
Figure 3. Soil boxes for erosion experiments: (a) Interrill erosion, plan (left) and section (right); (b) Rill erosion, plan (left) and section (right).
Agronomy 15 02362 g003
Figure 4. Visual comparison of soil surfaces in the interrill erosion experiment: (a) Soil A control; (b) Soil A SC500.
Agronomy 15 02362 g004
Figure 5. Relationship between the interrill erosion rate Di and the product of rainfall intensity I, runoff rate σ, and interrill slope adjustment factor S: (a) Soil A; (b) Soil B.
Agronomy 15 02362 g005
Figure 6. Representative photographs of runoff in the rill erosion experiment: (a) Soil A control; (b) Soil A SC500.
Agronomy 15 02362 g006
Figure 7. Relationship between the rill erosion rate Dr and the overland flow shear stress τf: (a) Kunigami Maaji; (b) Shimajiri Maaji.
Agronomy 15 02362 g007
Table 1. Physicochemical properties of the soil conditioner.
PropertyValue
pH4.9
Boiling point100 °C
FlammableNo
Density1.1 g·cm−3
Water solubilityWater-emulsifiable
Table 2. Textures and organic matter contents of the test soils.
Clay (%)Silt (%)Sand (%)Coarse Fragments (%)Organic Matter (%)
Kunigami Maaji (Soil A)33.9447.9118.150.047.77
Shimajiri Maaji (Soil B)5.1044.1050.8052.606.76
Table 3. Details of the soil conditioner treatments (The exact concentration of the active EVA ingredient in the proprietary stock solution is not disclosed by the manufacturer. According to the Safety Data Sheet, the stock solution contains a total copolymer concentration ranging from 35% to 60% by mass).
Treatment
Code
Application Amount
(g·m−2)
Equivalent Field Amount (t·ha−1)Dilution FactorSoil Water Content
(%)
Control00
SC5005005.00425
SC1001001.001515
SC50500.502525
Table 4. Experimental conditions used for interrill and rill erosion experiments.
Test Soil
Code
Interrill ExperimentsRill Experiments
Rainfall Intensity
(mm·h−1)
Flow Rate
(L·min−1)
Soil A
Control
16.75–68.580.23–2.16
Soil A
SC500
5.69–56.420.23–2.11
Soil A
SC100
14.34–75.540.23–1.15
Soil A
SC50
15.96–90.080.24–2.28
Soil B
Control
15.72–78.320.32–2.45
Soil B
SC100
17.72–75.640.32–2.41
Table 5. Summary of the experimental results for interrill erodibility, rill erodibility, and critical shear stress.
Test Soil
Code
Kib
[Reduction]
Runoff Ratiorp-ValueKrb
[Reduction]
τcbrp-Value
kg·m−4·s
[%]
s·m−1
[%]
Pa
Soil A *
untreated
1.222 × 10⁶
[-]
95–102%0.90<0.0013.452 × 10−3
[-]
1.6860.86<0.001
Soil A
SC500
0.013 × 10⁶
[99%]
41–73%0.95<0.001ES **>7.8400.32<0.001
Soil A
SC100
n/a *97–101%n/a *n/a *0.011 × 10⁻³
[99%]
>5.8280.85<0.1
Soil A
SC50
0.484 × 10⁶
[61%]
82–102%0.94<0.0011.210 × 10−3
[65%]
3.0820.95<0.01
Soil B
untreated
0.656 × 10⁶
[-]
97–105%0.96<0.0013.939 × 10−3
[-]
0.9450.92<0.001
Soil B
SC100
0.266 × 10⁶
[59%]
79–91%0.93<0.010.001 × 10−3
[99%]
>6.1220.28<0.01
* Data could not be accurately measured because the soil conditioner did not function as intended. ** Extremely small; data not available due to measurement limitations; Kib, interrill erodibility; Krb, rill erodibility; τcb, critical shear stress; r, Pearson’s correlation coefficient.
Table 6. Soil erodibility input values and sediment yields estimated by WEPP simulations.
InputOutput
Test Soil/CodeKibKrbτcbAnnual RunoffSY
(Reduction)
SYiSYr
kg·m−4·ss·m−1Pammkg·m−2·y−1
(%)
kg·m−2·y−1kg·m−2·y−1
Soil Auntreated1.222 × 1063.452 × 10−31.686437.4921.974
(-)
1.81120.163
SC5000.013 × 1060.001 × 10−37.840437.490.019
(99)
0.0190.000
SC500.484 × 1061.210 × 10−33.082437.495.998
(73)
0.7255.273
Soil Buntreated0.656 × 1063.939 × 10−30.945212.418.433
(-)
0.6047.829
SC1000.266 × 1060.001 × 10−36.122212.410.231
(97)
0.2310.000
Kib, interrill erodibility; Krb, rill erodibility; τcb, critical shear stress; SY, sediment yield; SYi, sediment yield due to interrill erosion; SYr, sediment yield due to rill erosion.
Disclaimer/Publisher’s Note: The statements, opinions and data contained in all publications are solely those of the individual author(s) and contributor(s) and not of MDPI and/or the editor(s). MDPI and/or the editor(s) disclaim responsibility for any injury to people or property resulting from any ideas, methods, instructions or products referred to in the content.