Review

Agronomic Practices vs. Climate Factors: A Meta-Analysis of Influences on Nitrous Oxide Emissions from Corn and Soybean Fields

1
College of Agriculture, Food and Natural Resources, University of Missouri, Columbia, MO 65211, USA
2
U.S. Geological Survey, Northern Prairie Wildlife Research Center, Jamestown, ND 58401, USA
*
Author to whom correspondence should be addressed.
Agronomy 2025, 15(10), 2358; https://doi.org/10.3390/agronomy15102358
Submission received: 13 September 2025 / Revised: 2 October 2025 / Accepted: 4 October 2025 / Published: 9 October 2025
(This article belongs to the Section Soil and Plant Nutrition)

Abstract

Nitrous oxide (N2O), a potent greenhouse gas (GHG) and major contributor to climate change, is primarily released through agricultural activities. To better understand and quantify how land management practices, local climate conditions, and soil physicochemical properties affect these agricultural N2O emissions, we conducted a review of the peer-reviewed literature on N2O emission from corn [Zea mays L.] and soybean [Glycine max (L.) Merr.] fields. We evaluated the seasonal, cumulative effects of three nitrogen fertilizer rates—no fertilizer (0), low (<188 kg N ha−1), and high (188–400 kg N ha−1)—tillage practices, local climate (precipitation and temperature), soil texture, and soil pH on soil N2O emissions. This meta-analysis included 77 articles for corn and 22 articles for soybean fields. Average N2O emissions during the corn rotation were 2.34 and 2.45 kg N2O-N ha−1 season−1 under low and high N fertilizer rates, respectively, and were both substantially (p < 0.0001) greater than those of non-fertilized corn fields (0.91 kg N2O-N ha−1 season−1). Non-fertilized soybean fields showed seasonal N2O emissions of 0.74 kg N2O-N ha−1, while low fertilizer application triggered a sharp increase (1.87 kg N2O-N ha−1) in N2O emissions by roughly 2.5 times (p < 0.028). Increased temperature did not significantly (p > 0.05) affect the emission of N2O from fertilized or non-fertilized corn fields. Regardless of fertilization and tillage practices, our analysis, including Principal Component Analysis, revealed that in corn fields, precipitation and soil pH are the dominant factors influencing soil N2O emissions. This study uniquely quantifies the influence of climate–soil factors, such as precipitation and soil pH, alongside agronomic practices, on N2O emissions, offering new insights beyond previous reviews focused primarily on fertilizer rates or tillage effects.

1. Introduction

Average global surface temperatures increased by 0.99 °C between 2001–2020 and are likely to rise 2 °C above the pre-industrial level by 2050 due to increased concentrations of greenhouse gases (GHGs) from both anthropogenic and environmental sources [1]. The agricultural sector is the highest producer of anthropogenic nitrous oxide (N2O), a powerful GHG with 298 times the radiative forcing potential of carbon dioxide (CO2) [1]. In recent decades, climate mitigation actions have taken global attention, and the 27th United Nations Climate Change Conference [2] emphasized the critical role of the agriculture sector in climate change. As a result, there is an increased need to understand the impacts of anthropogenic activities and climate condition drivers of N2O emissions from agricultural fields to help develop effective climate mitigation strategies.
Application of nitrogenous fertilizers and tillage practices in cropping systems is well known to influence N2O emissions [3,4]. Excess agricultural N is a strong driver of soil N2O emission [5]. Nitrogen fertilization is estimated to account for 60% of anthropogenic N2O emissions [6,7]. Tillage practices can accelerate soil N mineralization, nitrification, and thus N2O flux [4]. Studies have shown that higher inorganic N concentration under conventional tillage practices compared to no-till in corn [Zea mays L.]–soybean [Glycine max (L.) Merr.] rotation systems can lead to 43% greater N2O emissions [8]. However, reduced tillage or no-till practices can help retain moisture by leaving crop residues on the soil surface [9], which can facilitate incomplete denitrification and increased N2O production and emission [10].
Climate conditions, including rainfall characteristics and temperature, can notably impact soil N2O emissions. Elevated soil moisture levels can create favorable conditions for microbial activity, including denitrification, a major source of soil N2O production and release [11]. Incomplete denitrification in saturated soils is responsible for the reduction of nitrate (NO3) to N2O gas [12]. Warmer temperatures can increase soil microbial activity and rates of nitrification and denitrification, which can also lead to higher rates of N2O production [13,14]. Acidic soils (pH 4.3–5.6) show lower N2O emission relative to neutral to basic soils (pH 7.0–8.1) [15]. Increased soil pH in nutrient-rich soils contributes to soil enzyme and microbial activity, respiration, and GHG emission [16].
The objective of this review is to systematically analyze and synthesize the existing scientific literature on the effects of land management and climate and soil conditions on growing-season N2O emissions from corn and soybean agricultural systems. By collating data from a broad set of studies, we quantitatively assess how agronomic practices (e.g., tillage, fertilizer rate and type) and environmental variables (e.g., precipitation, air temperature, soil pH) influence N2O fluxes. Using principal component analysis (PCA), we further identify the most influential drivers within each crop system, highlighting the key factors affecting emissions in corn and soybean fields separately. Unlike previous reviews that focused primarily on single variables such as fertilizer or tillage, this study provides a comparative evaluation of both management practices and climate conditions. Previous studies have predominantly examined the individual effects of nitrogen (N) fertilizer application or tillage practices on nitrous oxide (N2O) emissions, often in isolation. For instance, a meta-analysis by Zhang et al. (2019) found that the type of N fertilizer is the best single predictor of N2O emissions from agricultural soils [17]. Similarly, tillage and abiotic factors has been shown to significantly affect soil N2O emissions [8,12]. However, these studies typically focus on single factors without considering the complex interactions between agronomic practices and environmental conditions. Our findings offer insight into the relative importance of these factors, with implications for sustainable farming strategies and the design of mitigation practices, while clearly acknowledging that the analysis is limited to the growing season.

2. Methods

2.1. Literature Review

Following PRISMA 2020 statement guidelines [18] (Chart 1), a literature search was conducted on Web of Science—All Databases (including Core Collection, BIOSIS Citation Index, Current Contents Connect, Data Citation Index, Derwent Innovations Index, KCI-Korean Journal Database, MEDLINE, SciELO Citation Index, and Zoological Record) on 15 May 2023. The exact search expression used was:
TS = (“Soil”) AND TS = (“N2O”).
This initial search retrieved 17,817 peer-reviewed articles. Refining the search with TS = (“corn”) AND TS = (“growing season”) returned 251 articles, and that with TS = (“soybean”) AND TS = (“growing season”) returned 78 articles. Separate crop-specific searches using either ‘corn’ or ‘soybean’ ensured that the studies included were relevant to each target crop. This approach allowed us to refine the dataset for corn and soybean independently, providing a more accurate and focused assessment of soil N2O emissions for each crop type. The study focused on examining and gathering data concerning soil N2O fluxes and the various factors that contribute to N2O emissions, including climate and soil elements like soil pH, precipitation, and air temperature, as well as human activities such as fertilizer application. To establish criteria for this review, we considered the following inclusion and exclusion measures: (1) Duplicate citations were eliminated; (2) soil GHG measurements must have been conducted in situ using static chambers; (3) only articles that reported cumulative GHG emissions over the growing season were selected. (4) Average 2-year cumulative emissions from corn–soybean rotation fields were eliminated. (5) Only the experimental sites historically under corn/soybean cultivation were the focus of this review, and the converted land use systems (e.g., conversion from grassland to corn) were eliminated. (6) Only the studies that reported treatment versus control measurements (e.g., fertilizer vs. non fertilized) were selected.
If the cropping system was a rotation of corn or soybean with other crops, only the emissions from the corn or soybean phase of the rotation were collected. The amounts of N added as synthetic (ammonium nitrate, urea, urea + ammonium nitrate) and organic (slurry, manure) fertilizer were collected from each study. Unless the study provided the amount of N added by applying crop residues, we did not consider this treatment as an extensive external source of organic N input. Soil pH values in the reviewed studies were consistently measured within the top 0–15 cm of the soil profile. If not provided by the study, soil pH was obtained from other studies at the same study site, or from the soil taxonomy and classification data, which the state’s departments of agriculture mostly release. Whenever the proportion of sand, silt, and clay-sized particles was needed, the soil texture triangle was used to derive the soil texture. The USDA Web Soil Survey tool [19] was used to derive soil texture using the study site coordinates whenever the soil texture or particle size analysis was not reported. The original data used in this analysis were either sourced from tables and text or digitally extracted from figures using Graphreader, v2.0 and WebPlotDigitizer v4.6. Unless available for the experimental period, growing season precipitation and mean temperature were obtained from the data provided by the local or national weather stations mentioned in each study.
Emissions were converted from mol into mass basis using the appropriate molecular weight whenever needed. The relevant conversion factor for annual emissions converted the area units to hectares. The mean values of the N2O fluxes were expressed to two decimal places. The CO2 equivalents (CO2eq) were converted to N2O fluxes by applying the associated gas warming potential conversion factors as used in the associated study.

Research Materials

Among the studies included in this review, the majority of region-specific studies were conducted in North America, accounting for approximately 50% of the studies with clearly defined locations. Notably, the majority of these studies were published between 2015 and 2025, reflecting a recent surge in research activity in this region. China followed with around 16% of region-specific studies, with the majority published between 2010 and 2020. Europe contributed roughly 10%, with a significant number of studies published between 2010 and 2020. Studies from South Asia, primarily India, represented about 4%, with most published between 2015 and 2025. Africa accounted for approximately 3%, with studies predominantly published between 2010 and 2020. Studies classified as global, reviews, or with unspecified locations were excluded from this calculation. This distribution reflects a strong research focus on North America and China, while also indicating opportunities for further studies in other regions. Chart 1 presents a PRISMA diagram outlining the study selection process.
In this study, agronomic practices refer to management strategies applied at the field level, including nitrogen fertilizer application rate, fertilizer type, and tillage system. Climate–soil factors encompass environmental and edaphic conditions that regulate soil nitrogen cycling, specifically seasonal precipitation and temperature (climatic variables), as well as inherent soil properties such as texture and pH.

2.2. Data Analysis

2.2.1. Effect of Land Management

To evaluate the effects of agronomic activities on the emission of soil N2O from corn and soybean fields, fertilization levels were separated into three levels of no fertilization, N rate < 188 kg ha−1 (the economic optimum N rate estimated by Schmidt et al. [20]), and N rate of 188–400 kg ha−1 (the majority of nitrogen fertilizer rates found in the literature are typically within this specified range). While 188 kg N ha−1 has been identified in the literature as a general economic optimum nitrogen rate (EONR), we recognize that EONR varies by location, soil type, and climatic conditions. The chosen threshold serves as a practical reference point for categorizing nitrogen application rates rather than a universally applicable EONR. We further note that the 188–400 kg N ha−1 category applies only to corn studies, as soybean studies did not report fertilizer rates within this range. In addition to the N application rate, we evaluated five types of fertilization measures: (1) organic fertilizer (organic manure/slurry), (2) urea, (3) urea + ammonium nitrate, (4) anhydrous ammonia, and (5) ammonium nitrate. Response ratio (R) was used to investigate the impact of land management practices on the emission of N2O. To measure the effect size, the natural log of response ratio (lnR), which is a metric commonly used in meta-analyses, and the mean of the response ratio (Rave) were calculated using Equations (1) and (2), respectively [21]:
l n R = ln N 2 O t N 2 O c
W i = n × f o b s
R a v e = e x p ln R i × W i w i
where ‘Wi’ is the weight for observations from the ith site; the value of ‘obs’ is the total number of flux observations over the study period from the ith site; n is the number of field replicates; ‘f’ is the number of flux measurements per month. N2Ot and N2Oc are N2O fluxes for treatment and control. Treatments are fertilization and tillage practices versus corresponding controls of no fertilization and no-till practices, respectively, derived from the same study. The results of R analysis visualized and expressed in %change ([R − 1] × 100) to facilitate interpretation and discussion. Mean N2O emission values were evaluated using Equation (4) representing the mean value of N2O emissions under various treatments.
M = N 2 O i × W i w i
where N2Oi is the N2O flux from the ith site corresponding to a specific treatment and Wi is the weight for observations from the ith site. We used the Statistical Analysis System (SAS, Studio 3.81) package for statistical analyses and evaluation of significance levels at p < 0.05.

2.2.2. Effect of Climate–Soil Factors

Climate–soil factors in this study included precipitation, temperature, soil pH, and soil texture. Precipitation was categorized into two classes: <550 mm and 550–1100 mm seasonal totals. Temperature was grouped into 15–25 °C and 25–30 °C ranges. Soil pH and soil texture were also considered under this category, as they represent inherent soil properties rather than agronomic practices. The effects of soil pH and texture, as well as growing season precipitation and temperature rate on the emission of soil N2O, were investigated under the three above-mentioned levels of N rate application. Soil pH was divided into three levels (<6.0, 6.0–7.0, and >7.0), representing acidic, neutral, and alkaline soils, respectively. Soil textures were categorized according to the U.S. Department of Agriculture classification system: coarse and moderately coarse texture, sandy/sandy loam/loamy sand; medium texture, loam/silty loam/silt; fine texture and moderately fine texture, clay/clay loam/sand clay loam/silty clay loam.
We used the methods of Linquist et al. [22] applying MetaWin 3 (Version 3.0.8 beta) software tool to conduct the analysis. Data represented the total N2O-N per unit crop field (ha). The N2O-N of each study was weighted by replication and sampling frequency (Equation (4)). Mean fluxes for categories of studies (e.g., the three fertilization rates, and the categories based on soil pH or texture of each crop type) were considered significantly different if their 95% confidence intervals (CI) did not overlap. CO2 equivalent (CO2eq) was converted to N2O fluxes using the appropriate conversion factor (Equation (5)).
CO 2 eq = N 2 O   ×   44 28 × 298
where 298 is the 100-year time-horizon global warming potential value of N2O as compared to CO2 [22].

2.2.3. Principal Component Analysis

A Principal Component Analysis (PCA) was applied using RStudio version 2023.12.1+402. Principal Component Analysis identifies the correlations between variables and provides information about the relative importance of each original variable in determining the principal components. By examining variables with higher loadings on a particular principal component, we were able to identify which variables are most strongly associated with soil N2O flux. Principal Component Analysis visualization led to examining how different variables are correlated with each other and with soil N2O flux (Pearson correlation) to understand which factors are most influential.

3. Results and Discussion

3.1. Nitrogen Fertilizer

Fertilizer application significantly increased nitrous oxide (N2O) emissions in both corn and soybean cropping systems. Our analysis of 260 observations showed that average seasonal N2O emissions in corn were 2.34 (N rate < 188 kg ha−1) and 2.45 (188 < N rate < 400 kg ha−1) kg N2O-N ha−1 season−1 (Table 1). These values align with the range of 2.1–3.9 kg N2O-N ha−1 season−1 reported in other meta-analyses [22,23]. In contrast, non-fertilized soybean fields emitted only 0.74 kg N2O-N ha−1, while fertilizer application increased emissions by approximately 2.5 times (Table 1). Comparing the two crops under a more realistic scenario, fertilized corn fields emitted roughly three times more N2O than non-fertilized soybean fields, which is consistent with findings by Drury et al. [24]. They observed two- to three-fold higher N2O emissions from corn relative to soybean years due to the N application.
The global average human-induced N2O emissions, dominated by agricultural N additions, were reported to be 2.4–6.7 kg N ha−1 yr−1 [25] when accounting for the 1.7 billion hectares of global cropland [26]. Discrepancies between our findings and other studies can be attributed to differences in climate zones, soil properties, the number of observations, and the analytical methods used. The sequence of crops in a rotation, particularly the common corn–soybean rotation, can influence the overall system’s global warming potential (GWP) [27]. The symbiotic N fixation by soybeans can reduce the need for N fertilizers in the rotation, which in turn lowers the overall GWP of the system [28].
In our analysis, a low nitrogen (N) application rate (55.8 kg N ha−1) in soybean fields significantly increased N2O emission by 91% compared to unfertilized plots (p = 0.028). Furthermore, N2O emissions from corn fields with low fertilizer rates (N rate < 188 kg N ha−1 season−1) were substantially higher than those from soybean fields at the same N rate (p = 0.031). This may be because the N application rate did not exceed the optimal N uptake range for soybeans [29].
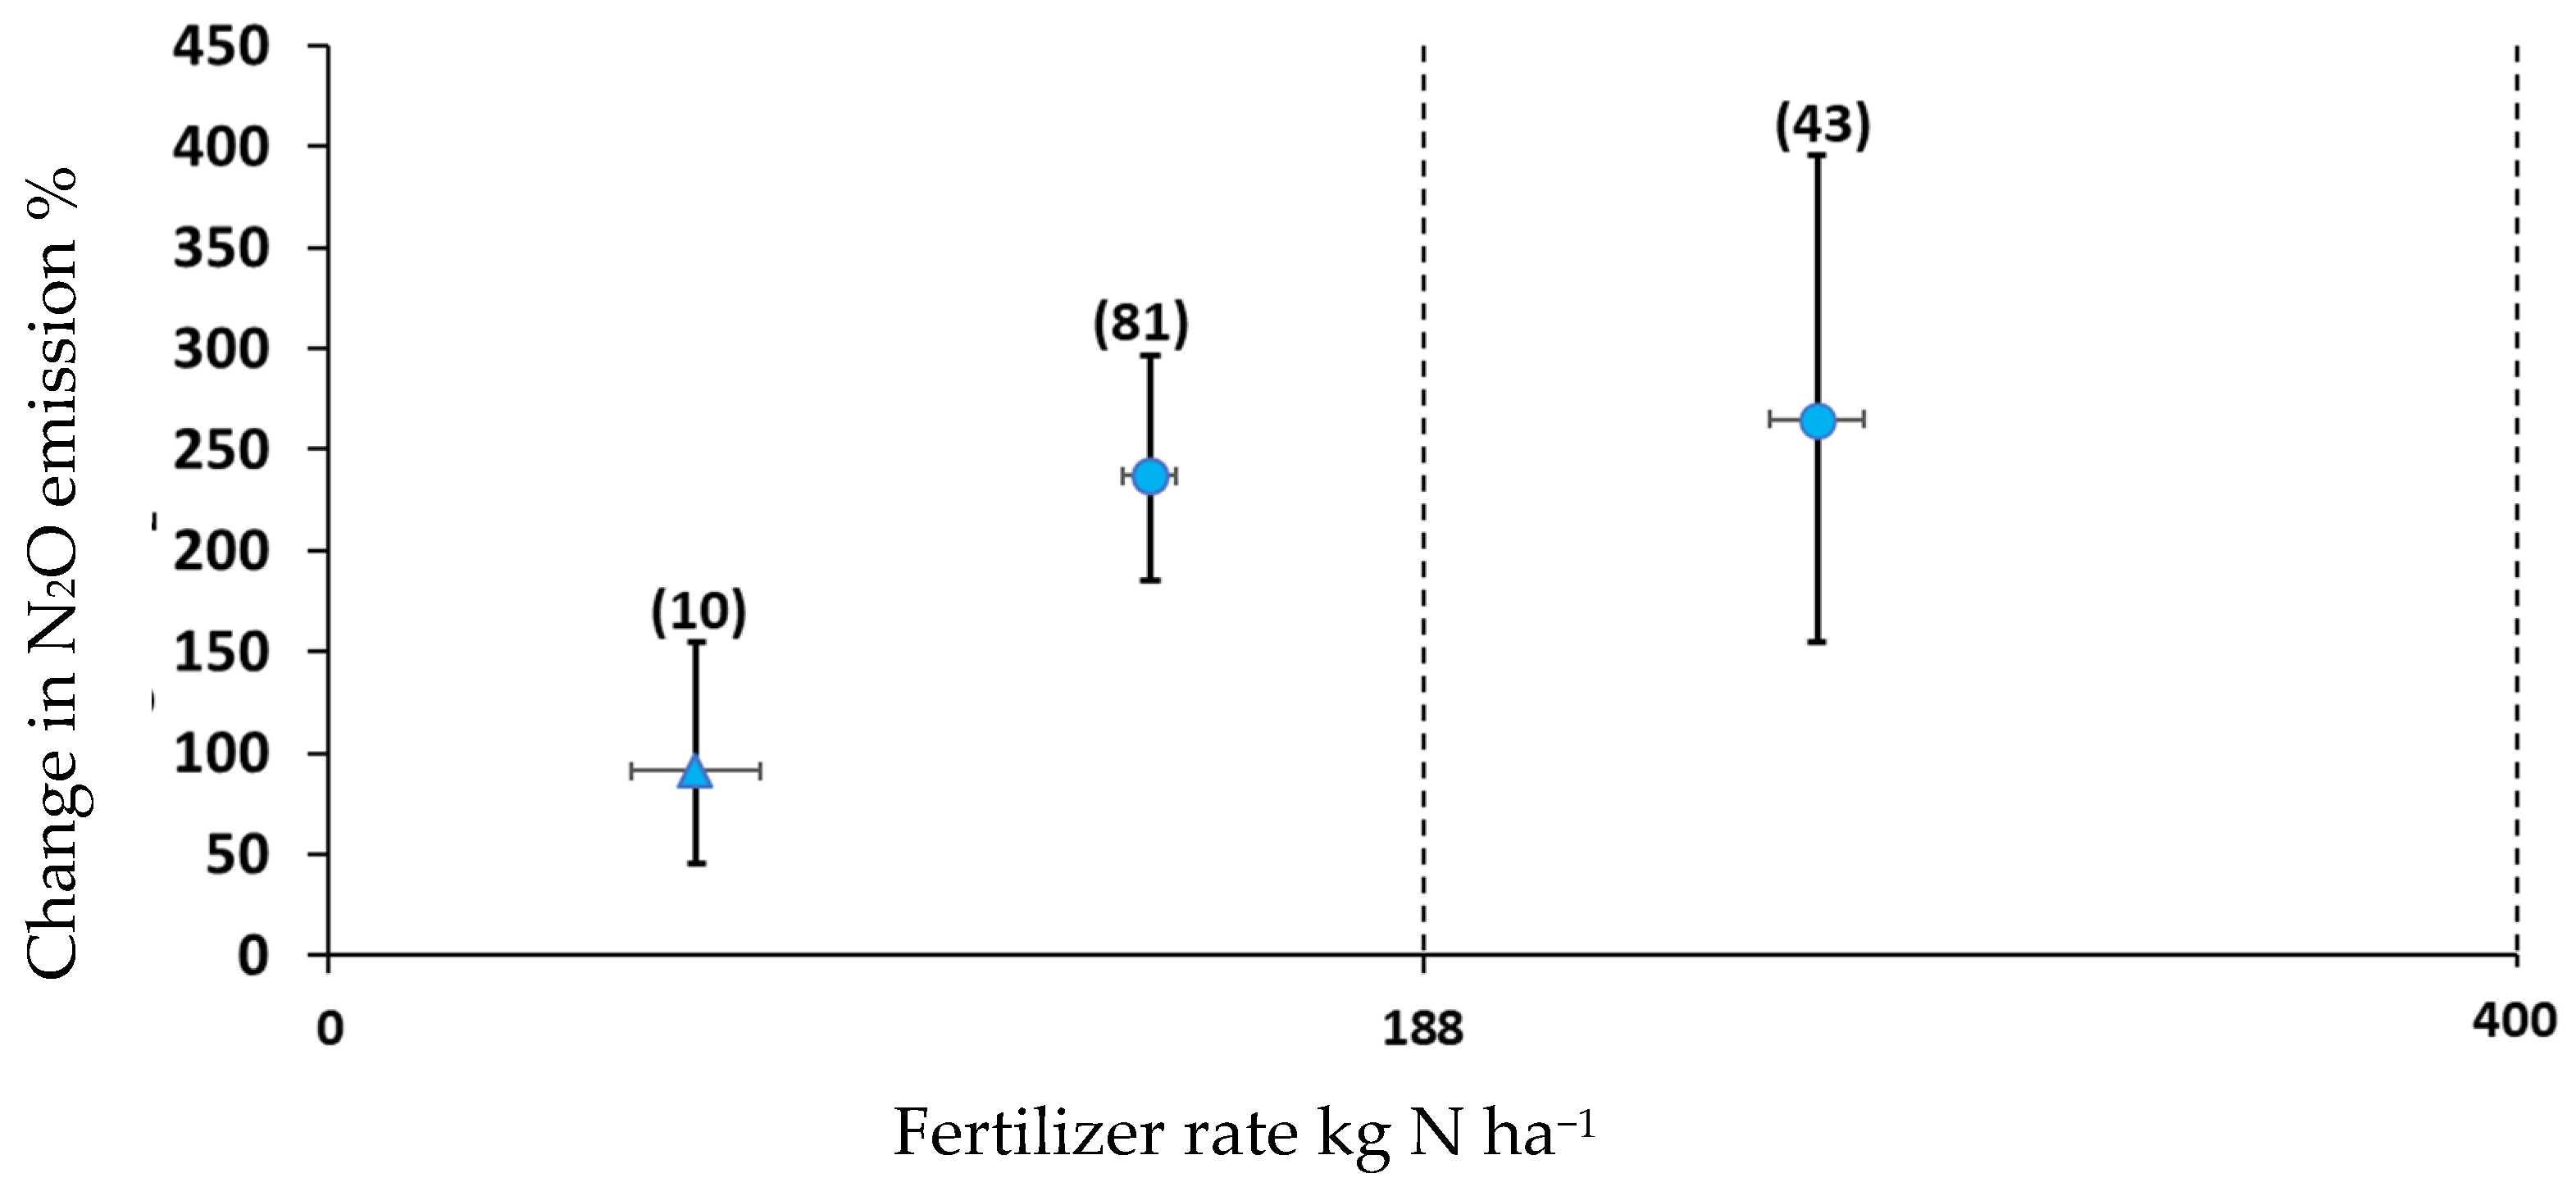
In corn plots, N fertilization sharply increased N2O emissions compared to non-fertilized plots (p < 0.0001). The relative increase in N2O emissions from corn fields (N rate < 188 and between 188 and 400 kg N ha−1 yr−1) were 237% and 265%, respectively (Figure 1), and these increases were not significantly different from each other (p = 0.59). A possible explanation is that the N2O production rate may decrease as fertilizer N input exceeds the microbial capacity to utilize it [29]. Further research would improve understanding of the complex interactions between N application rates, soil microbial activity, and N2O emissions in corn systems.
Table 1. Soil N2O emission for the corn and soybean seasons as affected by N fertilizer application rate. Different lowercase letters signify the N2O flux difference among the three fertilizer rates within each land use (corn/soybean). CI represents confidence intervals.
Land UseN RateMean N RateObs 1N2O Emissions95% CIp
kg N ha−1 kg N2O-N ha−1 Season−1
Corn 200.0470.91 a0.56 to 1.39<0.0001
<188142.61652.34 b1.82 to 2.93
188–400243.9952.45 b2.02 to 2.96
Soybean 300.0360.74 a0.41 to 1.300.028
<18855.8141.87 b1.41 to 2.65
1 Number of observations. 2 References: [30,31,32,33,34,35,36,37,38,39,40,41,42,43,44,45,46,47,48,49,50,51,52,53,54,55,56,57,58,59,60,61,62,63,64,65,66,67,68,69,70,71,72,73,74,75,76,77,78,79,80,81,82,83,84,85,86,87,88,89,90,91,92,93,94,95,96,97,98,99]. 3 References: [24,59,71,76,80,81,82,86,89,99,100,101,102,103,104,105,106,107,108,109].
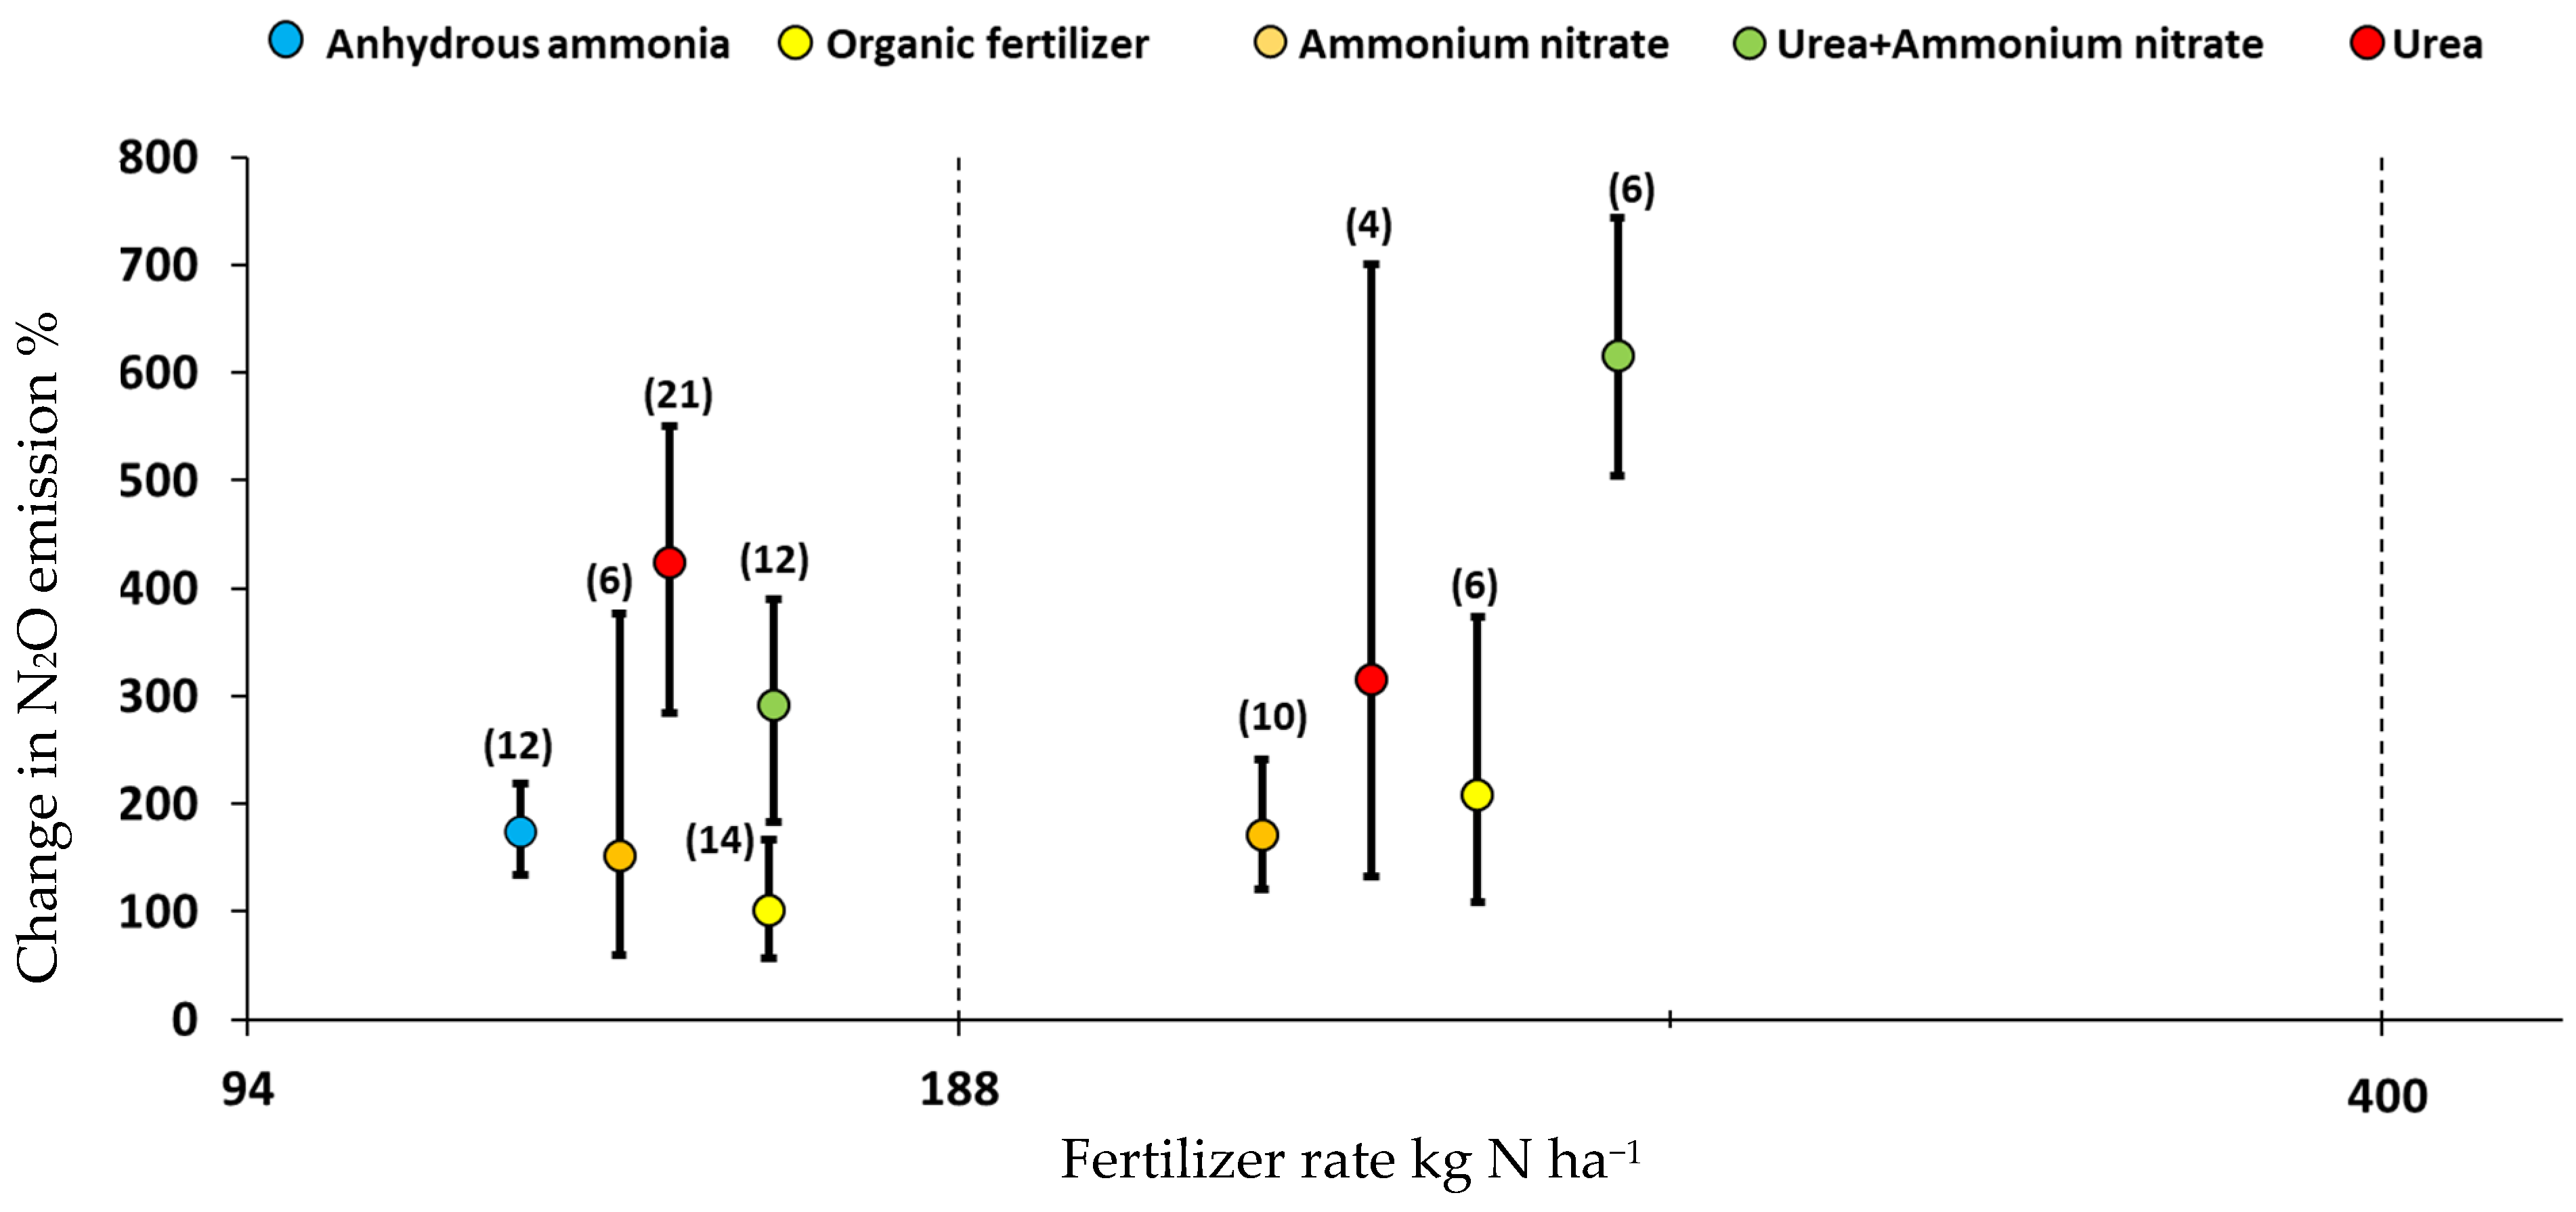
The effect of fertilizer type on N2O emissions varied with the N application rate. At lower N application rates (<188 kg ha−1), urea significantly increased N2O emissions, which were approximately two times higher than those from organic fertilizers and 1.5 times higher than those from anhydrous ammonia (Figure 2). The average seasonal N2O emission from organic fertilizers (dairy, poultry manure, and pig slurry) was notably lower at 0.69 kg N2O-N ha−1 (Table 2). This supports the notion that applying organic fertilizers can reduce N2O emissions by increasing the soil’s C:N ratio [110].
At higher N rates (188–400 kg ha−1), urea–ammonium nitrate application substantially increased N2O emissions, resulting in roughly a two-fold increase compared to both organic fertilizers and ammonium nitrate (Figure 2). This could be attributed to the excess inorganic N ions (NH4+ and NO3) provided by urea–ammonium nitrate relative to urea [111]. The simultaneous presence of NH4+ and NO3 can accelerate microbial transformation of nitrogen, especially under high-N conditions, leading to enhanced N2O production. In contrast, fertilizers supplying only a single inorganic N form, such as urea or ammonium nitrate alone, provide a more limited substrate pool, resulting in comparatively lower N2O emissions [111]. These results highlight the interactive effects of fertilizer type and application rate on N2O fluxes and underscore the importance of considering both chemical composition and N availability in managing greenhouse gas emissions from croplands. Although not statistically significant, the application of organic fertilizers and ammonium nitrate showed a slightly lower change in emissions compared to other inorganic fertilizers at this high N rate. This contrasts with previous reviews that found no significant difference between common inorganic fertilizers [112,113].
Table 2. Soil N2O emission (kg N2O-N ha−1 season−1) from corn fields as affected by fertilizer type under two fertilizer N rates of <188 and 188–400 kg ha−1. Data shows soil N2O flux. Lowercase letters signify the differences in each column. CI represents confidence intervals.
Land UseFertilizerObs 1<188 kg ha−195% CI188–400 kg ha−195% CI
<188188–400
CornOrganic fertilizer 21460.69 a0.45–0.961.12 a0.73–1.55
Urea 32141.65 b1.36–1.871.42 ab0.84–2.08
Urea + Ammonium nitrate 4661.18 ab0.82–1.551.96 b1.80–2.13
Ammonium nitrate 56101.3 ab0.84–1.631.0 a0.80–1.23
Anhydrous Ammonia 612-1.03 a0.84–1.16--
1 Number of observations for N rates < 188 and 188–400 kg ha−1, respectively. 2 Poultry and dairy manure, and pig slurry. References: [27,32,36,37,43,44,47,52,65,68,71,73,82,90,97,107]. 3 References: [30,34,36,63,69,76,77,78,85,91,92,93,95,97,114,115]. 4 References: [24,74,82,83,94,99]. 5 References: [45,62,65,68,71,73,88,90,116]. 6 References: [35,59,81,86,98].

3.2. Tillage

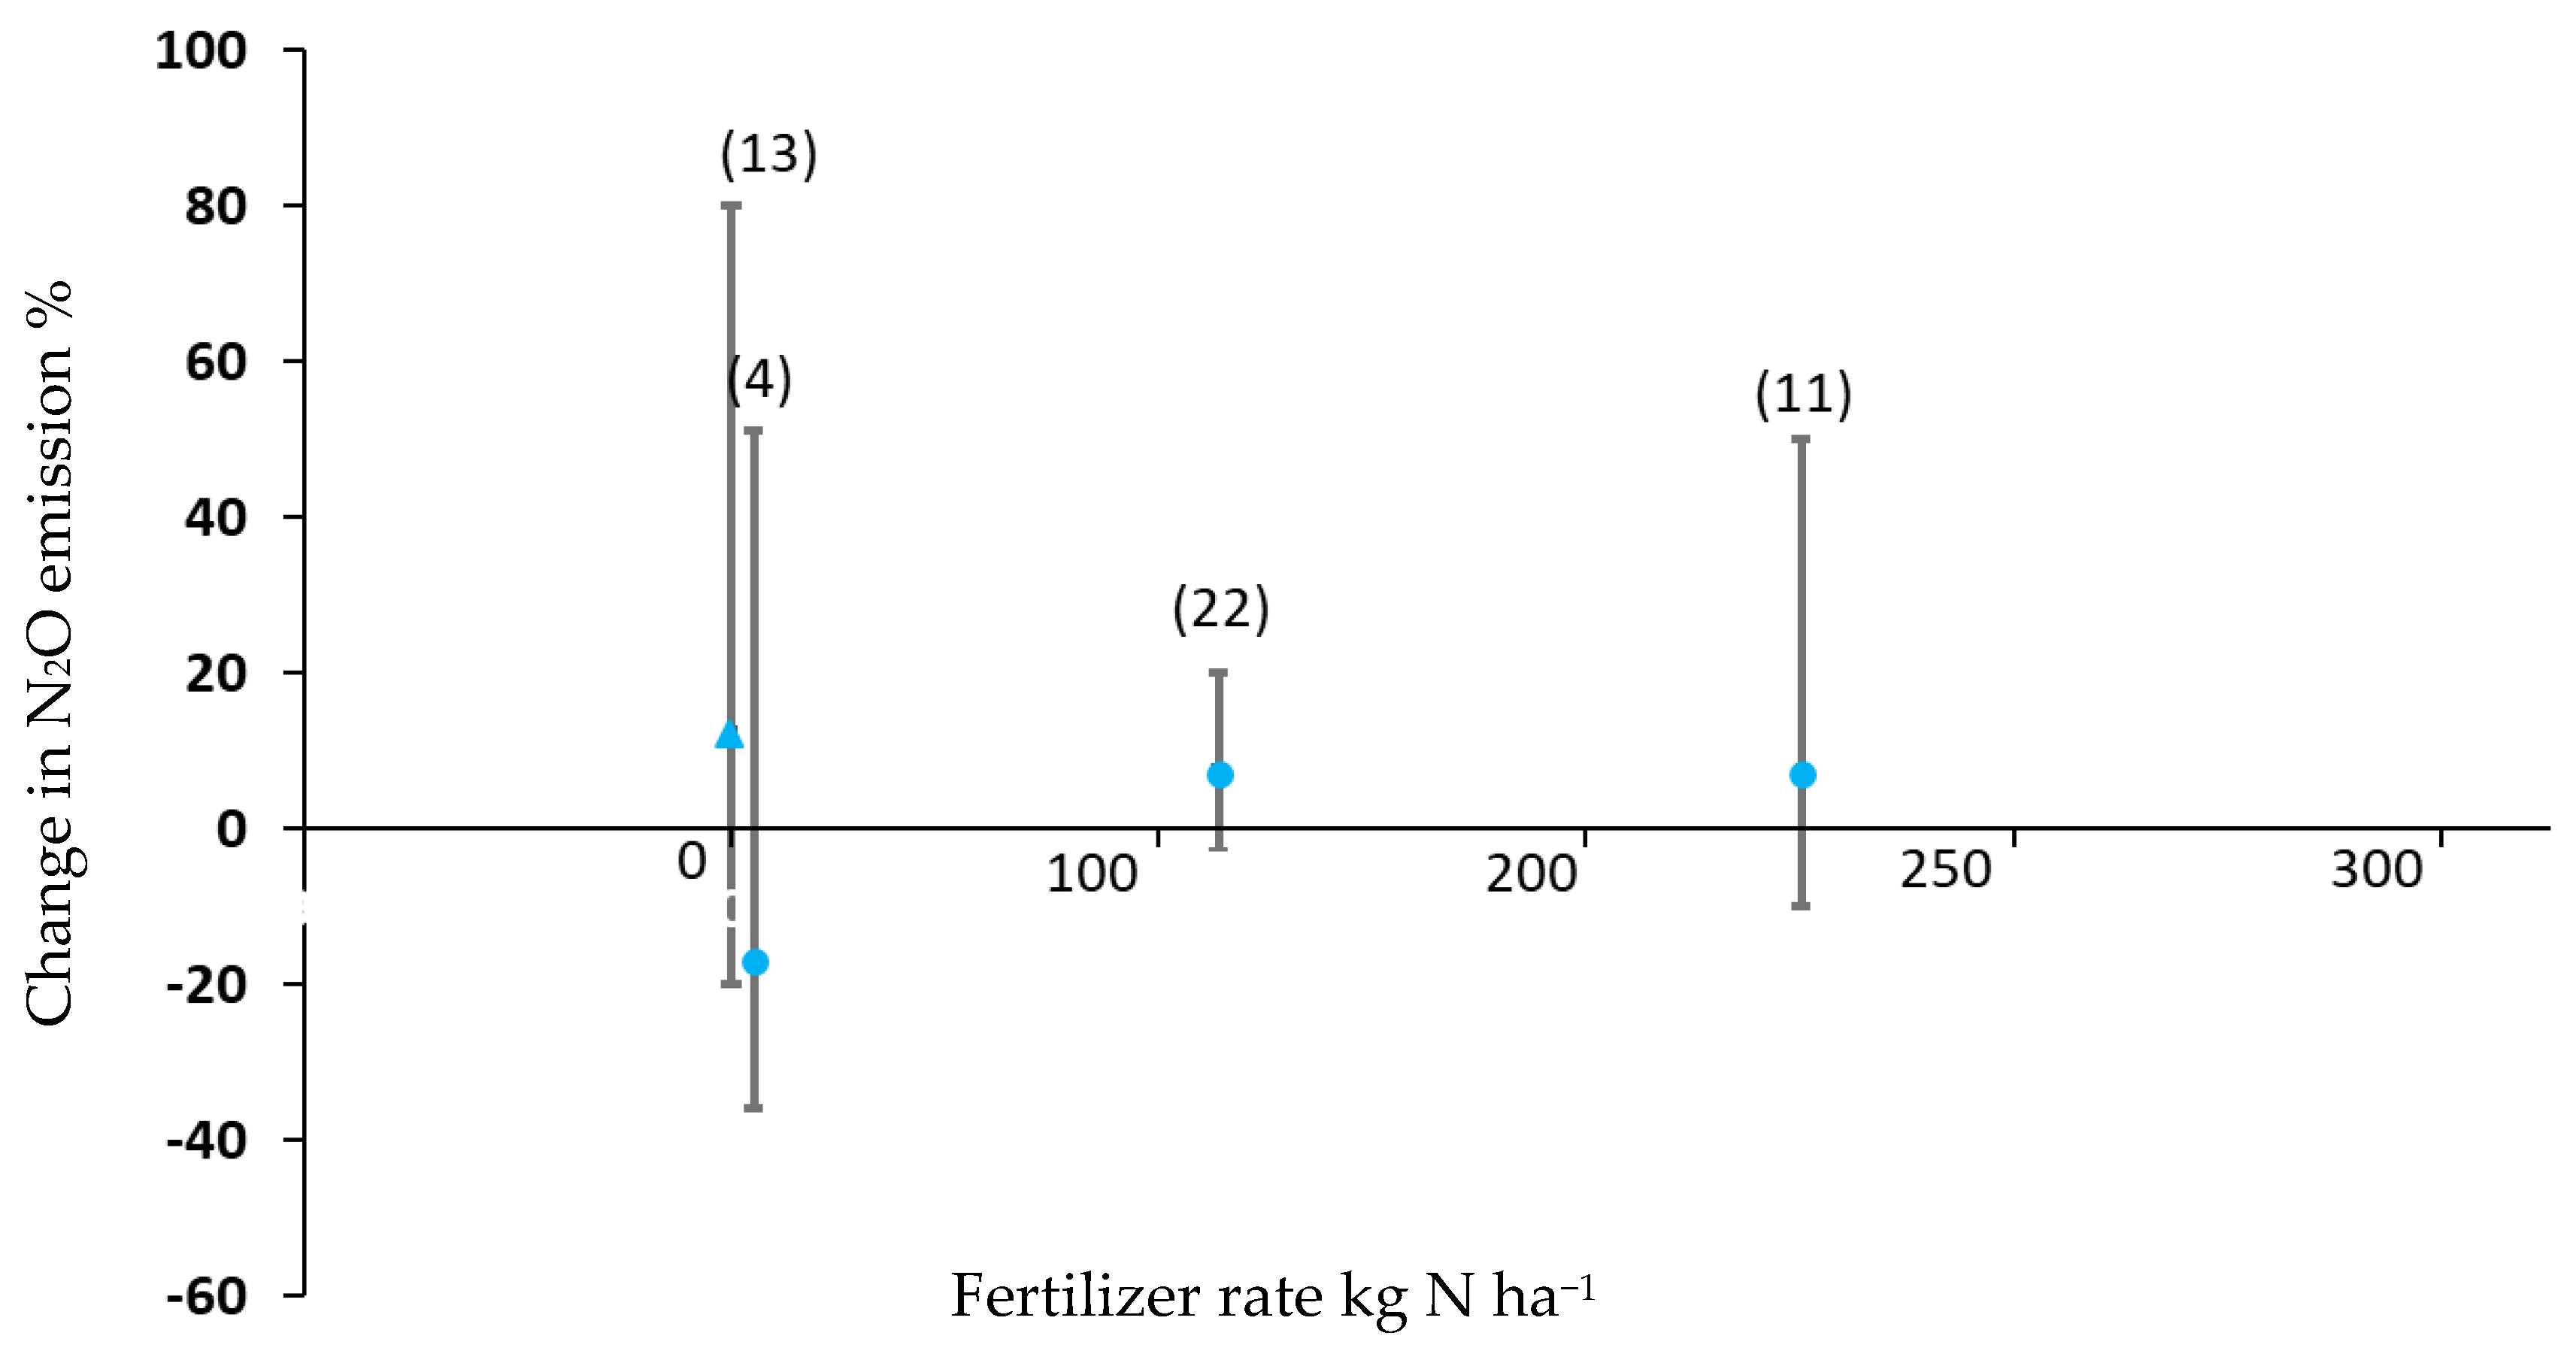
The N2O emission from soybean and corn (N rate < 188 and 188–400 kg h−1) fields increased by roughly 12% and 7%, respectively, from tilled management fields relative to no-till fields. Also, N2O emission from non-fertilized corn fields under tillage management practices decreased by 17% (Figure 3). While relative increases and decreases were noted, these differences were not statistically significant. The observed tendencies align with previous findings that tillage can enhance soil aeration and mineralization, thereby stimulating microbial activity and promoting N2O production in fertilized systems [84]. Conversely, in unfertilized fields, tillage may reduce N2O emissions by disrupting anaerobic microsites that favor denitrification [86]. However, the lack of significant differences in this study highlights the complexity of N2O dynamics, which are strongly influenced by interacting factors such as soil type, moisture, temperature, and crop-specific nitrogen demand. Mean N2O fluxes for tilled and no-till systems are provided in Table 3 to support these comparisons.

3.3. Soil Texture

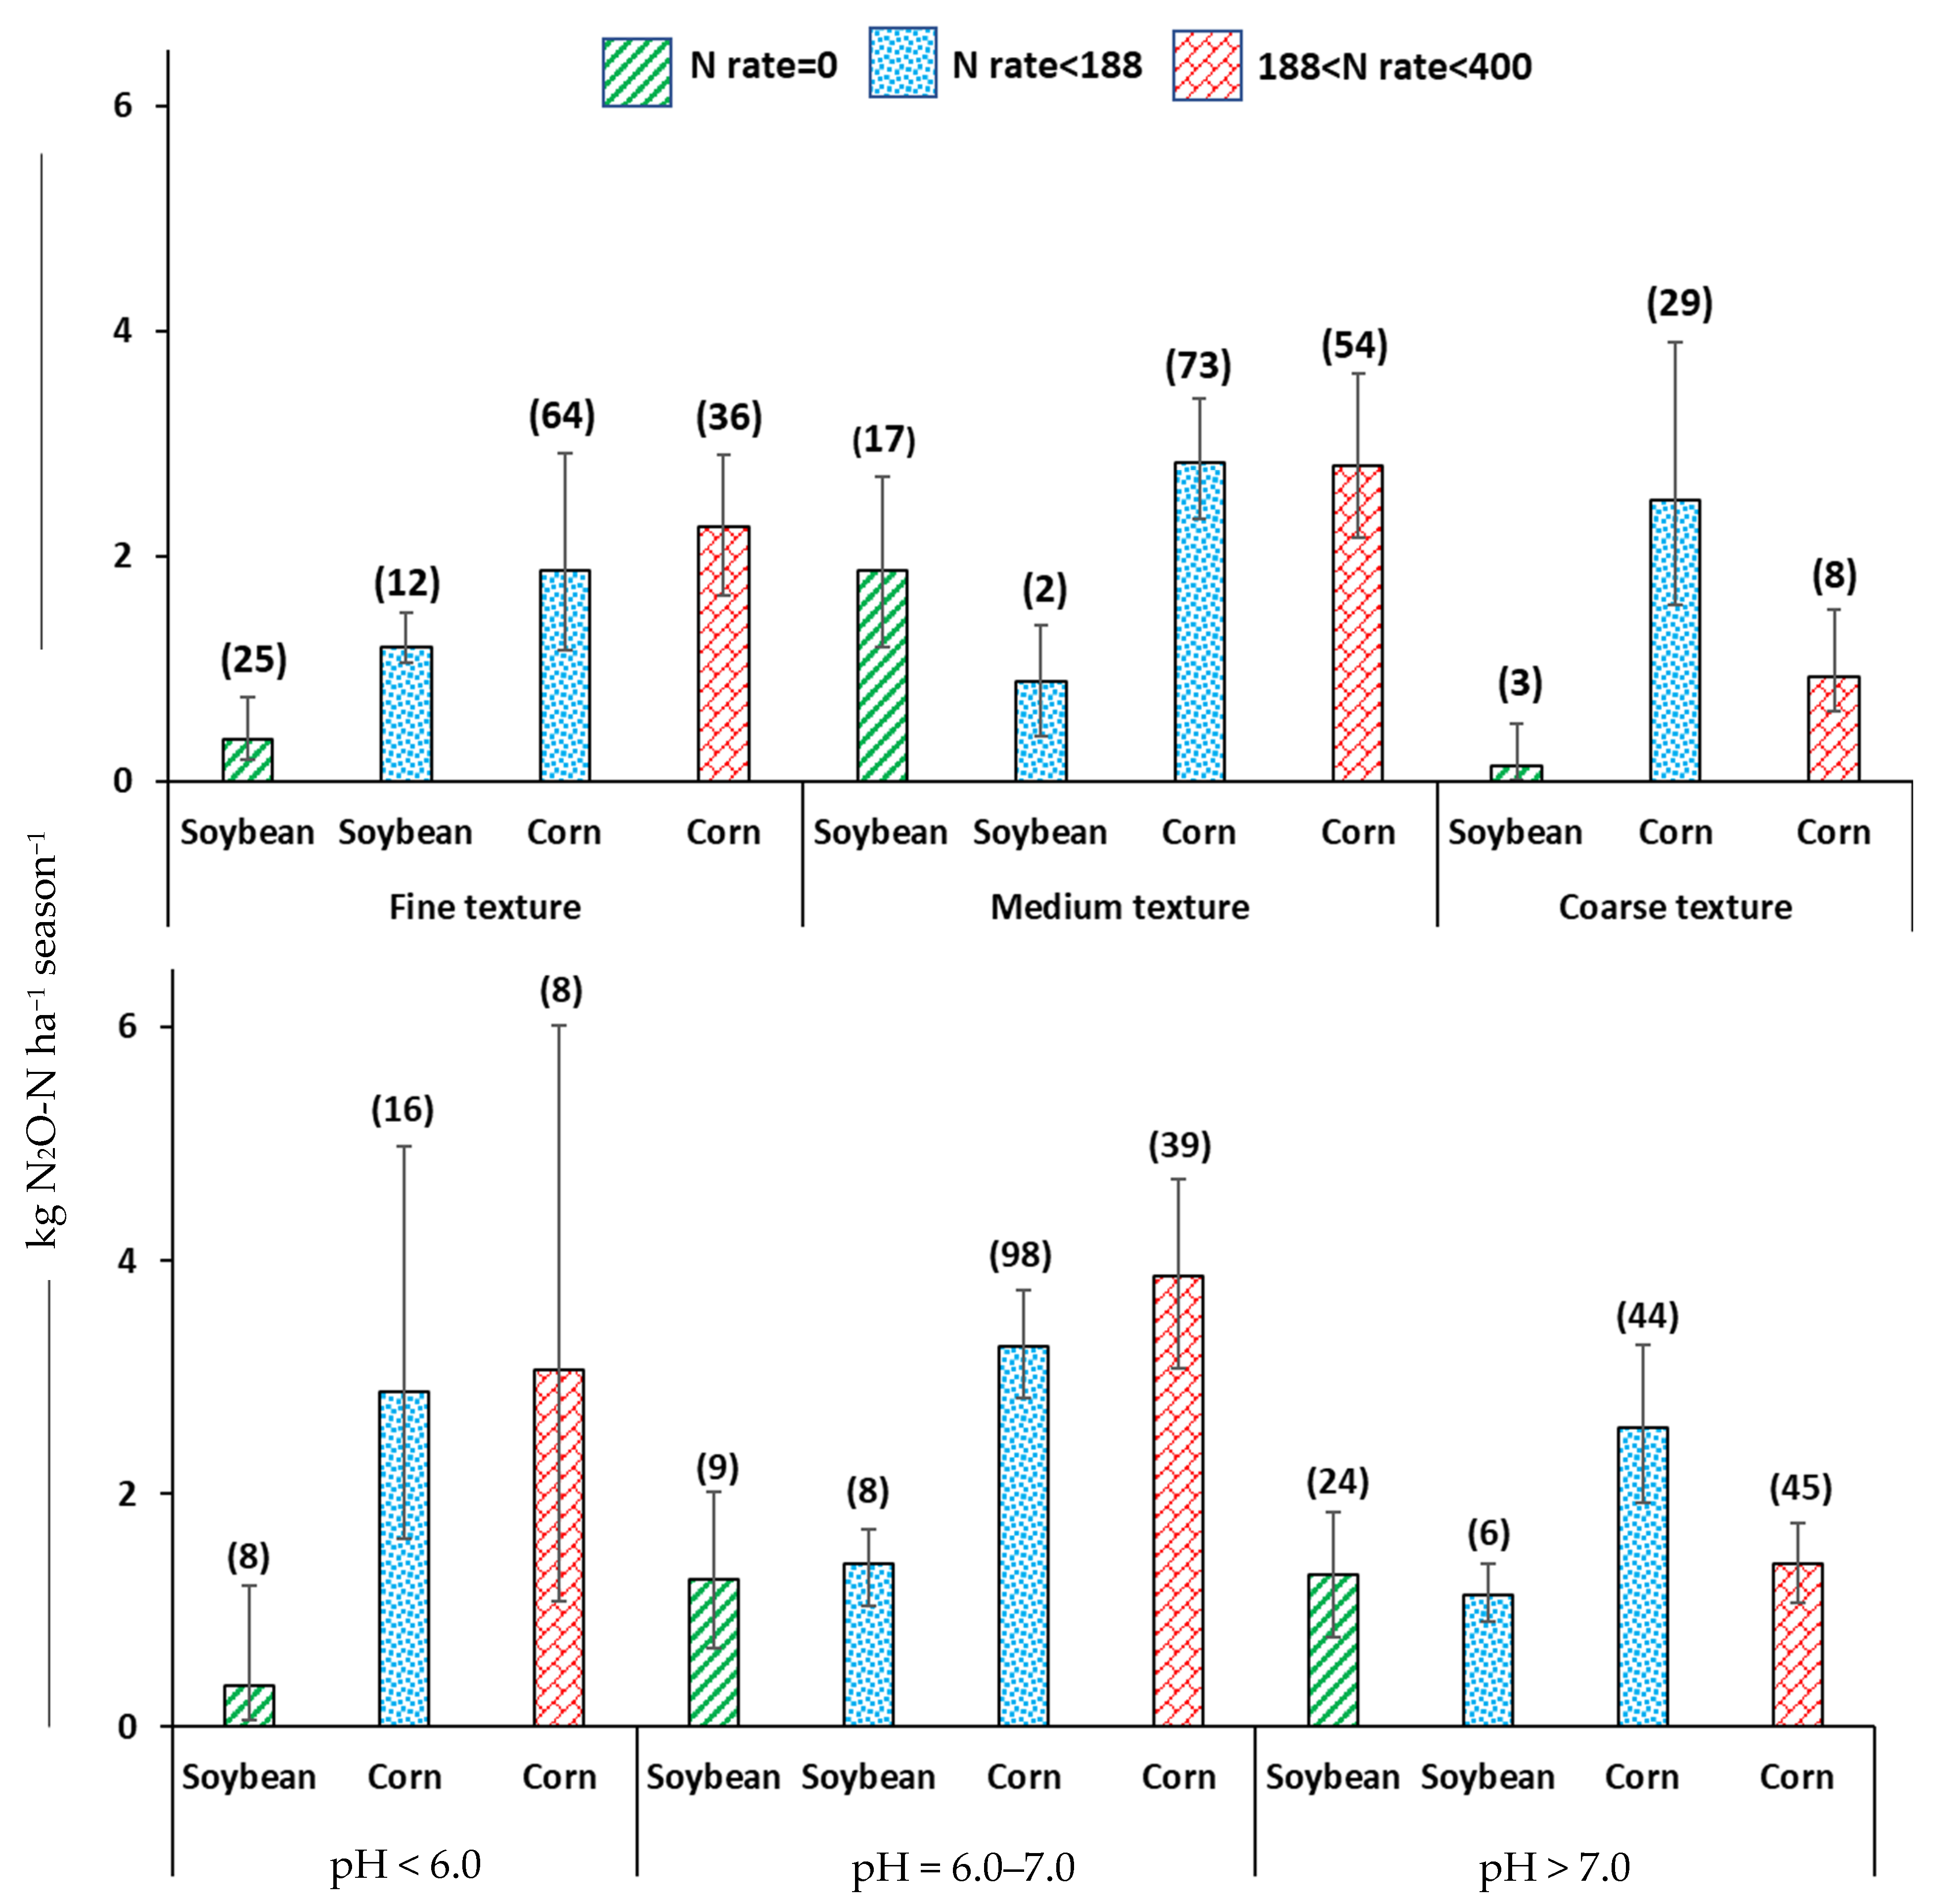
Nitrous oxide flux tended to be higher in medium-textured soils (loam/silt loam/silty) compared to coarse and fine-textured soils (Figure 4). A significant difference in N2O emissions was detected between fine/coarse and medium-textured soils in soybean fields. This may be because medium-textured soils have a higher gas diffusivity than fine-textured soils [117]. However, drawing definitive conclusions about coarse-textured soybean fields is challenging due to the limited number of studies.
In corn fields, at higher N rates (188–400 kg ha−1), both fine- and medium-textured soils exhibited substantially greater N2O emissions than coarse-textured soils (Figure 4). Soil texture directly influences aeration and oxygen diffusion, thereby affecting the processes that release N2O [118,119]. Both fine- and medium-textured soils have higher water-holding capacity and lower redox potential than coarse soils, which can promote incomplete denitrification and increase N2O production [43]. As a result, agricultural soils with higher clay content are more susceptible to N2O production and emission, particularly after fertilizer application [120]. In contrast, soils with greater porosity, like sandy soils, are more resistant to saturation and anaerobic denitrification due to their higher porosity and drainage capacity [121].
Our findings align with previous research. The average N2O flux from medium-textured corn fields (2.8 kg N2O-N ha−1) is consistent with the range of 2.3–6.5 kg N2O-N ha−1 reported by Gaillard et al. [122]. Similarly, the emissions from coarse-textured corn fields (2.5 kg N2O-N ha−1 at N rate < 188 kg ha−1; 0.9 kg N2O-N ha−1 at N rate 188–400 kg ha−1) fall within the spectrum of 0.5–3.0 kg N2O-N ha−1 for the fertilizer rates < 188 kg ha−1 [123]. Finally, the N2O flux range for fine-textured corn soils (1.9–2.3 kg N2O-N ha−1) is consistent with the 1.09–2.4 kg N2O-N ha−1 reported by Hargreaves et al. [120].
Figure 4. Soil N2O emissions from corn and soybean fields as affected by soil pH [24,30,31,32,33,34,35,36,37,38,39,40,41,42,43,44,45,46,47,48,49,51,52,53,54,55,56,57,59,61,62,63,64,65,66,68,69,70,71,72,73,74,75,76,77,78,80,81,82,84,85,86,87,88,89,90,91,92,93,95,96,97,98,100,101,102,103,104,105,106,107,108,115] and texture [27,30,31,32,33,34,35,36,37,38,39,40,41,42,43,44,46,47,48,49,50,51,52,53,54,55,56,57,58,59,60,61,62,63,64,65,66,67,68,69,70,71,72,73,74,75,76,77,78,79,80,81,82,83,84,85,86,87,88,89,90,91,92,93,94,95,96,97,98,99,102,104,107,108,109,114,116,124]. N rates are kg N ha−1. Values in parentheses are the number of observations. Error bars represent 95% confidence intervals. Mean fluxes for categories of studies (the categories based on soil pH or texture of each crop type) were considered significantly different if their 95% confidence intervals (CI) did not overlap.
Agronomy 15 02358 g004

3.4. Soil pH

Soil pH did not significantly influence N2O emissions during the soybean growing season (Figure 4). However, in corn fields with high fertilizer application rates (188–400 kg N ha−1), N2O emissions were significantly different between soils with a pH of 6–7 and those with a pH > 7 (p < 0.05). This finding is consistent with the established understanding that soil pH is a critical factor for nitrification and denitrification [125], with lower pH values often promoting N2O emissions [11].
The enhanced N2O production observed at lower pH levels is likely due to the acidifying effects of nitrogen fertilizers. Research by Moore et al. [7] found that N fertilizer application to row crop soil with a pH of 5.0–6.0 resulted in higher N2O emissions compared to unfertilized soil with a pH of 6.0–7.0 under the same water management conditions. Similarly, Ansari et al. [8] reported greater N2O flux from fertilized corn–soybean systems with a soil pH of 6–7 compared to unfertilized fields with a pH > 7. A negative exponential relationship between soil pH and N2O emissions has also been reported [69].
The mechanism behind this relationship is that lower soil pH (pH < 7) enhances the activity of nitrifiers and denitrifiers while simultaneously limiting the activity of N2O reductase, which converts N2O to harmless dinitrogen gas (N2). This imbalance leads to a greater release of N2O from the soil. Conversely, at higher pH levels (pH > 7), the activity of N2O reductase increases, which reduces N2O emissions [17,126].

3.5. Precipitation and Temperature

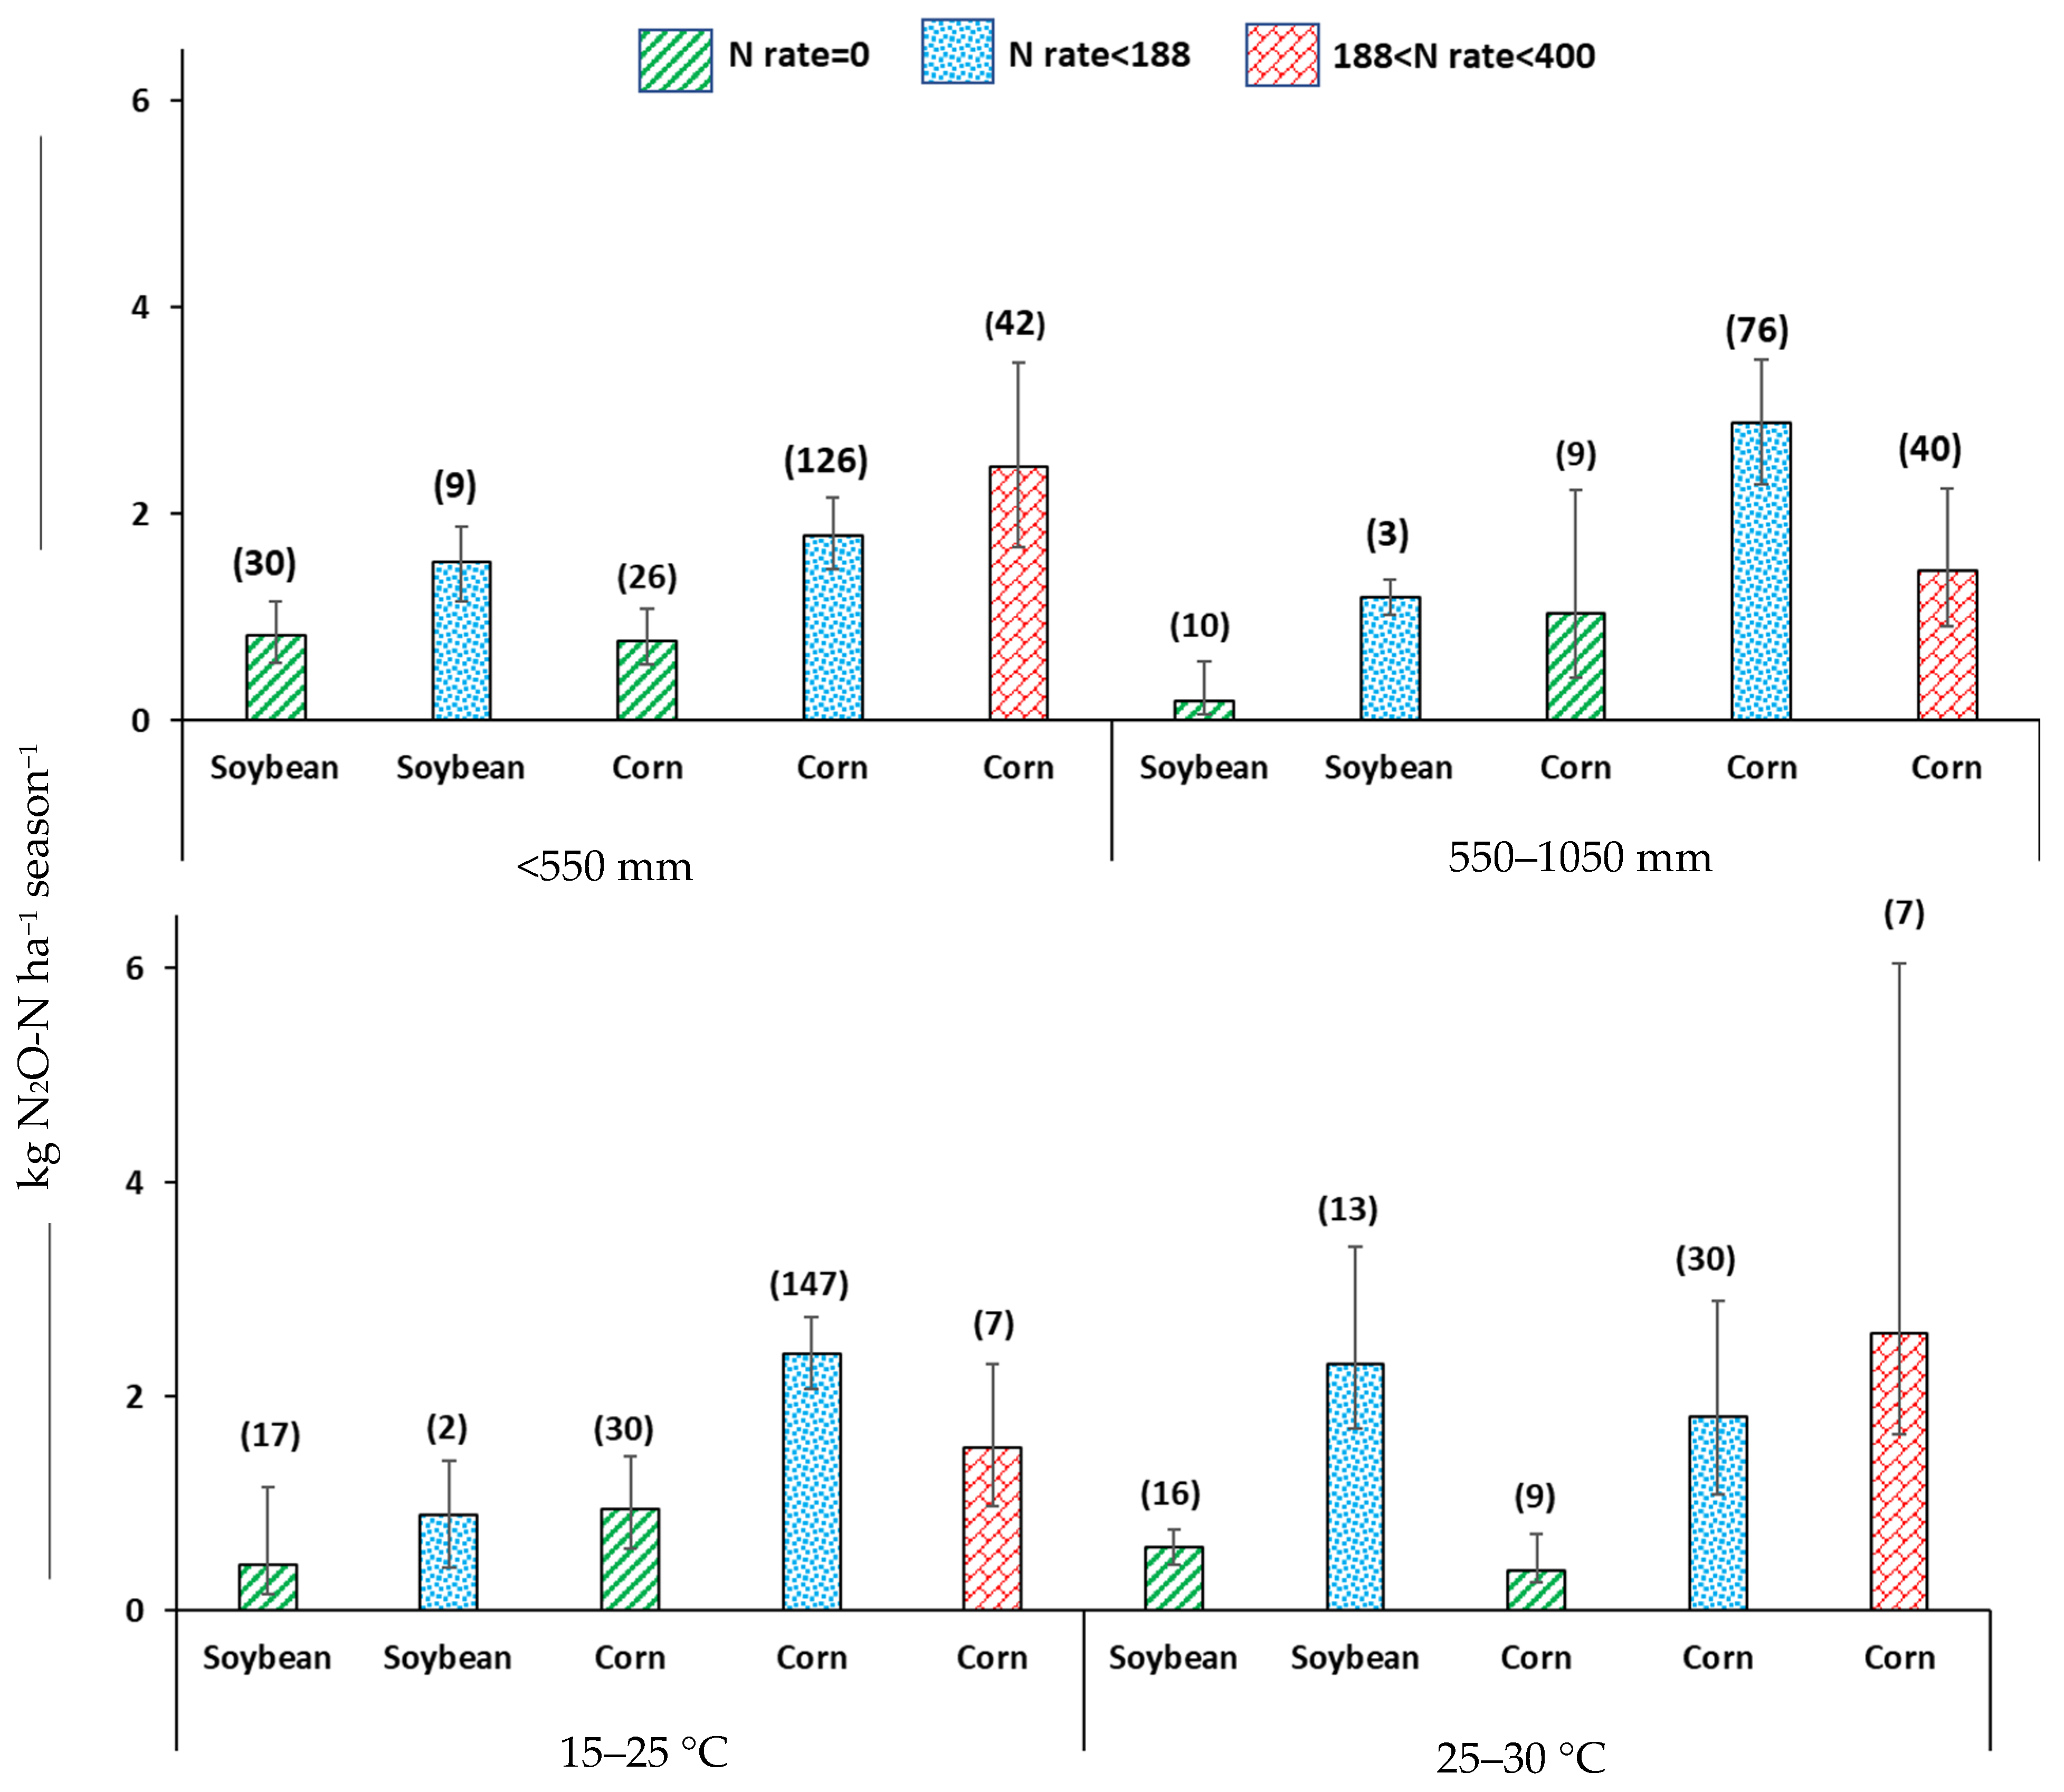
Increased precipitation and temperature did not significantly affect N2O emissions from corn and soybean fields across all nitrogen fertilizer levels (no fertilizer, low N, and high N), with the exception of soybean systems (Figure 5). This suggests that the relationship between these climatic variables and N2O emissions is complex and highly dependent on the interactions with other soil physicochemical properties, such as porosity and bulk density [127]. While heavy rainfall can create anaerobic conditions that enhance denitrification and N2O emissions, it can also lead to the leaching of inorganic N (NO3 and NH4+), thereby reducing the available substrate for N2O production [128].
In our study, N2O emissions from non-fertilized soybean fields were lower under high rainfall (550–1050 mm) compared to low rainfall (0–550 mm), indicating a potential dominance of N leaching in these systems. In contrast, fertilized corn fields showed significantly higher N2O emissions than controls, particularly under low precipitation (0–550 mm) and across various temperature ranges (15–25 °C and 25–30 °C) (Figure 5). This is consistent with a meta-analysis by Rashti et al. [129], which found that water-filled pore space and air temperature were responsible for 67% of the N2O emissions in fields receiving high N fertilizer rates (≥250 kg ha−1). Our use of cumulative seasonal data may have obscured short-term, event-based responses, such as those caused by extreme weather.

3.6. Environmental Factors vs. Agronomic Activities

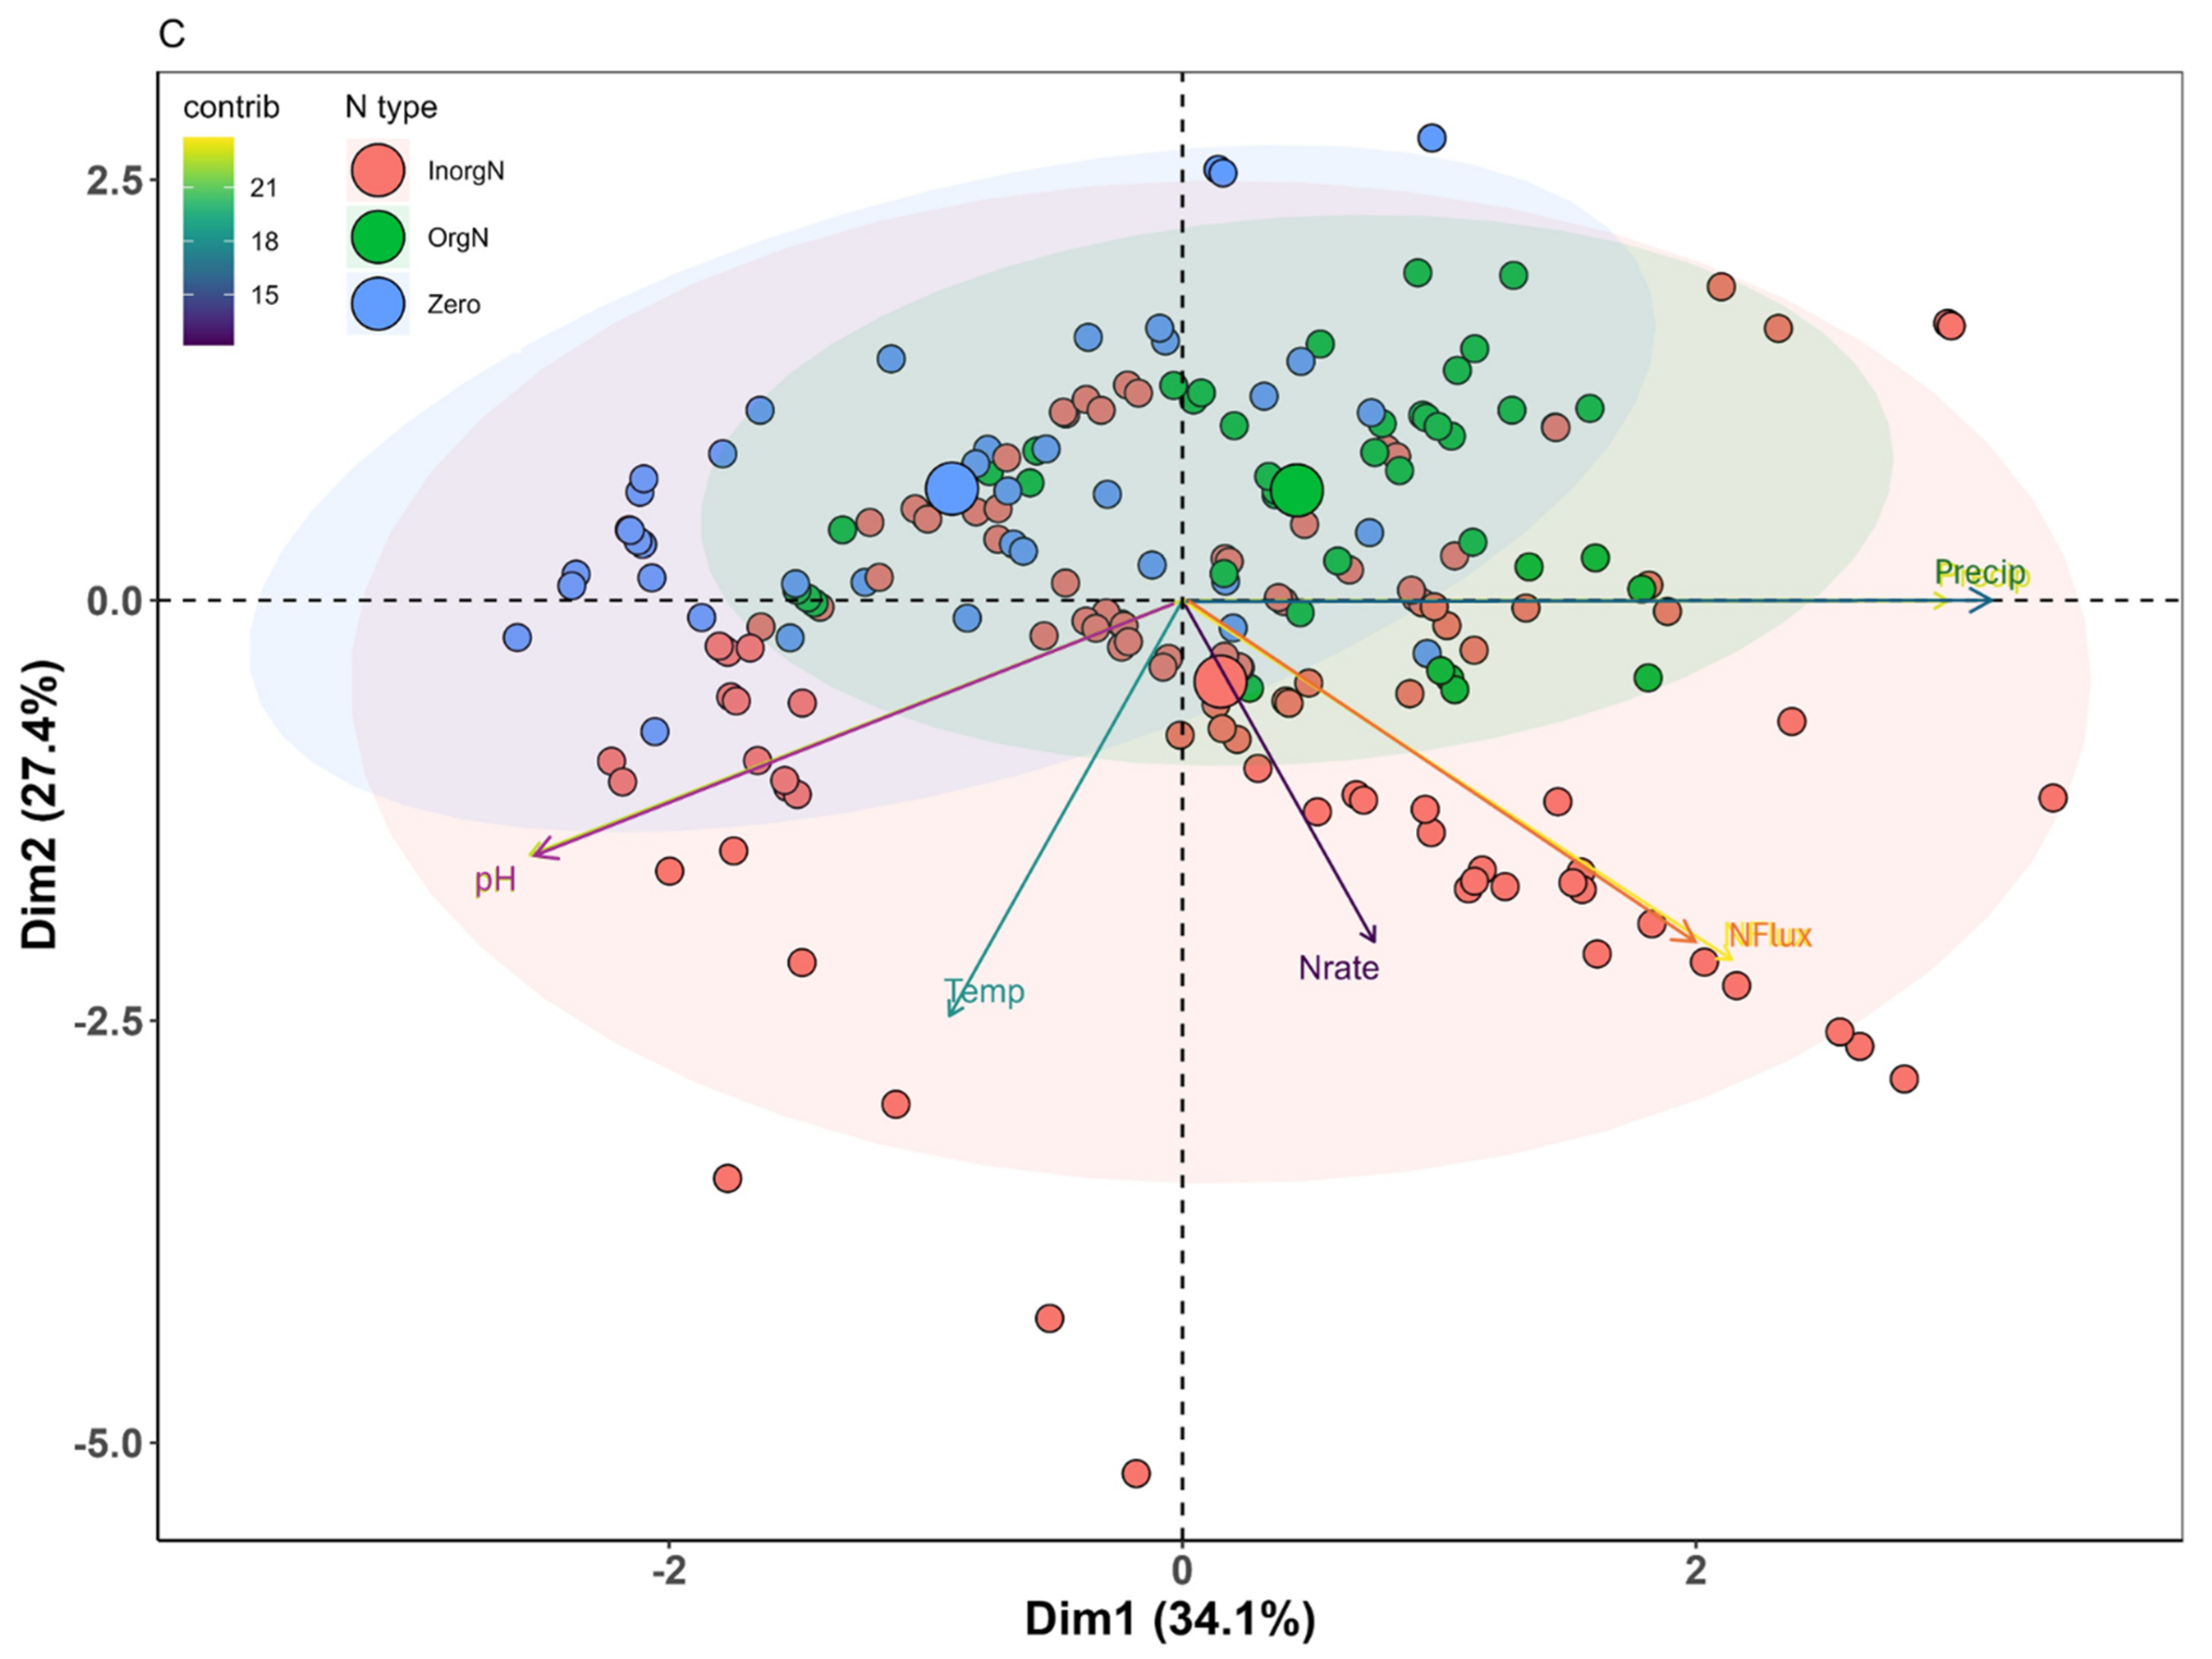
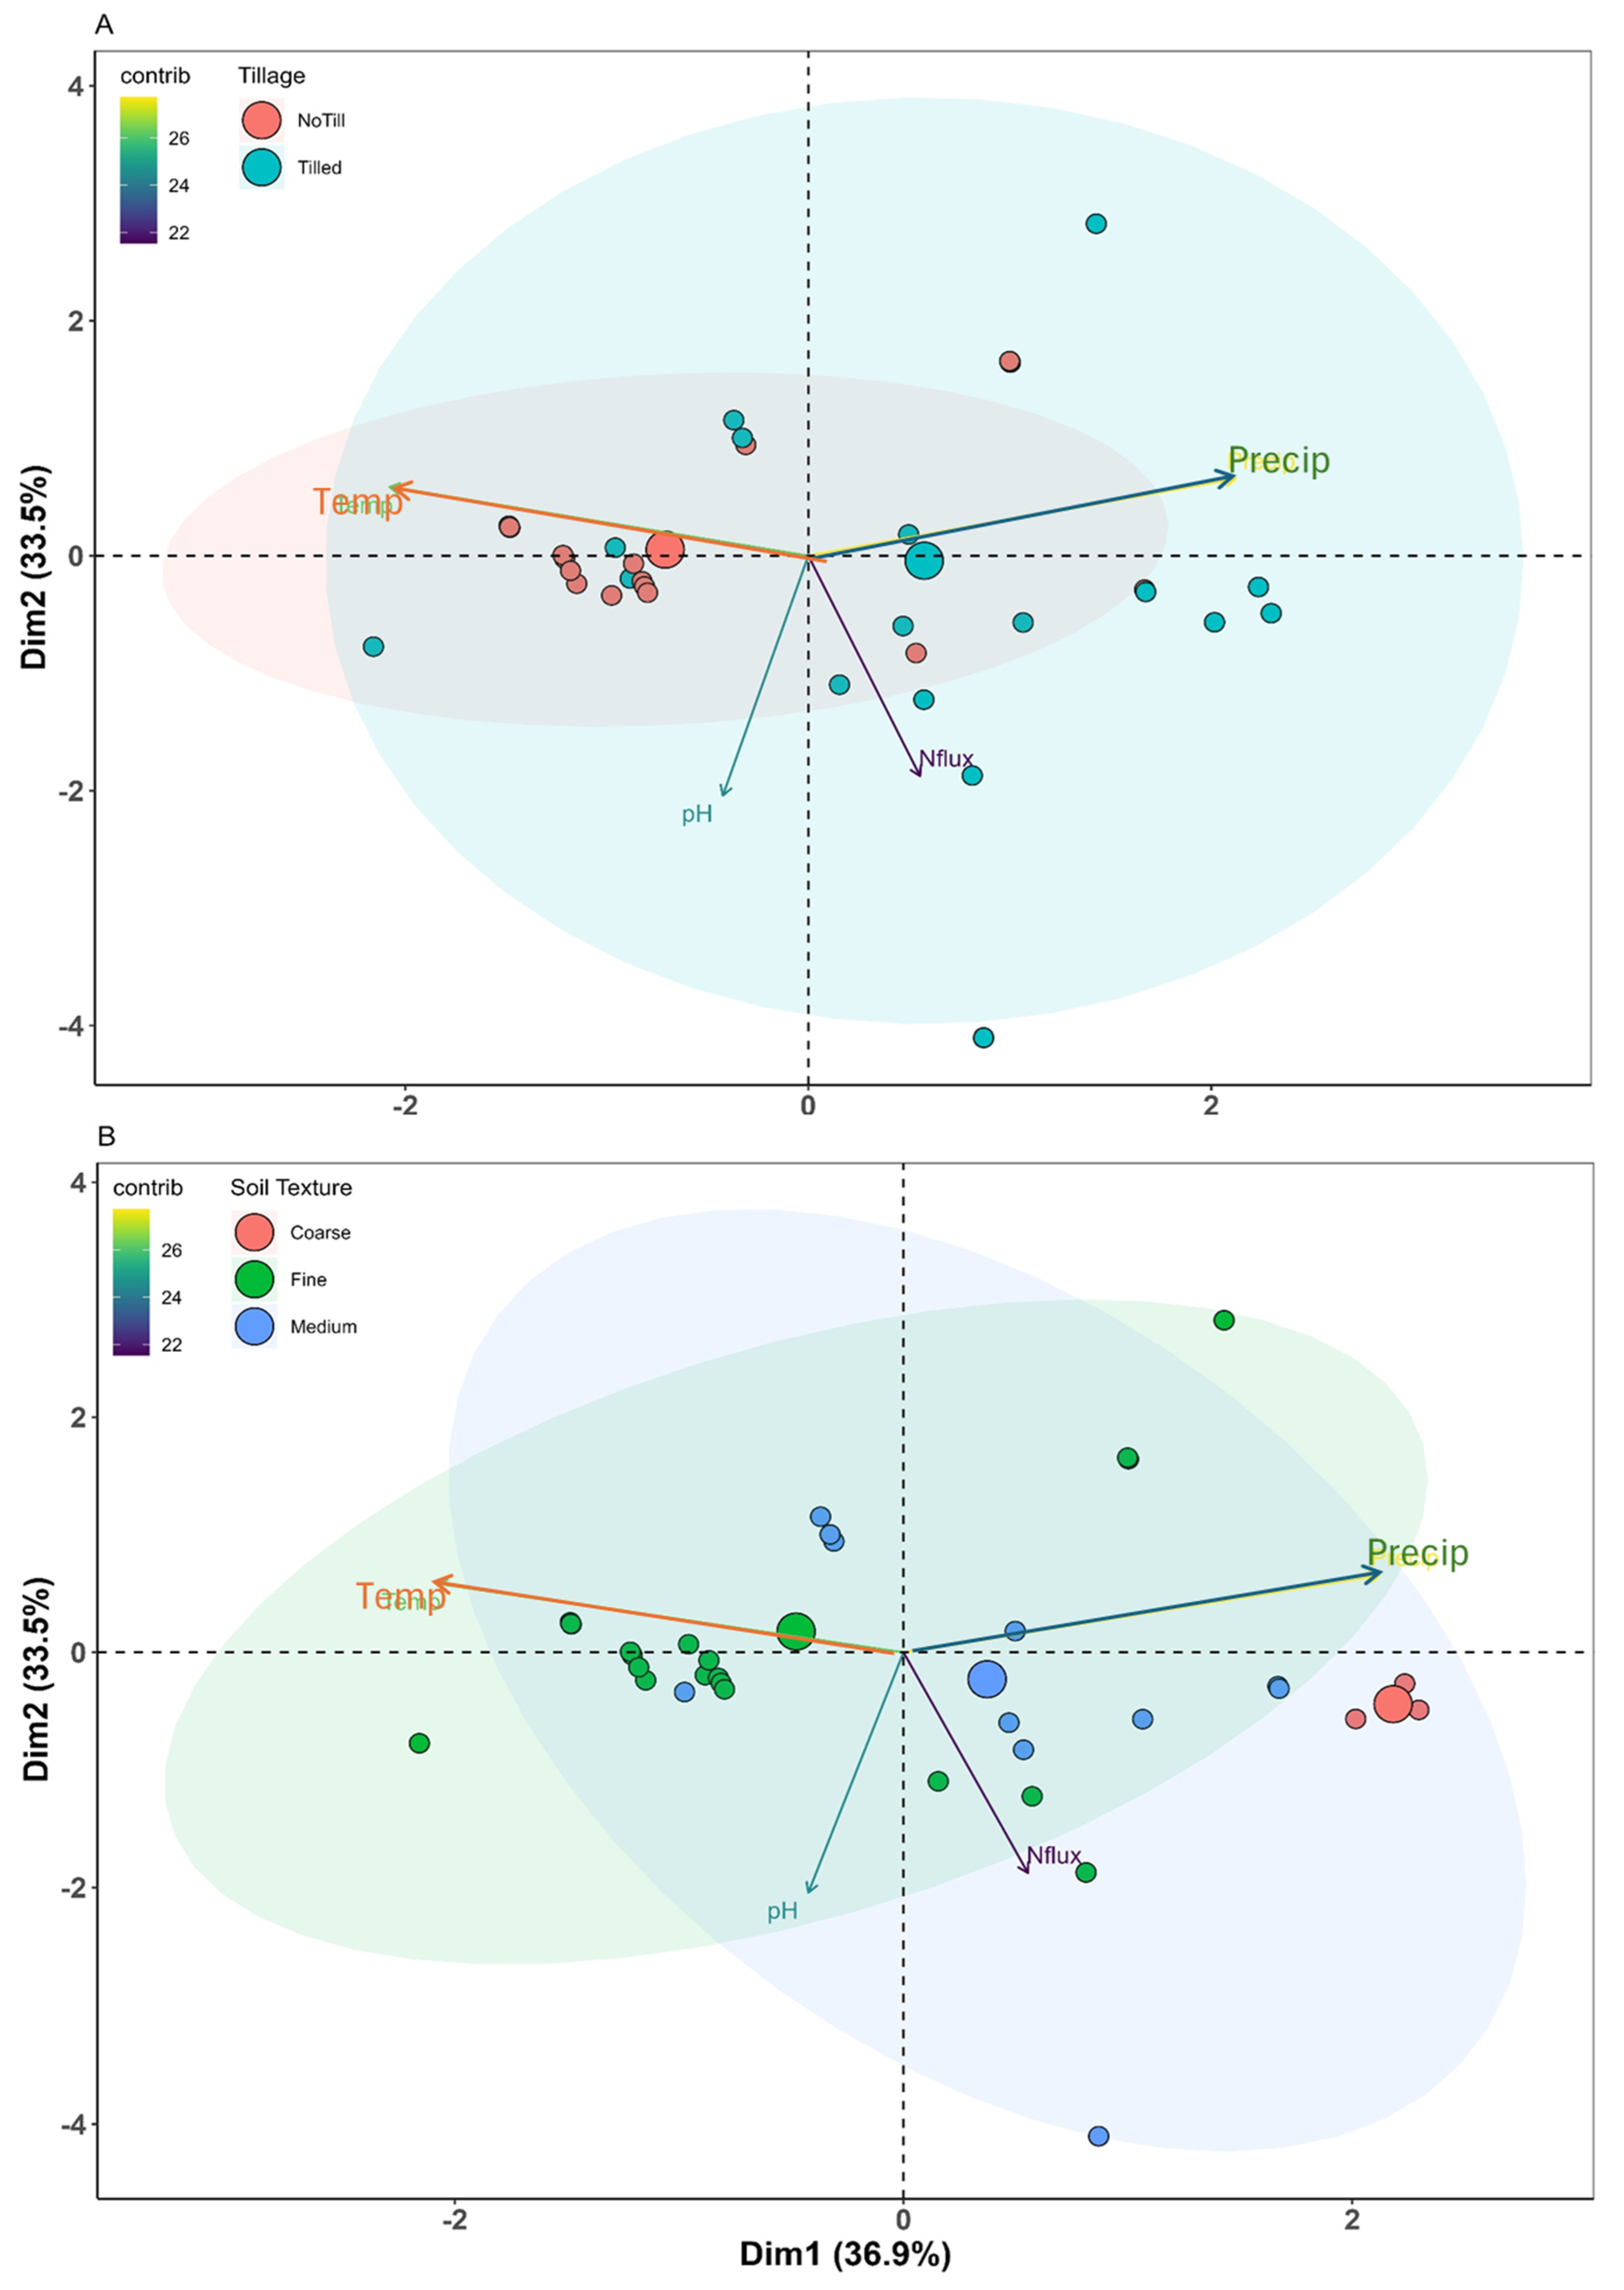
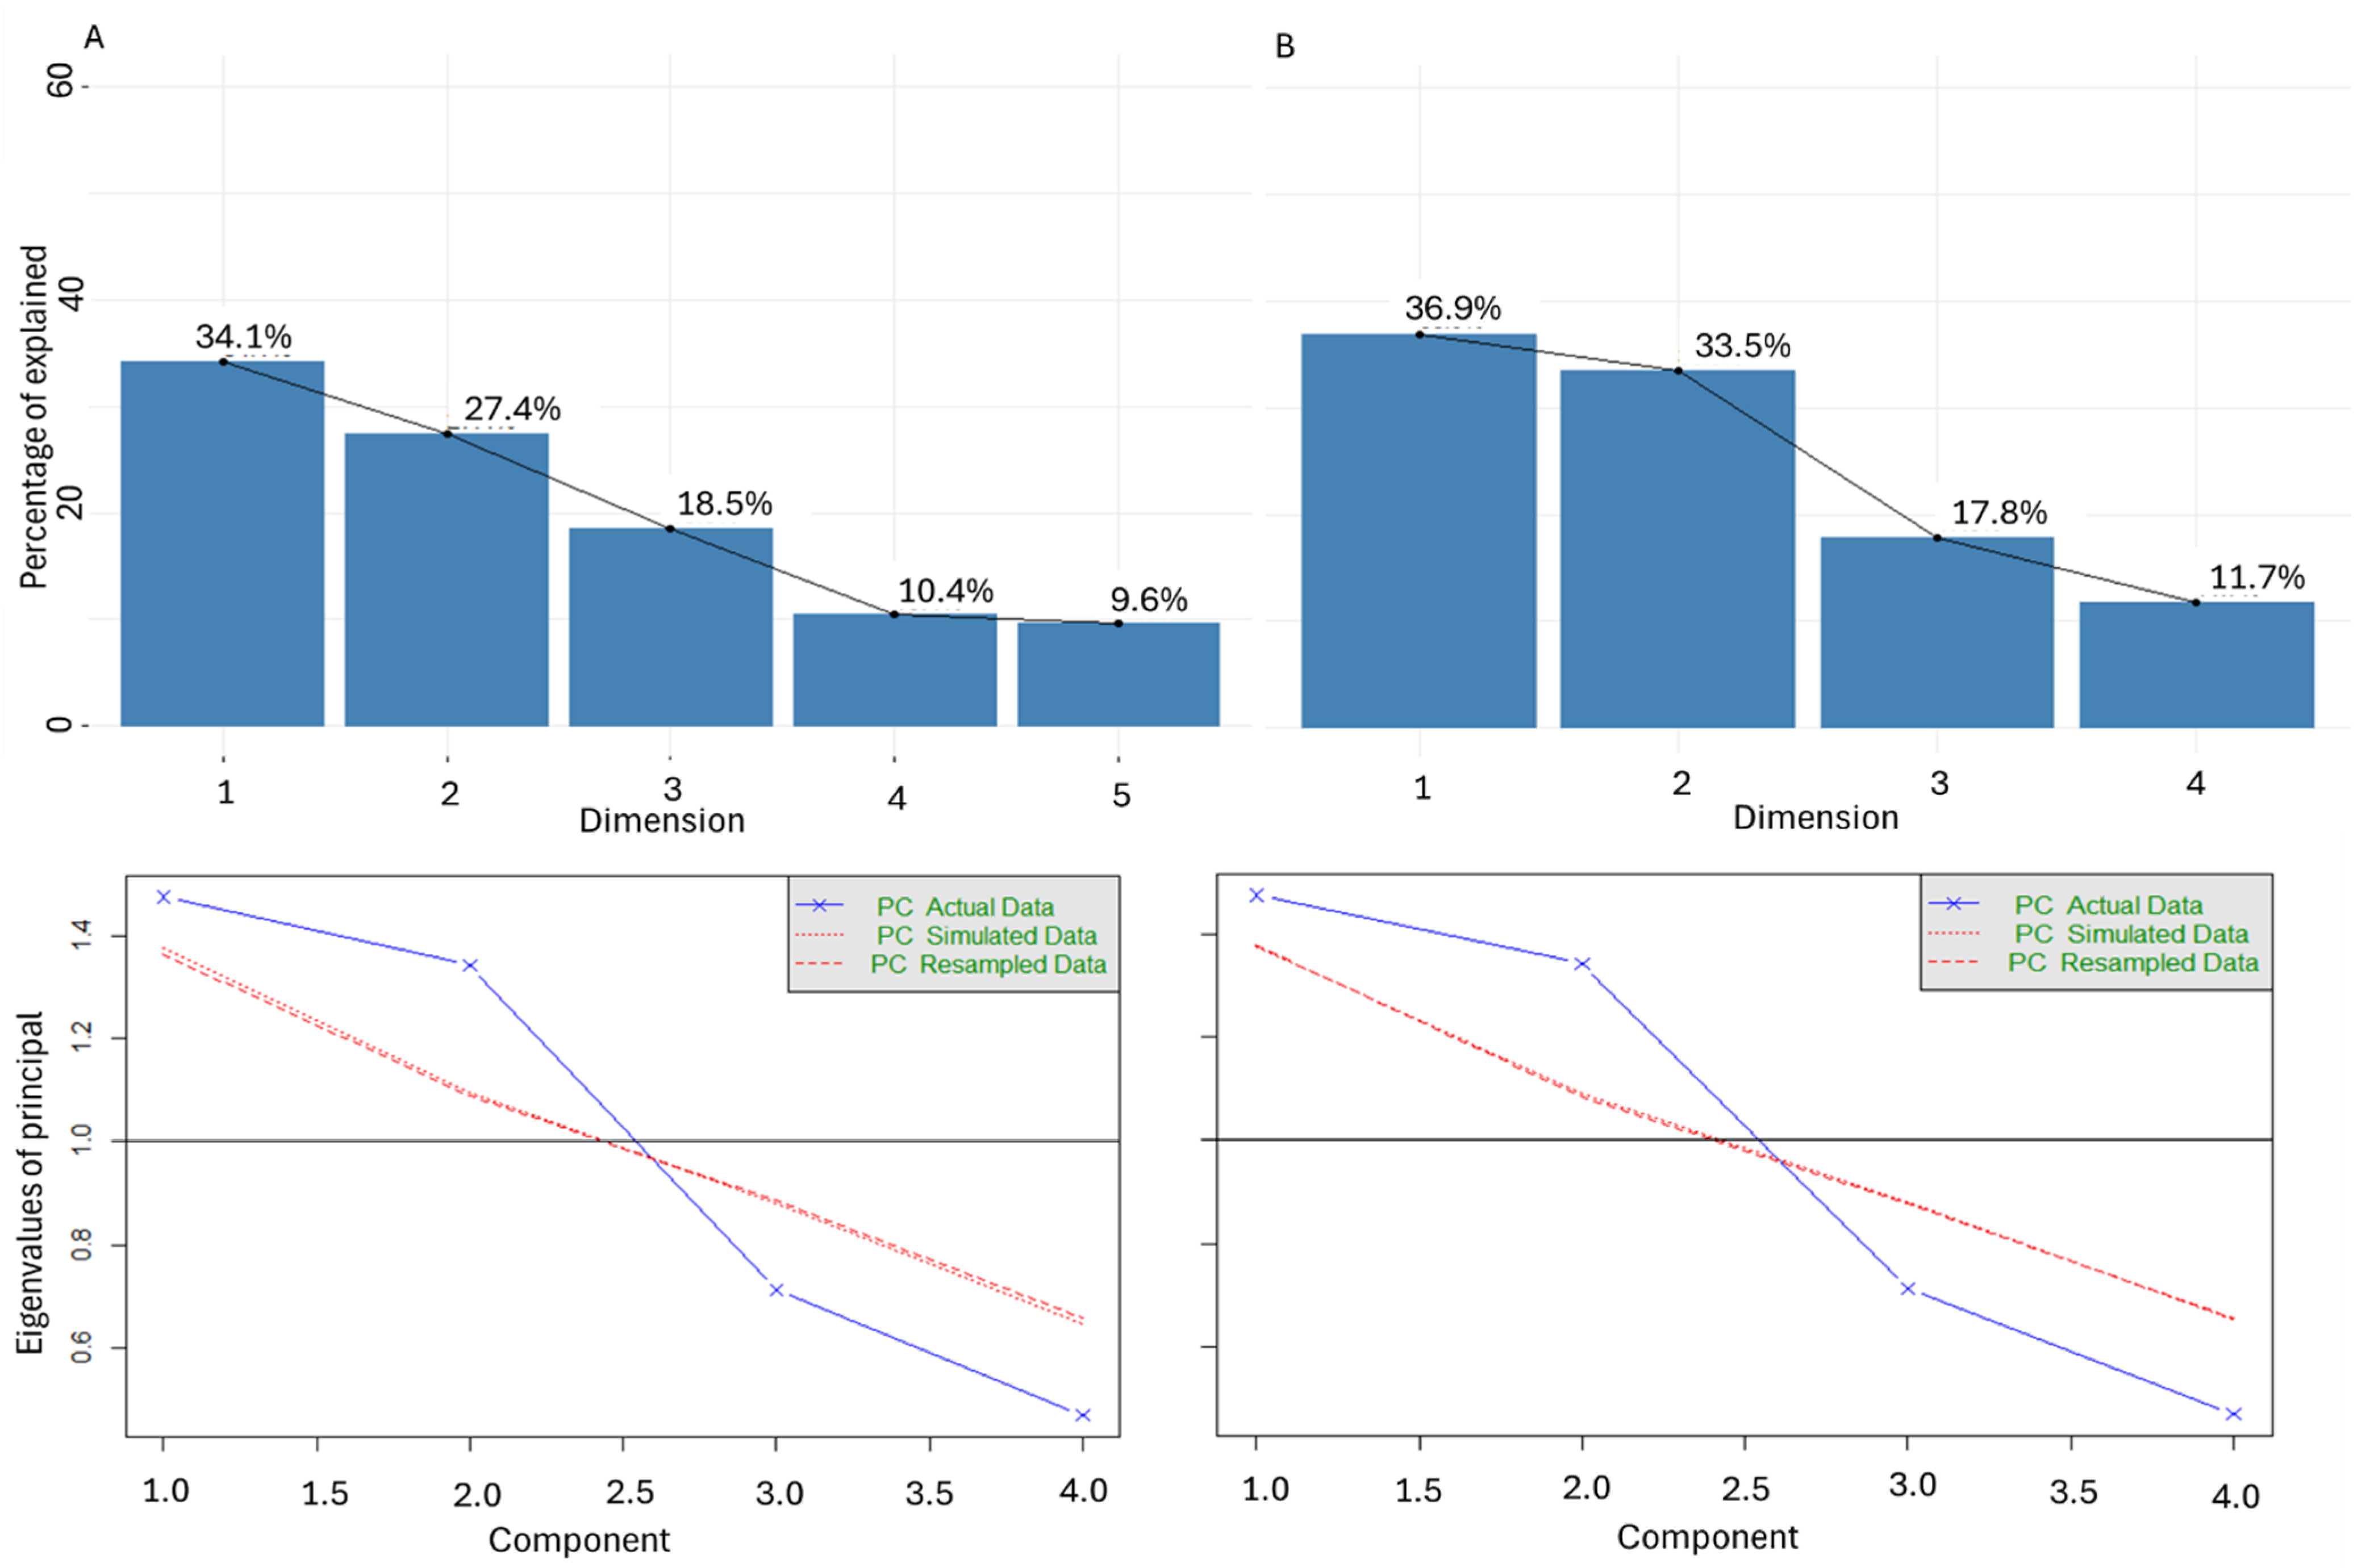
We performed a Principal Component Analysis (PCA) on soil data categorized by tillage, soil texture, and fertilizer type (Figure 6, Figure 7, Figure 8). Prior to performing PCA, the corn dataset, consisting of five continuous variables (pH, N-rate, air temperature, precipitation, and N-Flux), was rigorously screened against key assumptions.
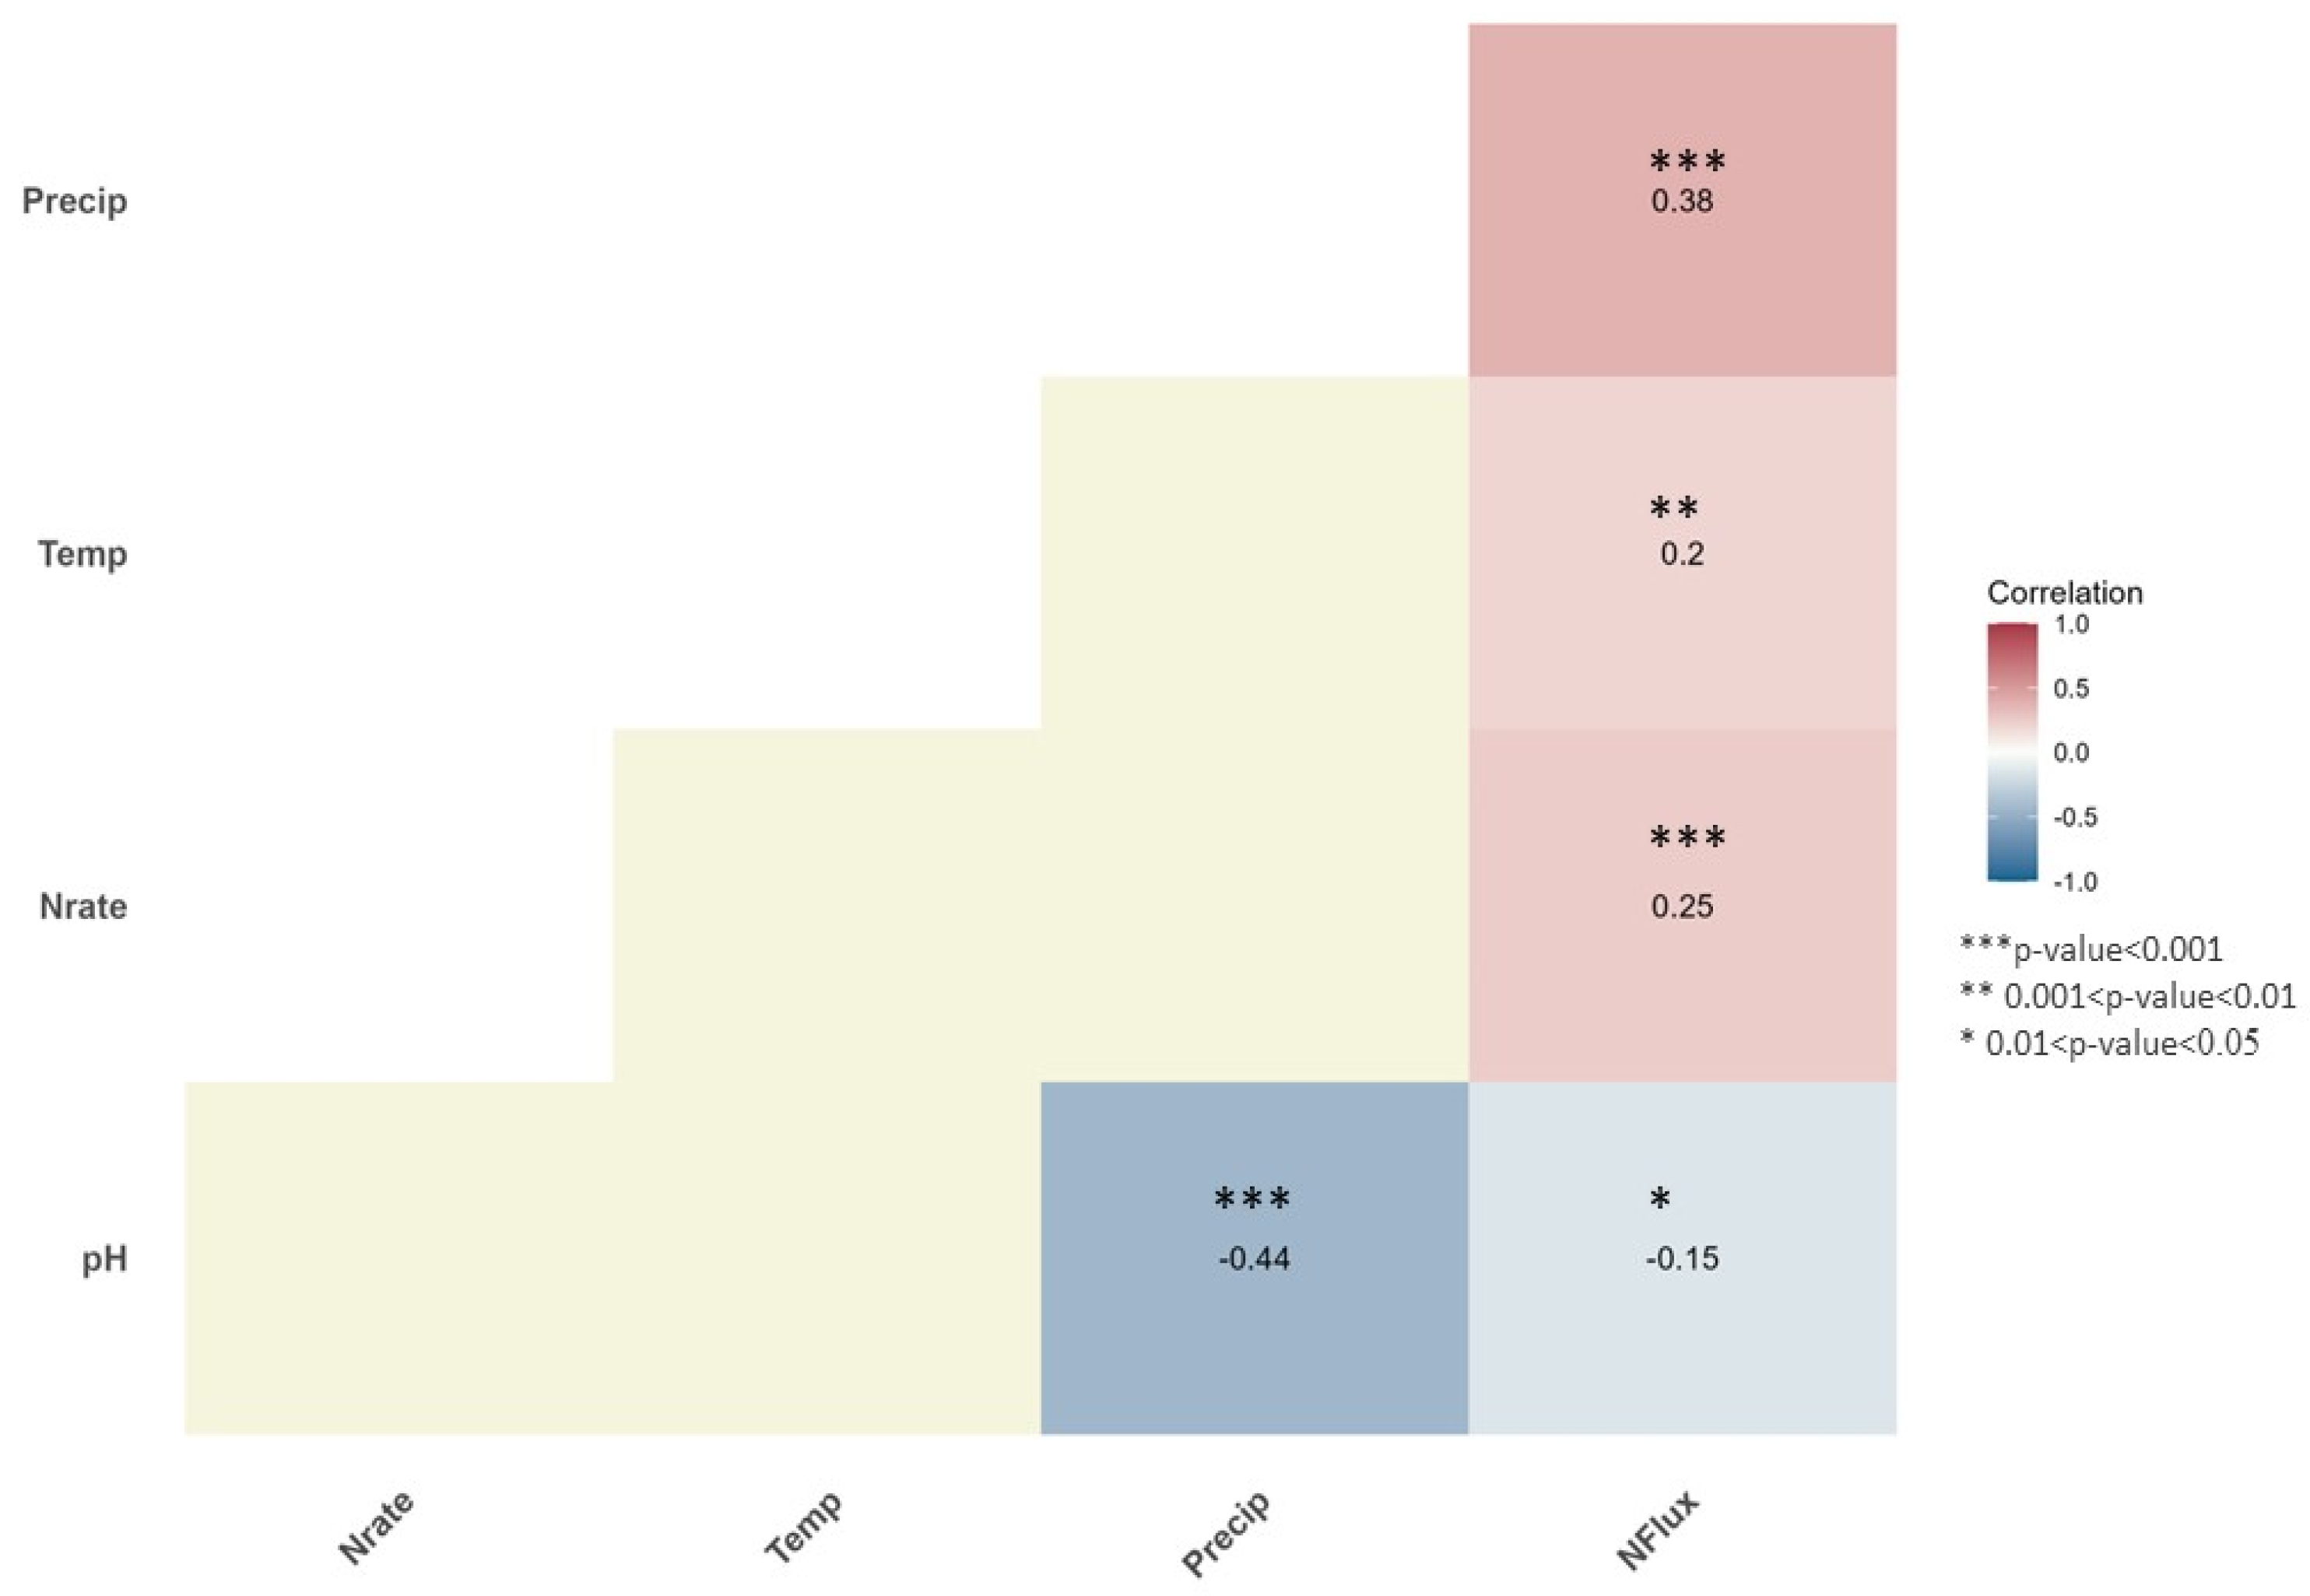
All variables were confirmed to be continuous and were assessed for approximate linear relationships. Bartlett’s test of sphericity yielded statistically significant results for both the corn (p < 0.001) and soybean (p < 0.027) datasets, indicating that the correlation matrices differ significantly from an identity matrix. This confirms the presence of meaningful inter-variable correlations, a fundamental prerequisite for conducting PCA. A heat map plot of significant correlations is presented in Figure 7. Sampling adequacy was found to be marginal, with a Kaiser–Meyer–Olkin (KMO) value of 0.54. The decision to retain two principal components was supported by both the Kaiser Criterion (eigenvalues > 1) and visual inspection of the scree plots (Figure 9). This decision was further supported by the results of the parallel analysis (Figure 9). In both the corn (Dim.1 = 1.7; Dim.2 = 1.3) and soybean (Dim.1 = 1.5; Dim.2 = 1.3) datasets, these criteria consistently indicated a two-component solution. Together, the retained components accounted for 61.50% of the total variance in the corn data and 70.42% in the soybean data. Outliers were screened using Mahalanobis distance and were found not to significantly bias the results. Despite the KMO measure being marginal (falling below the generally preferred threshold of 0.60), the analysis was deemed suitable for exploratory purposes. This decision was based on the highly significant Bartlett’s test, the acceptable individual MSAs, and the complex nature of the meta-analysis data. We proceeded with the PCA, a point further addressed in the limitations of the study.
Our analysis showed that precipitation, pH, and N2O flux were the primary drivers of this variability (Table 4). The PCA results indicate that PC1 is primarily influenced by precipitation (loading = 0.65) and pH (loading = −0.55), with N2O flux also moderately associated (0.46). This suggests that climatic factors and soil acidity largely drive the variability captured by PC1. PC2 is most strongly influenced by air temperature (0.60), N-rate (0.49), and N2O flux (0.52). While the N2O flux was predictably and positively associated with N application rate, which is a key management control, the contribution of the N-rate to the overall structure of the principal components was less pronounced than that of the fundamental environmental factors, precipitation and soil pH (Figure 6). This finding highlights that, although N-rate provides the substrate for N2O production, environmental factors, particularly precipitation, which affects soil moisture and aeration, and soil pH, remain the primary determinants of both the magnitude and spatial variability of N2O emissions in these systems. Therefore, the effect of nitrogen application rate is shaped by the surrounding environmental context.
While our study focused on regions with moderate precipitation, the patterns observed for N2O emissions, including the effects of N-rate, tillage, and environmental factors, may differ across climatic zones. In arid regions, lower soil moisture may limit microbial activity and denitrification, reducing N2O emissions, whereas in humid regions, higher soil moisture could enhance anaerobic conditions and increase emissions. Therefore, although the relative effects of management and environmental factors are likely generalizable, the absolute magnitude of N2O fluxes should be interpreted in the context of local climate conditions.

3.6.1. Key Drivers of N2O Emissions

Precipitation emerged as the dominant factor, likely due to its strong control over soil moisture content, which regulates oxygen availability and thereby the balance between nitrification and denitrification, the two primary microbial pathways producing N2O [111]. High precipitation can create anaerobic microsites that favor denitrification, often resulting in elevated N2O emissions [130].
Soil pH was the second major contributor and plays a critical role in regulating microbial community composition and enzyme activity (e.g., N2O reductase, nitrifiers and denitrifiers), as well as the chemical form and bioavailability of nitrogen substrates [130]. Low pH can impair the final step of denitrification, increasing the N2O/(N2O + N2) ratio and thus enhancing net N2O emissions [131].

3.6.2. Interactions and Implications

Our correlation analysis revealed a significant negative relationship between precipitation and pH in corn fields (Figure 7), which is a common finding in humid agricultural soils. This relationship likely reflects the precipitation-driven leaching of base cations (Ca2+, Mg2+, K+) and associated acidification. Heavy or prolonged rainfall removes alkaline cations, reducing the soil’s ability to neutralize acids, which leads to acidification [12,132]. This suggests that in wetter climates, a reduced soil pH may indirectly modulate N2O emissions by altering microbial pathways. These mechanistic linkages explain the opposing directions of precipitation and pH vectors in the PCA and underscore the importance of climate–soil chemical interactions in N2O emission dynamics.
Furthermore, we observed a positive association between N-rate and N2O flux in corn fields, indicating that fertilizer application influences N2O emissions, although to a lesser extent than climate–soil factors. Precipitation and pH showed statistically significant correlations with N2O emissions (r = –0.44, p < 0.001; r = 0.38, p < 0.001, respectively). Although these coefficients indicate moderate relationships, their statistical significance highlights the consistent role of these variables in influencing N2O fluxes across sites. These findings highlight the importance of local climate conditions, particularly precipitation, as a key driver of soil N2O flux, a crucial consideration for optimizing land-use management practices. No significant correlations were found for soybean fields.

4. Limitations of the Study

Because our analysis focused on growing-season N2O emissions, our findings should not be interpreted as annual emission budgets. Non-growing season fluxes, which can be significant in some climates, were outside the scope of this study. The economic optimum nitrogen rate (EONR) reported by [18] varied between 47 and 188 kg N ha−1 across nine different locations, highlighting the inherent variability in nitrogen requirements due to site-specific factors such as soil properties, climate, and management practices. We acknowledge that determining a precise EONR is complex and context-dependent. The selection of 188 kg N ha−1 as a threshold in this study was based on practical considerations rather than as a universally applicable recommendation. Future research incorporating a broader range of environmental conditions and management scenarios would help refine region-specific EONR estimates. Large-scale meta-analyses that integrate data from diverse agroecological zones could provide more accurate and adaptive nitrogen management guidelines.
Although Bartlett’s test of sphericity was highly significant, confirming that the correlation matrix is not an identity matrix and that the data are suitable for dimension reduction, the Kaiser–Meyer–Olkin (KMO) Measure of Sampling Adequacy was relatively low, falling within the marginal range. The KMO statistics assess the proportion of variance that might be common across variables; a low value suggests that the variables share limited common variance and that a substantial proportion of variance is specific to individual variables. This indicates that the intercorrelations among variables are weak to moderate overall, which may limit the stability and generalizability of the principal components extracted. While the first two components accounted for a reasonable proportion of the total variance (61.50% and 70.42%, respectively), the suboptimal KMO value implies that these components may be less robust than those derived from data with stronger sampling adequacy (typically KMO > 0.60). As such, the factor structure identified through PCA should be interpreted with caution and regarded as exploratory rather than confirmatory.

5. Conclusions

This review systematically analyzed the effects of land management and climate–soil conditions on growing-season N2O emissions from corn and soybean systems. While fertilizer management strongly influences N2O fluxes, overarching environmental factors, particularly precipitation and soil pH, are the dominant determinants of emission variability. A strong inverse correlation between precipitation and soil pH underscores the importance of accounting for interactive climate–soil chemical dynamics in emission assessments and sustainable agricultural planning. Corn-specific N2O emission factors (0.6% to 1.0%) provide regionally relevant values that can improve the accuracy of greenhouse gas inventories and national reporting. This synthesis provides actionable insights for developing climate-smart agricultural policies and highlights the need for integrated approaches linking soil, climate, and management to improve N2O mitigation efforts and reporting accuracy. Future research on the combined effects of climatic factors and diverse management practices (e.g., tillage, irrigation, and alternative fertilizers) is needed to guide effective, locally targeted mitigation strategies.

Author Contributions

J.A.: Contributed to the conceptualization and design of the study, methodology development, data curation, formal analysis, and visualization. Took the lead in drafting the original manuscript. Approved the final version and agrees to be accountable for all aspects of the work. M.P.D.: Provided supervision and input on methodology, contributed to writing through critical review and editing, and secured funding. Approved the final version and agrees to be accountable for all aspects of the work. C.L.: Contributed to the conceptualization of the study, provided supervision, and secured funding. Reviewed the manuscript for intellectual content, approved the final version, and agrees to be accountable for all aspects of the work. S.B.: Contributed to methodology and critical manuscript review and editing. Approved the final version and agrees to be accountable for all aspects of the work. All authors have read and agreed to the published version of the manuscript.

Funding

This work was supported by the U.S. Department of Agriculture-Farm Service Agency [grant number 3080-12620-006-005-R].

Conflicts of Interest

The authors have no relevant financial or non-financial interests to disclose.

References

  1. Summary for Policymakers. In Climate Change 2021: The Physical Science Basis. Contribution of Working Group I to the Sixth Assessment Report of the Intergovernmental Panel on Climate Change; Cambridge University Press: Cambridge, UK, 2021.
  2. Report of the Conference of the Parties on Its Twenty-Third Session, Held in Bonn from 6 to 18 November 2017. Addendum. Part Two: Action Taken by the Conference of the Parties at Its Twenty-Third Session; United Nations: New York, NY, USA, 2018; Available online: https://unfccc.int/documents/65126 (accessed on 16 October 2022).
  3. Kwak, J.H.; Lim, S.S.; Baah-Acheamfour, M.; Choi, W.J.; Fatemi, F.; Carlyle, C.N.; Chang, S.X. Introducing trees to agricultural lands increases greenhouse gas emission during spring thaw in Canadian agroforestry systems. Sci. Total Environ. 2019, 652, 800–809. [Google Scholar] [CrossRef]
  4. Baah-Acheamfour, M.; Carlyle, C.N.; Lim, S.S.; Bork, E.W.; Chang, S.X. Forest and grassland cover types reduce net greenhouse gas emissions from agricultural soils. Sci. Total Environ. 2016, 571, 1115–1127. [Google Scholar] [CrossRef]
  5. Weitzman, J.N.; Groffman, P.M.; Adler, P.R.; Dell, C.J.; Johnson, F.E.; Lerch, R.N.; Strickland, T.C. Drivers of hot spots and hot moments of denitrification in agricultural systems. J. Geophys. Res. Biogeosci. 2021, 126, e2020JG006234. [Google Scholar] [CrossRef]
  6. Abraha, M.; Gelfand, I.; Hamilton, S.K.; Chen, J.; Robertson, G.P. Legacy effects of land use on soil nitrous oxide emissions in annual crop and perennial grassland ecosystems. Ecol. Appl. 2018, 28, 1362–1369. [Google Scholar] [CrossRef] [PubMed]
  7. Moore, B.D.; Kaur, G.; Motavalli, P.P.; Zurweller, B.A.; Svoma, B.M. Soil greenhouse gas emissions from agroforestry and other land uses under different moisture regimes in lower Missouri River Floodplain soils: A laboratory approach. Agrofor. Syst. 2018, 92, 335–348. [Google Scholar] [CrossRef]
  8. Ansari, J.; Udawatta, R.P.; Anderson, S.H. Soil Nitrous Oxide Emission from Agroforestry, Rowcrop, Grassland and Forests in North America: A Review. Agrofor. Syst. 2023, 97, 1465–1479. [Google Scholar] [CrossRef]
  9. Mendis, S.S.; Udawatta, R.; Anderson, S.H.; Ansari, J.; Salceda, M. Effects of cover crops on soil thermal properties of a corn cropping system. Soil Sci. Soc. Am. J. 2022, 86, 1194–1205. [Google Scholar] [CrossRef]
  10. Huang, Y.; Tao, B.; Yang, Y.; Zhu, X.; Yang, X.; Grove, J.H.; Ren, W. Simulating no-tillage effects on crop yield and green-house gas emissions in Kentucky corn and soybean cropping systems: 1980–2018. Agric. Syst. 2022, 197, 103355. [Google Scholar] [CrossRef]
  11. Ansari, J.; Davis, M.P.; Anderson, S.H.; Eivazi, F.; Bardhan, S. Greenhouse Gas Emissions from Row Crop, Agroforestry, and Forested Land Use Systems in Floodplain Soils. Water Air Soil Pollut. 2023, 234, 227. [Google Scholar] [CrossRef]
  12. Heil, J.; Vereecken, H.; Brüggemann, N. A review of chemical reactions of nitrification intermediates and their role in nitrogen cycling and nitrogen trace gas formation in soil. Eur. J. Soil Sci. 2016, 67, 23–39. [Google Scholar] [CrossRef]
  13. Schaufler, G.; Kitzler, B.; Schindlbacher, A.; Skiba, U.; Sutton, M.A.; Zechmeister-Boltenstern, S. Greenhouse gas emissions from European soils under different land use: Effects of soil moisture and temperature. Eur. J. Soil Sci. 2010, 61, 683–696. [Google Scholar] [CrossRef]
  14. Heinen, M. Simplified denitrification models: Overview and properties. Geoderma 2006, 133, 444–463. [Google Scholar] [CrossRef]
  15. Baggs, E.M.; Smales, C.L.; Bateman, E.J. Changing pH shifts the microbial sourceas well as the magnitude of N2O emission from soil. Biol. Fertil. Soils 2010, 46, 793–805. [Google Scholar] [CrossRef]
  16. Ou, Y.; Rousseau, A.N.; Wang, L.; Yan, B.; Gumiere, T.; Zhu, H. Identification of the alteration of riparian wetland on soil properties, enzyme activities and microbial communities following extreme flooding. Geoderma 2019, 337, 825–833. [Google Scholar] [CrossRef]
  17. Zhang, W.; Liang, Z.; He, X.; Wang, X.; Shi, X.; Zou, C.; Chen, X. The effects of controlled release urea on maize productivity and reactive nitrogen losses: A meta-analysis. Environ. Pollut. 2019, 246, 559–565. [Google Scholar] [CrossRef]
  18. Page, M.J.; McKenzie, J.E.; Bossuyt, P.M.; Boutron, I.; Hoffmann, T.C.; Mulrow, C.D.; Moher, D. The PRISMA 2020 statement: An updated guideline for reporting systematic reviews. BMJ 2020, 372, n71. [Google Scholar]
  19. Soil Survey Staff, Natural Resources Conservation Service, United States Department of Agriculture. Web Soil Survey. Available online: https://websoilsurvey.nrcs.usda.gov/ (accessed on 12 February 2023).
  20. Schmidt, J.P.; Hong, N.; Dellinger, A.; Beegle, D.B.; Lin, H. Hillslope variability in corn response to nitrogen linked to in-season soil moisture redistribution. Agron. J. 2007, 99, 229–237. [Google Scholar] [CrossRef]
  21. Hedges, L.V.; Gurevitch, J.; Curtis, P.S. The meta-analysis of response ratios in experimental ecology. Ecology 1999, 80, 1150–1156. [Google Scholar] [CrossRef]
  22. Linquist, B.; Van Groenigen, K.J.; Adviento-Borbe, M.A.; Pittelkow, C.; Van Kessel, C. An agronomic assessment of greenhouse gas emissions from major cereal crops. Glob. Change Biol. 2012, 18, 194–209. [Google Scholar] [CrossRef]
  23. Xu, C.; Han, X.; Bol, R.; Smith, P.; Wu, W.; Meng, F. Impacts of natural factors and farming practices on greenhouse gas emissions in the North China Plain: A meta-analysis. Ecol. Evol. 2017, 7, 6702–6715. [Google Scholar] [CrossRef]
  24. Drury, C.F.; Yang, X.M.; Reynolds, W.D.; McLaughlin, N.B. Nitrous oxide and carbon dioxide emissions from monoculture and rotational cropping of corn, soybean and winter wheat. Can. J. Soil Sci. 2008, 88, 163–174. [Google Scholar] [CrossRef]
  25. Tian, H.; Xu, R.; Canadell, J.G.; Thompson, R.L.; Winiwarter, W.; Suntharalingam, P.; Yao, Y. A comprehensive quantification of global nitrous oxide sources and sinks. Nature 2020, 586, 248–256. [Google Scholar] [CrossRef] [PubMed]
  26. FAOSTAT Database-Resources. Food Agriculture Organization of United Nations. Available online: https://www.fao.org/sustainability (accessed on 4 August 2023).
  27. Cecchin, A.; Pourhashem, G.; Gesch, R.W.; Lenssen, A.W.; Mohammed, Y.A.; Patel, S.; Berti, M.T. Environmental trade-offs of relay-cropping winter cover crops with soybean in a maize-soybean cropping system. Agric. Syst. 2021, 189, 103062. [Google Scholar] [CrossRef]
  28. Elhady, A.; Hallmann, J.; Heuer, H. Symbiosis of soybean with nitrogen fixing bacteria affected by root lesion nematodes in a density-dependent manner. Sci. Rep. 2020, 10, 1619. [Google Scholar] [CrossRef]
  29. Liyanage, A.; Grace, P.R.; Scheer, C.; de Rosa, D.; Ranwala, S.; Rowlings, D.W. Carbon limits non-linear response of nitrous oxide (N2O) to increasing N inputs in a highly-weathered tropical soil in Sri Lanka. Agric. Ecosyst. Environ. 2020, 292, 106808. [Google Scholar] [CrossRef]
  30. Wang, Y.; Hu, C.; Ming, H.; Oenema, O.; Schaefer, D.A.; Dong, W.; Li, X. Methane, carbon dioxide and nitrous oxide fluxes in soil profile under a winter wheat-summer maize rotation in the North China Plain. PLoS ONE 2014, 9, e98445. [Google Scholar] [CrossRef]
  31. Álvaro-Fuentes, J.; Arrúe, J.L.; Cantero-Martínez, C.; Isla, R.; Plaza-Bonilla, D.; Quílez, D. Fertilization scenarios in sprinkler-irrigated corn under mediterranean conditions: Effects on greenhouse gas emissions. Soil Sci. Soc. Am. J. 2016, 80, 662–671. [Google Scholar] [CrossRef]
  32. Dungan, R.S.; Leytem, A.B.; Tarkalson, D.D. Greenhouse gas emissions from an irrigated cropping rotation with dairy manure utilization in a semiarid climate. Agron. J. 2021, 113, 1222–1237. [Google Scholar] [CrossRef]
  33. Phillips, R.L.; Tanaka, D.L.; Archer, D.W.; Hanson, J.D. Fertilizer application timing influences greenhouse gas fluxes over a growing season. J. Environ. Qual. 2009, 38, 1569–1579. [Google Scholar] [CrossRef]
  34. Liu, C.; Wang, K.; Zheng, X. Responses of N2O and CH4 fluxes to fertilizer nitrogen addition rates in an irrigated wheat-maize cropping system in northern China. Biogeosciences 2012, 9, 839–850. [Google Scholar] [CrossRef]
  35. Chantigny, M.H.; Rochette, P.; Angers, D.A.; Bittman, S.; Buckley, K.; Massé, D.; Gasser, M.O. Soil nitrous oxide emissions following band-incorporation of fertilizer nitrogen and swine manure. J. Environ. Qual. 2010, 39, 1545–1553. [Google Scholar] [CrossRef]
  36. Guardia, G.; Cangani, M.T.; Sanz-Cobena, A.; Junior, J.L.; Vallejo, A. Management of pig manure to mitigate NO and yield-scaled N2O emissions in an irrigated Mediterranean crop. Agric. Ecosyst. Environ. 2017, 238, 55–66. [Google Scholar] [CrossRef]
  37. Lessard, R.; Rochette, P.; Gregorich, E.G.; Pattey, E.; Desjardins, R.L. Nitrous oxide fluxes from manure-amended soil under maize. Soil Sci. Soc. Am. J. 1996, 25, 1371–1377. [Google Scholar] [CrossRef]
  38. Mosier, A.R.; Guenzi, W.D.; Schweizer, E.E. Soil losses of dinitrogen and nitrous oxide from irrigated crops in northeastern Colorado. Soil Sci. Soc. Am. J. 1986, 50, 344–348. [Google Scholar] [CrossRef]
  39. Pelster, D.E.; Chantigny, M.H.; Rochette, P.; Angers, D.A.; Rieux, C.; Vanasse, A. Nitrous oxide emissions respond differently to mineral and organic nitrogen sources in contrasting soil types. J. Environ. Qual. 2012, 41, 427–435. [Google Scholar] [CrossRef] [PubMed]
  40. Almaraz, J.J.; Mabood, F.; Zhou, X.; Madramootoo, C.; Rochette, P.; Ma, B.L.; Smith, D.L. Carbon dioxide and nitrous oxide fluxes in corn grown under two tillage systems in southwestern Quebec. Soil Sci. Soc. Am. J. 2009, 73, 113–119. [Google Scholar] [CrossRef]
  41. Montoya, M.; Guardia, G.; Recio, J.; Castellano-Hinojosa, A.; Ginés, C.; Bedmar, E.J.; Vallejo, A. Zinc-nitrogen co-fertilization influences N2O emissions and microbial communities in an irrigated maize field. Geoderma 2021, 383, 114735. [Google Scholar] [CrossRef]
  42. Abagandura, G.O.; Şentürklü, S.; Singh, N.; Kumar, S.; Landblom, D.G.; Ringwall, K. Impacts of crop rotational diversity and grazing under integrated crop-livestock system on soil surface greenhouse gas fluxes. PLoS ONE 2019, 14, e0217069. [Google Scholar] [CrossRef]
  43. Zhang, X.B.; Sun, N. Soil CO2 and N2O emissions in maize growing season under different fertilizer regimes in an upland red soil region of South China. J. Integr. Agric. 2014, 13, 604–614. [Google Scholar] [CrossRef]
  44. Bah, H.; Ren, X.; Wang, Y.; Tang, J.; Zhu, B. Characterizing greenhouse gas emissions and global warming potential of wheat-maize cropping systems in response to organic amendments in eutric regosols, China. Atmosphere 2020, 11, 614. [Google Scholar] [CrossRef]
  45. Horák, J.; Aydin, E.; Igaz, D.; Šimanský, V.; Buchkina, N.; Balashov, E. Effects of biochar combined with n-fertilization on soil CO2 emissions, crop yields and relationships with soil properties. Pol. J. Environ. Stud. 2020, 29, 3597–3609. [Google Scholar] [CrossRef]
  46. Burzaco, J.P.; Smith, D.R.; Vyn, T.J. Nitrous oxide emissions in Midwest US maize production vary widely with band-injected N fertilizer rates, timing and nitrapyrin presence. Environ. Res. Lett. 2013, 8, 035031. [Google Scholar] [CrossRef]
  47. Fangueiro, D.; Pereira, J.L.; Fraga, I.; Surgy, S.; Vasconcelos, E.; Coutinho, J. Band application of acidified slurry as an alternative to slurry injection in a Mediterranean double cropping system: Agronomic effect and gaseous emissions. Agric. Ecosyst. Environ. 2018, 267, 87–99. [Google Scholar] [CrossRef]
  48. Bastos, L.M.; Rice, C.W.; Tomlinson, P.J.; Mengel, D. Untangling soil-weather drivers of daily N2O emissions and fertilizer management mitigation strategies in no-till corn. Soil Sci. Soc. Am. J. 2021, 85, 1437–1447. [Google Scholar] [CrossRef]
  49. Parkin, T.B.; Hatfield, J.L. Enhanced efficiency fertilizers: Effect on nitrous oxide emissions in Iowa. Agron. J. 2014, 106, 694–702. [Google Scholar] [CrossRef]
  50. Tian, D.; Zhang, Y.; Zhou, Y.; Mu, Y.; Liu, J.; Zhang, C.; Liu, P. Effect of nitrification inhibitors on mitigating N2O and NO emissions from an agricultural field under drip fertigation in the North China Plain. Sci. Total Environ. 2017, 598, 87–96. [Google Scholar] [CrossRef] [PubMed]
  51. Zhou, Y.; Zhang, Y.; Tian, D.; Mu, Y. The influence of straw returning on N2O emissions from a maize-wheat field in the North China Plain. Sci. Total Environ. 2017, 584, 935–941. [Google Scholar] [CrossRef]
  52. Meijide, A.; Díez, J.A.; Sánchez-Martín, L.; López-Fernández, S.; Vallejo, A. Nitrogen oxide emissions from an irrigated maize crop amended with treated pig slurries and composts in a Mediterranean climate. Agric. Ecosyst. Environ. 2007, 121, 383–394. [Google Scholar] [CrossRef]
  53. Li, Y.; Hu, L.; Qiu, J.J.; Liu, H.Y. Impacts of fertilization alternatives and crop straw incorporation on N2O emissions from a spring maize field in Northeastern China. J. Integr. Agric. 2014, 13, 881–892. [Google Scholar] [CrossRef]
  54. Recio, J.; Vallejo, A.; Le-Noe, J.; Garnier, J.; García-Marco, S.; Álvarez, J.M.; Sanz-Cobena, A. The effect of nitrification inhibitors on NH3 and N2O emissions in highly N fertilized irrigated Mediterranean cropping systems. Sci. Total Environ. 2018, 636, 427–436. [Google Scholar] [CrossRef]
  55. Zhou, Y.; Zhang, Y.; Tian, D.; Mu, Y. Impact of dicyandiamide on emissions of nitrous oxide, nitric oxide and ammonia from agricultural field in the North China Plain. J. Environ. Sci. 2016, 40, 20–27. [Google Scholar] [CrossRef]
  56. Recio, J.; Montoya, M.; Ginés, C.; Sanz-Cobena, A.; Vallejo, A.; Alvarez, J.M. Joint mitigation of NH3 and N2O emissions by using two synthetic inhibitors in an irrigated cropping soil. Geoderma 2020, 373, 114423. [Google Scholar] [CrossRef]
  57. Shu, X.; Wang, Y.; Wang, Y.; Ma, Y.; Men, M.; Zheng, Y.; Noulas, C. Response of soil N2O emission and nitrogen utilization to organic matter in the wheat and maize rotation system. Sci. Rep. 2021, 11, 4396. [Google Scholar] [CrossRef]
  58. Guzman, J.; Al-Kaisi, M.; Parkin, T. Greenhouse gas emissions dynamics as influenced by corn residue removal in continuous corn system. Soil Sci. Soc. Am. J. 2015, 79, 612–625. [Google Scholar] [CrossRef]
  59. Bilen, S.; Jacinthe, P.A.; Shrestha, R.; Jagadamma, S.; Nakajima, T.; Kendall, J.R.; Dick, W. Greenhouse gas fluxes in a no-tillage chronosequence in Central Ohio. Soil Tillage Res. 2022, 218, 105313. [Google Scholar] [CrossRef]
  60. Oates, L.G.; Duncan, D.S.; Gelfand, I.; Millar, N.; Robertson, G.P.; Jackson, R.D. Nitrous oxide emissions during establishment of eight alternative cellulosic bioenergy cropping systems in the North Central United States. GCB Bioenergy 2016, 8, 539–549. [Google Scholar] [CrossRef]
  61. Dlamini, J.C.; Cardenas, L.M.; Tesfamariam, E.H.; Dunn, R.M.; Evans, J.; Hawkins, J.M.B.; Collins, A.L. Soil N2O and CH4 emissions from fodder maize production with and without riparian buffer strips of differing vegetation. Plant Soil 2022, 477, 297–318. [Google Scholar] [CrossRef]
  62. Franco-Luesma, S.; Álvaro-Fuentes, J.; Plaza-Bonilla, D.; Arrúe, J.L.; Cantero-Martínez, C.; Cavero, J. Influence of irrigation time and frequency on greenhouse gas emissions in a solid-set sprinkler-irrigated maize under Mediterranean conditions. Agric. Water Manag. 2019, 221, 303–311. [Google Scholar] [CrossRef]
  63. Jumadi, O.; Hala, Y.; Muis, A.B.D.; Ali, A.; Palennari, M.; Yagi, K.; Inubushi, K. Influences of chemical fertilizers and a nitrification inhibitor on greenhouse gas fluxes in a corn (Zea mays L.) field in Indonesia. Microbes Environ. 2008, 23, 29–34. [Google Scholar] [CrossRef]
  64. Sherman, J.; Young, E.; Jokela, W.; Kieke, B. Manure application timing and Incorporation effects on ammonia and green-house gas emissions in corn. Agriculture 2022, 12, 1952. [Google Scholar] [CrossRef]
  65. Lehman, R.M.; Osborne, S.L. Greenhouse gas fluxes from no-till rotated corn in the upper midwest. Agric. Ecosyst. Environ. 2013, 170, 1–9. [Google Scholar] [CrossRef]
  66. Mosongo, P.S.; Pelster, D.E.; Li, X.; Gaudel, G.; Wang, Y.; Chen, S.; Hu, C. Greenhouse gas emissions response to fertilizer application and soil moisture in dry agricultural uplands of Central Kenya. Atmosphere 2022, 13, 463. [Google Scholar] [CrossRef]
  67. Pitombo, L.M.; Carmo, J.B.D.; Maria, I.C.D.; Andrade, C.A.D. Carbon sequestration and greenhouse gases emissions in soil under sewage sludge residual effects. Sci. Agric. 2015, 72, 147–156. [Google Scholar] [CrossRef]
  68. Duxbury, J.M.; McConnaughey, P.K. Effect of fertilizer source on denitrification and nitrous oxide emissions in a maize-field. Soil Sci. Soc. Am. J. 1986, 50, 644–648. [Google Scholar] [CrossRef]
  69. Duxbury, J.M.; Bouldin, D.R.; Terry, R.E.; Tate, R.L., III. Emissions of nitrous oxide from soils. Nature 1982, 298, 462–464. [Google Scholar] [CrossRef]
  70. Rochette, P.; Angers, D.A.; Chantigny, M.H.; Gagnon, B.; Bertrand, N. N2O fluxes in soils of contrasting textures fertilized with liquid and solid dairy cattle manures. Can. J. Soil Sci. 2008, 88, 175–187. [Google Scholar] [CrossRef]
  71. Wagner-Riddle, C.; Thurtell, G.W.; Kidd, G.K.; Beauchamp, E.G.; Sweetman, R. Estimates of nitrous oxide emissions from agricultural fields over 28 months. Can. J. Soil Sci. 1997, 77, 135–144. [Google Scholar] [CrossRef]
  72. Zebarth, B.J.; Rochette, P.; Burton, D.L.; Price, M. Effect of fertilizer nitrogen management on N2O emissions in commercial corn fields. Can. J. Soil Sci. 2008, 88, 189–195. [Google Scholar] [CrossRef]
  73. Kumar, S.; Nakajima, T.; Kadono, A.; Lal, R.; Fausey, N. Long-term tillage and drainage influences on greenhouse gas fluxes from a poorly drained soil of central Ohio. J. Soil Water Conserv. 2014, 69, 553–563. [Google Scholar] [CrossRef]
  74. Drury, C.F.; Woodley, A.L.; Reynolds, W.D.; Yang, X.M.; Phillips, L.A.; Rehmann, L.; Calder, W. Impacts of corn stover removal on carbon dioxide and nitrous oxide emissions. Soil Sci. Soc. Am. J. 2021, 85, 1334–1348. [Google Scholar] [CrossRef]
  75. Sosulski, T.; Stępień, W.; Wąs, A.; Szymańska, M. N2O and CO2 emissions from bare soil: Effect of fertilizer management. Agriculture 2020, 10, 602. [Google Scholar] [CrossRef]
  76. Yoo, J.; Woo, S.H.; Park, K.D.; Chung, K.Y. Effect of no-tillage and conventional tillage practices on the nitrous oxide (N2O) emissions in an upland soil: Soil N2O emission as affected by the fertilizer applications. Appl. Biol. Chem. 2016, 59, 787–797. [Google Scholar] [CrossRef]
  77. Mirzaei, M.; Gorji Anari, M.; Taghizadeh-Toosi, A.; Zaman, M.; Saronjic, N.; Mohammed, S.; Caballero-Calvo, A. Soil nitrous oxide emissions following crop residues management in corn-wheat rotation under conventional and no-tillage systems. Air Soil Water Res. 2022, 15, 11786221221128789. [Google Scholar] [CrossRef]
  78. Chen, J.S.; Amin, A.S.; Hamani, A.K.M.; Wang, G.S.; Zhang, Y.Y.; Liu, K.; Gao, Y. Effects of maize (Zea mays L.) inter-cropping with legumes on nitrous oxide (N2O) emissions. Appl. Ecol. Environ. Res. 2021, 19, 1589–1623. [Google Scholar] [CrossRef]
  79. Omonode, R.A.; Vyn, T.J. Tillage and nitrogen source impacts on relationships between nitrous oxide emission and nitrogen recovery efficiency in corn. J. Environ. Qual. 2019, 48, 421–429. [Google Scholar] [CrossRef] [PubMed]
  80. Snowdon, E.; Zebarth, B.J.; Burton, D.L.; Goyer, C.; Rochette, P. Growing season N2O emissions from two-year potato rotations in a humid environment in New Brunswick, Canada. Can. J. Soil Sci. 2013, 93, 279–294. [Google Scholar] [CrossRef]
  81. Osterholz, W.R.; Kucharik, C.J.; Hedtcke, J.L.; Posner, J.L. Seasonal nitrous oxide and methane fluxes from grain-and forage-based production systems in Wisconsin, USA. J. Environ. Qual. 2014, 43, 1833–1843. [Google Scholar] [CrossRef]
  82. Behnke, G.D.; Zuber, S.M.; Pittelkow, C.M.; Nafziger, E.D.; Villamil, M.B. Long-term crop rotation and tillage effects on soil greenhouse gas emissions and crop production in Illinois, USA. Agric. Ecosyst. Environ. 2018, 261, 62–70. [Google Scholar] [CrossRef]
  83. Lee, J.; Hopmans, J.W.; van Kessel, C.; King, A.P.; Evatt, K.J.; Louie, D.; Six, J. Tillage and seasonal emissions of CO2, N2O and NO across a seed bed and at the field scale in a Mediterranean climate. Agric. Ecosyst. Environ. 2009, 129, 378–390. [Google Scholar] [CrossRef]
  84. Ussiri, D.A.; Lal, R.; Jarecki, M.K. Nitrous oxide and methane emissions from long-term tillage under a continuous corn cropping system in Ohio. Soil Tillage Res. 2009, 104, 247–255. [Google Scholar] [CrossRef]
  85. Mateo-Marín, N.; Quilez, D.; Guillen, M.; Isla, R. Feasibility of stabilised nitrogen fertilisers decreasing greenhouse gas emissions under optimal management in sprinkler irrigated conditions. Agric. Ecosyst. Environ. 2020, 290, 106725. [Google Scholar] [CrossRef]
  86. Ruis, S.J.; Blanco-Canqui, H.; Jasa, P.J.; Jin, V.L. No-till farming and greenhouse gas fluxes: Insights from literature and experimental data. Soil Tillage Res. 2022, 220, 105359. [Google Scholar] [CrossRef]
  87. Cui, F.; Yan, G.; Zhou, Z.; Zheng, X.; Deng, J. Annual emissions of nitrous oxide and nitric oxide from a wheat–maize cropping system on a silt loam calcareous soil in the North China Plain. Soil Biol. Biochem. 2012, 48, 10–19. [Google Scholar] [CrossRef]
  88. Sanz-Cobena, A.; García-Marco, S.; Quemada, M.; Gabriel, J.L.; Almendros, P.; Vallejo, A. Do cover crops enhance N2O, CO2 or CH4 emissions from soil in Mediterranean arable systems? Sci. Total Environ. 2014, 466, 164–174. [Google Scholar] [CrossRef] [PubMed]
  89. D’Amours, J.; Pelster, D.E.; Gagné, G.; Wilkinson, J.A.; Chantigny, M.H.; Angers, D.A.; Halde, C. Combining reduced tillage and green manures minimized N2O emissions from organic cropping systems in a cool humid climate. Agric. Ecosyst. Environ. 2023, 341, 108205. [Google Scholar] [CrossRef]
  90. Goodroad, L.L.; Keeney, D.R.; Peterson, L.A. Nitrous oxide emissions from agricultural soils in Wisconsin. J. Environ. Qual. 1984, 13, 557–561. [Google Scholar] [CrossRef]
  91. Liu, Q.; Chen, Y.; Li, W.; Liu, Y.; Han, J.; Wen, X.; Liao, Y. Plastic-film mulching and urea types affect soil CO2 emissions and grain yield in spring maize on the Loess Plateau, China. Sci. Rep. 2016, 6, 28150. [Google Scholar] [CrossRef]
  92. Shen, Y.; Zhu, L.; Cheng, H.; Yue, S.; Li, S. Effects of biochar application on CO2 emissions from a cultivated soil under semiarid climate conditions in Northwest China. Sustainability 2017, 9, 1482. [Google Scholar] [CrossRef]
  93. Kim, S.U.; Lee, H.H.; Moon, S.M.; Han, H.R.; Hong, C.O. Nitrous oxide emissions and maize yield as influenced by nitrogen fertilization and tillage operations in upland soil. Appl. Biol. Chem. 2021, 64, 18. [Google Scholar] [CrossRef]
  94. Yuan, M.; Greer, K.D.; Nafziger, E.D.; Villamil, M.B.; Pittelkow, C.M. Soil N2O emissions as affected by long-term residue removal and no-till practices in continuous corn. GCB Bioenergy 2018, 10, 972–985. [Google Scholar] [CrossRef]
  95. Chatterjee, A. Nitrogen dynamics under corn fields in the Red River Valley of North Dakota. Agrosyst. Geosci. Environ. 2021, 4, e20178. [Google Scholar] [CrossRef]
  96. Ponce de Leon, M.A.; Dell, C.J.; Karsten, H.D. Nitrous oxide emissions from manured, no-till corn systems. Nutr. Cycl. Agroecosyst. 2021, 119, 405–421. [Google Scholar] [CrossRef]
  97. Tang, Y.L.; Yu, L.L.; Guan, A.M.; Zhou, X.Y.; Wang, Z.G.; Gou, Y.G.; Wang, J.W. Soil mineral nitrogen and yield-scaled soil N2O emissions lowered by reducing nitrogen application and intercropping with soybean for sweet maize production in southern China. J. Integr. Agric. 2017, 16, 2586–2596. [Google Scholar] [CrossRef]
  98. Emmett, B.D.; O’Brien, P.L.; Malone, R.W.; Rogovska, N.; Kovar, J.L.; Kohler, K.; Parkin, T.B. Nitrate losses in subsurface drainage and nitrous oxide emissions from a winter camelina relay cropping system reveal challenges to sustainable intensification. Agric. Ecosyst. Environ. 2022, 339, 108136. [Google Scholar] [CrossRef]
  99. Parkin, T.B.; Kaspar, T.C.; Jaynes, D.B.; Moorman, T.B. Rye cover crop effects on direct and indirect nitrous oxide emissions. Soil Sci. Soc. Am. J. 2016, 80, 1551–1559. [Google Scholar] [CrossRef]
  100. Lenka, S.; Lenka, N.K.; Singh, A.B.; Singh, B.; Raghuwanshi, J. Global warming potential and greenhouse gas emission under different soil nutrient management practices in soybean–wheat system of central India. Environ. Sci. Pollut. Res. 2017, 24, 4603–4612. [Google Scholar] [CrossRef]
  101. Jain, N.; Arora, P.; Tomer, R.; Mishra, S.V.; Bhatia, A.; Pathak, H.; Singh, J.P. Greenhouse gases emission from soils under major crops in Northwest India. Sci. Total Environ. 2016, 542, 551–561. [Google Scholar] [CrossRef]
  102. Miao, S.; Qiao, Y.; Han, X.; Brancher Franco, R.; Burger, M. Frozen cropland soil in northeast China as source of N2O and CO2 emissions. PLoS ONE 2014, 9, e115761. [Google Scholar] [CrossRef]
  103. Langeroodi, A.S.; Osipitan, O.A.; Radicetti, E. Benefits of sustainable management practices on mitigating greenhouse gas emissions in soybean crop (Glycine max). Sci. Total Environ. 2019, 660, 1593–1601. [Google Scholar] [CrossRef]
  104. Bavin, T.K.; Griffis, T.J.; Baker, J.M.; Venterea, R.T. Impact of reduced tillage and cover cropping on the greenhouse gas budget of a maize/soybean rotation ecosystem. Agric. Ecosyst. Environ. 2009, 134, 234–242. [Google Scholar] [CrossRef]
  105. Westphal, M.; Tenuta, M.; Entz, M.H. Nitrous oxide emissions with organic crop production depends on fall soil moisture. Agric. Ecosyst. Environ. 2018, 254, 41–49. [Google Scholar] [CrossRef]
  106. Wegner, B.R.; Chalise, K.S.; Singh, S.; Lai, L.; Abagandura, G.O.; Kumar, S.; Jagadamma, S. Response of soil surface greenhouse gas fluxes to crop residue removal and cover crops under a corn–soybean rotation. J. Environ. Qual. 2018, 47, 1146–1154. [Google Scholar] [CrossRef]
  107. Gregorich, E.G.; McLaughlin, N.B.; Lapen, D.R.; Ma, B.L.; Rochette, P. Soil compaction, both an environmental and agronomic culprit: Increased nitrous oxide emissions and reduced plant nitrogen uptake. Soil Sci. Soc. Am. J. 2014, 78, 1913–1923. [Google Scholar] [CrossRef]
  108. Xiong, Z.; Xing, G.; Tsuruta, H.; Shen, G.; Shi, S.; Du, L. Field study on nitrous oxide emissions from upland cropping systems in China. Soil Sci. Plant Nutr. 2002, 48, 541–548. [Google Scholar] [CrossRef]
  109. Gelfand, I.; Shcherbak, I.; Millar, N.; Kravchenko, A.N.; Robertson, G.P. Long-term nitrous oxide fluxes in annual and perennial agricultural and unmanaged ecosystems in the upper Midwest USA. Glob. Change Biol. 2016, 22, 3594–3607. [Google Scholar] [CrossRef] [PubMed]
  110. Mu, Z.; Huang, A.; Kimura, S.D.; Jin, T.; Wei, S.; Hatano, R. Linking N2O emission to soil mineral N as estimated by CO2 emission and soil C/N ratio. Soil Biol. Biochem. 2009, 41, 2593–2597. [Google Scholar] [CrossRef]
  111. Butterbach-Bahl, K.; Baggs, E.M.; Dannenmann, M.; Kiese, R.; Zechmeister-Boltenstern, S. Nitrous oxide emissions from soils: How well do we understand the processes and their controls? Philos. Trans. R. Soc. B 2013, 368, 20130122. [Google Scholar] [CrossRef]
  112. Gregorich, E.; Janzen, H.H.; Helgason, B.; Ellert, B. Nitrogenous gas emissions from soils and greenhouse gas effects. Adv. Agron. 2015, 132, 39–74. [Google Scholar] [CrossRef]
  113. Stehfest, E.; Bouwman, L. N2O and NO emission from agricultural fields and soils under natural vegetation: Summarizing available measurement data and modeling of global annual emissions. Nutr. Cycl. Agroecosyst. 2006, 74, 207–228. [Google Scholar] [CrossRef]
  114. Jin, V.L.; Schmer, M.R.; Stewart, C.E.; Sindelar, A.J.; Varvel, G.E.; Wienhold, B.J. Long-term no-till and stover retention each decrease the global warming potential of irrigated continuous corn. Glob. Change Biol. 2017, 23, 2848–2862. [Google Scholar] [CrossRef]
  115. Bortoletto-Santos, R.; Cavigelli, M.A.; Montes, S.E.; Schomberg, H.H.; Le, A.; Thompson, A.I.; Ribeiro, C. Oil-based polyurethane-coated urea reduces nitrous oxide emissions in a corn field in a Maryland loamy sand soil. J. Clean. Prod. 2020, 249, 119329. [Google Scholar] [CrossRef]
  116. Weiske, A.; Benckiser, G.; Ottow, J.C. Effect of the new nitrification inhibitor DMPP in comparison to DCD on nitrous oxide (N2O) emissions and methane (CH4) oxidation during 3 years of repeated applications in field experiments. Nutr. Cycl. Agroecosyst. 2001, 60, 57–64. [Google Scholar] [CrossRef]
  117. Han, B.; Li, Z.J.; Wang, Y.; Ning, T.Y.; Zheng, Y.H.; Shi, Z.Q. Effects of soil tillage and returning straw to soil on wheat growth status and yield. Trans. CSAE 2007, 23, 48–53. [Google Scholar]
  118. Venterea, R.T.; Maharjan, B.; Dolan, M.S. Fertilizer source and tillage effects on yield-scaled nitrous oxide emissions in a corn cropping system. J. Environ. Qual. 2011, 40, 1521–1531. [Google Scholar] [CrossRef]
  119. Govaerts, B.; Fuentes, M.; Mezzalama, M.; Nicol, J.M.; Deckers, J.; Etchevers, J.D.; Sayre, K.D. Infiltration, soil moisture, root rot and nematode populations after 12 years of different tillage, residue and crop rotation managements. Soil Tillage Res. 2007, 94, 209–219. [Google Scholar] [CrossRef]
  120. Almaraz, J.J.; Zhou, X.; Mabood, F.; Madramootoo, C.; Rochette, P.; Ma, B.L.; Smith, D.L. Greenhouse gas fluxes associated with soybean production under two tillage systems in southwestern Quebec. Soil Tillage Res. 2009, 104, 134–139. [Google Scholar] [CrossRef]
  121. Kihara, J.; Martius, C.; Bationo, A.; Vlek, P.L. Effects of tillage and crop residue application on soybean nitrogen fixation in a tropical ferralsol. Agriculture 2011, 1, 22–37. [Google Scholar] [CrossRef]
  122. Ding, W.; Cai, Y.; Cai, Z.; Yagi, K.; Zheng, X. Nitrous oxide emissions from an intensively cultivated maize-wheat rotation soil in the North China Plain. Sci. Total Environ. 2007, 373, 501–511. [Google Scholar] [CrossRef]
  123. Dick, J.; Kaya, B.; Soutoura, M.; Skiba, U.; Smith, R.; Niang, A.; Tabo, R. The contribution of agricultural practices to nitrous oxide emissions in semi-arid Mali. Soil Use Manag. 2008, 24, 292–301. [Google Scholar] [CrossRef]
  124. Mosier, A.R.; Hutchinson, G.L. Nitrous oxide emissions from cropped fields. J. Environ. Qual. 1981, 10, 169–173. [Google Scholar] [CrossRef]
  125. Beare, M.H.; Gregorich, E.G.; St-Georges, P. Compaction effects on CO2 and N2O production during drying and rewetting of soil. Soil Biol. Biochem. 2009, 41, 611–621. [Google Scholar] [CrossRef]
  126. Gaillard, R.; Duval, B.D.; Osterholz, W.R.; Kucharik, C.J. Simulated effects of soil texture on nitrous oxide emission factors from corn and soybean agroecosystems in Wisconsin. J. Environ. Qual. 2016, 45, 1540–1548. [Google Scholar] [CrossRef] [PubMed]
  127. Pelster, D.E.; Chantigny, M.H.; Royer, I.; Angers, D.A.; Vanasse, A. Reduced tillage increased growing season N2O emissions from a fine but not a coarse textured soil under the cool, humid climate of eastern Canada. Soil Tillage Res. 2021, 206, 104833. [Google Scholar] [CrossRef]
  128. Hargreaves, P.R.; Baker, K.L.; Graceson, A.; Bonnett, S.A.F.; Ball, B.C.; Cloy, J.M. Use of a nitrification inhibitor reduces nitrous oxide (N2O) emissions from compacted grassland with different soil textures and climatic conditions. Agric. Ecosyst. Environ. 2021, 310, 107307. [Google Scholar] [CrossRef]
  129. Jones, R.J.; Spoor, G.; Thomasson, A.J. Vulnerability of subsoils in Europe to compaction: A preliminary analysis. Soil Tillage Res. 2003, 73, 131–143. [Google Scholar] [CrossRef]
  130. Wang, H.; Yan, Z.; Ju, X.; Song, X.; Zhang, J.; Li, S.; Zhu-Barker, X. Quantifying nitrous oxide production rates from nitrification and denitrification under various moisture conditions in agricultural soils: Laboratory study and literature synthesis. Front. Microbiol. 2023, 13, 1110151. [Google Scholar] [CrossRef]
  131. Khalifah, S.; Foltz, M.E. The ratio of denitrification end-products were influenced by soil pH and clay content across different texture classes in Oklahoma soils. Front. Soil Sci. 2024, 4, 1342986. [Google Scholar] [CrossRef]
  132. Oishy, M.N.; Shemonty, N.A.; Fatema, S.I.; Mahbub, S.; Mim, E.L.; Raisa, M.B.H.; Anik, A.H. Unravelling the effects of climate change on the soil-plant-atmosphere interactions: A critical review. Soil Environ. Health 2025, 2, 100130. [Google Scholar] [CrossRef]
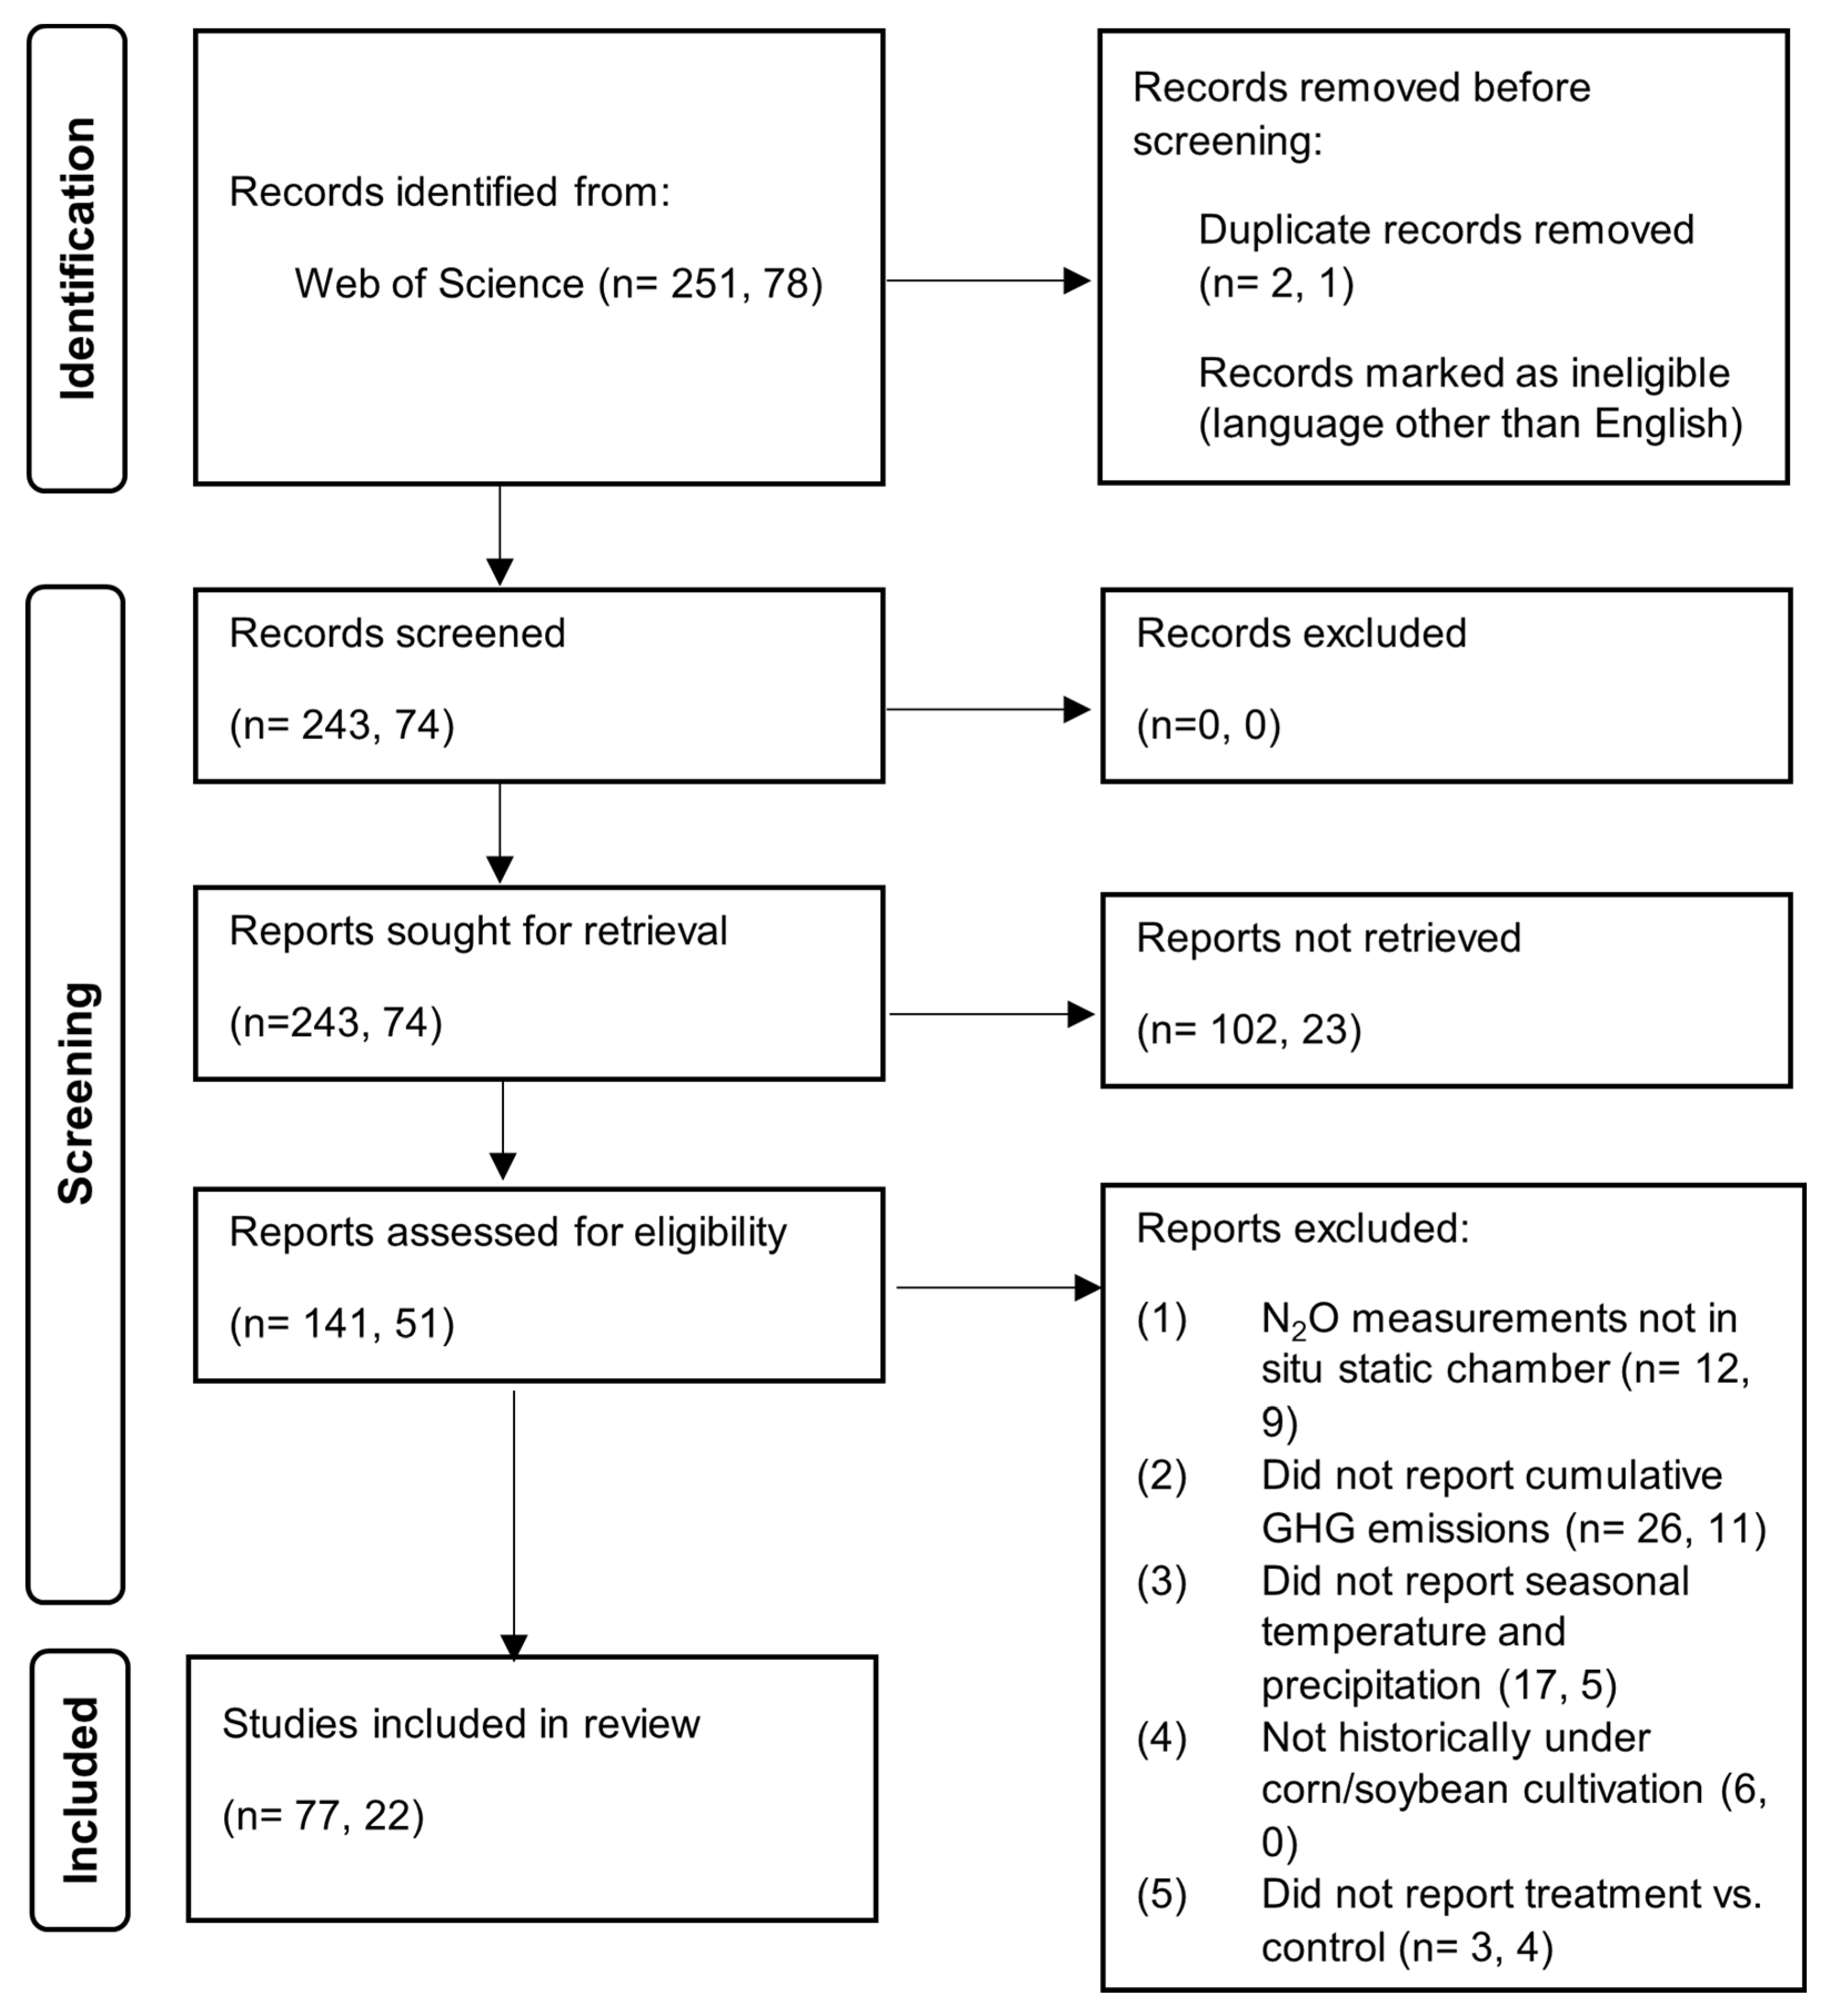
Chart 1. The PRISMA 2020 [18] flow diagram of the meta-analysis. The values inside the parentheses denote the number of studies specific to corn and soybean, in that order.
Agronomy 15 02358 ch001
Figure 1. Soil N2O emission changes as affected by fertilizer application relative to no fertilization practice over the growing season for corn (circular marker) and soybean (triangular marker). The vertical bars represent 95% confidence intervals of N2O percentage changes, and horizontal bars are standard errors of the average of N application rates in two levels of <188, and 188–400 kg N ha−1. Number of observations are within parentheses. The Cochran’s Q values were 0.58 for soybean, 8.94 for corn with N rate < 188 kg N ha−1, and 3.87 for corn with N rate 188–400 kg N ha−1. Across these categories, p-values ranged from 0.90 to 1.00 and I2 values were 0.0%, indicating statistical homogeneity among studies.
Agronomy 15 02358 g001
Figure 2. Effect of fertilizer type on the emission of soil N2O from corn fields. The vertical bars represent 95% confidence intervals of N2O percentage changes. Parentheses represent the number of observations. Vertical dotted lines indicate the fertilizer rate threshold below which comparisons among the different fertilizer types (represented by colored circles) were conducted. Cochran’s Q values were 0.66 for organic fertilizer (<188 kg N ha−1), 0.27 for organic fertilizer (188–400 kg N ha−1), 1.53 for urea (<188 kg N ha−1), 0.26 for urea (188–400 kg N ha−1), 0.51 for urea + ammonium nitrate (<188 kg N ha−1), 0.03 for urea + ammonium nitrate (188–400 kg N ha−1), 1.27 for ammonium nitrate (<188 kg N ha−1), 0.21 for ammonium nitrate (188–400 kg N ha−1), and 0.15 for anhydrous ammonia (<188 kg N ha−1). Across all categories, p-values ranged from 0.90 to 1.00 and I2 values were 0.0%, indicating homogeneity among studies.
Agronomy 15 02358 g002
Figure 3. Soil N2O emissions as affected by tillage compared to no-till over the growing season for corn (circular marker) and soybean (triangular marker). Positive values indicate increases in emissions. The vertical bars represent 95% confidence intervals of N2O percentage changes. Parentheses represent the number of observations. The Cochran’s Q values were 1.75 for soybean (0 kg N ha−1), 0.16 for corn (0 kg N ha−1), 0.74 for corn (N rate < 188 kg N ha−1), and 0.55 for corn (N rate 188,400 kg N ha−1). Across these categories, p-values ranged from 0.90 to 1.00 and I2 values were 0.0%, indicating statistical homogeneity among studies.
Agronomy 15 02358 g003
Figure 5. Soil N2O emissions as affected by precipitation [27,30,31,32,33,34,36,37,38,39,40,41,42,43,44,46,47,48,49,50,51,53,54,55,56,57,58,59,60,61,62,63,64,65,66,67,71,72,73,74,75,76,77,78,79,80,81,85,86,87,88,89,90,91,92,93,94,95,96,97,98,100,101,102,103,105,106,107,109,114,116] and mean air temperature [27,31,33,34,36,37,38,41,42,43,44,46,47,48,49,50,51,52,53,54,55,56,57,62,63,64,65,66,67,71,72,73,74,75,76,77,78,79,80,81,86,87,88,91,92,93,94,95,96,98,100,101,102,103,106,107,108,109,114] over the growing season for corn and soybean. Bars represent 95% confidence intervals (CIs). Values in parentheses are the number of observations.
Agronomy 15 02358 g005
Figure 6. PCA Plot of environmental and anthropogenic factors along with soil N2O flux from corn fields categorized by tillage activity (A), soil texture (B), and fertilizer type (C). The Factors are soil pH (pH), seasonal air temperature (Temp), seasonal precipitation (Precip), Soil N2O Flux (NFlux), and Nitrogen fertilizer rate (Nrate).
Agronomy 15 02358 g006aAgronomy 15 02358 g006b
Figure 7. Correlation matrix for the environmental and anthropogenic factors affecting soil N2O flux from corn fields.
Agronomy 15 02358 g007
Figure 8. Principal component analysis (PCA) plot of environmental and anthropogenic factors along with soil N2O flux from soybean fields categorized by tillage activity (A), soil texture (B). The Factors are soil pH (pH), seasonal air temperature (Temp), seasonal precipitation (Precip), Soil N2O Flux (NFlux).
Agronomy 15 02358 g008
Figure 9. Scree plots with parallel analysis results for principal component retention. Panel (A) shows the analysis for corn data, and Panel (B) shows the analysis for soybean data.
Agronomy 15 02358 g009
Table 3. Soil N2O emission (kg N2O-N ha−1 season−1) for the corn and soybean seasons as affected by tillage and No fertilizer, <188, and 188–400 kg h−1 fertilizer rates. Data shows soil N2O flux. Same lowercase letters indicate no significant difference in each column for each land use. CI represents confidence intervals.
Land UseTreatmentObs 1No Fertilizer95% CI<18895% CI188–40095% CI
Corn 2Tilled4, 23, 151.74 a0.83–2.191.53 a0.68–3.394.07 a2.96–5.54
No-tilled4, 12, 112.49 a0.66–3.502.11 a0.78–4.454.67 a2.96–6.31
Soybean 3Tilled240.71 a0.33–1.49----
No-tilled150.73 a0.30–1.50----
1 Number of observations for N rates of zero, <188, and 188–400 kg ha−1, respectively. 2 References: [40,58,59,73,74,77,79,82,84,85,93,94,95,114]. 3 References: [59,81,82,86,102].
Table 4. Percentage of each variable, soil pH (pH), Nitrogen fertilizer rate (N-rate), seasonal air temperature (Air-Temp), seasonal precipitation (Precipitation), and N2O flux (N-flux) in the first two components (PC1, PC2) that represent the largest amount of variance.
Variable/Principle ComponentPC1PC2
pH−0.550.37
N-rate0.160.49
Air-Temp (seasonal)−0.200.60
Precipitation (seasonal)0.650.00
N-Flux0.460.52
Disclaimer/Publisher’s Note: The statements, opinions and data contained in all publications are solely those of the individual author(s) and contributor(s) and not of MDPI and/or the editor(s). MDPI and/or the editor(s) disclaim responsibility for any injury to people or property resulting from any ideas, methods, instructions or products referred to in the content.