Article

Improving Air Distribution Within Lettuce Plant Canopy by Employing Double-Channel Ventilation Cultivation System: Simulation and Experiment Study

Institute of Environment and Sustainable Development in Agriculture, Chinese Academy of Agricultural Sciences, Beijing 100081, China
*
Author to whom correspondence should be addressed.
Agronomy 2025, 15(10), 2326; https://doi.org/10.3390/agronomy15102326
Submission received: 5 September 2025 / Revised: 25 September 2025 / Accepted: 29 September 2025 / Published: 1 October 2025

Abstract

In greenhouse and plant factory production, improper design of the ventilation system and increasing scales will lead to a stagnant airflow zone, which could inhibit plant growth and induce physiological disease, such as tipburn. To increase the airflow within the plant canopy, simplify the equipment complexity, and improve operation convenience, a cultivation system was designed to provide a constant airflow within the plant canopy by integrating ventilation ducts with cultivation tanks. A three-dimensional computational fluid dynamics (ANSYS Fluent 2021R2) model was developed and validated through simulating the airflow distribution within the plant canopy under different intake air velocities. According to the simulated results, an intake air velocity of 10 m s−1 showed better airflow uniformity, and the proportion of the suitable zone reached the highest value of 83% at an intake air velocity of 20 m s−1. To validate the practical effectiveness of cultivation, a cultivation experiment was conducted. Five different canopy air velocities were set at 0 (CK), 0.35 (T1), 0.5 (T2), 0.65 (T3), and 0.8 (T4) m s−1, respectively. The results showed that the photosynthetic and transpiration rate, as well as the fresh and dry weights of lettuce plants (Lactuca sativa cv. ‘Tiberius’), increased by 17.8%, 21.7%, 29.6%, and 29.9%, respectively, under treatment T4 compared to those under the control, while the canopy air temperature and relative humidity decreased by 1.3 °C and 3.2%, respectively. The above results indicate that the newly designed cultivation system can be considered an effective system for improving lettuce plant growth and its canopy environment.

1. Introduction

Protected agriculture is an important agricultural form for ensuring food security and achieving sustainable agriculture. Compared to open-field agriculture, protected agriculture enables efficient year-round plant production through the precise regulation of environmental factors such as temperature, humidity, air velocity, light, and CO2 concentration, while overcoming geographical and temporal limitations in plant cultivation [1,2,3]. However, as the scale of greenhouses and plant factories expands, conventional environmental control methods dominated by whole-environment control can no longer meet the requirements for the precise regulation of environmental factors such as airflow, resulting in low air velocities within the plant canopy, leading to spatial heterogeneity in temperature, humidity, and CO2 concentration [4]. Previous studies have demonstrated that prolonged exposure to such conditions adversely affects plant quality and yield, while also increasing susceptibility to diseases [5].
The airflow plays a significant role in plant growth. Airflow can affect the photosynthesis and transpiration rates of plants by improving the gas diffusion in the leaf boundary layer [6]. The optimal air velocity for promoting plant growth ranges from 0.3 to 0.7 m s−1, and horizontal air velocities between 0.28 m s−1 and 1.04 m s−1 have been found to effectively enhance plant transpiration [7]. Increasing canopy air velocity from 0.05 m s−1 to 0.6 m s−1 significantly elevated the net photosynthesis and transpiration rates of tomato plants, resulting in a 1.9-times increase in the net photosynthesis rate [8,9]. Similar findings were observed in cucumber seedlings, where an increase in air velocity from 0.02 to 1.3 m s−1 led to a substantial enhancement in canopy net photosynthesis and transpiration rates. Specifically, the net photosynthesis rate increased by 1.2 times, and the transpiration rate increased by 2.8 times for the entire canopy. Additionally, for individual leaves, the net photosynthesis rate increased by 1.7 times, and the transpiration rate increased by 2.1 times [10]. Furthermore, air velocity can influence the stomatal conductance of plants. Stomatal conductance reflects the extent of stomatal opening, which in turn impacts photosynthesis, cellular respiration, and transpiration. Vertical airflow with a velocity of 0.7 m s−1 reduced the resistance of H2O and CO2 by improving the stomatal conductance [11]. And air velocity ranging from 0 to 0.8 m s−1 had no negative effect on stomata opening [12].
In addition to studying air velocity in crop canopies, many research studies have been conducted on airflow patterns. An appropriate ventilation system was essential for controlling environmental parameters that affect plant growth [13]. In greenhouses and plant factories, some devices were developed to control the air velocity within the optimal range [14]. An airflow pattern with the horizontal or vertical direction was often applied in protected agriculture [13]. Compared to horizontal airflow, vertical airflow was more suitable for plant growth and disease prevention [11,15]. Research studies have shown that the vertical downward airflow with a velocity exceeding 0.3 m s−1 can effectively enhance plant net photosynthesis and transpiration rates [12]. And in vertical airflow, a downward ventilation system can provide a more uniform airflow than an upward ventilation system [13].
The above findings indicated that providing constant airflow to the canopy can effectively improve the canopy environment and promote plant growth. However, currently available ventilation systems commonly include extra micro-fans or air ducts, which are usually put on one side of the cultivation module, resulting in uneven distribution of airflow and environmental factors (temperature and relative humidity) within the canopy due to the singular airflow direction. Additionally, additional installation of ventilation ducts is required, which increases the complexity of the equipment and decreases the operational convenience. Therefore, a ventilation system that can effectively improve the canopy environment without needing additional ventilation pipes is needed to avoid the above problems.
Computational fluid dynamics (CFD) is a software (ANSYS Fluent 2021R2) used for predicting fluid flow, heat and mass transfer, and related physical phenomena. It involves solving fluid control equations to model fluid problems and visualizing the results through graphical simulations [16]. Currently, CFD has proven to be effective in analyzing aerodynamics, climate, and complex fluid problems in protected agriculture [17]. The k-epsilon turbulence model in CFD software is widely used to simulate the airflow distribution under different intake and outlet openings in a plant factory [18]. Based on the results, improvements and optimizations were made to the existing ventilation system. Li (2019) used CFD software to design a device capable of ventilating the root zone of plants, effectively enhancing airflow uniformity and improving various microenvironmental parameters in both the aboveground and underground parts of plants [19].
Therefore, to improve the airflow distribution within the plant canopy and reduce the complexity of equipment, the objective of this study was to design a cultivation device that integrates a cultivation tank with ventilation ducts. CFD software was utilized to simulate the airflow distribution within the cultivation space under different intake air velocities. The optimal intake air velocity was determined through airflow uniformity. Practical plant cultivation experiments were conducted with different air velocities within the plant canopy. The optimal ventilation strategy was determined according to the growth and electric use efficiency of lettuce plants. This study will provide valuable insights into the design of advanced cultivation systems, with potential applications in greenhouses and plant factories, where optimized microenvironments can lead to more consistent crop production and a reduction in operational costs.

2. Materials and Methods

2.1. Numerical Simulation

2.1.1. The Model Geometry and Grid Generation

The structure of the cultivation tank is shown in Figure 1. The length and width of the cultivation tank were 1.1 m and 0.12 m, respectively. In this study, 7 planting holes were set on the cultivation board with a spacing of 150 mm between each hole (Figure 2). And 13 ventilated holes with a diameter of 5 mm were staggered and set on both sides of the cultivation tank (Figure 3). The distance between two ventilated holes was 180 mm according to the position of the planting holes.
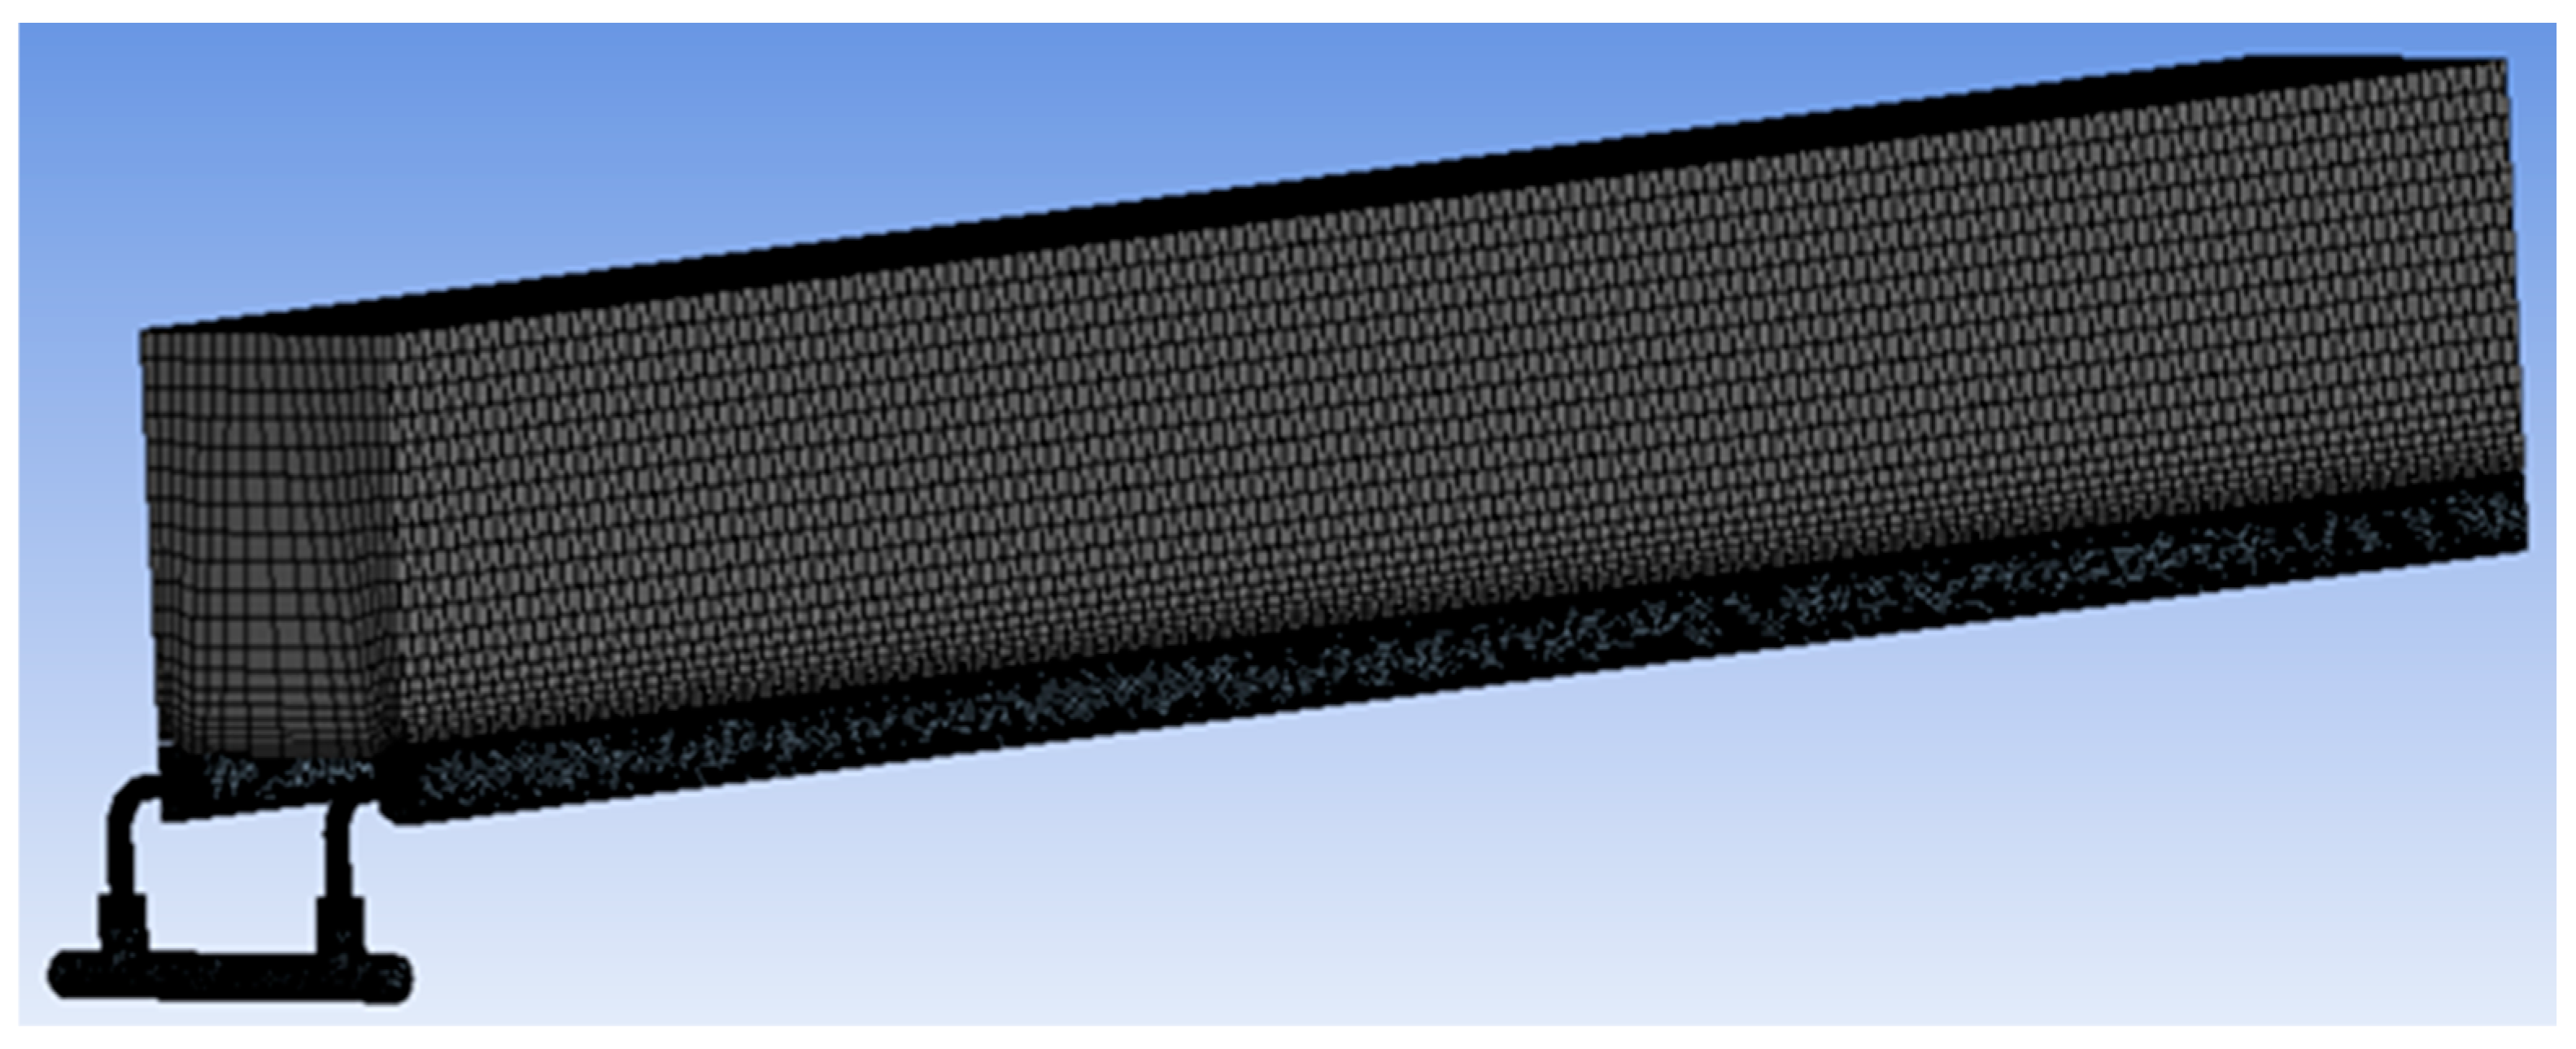
The model geometry and grid generation were assessed using ANSYS Fluent 2021R2 (Figure 4). In this model, the three-dimensional space of 180 mm above the cultivation board was considered as the canopy zone.
For grid independence analysis, the initial mesh (with an initial cell height of 0.01 m) satisfied the convergence criteria for the steady-state condition. To improve the mesh quality and calculation accuracy, the mesh was encrypted on the near-wall surface of the ventilation pipe. Different numbers of meshes (from 50 thousand to 500 thousand) were tested, and 253,677 meshes and 549,733 nodes were selected to achieve a balance between mesh quality and convergence speed. The canopy area was meshed with tetrahedral elements, while the pipeline area was meshed with hexahedral elements. And the quality of the grid was verified through the analysis of skewness, the aspect ratio, and orthogonality. The mesh quality parameters are shown in Table 1. And these parameters indicate that the mesh quality meets the standard and can be used for further simulation [20].

2.1.2. The Numerical Approach

In this study, the distribution of airflow in the crop canopy was mainly affected by the structure of the cultivation tank and the intake air velocity. The fluid flow in the problem domain was assumed to be a steady-state, incompressible, and three-dimensional turbulent. The numerical calculation of airflow can be seen as a mathematical formula for the conservation law of fluid mechanics. In this model, the momentum equation was used, and the k ε turbulence model was selected to solve for the turbulent kinetic energy (k) and the viscous dissipation rate of turbulent energy ( ε ). By applying the mass and momentum conservation, as well as the fundamental governing equations of fluid dynamics, the continuity (1) and momentum (2) can be written as follows [20]:
ρ t + x i ( ρ u j ) = 0
t ( ρ u i ) + x j ( ρ u i u j ) = x i [ ρ δ i j + μ ( u i x j + u j x i ) ] + ρ g i
where ρ is the fluid density (kg m−3); t is time (s); x denotes the cartesian coordinates (m); u is the velocity component (m s−1); i and j are cartesian coordinate indices; δ is Kroneckor delta; and g is acceleration due to gravity (m s−2).

2.1.3. Boundary Conditions

The airflow inlet was set as the velocity inlet, and the 5 surfaces around the plant canopy were set as the pressure outlet. The interior of the pipeline was set as the airflow zone. In this study, 8 air velocity gradients were set according to other research studies on the optimal range of intake air velocity, which were 5, 6, 7, 8, 9, 10, 15, and 20 m s−1 [21]. As it is impossible to represent the realistic structure of lettuce in the CFD model, we simplified the lettuce canopy as a porous zone with a viscous resistance of 25 and an inertial resistance of 1.3 [22]. The porous zone has become the most common method used in greenhouse microclimate simulations, as it can accurately simulate the plant canopy through simple equations, and it is adaptable [23]. A non-slip wall condition was used for all walls in the model. The boundary conditions are summarized in Table 2.

2.1.4. Solver Settings

The SIMPLE algorithm for pressure–velocity coupling was selected to solve Equations (1) and (2) [24]. For spatial discretization, a least-squares cell-based scheme was employed for the gradient term. First-order upwind discretization schemes were used for the viscous terms of the governing equations to achieve a better convergence of calculations [25]. The convergence criterion was set to be 10−3 on the viscous term and continuity term. And the pressure scheme was selected as the second order. The solver settings were set with reference to the studies by [26]. A laptop (Lenovo, Y7000P, Lenovo, Shenzhen China Inc., Shenzhen, China) with Intel i7-12700H (14 cores, 4.7 GHz, 32 GB) was used to calculate the CFD model. The number of iterations was set to 1000, and all equations achieved convergence.

2.2. Practical Cultivation Experiment Setup

To verify the feasibility of the cultivation tank, a practical cultivation experiment was conducted. In the cultivation experiment, 5 gradient levels of air velocities within the plant canopy were set to explore the effects of different air velocities on lettuce growth and the canopy environment. The photosynthetic and growth indicators of lettuce plants were measured, and the electrical energy utilization efficiency of lettuce plants was calculated. As for the canopy environment indicators, the air temperature and relative humidity of the plant canopy were measured and recorded.

2.2.1. Cultivation Tank Design and Treatment Setup

The study was conducted between March 2023 and April 2023 in a Venlo greenhouse (10.0 m long × 8.0 m wide × 6.0 m high) located at the Chinese Academy of Agricultural Sciences, Beijing (116°20′ E, 39°56′ N), China. The structure and detailed parameters of the cultivation tank have been provided in Section 2.1.1. The cultivation tank was made of white PVC plastic material.
Previous studies have proved that the optimal air velocity range for lettuce growth was 0.3–1.0 m s−1 [7,27]. Therefore, the experiment was conducted at five different levels of canopy air velocities of 0 (CK), 0.35 m s−1 (T1), 0.5 m s−1 (T2), 0.65 m s−1 (T3), and 0.8 m s−1 (T4). The air velocity was provided by an air ventilator (JYF-75pqs, Shenzhen, China). The canopy air velocity can be maintained at the desired value by adjusting the power of the ventilator. The air velocity within the plant canopy was calculated as the average of 12 points measured along each cultivation tank.

2.2.2. Plant Preparing

Three hundred lettuce seeds (Lactuca sativa cv. ‘Tiberius’) were germinated in sponge cubes and incubated for 2 days in a growth chamber in the dark at an air temperature of 23.5 °C. On day 3, seedlings were transferred to a plant factory with a PPFD of 150 μmol m−2 s−1 using fluorescent lamps (ZPDT812WW-75, ZSP Technology Co., Shenzhen, China). On day 15, 140 uniform-sized seedlings were selected and transferred to the greenhouse with a planting density of 28 plants m−2 and a spacing of 0.15 m. The Yamazaki lettuce nutrient solution was selected as the nutrient solution (Table 3). And the nutrient solution was circulated once a day. The light source was the sunlight. Lettuce of each treatment was grown under the same light environment.

2.2.3. Plant Measurements

On day 28 after transplant, fresh and dry weights of shoots and roots, the number of leaves per plant, and total leaf area were measured. The fresh weights of shoots and roots were measured using an electronic scale (GL6202-1SCN, Sartoriu, Göttingen, Germany). Shoots and roots were dried in an oven at 80 °C for 72 h. Total leaf area was measured using a leaf area meter (Li-3100C, LI-COR, Lincoln, USA). Ten plants were chosen randomly from each treatment for measurement.

2.2.4. Gas Exchange Measurements

On day 28 after transplant, the photosynthetic rate, transpiration rate, stomatal conductance, and intercellular carbon dioxide concentration were measured using a portable infrared gas analyzer equipped with a leaf cuvette fluorometer (LI-6400, LI-COR, Lincoln, NE, USA). Ten plants were chosen at random from each treatment for measurement. The environmental parameters in the leaf chamber during measurement were set as follows: air temperature at 24 °C, carbon dioxide concentration at 450 μmol mol−1, light intensity at 300 μmol m−2 s−1, and the ratio of red to blue light at 3:1.

2.2.5. Efficiency of Electric Energy Utilization

In this study, only the ventilator consumed electrical energy. The efficiency of electric energy utilization was expressed as the increase in lettuce fresh weight for every 1 kW·h of electricity consumed, and it can be calculated using the following equation [28]:
E U E = D × S × ( S F W E S F W C ) W
where EUE is the efficiency of increase in the lettuce fresh weight for every 1 kW·h of electricity consumed (g/kW·h), D is the planting density, S is the cultivated area (m2), SFWE is the lettuce fresh weight of the experimental group (g), SFWC is the lettuce fresh weight of the control group (g), and W is the electric energy consumed by the ventilator (kW·h).

2.2.6. Environmental Parameters Measurements

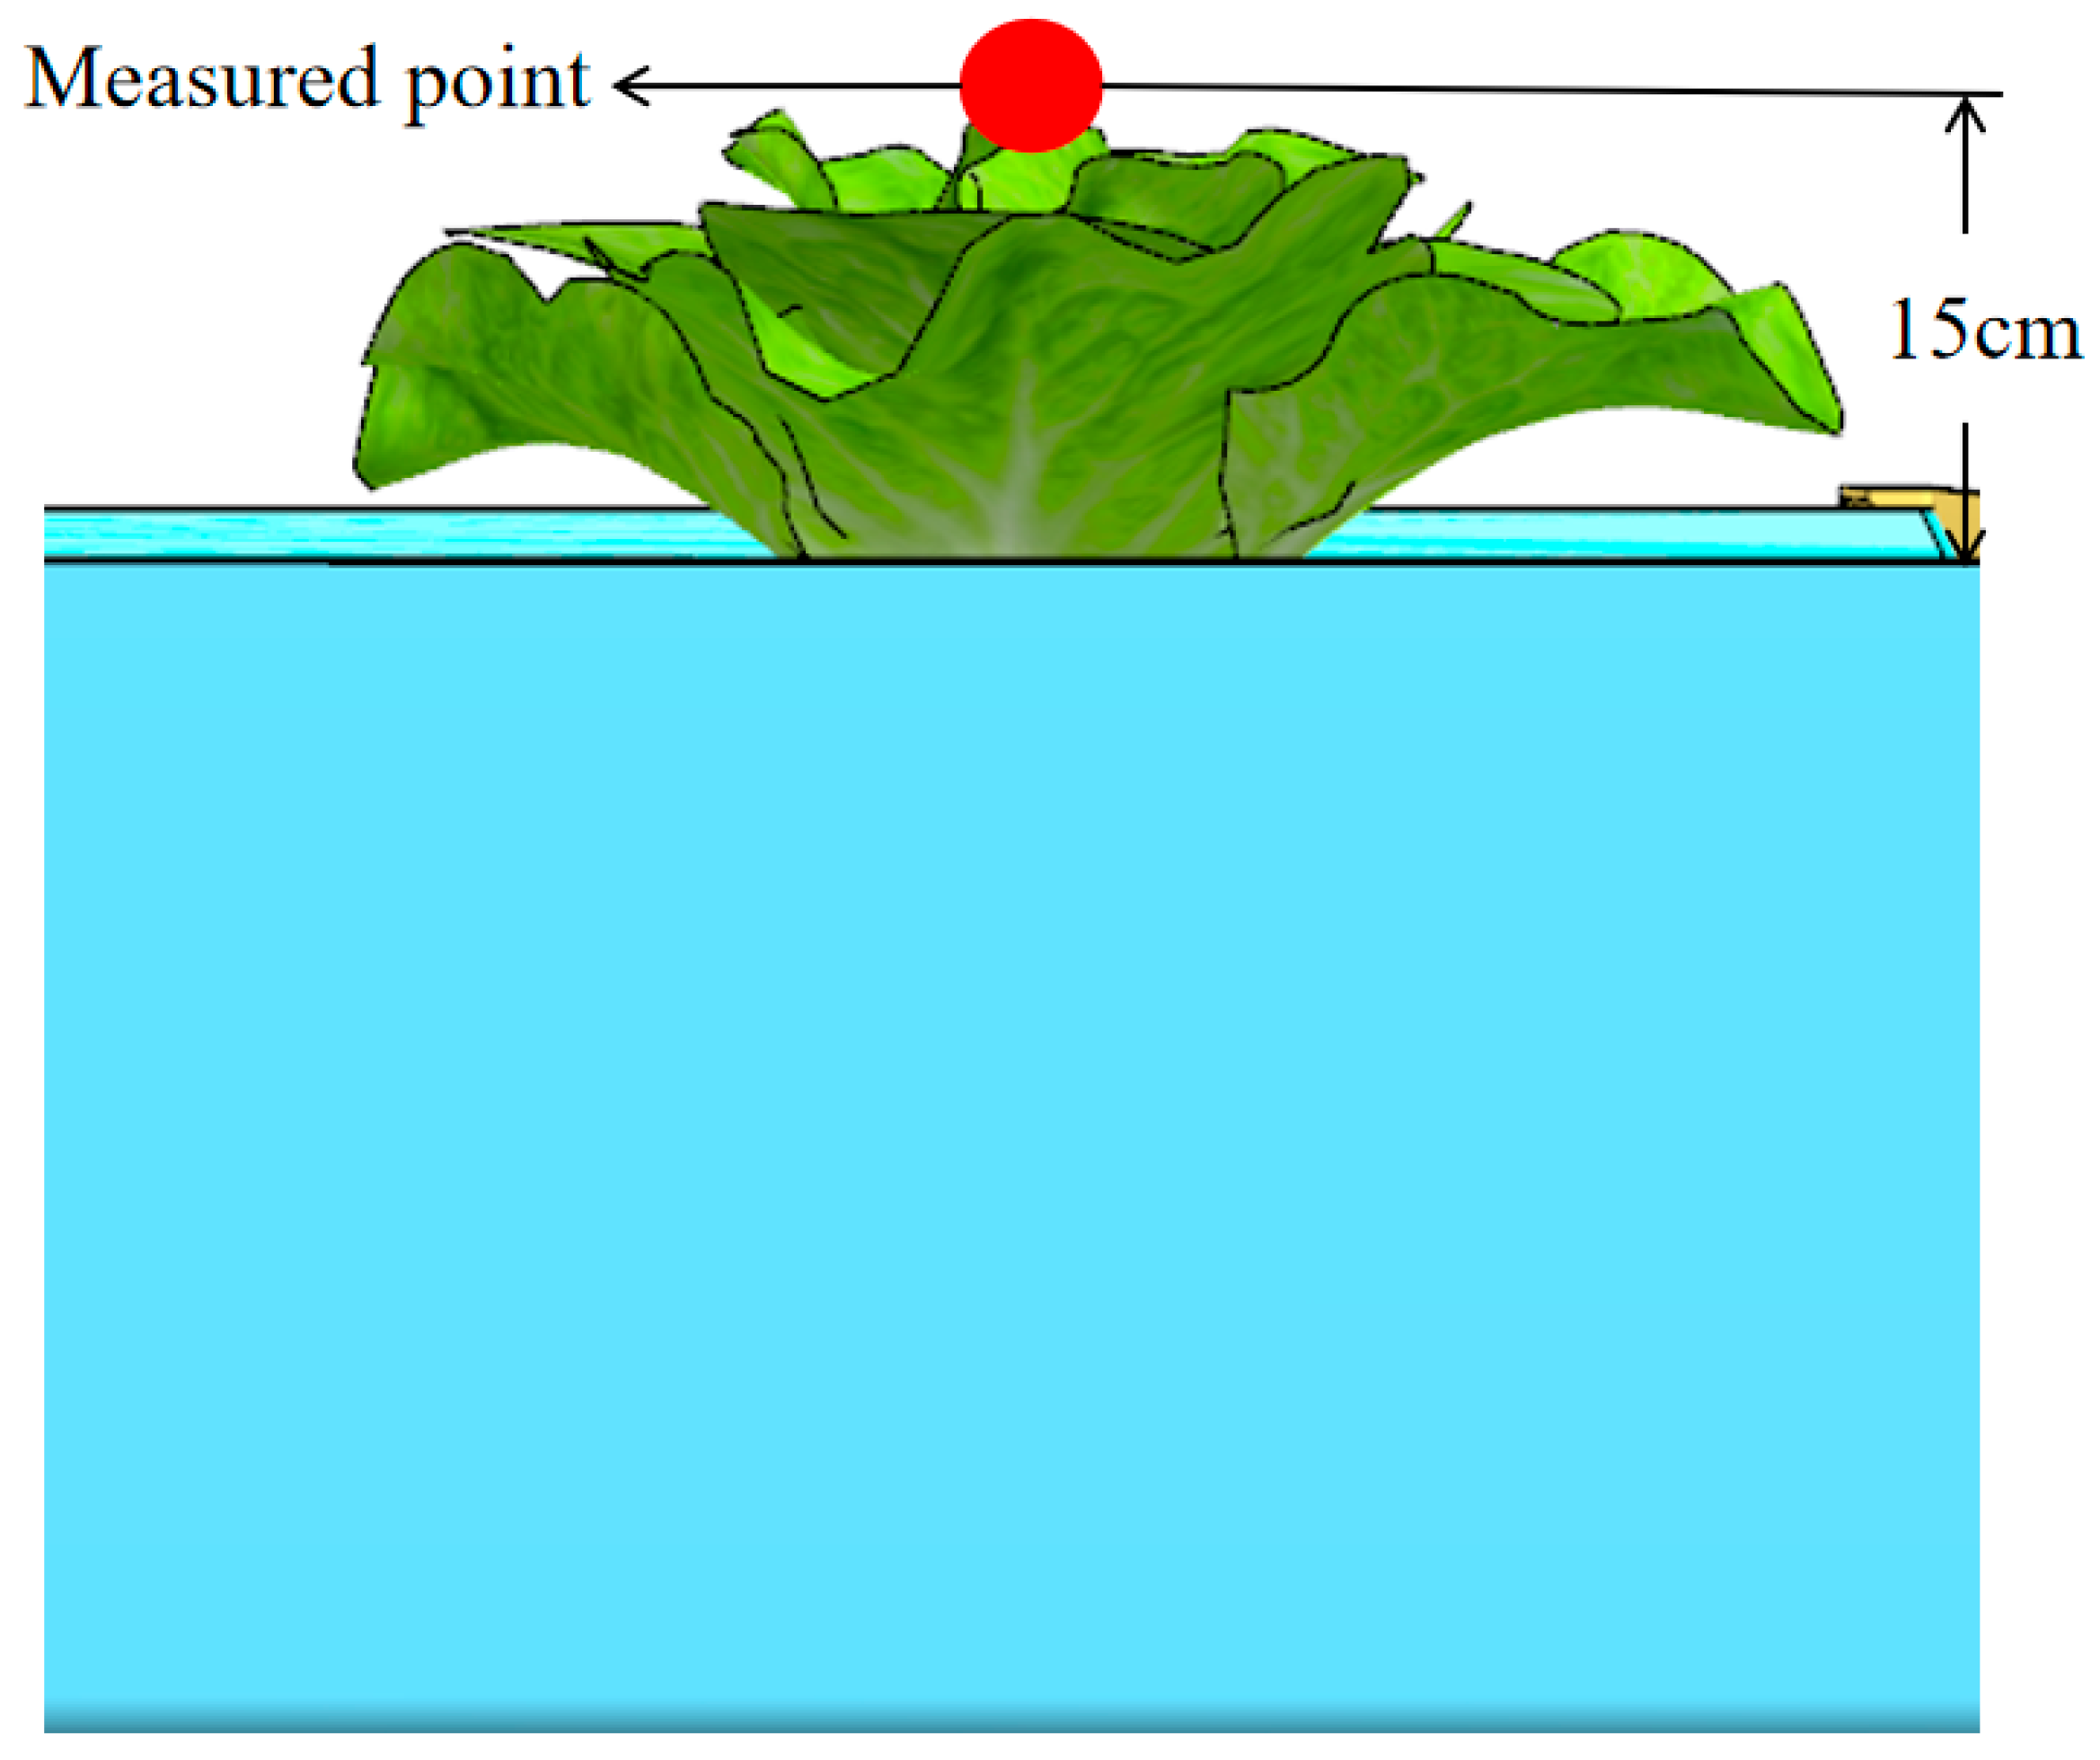
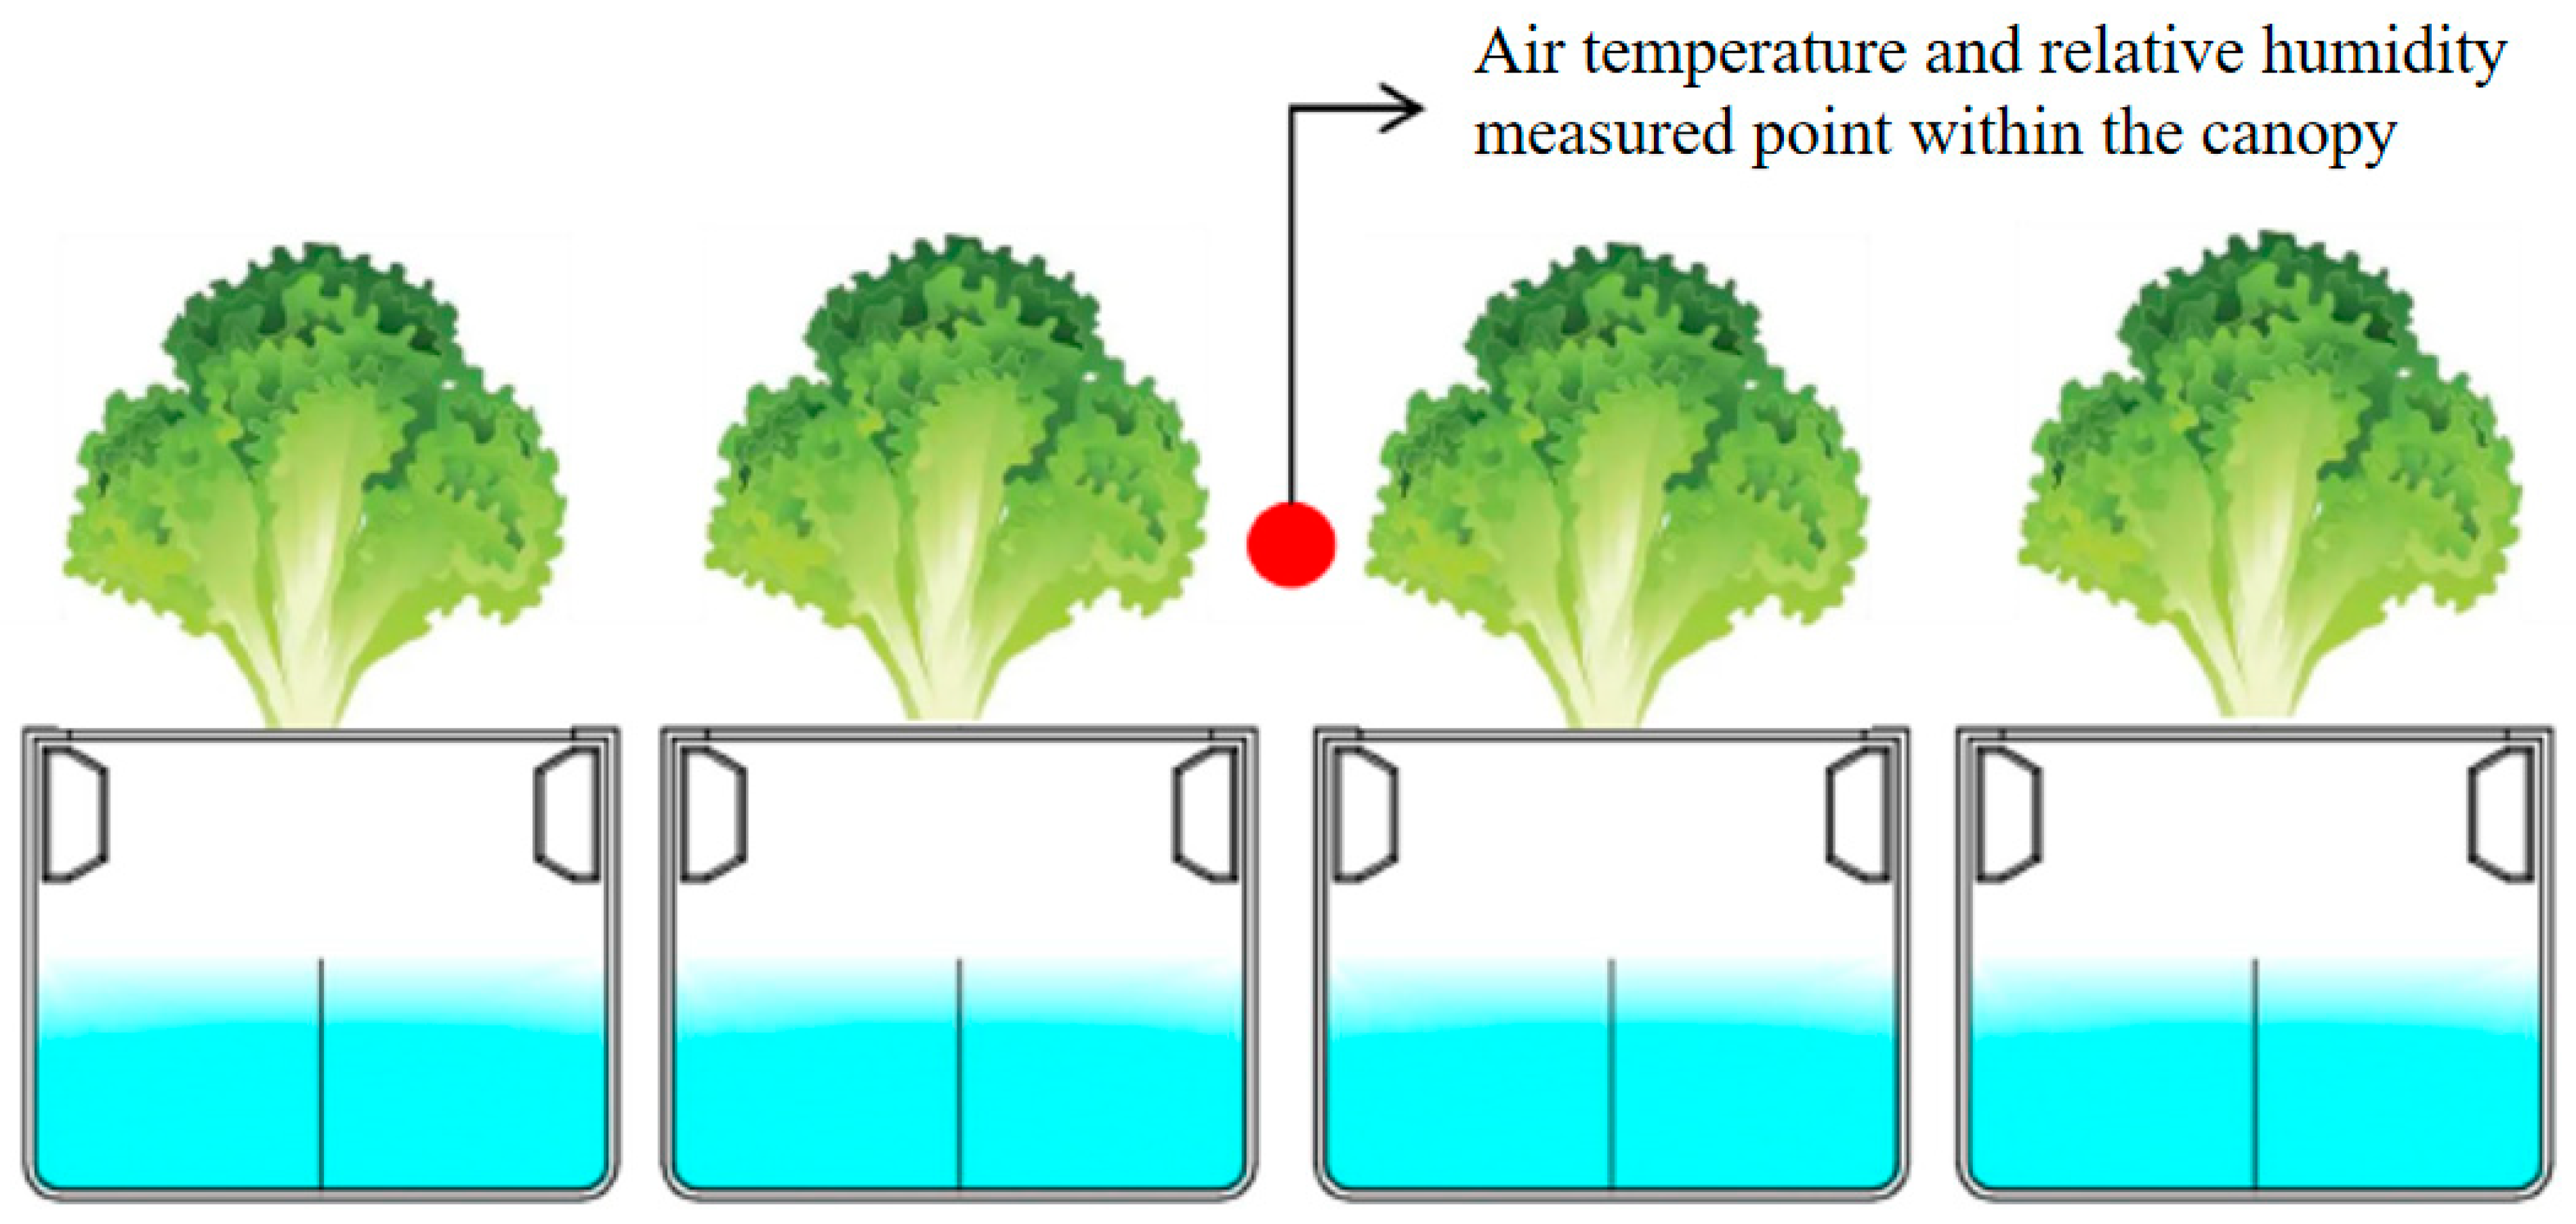
On day 28 after transplant, the air velocity in the plant canopy was measured by an infrared hot-wire anemometer (Climomaster6501-BG, KANOMAX, Osaka, Japan) along the cultivation tank. Sensors (LR5001, HIOKI, Nagano, Japan) were used to record the air temperature and relative humidity within the plant canopy for 28 days. The air velocity-measured points and canopy environment parameter-measured points are shown in Figure 5 and Figure 6.

2.3. Statistical Analysis

Statistical analysis was carried out using SPSS 16.0 (SPSS Inc., Chicago, IL, USA) statistical software. In this study, the only difference among the treatments was the canopy airflow velocity. Therefore, the effects of treatments on measured plant growth and photosynthetic parameters were evaluated by a one-way ANOVA. Prior to the ANOVA, the data were tested for normality using the Shapiro–Wilk test and for homogeneity of variances using Levene’s test. Separation of means was performed using Tukey’s multiple range test at p ≤ 0.05. Moreover, a t-test was used to determine the difference between the simulated and measured values.

3. Results and Discussions

3.1. Numerical Simulation: Model Validation

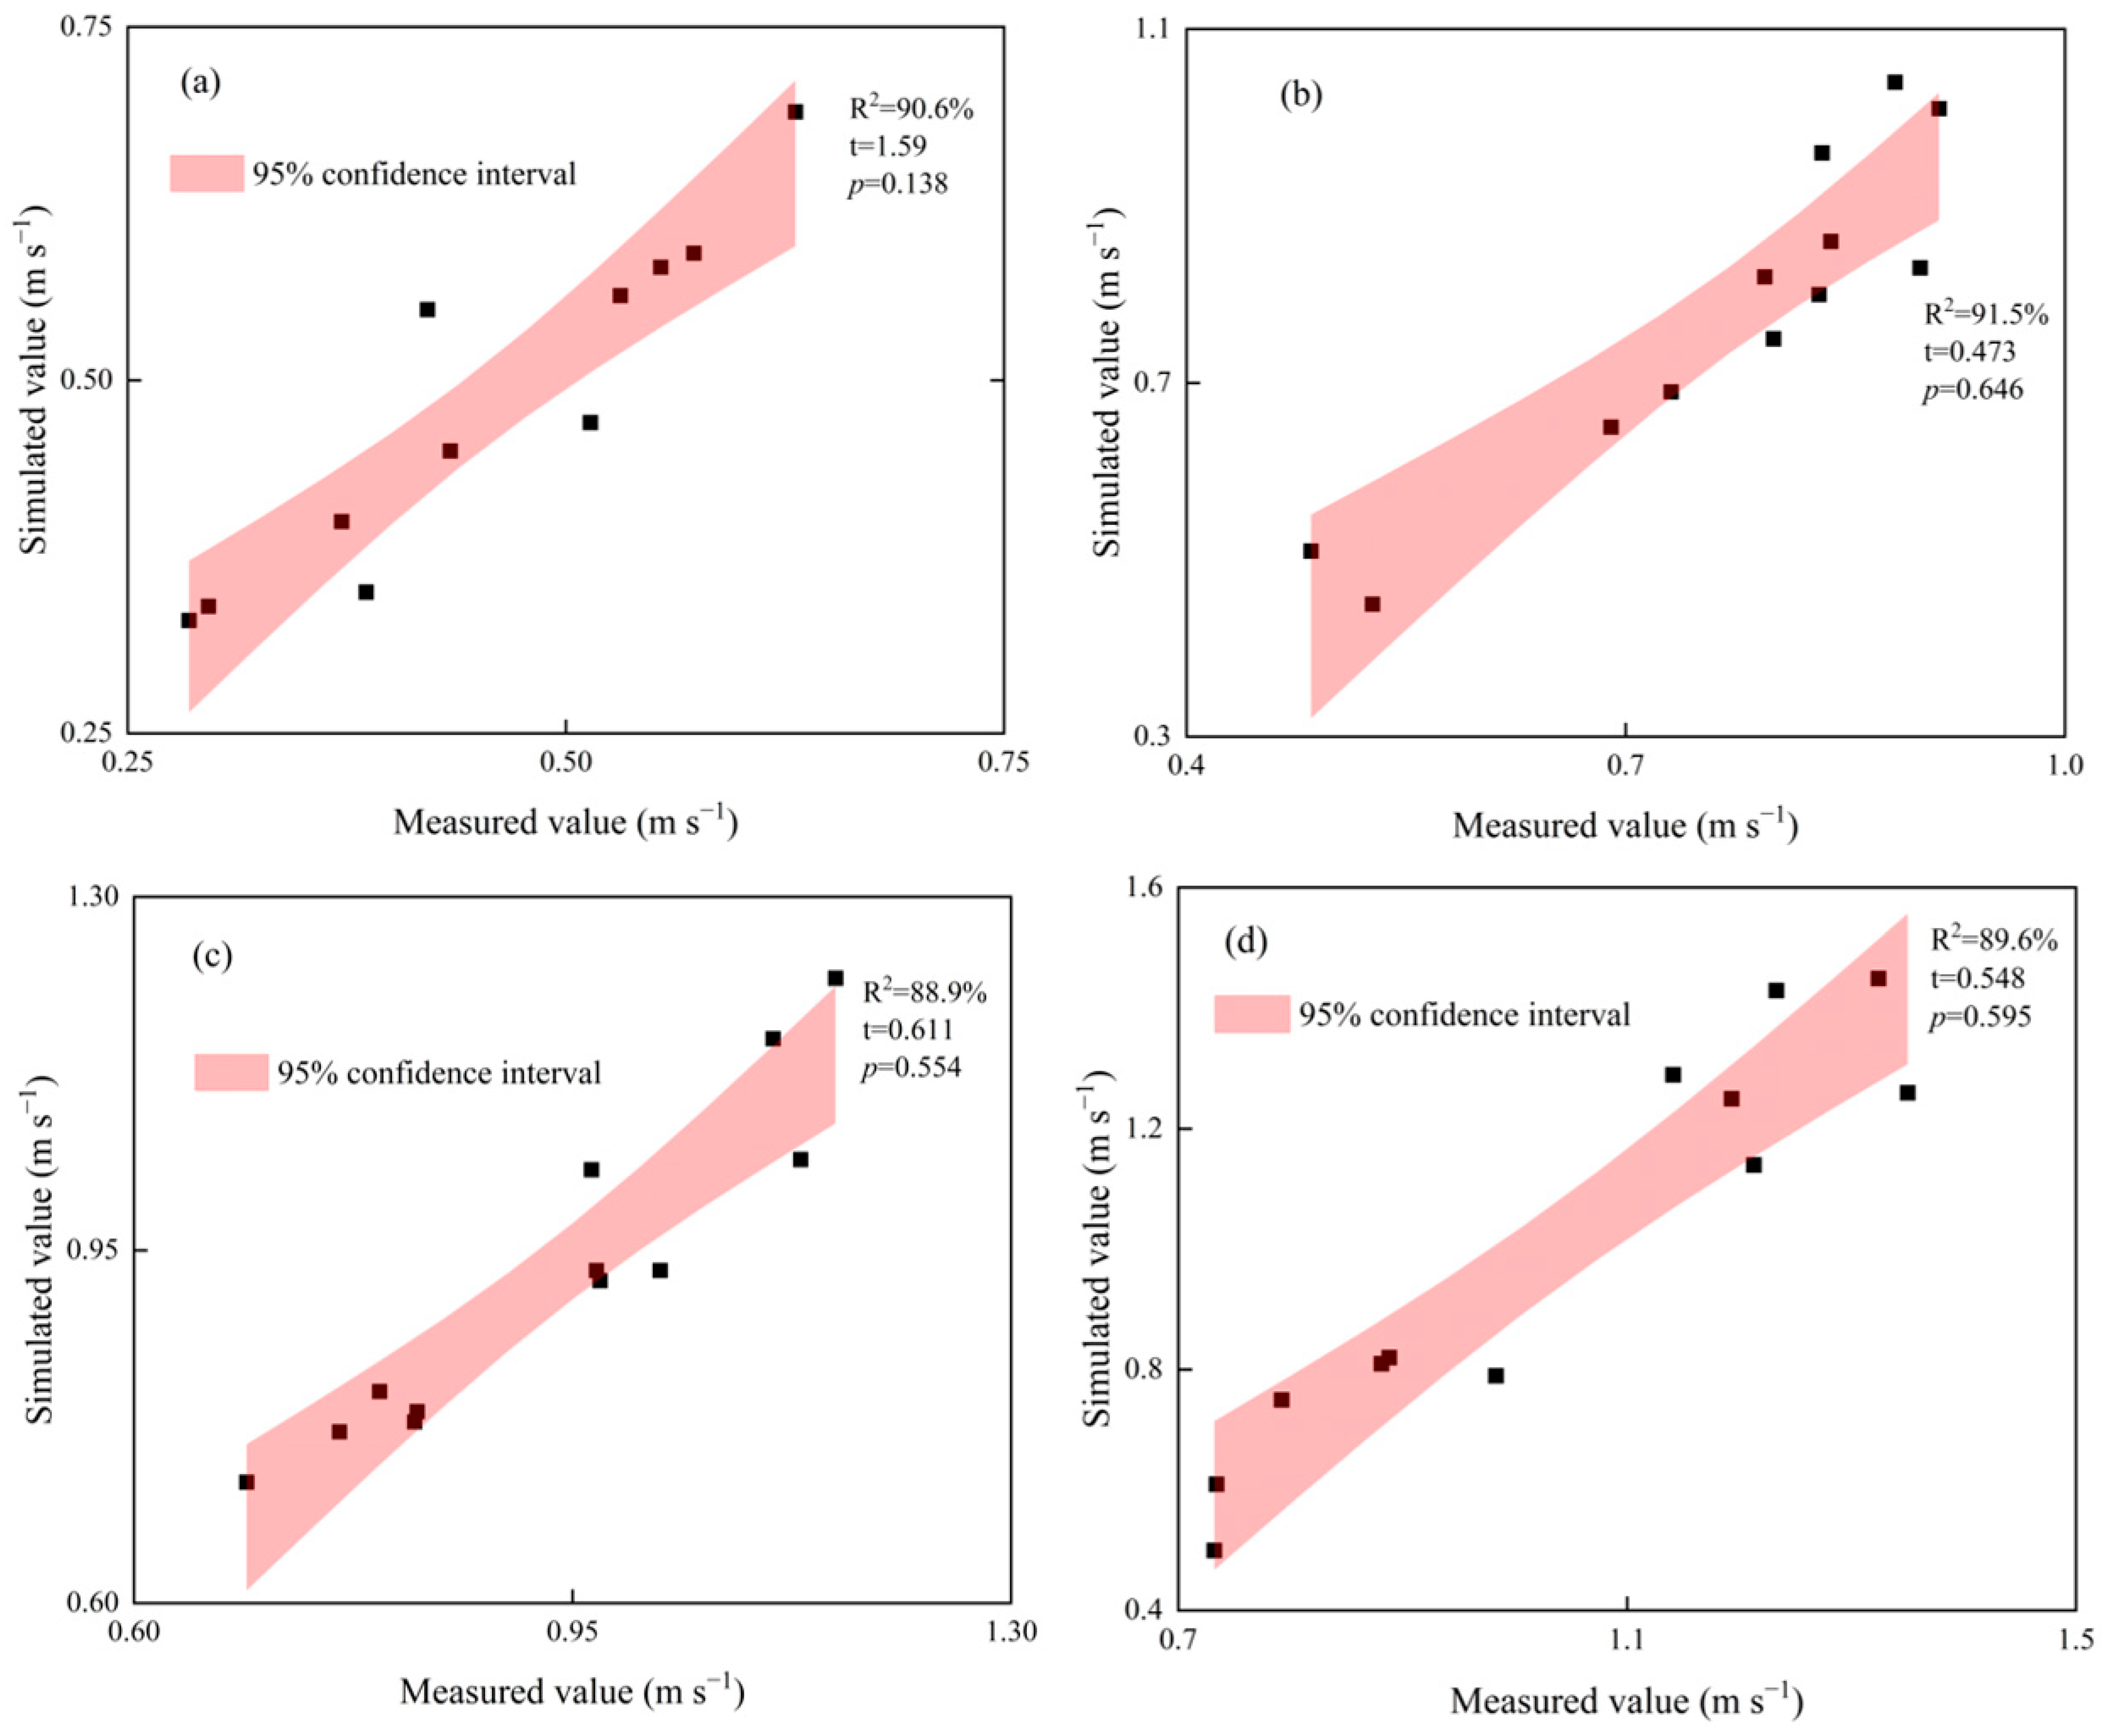
To evaluate the accuracy of the model, differences between the simulated and measured values were compared at intake air velocities of 5, 10, 15, and 20 m s−1. The simulated air velocities at 12 points were compared to those at the same points from the experimental measurements in the single cultivation tank interior domain. Model prediction accuracy was evaluated by comparing the mean relative error (MRE), mean absolute error (MAE), and root mean square error (RMSE) for each individual point between the measured and simulated data. The results showed that the prediction accuracy of the 3D CFD model for air velocity in the plant canopy had MRE values of 8.5%, 3.3%, 8.3%, and −4.8%, MAE values of 0.05, 0.07, 0.1, and 0.08, and RMSE values of 0.07, 0.09, 0.11, and 0.08, respectively, when compared to the measured values. And the simulated values exhibited consistent trends with the measured values under different intake air velocities (Figure 7), indicating that the model accuracy meets the standard [29]. And the t-test also showed that there were no significant differences between simulated and measured values (the t and p values are shown in Figure 7).

3.2. Computational Simulation: Design of a Cultivation Tank

3.2.1. Airflow Patterns with Different Intake Air Velocities

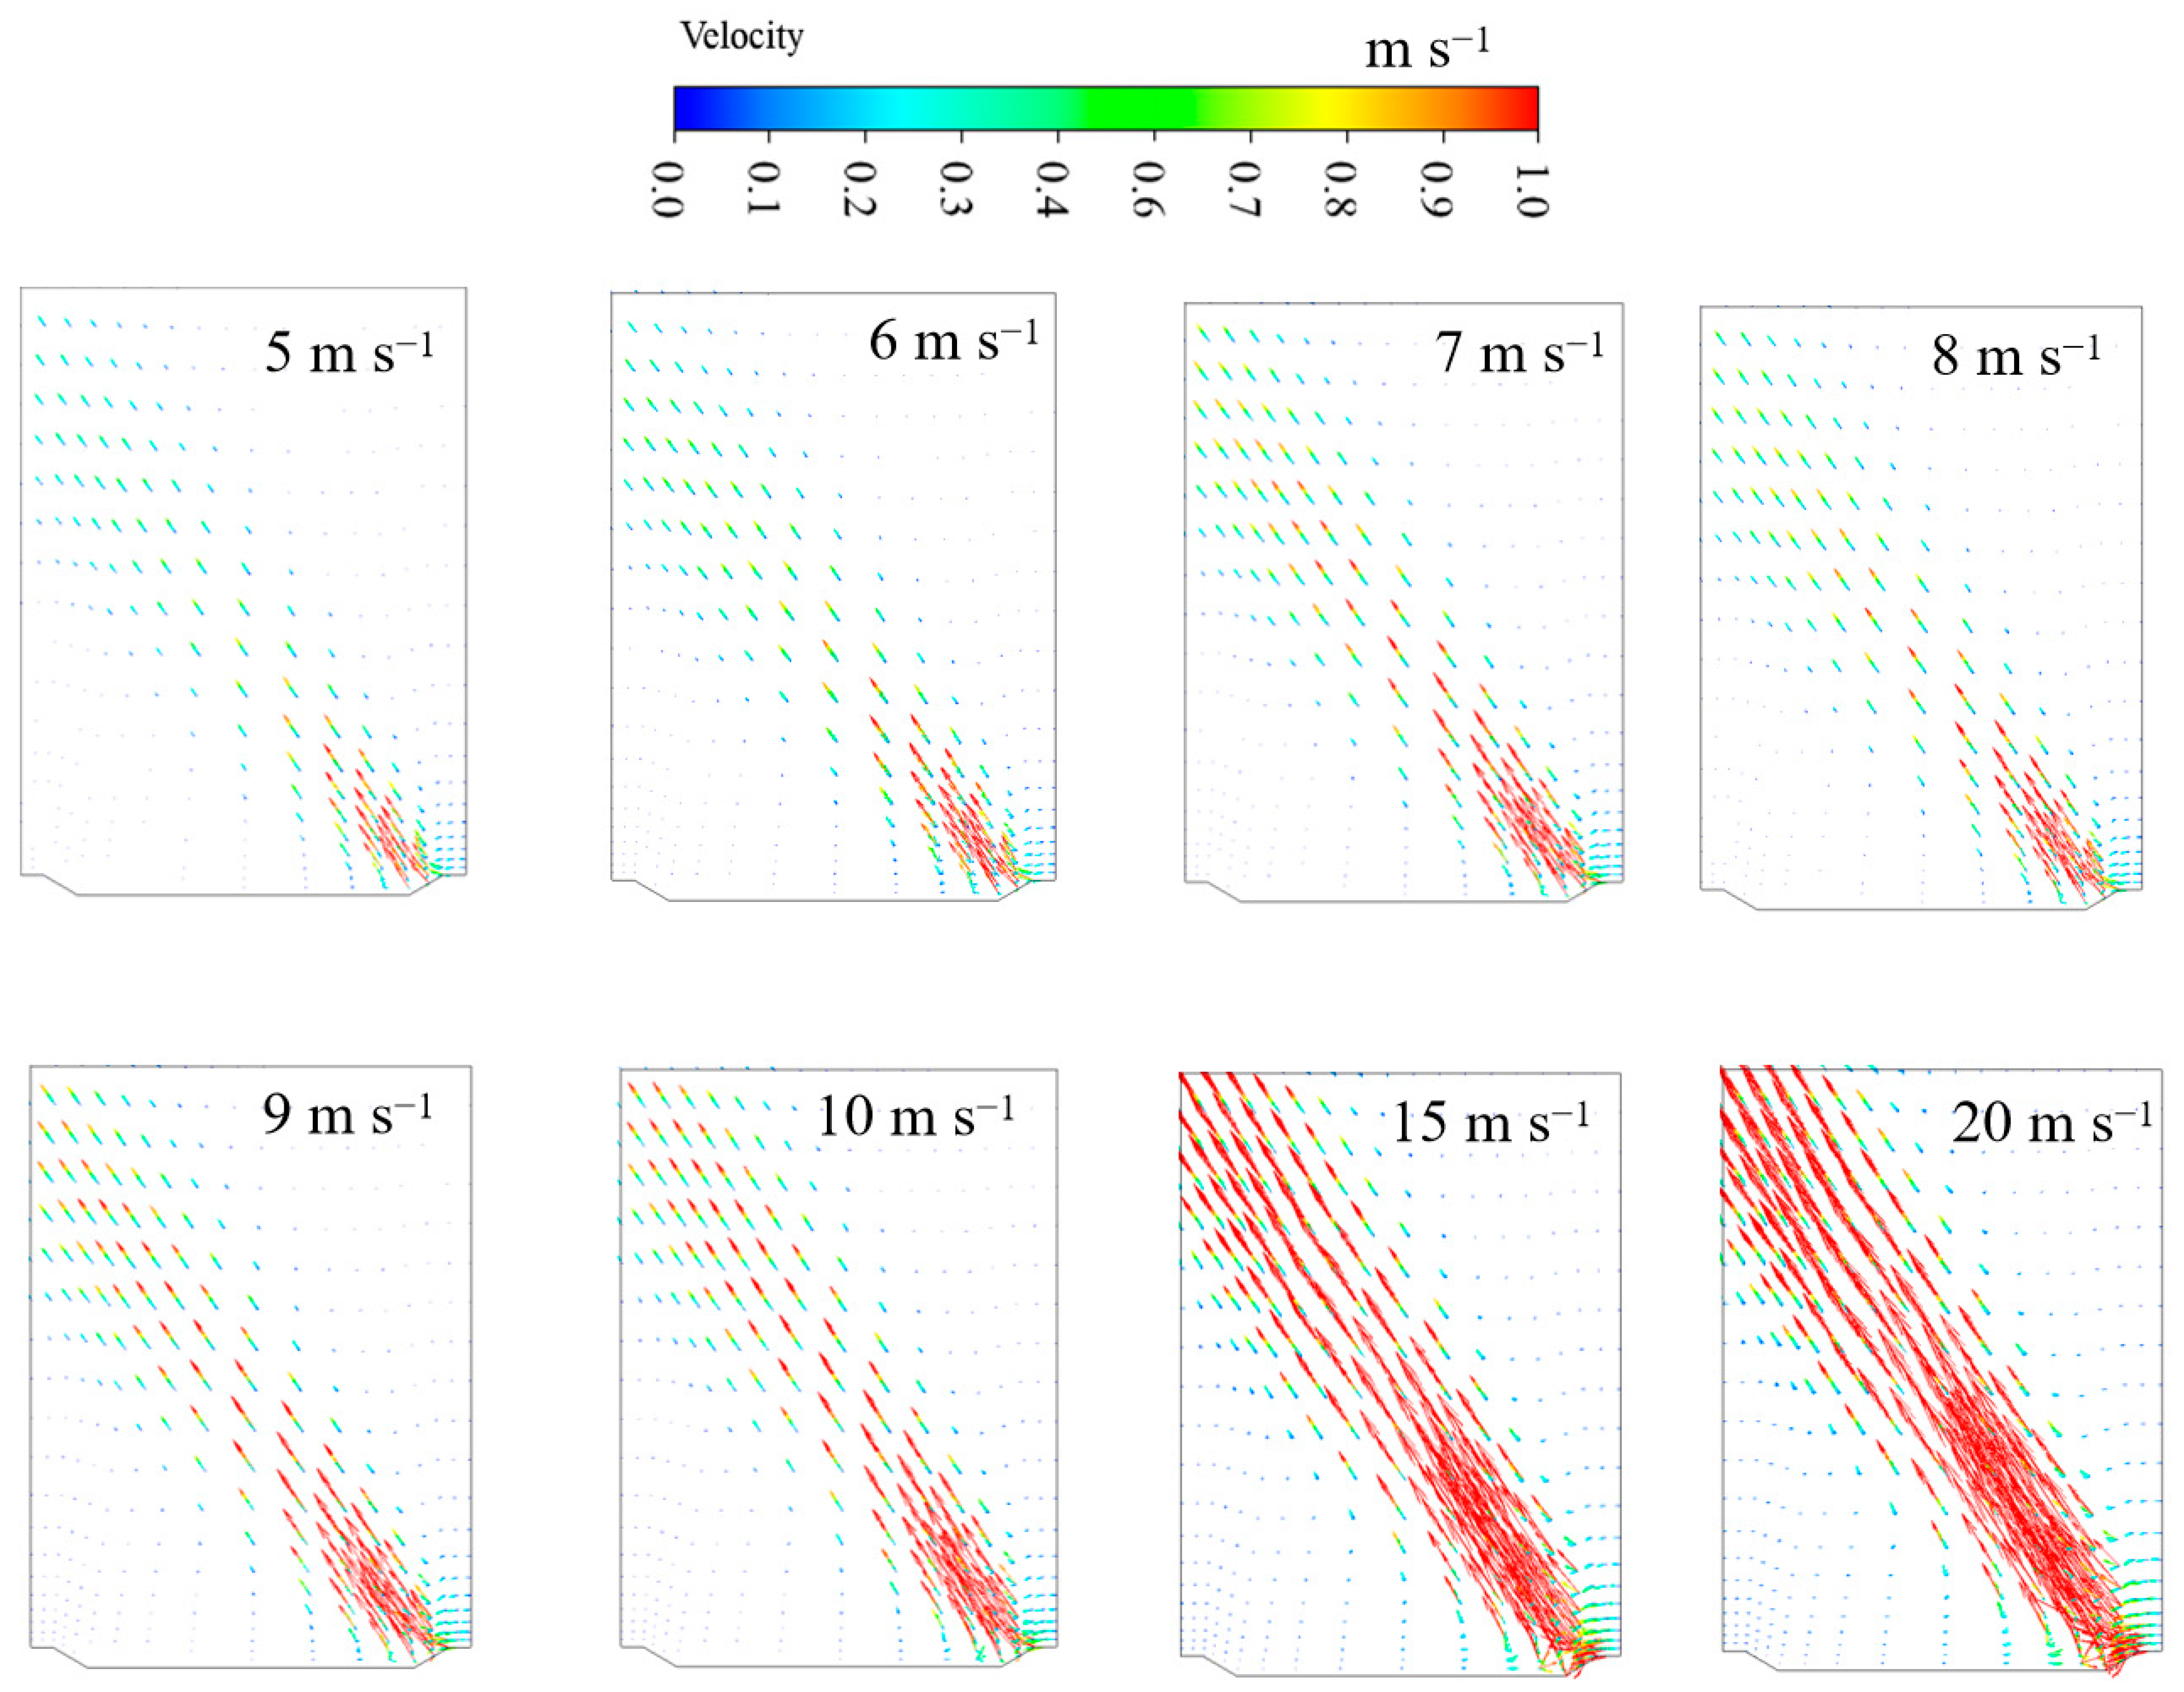
The airflow velocity vectors are shown in Figure 8. The cross-section of the first ventilation hole on the side of the cultivation tank was selected for analysis. The image revealed that the airflow enters the crop canopy through the ventilated hole, flows through the crop canopy, and exits the crop boundary layer, forming a regular columnar airflow. An increase in intake velocity resulted in a higher percentage of volume with air velocity higher than 1 m s−1. The lower intake air velocity resulted in a stagnant airflow zone in the canopy interior. In this study, the canopy region was divided into three parts—stagnant zone (v < 0.1 m s−1), suitable zone (0.1 m s−1 ≤ v ≤ 1 m s−1), and high-velocity zone (v > 1 m s−1)—based on the airflow velocity in the plant canopy.
Since the airflow pattern and air velocity in the plant canopy depend on the total number, angle, and position of the ventilation holes, further combinations and detailed analysis are recommended to enhance the design of the cultivation tank in this study. Moreover, in a multi-layer cultivation mode, the airflow pattern is also affected by the plant and the LED light. Thus, the radiation model and the evapotranspiration model can be considered to conduct a more comprehensive simulation.

3.2.2. Airflow Distribution in Crop Canopy Interior

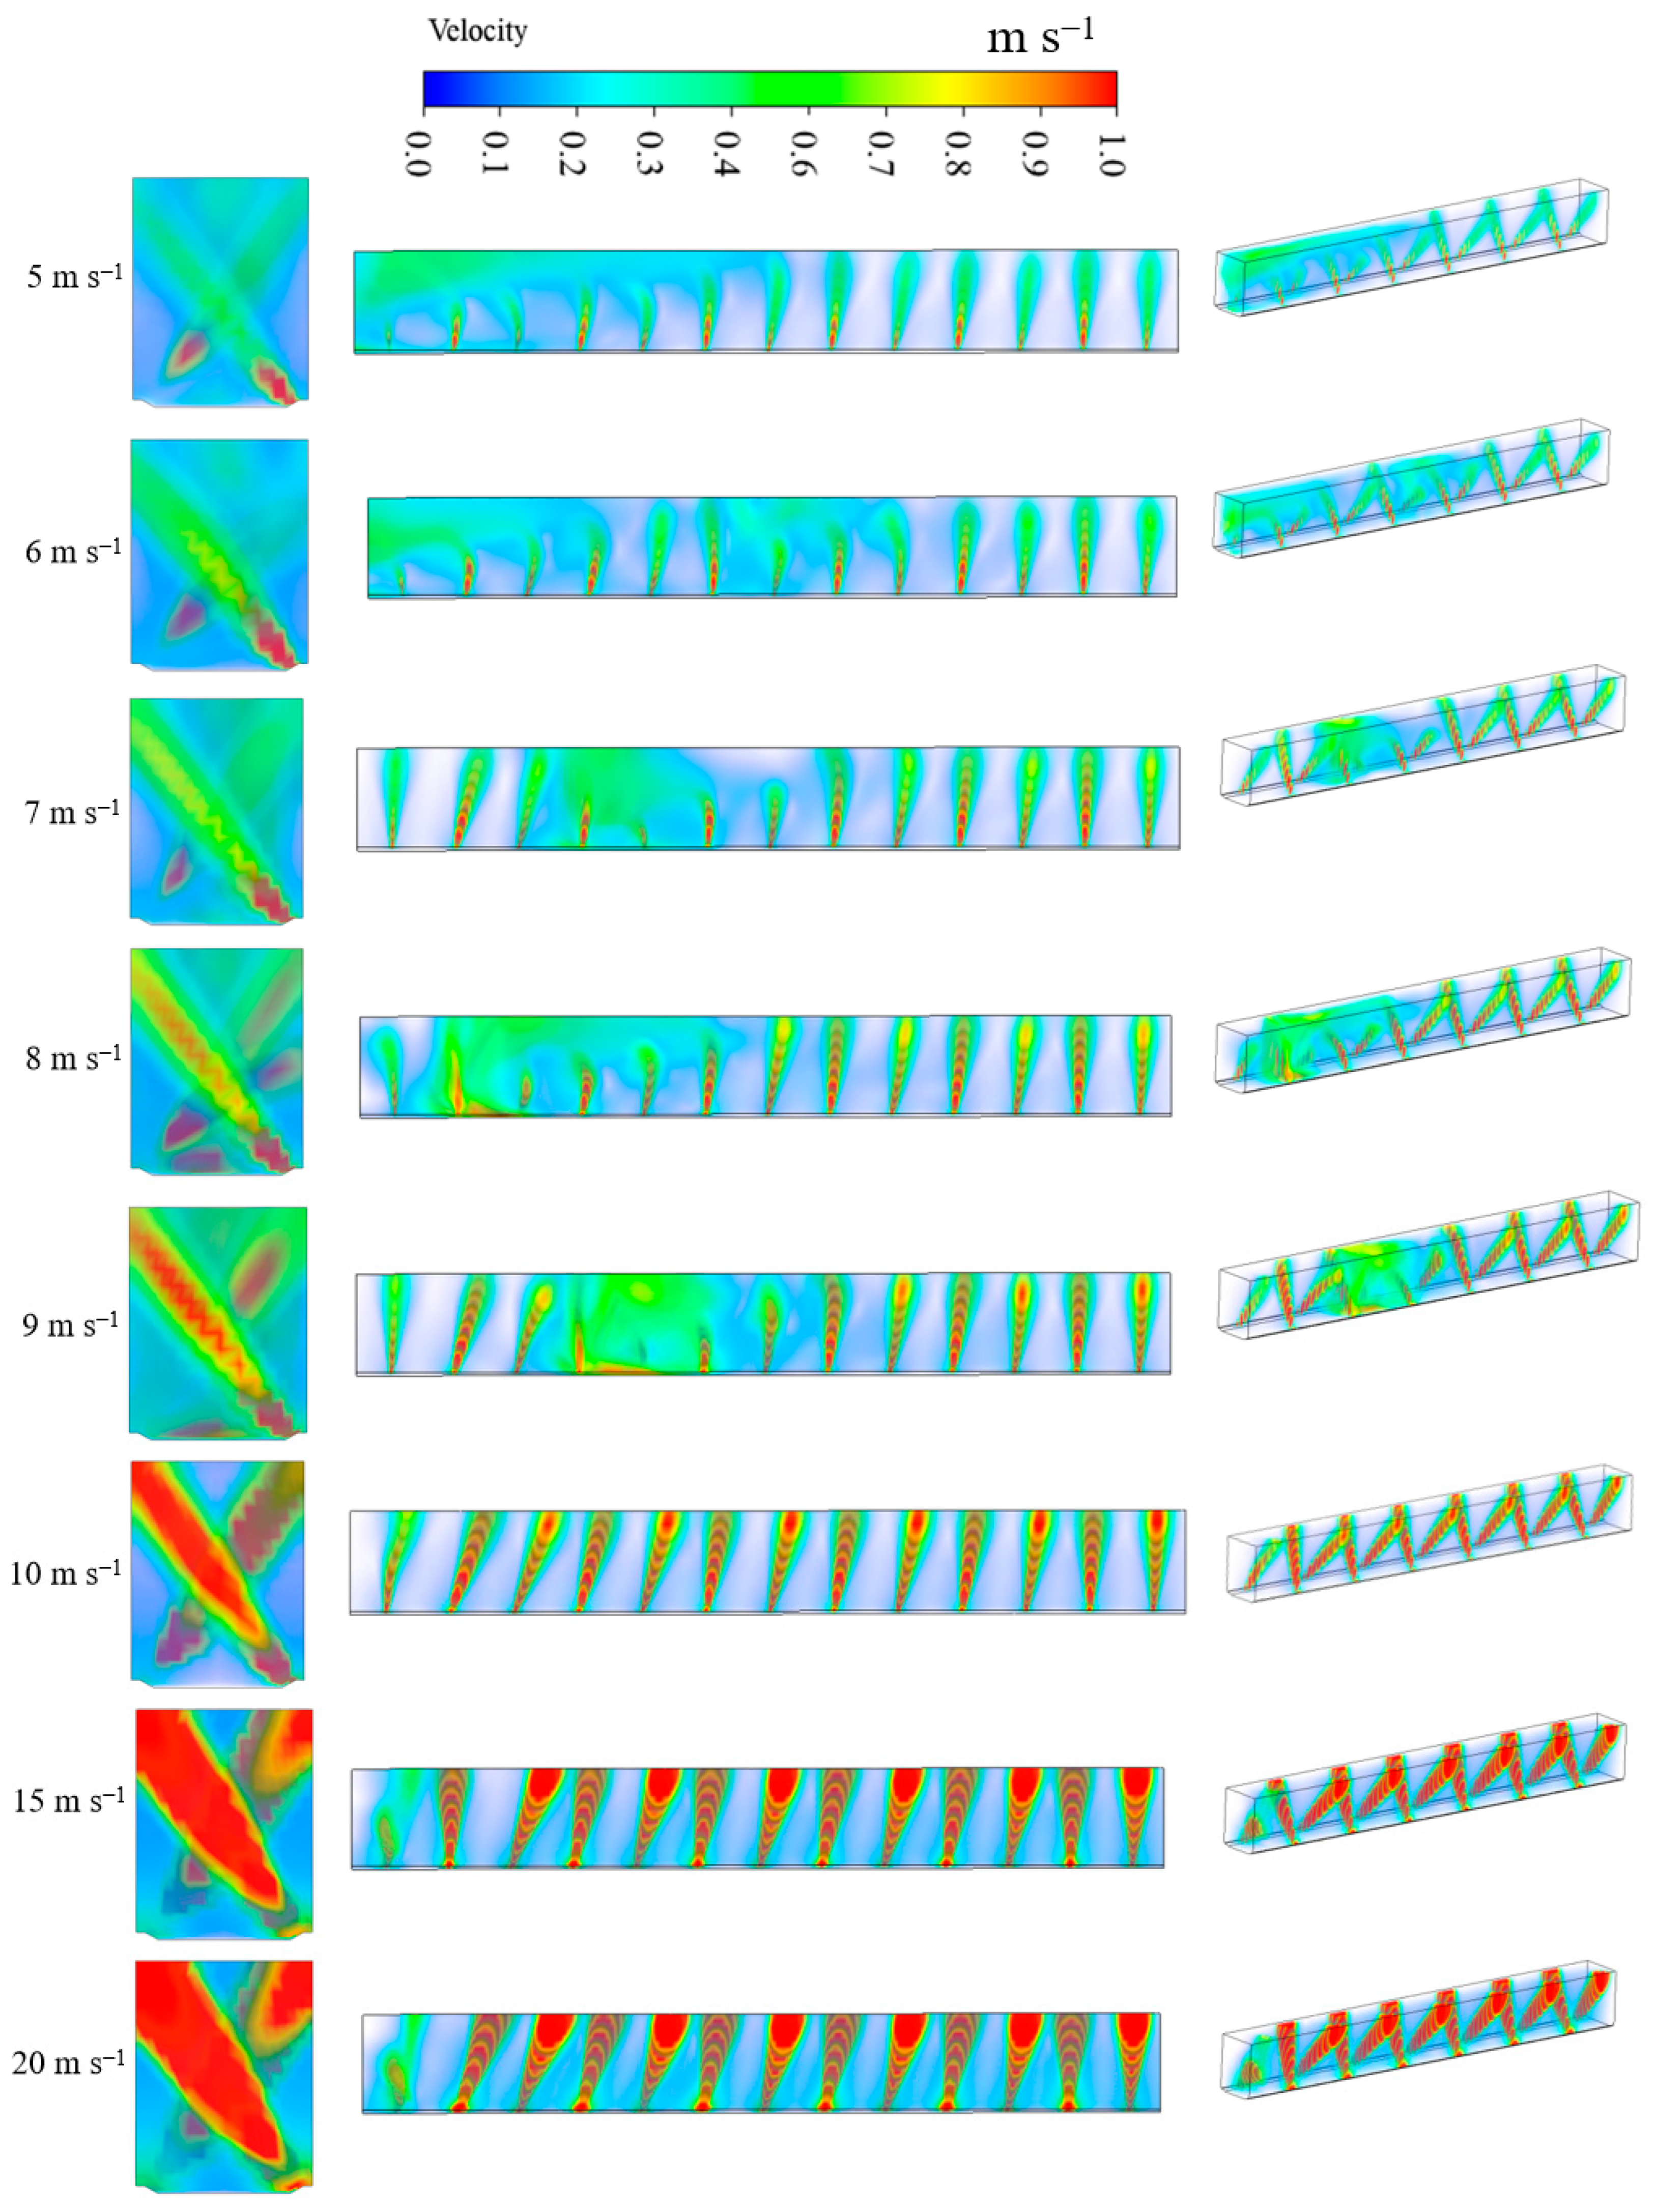
The contours of air velocity distribution in the lettuce canopy interior with different intake air velocities are shown in Figure 9. It can be seen from the figure that the trend in the crop canopy airflow profile was consistent with different intake air velocities. The velocity of airflow was faster at the ventilated hole and decayed after entering the crop canopy. The percentages of volumes for the stagnant zone, the suitable zone, the high-velocity zone, and volume-weighted average air velocity are shown in Table 2. It can be seen from the table that as the intake air velocity increased from 5 to 20 m s−1, the volume-weighted average air velocity increased from 0.11 to 0.37 m s−1, the percentages of volumes for the suitable zone increased from 47% to 83%, and the percentages of volumes for the stagnant zone decreased from 53% to 14.5%. The use of this cultivation tank effectively improved the airflow distribution within the plant canopy, and as the intake air velocity increased, the proportion of the stagnant zone also decreased.
The air velocity within the crop canopy has a significant impact on the photosynthesis and transpiration rates of plants. Studies have shown that when the air velocity in the plant canopy ranged from 0.01 to 1.3 m s−1, both photosynthesis and transpiration rates of the leaves increased with the increasing velocity. Supplying airflow to the plant canopy can create a more suitable environment for plant growth [12].

3.2.3. The Canopy Airflow Uniformity as Affected by Different Intake Air Velocities

The uniformity of airflow plays an important role in the growth and development of plants. The uneven distribution of airflow can lead to the uneven distribution of air temperature and relative humidity within the cultivation space, which can have adverse effects on plant growth, development, and physiological activities [30]. In this study, the plant canopy airflow uniformity was expressed by the coefficient of variation (CV), which was defined as the ratio of the standard deviation to the mean. The CV indicates the extent of variability in relation to the mean of the population. Therefore, the smaller CV demonstrated better airflow uniformity. The values of standard deviation, average velocity, and CV are shown in Table 4 and Table 5. The uniformity of the airflow first increased and then decreased with the increase in intake air velocity, reaching the optimal point at an intake air velocity of 10 m s−1. The reason for this may be that at low intake air velocities, the proportion of the stagnant zone was high. As the intake air velocity increased, the proportion of the stagnant zone decreased, improving the airflow uniformity. However, as the intake air velocity continued to increase, the proportion of the high-velocity zone increased, which then reduced the airflow uniformity.
In addition to being affected by airflow velocity, the airflow uniformity is also related to the aperture of the ventilated hole. Collin (1994) reported that for porous ventilation pipes, when the aperture ratio was within the range of 1.0 to 1.5, the airflow of each ventilated hole was more uniform [31]. In this study, when the aperture of the ventilated hole was 5 and the total number of ventilated holes was 13, the aperture ratio was 1.3.

3.3. Practical Plant Cultivation Experiment

3.3.1. The Canopy Environment as Affected by Different Air Velocities

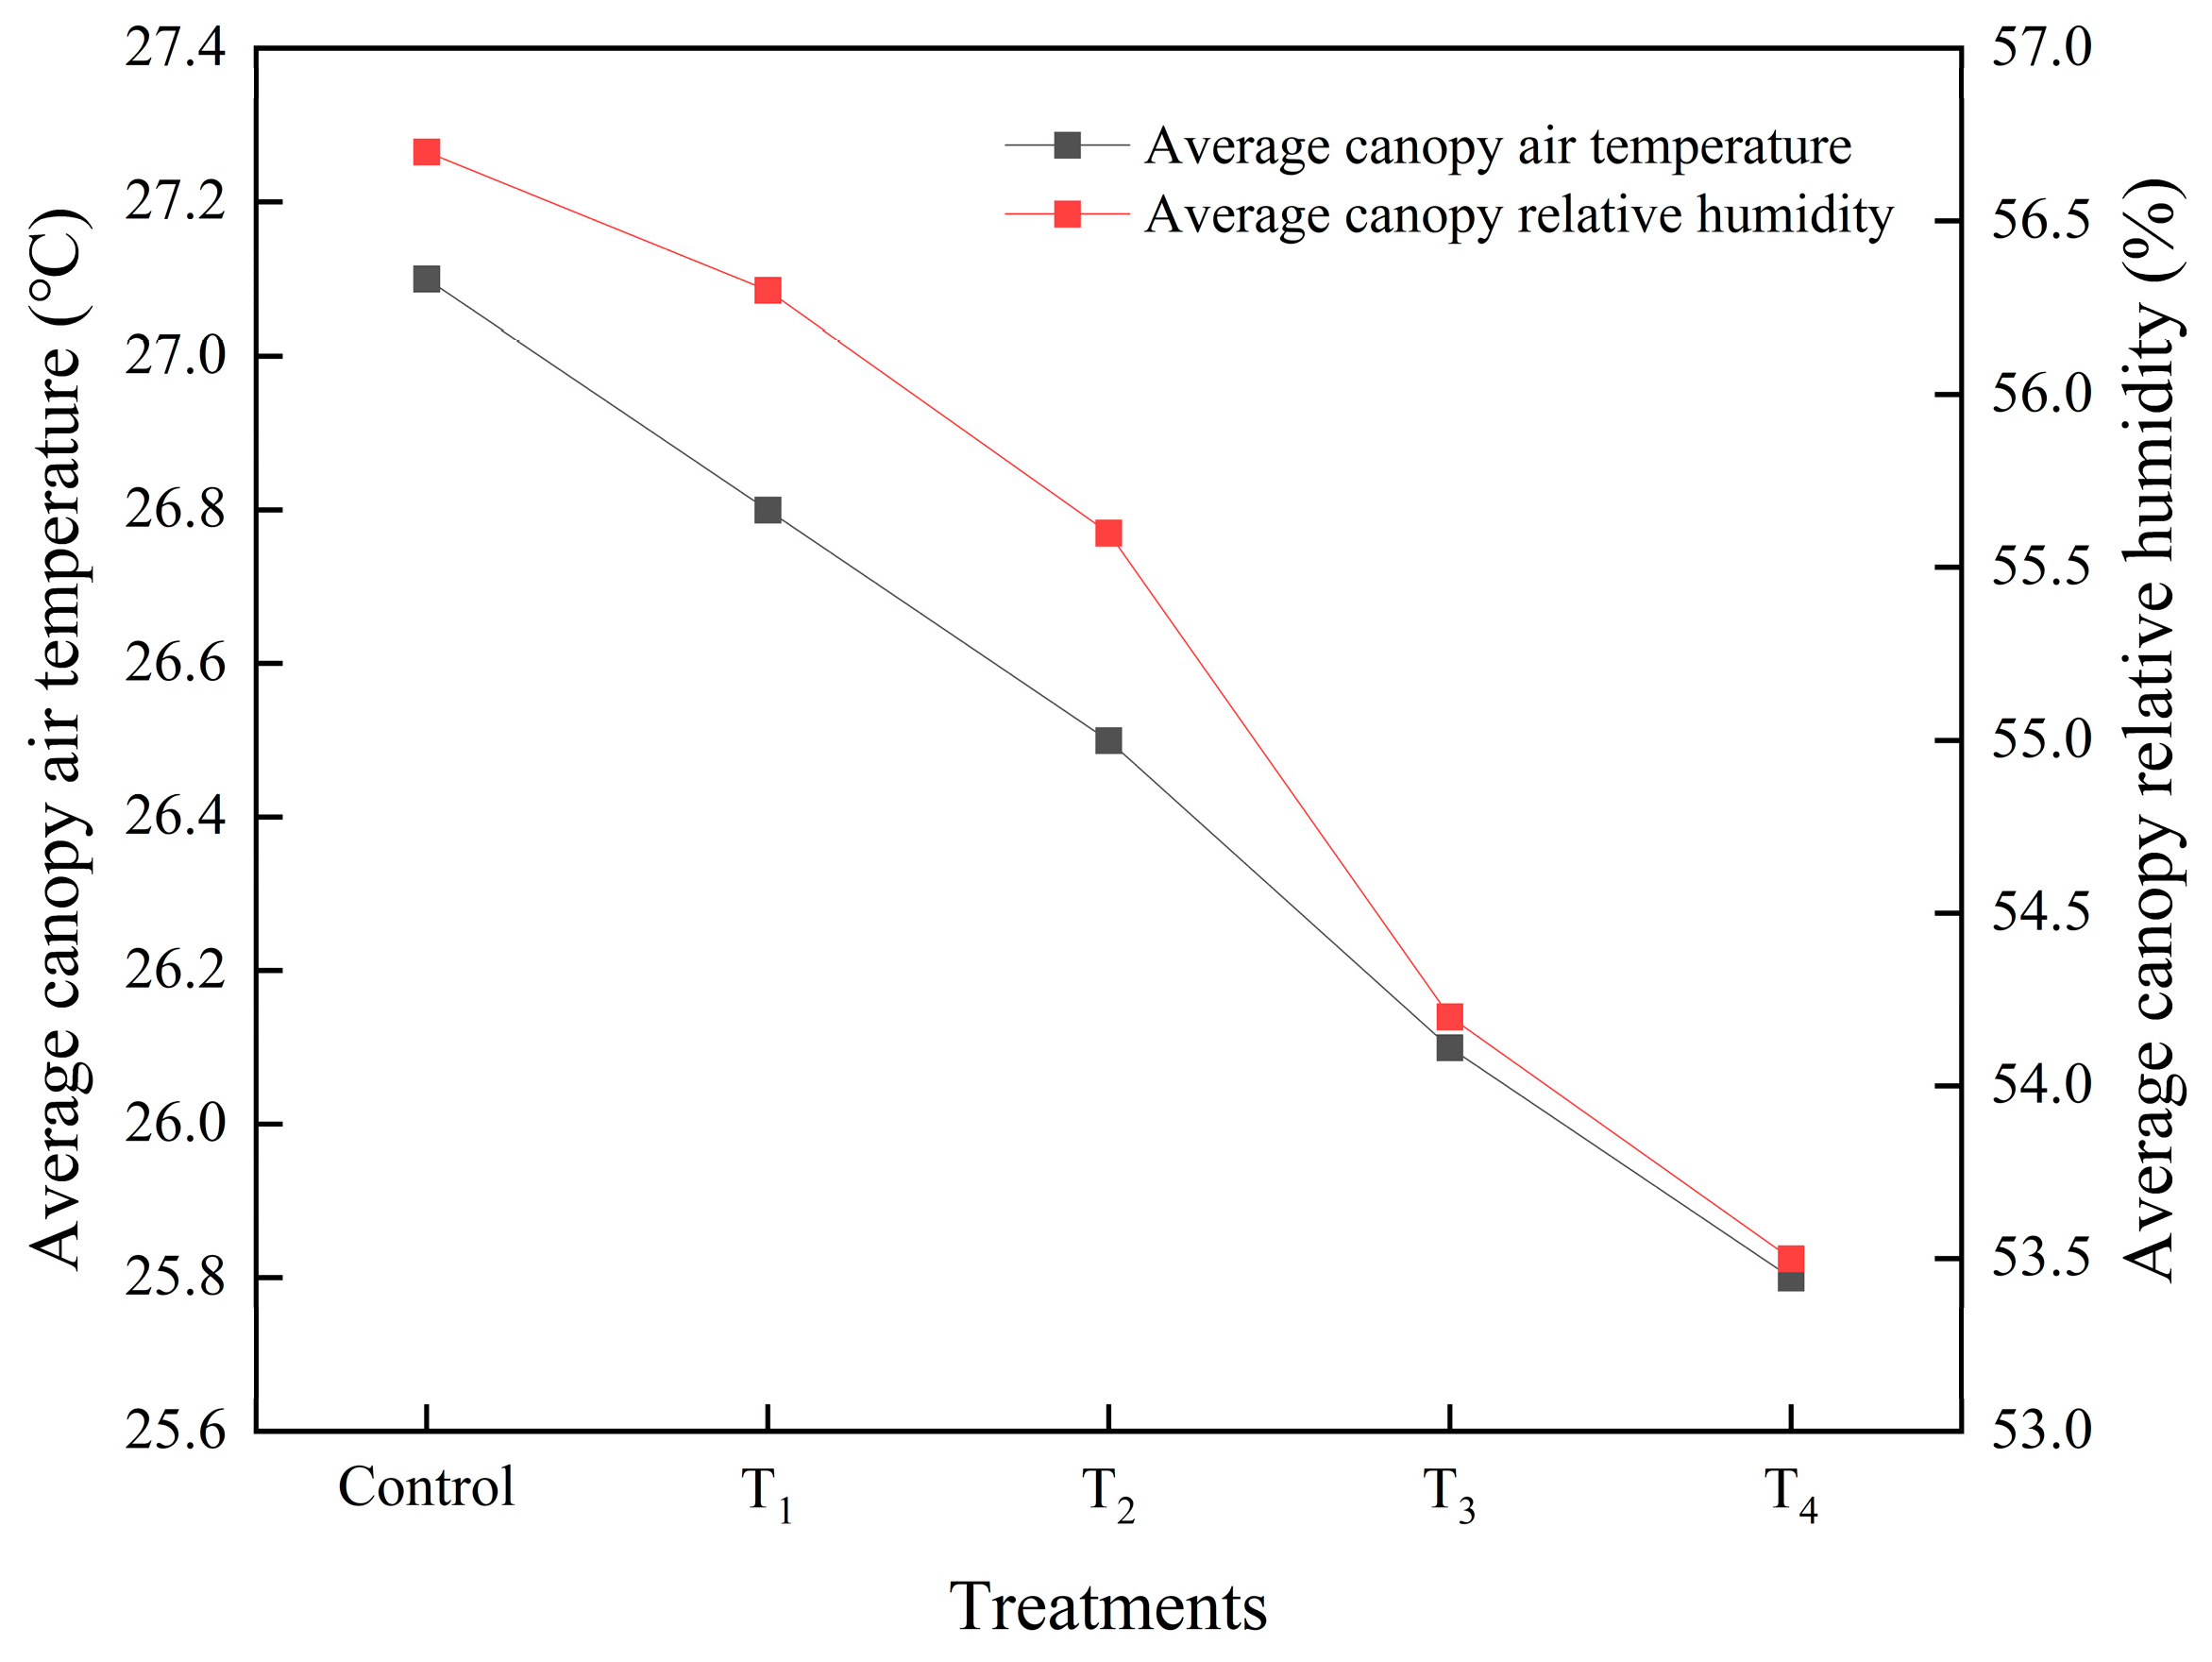
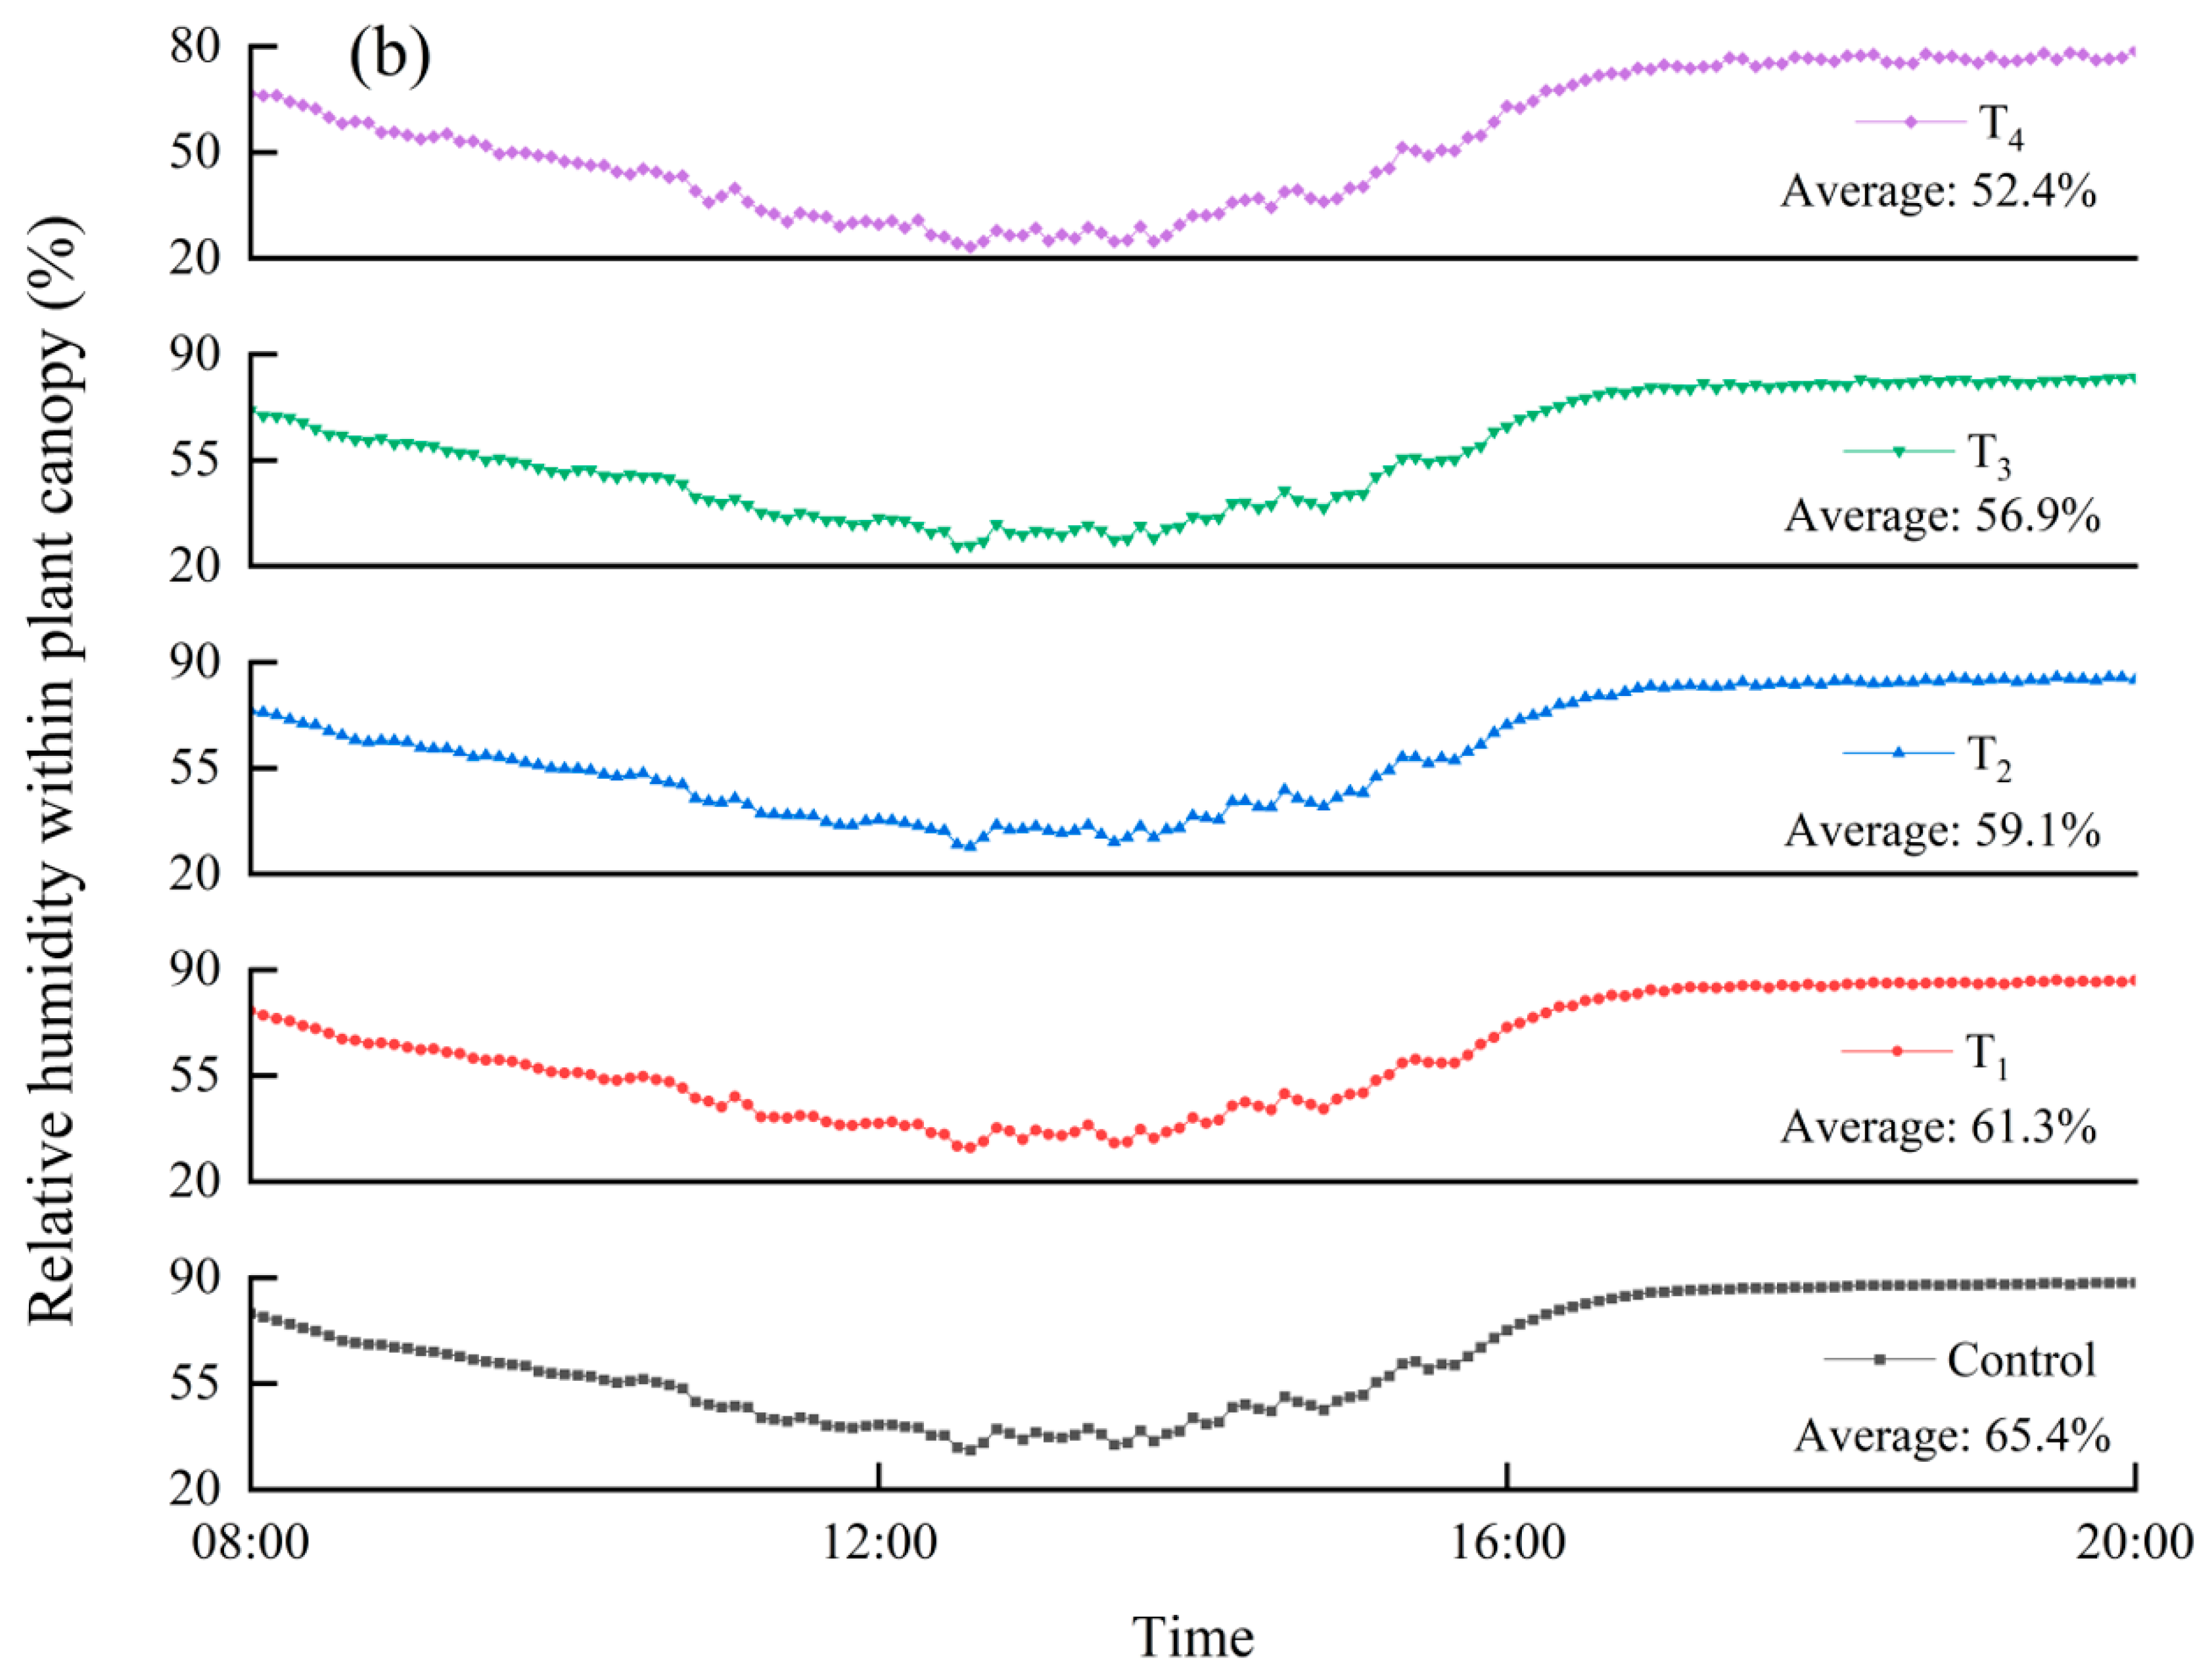
The constant air velocity on the surface of the plant canopy has a positive effect on the plant, as it can improve the canopy environment. Figure 10 and Figure 11 shows the variations in average canopy air temperature and average relative humidity under different treatments. The average canopy air temperature decreased from 22.1 °C to 20.7 °C, and the relative humidity decreased from 65.4% to 52.4% with the increasing canopy air velocity. Compared to the control, the average canopy air temperature and relative humidity of T4 decreased by 1.3 °C and 3.2%, respectively.
Research has shown that decreasing relative humidity could promote the accumulation of calcium ions in external leaves and enhance the ability to absorb ions in crops [15]. When the airflow within the crop canopy is stagnant, the water vapor generated by plant transpiration cannot be promptly expelled. Prolonged exposure to a high-humidity environment can lead to a reduction in leaf transpiration rate, triggering symptoms like leaf necrosis and elemental deficiencies [32,33]. Providing airflow to the plant canopy not only improves the airflow but also optimizes temperature and humidity. The canopy microclimate is highly heterogeneous, directly regulating the environment within the plant canopy, enhancing its uniformity [34,35]. Therefore, the novel cultivation system can be considered as an effective way to reduce the stagnant zone, as well as the temperature and relative humidity within the plant canopy, making the canopy environment more suitable for lettuce growth.

3.3.2. Lettuce Growth and Photosynthesis Analysis as Affected by Different Intake Air Velocities

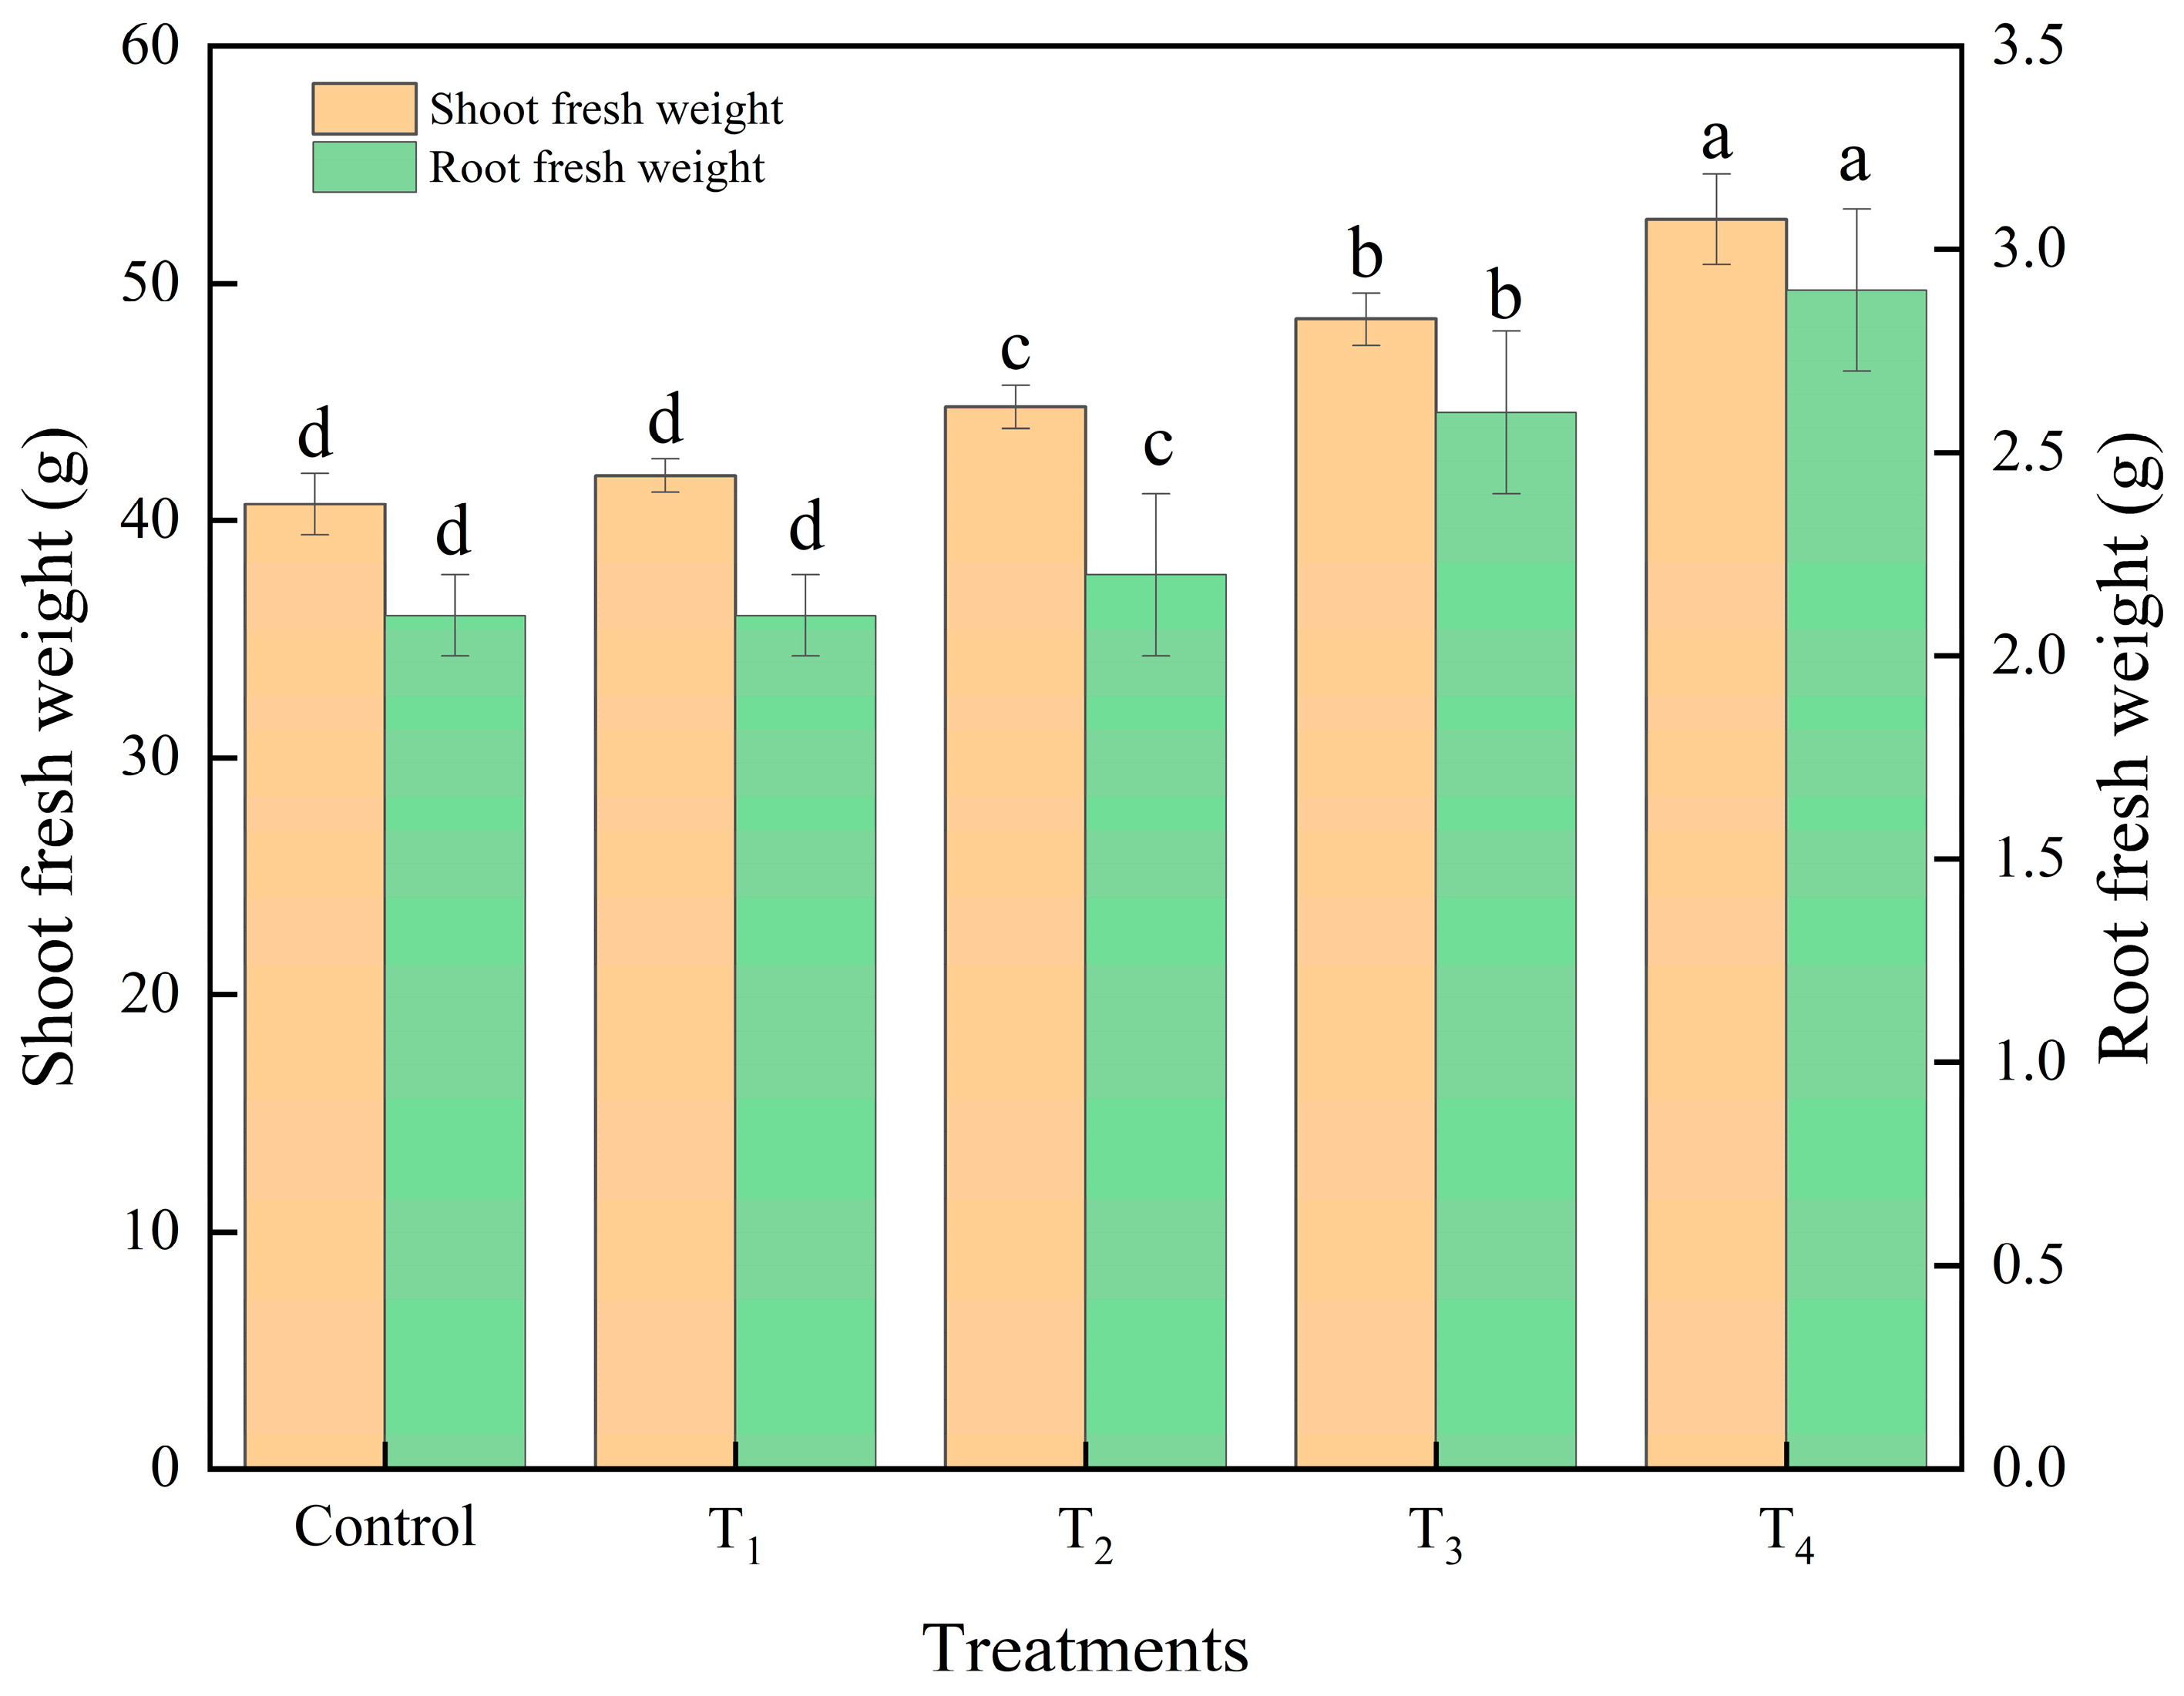
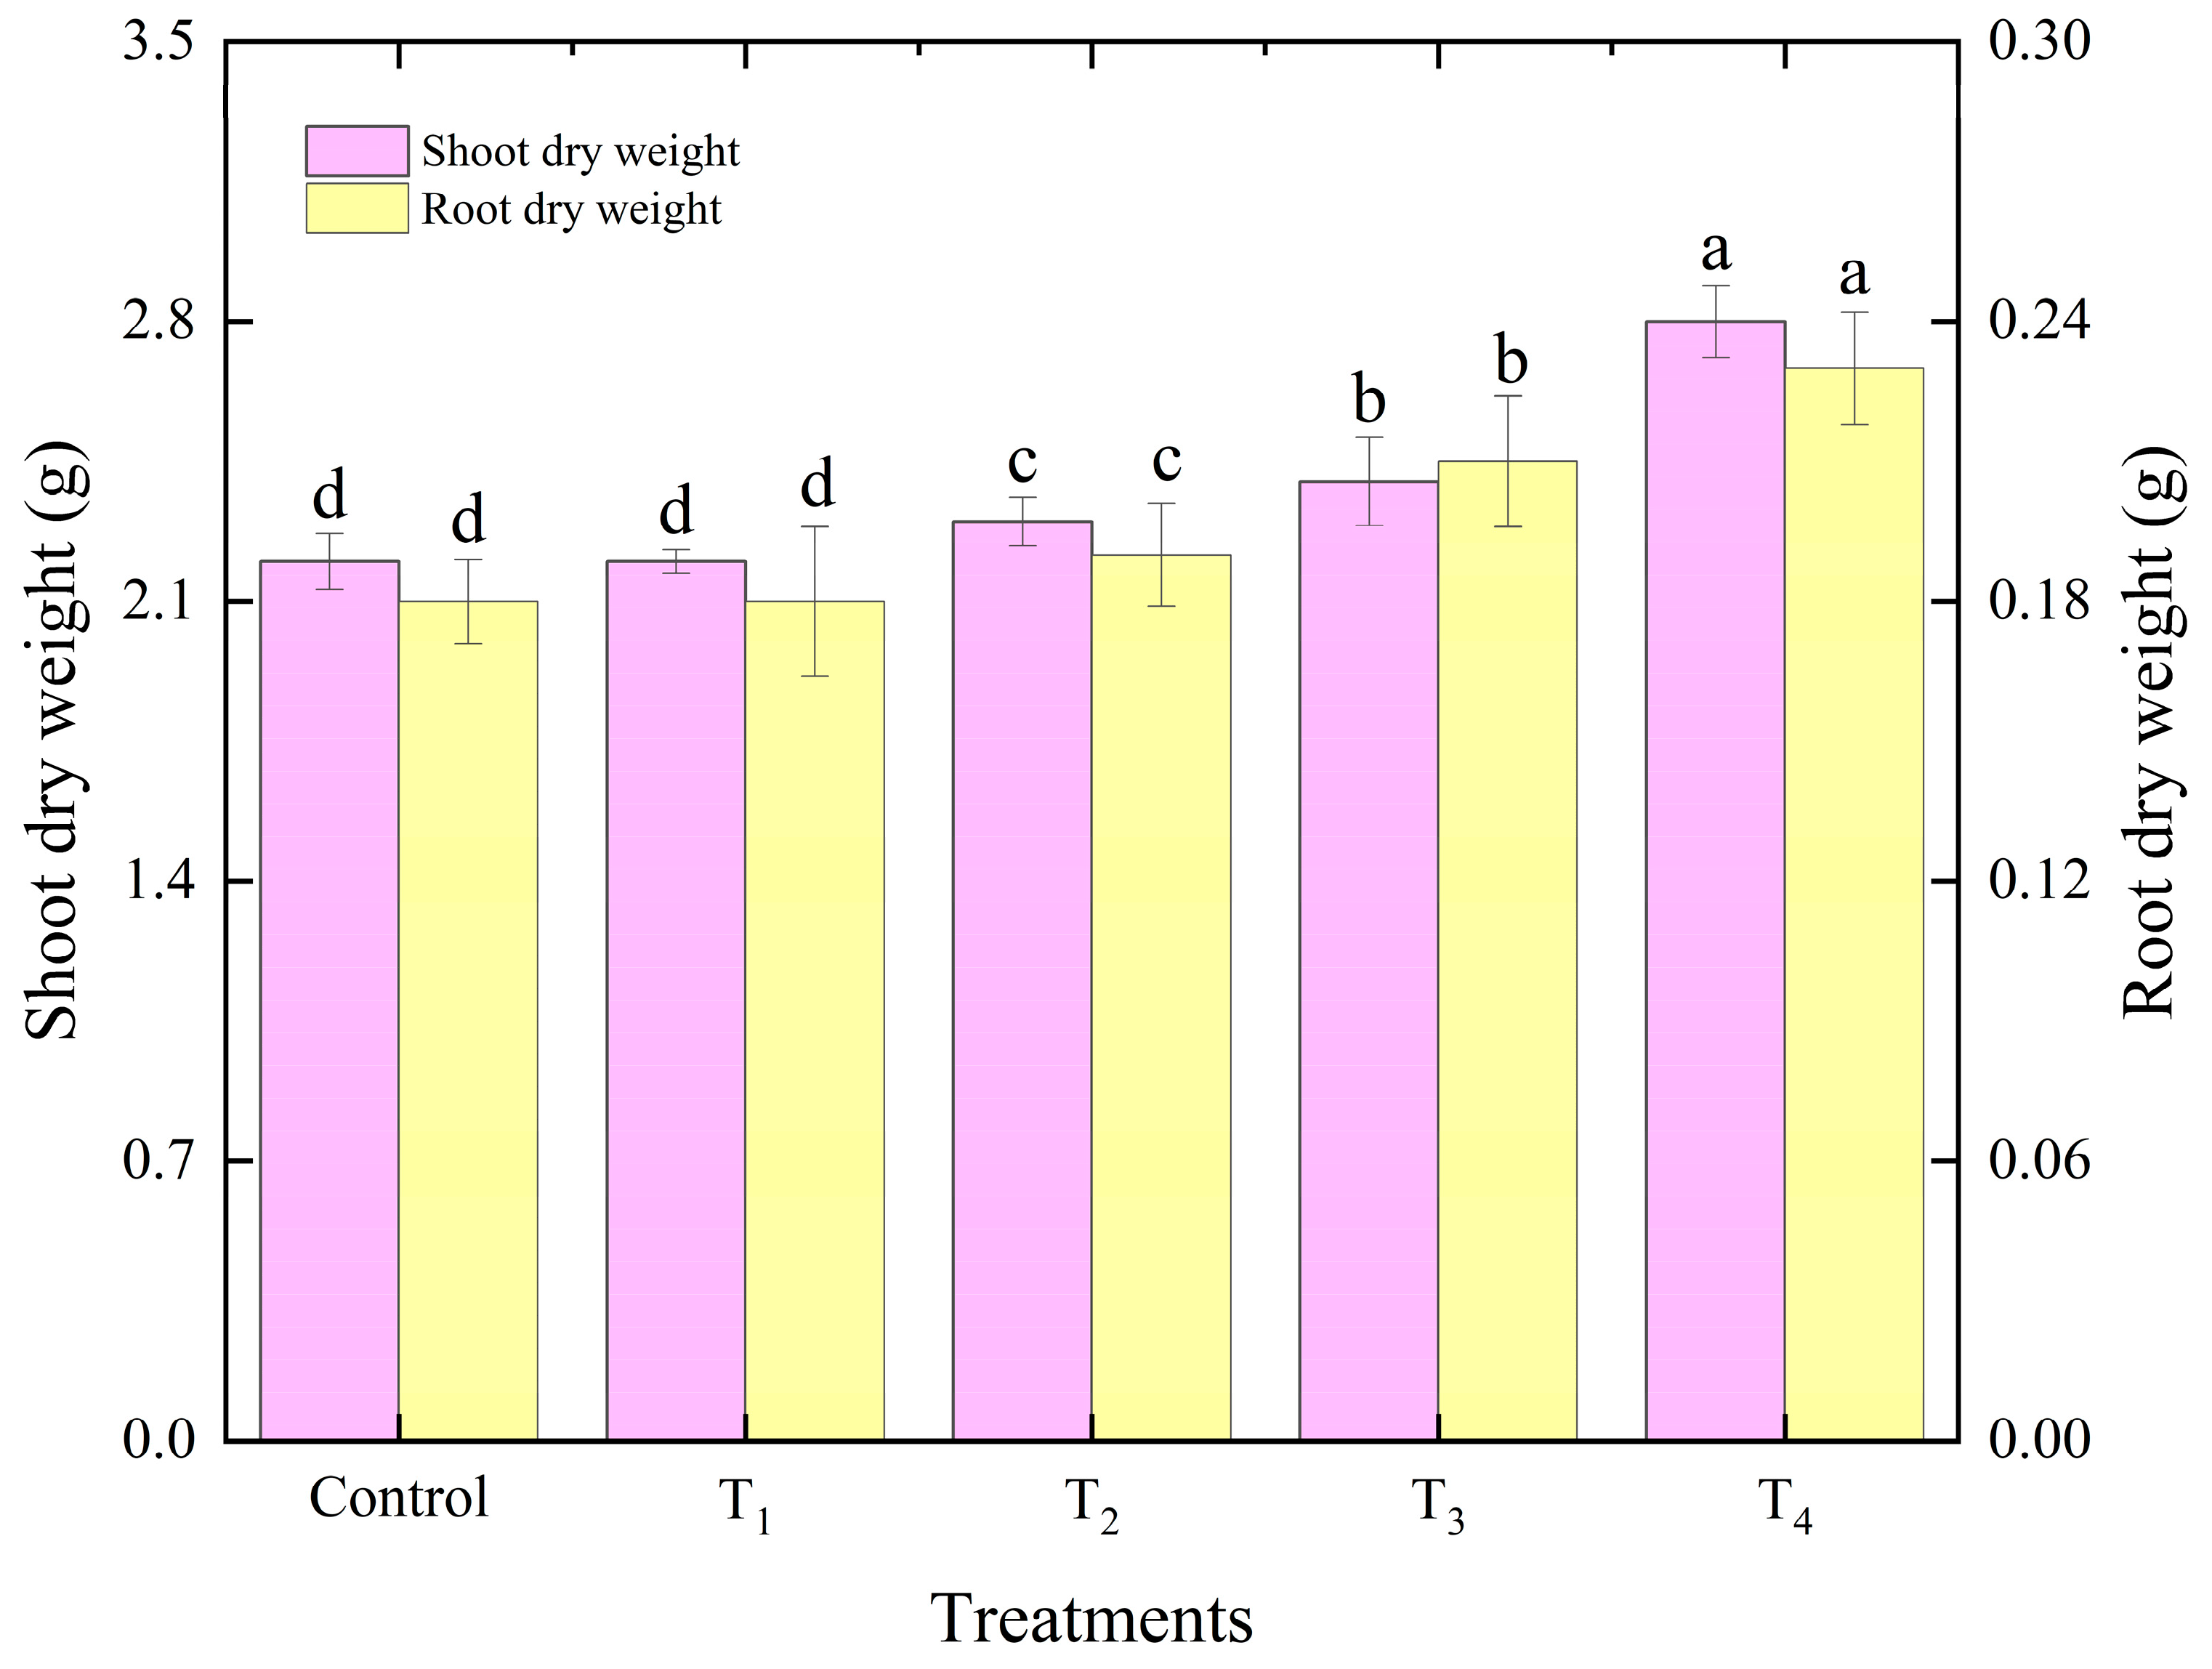
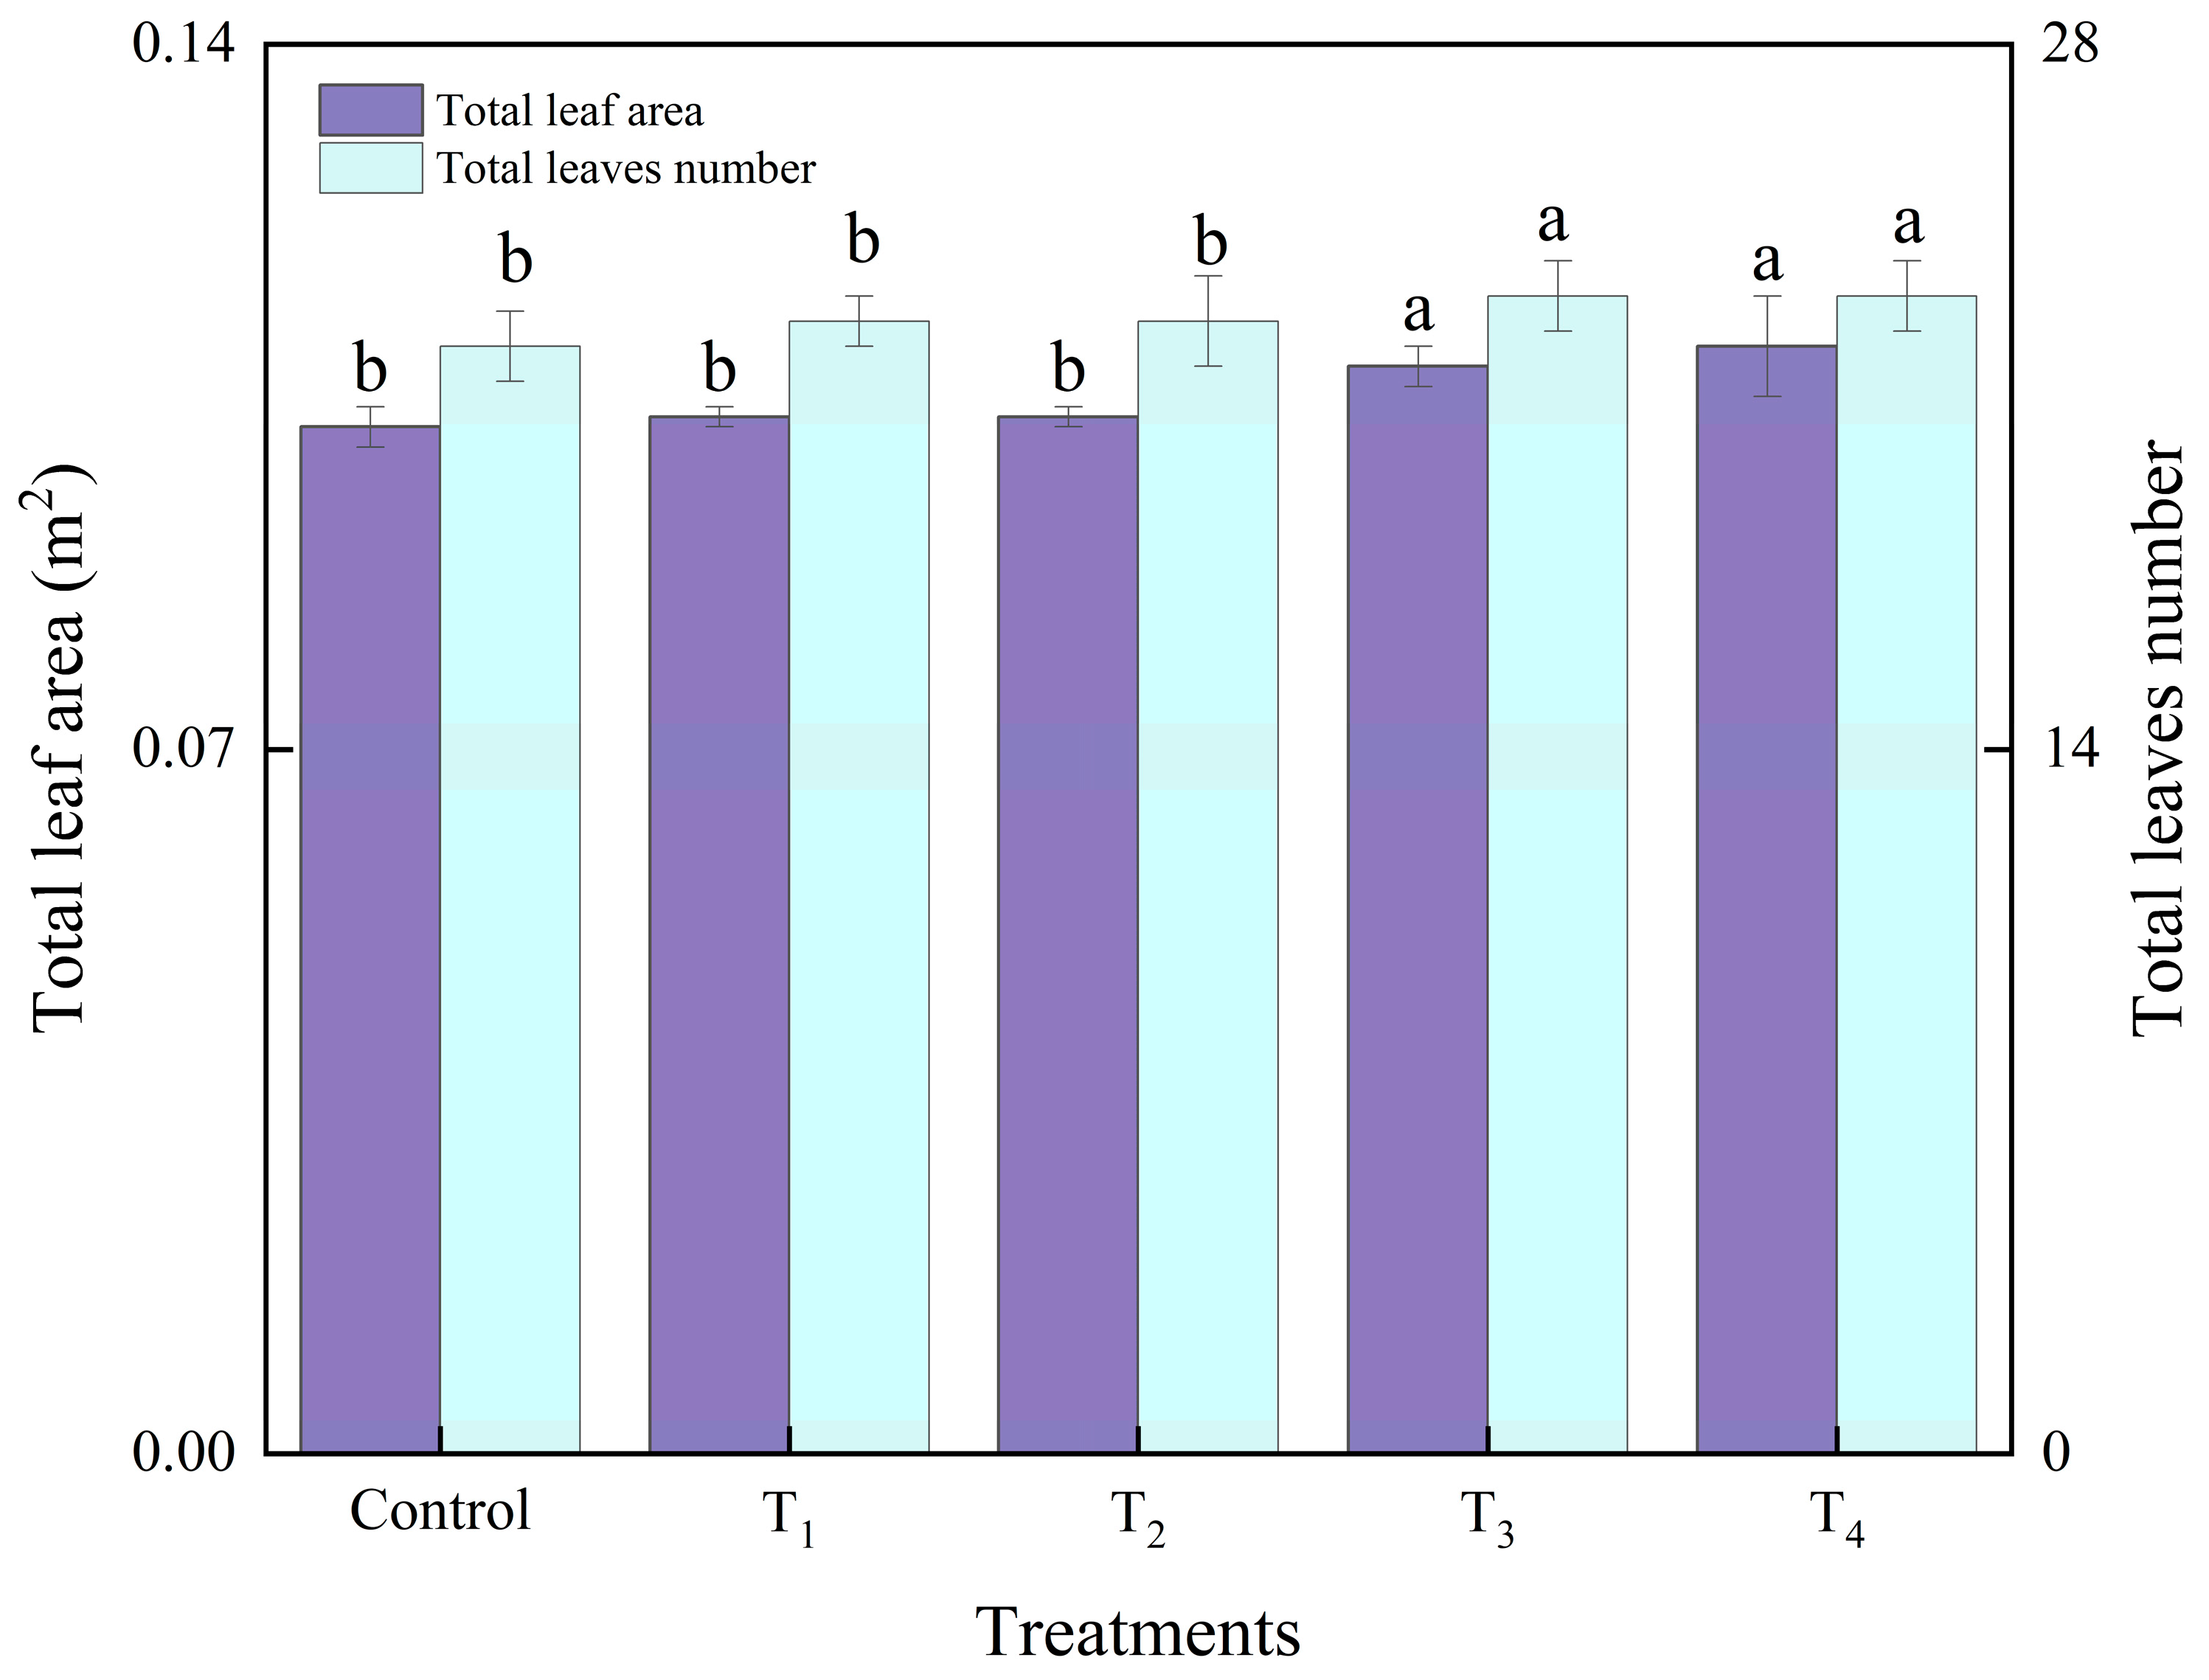
In protected agriculture, improving plant growth and quality are two of the main objectives. Figure 12, Figure 13 and Figure 14 show the lettuce growth under different intake air velocities. The lettuce exhibited optimal growth at an air velocity of 0.8 m s−1. With the increase in air velocity, the growth of the lettuce plant also improved. Compared with CK, the fresh weight increased by 2.8%, 9.9%, 19.4%, and 29.6%. And the dry weight increased by 3.8%, 8.1%, 12.5% and 29.9%. And for total leaf area and number of leaves, there was no significant improvement. This is because air currents do not directly regulate the leaf area and number of plants. According to CFD results, increasing the proportion of the suitable zone helps improve lettuce yield. The increase in lettuce plant growth with increasing intake air velocity can be attributed to enhancing CO2 uptake and H2O diffusion. Many studies have shown that low air velocity within the plant canopy could lead to a decrease in plant photosynthetic rate, which in turn reduces plant uptake of CO2, leading to a decrease in plant growth [36]. Meanwhile, an air velocity of 0.75 m s−1 was reported as a suitable rate for improving lettuce growth [27].
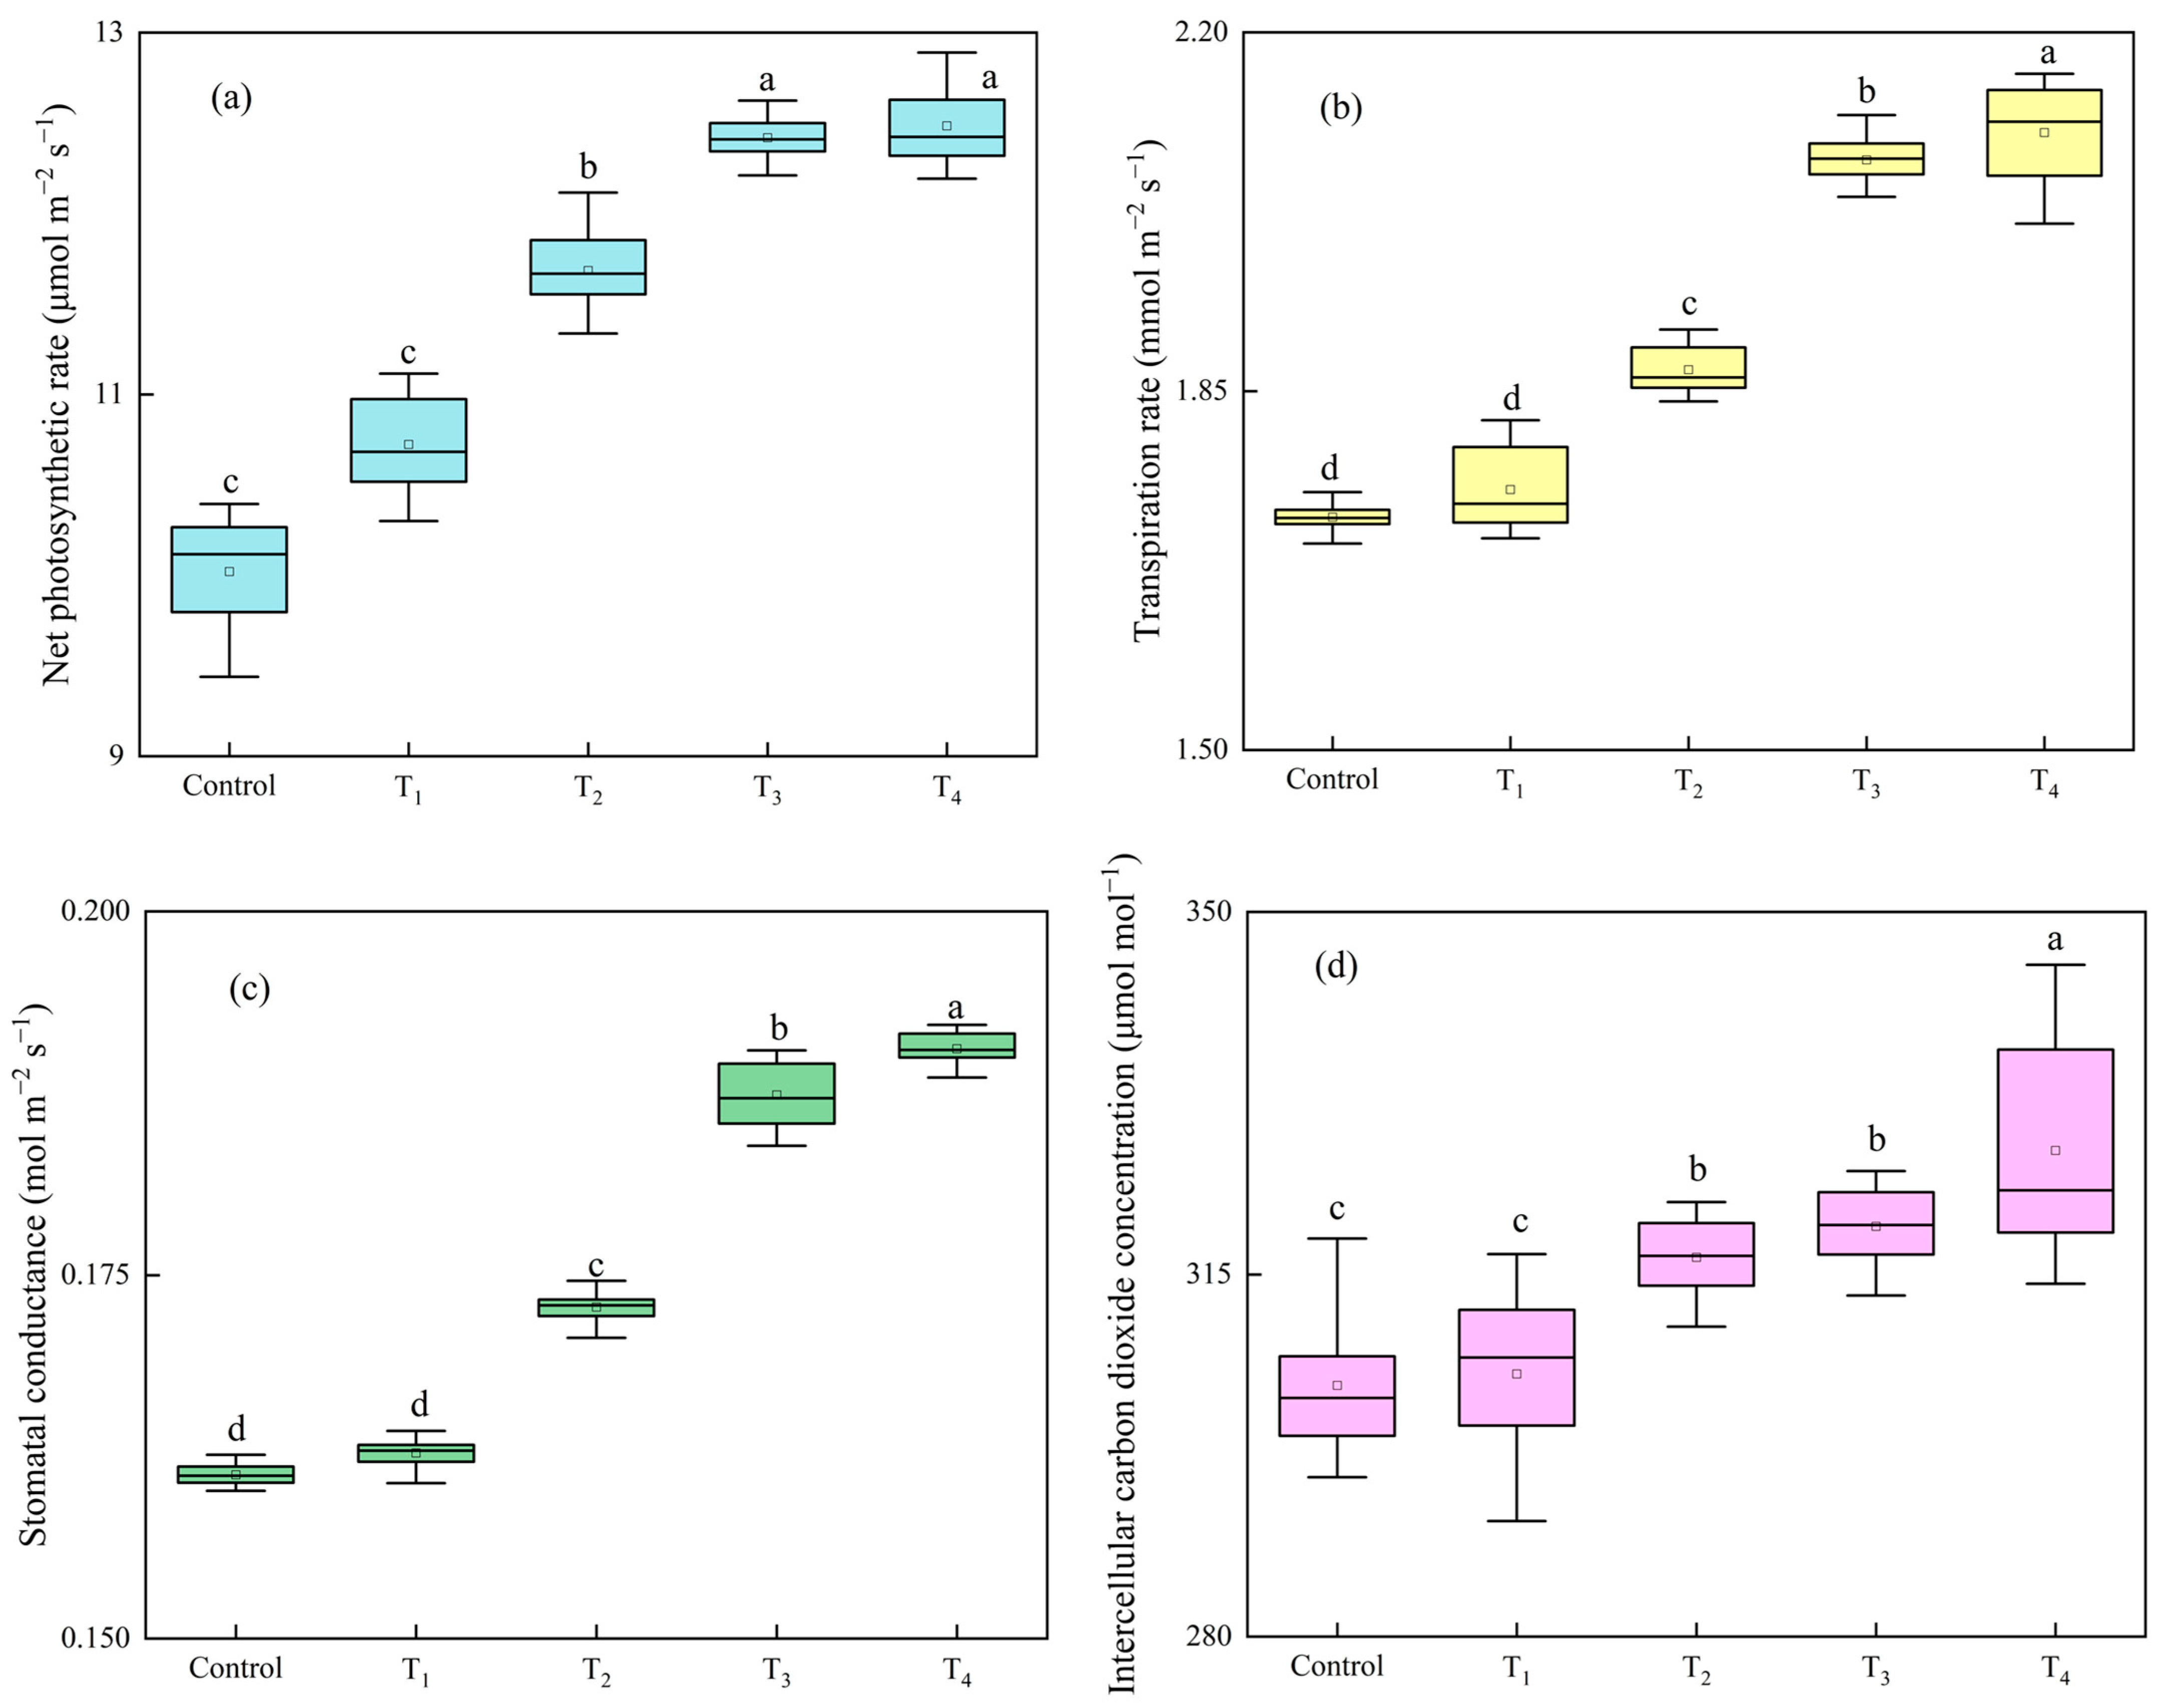
Figure 15 shows the photosynthetic parameters of lettuce plants. Compared with CK, the net photosynthetic and transpiration rates of the lettuce leaves in the experimental group were significantly improved, except for T1. Compared with the control, the net photosynthetic rate under the other three treatments increased by 10.2%, 17.1%, and 17.8%. As for the transpiration rates, they increased by 8.3%, 20.2%, and 21.7%. Moreover, the stomatal conductance and intercellular carbon dioxide also increased with the increasing air velocity; except for T1, the other treatments showed a significant improvement compared with CK, with increases of 7.5%, 16.1%, and 18.6%. And the intercellular carbon dioxide concentration also showed a similar trend to stomatal conductance, with increases of 4.2%, 5.6%, and 7.6%, compared with the control. Research studies have proved that the increased air velocity presumably reduced the leaf boundary layer resistance, facilitating more efficient gas exchange between the leaf and the atmosphere, which is similar to this study [27,37].
Photosynthesis is an important physiological function of plants. Plants accumulate dry matter through photosynthesis. The improvement in crop yield was mainly influenced by two factors: photosynthetic performance and morphological changes [38]. For lettuce plants, the photosynthetic and transpiration rates increase within the air velocity range of 0–0.8 m s−1 [38]. However, a higher air velocity can lead to stomatal closure, decreasing the photosynthetic rate and reducing the growth of the plant [36,38,39]. According to the results, increasing air velocity is associated with increased photosynthetic rate. This can be explained by the diffusion of CO2 through the leaf boundary layer, which increases with the increasing air velocity [27].
Stomatal conductance is an important parameter for the physiological control of transpiration. Stomatal regulation of gas exchange is significant for plant growth [40]. Shibata et al. (1995) reported that the stomata could be considered fully open within the range of 0.5–1 m s−1 [11]. Another factor that affects photosynthesis is the intercellular carbon dioxide, which is primarily influenced by the CO2 concentration surrounding the leaf, stomatal conductance, mesophyll conductance, and photosynthetic activity of mesophyll cells [41]. In this study, the intercellular carbon dioxide concentration also showed a similar trend to stomatal conductance. Thus, it can be inferred that the increase in stomatal conductance led to an increase in intercellular carbon dioxide concentration, which in turn resulted in an increase in the net photosynthetic rate. Besides being affected by air velocity, plant photosynthesis is also influenced by temperature, humidity, light intensity, and CO2 concentration [35]. Temperature greatly affects the activity of enzymes as part of plant metabolic processes. An increase in temperature is a factor that induces a higher rate of photosynthesis, as most biochemical reactions are activated [35]. The level of CO2 in the greenhouse has a significant effect on plant growth and photosynthesis [42]. High CO2 concentrations increase the photosynthetic rate and enhance carbohydrate production in plants. Temperature and CO2 concentration also affect stomatal conductance. Rising temperatures and CO2 concentrations increase and decrease stomatal conductance, respectively. However, when the temperature further increases to 34 °C, the stomatal conductance still increases, but CO2 assimilation decreases [41]. In greenhouse production, improper ventilation often leads to imbalances in temperature, relative humidity, and CO2 concentration. Directly providing airflow to the plant canopy can improve the microclimate parameters, leading to the enhancement of photosynthesis, which is consistent with this study [35,42].
When the air velocity within the lettuce canopy increased from 0 to 0.8 m s−1, the growth and photosynthesis capacity of lettuce plants were significantly improved. The CFD results revealed that the volume of the stagnant zone decreased with increasing air velocity, confirming that reducing the stagnant zone directly enhanced gas exchange capacity and biomass accumulation. Research studies showed that the optimal air velocity within crop canopy for indoor lettuce cultivation was in the range of 0.3–1.0 m s−1 [43]. Research studies have found that the air velocity within the plant canopy of 0.7 m s−1 could enhance the photosynthetic and transpiration rates, which is consistent with the results of this study [39].

3.3.3. Electric Use Efficiency as Affected by Different Intake Air Velocities

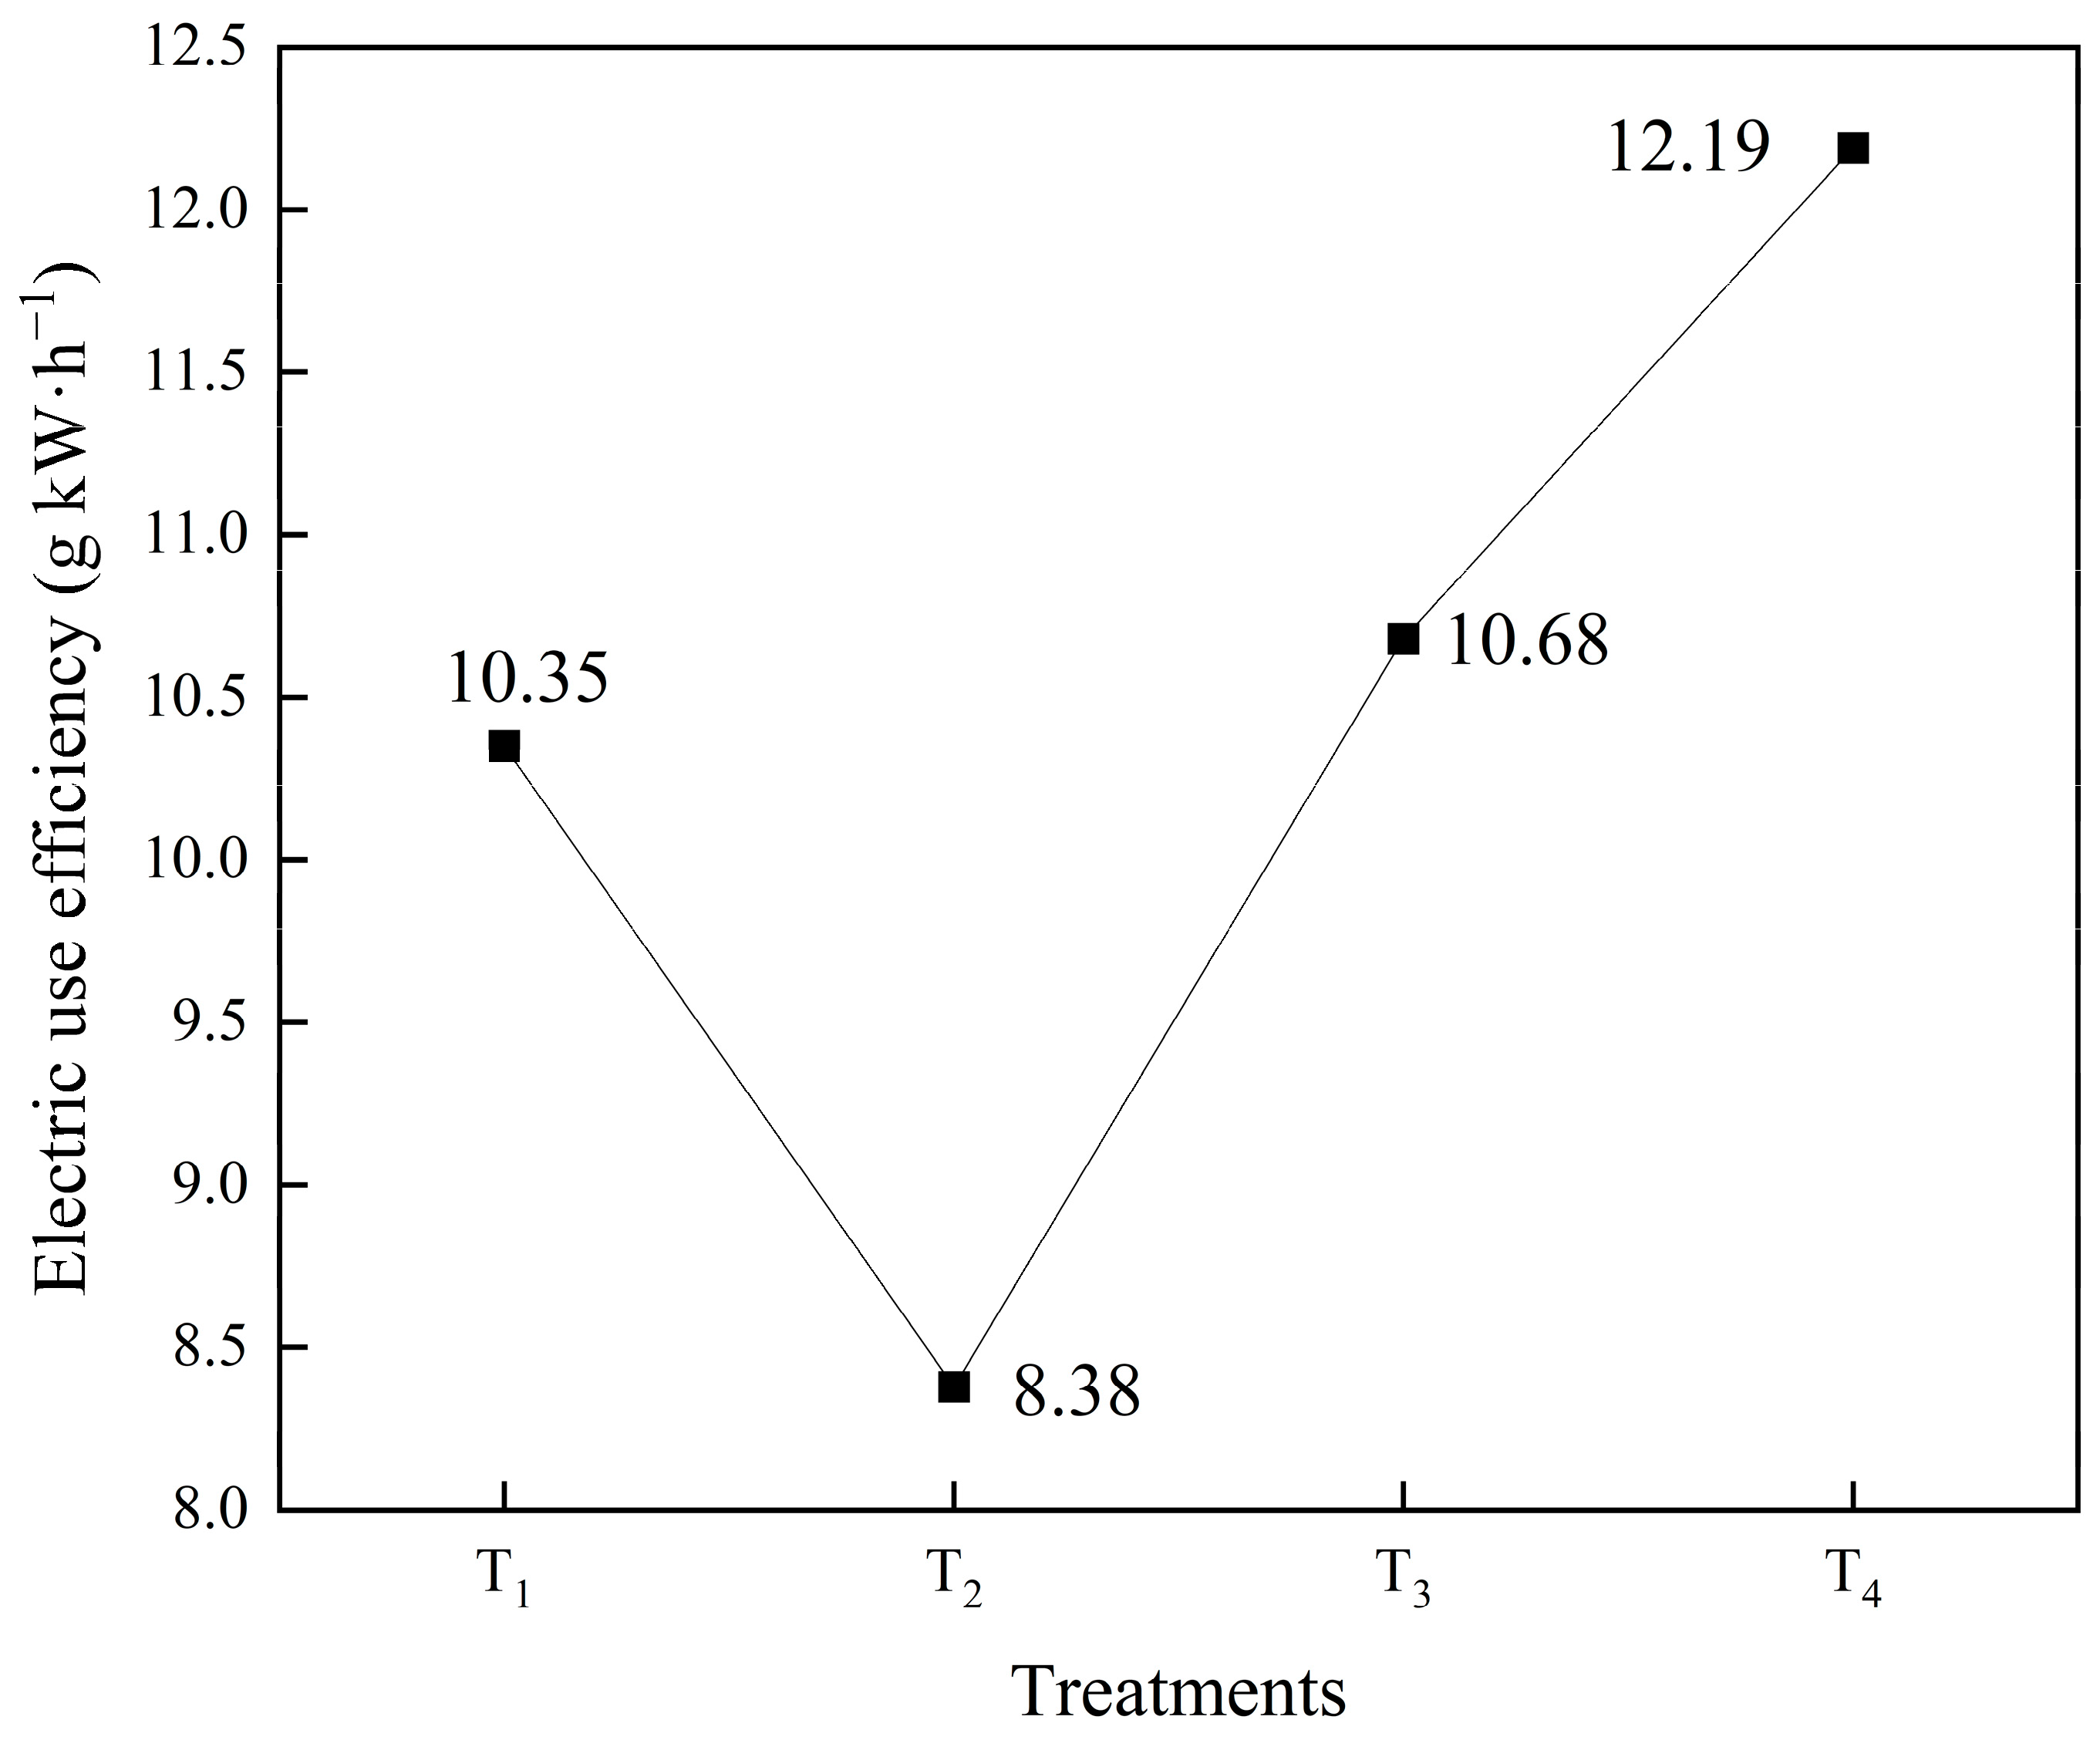
Electric use efficiency is an important indicator for evaluating the economic value created by plants [28]. Figure 16 shows the increase in lettuce fresh weight under different intake air velocities. The overall trend showed a downward trend followed by an upward trend and reached the max value at a canopy air velocity of 0.8 m s−1, which was higher than that in T1, T2, and T3 by 17.8%, 45.5%, and 12.4%, respectively. Based on the production yield and electricity utilization efficiency considerations, it is recommended to use a canopy air velocity of 0.8 m s−1 in actual production.
In this study, the electrical energy utilization efficiency during the entire growth period of lettuce after transplantation was calculated. Due to the different growth rates of plants at different growth stages, experiments can be conducted in subsequent studies to adjust the power of the ventilator according to different growth stages to achieve higher electricity utilization efficiency and create higher economic value. Moreover, in this study, single-row cultivation was adopted. If expanded to double-row cultivation, the cost could be further reduced.

4. Conclusions

A double-channel ventilation cultivation system was designed and created to improve the airflow distribution within the lettuce plant canopy and reduce the complexity of environmental control equipment in protected agriculture. CFD software was used to simulate airflow distribution and evaluate the airflow uniformity within the crop canopy. In the CFD model, the airflow uniformity was optimal at an intake air velocity of 10 m s−1, while at an intake air velocity of 20 m s−1, the proportion of the suitable zone reached the highest value of 83%. Furthermore, a comparison between the simulated and measured air velocity values in the plant canopy was conducted at intake air velocities of 5, 10, 15, and 20 m s−1. The results showed that the accuracy of the CFD model meets the standard. Then, a practical plant cultivation experiment was set up to validate the feasibility of the cultivation device. The results showed that the photosynthetic and transpiration rates, as well as the fresh and dry weights of lettuce plants, increased with increasing canopy air velocity. And the electric use efficiency reached the highest value at a canopy air velocity of 0.8 m s−1. Therefore, this novel cultivation system was capable of effectively improving the plant canopy environment and enhancing crop yield. Moreover, in future research, the system can be integrated with cold sources, heat sources, and CO2 generators to achieve comprehensive environmental control. Additionally, expanding the number of cultivation rows can further reduce costs.

Author Contributions

Methodology, Y.Z., C.C. and H.F.; writing—original draft preparation, Y.Z.; validation, Y.Z. and H.F.; writing—review and editing, Y.T.; funding acquisition, Y.T.; project administration, Y.T. All authors have read and agreed to the published version of the manuscript.

Funding

This work was financially supported by an innovation project (No. CAASTIP-2025-09) of the Institute of Environment and Sustainable Development in Agriculture, Chinese Academy of Agricultural Sciences, the Key Research and Development Program, Department of Science and Technology of Inner Mongolia Autonomous Region (No. 2022YFDZ0086), and the National Key Research and Development Program, Ministry of Science and Technology of China (No. 2020YFE0203600).

Data Availability Statement

The original contributions presented in this study are included in the article. Further inquiries can be directed to the corresponding author.

Conflicts of Interest

The authors declare no competing interests.

References

  1. Liao, P.; Liu, J.; Sun, L.; Chang, H. Can the Adoption of Protected Cultivation Facilities Affect Farm Sustainability? Sustainability 2020, 12, 9970. [Google Scholar] [CrossRef]
  2. Naseer, M.; Persson, T.; Righini, I.; Stanghellini, C.; Maessen, H.; Verheul, M.J. Bio-economic evaluation of greenhouse designs for seasonal tomato production in Norway. Biosyst. Eng. 2021, 212, 413–430. [Google Scholar] [CrossRef]
  3. Ghani, S.; El-Bialy, E.; Bakochristou, F.; Mohamed, M.; Mohamed, A.; Mohammad, S.; Ben, P. Experimental and numerical investigation of the thermal performance of evaporative cooled greenhouses in hot and arid climates. Sci. Technol. Built Environ. 2020, 26, 141–160. [Google Scholar] [CrossRef]
  4. Moon, S.; Kwon, S.; Lim, J. Minimization of Temperature Ranges between the Top and Bottom of an Air Flow Controlling Device through Hybrid Control in a Plant Factory. Sci. World J. 2014, 2014, 801590. [Google Scholar] [CrossRef]
  5. Boulard, T.; Fatnassi, H.; Roy, J.; Lagier, J.; Fargues, J.; Smits, N.; Rougier, M.; Jeannequin, B. Effect of greenhouse ventilation on humidity of inside air and in leaf boundary-layer. Agric. For. Meteorol. 2004, 125, 225–239. [Google Scholar] [CrossRef]
  6. Yabuki, K.; Miyagawa, H. Studies on the Effect of Wind Speed upon the Photosynthesis (2) The Relation between Wind Speed and Photosynthesis. J. Agric. Meteorol. 1970, 26, 137–141. [Google Scholar] [CrossRef]
  7. Lee, I.; Short, T. Two-dimensional numerical simulation of natural ventilation in a multi-span greenhouse. Trans. ASAE 2000, 43, 745–753. [Google Scholar] [CrossRef]
  8. Kitaya, Y.; Tsuruyama, J.; Shibuya, T. Effects of air current speed on gas exchange in plant leaves and plant canopies. Adv. Space Res. 2003, 31, 177–182. [Google Scholar] [CrossRef]
  9. Nishikawa, T.; Fukuda, H.; Murase, H. Effects of Airflow for Lettuce Growth in the Plant Factory with an Electric Turntable. IFAC Proc. Vol. 2013, 46, 270–273. [Google Scholar] [CrossRef]
  10. Kitaya, Y. Importance of air movement for promoting gas and heat exchanges between plants and atmosphere under controlled environments. In Plant Responses to Air Pollution and Global Change; Springer: Tokyo, Japan, 2005; pp. 185–193. [Google Scholar]
  11. Shibata, T.; Iwao, K.; Takano, T. Effect of vertical air flowing on lettuce growing in a plant factory. In Acta Horticulturae; International Society for Horticultural Science (ISHS): Leuven, Belgium, 1995; pp. 175–182. [Google Scholar]
  12. Kitaya, Y.; Tsuruyama, J.; Shibuya, T.; Kiyota, M. Effects of air current speed, light intensity and CO2 concentration on photosynthesis and transpiration of plant leaves. In Proceedings of the 35th COSPAR Scientific Assembly, Paris, France, 18–25 July 2004. [Google Scholar]
  13. Shibuya, T.; Tsuruyama, J.; Kitaya, Y.; Kiyota, M. Enhancement of photosynthesis and growth of tomato seedlings by forced ventilation within the canopy. Sci. Hortic. 2006, 109, 218–222. [Google Scholar] [CrossRef]
  14. Chintakovid, W.; Kubota, C.; Bostick, W.; Kozai, T. Effect of Air Current Speed on Evapotranspiration Rate of Transplant Canopy under Artificial Light. Shokubutsu Kojo Gakkaishi 2002, 14, 25–31. [Google Scholar] [CrossRef]
  15. Goto, E.; Takakura, T. Promotion of Ca Accumulation in Inner Leaves by Air Supply for Prevention of Lettuce Tipburn. Trans. ASAE 1992, 35, 647–650. [Google Scholar] [CrossRef]
  16. Wu, C.; Cheng, R.; Fang, H.; Yang, Q.; Zhang, C. Simulation and optimization of air tube ventilation in plant factory based on CFD. J. Chin. Agric. Univ. 2021, 26, 78–87. [Google Scholar]
  17. Zhang, Y.; Kacira, M.; An, L. A CFD study on improving air flow uniformity in indoor plant factory system. Biosyst. Eng. 2016, 147, 193–205. [Google Scholar] [CrossRef]
  18. Lim, T.; Kim, H. Analysis of Airflow Pattern in Plant Factory with Different Inlet and Outlet Locations using Computational Fluid Dynamics. J. Biosyst. Eng. 2014, 39, 310–317. [Google Scholar] [CrossRef]
  19. Li, K.; Zou, Z. Environmental effects of root zone ventilation on canopy and rhizosphere of lettuce in plant factory. Trans. Chin. Soc. Agric. Eng. 2019, 35, 178–187. [Google Scholar]
  20. Norton, T.; Sun, D.; Grant, J.; Fallon, R.; Dodd, V. Applications of computational fluid dynamics (CFD) in the modelling and design of ventilation systems in the agricultural industry: A review. Bioresour. Technol. 2007, 98, 2386–2414. [Google Scholar] [CrossRef]
  21. Fang, H.; Li, K.; Wu, G.; Cheng, R.; Zhang, Y.; Yang, Q. A CFD analysis on improving lettuce canopy airflow distribution in a plant factory considering the crop resistance and LEDs heat dissipation. Biosyst. Eng. 2020, 200, 1–12. [Google Scholar] [CrossRef]
  22. Zhang, C.; Fang, H.; Cheng, R.; Ynag, Q.; Wei, X.; Wu, C. Aerodynamic properties of lettuce canopy based on wind tunnel system. J. China Agric. Univ. 2019, 24, 96–103. [Google Scholar]
  23. Zhang, Y.; Yasutake, D.; Hidaka, K.; Kitano, M.; Okayasu, T. CFD analysis for evaluating and optimizing spatial distribution of CO2 concentration in a strawberry greenhouse under different CO2 enrichment methods. Comput. Electron. Agric. 2020, 179, 105811. [Google Scholar] [CrossRef]
  24. Patanker, S. Numerical Heat Transfer and Fluid Flow; CRC Press: Boca Raton, FL, USA, 1980. [Google Scholar] [CrossRef]
  25. Mirade, P.; Daudin, J. Computational fluid dynamics prediction and validation of gas circulation in a cheese-ripening room. Int. Dairy J. 2006, 16, 920–930. [Google Scholar] [CrossRef]
  26. Zhang, Y.; Yasutake, D.; Hidaka, K.; Okayasu, T.; Kitano, M.; Hirota, T. Crop-localised CO2 enrichment improves the microclimate, photosynthetic distribution and energy utilisation efficiency in a greenhouse. J. Clean. Prod. 2022, 371, 133465. [Google Scholar] [CrossRef]
  27. Ahmed, H.; Tong, Y.; Li, L.; Sahari, S.; Almogahed, A.; Cheng, R. Integrative Effects of CO2 Concentration, Illumination Intensity and Air Speed on the Growth, Gas Exchange and Light Use Efficiency of Lettuce Plants Grown under Artificial Lighting. Horticulturae 2022, 8, 270. [Google Scholar] [CrossRef]
  28. Wang, J.; Yang, Q.; Tong, Y. Effects on electric-energy and light use efficiency and quality for lettuce under different light intensities supplied with red light and blue light. J. China Agric. Univ. 2016, 21, 59–66. [Google Scholar]
  29. Tamimi, E.; Kacira, M.; Yeonsik, C.; An, L. Analysis of Microclimate Uniformity in a Naturally Vented Greenhouse with a High-Pressure Fogging System. Trans. ASABE 2013, 56, 1241–1254. [Google Scholar] [CrossRef]
  30. Kitaya, Y.; Shibuya, T.; Kozai, T.; Kubota, C. Effects of light intensity and air velocity on air temperature, water vapor pressure, and CO2 concentration inside a plant canopy under an artificial lighting condition. Life Support Biosph. Sci. Int. J. Earth Space 1998, 5, 199–203. [Google Scholar]
  31. Wells, C.; Amos, N. Design of air Distribution Systems for Closed Greenhouses; International Society for Horticultural Science (ISHS): Leuven, Belgium, 1994; pp. 93–104. [Google Scholar]
  32. Clarkson, J.; Fawcett, L.; Anthony, S.; Young, C. A Model for Sclerotinia sclerotiorum Infection and Disease Development in Lettuce, Based on the Effects of Temperature, Relative Humidity and Ascospore Density. PLoS ONE 2014, 9, e94049. [Google Scholar] [CrossRef] [PubMed]
  33. Lyimo, H.; Pratt, R.; Mnyuku, R. An effective integrated crop management strategy for enhanced maize production in tropical agroecosystems prone to gray leaf spot. Crop Prot. 2012, 41, 57–63. [Google Scholar] [CrossRef]
  34. Kawasaki, Y.; Yoneda, Y. Local Temperature Control in Greenhouse Vegetable Production. Hortic. J. 2019, 88, 305–314. [Google Scholar] [CrossRef]
  35. Dupont, K.; Den, T.; Zhang, J.; Moene, A.; Vialet-Chabrand, S.R.M. Beyond the boundary: A new road to improve photosynthesis via wind. J. Exp. Bot. 2025, 00, 1–23. [Google Scholar] [CrossRef] [PubMed]
  36. Korthals, R.; Knight, S.; Christianson, J.; Spomer, L. Chambers for studying the effects of airflow velocity on plant growth. Biotronics 1994, 23, 113–119. [Google Scholar]
  37. Ahmed, H.A.; Yuxin, T.; Qichang, Y. Lettuce plant growth and tipburn occurrence as affected by airflow using a multi-fan system in a plant factory with artificial light. J. Therm. Biol. 2020, 88, 102496. [Google Scholar] [CrossRef]
  38. Gruda, N.; Samuolienė, G.; Dong, J.; Li, X. Environmental conditions and nutritional quality of vegetables in protected cultivation. Compr. Rev. Food Sci. Food Saf. 2025, 24, e70139. [Google Scholar] [CrossRef]
  39. Shibuya, T.; Kozai, T. Effects of Air Current Speed on Net Photosynthetic and Evapotranspiration Rates of a Tomato Plug Sheet under Artificial Light. Environ. Control Biol. 1998, 36, 131–136. [Google Scholar] [CrossRef]
  40. Farquhar, G.; Sharkey, T. Stomatal Conductance and Photosynthesis. Annu. Rev. Plant Physiol. 1982, 33, 317–345. [Google Scholar] [CrossRef]
  41. Takahashi, Y.; Joo, H.; Pankasem, N.; Hsu, P.; Schroeder, J. Stomatal CO2 sensing in plants: Control of gas exchange and interactions with environmental stimuli. Plant Cell Physiol. 2025, 66, 1259–1273. [Google Scholar] [CrossRef] [PubMed]
  42. Kim, H.; Goins, G.; Wheeler, R.; Sager, J. Stomatal Conductance of Lettuce Grown Under or Exposed to Different Light Qualities. Ann. Bot. 2004, 94, 691–697. [Google Scholar] [CrossRef]
  43. Lee, J.; Choi, C.; Jang, Y.; Jang, S.; Lee, S.; Um, Y. Effects of air temperature and air flow rate control on the tipburn occurrence of leaf lettuce in a closed-type plant factory system. Hortic. Environ. Biotechnol. 2013, 54, 303–310. [Google Scholar] [CrossRef]
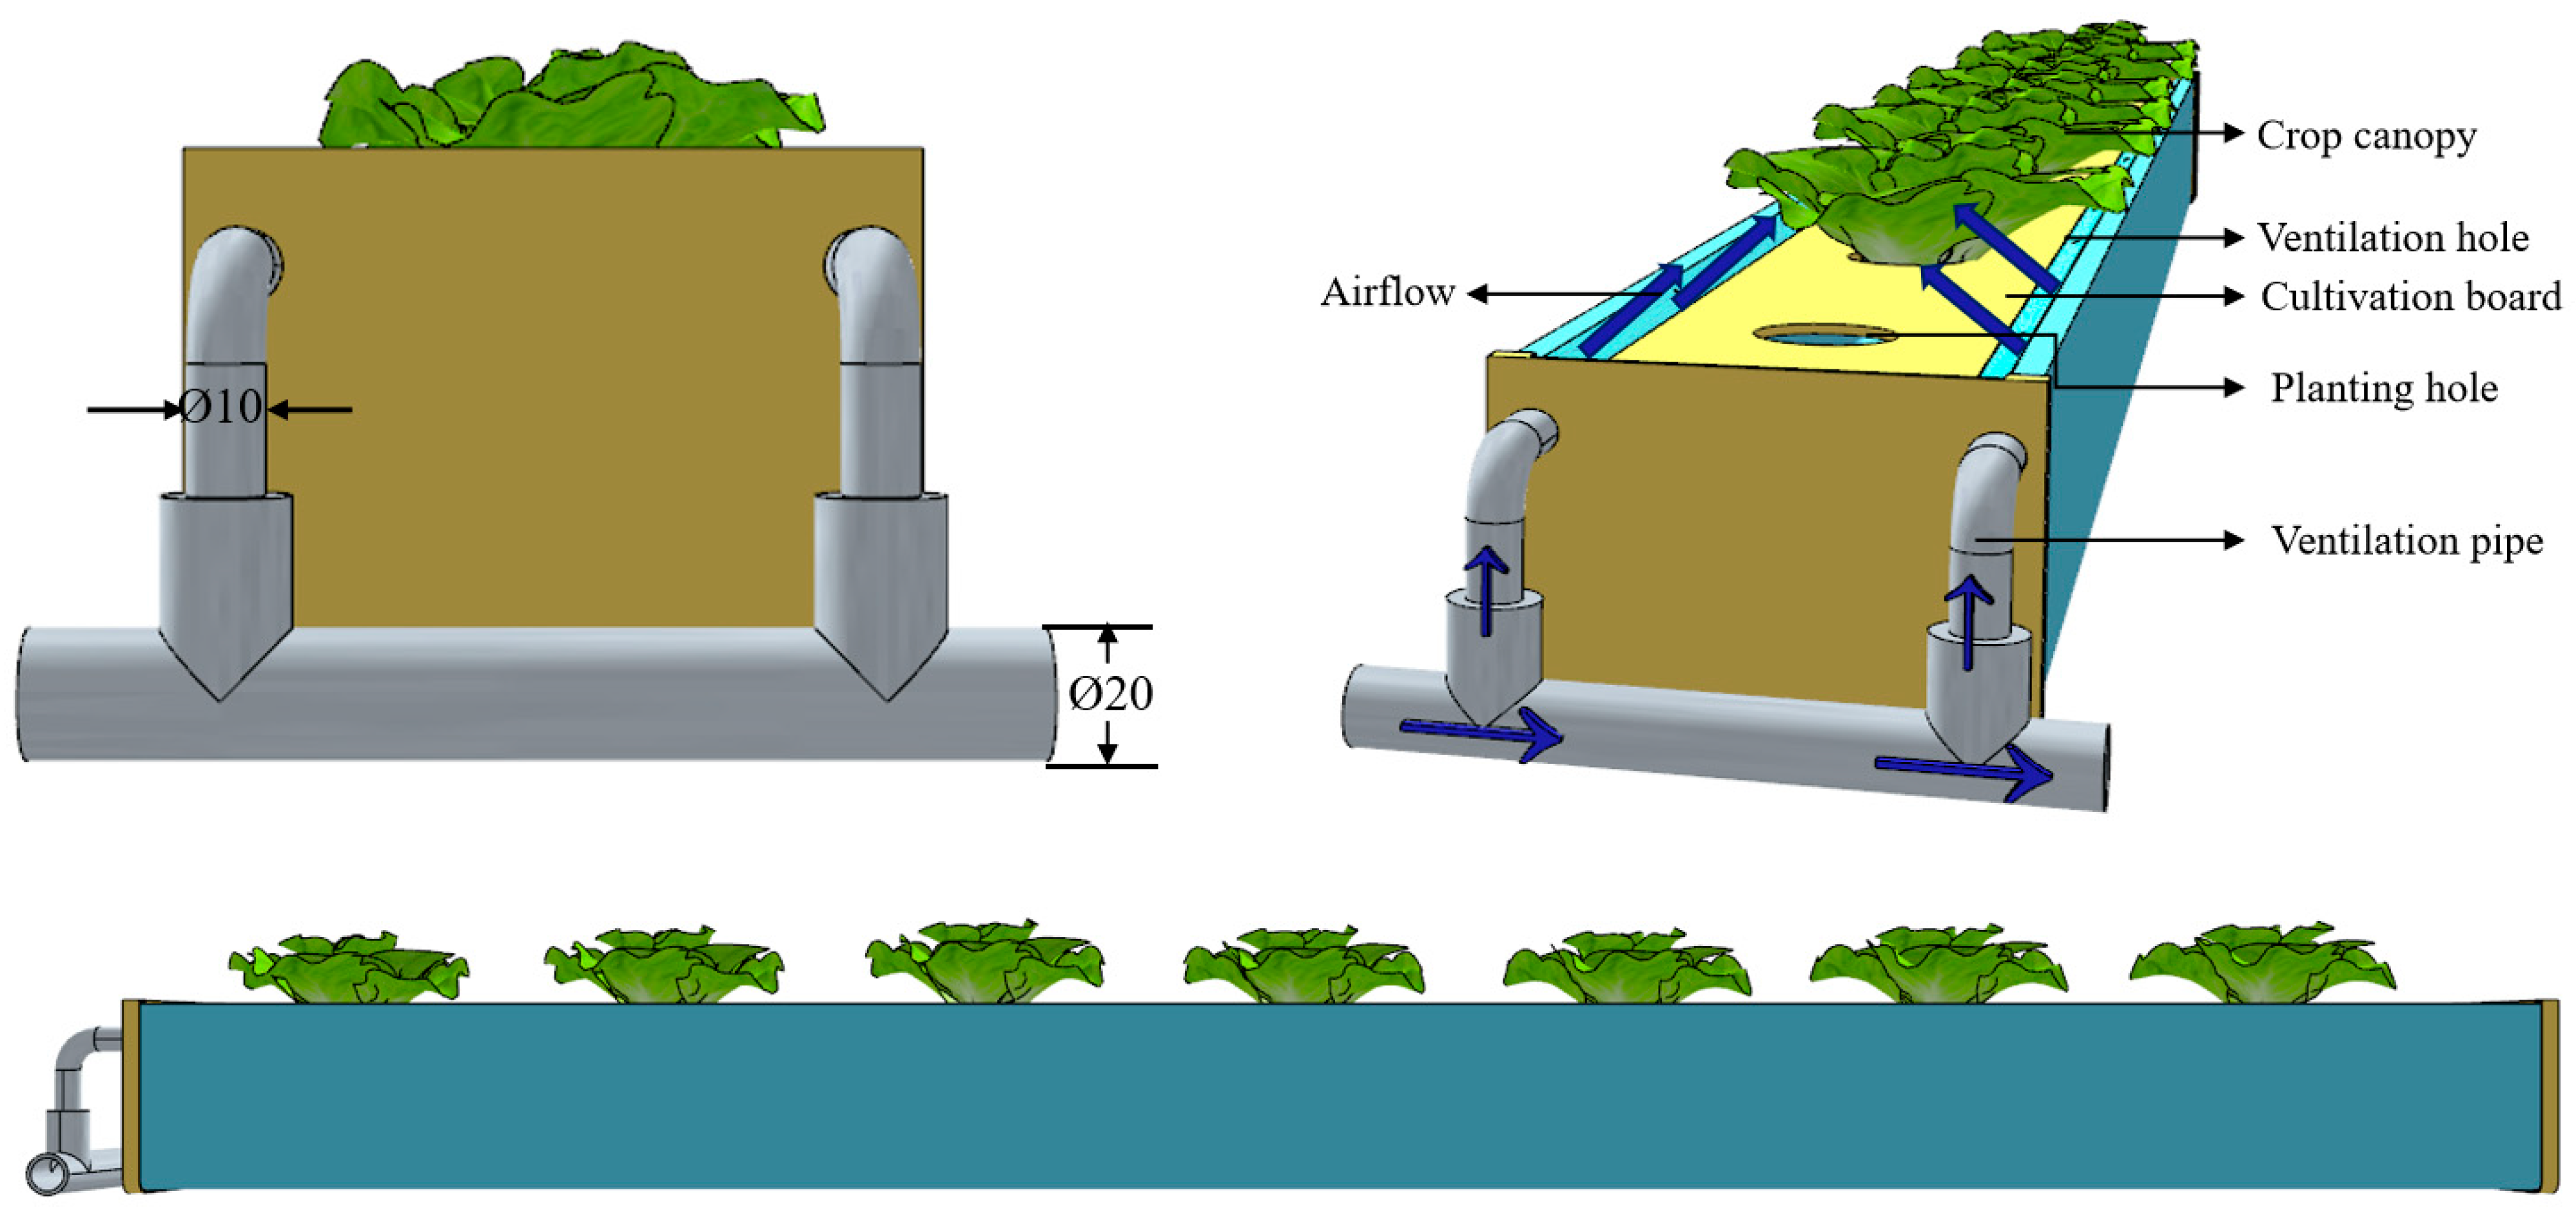
Figure 1. The structure of the cultivation tank. The blue arrows denote the airflow.
Agronomy 15 02326 g001
Figure 2. The planting holes on the cultivation board.
Agronomy 15 02326 g002
Figure 3. The ventilated holes on the cultivation tank.
Agronomy 15 02326 g003
Figure 4. The grid of the domain.
Agronomy 15 02326 g004
Figure 5. Air velocity-measured point.
Agronomy 15 02326 g005
Figure 6. Canopy air temperature and relative humidity-measured point.
Agronomy 15 02326 g006
Figure 7. Summary of simulated and measured data for model validation. (a) Intake air velocity of 5 m s−1; (b) intake air velocity of 10 m s−1; (c) intake air velocity of 15 m s−1; and (d) intake air velocity of 20 m s−1. The red stripe in the figure is the 95% confidence interval.
Agronomy 15 02326 g007
Figure 8. The air velocity vector under different intake air velocities at the cross-section of Y = 0.18 m (the first ventilated hole).
Agronomy 15 02326 g008
Figure 9. The distribution of plant canopy air velocity under different intake air velocities.
Agronomy 15 02326 g009
Figure 10. Canopy environment under different treatments during the whole experiment period (from March 2023 to April 2023).
Agronomy 15 02326 g010
Figure 11. Time course (8:00~20:00) of air temperature (a) and relative humidity (b) within the plant canopy on day 21 after transplanting.
Agronomy 15 02326 g011aAgronomy 15 02326 g011b
Figure 12. The shoot and root fresh weights of lettuce plants were affected by different air velocities. T1, T2, T3, and T4 represent the treatments of canopy air velocity of 0.35, 0.5, 0.65, and 0.8 m s−1, respectively. Different letters in the figure indicate significant differences using the Tukey test, where p ≤ 0.05.
Agronomy 15 02326 g012
Figure 13. The shoot and root dry weights of lettuce plants were affected by different air velocities. Different letters in the figure indicate significant differences using the Tukey test, where p ≤ 0.05.
Agronomy 15 02326 g013
Figure 14. The total leaf area and total leaf number of lettuce plants were affected by different air velocities. Different letters in the figure indicate significant differences using the Tukey test, where p ≤ 0.05.
Agronomy 15 02326 g014
Figure 15. The photosynthetic parameters of lettuce plants were affected by different air velocities, where (a) is the net photosynthetic rate, (b) is the transpiration rate, (c) is stomatal conductance, and (d) is intercellular carbon dioxide concentration. Different letters in the figure indicate significant differences using the Tukey test, where p ≤ 0.05.
Agronomy 15 02326 g015
Figure 16. The electric use efficiency of lettuce under different treatments.
Agronomy 15 02326 g016
Table 1. The mesh quality parameters of the CFD model.
MaxMinAverage
Skewness0.692.9 × 10−40.21
Aspect ratio5.51.11.8
Orthogonality10.270.78
Table 2. Air current velocities at inlets and boundary conditions summary for CFD simulation for cultivation system design.
Fluid: Air
Operating Air Temperature in the Production Domain: 297 K
Gravitational Acceleration: 9.81 m s−2
Viscous Model: Realizable K-Epsilon Model with Standard Wall Functions and Full Buoyancy Effect
ParameterBoundary conditionsProperty
Air-pipe-inletVelocity—inlet5/6/7/8/9/10/15/20 m s−1
Two-side-wall-1Pressure—outletGauge pressure: 0 Pa
Pipe-wallWallDefault
Two-side-wall-2Pressure—outletGauge pressure: 0 Pa
Top-side-wallPressure—outletGauge pressure: 0 Pa
Table 3. The components and concentration of the nutrient solution used in this study.
ElementConcentration (mg L−1)
Ca(NO3)2·4H2O236
KNO3404
NH4H2PO457
MgSO4·7H2O123
H3BO32.86
MnSO4·4H2O2.13
ZnSO4·7H2O0.22
CuSO4·5H2O0.08
(NH4)6MO7O24·4H2O0.02
NaFe-EDTA·3H2O32.4
Table 4. The distribution and proportion of stagnant, suitable, and high-velocity zones under different intake air velocities.
Intake Air Velocity
(m s−1)
Percentage (%)Volume-Weighted Average Velocity
(m s−1)
v < 0.1 m s−10.1 m s−1 ≤ v ≤ 1 m s−1v > 1 m s−1
5534700.11
6435700.14
7554500.14
8455410.18
9405820.20
1034.5632.50.22
15177850.30
20108370.37
Table 5. The coefficient of variation (CV) and standard deviation of air velocity within the plant canopy.
Intake Air Velocity
(m s−1)
Standard DeviationVolume-Weighted
Average Velocity
(m s−1)
CV (%)
50.090.1182
60.100.1471
70.100.1471
80.130.1872
90.140.2069
100.140.2264
150.240.3080
200.300.3781
Disclaimer/Publisher’s Note: The statements, opinions and data contained in all publications are solely those of the individual author(s) and contributor(s) and not of MDPI and/or the editor(s). MDPI and/or the editor(s) disclaim responsibility for any injury to people or property resulting from any ideas, methods, instructions or products referred to in the content.