Article

Transcriptome Analysis Revealed the Molecular Mechanism of Cyanogenic Glycoside Synthesis in Flax

1
Institute of Industrial Crops of Heilongjiang Academy of Agricultural Sciences, Harbin 150000, China
2
Agricultural College, Inner Mongolia Agricultural University, Hohhot 010019, China
3
Institute of Biotechnology, Heilongjiang Academy of Agricultural Sciences, Harbin 150000, China
4
Institute of Bast Fiber Crops, Chinese Academy of Agricultural Sciences, Changsha 410000, China
5
Faculty of Agronomy, Jilin Agricultural University, Changchun 130118, China
*
Authors to whom correspondence should be addressed.
These authors contributed equally to this work.
Agronomy 2025, 15(10), 2327; https://doi.org/10.3390/agronomy15102327
Submission received: 26 August 2025 / Revised: 27 September 2025 / Accepted: 28 September 2025 / Published: 1 October 2025
(This article belongs to the Section Plant-Crop Biology and Biochemistry)

Abstract

This study aims to elucidate the molecular mechanisms underlying cyanogenic glycoside accumulation in flax. As an important oil and fiber crop, the nutritional value of flax is compromised by the toxicity of cyanogenic glycoside. To clarify the key genetic regulators and temporal patterns of cyanogenic glycoside biosynthesis, transcriptomic sequencing was performed on seeds from high- and low-cyanogenic glycoside flax varieties (‘MONTANA16’ and ‘Xilibai’) at three developmental stages: bud stage, full flowering stage, and capsule-setting stage. A total of 127.25 Gb of high-quality data was obtained, with an alignment rate exceeding 87.80%. We identified 31,623 differentially expressed genes (DEGs), which exhibited distinct variety- and stage-specific expression patterns. Principal component analysis (PCA) and hierarchical clustering demonstrated strong reproducibility among biological replicates and revealed the seed pod formation stage as the period with the most significant varietal differences, suggesting it may represent a critical regulatory window for cyanogenic glycoside synthesis. GO and KEGG enrichment analyses indicated that DEGs were primarily involved in metabolic processes (including secondary metabolism and carbohydrate metabolism), oxidoreductase activity, and transmembrane transport functions. Of these, the cytochrome P450 pathway was most significantly enriched at the full bloom stage (H2 vs. L2). A total of 15 LuCYP450 and 13 LuUGT85 family genes were identified, and their expression patterns were closely associated with cyanogenic glycoside accumulation: In high-cyanogenic varieties, LuCYP450-8 was continuously upregulated, and LuUGT85-12 was significantly activated during later stages. Conversely, in low-cyanogenic varieties, high expression of LuCYP450-2/14 may inhibit synthesis. These findings systematically reveal the genetic basis and temporal dynamics of cyanogenic glycoside biosynthesis in flax and highlight the seed pod formation stage as a decisive regulatory window for cyanogenic glycoside synthesis. This study provides new insights into the coordinated regulation of cyanogenic pathways and establishes a molecular foundation for breeding flax varieties with low CNG content without compromising agronomic traits.

1. Introduction

Flax (Linum usitatissimum L.) is an annual herbaceous plant belonging to the genus Linum within the Linacese family. It is also among the oldest crops cultivated by humans [1,2]. Flax can be classified based on inflorescence branching and main stem morphological characteristics. The classification system distinguishes three types: oil-type flax, fiber-type flax, and oil–fiber dual-purpose flax [3,4]. In Chinese regions including Shanxi, Gansu, and Inner Mongolia, flax is primarily cultivated as an oilseed crop. Oil extracted from its seeds is rich in alpha-linolenic acid (40–60%), 18 essential amino acids for human health, lignans, vitamins, and dietary fiber [5,6]. Consumption of flax seed oil has been shown to offer multiple health benefits, including alleviating chronic inflammatory conditions such as arthritis and nephritis. Additionally, it exhibits physiological activities such as inhibiting platelet aggregation, regulating blood lipids and blood pressure, and potential anticancer effects [7,8]. However, the presence of toxic substances (e.g., cyanogenic glycosides) in flax seeds has been identified as a major barrier to the development of the flax industry [9]. Consequently, selective breeding of varieties with reduced cyanogenic glycoside content is recognized as a pivotal strategy to advance the flax seed industry. Furthermore, elucidating the molecular mechanisms underlying cyanogenic glycoside synthesis in flax seeds from an omics perspective is of great significance for the targeted improvement in varieties [10]. Cyanogenic glycosides are a class of compounds formed by the condensation of cyanohydrin derivatives with D-glucose through glycosidic linkages. Substitution patterns serve to distinguish the two primary classes of cyanogenic glycosides: aromatic and aliphatic [11,12]. These compounds have been identified in a range of plant species, with over 10,000 species across families, such as Linales, Fabales, Rosales, and Asterales. Their distribution varies among different crops species [13]. Cyanogenic glycosides in flax are predominantly localized in the seed coat and endosperm. A significant negative correlation has been observed between oil content and cyanogenic glycoside content in flax seeds [14]. Cyanogenic glycosides in flax seeds are predominantly monosaccharide glycosides (e.g., linamarin and lotusin) and disaccharide glycosides (e.g., β-gentiobioside methyl ethyl ketone cyanohydrin and β-gentiobioside propyl ketone cyanohydrin) [15]. Studies have shown that cyanogenic glycosides content varies significantly among different flax varieties. For example, Oomah et al. reported that flax glycosides content ranged from 13.8 to 31.9 mg/100 g, β-gentiobioside methyl ethyl ketone cyanohydrin ranged from 73 to 454 mg/100 g, and β-gentiobioside propyl ketone cyanohydrin from 218 to 538 mg/100 g [16].
The biosynthesis of cyanogenic glycosides initiates with L-amino acids as substrates, catalyzed by members of the CYP79 and CYP71 subfamilies within the cytochrome P450 (CYP450) gene family. This process involves α-amino acid hydroxylation, conversion of the resulting aldoxime to a nitrile, and other steps, ultimately leading to glucose transferase-catalyzed semi-cyanohydrin glycosylation [17]. Cytochrome P450 enzymes exhibit a high degree of substrate specificity, with their functions varying across plant species: CYP79A1, involved in sorghum glycosides synthesis in sorghum, utilizes tyrosine as a substrate, whereas CYP71E1 not only catalyzes the aldol derivatives of phenylalanine, valine, or isoleucine [18]. In Lotus corniculatus L., CYP79D3 and CYP79D4 share 95% sequence similarity but exhibit distinct substrate specificities: CYP79D3 acts on L-isoleucine, whereas CYP79D4 specifically recognizes L-valine [19]. Manihot esculenta CYP79D1 also utilizes L-valine as its substrate [20]. Additionally, interspecific differences in cyanogenic glycosides sites have been observed. For example, CYP79D3 in Japanese Lotus corniculatus is expressed in leaves [21], whereas cyanogenic glycosides in cassava are first synthesized in the aboveground tissues and subsequently transported via the phloem to the roots for storage [22]. CYP79D1 and CYP79D2 are highly expressed in mesophyll cells and phloem-associated tissues, with significantly upregulated expression levels in parenchyma cells between vascular bundles [23].
Flax, a key oilseed crop in northern China, has been the focus of extensive research on improving agronomic and quality traits [24,25,26]. To this end, this study employed two extreme materials—low-cyanogenic glycoside accession ‘MONTANA16’ and high-cyanogenic glycoside accession ‘Xilibai’—selected from 269 flax germplasm resources and conducted comparative transcriptomic analysis of seeds at different developmental stages. By investigating spatiotemporal dynamics of gene expression, we identified key candidate genes, including LuCYP450-8 and LuUGT85-12, and determined the capsule formation stage as a critical regulatory window for cyanogenic glycoside accumulation. Furthermore, a putative regulatory model underlying the divergence between high- and low-cyanogenic glycoside cultivars was proposed. As the first study to integrate developmental timing and varietal variation in elucidating the transcriptional regulatory network of cyanogenic glycoside biosynthesis in flax, our work provides novel insights and valuable genetic resources for molecular breeding aimed at developing new flax varieties with low-cyanogenic glycoside and high oil content.

2. Materials and Methods

2.1. Plant Materials and Treatments

In the previous study by the research group, two accessions were selected for experimental analysis based on cyanogenic glycoside content measurements of seeds in 269 flax germplasm samples (primarily consisting of oil-type flax and oil–fiber dual-purpose flax). These include the low-content 'MONTANA16' (cyanogenic glycoside 9.09 mg/100 g, paeonia glycoside 6.54 mg/100 g) and the high-content 'XiliBai' (cyanogenic glycoside 172.94 mg/100 g, paeonia glycoside 103.37 mg/100 g). In late April 2023, the accession was planted at the Teaching Farm of Inner Mongolia Agricultural University (40°43′50.33″N, 111°55′32.27″E). Each accession was planted in three rows, each 1.5 m in length with a row spacing of 0.25 m. Approximately 180 seeds were sown per row at a depth of 5–7 cm. Field management followed standard practices, incorporating flax cultivation techniques until sampling at the flowering stage. Each flower bud was date-labeled during sampling, and seed samples were collected at the bud stage (10 days post-flowering), full flowering stage (20 days post-flowering), and capsule-setting stage (30 days post-flowering). Samples were immediately frozen in liquid nitrogen and stored at −80 °C for subsequent RNA extraction and transcriptomic sequencing. The following sample naming conventions apply: L1, L2, and L3 represent seeds from accession “MONTANA16” variety at 0, 15, and 30 days post-flowering, respectively; H1, H2, and H3 represent seeds from accession A15 at 0, 15, and 30 day post-flowering, respectively. Transcriptomic sequencing was performed with three biological replicates per sample.

2.2. RNA Extraction, cDNA Library Construction and Transcriptome Sequencing

Total RNA was extracted from flax seeds at different developmental stages using the CTAB method: Samples were treated with CTAB extraction buffer (2% CTAB, 100 mmol/L Tris-HCl pH 8.0, 20 mmol/L EDTA, 1.4 mol/L NaCl, 2% PVP-40, and 0.1% β-mercaptoethanol), followed by extraction chloroform-isopropanol (24:1), isopropanol precipitation, 75% ethanol washing, and final dissolution in RNase-free water. RNA integrity was evaluated via 1.5% agarose gel electrophoresis, and RNA concentration and purity were determined using a Nanodrop ND-100 microspectrophotometer (Nanodrop Technology Inc., Wilmington, DE, USA). Qualified RNA samples were selected for cDNA synthesis. The cDNA library was constructed using the Illumina Truseq Stranded mRNA Library Prep Kit (refer to the kit manual for detailed protocols). After successful quality control, paired-end deep sequencing was performed on the Illumina HiSeq 2000 platform (read length 150 bp). Transcriptome sequencing was performed by Beijing Novogene Co., Ltd (Beijing, China).

2.3. Transcriptome Data Quality Control

Raw sequencing data (raw reads) were processed using Cutadapt software (v2.10) to remove the sequencing adapters and primer sequences [27]. This was followed by filtering low-quality reads (where bases with Q ≤ 20 accounted for >50% of the read) and reads containing >10% unknown bases (N) using the fastp software (v0.23.2), yielding clean data (Table S2) [28]. Sequencing data quality was evaluated using Q20 (error rate ≤ 1%) and Q30 (error rate ≤ 0.1%), with both metrics required to be ≥85% for data qualification. HISAT2 software (v2.2.1) was used to align the cleaned data with the reference genome of the flax variety ‘Longya 10’ (accession number QMEI02000000) [29,30]. FeatureCounts software (v2.0.1) was used to quantify reads at the gene level, generating a gene expression count matrix for subsequent differential analysis [31].

2.4. Identification and Functional Annotation Analysis of Differentially Expressed Genes (DEGs)

Based on the count matrix, differential expression analysis was performed using the R package DESeq2 (v1.34.0) [32]. Gene expression data were modeled using a negative binomial distribution, and the Wald statistical test was used to calculate intergroup fold change. p-values were subsequently corrected using the Benjamini–Hochberg method to obtain the false discovery rate (FDR) [33]. DEGs were filtered |log2FC| ≥ 1 and an FDR of <0.05 [34]. The Gene Ontology (GO) database (https://geneontology.org/, accessed on 25 July 2025) and the Kyoto Encyclopedia of Genes and Genomes (KEGG) database (https://www.kegg.jp/kegg/, accessed on 25 July 2025) were used to perform GO and KEGG enrichment analyses on DEGs using TBtools software (v2.225) [35].

2.5. qRT-PCR Validation

To validate the reliability of the transcriptomic data, 10 genes were randomly selected from DEGs involved in the cyanogenic glycoside biosynthesis pathway for qRT-PCR validation. The flax elongation factor gene LuEF1A served as the internal reference gene, with specific primers that were designed using Primer Premier 6.0 software (Table S4). qRT-PCR was performed using the SYBR Premix Ex Taq kit (TaKaRa, Dalian, China) on a real-time fluorescent quantitative PCR system (FTC-3000TM). The 20 μL reaction system comprises 10 μL 2×SYBR qPCR Master Mix, 2 μL of diluted cDNA template (10-fold), 0.5 μL each of forward and reverse primers (10 μmol/L), and 7 μL of double-distilled water (ddH2O). Reaction program: Thermal cycling conditions for the amplification were 95 °C for 5 min, followed by 40 cycles of 95 °C for 10, 54 °C for 30 s, and 65 °C for 10 s. A final melting curve analysis at 95 °C was performed to verify amplification specificity. Amplified products were subsequently stored at 4 °C. Three biological replicates and three technical replicates were established for each sample. Relative gene expression levels were calculated using the 2−ΔΔCT method [36], and the resulting relative expression bar charts were generated using GraphPad Prism 9.0 (mean ± standard deviation) [37].

2.6. Statistical Analysis

Experimental data were analyzed using Microsoft Excel 2019 and IBM SPSS Statistics 20.0. Multiple groups were compared via one-way analysis of variance (ANOVA), and pairwise comparisons between groups were performed using the LSD-t test. The significance level was set at p < 0.05 [38,39,40]. Bar charts were generated using GraphPad Prism 9.0, volcano plots (EnhancedVolcano package) [41], Venn diagrams (ggVennDiagram package) [42] were constructed using R software (v4.2.3), and GO/KEGG enrichment results were visualized using the MicroBioinformatics platform (https://www.bioinformatics.com.cn/, accessed on 25 July 2025).

3. Results

3.1. Sequencing Data Quality Assessment

After filtering raw data using fastp, this study obtained a total of 127.25 Gb of high-quality clean data, with an average of 7.07 Gb of clean data per sample. The clean reads were aligned to the ‘Longya 10’ reference genome (accession number: QMEI02000000) using HISAT2. The results revealed that except for sample L2_3 (alignment rate: 87.80%), the alignment rates of all other samples exceeded 90%, with the highest reaching 95.09%. For all samples, the Q20 base percentage was ≥98.79%, the Q30 base percentage was ≥96.15%, and the GC content ranged from 47.00 to 51.36. These findings indicate that the sequencing data quality meets the requirements for subsequent analyses (Table S1).

3.2. Correlation Analysis Between Samples

Principal component analysis (PCA) of transcriptome data revealed that the first (PC1) and second (PC2) principal components explained 96.69% and 1.49% of the variance, respectively, with a cumulative contribution rate of 98.18% (Figure 1A). Except for three biological replicates of the ‘MONTANA16’ cultivar at 30 days post-flowering, which displayed a moderate degree of dispersion, all other samples exhibited robust intragroup clustering. Hierarchical clustering heat map analysis of FPKM values further confirmed that biological replicates at the same developmental stage exhibited extremely high similarity, whereas samples at different stages showed distinct separation (Figure 1B). This might be associated with differential expression regulation of cyanogenic glycoside biosynthesis-related genes between the two cultivars during late development.

3.3. Genome-Wide Expression Profile Analysis of Different Flax Varieties at Different Developmental Stages

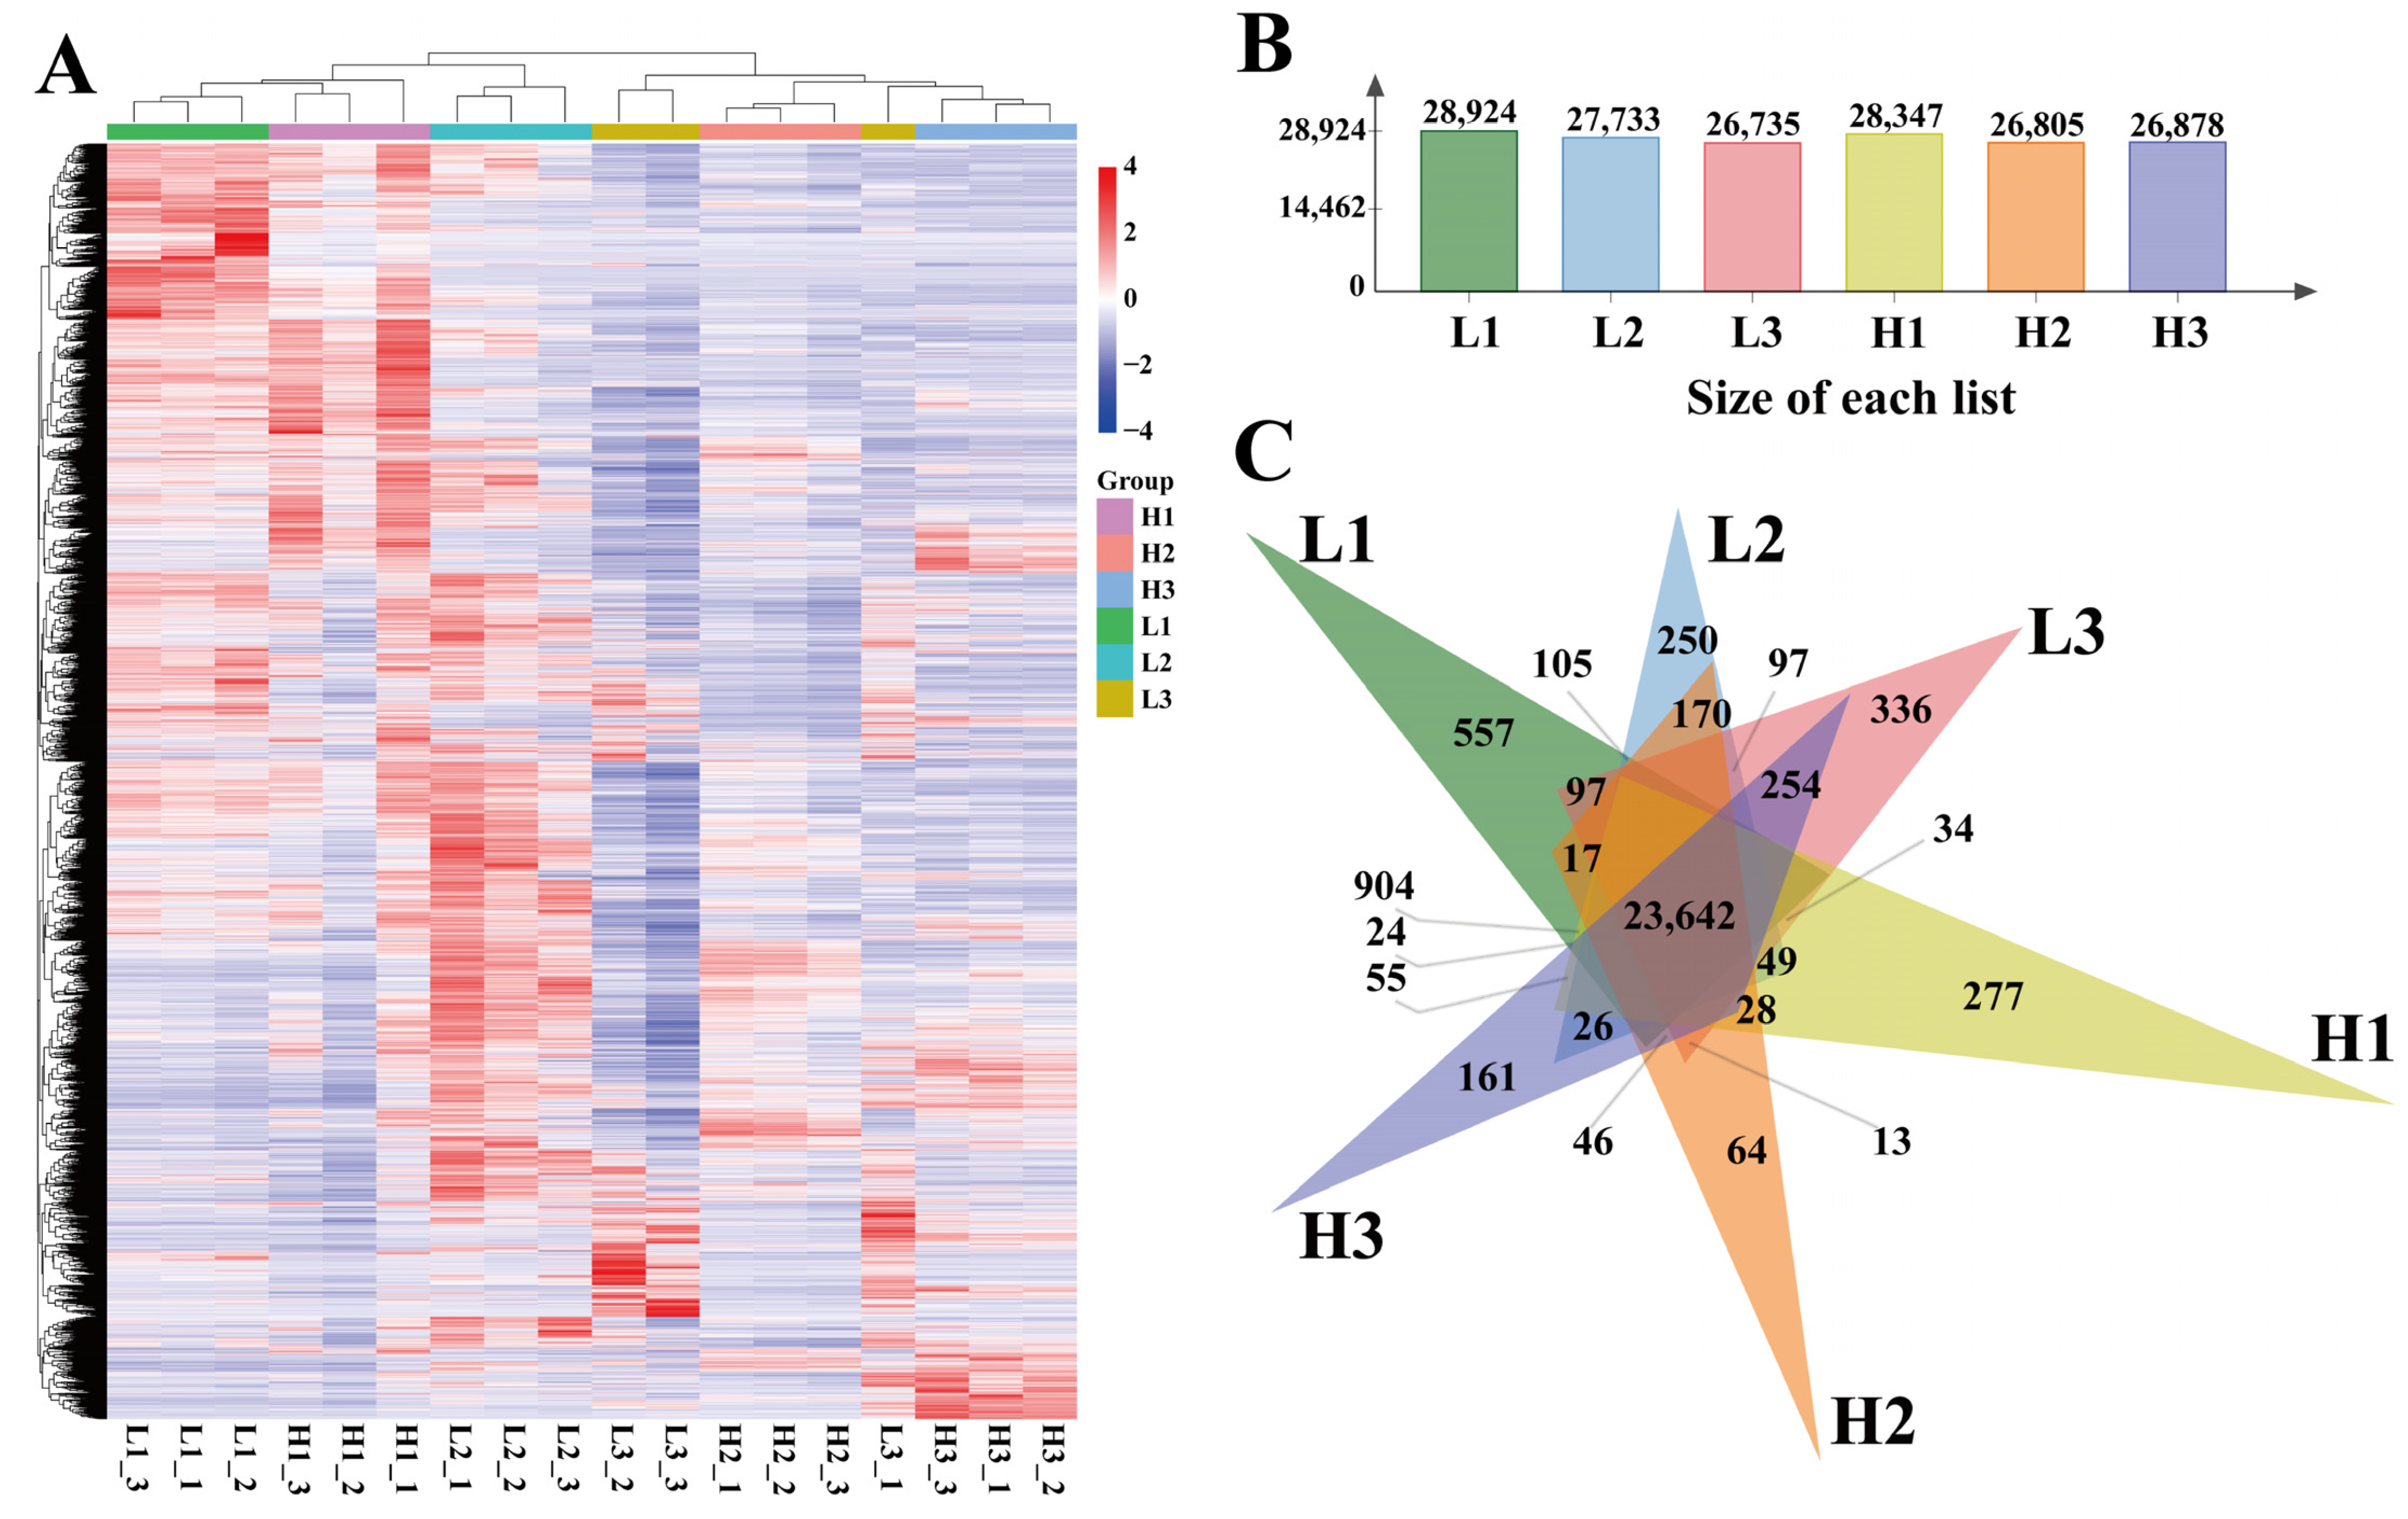
Following quality control, RNA-Seq data were aligned to the ‘Longya 10’ reference genome using HISAT2, resulting in the effective alignment of 43,668 genes. Genes from different flax cultivars at various developmental stages were filtered based on multiple criteria, including gene count > 30, |log2FC| > 1, and DFR < 0.05. Ultimately, 31,623 differentially expressed genes were identified among the six flax samples. Visualization of the expression levels of these genes via a heat map clearly demonstrated significant differences between the six flax sample groups (Figure 2A).
Further subgroup analysis revealed that the number of differentially expressed genes in groups L1, L2, L3, H1, H2, and H3 was 28,924, 27,733, 26,735, 28,347, 26,805, and 26,878, respectively (Figure 2B,C). Additionally, co-expression pattern analysis of differentially expressed genes across samples showed that 23,642 genes were expressed in all six flax samples, whereas groups L1, L2, L3, H1, H2, and H3 contained 557, 250, 336, 277, 64, and 161 specifically expressed genes, respectively (Figure 2B).

3.4. Identification and Analysis of DEGs in Different Periods of Flax

This study used the screening criteria of |log2FC| > 1 and DFR < 0.05 and summarized the number and expression trends of differential genes in the nine comparison groups as follows. Dynamic changes across different developmental stages of the same cultivar: In the low-cyanogenic glycoside cultivar, the L3 vs. L1 group contained the largest number of DEGs (10,658), with downregulated genes (6451) accounting for a higher proportion than upregulated genes (4207) (Figure 3A). This indicates that a large number of genes were transcriptionally repressed throughout seed development (from L1 to L3). The L2 vs. L1 group (7700 DEGs) and L2 vs. L3 group (8120 DEGs) contained a similar number of differential genes, yet the L2 vs. L3 group exhibited slightly more upregulated genes (4217) than downregulated genes (3903), reflecting stage-specific gene activation from the middle (L2) to late (L3) developmental stages. In the high-cyanogenic glycoside cultivar, the H3 vs. H1 group contained a significantly larger number of DEGs (9440) compared to the H2 vs. H1 group (8188) and H2 vs. H3 group (6021). Furthermore, downregulated genes accounted for a higher proportion than upregulated genes in all these groups (e.g., 5514 downregulated genes in the H3 vs. H1 group, accounting for 58.4%), indicating that gene expression regulation in high-cyanogenic cultivars tend to strengthen the inhibitory effect during the late developmental stage.
This section aims to identify and examine the differentiation characteristics of different varieties at the same developmental stage. During the early developmental stage (H1 vs. L1), a total of 4202 differentially expressed genes (DEGs) were identified, with downregulated genes (2953) accounting for 70%. These results indicate that gene expression differences between varieties are primarily regulated by inhibitory mechanisms at the early stage. During the mid-developmental stage (H2 vs. L2), the number of differentially expressed genes (DEGs) decreased to 3290, with 1739 upregulated and 1551 downregulated genes, suggesting a tendency towards metabolic pathway balance between varieties at this stage. In the late developmental stage (H3 vs. L3), the number of DEGs increased significantly to 7175, with the ratio of upregulated to downregulated genes (3653:3522) approaching 1:1. This indicates that the differences in gene expression between varieties are further amplified via bidirectional regulation during seed maturation. This finding is highly consistent with the variety-specific accumulation of cyanogenic glycosides (i.e., rapid accumulation in high-cyanogenic varieties during the late stage).
To analyze the commonalities and specificities of differentially expressed genes, Venn diagram analysis was performed to identify shared and unique genes across the nine comparison groups (Figure 3B). Regarding the comparisons of developmental stages within varieties, the results revealed that the L3 vs. L1 group exhibited the highest number of specific genes (1303 out of 3492), indicating the most significant gene remodeling throughout seed development; the H3 vs. H1 group had the second highest number (1303/2772), indicating that gene regulation in high-cyanogenic varieties becomes more inhibitory in the later stages. The L3 vs. L2 and H3 vs. H2 groups exhibited a reduced number of specific genes (1380/2378 and 1373/1300, respectively), indicative of more targeted gene adjustments in the subsequent phases of development. Regarding the inter-variety comparisons at the same developmental stage, the H3 vs. L3 group exhibited a significantly higher number of specific genes (1687/1544) compared to the H1 vs. L1 (797/1374) and H2 vs. L2 (670/1598) groups. This finding indicates that gene diversity is further augmented in the subsequent phases of development, which is consistent with the rapid accumulation of high-cyanogenic phenotypes observed in later stages. The following are characteristics of co-expressed genes: the number of co-expressed genes across the nine groups ranged from 25,191 to 27,550, with the highest number recorded in the H1 vs. L1 group (27,550, accounting for 90.5%), indicating the presence of a highly conserved core gene network in flax seed development, which may be involved in maintaining basal metabolism.

3.5. KEGG Enrichment Analysis of Differentially Expressed Genes

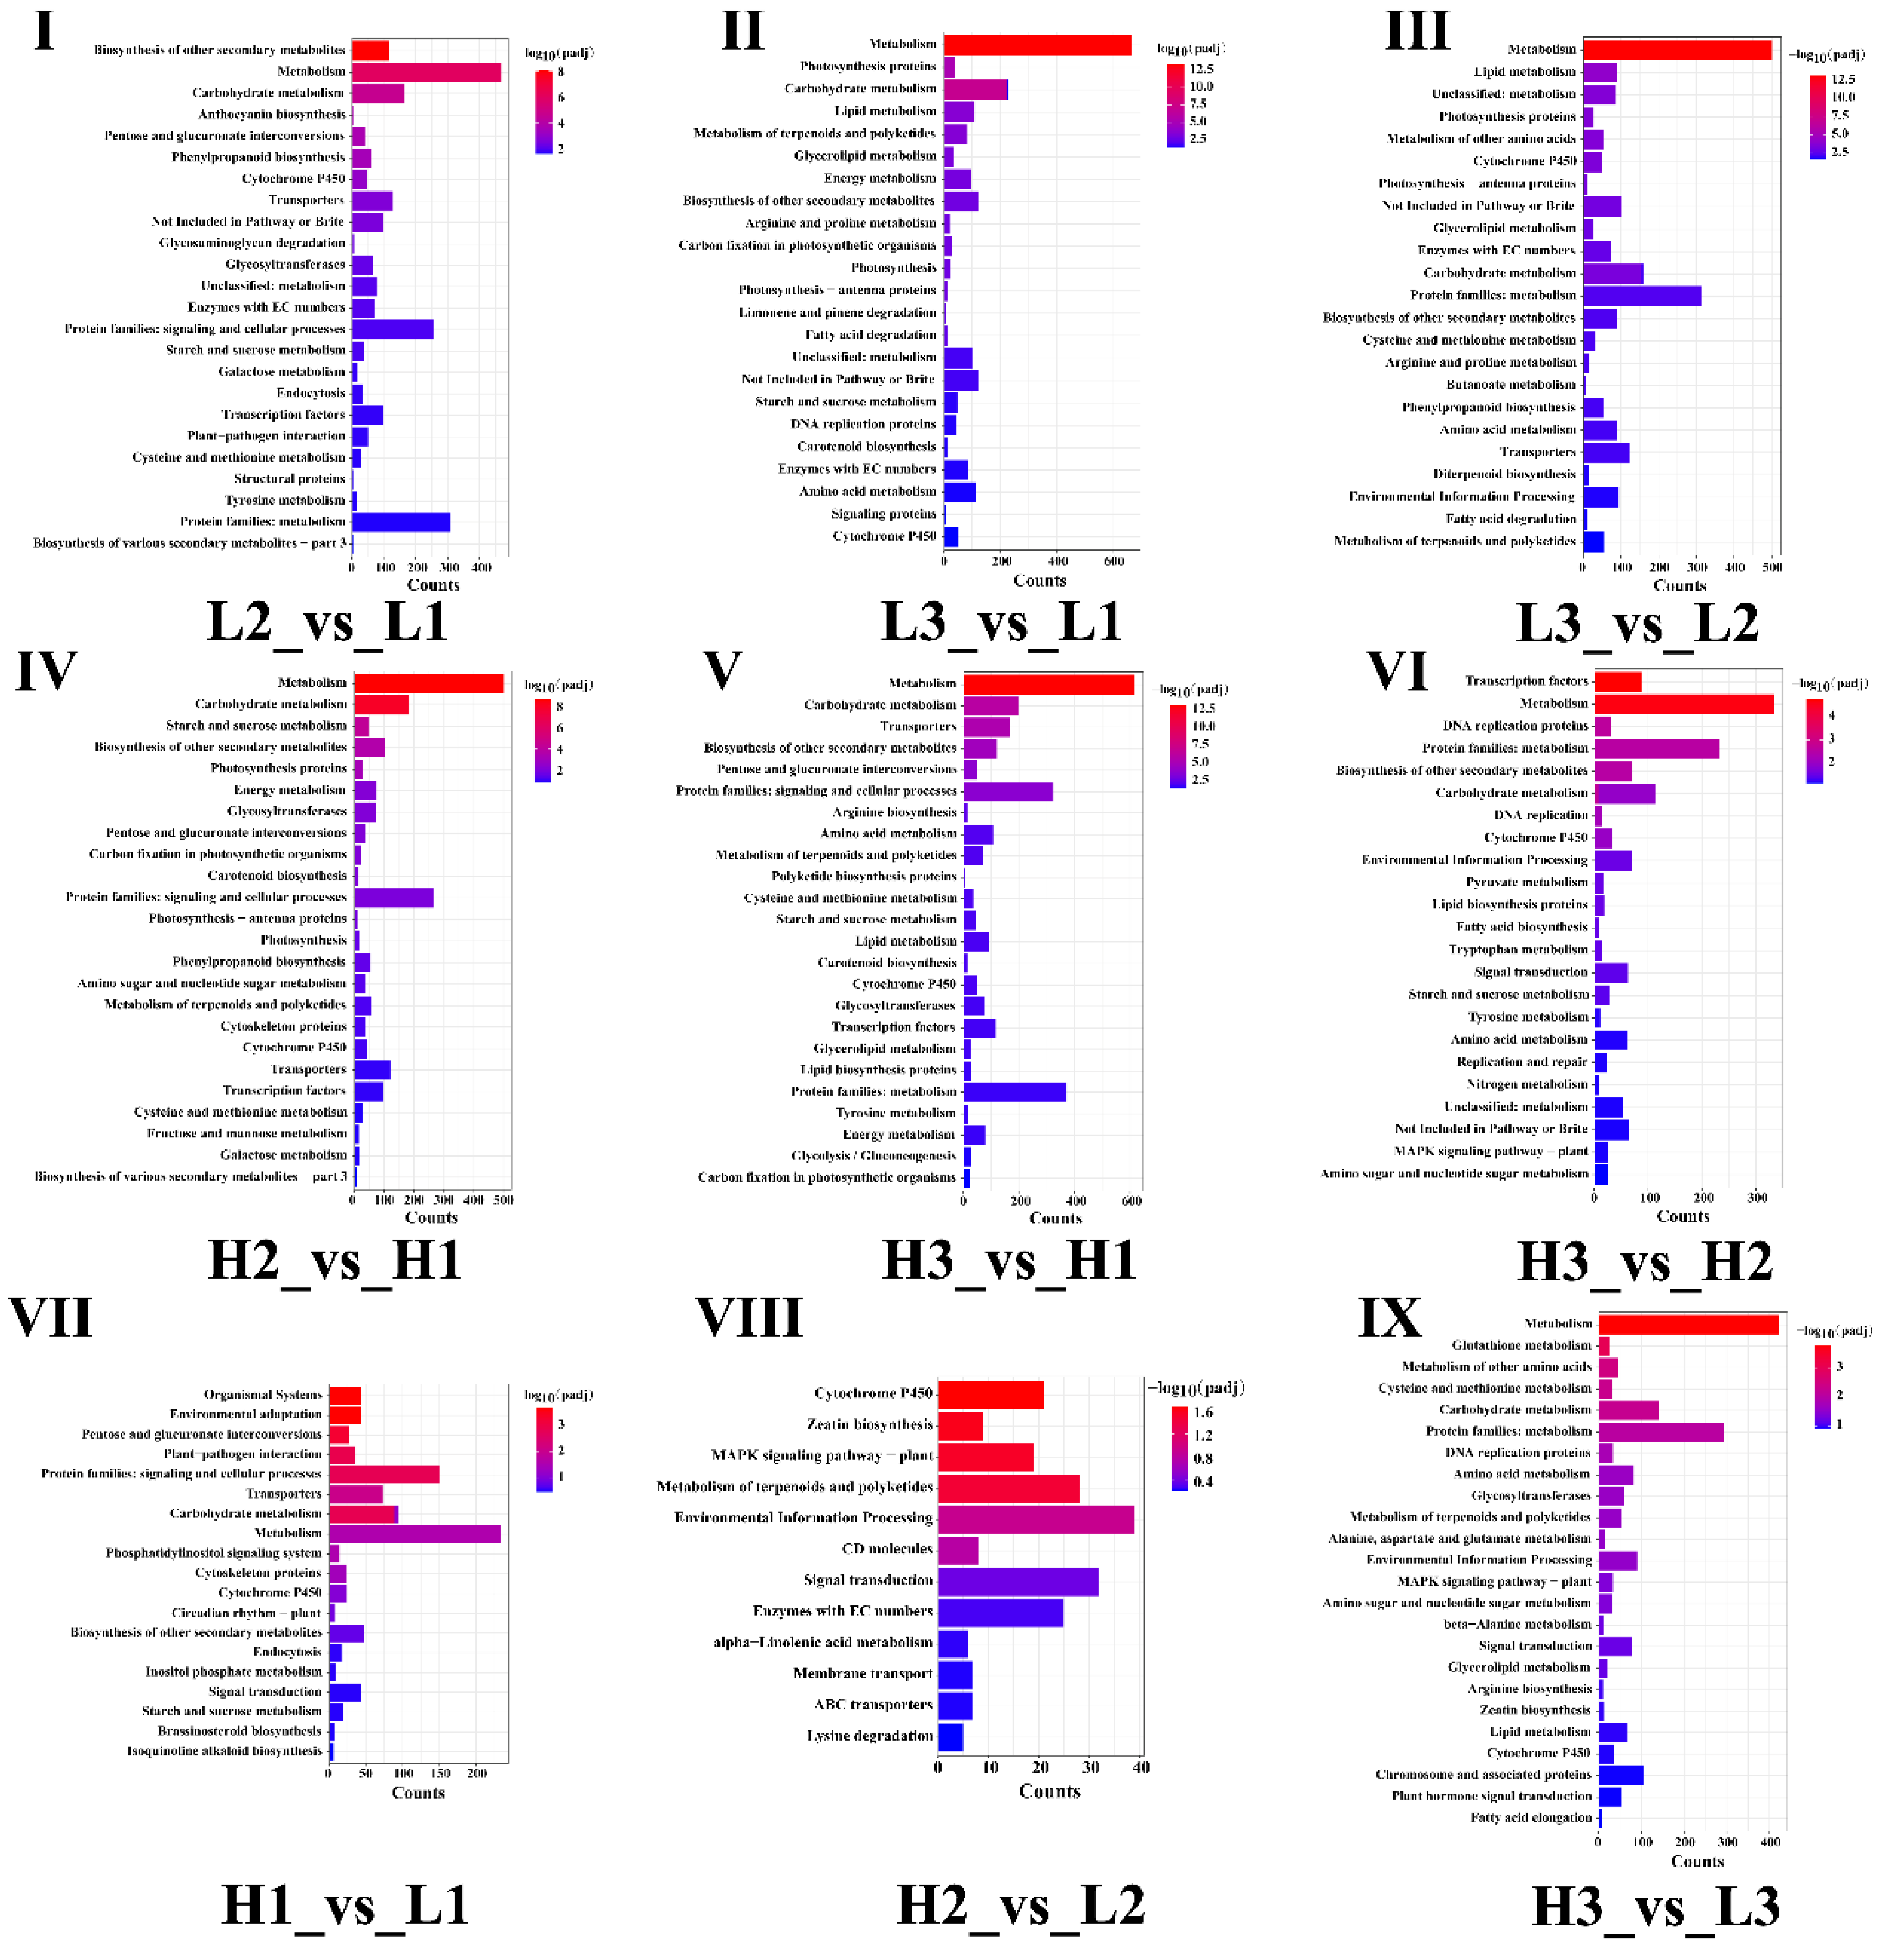
The KEGG database was used for functional annotation and enrichment analysis (Figure 4, Table S2). The findings of this study are outlined below. When comparing different developmental stages of the same variety, significant differences in DEG enrichment were observed. However, these were consistently enriched in the Metabolism, Carbohydrate Metabolism, and Protein Families: Metabolism pathways. This finding indicates that these fundamental metabolic processes are not merely incidental but integral to all phases of flax seed development, potentially providing the energy and material basis for seed morphogenesis and substance accumulation. In contrast to the shared characteristics of developmental stages, DEGs between high- and low-cyanogenic glycoside varieties at the same developmental stage exhibited substantial disparities in KEGG enrichment patterns. In the H1 vs. L1 comparison group (seeds from high- and low-cyanogenic glycoside varieties 10 days post-flowering), DEGs were significantly enriched in Organismal Systems, Environmental Adaptation, and Protein Families. In the H2 vs. L2 comparison group (seeds 20 days post-flowering), the enriched pathways focused on Cytochrome P450, MAPK signaling pathway, Metabolism of terpenoids and polyketides, zeatin biosynthesis, and environmental information processing. In the H3 vs. L3 comparison group (seeds 30 days post-flowering), DEGs were primarily enriched in Metabolism and Protein Families: Metabolism.
It is noteworthy that in the nine comparison groups, encompassing different stages of the same variety and the same stage of different varieties, the Cytochrome P450 pathway was enriched with DEGs. However, the number and significance of enriched genes varied among groups. Among these groups, the enrichment of this pathway was most significant in the H2 vs. L2 group and involved the largest number of genes.

3.6. GO Enrichment Analysis of Differentially Expressed Genes

This study conducted Gene Ontology (GO) enrichment analysis, which primarily categorized DEGs into three categories: biological process (BP), cellular component (CC), and molecular function (MF) (Figure S1, Table S3).
At the molecular function level, significantly enriched terms cluster into three core categories: transcription regulation (e.g., DNA-binding transcription factor activity, GO:0003700), transmembrane transporter activity (e.g., inorganic molecular entity transmembrane transporter, GO:0015318), and catalytic functions—particularly, UDP-glycosyltransferase (GO:0008194) and monooxygenase activities (GO:0004497), which are implicated in glycosylation and oxidation steps during cyanogenic glycoside biosynthesis and may underlie the divergence between high- and low-cyanogenic glycoside varieties.
It is evident that significantly enriched terms at the cellular component (CC) level focus on the cell periphery (GO:0071944), plasma membrane (GO:0005886), and membrane (GO:0016020). This finding is consistent with the localization characteristics of the aforementioned transmembrane transporters and the membrane-bound nature of enzymatic reactions, indicating that cell membrane-related metabolic processes may play a crucial role in seed development and cyanogenic glycoside accumulation.
Enrichment results at the biological process (BP) level exhibit characteristics closely related to seed development and secondary metabolism: on the one hand, terms related to plant organ development, such as shoot system development (GO:0048367), phyllome development (GO:0048827), leaf development (GO:0048366), plant organ development (GO:0099402), and cell morphogenesis (GO:0000902), reflected differences in gene expression associated with seed morphological development across different stages. Conversely, terms associated with metabolism and stress response predominate, encompassing secondary metabolic process (GO:0019748), cell wall organization or biogenesis (GO:0071554), plant-type cell wall biogenesis (GO:0009832), and other material synthesis processes, along with response to stimulus (GO:0050896), response to abiotic stimulus (GO:0009628), and other environmental adaptation processes.
It is noteworthy that cyanogenic glycosides, as significant secondary metabolites, may have their synthesis and accumulation associated with the overall activation of secondary metabolic processes. Moreover, differences in cell wall-related biosynthetic processes may influence seed structural characteristics, which may in turn affect the storage and transport efficiency of cyanogenic glycosides. Additionally, the enrichment of terms related to post-embryonic development (GO:0009791) and cell growth (GO:0016049) further indicates the central role of these DEGs in regulating the timing of seed development and the dynamics of material accumulation.

3.7. Screening of Genes Related to Cyanogenic Glycoside Biosynthesis in Flax

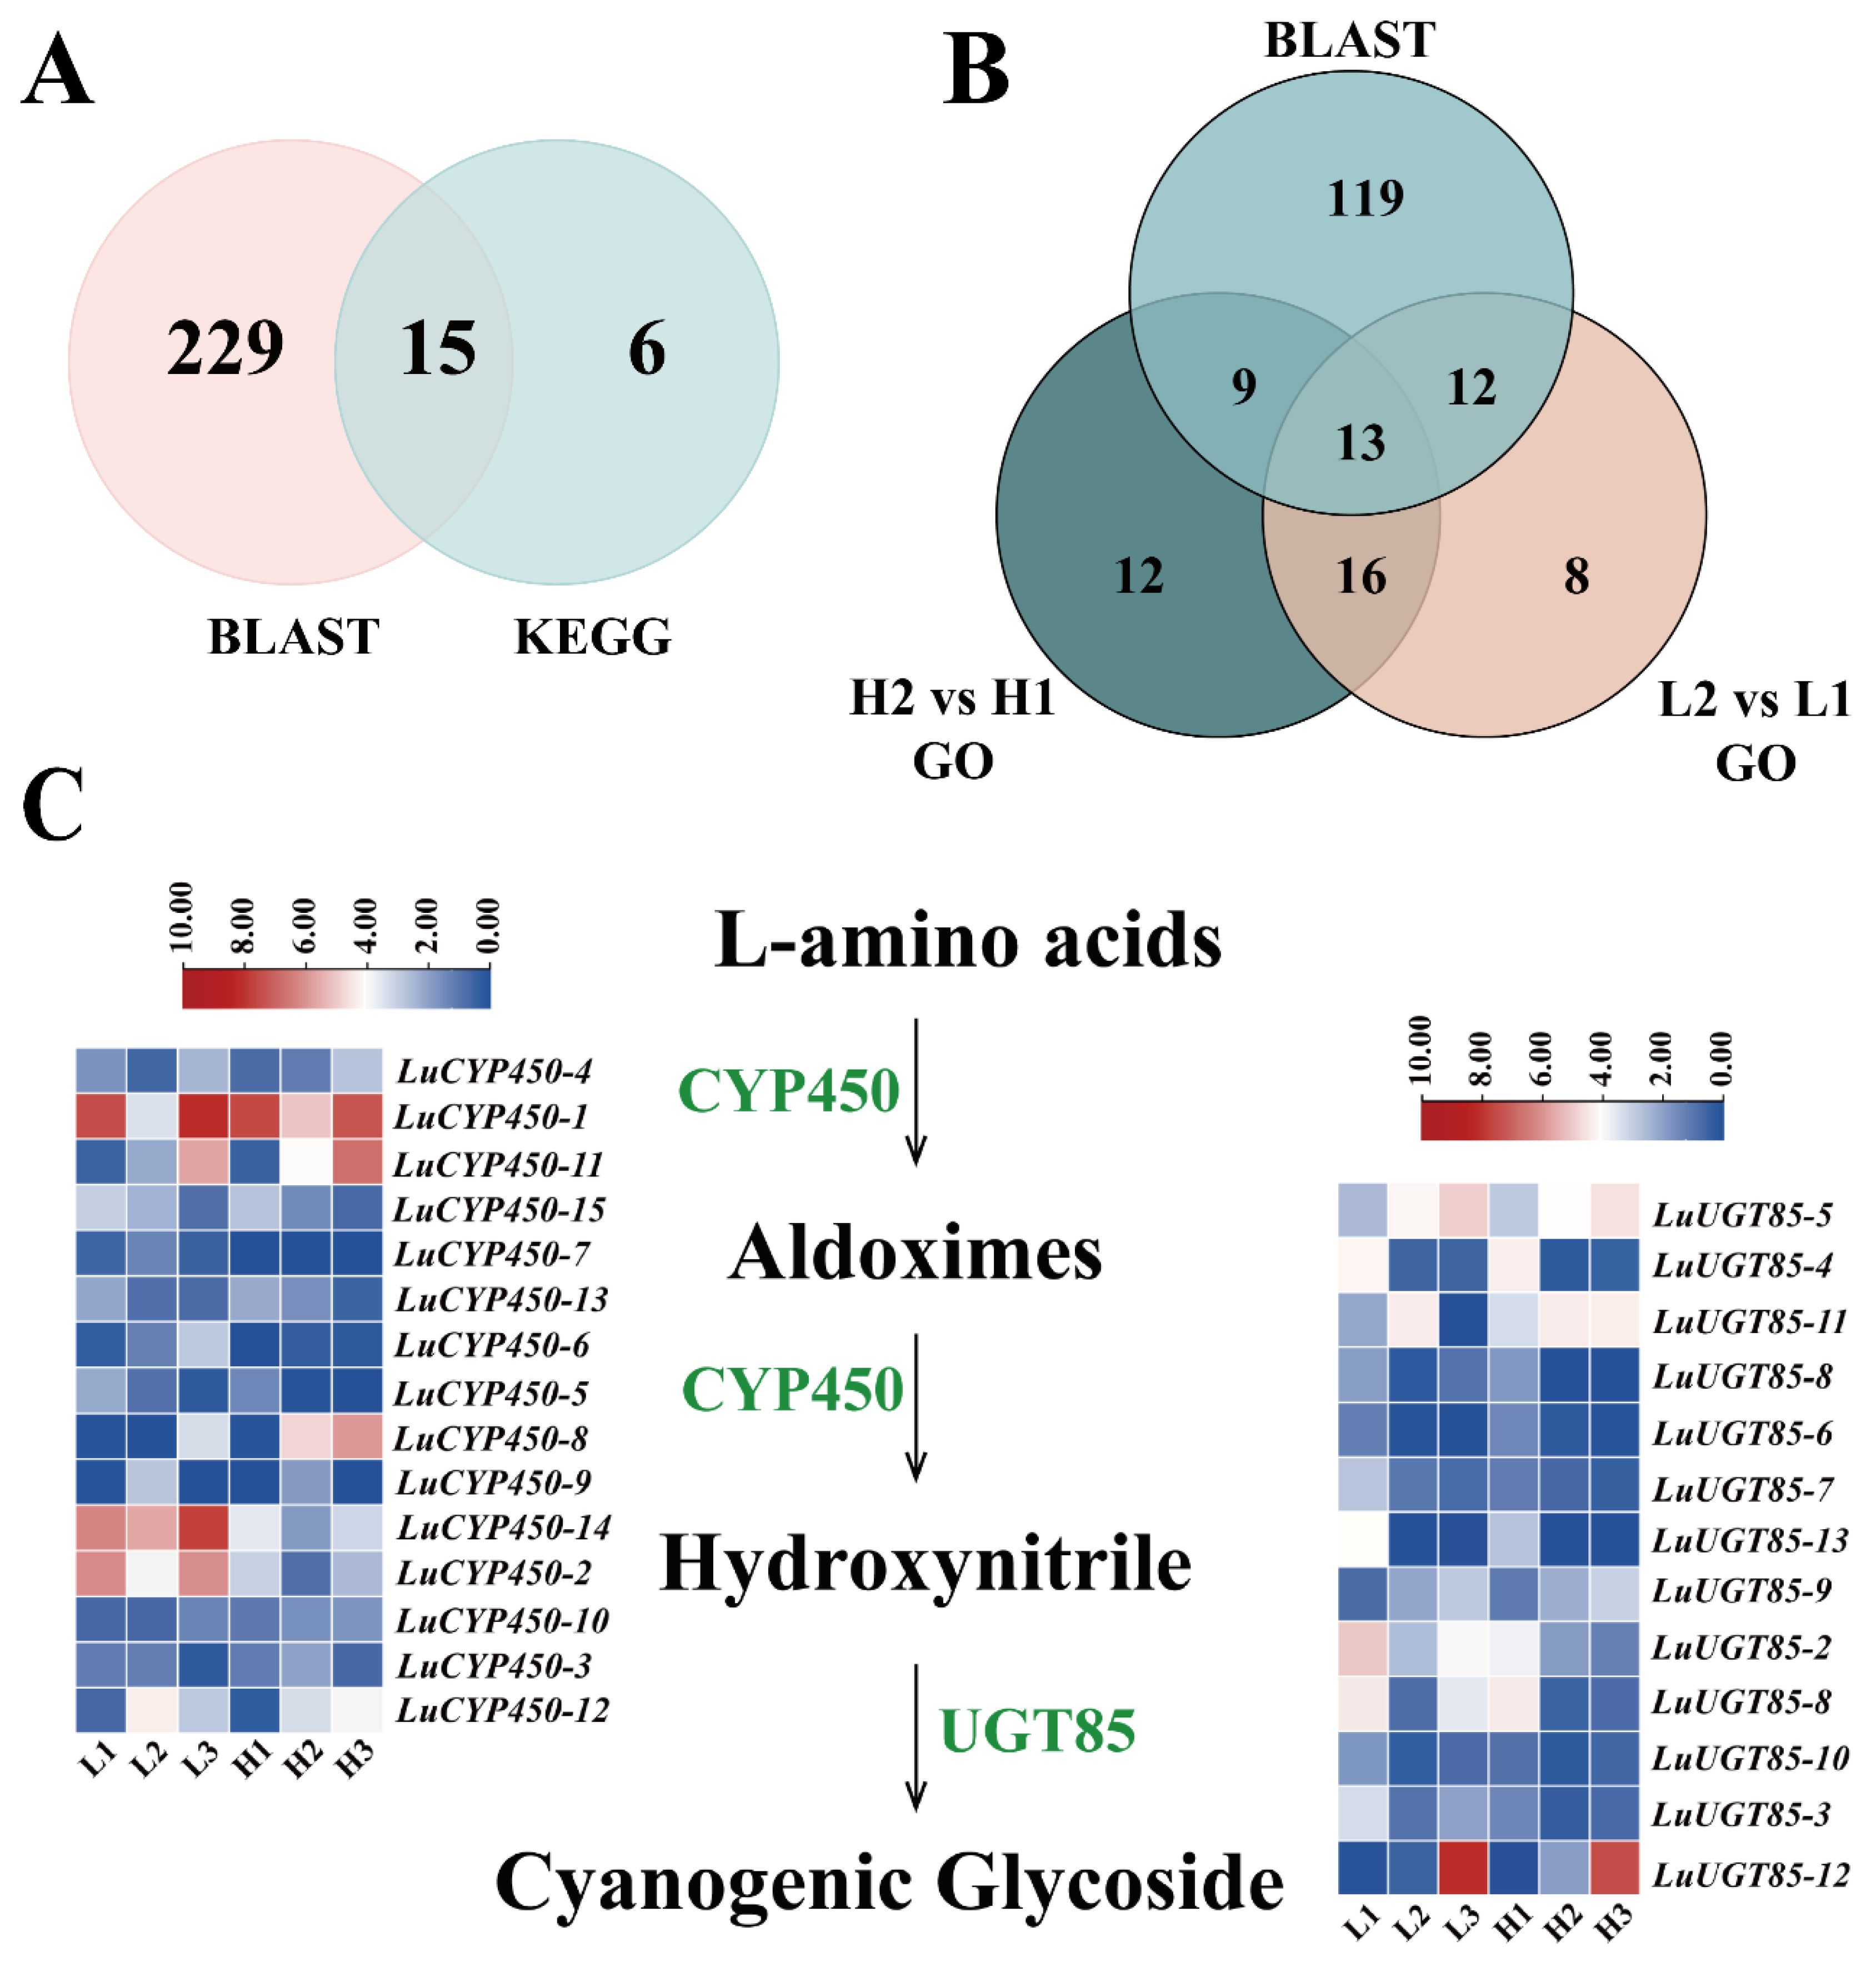
To elucidate the molecular basis of cyanogenic glycoside synthesis in flax, this study integrated homology mapping with functional enrichment strategies to identify relevant genes and analyze their spatiotemporal expression characteristics. Based on the well-characterized gene families CYP450 and UGT85, which are pivotal in cyanogenic glycoside synthesis in Arabidopsis, initial screening of candidate genes was performed via BLAST (version 2.9.0) homology mapping. This was followed by intersection analysis of KEGG and GO enrichment results. Fifteen genes homologous to LuCYP450 (LuCYP450-1 to LuCYP450-15) and thirteen genes homologous to LuUGT85 (LuUGT85-1 to LuUGT85-13) were identified from the flax genome. These genes were systematically named based on their chromosomal physical locations (Figure 5A and Figure 6B). During the initial phases of cyanogenic glycoside synthesis, 15 LuCYP450 genes exhibited significant spatiotemporal expression specificity: LuCYP450-1 expression was consistently elevated in both high- and low-cyanogenic varieties across all developmental stages. Notably, the transcriptional abundance of LuCYP450-1 was particularly pronounced during the L1, L3, H1, and H3 stages. In contrast, LuCYP450-8 expression exhibited a marked decrease in low-cyanogenic varieties and was continuously upregulated in high-cyanogenic varieties as development progressed. LuCYP450-11 is expressed at a significantly higher level during the L3 and H3 stages; conversely, LuCYP450-2 and LuCYP450-14 are expressed at a significantly lower level in low-cyanogenic varieties and repressed in high-cyanogenic varieties (Figure 5C).
During the glycosylation modification stage of cyanogenic glycoside synthesis, the expression patterns of the 13 LuUGT85 genes are as follows: LuUGT85-3/6/7/8/9/10/13 exhibit extremely low expression levels across all varieties and growth stages; the remaining LuUGT85 genes show consistent expression trends between high- and low-cyanogenic varieties; LuUGT85-12 is significantly induced during the L3 and H3 stages and exhibits the highest expression levels in low-cyanogenic varieties (Figure 5C). The efficient synthesis in high-cyanogenic varieties may be attributed to the sustained high expression of LuCYP450-8 and timely activation of LuUGT85-12. In low-cyanogenic varieties, high expression of LuCYP450-2/14 may divert precursor substances, while delayed activation of LuUGT85-12 reduces glycosylation efficiency, ultimately limiting cyanogenic glycoside accumulation.

3.8. Cyanogenic Glycoside Synthesis-Related Genes Expression in Flax Seeds

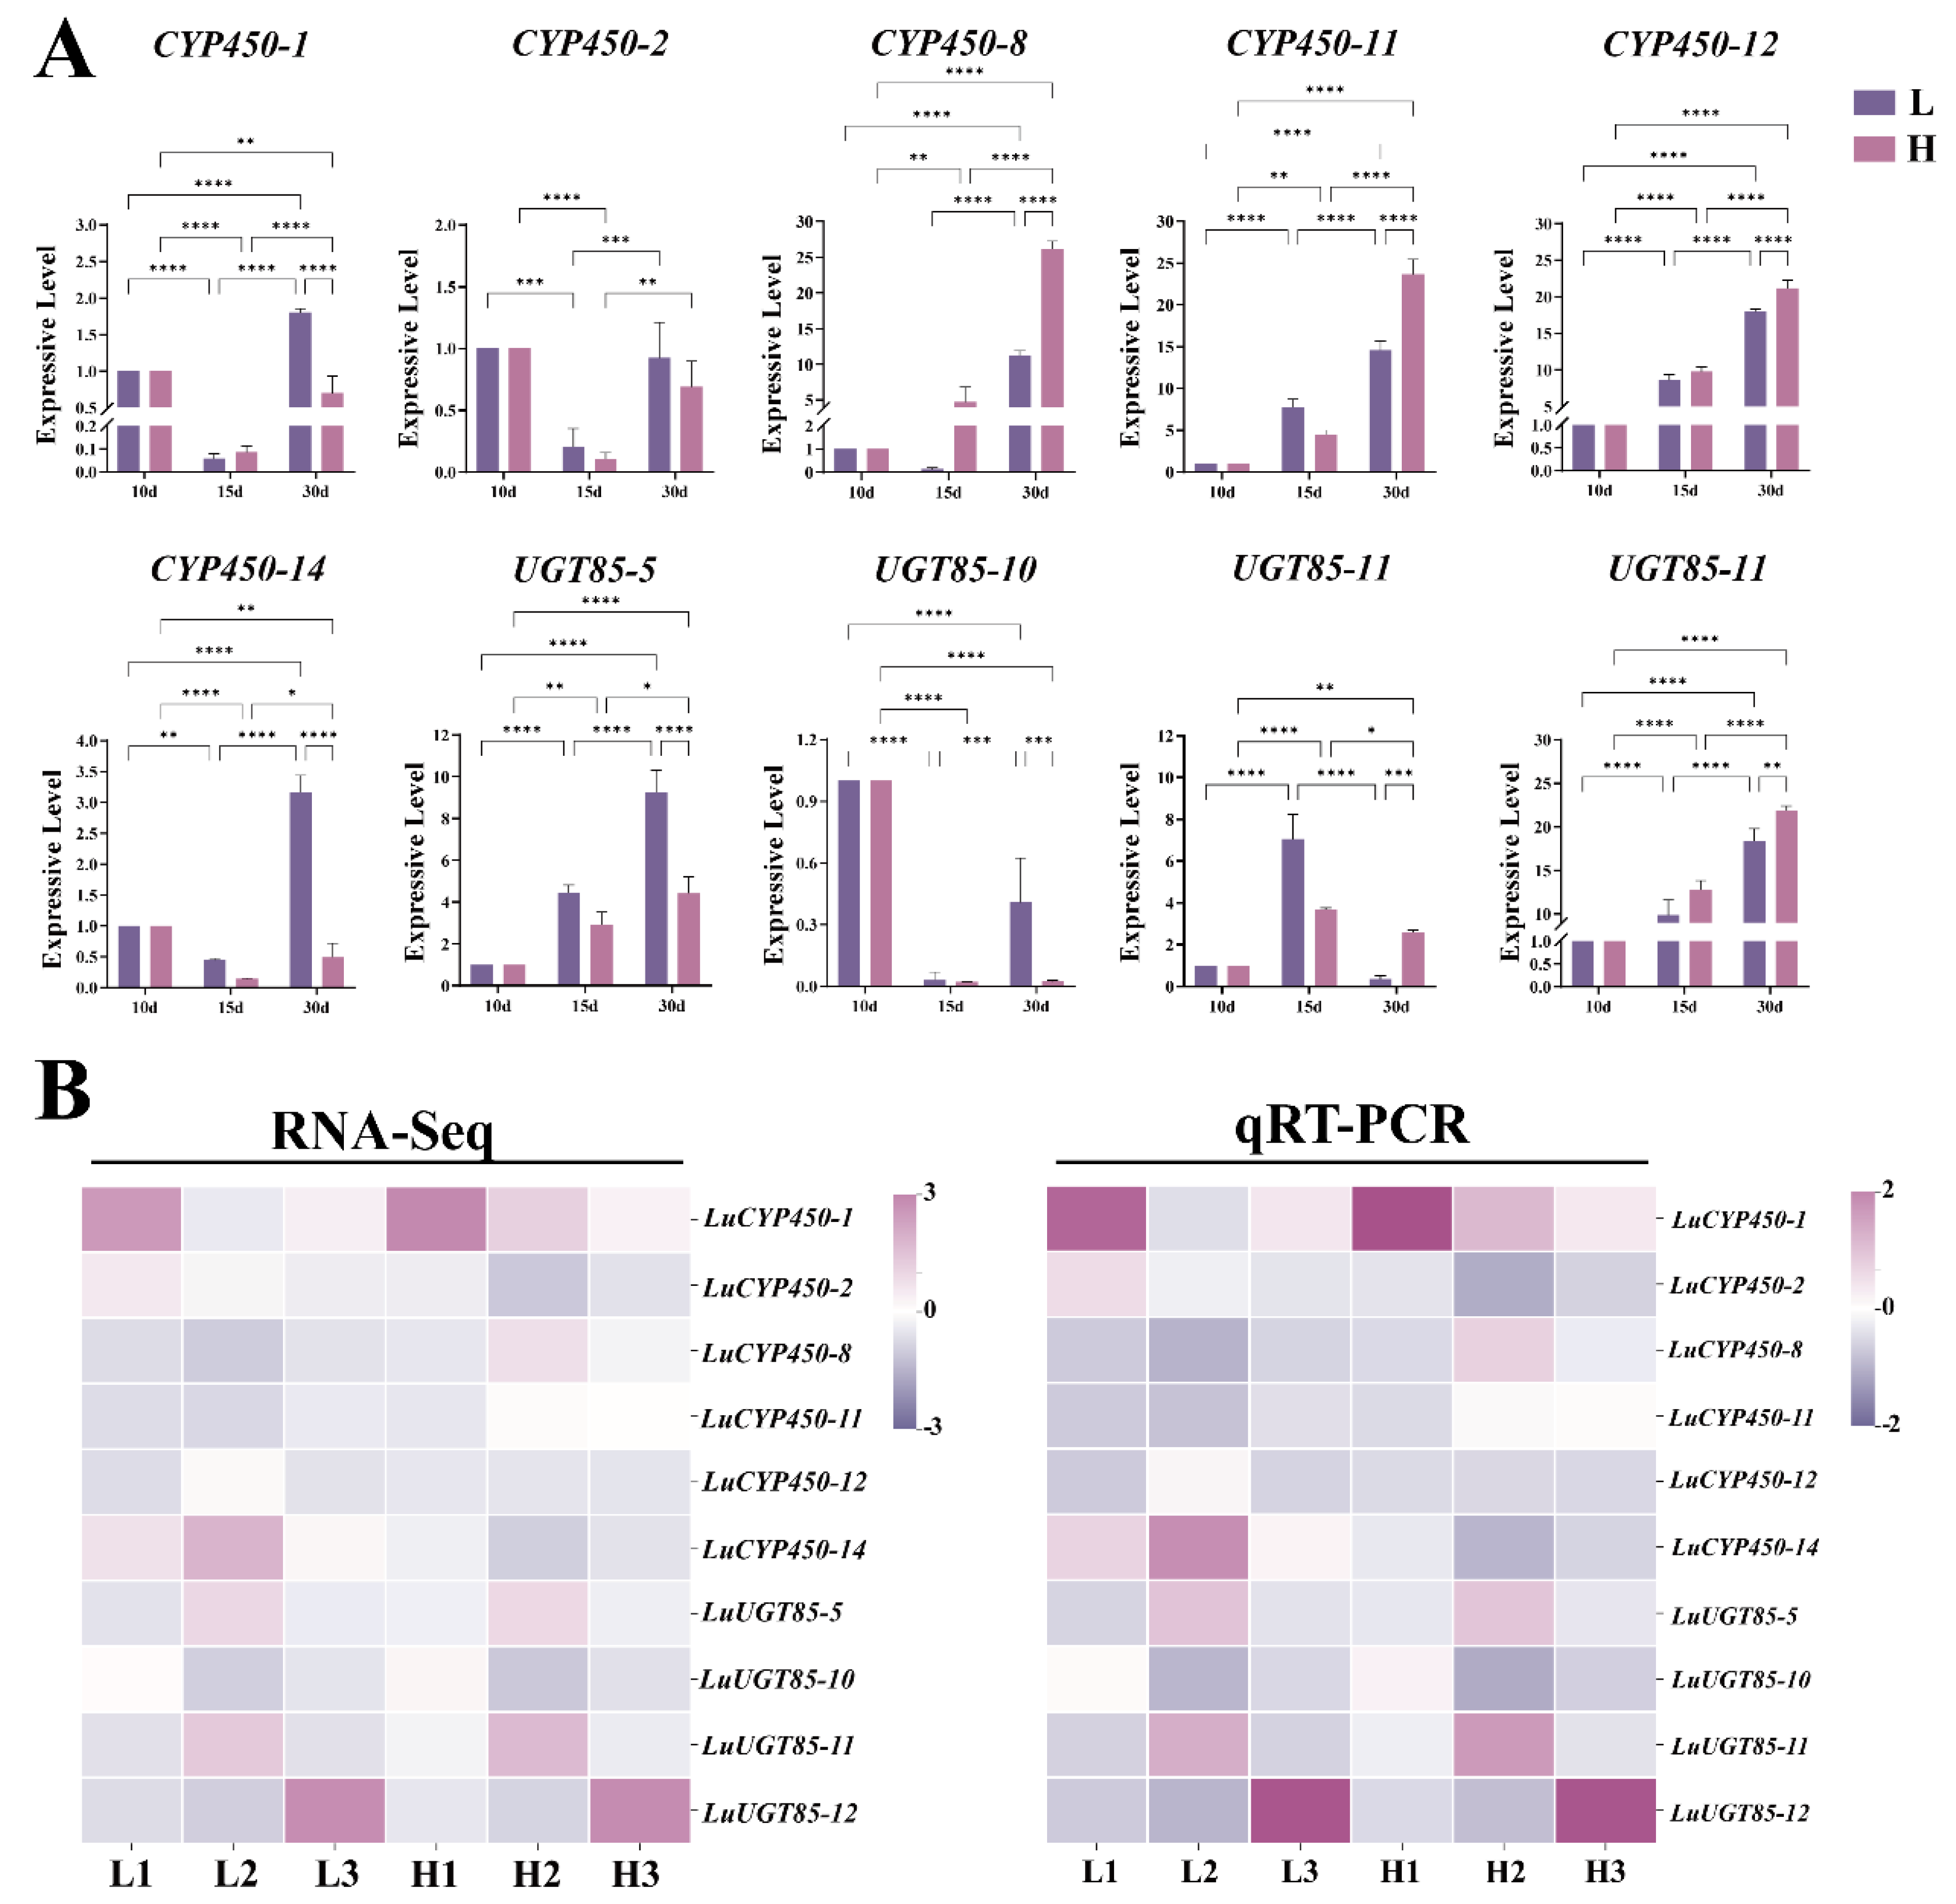
To validate the reliability of transcriptomic data, qRT-PCR validation experiments were designed to target key genes in the cyanogenic glycoside biosynthesis pathway. Based on earlier findings from homology alignment, KEGG, and GO enrichment analyses, 10 core genes (6 LuCYP450 and 4 LuUGT85) were randomly selected from the flax genome. The expression levels of these genes were then detected across three distinct developmental stages in flax varieties with high- and low-cyanogenic glycoside content. qRT-PCR results demonstrated that the expression levels of these 10 genes exhibited significant variability and developmental stage specificity (Figure 6A). Furthermore, the gene expression trends detected by qRT-PCR were highly consistent with RNA-Seq data (Figure 6B), further confirming the accuracy and reliability of transcriptomic sequencing data.

4. Discussion

The “early conservation-late differentiation” gene expression pattern uncovered in this study provides critical insights into the regulation of cyanogenic glycoside accumulation in flax from a temporal dimension. Notably, this pattern is not an isolated occurrence—analogous observations have been documented in the accumulation of secondary metabolites during seed development across a range of crop species [43,44]. The conservation of gene expression in early developmental stages ensures the robust progression of core biological processes, such as cell division and differentiation, which is pivotal for maintaining the fundamental structure and function of seeds. For instance, in studies investigating fruit development in apple (Malus domestica), gene expression during early stages is also predominantly focused on basic biological processes, including cell growth, division, and differentiation [45]. Through transcriptomic analysis, we identified two key gene expression patterns—”developmental stage differentiation” and “variety specificity”—between high- and low-cyanogenic glycoside flax varieties, critical for deciphering cyanogenic glycoside accumulation regulation. PCA and hierarchical clustering showed same-stage replicates clustered tightly while cross-stage samples separated distinctly: this validates data reliability, reflects seed development’s temporal gene expression specificity (linked to stage-specific physiology, consistent with angiosperms), and guides cyanogenic glycoside-related gene analysis8888. Notably, varieties clustered closely early but separated significantly at pod formation (L3/H3), aligning with amplified cyanogenic glycoside differences then, indicate late gene divergence drives cyanogenic glycoside variation (due to secondary metabolism delay and active seed maturation), narrowing future study windows. This “early conservation + late differentiation” likely reflects evolutionary adaptation: early core process conservation ensures robustness, while late regulation enables metabolic diversification. These patterns clarify cyanogenic glycoside’s molecular basis and support subsequent cyanogenic glycoside gene studies [46].
The results of KEGG and GO enrichment analyses revealed that the core of the regulatory network for cyanogenic glycoside biosynthesis centers on redox and glycosylation processes. This is fully consistent with the significant enrichment of cytochrome P450 monooxygenases and UDP-glucosyltransferases (UGTs), as these enzymes, respectively, catalyze the oxidation of cyanogenic glycoside precursor amino acids and subsequent glycosylation modification—two core reactions in cyanogenic glycoside biosynthesis [47]. Notably, regarding the comparison of the full bloom stage (H2 vs. L2), the P450 pathway exhibited the most significant enrichment. This finding echoes results from studies on model plants [48], indicating that despite interspecific differences, the core function of P450 enzymes in cyanogenic glycoside biosynthesis is evolutionarily conserved. However, unlike previous studies that focused primarily on leaves or other tissues, our work identifies that for flax seeds (a specific organ), 20 days post-flowering (i.e., the full bloom stage) is a critical period: during this stage, the expression differences in P450-related genes are most pronounced, which may thereby drive the divergence in cyanogenic glycoside content between varieties. Meanwhile, the UDP-glycosyltransferases (UGT85 family) enriched in GO analysis further confirms the role of glycosylation in cyanogenic glycoside product stabilization [49]. Additionally, the investigation revealed enrichment of basal metabolic pathways (including those associated with carbohydrate metabolism) across all stages of seed development. This finding suggests that these pathways are essential for providing the energy and material basis for seed development and secondary metabolism. This finding is consistent with the physiological characteristic of starch accumulation transitioning to secondary metabolism during Tilia tuan seed maturation [46].
Given the pivotal role of the cytochrome P450 family in cyanogenic glycoside biosynthesis—a process entailing the oxidation and structural modification of cyanogenic glycoside precursors, including amino acids—this finding provides substantial evidence that metabolic disparities between high- and low-cyanogenic glycoside flax varieties are most pronounced in seeds collected 20 days post-flowering. This temporal point may represent a critical window during which substantial synthesis and accumulation of cyanogenic glycosides occur. The 15 LuCYP450 and 13 LuUGT85 genes identified in this study exhibit diverse expression patterns, indicating functional differentiation. In high-cyanogenic varieties, LuCYP450-8 is continuously upregulated during development, potentially promoting cyanogenic glycoside synthesis through efficient catalytic oxidation of amino acid precursors. Conversely, LuCYP450-2/14 is highly expressed in low-cyanogenic varieties, potentially inhibiting accumulation through substrate competition or catalytic degradation reactions. This finding is consistent with the established functional diversity of the CYP450 family in plants, which exhibits dual roles in synthesis and detoxification [50]. In the UGT85 family, LuUGT85-12 is significantly induced during late seed development stages and is more highly expressed in low-cyanogenic varieties, indicating that it may participate in maintaining product homeostasis through feedback regulation [51]. The spatiotemporal specificity of these genes’ expression collectively forms a “switch-like” regulatory network for cyanogenic glycoside synthesis, providing a molecular explanation for metabolic differences between varieties.
Research has identified the peak flowering period (H2/L2) as a critical regulatory window for cyanogenic glycoside synthesis. During this period, the cytochrome P450 pathway is most significantly enriched, with expression differences between CYP450 and UGT85 genes beginning to become apparent. This temporal characteristic may be associated with the physiological requirements of seed development. The peak flowering stage is a phase of rapid nutrient transport to seeds, with cyanogenic glycosides synthesized simultaneously as defensive compounds to protect tender seeds [50]. Furthermore, amplified gene expression differences between varieties during the pod formation stage (L3/H3) may be associated with directed metabolic flux allocation during seed maturation: high-cyanogenic varieties prioritize resource allocation toward cyanogenic glycoside synthesis, whereas low-cyanogenic varieties may shift toward accumulating other defensive compounds (e.g., flavonoids). This finding provides a target for enhancing cyanogenic glycoside content in flax by regulating gene expression during specific periods [52]. Genes belonging to the CYP450 and UGT85 families play a central role in the cyanogenic glycoside biosynthetic pathway. In plant secondary metabolism, the CYP450 enzyme family is widely involved in the biosynthesis of various compounds, including flavonoids, terpenoids, and alkaloids. It catalyzes the structural modification of substrates through redox reactions [53]. While the UGT85 family is responsible for transferring glycosyl moieties to secondary metabolites, thereby altering their physicochemical properties, solubility, and bioactivity [54]. For instance, in medicinal plants such as Tripterygium wilfordii, UGTs are involved in the glycosylation of multiple secondary metabolites, which in turn affects their pharmacological activities [55,56]. Thus, the differential expression of these key enzyme-encoding genes at specific developmental stages directly influences the biosynthesis and accumulation of cyanogenic glycosides.

5. Conclusions

Through comparative transcriptomic analysis of flax cultivars with high- and low-cyanogenic glycoside contents across multiple developmental stages, this study systematically deciphered the molecular mechanisms underlying cyanogenic glycoside accumulation in flax. The results demonstrated that gene expression during flax seed development exhibited distinct temporal dynamics and cultivar specificity, with particularly evident differentiation between cultivars at the capsule-forming stage. Twenty days after flowering was identified as a critical period for cyanogenic glycoside synthesis, during which the CYP450 pathway was most significantly enriched. A total of 15 LuCYP450 homologous genes and 13 LuUGT85 homologous genes were identified in this study. Among them, the high expression of LuCYP450-8 and the late-stage induction of LuUGT85-12 were closely associated with cyanogenic glycoside accumulation in high-cyanogenic cultivars. In contrast, the high expression of LuCYP450-2/14 and the delayed activation of LuUGT85-12 in low-cyanogenic cultivars might collectively restrict product accumulation. Functional enrichment analysis revealed that cyanogenic glycoside synthesis involves multiple molecular functions, including transcriptional regulation, transmembrane transport, redox, and glycosyltransferase activity, and is synergistically regulated by multi-level biological processes such as secondary metabolism, cell wall biosynthesis, and stress response. The reliability of the transcriptomic data was further confirmed by qRT-PCR validation. This study provides an important basis for elucidating the molecular mechanisms of cyanogenic glycoside synthesis in flax and lays a theoretical foundation for molecular breeding to regulate cyanogenic glycoside content.

6. Limitations

It should be noted that the present study is still in the preliminary exploration stage and has certain limitations. First, the biological functions of the key genes have not been verified by genetic experiments such as transgenesis or gene editing, and their specific roles in the cyanogenic glycoside synthesis pathway need further confirmation. Second, cyanogenic glycoside synthesis is a complex biological process regulated synergistically by a multi-gene network. This study was conducted solely based on transcriptomic data, and metabolomic data have not been integrated to systematically analyze the interaction mechanisms between upstream and downstream pathways.

Supplementary Materials

The following supporting information can be downloaded at https://www.mdpi.com/article/10.3390/agronomy15102327/s1, Table S1: Quality analysis of transcriptome sequencing data in flax seeds; Table S2: The KEGG enrichment analysis of DEGs of flax; Table S3: The GO enrichment analysis of DEGs of flax: Table S4: The primer of genes for qRT-PCR analysis in this study; Figure S1: GO enrichment analysis of flax differential genes.

Author Contributions

Conceptualization, X.S., Q.K., L.Y. (Liuxi Yi) and J.Z. (Jinhao Zhang); methodology, X.S., Z.S., J.Z. (Jinhao Zhang), L.T., H.Y., D.Y., W.J., D.L., L.Y. (Lie Yang), C.Q., J.Z. (Jian Zhang), Q.K., L.Y. (Liuxi Yi) and G.W.; software, X.S., J.Z. (Jinhao Zhang), L.T., H.Y., D.Y., W.J., L.C., L.Y. (Lie Yang), D.L., Z.S. and G.W.; validation, X.S., J.Z. (Jinhao Zhang), L.Y. (Lie Yang), L.T., H.Y., Q.K., D.Y., Z.S., W.J., C.Q. and L.C.; writing—original draft preparation, X.S. and J.Z. (Jinhao Zhang); writing—review and editing, J.Z. (Jian Zhang), L.Y. (Liuxi Yi) and Q.K.; visualization, L.T., J.Z. (Jian Zhang), D.Y., W.J., L.C., D.L., L.Y. (Lie Yang), C.Q. and L.Y. (Liuxi Yi); supervision, J.Z. (Jian Zhang), L.Y. (Liuxi Yi), H.Y., G.W., L.C., D.L., Z.S., C.Q. and Q.K.; project administration, G.W., X.S. and Q.K.; funding acquisition, X.S. and Q.K.; All authors have read and agreed to the published version of the manuscript.

Funding

This work was supported by the earmarked fund for China Agriculture Research System (CARS) [CARS-16-E04], the National Natural Science Foundation of China (No. 32160448), and the Basic Research Operating Expenses Program for Colleges and Universities directly under the Inner Mongolia Autonomous Region (No. BR231513).

Data Availability Statement

The original contributions presented in this study are included in the article/Supplementary Materials. Further inquiries can be directed to the corresponding authors.

Conflicts of Interest

The authors declare no conflicts of interest.

References

  1. Xie, D.W.; Dai, Z.G.; Yang, Z.M.; Tang, Q.; Sun, J.; Yang, X.; Song, X.X.; Lu, Y.; Zhao, D.B.; Zhang, L.G.; et al. Genomic variations and association study of agronomic traits in flax. BMC Genom. 2018, 19, e512. [Google Scholar] [CrossRef]
  2. Yang, J.; Wen, C.T.; Duan, Y.Q.; Deng, Q.C.; Peng, D.F.; Zhang, H.H.; Ma, H.L. The composition, extraction, analysis, bioactivities, bioavailability and applications in food system of flaxseed (Linum usitatissimum L.) oil: A review. Trends Food Sci. Technol. 2021, 118, 252–260. [Google Scholar] [CrossRef]
  3. Guo, D.L.; Jiang, H.X.; Yan, W.L.; Yang, L.J.; Ye, J.L.; Wang, Y.; Yan, Q.C.; Chen, J.X.; Gao, Y.F.; Duan, L.P.; et al. Resequencing 200 flax cultivated accessions identifies candidate genes related to seed size and weight and reveals signatures of artiffcial selection. Front. Plant Sci. 2020, 10, e1682. [Google Scholar] [CrossRef] [PubMed]
  4. Sertse, D.; You, F.M.; Ravichandran, S.; Cloutier, S. The genetic structure of flax illustrates environmental and anthropogenic selections that gave rise to its ecogeographical adaptation. Mol. Phylogenet. Evol. 2019, 137, 22–32. [Google Scholar] [CrossRef] [PubMed]
  5. Kaur, V.; Singh, M.; Wankhede, D.P.; Gupta, K.; Langyan, S.; Aravind, J.; Thangavel, B.; Yadav, S.K.; Kalia, S.; Singh, K.; et al. Diversity of Linum genetic resources in global genebanks: From agro-morphological characterisation to novel genomic technologies—A review. Front. Nutr. 2023, 10, e1165580. [Google Scholar] [CrossRef] [PubMed]
  6. Mueed, A.; Shibli, S.; Jahangir, M.; Jabbar, S.; Deng, Z.Y. A comprehensive review of flaxseed (Linum usitatissimum L.): Health-affecting compounds, mechanism of toxicity, detoxification, anticancer and potential risk. Crit. Rev. Food Sci. Nutr. 2023, 63, 11081–11104. [Google Scholar] [CrossRef]
  7. Al-Madhagy, S.; Ashmawy, N.S.; Mamdouh, A.; Eldahshan, O.A.; Farag, M.A. A comprehensive review of the health benefits of flaxseed oil in relation to its chemical composition and comparison with other omega-3-rich oils. Eur. J. Med. Res. 2023, 28, e240. [Google Scholar] [CrossRef]
  8. Manimurugan, C.; Sujatha, M.; Rathnakumar, A.; Sandhanalakshmi, M.; Zanwar, A. Role of flaxseed (Linum usitatissimum L.) in disease prevention and treatment. Asian Pac. J. Trop. Biomed. 2023, 13, 277–286. [Google Scholar] [CrossRef]
  9. Kazachkov, M.; Li, Q.; Shen, W.Y.; Wang, L.P.; Gao, P.; Xiang, D.Q.; Datla, R.; Zou, J.T. Molecular identification and functional characterization of a cyanogenic glucosyltransferase from flax (Linum unsitatissimum). PLoS ONE 2020, 15, e0227840. [Google Scholar] [CrossRef]
  10. Zuk, M.; Pelc, K.; Szperlik, J.; Sawula, A.; Szopa, J. Metabolism of the cyanogenic glucosides in developing flax: Metabolic analysis, and expression pattern of genes. Metabolites 2020, 10, 288. [Google Scholar] [CrossRef]
  11. Gleadow, R.M.; Møller, B.L. Cyanogenic Glycosides: Synthesis, Physiology, and Phenotypic Plasticity. Annu. Rev. Plant Biol. 2014, 65, 155–185. [Google Scholar] [CrossRef] [PubMed]
  12. Yulvianti, M.; Zidorn, C. Chemical diversity of plant cyanogenic glycosides: An overview of reported natural products. Molecules 2021, 26, 719. [Google Scholar] [CrossRef] [PubMed]
  13. Vetter, J. Plant cyanogenic glycosides. Toxicon 2000, 38, 11–36. [Google Scholar] [CrossRef] [PubMed]
  14. Shim, Y.Y.; Olivia, C.M.; Liu, J.; Boonen, R.; Shen, J.H.; Reaney, M.J.T. Secoisolariciresinol diglucoside and cyanogenic glycosides in gluten free bread fortified with flaxseed meal. J. Agric. Food Chem. 2016, 64, 9551–9558. [Google Scholar] [CrossRef]
  15. Shahwar, D.; Young, L.W.; Shim, Y.Y.; Reaney, M.J.T. Extractive silylation method for high throughput GC analysis of flaxseed cyanogenic glycosides. J. Chromatogr. B Analyt. Technol. Biomed. Life Sci. 2019, 1132, e121816. [Google Scholar] [CrossRef]
  16. Oomah, B.D.; Mama, G. Cyanogenic compounds in flaxseed. J. Agric. Food Chem. 1992, 40, 1346–1348. [Google Scholar] [CrossRef]
  17. Thodberg, S.; Sørensen, M.; Bellucci, M.; Crocoll, C.; Bendtsen, A.K.; Nelson, D.R.; Motawia, M.S.; Møller, B.L.; Neilson, E.H.J. A flavin-dependent monooxygenase catalyzes the initial step in cyanogenic glycoside synthesis in ferns. Commun. Biol. 2020, 3, e507. [Google Scholar] [CrossRef]
  18. Hansen, K.S.; Kristensen, C.; Tattersall, D.B.; Jones, P.R.; Olsen, C.E.; Bak, S.; Moller, B.L. The in vitro substrate regiospecificity of recombinant UGT85B1, the cyanohydrin glucosyltransferase from Sorghum bicolor. Phytochemistry 2003, 64, 143–151. [Google Scholar] [CrossRef]
  19. Andersen, M.D.; Busk, P.K.; Svendsen, I.; Moller, B.L. Cytochromes P-450 from cassava (Manihot esculenta crantz) catalyzing the first steps in the biosynthesis of the cyanogenic glucosides linamarin and lotaustralin. J. Biol. Chem. 2000, 275, 1966–1975. [Google Scholar] [CrossRef]
  20. Ngugi, M.P.; Murugi, N.J.; Oduor, R.O.; Mgutu, A.J.; Ombori, R.O.; Cheriyot, R.C. Determination of cyanogenic compounds content in transgenic acyanogenic kenyan cassava (Manihot esculenta crantz) genotypes: Linking molecular analysis to biochemical analysis. Tech. Univ. Mombasa 2015, 9, 23–29. [Google Scholar]
  21. Forslund, K.; Morant, M.; Jorgensen, B.; Olsen, C.E.; Asamizu, E.; Sato, S.; Tabata, S.; Bak, S. Biosynthesis of the nitrile glucosides rhodiocyanoside A and D and the cyanogenic glucosides lotaustralin and linamarin in Lotus japonicus. Plant Physiol. 2004, 135, 71–84. [Google Scholar] [CrossRef] [PubMed]
  22. Jorgensen, K.; Bak, S.; Busk, P.K.; Sorensen, C.; Olsen, C.E.; Puonti-Kaerlas, J.; Moller, B.L. Cassava plants with a depleted cyanogenic glucoside content in leaves and tubers. Distribution of cyanogenic glucosides, their site of synthesis and transport, and blockage of the biosynthesis by RNA interference technology. Plant Physiol. 2005, 139, 363–374. [Google Scholar] [CrossRef] [PubMed]
  23. Jenrich, R.; Trompetter, I.; Bak, S.; Olsen, C.E.; Moller, B.L.; Piotrowski, M. Evolution of heteromeric nitrilase complexes in Poaceae with new functions in nitrile metabolism. Proc. Natl. Acad. Sci. USA 2007, 104, 18848–18853. [Google Scholar] [CrossRef] [PubMed]
  24. Soto-Cerda, B.J.; Cloutier, S.; Gajardo, H.A.; Aravena, G.; Quian, R.; You, F.M. Drought response of flax accessions and identification of quantitative trait nucleotides (QTNs) governing agronomic and root traits by genome-wide association analysis. Mol. Breed. 2020, 40, e15. [Google Scholar] [CrossRef]
  25. Abtahi, M.; Mirlohi, A.; Sharif-Moghaddam, N.; Ataii, E. Revealing seed color variation and their possible association with yield and quality traits in a diversity panel of flax (Linum Usitatissimum L.). Front. Plant Sci. 2022, 13, e1038079. [Google Scholar] [CrossRef]
  26. Xie, D.W.; Dai, Z.G.; Yang, Z.M.; Sun, J.; Zhao, D.B.; Yang, X.; Zhang, L.G.; Tang, Q.; Su, J.G. Genome-wide association study identifying candidate genes influencing important agronomic traits of flax (Linum usitatissimum L.) using SLAF-seq. Front. Plant Sci. 2018, 8, e2232. [Google Scholar] [CrossRef]
  27. Yao, Y.; Gu, J.; Luo, Y.; Wang, Y.; Pang, Y.; Shen, G.; Guo, B. Genome-Wide Analysis of UGT Gene Family Identified Key Gene for the Biosynthesis of Bioactive Flavonol Glycosides in Epimedium Pubescens Maxim. Synth. Syst. Biotechnol. 2022, 7, 1095–1107. [Google Scholar] [CrossRef]
  28. Chen, S.F.; Zhou, Y.Q.; Chen, Y.R.; Gu, J. fastp: An ultra-fast all-in-one FASTQ preprocessor. Bioinformatics 2018, 34, 884–890. [Google Scholar] [CrossRef]
  29. Sunbul, M.; Jäschke, A. SRB-2: A promiscuous rainbow aptamer for live-cell RNA imaging. Nucleic Acids Res. 2018, 46, e110. [Google Scholar] [CrossRef]
  30. Guguchkin, E.; Kasianov, A.; Belenikin, M.; Zobkova, G.; Kosova, E.; Makeev, V.; Karpulevich, E. Enhancing SNV identification in whole-genome sequencing data through the incorporation of known genetic variants into the minimap2 index. BMC Bioinform. 2024, 25, e268. [Google Scholar] [CrossRef]
  31. Liao, Y.; Smyth, G.K.; Shi, W. featureCounts: An efficient general purpose program for assigning sequence reads to genomic features. Bioinformatics 2014, 30, 923–930. [Google Scholar] [CrossRef] [PubMed]
  32. Spinozzi, G.; Tini, V.; Adorni, A.; Falini, B.; Martelli, M.P. ARPIR: Automatic RNA-Seq pipelines with interactive report. BMC Bioinform. 2020, 21, e574. [Google Scholar] [CrossRef]
  33. Lachmann, A.; Clarke, D.J.B.; Torre, D.; Xie, Z.R.; Ma’ayan, A. Interoperable RNA-Seq analysis in the cloud. Biochim. Biophys. Acta—Gene Regul. Mech. 2020, 1863, e194521. [Google Scholar] [CrossRef] [PubMed]
  34. Olney, K.C.; Brotman, S.M.; Andrews, J.P.; Valverde-Vesling, V.A.; Wilson, M.A. Reference genome and transcriptome informed by the sex chromosome complement of the sample increase ability to detect sex differences in gene expression from RNA-Seq data. Biol. Sex Differ. 2020, 11, e42. [Google Scholar] [CrossRef]
  35. Chen, C.J.; Chen, H.; Zhang, Y.; Thomas, H.R.; Frank, M.H.; He, Y.H.; Xia, R. TBtools: An integrative toolkit developed for interactive analyses of big biological data. Mol. Plant 2020, 13, 1194–1202. [Google Scholar] [CrossRef]
  36. Zhang, L.Y.; Xia, Y.B.; Jiang, G.F.; Wang, X.Q.; Bai, Y.T.; Zhang, P.; Liu, J.N.; Li, L.; Li, H.X.; Huang, L.B.; et al. Identification of quinoa B3 gene family and its expression pattern in response to low temperature stress. Genet. Resour. Crop Evol. 2025, 72, 4345–4360. [Google Scholar] [CrossRef]
  37. Mitteer, D.R.; Greer, B.D. Using GraphPad Prism’s heat maps for efficient, fine-grained analyses of single-case data. Behav. Anal. Pract. 2022, 15, 505–514. [Google Scholar] [CrossRef]
  38. Laverty, W.; Kelly, I. Using Excel to Explore the Effects of Assumption Violations on One-Way Analysis of Variance (ANOVA) Statistical Procedures. Open J. Stat. 2019, 9, 458–469. [Google Scholar] [CrossRef]
  39. Durango, J.M.; Yurango, C.P. Statistical Analysis using traditional technique, Microsoft Excel and Predictive Analytic Software. UIC Res. J. 2016, 19, e1. [Google Scholar] [CrossRef]
  40. Boulesteix, A.L.; Tutz, G. Identification of interaction patterns and classification with applications to microarray data. Comput. Stat. Data Anal. 2006, 50, 783–802. [Google Scholar] [CrossRef]
  41. O’Connell, T.M. Pathway volcano: An interactive tool for pathway guided visualization of differential expression data. Bioinformatics 2025, 41, ebtaf367. [Google Scholar] [CrossRef] [PubMed]
  42. Gao, C.H.; Yu, G.C.; Cai, P. ggVennDiagram: An intuitive, easy-to-use, and highly customizable R package to generate Venn Diagram. Front. Genet. 2021, 12, e706907. [Google Scholar] [CrossRef] [PubMed]
  43. Cheng, G.; Wu, D.; Guo, R.; Li, H.; Wei, R.; Zhang, J.; Wei, Z.; Meng, X.; Yu, H.; Xie, L.; et al. Chromosome-Scale Genomics, Metabolomics, and Transcriptomics Provide Insight into the Synthesis and Regulation of Phenols in Vitis Adenoclada Grapes. Front. Plant Sci. 2023, 14, e1124046. [Google Scholar] [CrossRef] [PubMed]
  44. Zhang, C.; Ren, H.; Yao, X.; Wang, K.; Chang, J. Comparative Transcriptome Analysis Reveals Differential Regulation of Flavonoids Biosynthesis Between Kernels of Two Pecan Cultivars. Front. Plant Sci. 2022, 13, e804968. [Google Scholar] [CrossRef]
  45. Zhang, W.; Han, Y.; Liao, L. Phenomics and Transcriptomic Profiling of Fruit Development in Distinct Apple Varieties. Sci. Data 2024, 11, e390. [Google Scholar] [CrossRef]
  46. Liu, L.; Long, C.; Hao, X.R.; Zhang, R.; Li, C.Q.; Song, Y.P. Identification of key genes involved in lignin and flavonoid accumulation during Tilia tuan seed maturation. Plant Cell Rep. 2024, 43, e205. [Google Scholar] [CrossRef]
  47. Bak, S.; Paquette, S.M.; Morant, M.; Morant, A.V.; Saito, S.; Bjarnholt, N.; Zagrobelny, M.; Jørgensen, K.; Osmani, S.; Simonsen, H.T.; et al. Cyanogenic glycosides: A case study for evolution and application of cytochromes P450. Phytochem. Rev. 2006, 5, 309–329. [Google Scholar] [CrossRef]
  48. Clausen, M.; Kannangara, R.M.; Olsen, C.E.; Blomstedt, C.K.; Gleadow, R.M.; Jorgensen, K.; Bak, S.; Motawie, M.S.; Moller, B.L. The bifurcation of the cyanogenic glucoside and glucosinolate biosynthetic pathways. Plant J. 2015, 84, 558–573. [Google Scholar] [CrossRef]
  49. Del Giudice, R.; Putkaradze, N.; dos Santos, B.M.; Hansen, C.C.; Crocoll, C.; Motawia, M.S.; Fredslund, F.; Laursen, T.; Welner, D.H. Structure-guided engineering of key amino acids in UGT85B1 controlling substrate and stereo-specificity in aromatic cyanogenic glucoside biosynthesis. Plant J. 2022, 111, 1539–1549. [Google Scholar] [CrossRef]
  50. Hansen, C.C.; Sorensen, M.; Veiga, T.A.M.; Zibrandtsen, J.F.S.; Heskes, A.M.; Olsen, C.E.; Boughton, B.A.; Moller, B.L.; Neilsono, E.H.J. Reconfigured cyanogenic glucoside biosynthesis in Eucalyptus cladocalyx involves a cytochrome P450 CYP706C55. Plant Physiol. 2018, 178, 1081–1095. [Google Scholar] [CrossRef]
  51. Ruegenberg, S.; Horn, M.; Pichlo, C.; Allmeroth, K.; Baumann, U.; Denzel, M.S. Loss of GFAT-1 feedback regulation activates the hexosamine pathway that modulates protein homeostasis. Nat. Commun. 2020, 11, e687. [Google Scholar] [CrossRef] [PubMed]
  52. Zhang, Y.M.; Yu, H.X.; Ye, W.W.; Shan, J.X.; Dong, N.Q.; Guo, T.; Xiang, Y.H.; Zhang, H.; Yang, Y.B.; Li, Y.C.; et al. A rice QTL GS3.1 regulates grain size through metabolic-flux distribution between flavonoid and lignin metabolons without affecting stress tolerance. Commun. Biol. 2021, 4, e1171. [Google Scholar] [CrossRef]
  53. He, B.S.; Zhu, R.R.; Yang, H.D.; Lu, Q.Q.; Wang, W.W.; Song, L.; Sun, X.; Zhang, G.D.; Li, S.J.; Yang, J.L.; et al. Assessing the impact of data preprocessing on analyzing next generation sequencing data. Front. Bioeng. Biotechnol. 2020, 8, e817. [Google Scholar] [CrossRef] [PubMed]
  54. Mizutani, M.; Sato, F. Unusual P450 Reactions in Plant Secondary Metabolism. Arch. Biochem. Biophys. 2011, 507, 194–203. [Google Scholar] [CrossRef] [PubMed]
  55. Nomura, T.; Bishop, G.J. Cytochrome P450s in Plant Steroid Hormone Synthesis and Metabolism. Phytochem. Rev. 2006, 5, 421–432. [Google Scholar] [CrossRef]
  56. Gao, J.; Ma, B.; Lu, Y.; Zhang, Y.; Tong, Y.; Guo, S.; Gao, W.; Huang, L. Investigating the Catalytic Activity of Glycosyltransferase on Quercetin from Tripterygium Wilfordii. ACS Omega 2020, 5, 1414–1421. [Google Scholar] [CrossRef]
Figure 1. (A) Principal component analysis of flax seeds at different developmental stages. (B) Cluster analysis of flax seeds at different developmental stages. L1 represents the sample of 10 days after flowering of ‘MONTANA16’ flax material; l2 represents the sample of ‘MONTANA16’ flax material 20 days after flowering; l3 represents the sample of ‘MONTANA16’ flax material 30 days after flowering; H1 represents the sample of ‘Xilibai’ flax material 10 days after flowering; H2 represents the sample of ‘Xilibai’ flax material 20 days after flowering; H3 represents the sample of ‘Xilibai’ flax material 30 days after flowering.
Agronomy 15 02327 g001
Figure 2. Differential expression analysis of flax at different developmental stages. (A) Gene expression heat map of different varieties of flax at different developmental stages. (B) Differential gene statistics of different varieties of flax at different developmental stages. (C) Venn diagram of different varieties of flax at different development stages.
Agronomy 15 02327 g002
Figure 3. Analysis of differential genes in flax. (A−I) Volcanic diagram analysis of flax in “L2 vs. L1”. (A−II) Volcanic diagram analysis of flax in “L3 vs. L1”. (A−III) Volcanic diagram analysis of flax in “L3 vs. L2”. (A−IV) Volcanic diagram analysis of flax in “H2 vs. H1”. (A−V) Volcanic diagram analysis of flax in “H3 vs. H1”. (A−VI) Volcanic diagram analysis of flax in “H3 vs. H2”. (A−VII) Volcanic diagram analysis of flax in “H1 vs. L1”. (A−VIII) Volcanic diagram analysis of flax in “H2 vs. L2”. (A−IX) Volcanic diagram analysis of flax in “H3 vs. L3”. (B−I) Venn diagram analysis of flax in “L2 vs. L1”. (B−II) Venn diagram analysis of flax in “L3 vs. L1”. (B−III) Venn diagram analysis of flax in “L3 vs. L2”. (B−IV) Venn diagram analysis of flax in “H2 vs. H1”. (B−V) Venn diagram analysis of flax in “H3 vs. H1”. (B−VI) Venn diagram analysis of flax in “H3 vs. H2”. (B−VII) Venn diagram analysis of flax in “H1 vs. L1”. (B−VIII) Venn diagram analysis of flax in “H2 vs. L2”. (B−IX) Venn diagram analysis of flax in “H3 vs. L3”.
Agronomy 15 02327 g003
Figure 4. KEGG enrichment analysis of flax differential genes. (I) KEGG enrichment analysis of flax in “L2 vs. L1”. (II) KEGG enrichment analysis of flax in “L3 vs. L1”. (III) KEGG enrichment analysis of flax in “L3 vs. L2”. (IV) KEGG enrichment analysis of flax in “H2 vs. H1”. (V) KEGG enrichment analysis of flax in “H3 vs. H1”. (VI) KEGG enrichment analysis of flax in “H3 vs. H2”. (VII) KEGG enrichment analysis of flax in “H1 vs. L1”. (VIII) KEGG enrichment analysis of flax in “H2 vs. L2”. (IX) KEGG enrichment analysis of flax in “H3 vs. L3”.
Agronomy 15 02327 g004
Figure 5. Identification, synthesis pathway and heat map of cyanogenic glycoside genes in flax. (A) Identification of flax LuCYP450 gene. (B) Identification of flax LuUGT85 gene. (C) Flax cyanogenic glycoside synthesis pathway and heat map analysis.
Agronomy 15 02327 g005
Figure 6. Validation of RNA-Seq and qRT-PCR expression levels of genes related to cyanogenic glycoside synthesis in flax. (A) The relative expression levels of key genes for cyanogenic glycoside biosynthesis in flax seeds detected by qRT-PCR at different developmental stages of high- and low-cyanogenic glycoside content varieties. (B) RNA-Seq and qRT-PCR expression trend validation. Data were analyzed by two-way ANOVA in GraphPad Prism. Significance levels are indicated as follows: * p < 0.1, ** p < 0.01, *** p < 0.001, **** p < 0.0001.
Agronomy 15 02327 g006
Disclaimer/Publisher’s Note: The statements, opinions and data contained in all publications are solely those of the individual author(s) and contributor(s) and not of MDPI and/or the editor(s). MDPI and/or the editor(s) disclaim responsibility for any injury to people or property resulting from any ideas, methods, instructions or products referred to in the content.